Monte Carlo refinement of rigid-body protein docking structures with backbone displacement and...
10
Monte Carlo refinement of rigid-body protein docking structures with backbone displacement and side-chain optimization STEPHAN LORENZEN 1–3 AND YANG ZHANG 1,2 1 Center for Bioinformatics, University of Kansas, Kansas 66047, USA 2 Department of Molecular Biosciences, University of Kansas, Kansas 66047, USA 3 Macromolecular Modelling Group, Free University, 14195 Berlin, Germany (RECEIVED March 2, 2007; FINAL REVISION August 29, 2007; ACCEPTED August 30, 2007) Abstract Structures of hitherto unknown protein complexes can be predicted by docking the solved protein monomers. Here, we present a method to refine initial docking estimates of protein complex structures by a Monte Carlo approach including rigid-body moves and side-chain optimization. The energy function used is comprised of van der Waals, Coulomb, and atomic contact energy terms. During the simulation, we gradually shift from a novel smoothed van der Waals potential, which prevents trapping in local energy minima, to the standard Lennard-Jones potential. Following the simulation, the con- formations are clustered to obtain the final predictions. Using only the first 100 decoys generated by a fast Fourier transform (FFT)-based rigid-body docking method, our refinement procedure is able to gener- ate near-native structures (interface RMSD <2.5 A ˚ ) as first model in 14 of 59 cases in a benchmark set. In most cases, clear binding funnels around the native structure can be observed. The results show the potential of Monte Carlo refinement methods and emphasize their applicability for protein–protein docking. Keywords: protein–protein docking; fast Fourier transformation; scoring; refinement; smoothed potential Most proteins associate with other proteins to fulfill their function in the living cell. The understanding of the function of a protein thus crucially depends on structural knowledge of its complexes with interaction partners. However, since many protein–protein complexes are hard to crystallize, experimental structural data of the com- plexes is often missing. With the structures of the respec- tive monomers available in the Protein Data Bank (PDB) (Berman et al. 2000), it is the task of computational protein–protein docking to reassemble the monomers into complexes. Generally, there are three levels of degrees of freedom in complex formation from monomers: First, both chains can be treated as rigid bodies and translated and rotated against each other, which results in six degrees of freedom. Further on, the conformation of side chains can be adjusted to optimize the interface between the two monomers. The highest number of degrees of free- dom is introduced by the possibility of backbone re- arrangements upon complex formation. Thus, the ‘‘redocking’’ of monomers obtained from a cocrystallized complex structure (bound–bound docking) is much easier than the prediction of a complex structure from independently crystallized monomers (unbound– unbound docking). While for the bound–bound cases, shape complementarity as the major determinant seems to be sufficient for reliable results (Norel et al. 1994), the more difficult unbound–unbound cases have to be con- sidered as real-world examples. The introduction of the fast Fourier transform (FFT) technique by Katchalski- Katzir et al. (1992) made the computational search of the six-dimensional conformation space possible for the first time. Until today, most rigid-body docking algorithms depend on the FFT algorithm (Gabb et al. 1997; Mandell Reprint requests to: Yang Zhang, 2030 Becker Drive, Lawrence, KS 66047, USA; e-mail: [email protected]; fax: (785) 864-5558. Article published online ahead of print. Article and publication date are at http://www.proteinscience.org/cgi/doi/10.1110/ps.072847207. 2716 Protein Science (2007), 16:2716–2725. Published by Cold Spring Harbor Laboratory Press. Copyright Ó 2007 The Protein Society
-
Upload
independent -
Category
Documents
-
view
1 -
download
0
Transcript of Monte Carlo refinement of rigid-body protein docking structures with backbone displacement and...

Monte Carlo refinement of rigid-body protein dockingstructures with backbone displacement andside-chain optimization
STEPHAN LORENZEN1–3AND YANG ZHANG1,2
1Center for Bioinformatics, University of Kansas, Kansas 66047, USA2Department of Molecular Biosciences, University of Kansas, Kansas 66047, USA3Macromolecular Modelling Group, Free University, 14195 Berlin, Germany
(RECEIVED March 2, 2007; FINAL REVISION August 29, 2007; ACCEPTED August 30, 2007)
Abstract
Structures of hitherto unknown protein complexes can be predicted by docking the solved proteinmonomers. Here, we present a method to refine initial docking estimates of protein complex structuresby a Monte Carlo approach including rigid-body moves and side-chain optimization. The energyfunction used is comprised of van der Waals, Coulomb, and atomic contact energy terms. During thesimulation, we gradually shift from a novel smoothed van der Waals potential, which prevents trappingin local energy minima, to the standard Lennard-Jones potential. Following the simulation, the con-formations are clustered to obtain the final predictions. Using only the first 100 decoys generated by afast Fourier transform (FFT)-based rigid-body docking method, our refinement procedure is able to gener-ate near-native structures (interface RMSD <2.5 A) as first model in 14 of 59 cases in a benchmark set.In most cases, clear binding funnels around the native structure can be observed. The results show thepotential of Monte Carlo refinement methods and emphasize their applicability for protein–protein docking.
Keywords: protein–protein docking; fast Fourier transformation; scoring; refinement; smoothed potential
Most proteins associate with other proteins to fulfill theirfunction in the living cell. The understanding of thefunction of a protein thus crucially depends on structuralknowledge of its complexes with interaction partners.However, since many protein–protein complexes are hardto crystallize, experimental structural data of the com-plexes is often missing. With the structures of the respec-tive monomers available in the Protein Data Bank (PDB)(Berman et al. 2000), it is the task of computationalprotein–protein docking to reassemble the monomers intocomplexes. Generally, there are three levels of degrees offreedom in complex formation from monomers: First,both chains can be treated as rigid bodies and translatedand rotated against each other, which results in six
degrees of freedom. Further on, the conformation of sidechains can be adjusted to optimize the interface betweenthe two monomers. The highest number of degrees of free-dom is introduced by the possibility of backbone re-arrangements upon complex formation.
Thus, the ‘‘redocking’’ of monomers obtained from acocrystallized complex structure (bound–bound docking)is much easier than the prediction of a complex structurefrom independently crystallized monomers (unbound–unbound docking). While for the bound–bound cases,shape complementarity as the major determinant seems tobe sufficient for reliable results (Norel et al. 1994), themore difficult unbound–unbound cases have to be con-sidered as real-world examples. The introduction of thefast Fourier transform (FFT) technique by Katchalski-Katzir et al. (1992) made the computational search of thesix-dimensional conformation space possible for the firsttime. Until today, most rigid-body docking algorithmsdepend on the FFT algorithm (Gabb et al. 1997; Mandell
Reprint requests to: Yang Zhang, 2030 Becker Drive, Lawrence, KS66047, USA; e-mail: [email protected]; fax: (785) 864-5558.
Article published online ahead of print. Article and publication dateare at http://www.proteinscience.org/cgi/doi/10.1110/ps.072847207.
2716 Protein Science (2007), 16:2716–2725. Published by Cold Spring Harbor Laboratory Press. Copyright � 2007 The Protein Society
et al. 2001; Heifetz et al. 2002; Chen et al. 2003a;Tovchigrechko and Vakser 2006).
While the initial scanning of possible docking con-formations by these methods is quick and efficient, themajor problem lies in the scoring of thousands of decoysand in the missing treatment of structural flexibility. Arescoring of docking decoys using more elaborate energyfunctions and filters (Murphy et al. 2003; Camacho et al.2006) was shown to improve the selection of models.Structural flexibility can be treated by soft potentials(Vakser 1995, 1996), multicopy representations of sidechains (Lorber et al. 2002), or flexible loops (Zacharias2003; Bastard et al. 2006). Initial results of dockingprograms can subsequently be refined by conjugate gra-dient minimization (Tovchigrechko and Vakser 2005) andare then usually clustered to identify near-native struc-tures. The basic idea behind clustering is the notion thatin most cases native structures lie in broad energy wells(Camacho et al. 1999), and it can be shown that clusteringsignificantly enhances the performance of docking algo-rithms (Comeau et al. 2004; Lorenzen and Zhang 2007).
A different approach to the docking problem is theMonte Carlo method. Instead of screening all possibleconformations with a Fourier-transformable energy func-tion, random starting decoys are refined by applyingrandom translational and rotational moves and deciding ontheir acceptance using the Metropolis criterion (Metropoliset al. 1953; Gray et al. 2003; Schueler-Furman et al. 2005).While FFT methods have the advantage of great speed andcomplete sampling of the conformational space, MonteCarlo methods are able to generate more physical decoydistributions, can involve arbitrary energy functions, andmight allow for structural flexibility. However, an exhaus-tive sampling of conformational space can be very timeconsuming, if not beyond computational possibility.
Here, we present a hierarchical approach of initiallyscanning the conformational space by a quick FFT-basedZDOCK run, followed by the refining of the resulting top100 decoys by ROTAFIT, a Monte Carlo refinementprogram, combined with subsequent clustering. Of 59cases in a common benchmark set (Chen et al. 2003b),we are able to obtain 14 cases with a near-native solution(interface RMSD below 2.5 A) as the highest scoringmodel, compared with six near-native solutions obtainedas first hits by ZDOCK.
Similar two-step approaches have been realized byFernandez-Recio and colleagues (ICM-DISCO) (Fernandez-Recio et al. 2002, 2003) and Gray and colleagues(RosettaDock) (Gray et al. 2003). In ICM-DISCO, theinvestigators start with a rigid-body docking searched bya pseudo-Brownian Monte Carlo simulation (Abagyan andTotrov 1994). The second step is the Monte Carlo refine-ment of ligand side-chain torsion angles. In RossetaDock,the authors start from random ligand-receptor orientations,
followed by a low-resolution rigid-body docking. In asecond step, RosettaDock optimizes side chains and rigid-body orientations simultaneously, based on the simulatedannealing Monte Carlo simulation (Kirkpatrick et al.1983). In both of the approaches, the rigid-body dockingis performed by Monte Carlo searches. In our approach,however, the first step of rigid-body conformation is takendirectly from the FFT-based docking (Chen et al. 2003a),which is supposed to cover the whole complex space andmay include a larger diversity of initial conformations. Inthe second step, while ICM-DISCO uses the pseudo-Brownian Monte Carlo approach and RosettaDock thesimulated annealing, we exploit the replica-exchangeMonte Carlo simulation (Swendsen and Wang 1986), amethod that has been demonstrated to be more efficient inbiomolecule simulations than other Monte Carlo methods(Gront et al. 2000; Zhang et al. 2002).
Another novelty in our approach is the smoothing ofthe Lennard-Jones potential and a gradual rougheningto finally reach the original potential. Since in unbound–unbound docking, the conformations of side chains, andto some extent, also the main chain, often differ from thebound conformation, the ‘‘hard’’ Lennard-Jones potentialneeds to be smoothed in some way to allow some overlapbetween the structures or tolerate inaccuracies. Previousmethods to smooth the Lenard-Jones potential for smallatom distances in docking refinement include linearextrapolation below some threshold (Gray et al. 2003)or truncation above a maximal positive energy (Fernandez-Recio et al. 2003). Our smoothing approach was inspiredby Zacharias’s study (Zacharias et al. 1994; Riemann andZacharias 2005) (see Materials and Methods and Fig. 8,below). In addition to dampening the positive part of thepotential, the minimum well is also broadened, which leadsto a less restrictive location of the minimum, and thusenables a smooth direction of the structure toward the trueminimum in the course of roughening the potential.
Results
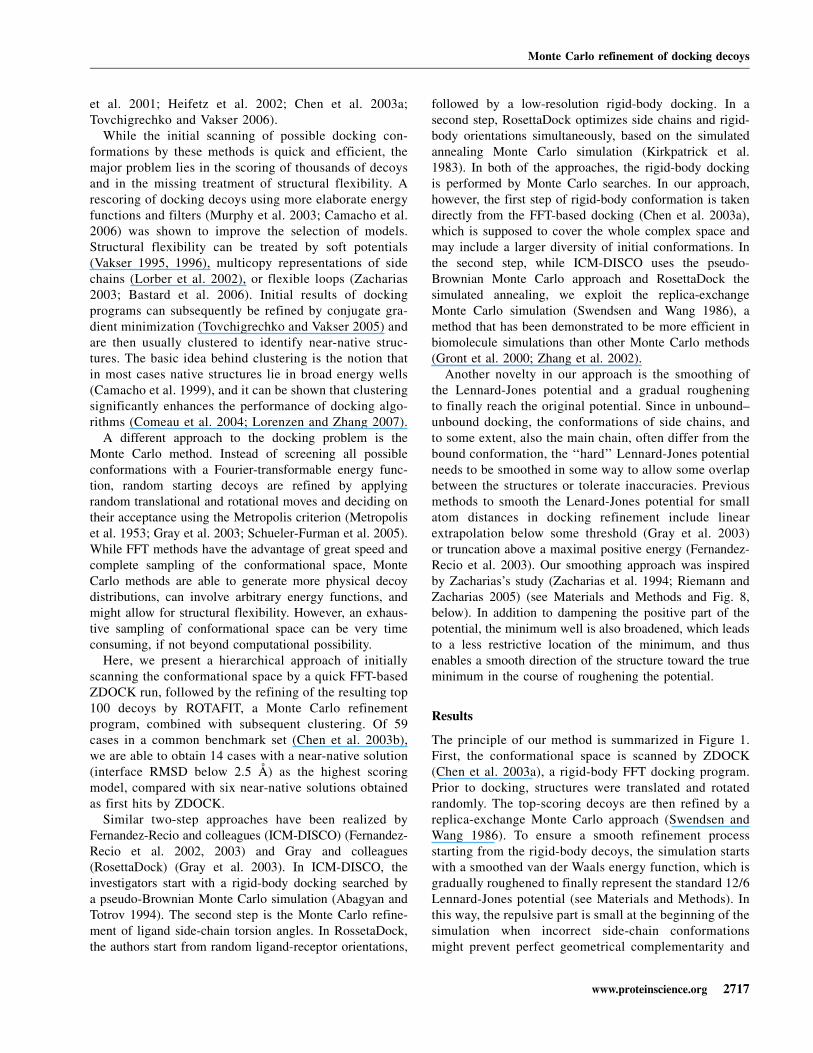
The principle of our method is summarized in Figure 1.First, the conformational space is scanned by ZDOCK(Chen et al. 2003a), a rigid-body FFT docking program.Prior to docking, structures were translated and rotatedrandomly. The top-scoring decoys are then refined by areplica-exchange Monte Carlo approach (Swendsen andWang 1986). To ensure a smooth refinement processstarting from the rigid-body decoys, the simulation startswith a smoothed van der Waals energy function, which isgradually roughened to finally represent the standard 12/6Lennard-Jones potential (see Materials and Methods). Inthis way, the repulsive part is small at the beginning of thesimulation when incorrect side-chain conformationsmight prevent perfect geometrical complementarity and
Monte Carlo refinement of docking decoys
www.proteinscience.org 2717
a rough scan is desired. During the simulation, it becomesmore restrictive gradually to induce a tight fit betweenreceptor and ligand and select correct side-chain con-formations. The median energies of the lowest temper-ature replicas for the 59 cases versus the simulation timeare shown in Figure 2. Note the jumps in the energy valueat the times when the energy function is roughened (every150 steps). At around half the simulation length (1250steps), the energy values start to be stable, and longersimulations did not obviously change the results. Gen-erally, our replica exchange method leads to a completeexploration of the simulated temperature range by allreplicas in the course of the simulation. As an illustrativeexample, the temperature progression of two replicas ofcase 1ACB is plotted in Figure 3. Initially, both replicasstart exploring the complete range of temperatures. Onlyafter around 1600 steps, Replica 16 stays in the coldertemperature regions.
Performance of ROTAFIT versus ZDOCK
Table 1 summarizes the results of the procedure on thebenchmark set. For all 59 cases, the interface RMSD ofthe top-1 and top-5 and the best decoys by ZDOCK(columns 2–4) and the subsequent ROTAFIT refinements(columns 7–13) are listed. In the bottom of the table, wealso list the number of cases with an interface RMSDbelow some thresholds as well as the average RMSD forthe best 10–50 cases.
In most cases, the ROTAFIT Monte Carlo simulationscan significantly improve the interface RMSD. Forexample, the average interface RMSD of the best decoyin the best 50 targets by ZDOCK is 3.6 A. During the
Monte Carlo refinements, the average RMSD decreasesto 2.6 A. If we consider the best 40/30/20/10 targets, theaverage RMSD of the best decoys is reduced from 2.4/1.4/0.9/0.7 A to 1.6/0.9/0.5/0.3 A, respectively.
The ranking of Monte Carlo decoys by ROTAFITenergy also performs better than the ranking of ZDOCKdecoys by the ZDOCK energy. As shown in Table 1, theaverage interface RMSD of the first model in the best 20targets by ZDOCK is 5.3 A; while based on the ROTAFITranking, the average RMSD of the first model is reducedto 2.9 A. If we count the number of targets that have thefirst model with an interface RMSD <2.5 A, ZDOCK hassix cases and ROTAFIT has 13 cases in this criterion. Thestructural clustering of the low-temperature replica decoyscan further improve the ROTAFIT ranking. As shown incolumn 10 of Table 1, the average interface RMSD of thefirst cluster in the best 20 targets is 2.4 A. For 14 targets,the first cluster center has an interface RMSD of <2.5 A,and for 19 targets, at least one of the first five clustercenters has an interface RMSD of <2.5 A (Table 1).
Figure 4 presents three representative examples ofinterface RMSD versus ZDOCK-score of the ZDOCK de-coys (left column) and interface RMSD of refined decoysversus ROTAFIT energy (right column). These data showthat the top-ranking decoys in ROTAFIT have a muchlower interface RMSD than that of ZDOCK decoys,which explains why the average ranking of ROTAFITperforms better than that of ZDOCK shown in Table 1.
Figure 5 summarizes the comparison of ROTAFIT andZDOCK results for the first (left) and top five (right) de-coys. In two cases, the interface RMSD of the top-1 decoyby ROTAFIT is increasing significantly (1DFJ: 2.5 versus
Figure 1. Flowchart of the ROTAFIT refinement procedure: Starting
orientations are obtained from rigid-body docking by ZDOCK (Chen
et al. 2003a). Each decoy is then refined by a Monte Carlo run with
subsequent clustering. The resulting models are ranked by their energy.
Figure 2. Median energies of the lowest temperature replica versus simu-
lation time (in the unit of moving attempts) for all 59 benchmark protein
complexes. Jumps in the energy function in every 150 moving attempts
indicate a roughening of the energy function (see Materials and Methods).
Lorenzen and Zhang
2718 Protein Science, vol. 16

14.9 and 1WQ1: 2.73 versus 5.57), whereas in eightcases, ROTAFIT obviously outperforms ZDOCK (1ACB,1ATN, 1BRC, 1KXQ, 1MEL, 1NCA, 1UDI, 2SIC). Thesolid lines show the average interface RMSD of thebest-performing ROTAFIT cases versus the average inter-face RMSD of the best-performing ZDOCK cases. Num-bers indicate the average of the best 10, 20, 30, 40, and50 cases. All points are below the diagonal line, whichagain shows a clear improvement of interface RMSD byROTAFIT compared with the initial ZDOCK input.
Comparison with other methods
Several groups reported methods to refine initial dockingdecoys. For example, starting from conformations gen-erated by ZDOCK, Li et al. (2003) use short CHARMMenergy minimizations to refine and rescore the initialdecoys (called RDOCK). The final scoring function iscomprised of electrostatic interaction energies betweenligand and receptor as well as an ACE term, with filteringfor unfavorable van der Waals energies. Using a bench-mark set of 49 protein complexes, the authors report 21cases with solutions within the first 100 ZDOCK decoysand were able to rank 11 of them as top-ranking decoyand two others within the top five decoys (Li et al. 2003).However, the ZDOCK version used by Li et al. (2003)was 2.1, whereas we are using version 2.3. To have a faircomparison, we downloaded and ran RDOCK based onthe same set of 100 decoys (not counting the ones dis-carded because of unfavorable van der Waals interac-tions). We obtained 12 hits in the rank-1 decoys and 19hits in the best of top five decoys, which are comparableto 14 and 19 hits by ROTAFIT. The average RMSD of therank-1 decoys by ROTFIT is slightly lower, i.e., 0.6/2.4/4.7/6.8/8.8 A for the top 10/20/30/40/50 cases versus1.0/3.4/5.9/7.8/9.6 A by RDOCK. The detailed RDOCKresults are listed in columns 5 and 6 in Table I.
Gray et al. (2003) tested RosettaDock on a benchmarkof 54 proteins, a subset of the benchmark used in thisstudy. The investigators report seven cases with the firstmodel of <5 A ligand Ca RMSD after superimposing thereceptor structures and a further nine cases with thiscriterion within the first five models. Using ROTAFIT, wefound 12 cases with a complete ligand RMSD of <5 A astop-1 hit and 16 hits within the first five decoys (seecolumns 12 and 13 of Table 1).
Performance of ROTAFIT in CAPRI round 11
As a blind test for our algorithm, we took part in round 11of the community-wide protein–protein docking experi-ment, CAPRI (Janin et al. 2003; Janin 2005; Mendezet al. 2005). The target was a complex of Huntingtin-interacting protein 2 (Hip2), a ubiquitin-conjugatingenzyme with Ubc9, a SUMO transferase (Desterro et al.1997; Johnson and Blobel 1997; Schwarz et al. 1998).SUMO, a ubiquitin-like protein of 101 residues (Mulleret al. 2001), is transferred from cystein 93 of Ubc9 tolysin 14 of Hip2 (Pichler et al. 2005). In a crystal struc-ture of Ubc9 with another substrate, RanGAP (PDB code1KPS), the acceptor Lysine residue lies in a pocketwith contacts to residues Asp127, Pro128, Ala129, andTyr87 of Ubc9 (Bernier-Villamor et al. 2002). Residues129–135 of Ubc9 have also been shown to interact withUbc9 substrates by chemical-shift analysis (Lin et al.2002).
We first performed a rigid-body docking with ZDOCKand filtered for decoys with a distance of <10 A betweenLys14 of Hip2 and Cys93 of Ubc9. After filtering the10,000 top-ranking models generated with default andhigh-density rotational sampling, we obtained 31 and 101docking structures, respectively, which are used as thestarting conformations in the subsequent ROTAFIT refine-ments. During the simulations, we also add a distancerestraint proportional to the square of the distance betweenNe of Lys14 and Sg of Cys93 to our potential. Here, oneissue is the determination of the weight factor of therestraint, which should be strong enough to move themonomer structures, but should not dominate the otherinherent physics-based ROTAFIT potentials. To do this, wetested three weight factors of 0.1, 0.5, and 5. Figure 6Ashows the Lys–Cys distance distribution of the simulatedROTAFIT decoys with various weights compared withthe original selected ZDOCK decoys. A restraint weightfactor of 0.5 seems to work best, which is sufficient toguide the monomer movement, but does not modifysignificantly the energy distribution of the final models(Fig. 6B). So 0.5 has been exploited in our simulations.Finally, the ROTAFIT decoys were clustered with a cutoff of3.5A ligand RMSD, which are ranked based on the clustersize. Figure 7 shows our first submitted model to CAPRI,
Figure 3. Temperature progression for two replicas of decoy 4 of 1ACB
(RMSD 1.5 A at the end of the simulation). Replica 16 (black) initially
explores the complete temperature range and, due to the favorable
conformation and energy, stays at low-temperature ranges after around
step 1600. Replica 3 (gray) keeps traveling through the complete temper-
ature range in the whole course of the simulation.
Monte Carlo refinement of docking decoys
www.proteinscience.org 2719
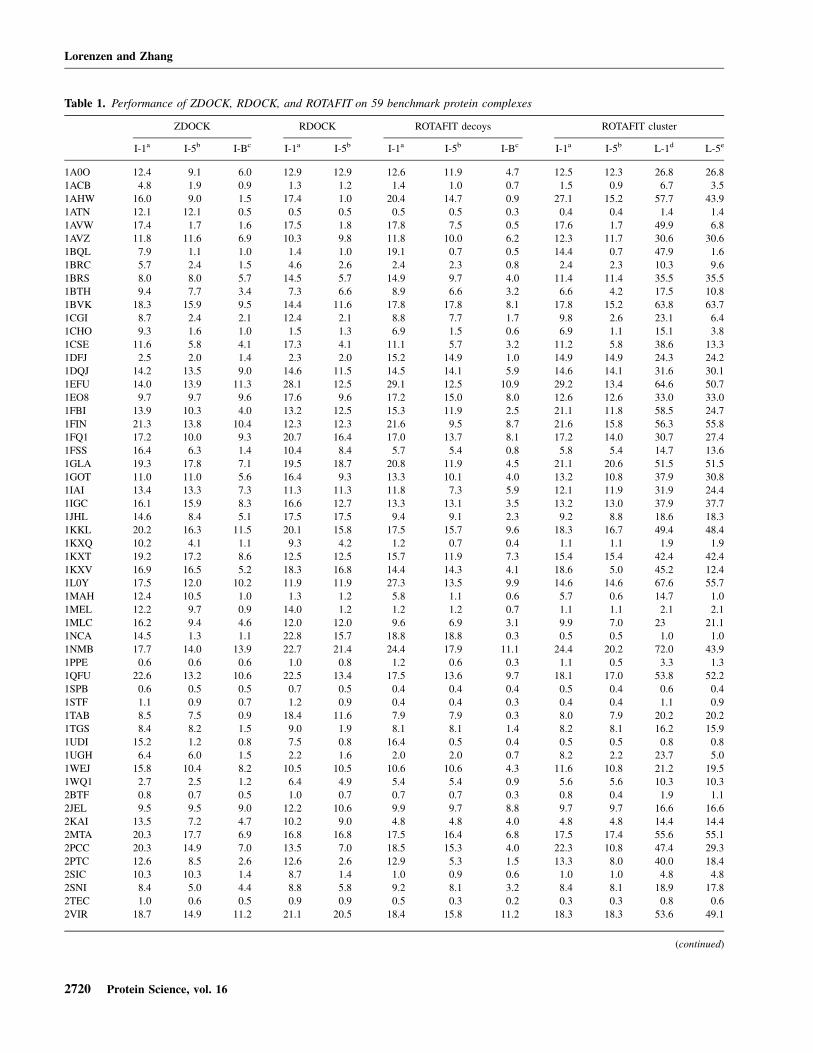
Table 1. Performance of ZDOCK, RDOCK, and ROTAFIT on 59 benchmark protein complexes
ZDOCK RDOCK ROTAFIT decoys ROTAFIT cluster
I-1a I-5b I-Bc I-1a I-5b I-1a I-5b I-Bc I-1a I-5b L-1d L-5e
1A0O 12.4 9.1 6.0 12.9 12.9 12.6 11.9 4.7 12.5 12.3 26.8 26.8
1ACB 4.8 1.9 0.9 1.3 1.2 1.4 1.0 0.7 1.5 0.9 6.7 3.5
1AHW 16.0 9.0 1.5 17.4 1.0 20.4 14.7 0.9 27.1 15.2 57.7 43.9
1ATN 12.1 12.1 0.5 0.5 0.5 0.5 0.5 0.3 0.4 0.4 1.4 1.4
1AVW 17.4 1.7 1.6 17.5 1.8 17.8 7.5 0.5 17.6 1.7 49.9 6.8
1AVZ 11.8 11.6 6.9 10.3 9.8 11.8 10.0 6.2 12.3 11.7 30.6 30.6
1BQL 7.9 1.1 1.0 1.4 1.0 19.1 0.7 0.5 14.4 0.7 47.9 1.6
1BRC 5.7 2.4 1.5 4.6 2.6 2.4 2.3 0.8 2.4 2.3 10.3 9.6
1BRS 8.0 8.0 5.7 14.5 5.7 14.9 9.7 4.0 11.4 11.4 35.5 35.5
1BTH 9.4 7.7 3.4 7.3 6.6 8.9 6.6 3.2 6.6 4.2 17.5 10.8
1BVK 18.3 15.9 9.5 14.4 11.6 17.8 17.8 8.1 17.8 15.2 63.8 63.7
1CGI 8.7 2.4 2.1 12.4 2.1 8.8 7.7 1.7 9.8 2.6 23.1 6.4
1CHO 9.3 1.6 1.0 1.5 1.3 6.9 1.5 0.6 6.9 1.1 15.1 3.8
1CSE 11.6 5.8 4.1 17.3 4.1 11.1 5.7 3.2 11.2 5.8 38.6 13.3
1DFJ 2.5 2.0 1.4 2.3 2.0 15.2 14.9 1.0 14.9 14.9 24.3 24.2
1DQJ 14.2 13.5 9.0 14.6 11.5 14.5 14.1 5.9 14.6 14.1 31.6 30.1
1EFU 14.0 13.9 11.3 28.1 12.5 29.1 12.5 10.9 29.2 13.4 64.6 50.7
1EO8 9.7 9.7 9.6 17.6 9.6 17.2 15.0 8.0 12.6 12.6 33.0 33.0
1FBI 13.9 10.3 4.0 13.2 12.5 15.3 11.9 2.5 21.1 11.8 58.5 24.7
1FIN 21.3 13.8 10.4 12.3 12.3 21.6 9.5 8.7 21.6 15.8 56.3 55.8
1FQ1 17.2 10.0 9.3 20.7 16.4 17.0 13.7 8.1 17.2 14.0 30.7 27.4
1FSS 16.4 6.3 1.4 10.4 8.4 5.7 5.4 0.8 5.8 5.4 14.7 13.6
1GLA 19.3 17.8 7.1 19.5 18.7 20.8 11.9 4.5 21.1 20.6 51.5 51.5
1GOT 11.0 11.0 5.6 16.4 9.3 13.3 10.1 4.0 13.2 10.8 37.9 30.8
1IAI 13.4 13.3 7.3 11.3 11.3 11.8 7.3 5.9 12.1 11.9 31.9 24.4
1IGC 16.1 15.9 8.3 16.6 12.7 13.3 13.1 3.5 13.2 13.0 37.9 37.7
1JHL 14.6 8.4 5.1 17.5 17.5 9.4 9.1 2.3 9.2 8.8 18.6 18.3
1KKL 20.2 16.3 11.5 20.1 15.8 17.5 15.7 9.6 18.3 16.7 49.4 48.4
1KXQ 10.2 4.1 1.1 9.3 4.2 1.2 0.7 0.4 1.1 1.1 1.9 1.9
1KXT 19.2 17.2 8.6 12.5 12.5 15.7 11.9 7.3 15.4 15.4 42.4 42.4
1KXV 16.9 16.5 5.2 18.3 16.8 14.4 14.3 4.1 18.6 5.0 45.2 12.4
1L0Y 17.5 12.0 10.2 11.9 11.9 27.3 13.5 9.9 14.6 14.6 67.6 55.7
1MAH 12.4 10.5 1.0 1.3 1.2 5.8 1.1 0.6 5.7 0.6 14.7 1.0
1MEL 12.2 9.7 0.9 14.0 1.2 1.2 1.2 0.7 1.1 1.1 2.1 2.1
1MLC 16.2 9.4 4.6 12.0 12.0 9.6 6.9 3.1 9.9 7.0 23 21.1
1NCA 14.5 1.3 1.1 22.8 15.7 18.8 18.8 0.3 0.5 0.5 1.0 1.0
1NMB 17.7 14.0 13.9 22.7 21.4 24.4 17.9 11.1 24.4 20.2 72.0 43.9
1PPE 0.6 0.6 0.6 1.0 0.8 1.2 0.6 0.3 1.1 0.5 3.3 1.3
1QFU 22.6 13.2 10.6 22.5 13.4 17.5 13.6 9.7 18.1 17.0 53.8 52.2
1SPB 0.6 0.5 0.5 0.7 0.5 0.4 0.4 0.4 0.5 0.4 0.6 0.4
1STF 1.1 0.9 0.7 1.2 0.9 0.4 0.4 0.3 0.4 0.4 1.1 0.9
1TAB 8.5 7.5 0.9 18.4 11.6 7.9 7.9 0.3 8.0 7.9 20.2 20.2
1TGS 8.4 8.2 1.5 9.0 1.9 8.1 8.1 1.4 8.2 8.1 16.2 15.9
1UDI 15.2 1.2 0.8 7.5 0.8 16.4 0.5 0.4 0.5 0.5 0.8 0.8
1UGH 6.4 6.0 1.5 2.2 1.6 2.0 2.0 0.7 8.2 2.2 23.7 5.0
1WEJ 15.8 10.4 8.2 10.5 10.5 10.6 10.6 4.3 11.6 10.8 21.2 19.5
1WQ1 2.7 2.5 1.2 6.4 4.9 5.4 5.4 0.9 5.6 5.6 10.3 10.3
2BTF 0.8 0.7 0.5 1.0 0.7 0.7 0.7 0.3 0.8 0.4 1.9 1.1
2JEL 9.5 9.5 9.0 12.2 10.6 9.9 9.7 8.8 9.7 9.7 16.6 16.6
2KAI 13.5 7.2 4.7 10.2 9.0 4.8 4.8 4.0 4.8 4.8 14.4 14.4
2MTA 20.3 17.7 6.9 16.8 16.8 17.5 16.4 6.8 17.5 17.4 55.6 55.1
2PCC 20.3 14.9 7.0 13.5 7.0 18.5 15.3 4.0 22.3 10.8 47.4 29.3
2PTC 12.6 8.5 2.6 12.6 2.6 12.9 5.3 1.5 13.3 8.0 40.0 18.4
2SIC 10.3 10.3 1.4 8.7 1.4 1.0 0.9 0.6 1.0 1.0 4.8 4.8
2SNI 8.4 5.0 4.4 8.8 5.8 9.2 8.1 3.2 8.4 8.1 18.9 17.8
2TEC 1.0 0.6 0.5 0.9 0.9 0.5 0.3 0.2 0.3 0.3 0.8 0.6
2VIR 18.7 14.9 11.2 21.1 20.5 18.4 15.8 11.2 18.3 18.3 53.6 49.1
(continued)
Lorenzen and Zhang
2720 Protein Science, vol. 16

which has an interface RMSD of 2.5 A to the nativestructure.
Discussion
We present an algorithm to refine docking decoysgenerated by ZDOCK, a state-of-the-art FFT rigid-bodydocking program. The goal of the work was to combinethe advantages of different methods in protein–proteindocking: While the fast Fourier transform techniqueallows a rapid scanning of the complete six-dimensionaltranslational and rotational space, it relies on simpleenergy functions that can be expressed as sums of prod-ucts between grid values to allow a fast Fourier trans-formation. While the final ranking of decoys might not beoptimal, in most cases the FFT algorithm provides somereasonable starting points for further refinements.Another drawback of FFT methods is the inherent rigidityof receptor and ligand molecules.
On the other hand, Monte Carlo simulations allow theimplementation of any form of composite energy terms aswell as the conformational flexibility. Here, we chose theMonte Carlo approach to obtain not only information aboutthe energies of docking decoys, but also about their distri-bution. It is well known that native structures mostly lie inbroad energy wells rather than a narrow minimum (Camachoet al. 1999), which can be detected by clustering the resultingMonte Carlo decoys (Lorenzen and Zhang 2007).
Another novelty in our approach is the gradual rough-ening of the energy landscape, starting from a smoothed
Lennard-Jones potential. In this way, structures can besmoothly guided into tight-fit positions with rising impactof side-chain positions (since overlap and clashes arepunished stronger) during the simulation process. Sincethe average negative part of the van der Waals energy iskept constant by our scaling method, the shape of thepotential smoothly changes from having considerable at-tractive forces even for r >> r0 and only a few repulsive
Table 1. Continued
ZDOCK RDOCK ROTAFIT decoys ROTAFIT cluster
I-1a I-5b I-Bc I-1a I-5b I-1a I-5b I-Bc I-1a I-5b L-1d L-5e
3HHR 12.3 12.0 11.5 13.5 13.4 17.5 12.3 10.6 21.2 17.2 58.4 52.3
4HTC 0.9 0.9 0.7 16.1 16.1 0.6 0.6 0.6 0.7 0.6 0.8 0.7
<2.0f 6 13 25 10 18 12 16 27 13 17 9 12
<2.5 6 16 26 12 19 13 17 28 14 19 10 13
<3.0 8 16 27 12 21 13 17 29 14 20 10 13
<4.0 8 16 29 12 21 13 17 38 14 20 11 15
<5.0 9 18 33 13 24 14 18 42 15 23 12 16
<8.0 12 24 43 16 28 19 28 47 20 29 13 19
Best 10g 2.1 0.9 0.7 1.0 0.8 0.8 0.6 0.3 0.6 0.5 1.2 0.9
Best 20 5.3 2.2 0.9 3.4 1.1 2.9 1.5 0.5 2.4 1.0 6.2 2.7
Best 30 7.3 4.1 1.4 5.9 2.3 5.3 3.4 0.9 4.7 2.7 11.0 6.6
Best 40 8.9 5.6 2.4 7.7 4.2 7.5 5.2 1.6 6.8 4.7 16.6 10.9
Best 50 10.5 7.1 3.6 9.6 5.9 9.5 6.8 2.6 8.8 6.5 22.9 16.2
a (I-1) Interface RMSD (A) of the highest-scoring decoys.b (I-5) Best interface RMSD (A) in five top-scoring decoys.c (I-B) Interface RMSD (A) of best decoy.d (L-1) Ligand RMSD (A) of the highest-scoring decoys.e (L-5) Best ligand RMSD (A) of five top-scoring decoys.f (<2.0) Number of cases with an interface RMSD of <2.0 A.g (Best 10) Mean RMSD (A) of the 10 best-performing cases in the benchmark set.
Figure 4. Interface RMSD versus energy for the first 100 ZDOCK decoys
before (left, negative ZDOCK score interpreted as energy) and after (right)
the ROTAFIT Monte Carlo refinement. The figure shows three represen-
tative cases (1ACB, 1MEL, and 2SIC). The energy values have been
rescaled to fit the united scale of different targets.
Monte Carlo refinement of docking decoys
www.proteinscience.org 2721

forces for clashes caused by incorrect side-chain con-formations to being more restrictive toward the distanceof minimal energy, r0.
Another advantage of a smoothed energy function isthe possibility of a broader distribution of decoys in thebeginning phase of the simulation and subsequent drivingtoward local minima. In this way, a bigger part of theconformational space can be scanned, while cluster sizesof the final conformations give information about thewidth of the energy well.
As shown in Figure 5, the RMSD of the highest-scoringdecoys could be improved by our method, and in eightcases, near-native decoys were identified that were missedby ZDOCK. Refinement results with gradual rougheningwere significantly better than with a static energy function(data not shown), which shows the potential of our
approach. An increase in the number of starting decoysis promising to further improve the results, since 100ZDOCK decoys often do not include structures closeenough to the native structure to be refined. The improvedversion of the ROTAFIT algorithm is being developed andwill be made publicly available in future work.
Materials and Methods
Docking algorithm
ROTAFIT starts from the FFT-based rigid-body docking struc-tures by ZDOCK (Chen et al. 2003a). The conformational spacein ROTAFIT is searched by the replica-exchange Monte Carlosimulation algorithm (Swendsen and Wang 1986), where 40replicas are used and each takes 2500 Monte Carlo movingattempts. Our testing data show that longer simulation with
Figure 6. (A) Distribution of distances between Cys93 of Ubc9 and Lys14 of Hip2 in the initial decoy set and after Monte Carlo
refinement with different restraint weights. A restraint $0.5 leads to a significantly closer distance between the two residues. (B)
Energy distribution of refined decoys using different restraint weights for the Cys–Lys distance. A restraint below 0.5 does not
significantly impair the final energies of the models.
Figure 5. Interface RMSD of refined decoys by ROTAFIT versus RMSD of initial ZDOCK decoys for the 59 benchmark targets.
(Left) First decoy; (right) the best in top five decoys. The Monte Carlo decoys show more near-native cases. The solid lines indicate
average interface RMSDs of the best 10, 20, 30, 40, and 50 cases by both ZDOCK and ROTAFIT. The lines below the diagonal line
indicate that the average interface RMSD has been improved by the ROTAFIT simulations.
Lorenzen and Zhang
2722 Protein Science, vol. 16
more replicas does not improve the results (see Fig. 2). In eachmoving attempt, a translation along a random vector and arotation around a random axis are performed. The translationdistance and the rotation angle are scaled so that the displace-ment of interface atoms is distributed according to a Gaussianfunction with a standard deviation of 0.5 A. Following thebackbone displacement, conformations of two randomly se-lected side chains on the ligand-receptor interface are randomlychanged based on Dunbrack’s rotamer library (Dunbrack Jr. andCohen 1997). The acceptance of the composite movements isdecided by the Metropolis criterion (Metropolis et al. 1953)using an energy function comprised of van der Waals, Coulomb,and atomic contact energy. Replica exchange is performed afterevery moving attempt, which leads to an average of 1000exchanges between neighboring replicas. After the Monte Carlosimulations, the structures in the five lowest temperature rep-licas obtained in the last 600 steps of the refinement simulationsare clustered. For each cluster, the structure at the cluster centeris selected. The structures from 100 different clusters are rankedby their energy. The overall procedure of ROTAFIT can be seenin Figure 1.
Energy function
Receptor and ligand are modeled with implicit hydrogen atoms(only polar hydrogen atoms treated explicitly). The energyfunction of ROTAFIT consists of three terms: a Lennard-Jones
term Eij = eijr0ij
rij
� �12
�2r0ij
rij
� �6� �
with parameters of eij and r0ij
taken from CHARMM (Brooks et al. 1983), a Coulomb term
ECou = 14pee0
qiqj
rij, and an atomic contact energy term (Zhang et al.
1997). For the Lennard-Jones and Coulomb terms, rij is thedistance between two atoms i and j, qi and qj are their charges,and r0ij
is the optimal distance between two atoms of type i andj. For the Coulomb term, a distant dependent dielectric e ¼ 4rij
was used. Partial charges for amino acids used in the Coulombterm were also taken from CHARMM. The atomic contactenergy is a statistical potential with 19 distinct atom typesderived from PDB structures. For the Coulomb and Lennard-Jones interaction energies, a distance cutoff at 1 A was used toavoid singularities, which sets the potential at shorter distancesequal to that at 1 A.
Smoothing of the van der Waals energy function
The smoothing approach for the van der Waals function was in-spired by the potential scaling approach of Zacharias (Zachariaset al. 1994; Riemann and Zacharias 2005). Basically, theauthors used a modified Lennard-Jones potential of the form
VðrijÞ = eijð1� lÞr2
0ij+ld
r2ij+ld
� �6
�2r2
0ij+ld
r2ij+ld
� �3 !
with eij being the
minimum Lennard-Jones energy for the interaction betweenatoms i and j, r0ij
the optimal distance between the two atoms, andd, a shifting parameter. The value of l can vary between 0 (fullLennard-Jones potential) and 1 (interaction energy vanished)during the simulations.
Our potential was designed to include only one scalableparameter l instead of the two parameters, l and d, and keep theaverage attractive forces constant while increasing the repulsiveforces. Assuming an equidistribution of particles in three-dimensional space, the number of pairwise interactions betweenparticles with distance r would be proportional to r3. Theintegral over the attractive (negative) part of our modifiedpotential would thus be:
ð‘ffiffiffiffiffiffiffiffiffiffiffiffiffiffiffiffiffiffiffiffiffiffiffiffiffi2�
13 r2
0ij+ l
� ��l
r r3r2
0ij+ l
r2ij + l
!6
� 2r2
0ij+ l
r2ij + l
!30@
1Adr =
3ffiffi43p
10 l r20ij
+ l� �
� 3ffiffi23p
10 r20ij
+ l� �2
(1)
A scalable potential function with constant average attractiveforces can be obtained by scaling:
Figure 7. The first ROTAFIT model for T27 submitted to round 11 of the
CAPRI experiment, which has an interface RMSD of 2.5 A. The predicted
model is shown in cartoon and the target in backbone. Left is the structure
of Ubc9 and right for Hip2. The catalytic residue Cys93 and the acceptor
site Lys14 are shown as sticks in the model.
Figure 8. Smoothed Lennard-Jones potential (see Materials and Methods)
with r0ij¼ 2 (solid lines) and 4 (dashed lines). l9 ranges from 0 to 1.6, as
indicated in the figure. The spatial sum of attractive forces only depends on r,
not on l9. A l9 value of 0 is equivalent to the original Lennard-Jones potential.
Monte Carlo refinement of docking decoys
www.proteinscience.org 2723
VðrijÞ = eij
5r40ij
5 r20ij
+ l� �2
�2ffiffiffi23p
l r20ij
+ l� �
3r2
0ij+ l
r2ij + l
!6
�2r2
0ij+ l
r2ij + l
!30@
1A
(2)
To obtain comparable degrees of smoothness for different valuesof rij, we used smoothing parameters l9 which depends on r0ij
with l ¼ l9 r20ij
. Figure 8 shows potential functions of differentsmoothing values.
The current setting starts with a smoothing value l9 ¼ 0.4,which is decreased by 0.05 in every 150 Monte Carlo steps. Thisway, the initial setting allows a rough orientation of receptor andligand toward each other, while later in the simulation, restric-tive settings direct orientations and side chains toward a tight fitbetween receptor and ligand. Stronger smoothing in the begin-ning of the simulation decreased the specificity of the inter-action and worsened the results (data not shown). Theroughening of the energy landscape was designed in such away that the original Lennard-Jones potential was reached andbriefly equilibrated after half of the simulation time.
Acknowledgments
Part of the calculations in this work have been performed on theKU ITTC clusters, where help from Drs. V. Frost and A. Hockis gratefully acknowledged. The project is supported by KUStart-up Fund 06194.
References
Abagyan, R. and Totrov, M. 1994. Biased probability Monte Carlo conforma-tional searches and electrostatic calculations for peptides and proteins.J. Mol. Biol. 235: 983–1002.
Bastard, K., Prevost, C., and Zacharias, M. 2006. Accounting forloop flexibility during protein-protein docking. Proteins 62: 956–969.
Berman, H.M., Westbrook, J., Feng, Z., Gilliland, G., Bhat, T.N., Weissig, H.,Shindyalov, I.N., and Bourne, P.E. 2000. The Protein Data Bank. NucleicAcids Res. 28: 235–242.
Bernier-Villamor, V., Sampson, D.A., Matunis, M.J., and Lima, C.D. 2002.Structural basis for E2-mediated SUMO conjugation revealed by a complexbetween ubiquitin-conjugating enzyme Ubc9 and RanGAP1. Cell 108:345–356.
Brooks, B.R., Bruccoleri, R.E., Olafson, B.D., States, D.J., Swaminathan, S.,and Karplus, M. 1983. CHARMM: A program for macromolecularenergy, minimization, and dynamics calculations. J. Comput. Chem. 4:187–217.
Camacho, C.J., Weng, Z., Vajda, S., and DeLisi, C. 1999. Free energylandscapes of encounter complexes in protein-protein association. Biophys.J. 76: 1166–1178.
Camacho, C.J., Ma, H., and Champ, P.C. 2006. Scoring a diverse set of high-quality docked conformations: A metascore based on electrostatic anddesolvation interactions. Proteins 63: 868–877.
Chen, R., Li, L., and Weng, Z. 2003a. ZDOCK: An initial-stage protein-docking algorithm. Proteins 52: 80–87.
Chen, R., Mintseris, J., Janin, J., and Weng, Z. 2003b. A protein—proteindocking benchmark. Proteins 52: 88–91.
Comeau, S.R., Gatchell, D.W., Vajda, S., and Camacho, C.J. 2004. ClusPro: Anautomated docking and discrimination method for the prediction of proteincomplexes. Bioinformatics 20: 45–50.
Desterro, J.M., Thomson, J., and Hay, R.T. 1997. Ubch9 conjugates SUMO butnot ubiquitin. FEBS Lett. 417: 297–300.
Dunbrack Jr., R.L. and Cohen, F.E. 1997. Bayesian statistical analysis ofprotein side-chain rotamer preferences. Protein Sci. 6: 1661–1681.
Fernandez-Recio, J., Totrov, M., and Abagyan, R. 2002. Soft protein-proteindocking in internal coordinates. Protein Sci. 11: 280–291.
Fernandez-Recio, J., Totrov, M., and Abagyan, R. 2003. ICM-DISCO dockingby global energy optimization with fully flexible side-chains. Proteins 52:113–117.
Gabb, H.A., Jackson, R.M., and Sternberg, M.J. 1997. Modelling proteindocking using shape complementarity, electrostatics and biochemicalinformation. J. Mol. Biol. 272: 106–120.
Gray, J.J., Moughon, S., Wang, C., Schueler-Furman, O., Kuhlman, B.,Rohl, C.A., and Baker, D. 2003. Protein-protein docking with simultaneousoptimization of rigid-body displacement and side-chain conformations.J. Mol. Biol. 331: 281–299.
Gront, D., Kolinski, A., and Skolnick, J. 2000. Comparison of three MonteCarlo conformational search strategies for a protein-like homopolymermodel: Folding thermodynamics and identification of low-energy struc-tures. J. Chem. Phys. 113: 5065–5071.
Heifetz, A., Katchalski-Katzir, E., and Eisenstein, M. 2002. Electrostatics inprotein-protein docking. Protein Sci. 11: 571–587.
Janin, J. 2005. Assessing predictions of protein–protein interaction: The CAPRIexperiment. Protein Sci. 14: 278–283.
Janin, J., Henrick, K., Moult, J., Eyck, L.T., Sternberg, M.J., Vajda, S.,Vakser, I., and Wodak, S.J. 2003. CAPRI: A critical assessment of predictedinteractions. Proteins 52: 2–9.
Johnson, E.S. and Blobel, G. 1997. Ubc9p is the conjugating enzymefor the ubiquitin-like protein Smt3p. J. Biol. Chem. 272: 26799–26802.
Katchalski-Katzir, E., Shariv, I., Eisenstein, M., Friesem, A.A., Aflalo, C., andVakser, I.A. 1992. Molecular surface recognition: Determination of geo-metric fit between proteins and their ligands by correlation techniques.Proc. Natl. Acad. Sci. 89: 2195–2199.
Kirkpatrick, S., Gelatt Jr., C.D., and Vecchi, M.P. 1983. Optimization bysimulated annealing. Science 220: 671–680.
Li, L., Chen, R., and Weng, Z. 2003. RDOCK: Refinement of rigid-bodyprotein docking predictions. Proteins 53: 693–707.
Lin, D., Tatham, M.H., Yu, B., Kim, S., Hay, R.T., and Chen, Y. 2002.Identification of a substrate recognition site on Ubc9. J. Biol. Chem. 277:21740–21748.
Lorber, D.M., Udo, M.K., and Shoichet, B.K. 2002. Protein-protein dockingwith multiple residue conformations and residue substitutions. Protein Sci.11: 1393–1408.
Lorenzen, S. and Zhang, Y. 2007. Identification of near-native struc-tures by clustering protein docking conformations. Proteins 68: 187–194.
Mandell, J.G., Roberts, V.A., Pique, M.E., Kotlovyi, V., Mitchell, J.C.,Nelson, E., Tsigelny, I., and Ten Eyck, L.F. 2001. Protein dockingusing continuum electrostatics and geometric fit. Protein Eng. 14: 105–113.
Mendez, R., Leplae, R., Lensink, M.F., and Wodak, S.J. 2005. Assessment ofCAPRI predictions in rounds 3-5 shows progress in docking procedures.Proteins 60: 150–169.
Metropolis, N., Rosenbluth, A.W., Rosenbluth, M.N., Teller, A.H., andTeller, E. 1953. Equations of state calculations by fast computing machines.J. Chem. Phys. 21: 1087–1092.
Muller, S., Hoege, C., Pyrowolakis, G., and Jentsch, S. 2001.SUMO, ubiquitin’s mysterious cousin. Nat. Rev. Mol. Cell Biol. 2: 202–210.
Murphy, J., Gatchell, D.W., Prasad, J.C., and Vajda, S. 2003. Combination ofscoring functions improves discrimination in protein-protein docking.Proteins 53: 840–854.
Norel, R., Lin, S.L., Wolfson, H.J., and Nussinov, R. 1994. Shapecomplementarity at protein–protein interfaces. Biopolymers 34: 933–940.
Pichler, A., Knipscheer, P., Oberhofer, E., van Dijk, W.J., Korner, R.,Olsen, J.V., Jentsch, S., Melchior, F., and Sixma, T.K. 2005. SUMOmodification of the ubiquitin-conjugating enzyme E2-25K. Nat. Struct.Mol. Biol. 12: 264–269.
Riemann, R.N. and Zacharias, M. 2005. Refinement of protein cores andprotein-peptide interfaces using a potential scaling approach. Protein Eng.Des. Sel. 18: 465–476.
Schueler-Furman, O., Wang, C., and Baker, D. 2005. Progress in protein—protein docking: Atomic resolution predictions in the CAPRI experimentusing RosettaDock with an improved treatment of side-chain flexibility.Proteins 60: 187–194.
Schwarz, S.E., Matuschewski, K., Liakopoulos, D., Scheffner, M., andJentsch, S. 1998. The ubiquitin-like proteins SMT3 and SUMO-1 areconjugated by the UBC9 E2 enzyme. Proc. Natl. Acad. Sci. 95: 560–564.
Lorenzen and Zhang
2724 Protein Science, vol. 16

Swendsen, R.H. and Wang, J.S. 1986. Replica Monte Carlo simulation of spinglasses. Phys. Rev. Lett. 57: 2607–2609.
Tovchigrechko, A. and Vakser, I.A. 2005. Development and testingof an automated approach to protein docking. Proteins 60: 296–301.
Tovchigrechko, A. and Vakser, I.A. 2006. GRAMM-X public Web server forprotein-protein docking. Nucleic Acids Res. 34: W310–W314. doi:10.1093/nar/gki206.
Vakser, I.A. 1995. Protein docking for low-resolution structures. Protein Eng.8: 371–377.
Vakser, I.A. 1996. Low-resolution docking: Prediction of complexes forunderdetermined structures. Biopolymers 39: 455–464.
Zacharias, M. 2003. Protein-protein docking with a reduced protein modelaccounting for side-chain flexibility. Protein Sci. 12: 1271–1282.
Zacharias, M., Straatsma, T.P., and McCammon, J.A. 1994. Separation-shifted scaling, a new scaling method for Lennard-Jones interactions inthermodynamic integration. J. Chem. Phys. 100: 9025–9031.
Zhang, C., Vasmatzis, G., Cornette, J.L., and DeLisi, C. 1997. Determination ofatomic desolvation energies from the structures of crystallized proteins.J. Mol. Biol. 267: 707–726.
Zhang, Y., Kihara, D., and Skolnick, J. 2002. Local energy landscape flattening:Parallel hyperbolic Monte Carlo sampling of protein folding. Proteins 48:192–201.
Monte Carlo refinement of docking decoys
www.proteinscience.org 2725