Monitoring the long-range transport effects on urban PM10 levels using 3D clusters of backward...
12
Monitoring the long-range transport effects on urban PM10 levels using 3D clusters of backward trajectories László Makra a, * , István Matyasovszky b , Zoltán Guba a , Kostas Karatzas c , Pia Anttila d a Department of Climatology and Landscape Ecology, University of Szeged, P.O. Box 653, H-6701 Szeged, Hungary b Department of Meteorology, Eötvös Loránd University, Pázmány Péter Street 1/A, H-1117 Budapest, Hungary c Department of Mechanical Engineering, Aristotle University, P.O. Box 483, GR-54124 Thessaloniki, Greece d Finnish Meteorological Institute, P.O. Box 503, FI-00101 Helsinki, Finland article info Article history: Received 22 September 2010 Received in revised form 27 February 2011 Accepted 28 February 2011 Keywords: Long-range PM10 transport Backward trajectories Cluster analysis Mahalanobis metric abstract The purpose of the study is to identify long-range transport patterns that may have an important influence on PM10 levels in three European cities at different latitudes, namely Thessaloniki, Szeged and Helsinki. A further aim is to separate medium- and long-range PM10 transport for these cities. 4-day, 6-hourly three-dimensional (3D) backward trajectories arriving at these locations at 1200 GMT were computed using the HYSPLIT model over a 5-year period from 2001 to 2005. A k-means clustering algorithm using the Mahalanobis metric was applied in order to develop trajectory types. The 3D delimination of the clusters by the function “convhull” is a novel approach. Two statistical indices were used to evaluate and compare critical daily PM10 exceedances corresponding to the trajectory clusters. For Thessaloniki, the major PM10 transport can be clearly associated with air masses arriving from Central and Southern Europe. Occasional North African dust intrusions over Greece are also found. The transport of particulate matter from North-western Europe to Thessaloniki is of limited importance. For Szeged, Central Europe, Southern Europe and Mid-eastern Europe are the most important sources of PM10. The occasional appearance of North African-origin dust over Hungary is also detected. Local PM10 levels tend to be diluted when air masses arrive at the Carpathian Basin from North-western Europe, the Mid-Atlantic e Western Europe and Northern Europe. For Helsinki, high PM10 concentrations are due to air masses coming from Northern and Eastern Europe including North-western Russia. An occasional Caspian Sea desert influence on particulate levels can also be identified. However, air currents coming from the Northern Atlantics, Northern and North-western Europe tend to dilute PM10 levels. A simple approach is developed in order to separate medium- and long-range PM10 transport for each city. Ó 2011 Elsevier Ltd. All rights reserved. 1. Introduction PM10 is a measure of particles in the atmosphere with a diam- eter of less than or equal to a nominal 10 mm. The 24-h limit value for PM10 (50 mgm 3 ) is frequently exceeded in the urban envi- ronment. The short- and long-term human exposure to high particulate matter concentrations observed in large cities increases the risk of respiratory (Annesi-Maesano et al., 2007) and also cardiovascular (Analitis et al., 2006) diseases. Therefore, studying potential key regions and long-range transport effects on urban PM10 levels is of great importance. Several authors have published backward trajectory modeling results to help detect the long-range transport of pollutant air masses that may have an impact on local PM10 levels (Salvador et al., 2008), to better describe the related tropospheric circula- tions (Jorba et al., 2004) or to characterize and identify spatial and temporal trends of pollutants (Coury and Dillner, 2007). However, single backward trajectories generally applied to detect key regions of extreme PM episodes for given sites (Hongisto and Sofiev, 2004) are not suitable for an overall identification of paths and origins of air parcels that play a role in the contribution to PM10 levels. Large numbers of trajectories arriving at a given site can be analyzed in order to determine the origin of polluted air masses. Several authors performed cluster analyses in order to place trajectories into a relatively small number of groups (Dorling et al., 1992; Dorling and Davies, 1995). Such procedures have been frequently used to interpret the origin and the transport of atmo- spheric pollution (Vardoulakis and Kassomenos, 2008). However, * Corresponding author. Tel.: þ36 62 544 856; fax: þ36 62 544 624. E-mail addresses: [email protected] (L. Makra), [email protected] (I. Matyasovszky), [email protected] (Z. Guba), [email protected] (K. Karatzas), Pia.Anttila@fmi.fi (P. Anttila). Contents lists available at ScienceDirect Atmospheric Environment journal homepage: www.elsevier.com/locate/atmosenv 1352-2310/$ e see front matter Ó 2011 Elsevier Ltd. All rights reserved. doi:10.1016/j.atmosenv.2011.02.068 Atmospheric Environment 45 (2011) 2630e2641
-
Upload
independent -
Category
Documents
-
view
1 -
download
0
Transcript of Monitoring the long-range transport effects on urban PM10 levels using 3D clusters of backward...

lable at ScienceDirect
Atmospheric Environment 45 (2011) 2630e2641
Contents lists avai
Atmospheric Environment
journal homepage: www.elsevier .com/locate/atmosenv
Monitoring the long-range transport effects on urban PM10 levelsusing 3D clusters of backward trajectories
László Makra a,*, István Matyasovszky b, Zoltán Guba a, Kostas Karatzas c, Pia Anttila d
aDepartment of Climatology and Landscape Ecology, University of Szeged, P.O. Box 653, H-6701 Szeged, HungarybDepartment of Meteorology, Eötvös Loránd University, Pázmány Péter Street 1/A, H-1117 Budapest, HungarycDepartment of Mechanical Engineering, Aristotle University, P.O. Box 483, GR-54124 Thessaloniki, Greeced Finnish Meteorological Institute, P.O. Box 503, FI-00101 Helsinki, Finland
a r t i c l e i n f o
Article history:Received 22 September 2010Received in revised form27 February 2011Accepted 28 February 2011
Keywords:Long-range PM10 transportBackward trajectoriesCluster analysisMahalanobis metric
* Corresponding author. Tel.: þ36 62 544 856; fax:E-mail addresses: [email protected] (L. Ma
(I. Matyasovszky), [email protected] (Z(K. Karatzas), [email protected] (P. Anttila).
1352-2310/$ e see front matter � 2011 Elsevier Ltd.doi:10.1016/j.atmosenv.2011.02.068
a b s t r a c t
The purpose of the study is to identify long-range transport patterns that may have an importantinfluence on PM10 levels in three European cities at different latitudes, namely Thessaloniki, Szeged andHelsinki. A further aim is to separate medium- and long-range PM10 transport for these cities. 4-day,6-hourly three-dimensional (3D) backward trajectories arriving at these locations at 1200 GMT werecomputed using the HYSPLIT model over a 5-year period from 2001 to 2005. A k-means clusteringalgorithm using the Mahalanobis metric was applied in order to develop trajectory types. The 3Ddelimination of the clusters by the function “convhull” is a novel approach. Two statistical indices wereused to evaluate and compare critical daily PM10 exceedances corresponding to the trajectory clusters.For Thessaloniki, the major PM10 transport can be clearly associated with air masses arriving fromCentral and Southern Europe. Occasional North African dust intrusions over Greece are also found. Thetransport of particulate matter from North-western Europe to Thessaloniki is of limited importance. ForSzeged, Central Europe, Southern Europe and Mid-eastern Europe are the most important sources ofPM10. The occasional appearance of North African-origin dust over Hungary is also detected. Local PM10levels tend to be diluted when air masses arrive at the Carpathian Basin from North-western Europe, theMid-Atlantic e Western Europe and Northern Europe. For Helsinki, high PM10 concentrations are due toair masses coming from Northern and Eastern Europe including North-western Russia. An occasionalCaspian Sea desert influence on particulate levels can also be identified. However, air currents comingfrom the Northern Atlantics, Northern and North-western Europe tend to dilute PM10 levels. A simpleapproach is developed in order to separate medium- and long-range PM10 transport for each city.
� 2011 Elsevier Ltd. All rights reserved.
1. Introduction
PM10 is a measure of particles in the atmosphere with a diam-eter of less than or equal to a nominal 10 mm. The 24-h limit valuefor PM10 (50 mg m�3) is frequently exceeded in the urban envi-ronment. The short- and long-term human exposure to highparticulate matter concentrations observed in large cities increasesthe risk of respiratory (Annesi-Maesano et al., 2007) and alsocardiovascular (Analitis et al., 2006) diseases. Therefore, studyingpotential key regions and long-range transport effects on urbanPM10 levels is of great importance.
þ36 62 544 624.kra), [email protected]. Guba), [email protected]
All rights reserved.
Several authors have published backward trajectory modelingresults to help detect the long-range transport of pollutant airmasses that may have an impact on local PM10 levels (Salvadoret al., 2008), to better describe the related tropospheric circula-tions (Jorba et al., 2004) or to characterize and identify spatial andtemporal trends of pollutants (Coury and Dillner, 2007). However,single backward trajectories generally applied to detect key regionsof extreme PM episodes for given sites (Hongisto and Sofiev, 2004)are not suitable for an overall identification of paths and origins ofair parcels that play a role in the contribution to PM10 levels.
Large numbers of trajectories arriving at a given site can beanalyzed in order to determine the origin of polluted air masses.Several authors performed cluster analyses in order to placetrajectories into a relatively small number of groups (Dorling et al.,1992; Dorling and Davies, 1995). Such procedures have beenfrequently used to interpret the origin and the transport of atmo-spheric pollution (Vardoulakis and Kassomenos, 2008). However,

Fig. 1. The geographical positions of Thessaloniki, Szeged and Helsinki.
Table 1Parameters of basic meteorological data and mean 24-h PM10 concentrations.
City Parameter Jan Jul Year
Thessaloniki Mean temperature (�C) 4.6 26.4 15.8Precipitation total (mm) 44 20 449Mean 24-h PM10 concentration (mg m�3) 65.3 51.5 58.9
Szeged Mean temperature (�C) �1.2 22.4 11.2Precipitation total (mm) 32 51 573Mean 24-h PM10 concentration (mg m�3) 53.2 38.1 47.0
Helsinki Mean temperature (�C) �6.1 17.2 4.9Precipitation total (mm) 57 68 640Mean 24-h PM10 concentration (mg m�3) 14.0 15.5 15.7
L. Makra et al. / Atmospheric Environment 45 (2011) 2630e2641 2631
cluster analysis alone does not tell us anything about the cause-eeffect relationships as no pre-determined characteristics are usedto define the membership for a cluster, although items in the samecluster are likely to have many features in common.
The question may arise whether deposition of coarse particles ismeaningful or they play an important role in long-range transport.For Thessaloniki, north-easterly winds can add to the background-urban PM10 level to 10 mg m�3 on a monthly basis. Furthermore,south-westerly winds, originating from North Africa, maycontribute to a monthly basis up to 20e30 mg m�3 to the alreadyexisting aerosol load of the city during transition seasons(Katragkou et al., 2009). In Crete, for the low dust period ionsdominate the PM10mass (40e60%), followed by dust (25e35%) andparticulate carbonaceous matter (PCM) (20e25%). However, duringthe identified dust outbreaks the contribution of dust rises to60e65%, the share of ions declines to 30% and only 10% is PCM(Gerasopoulos et al., 2006).
During a ten-year period (1991e2000) about 50 episodicappearance of Saharan dust in the Hungarian aerosol was assignedand investigated using PIXE analysis (Borbély-Kiss et al., 2004).Local episodes of Saharan origin were selected in the time series ofconcentration ratios Ti/Ca, Si/Al, Al/Ca, Ti/Fe, Si/Fe, Ca/Fe generallyaccepted as regional signatures of Saharan dust. These long-rangetransport episodes of mineral dust from North African desertscaused elevated concentrations of coarse Ca, Mg and K at sites inCentral Europe (Borbély-Kiss et al., 2004; Salvador et al., 2010).
For Helsinki, PM10 pollution episodes clearly of local originwerecharacterized by a low average fraction of PM2.5 (<0.2) in PM10 atthe urban traffic monitoring site, low ratio between PM10concentrations at the regional background site and at the urbantraffic site (<0.2), low average ion sums (1.5e2.5 mg m�3) and lowaccumulation to Aitken mode ratios (0.13e0.26). Furthermore, theepisodes of distinct long-range transport characteristics have a highfraction of fine particles in PM10 (0.5e0.6) at the urban traffic site,a high ratio between PM10 concentrations at the regional back-ground site and at the urban traffic site (0.7e0.8), high values forthe ion sum (6.6e11.9 mg m�3) and high accumulation to Aitkenmode ratios (0.75e0.85) (Aarnio et al., 2008).
The course fraction is considered important not only at thesethree regions but elsewhere in Europe or even in Hong Kong. InBrussels a dust storm, that occurred 2 days earlier in the Sahara,showed a significant peak in PM10 indicating a clear differencebetween PM10 and PM2.5 mass concentrations (Vanderstraetenet al., 2008). Most of the mass concentration during this periodwas due to the presence of the coarse fraction (PM2.5ePM10).Chemical analysis showed a significant similarity to Saharan dustcomposition (Vanderstraeten et al., 2008). In Hong Kong the coarsesize fractions of PM10 concentrations were about 4e8 times higherduring dust events (Lee et al., 2010). The concentration ratio ofcoarse to fine aerosol for the periods before, during and after thedust event here is 1.17, 1.96, and 1.39. About 79% of the massconcentration of PM10 dust is due to the presence of the coarsefraction. Therefore, the size distribution evolution clearly indicatesthat the coarse mode aerosol is enhanced during the dust period,despite likely scavenging of coarse particles by frontal rain.
As a result, during PM10 pollution episodes the amount ofcoarse particles increases (Borbély-Kiss et al., 2004; Gerasopouloset al., 2006; Vanderstraeten et al., 2008; Lee et al., 2010; Salvadoret al., 2010), their ratio also increases in Southern Europe(Gerasopoulos et al., 2006), in the temperate regions of Europe(Borbély-Kiss et al., 2004; Vanderstraeten et al., 2008) or in HongKong (Lee et al., 2010). However, in Northern Europe the ratio ofcoarse particles (PM2.5ePM10) increases smaller than that of fineparticles (Aarnio et al., 2008). The size distribution of the particlesin the target area generally depends on the physical characteristics
of the source regions, and on how the dust is picked up. It isprobably modified in the initial stages of transport, but afterinjection into the upper atmosphere, it is not much. In this way,coarse particles can play a substantial role in long-range transportof PM10, hence there is sense to talk about PM10 instead of justPM2.5.
The main objective of this paper is to identify the keygeographical regions responsible for PM10 levels in three cities(Thessaloniki, southern Europe; Szeged, Central Europe; and Hel-sinki, northern Europe, Fig. 1). Backward trajectories arriving atthese sites are clustered using the Mahalanobis metric in order todetermine which regions imply high PM10 concentrations. Theclustering is performed using three-dimensional (3D) backwardtrajectories. ANOVA is used to determine whether PM10 concen-trations corresponding to these trajectory clusters differ signifi-cantly. Cluster-dependent occurrences, when 24-h mean PM10concentrations exceed the limit value of 50 mg m�3 are alsoanalyzed with two statistical indices. Lastly, a simple approach isdeveloped in order to separate medium-range PM10 transportincluding local PM10 emissions from the long-range transport ofPM10.
2. Data and methods
2.1. Study areas and monitoring data
Five years (2001e2005) of dailymean PM10 data as well as dailymeteorological data (mean temperature, mean global solar flux,mean relative humidity and daily precipitation total) taken fromthree European cities e Thessaloniki (Greece), Szeged (Hungary)andHelsinki (Finland) (Fig.1; Table 1)ewere analyzed. The reasons

L. Makra et al. / Atmospheric Environment 45 (2011) 2630e26412632
for selecting these sites include their fairly big distance and theirsubstantial difference in topography and climate.
Thessaloniki (40.64 N; 22.94 E) is the second largest city ofGreece where emissions originate mainly from the local traffic.Szeged (46.25 N; 20.10 E), the largest settlement in SE Hungary, islocated at the confluence of the Rivers Tisza and Maros. Helsinki(60.25 N; 25.05 E), the capital of Finland, forms the core of theHelsinki Metropolitan Area.
2.2. Backward trajectories
In the frame of an ETEX (European Tracer Experiment) research,efficacy of three large-scale Lagrangian dispersion models (CAL-PUFF 5.8, FLEXPART 6.2 and HYSPLIT 4.8) was compared. As theHYSPLIT model has the best performance according to four statis-tical scores (Anderson, 2008), we decided to use the HYSPLIT model(Draxler and Hess, 1998).
Backward trajectories for Thessaloniki, Szeged and Helsinkicorresponding to the Hybrid Single-Particle Lagrangian IntegralTrajectory (HYSPLIT, version 4.8; http://www.arl.noaa.gov/ready/hysplit4.html) model (Draxler and Hess, 1998) were obtainedfrom National Centres for Environmental Prediction/NationalCentre for Atmospheric Research (NCEP/NCAR; http://dss.ucar.edu/datasets/ds090.0/).
Since a single backward trajectory has a large uncertainty and isof limited significance (Stohl, 1998), a three-dimensional (3D)representation of the synoptic air currents in the given regions wasmade via the reconstruction and analysis of a large number ofatmospheric trajectories. 4-day, 6-h 3D backward trajectoriesarriving at the three locations at 1200 GreenwichMean Time (GMT)at heights h ¼ 500, 1500 and 3000 m above mean sea level (AMSL)for each day over a 5-year period from 2001 to 2005 were taken inorder to describe the horizontal and vertical movements of an airparcel for the above-mentioned three cities. Hence, trajectoriesarriving at these three sites were extended backwards in time for4 days with 6-h temporal resolutions. The actual heights oftrajectories may act as an indicator of the atmosphereesurfaceinteractions. For instance, an air mass moving over a source area atlow vertical levels might be more affected by PM10 loadings of thisregion than another air mass traveling at much higher levels overthis same area.
2.3. Cluster analysis
Cluster analysis groups trajectories with similar paths. The aimof any clustering technique is to maximize the homogeneity ofelements (in our case, backward trajectories) within the clustersand also to maximize the heterogeneity among the clusters. Herea non-hierarchical cluster analysis with the k-means method(Anderberg, 1973) was applied using the Mahalanobis metric(Mahalanobis, 1936) available in MATLAB 7.5.0. Input data as clus-tering variables include the 6-hourly co-ordinate values (f e lati-tude, l e longitude and h e height AMSL) of the 4-day 3Dbacktrajectories for each city and the three given heights.
The homogeneity within clusters was measured by RMSDdefined as the sum of the root mean square deviations of clusterelements from the corresponding cluster centre over clusters. Asthe RMSD will usually decrease with an increasing number ofclusters, this quantity is not very useful for deciding about theoptimal number of clusters. However, the change of RMSD (CRMSD)versus the change of cluster numbers, or rather the change ofCMRSD (CCRMSD) is much more informative. Here, working withcluster numbers from 15 to 1, an optimal cluster number wasselected so as to maximize the change in CRMSD. The rationalebehind this approach is that the number of clusters producing the
largest improvement in cluster performance compared to that fora smaller number of clusters is considered optimal.
The results of our cluster analysis are discussed and presentedonly for the lowest (h ¼ 500 m) arrival height because back-trajectories at this arrival height are expected to have the largestinfluence on the PM10 concentration of the target site. The sepa-ration of the backward trajectory clusters and preparation of figuresfor clusters of backward trajectories were performed using a novelapproach that employs a function called “convhull”. The algorithm(qhull procedure; www.qhull.org) gathers the extreme trajectorypositions (positions farthermost from the centre) belonging toa cluster, which are then enclosed. Specifically, the procedurecreates the smallest convex hull with minimum volume coveringthe backtrajectories of the clusters (Preparata and Hong, 1977).
Borge et al. (2007) used a two-stage clustering procedure. Theyobserved that the original one-stage cluster analysis including alltrajectories was strongly influenced by the trajectory length. Longtrajectories representing fast-moving air masses were highly dis-aggregated, even though they often came from the samegeographical region. Many short trajectories representing slow-moving air masses, however, were grouped together, although theycame from very heterogeneous regions. Therefore, only the shorttrajectories were reanalyzed by identifying new clusters (second-stage). However, a second-stage analysis is not necessary if themetric in the clustering procedure is non-Euclidean. The problem ofjustifying the two steps vanishes when a Mahalanobis metric isused. The issue of a two-stage cluster analysis (Borge et al., 2007)arises from different standard deviations of the co-ordinates of thetrajectory points being far and near in time. In order to demonstratethe role of different standard deviations, let us take a difference of200 km in the position of a given trajectory point. Such a differencesome 1500 km from us seems relatively insignificant, while thesame difference is considered very large when close to the arrivingpoint of the trajectory.
2.4. Analysis of variance (ANOVA)
ANOVA is used to test whether the means of PM10 values underdifferent trajectory types (clusters) differ significantly for a givencity. If ANOVA, based on the F-test, detects significant differenceamong these means another test is then applied to determinewhich means differ significantly from the others. Significantdifferences among mean PM10 concentrations under differenttrajectory types may tell us about the origin and transport of airmasses on local PM10 levels. There are several versions available forcomparing means calculated from sub samples of a sample.A relatively simple but effective way is to use the Tukey test. Itperforms well in terms of both the accumulation of first ordererrors of the test and the test power (Tukey, 1985).
ANOVA assumes in general that elements of the entire data setrepresented as random variables are independent, and elementswithin each group have identical probability distributions. DailyPM10 data, however, do not meet these requirements as they havean annual trend in both the expected value and variance. Thesetrends can be removed by standardization. Standardized data arefree of annual trends and thus distinguishing between averagePM10 levels corresponding to trajectory types is due to the typesthemselves and it is not related to periods of the year. (Note that thestandardized PM10 values are dimensionless.) The annual trend ofthe expected value is estimated by fitting sine and cosine waveswith periods of one year and half a year to PM10 data by the leastsquares technique. Note that the half a year period is introduced todescribe the temporal asymmetry of the annual trend. A subtrac-tion of the estimated trend from data results in centralized data.The annual trend of the variance is estimated by fitting sine and

L. Makra et al. / Atmospheric Environment 45 (2011) 2630e2641 2633
cosine waves with periods of one year and half a year to squaredcentralized data. Lastly, centralized data are divided by the root ofthe estimated time-dependent variance in order to get standard-ized data. Consecutive daily PM10 values are correlated andproduce higher variances of the means estimated under trajectorytypes compared to those for uncorrelated data. The autocorrelationstructure is modeled via first order autoregressive (AR) processesconditioned on clusters. The classical Tukey test (Tukey, 1985) isthen modified according to the variances of estimated meansobtained with the help of the AR models. Note that the omission ofthis step could systematically overestimate the number of signifi-cantly different means.
2.5. Factor analysis and special transformation
Factor analysis (FA) identifies linear relationships among subsetsof examined variables, which helps to reduce the dimensionality ofthe initial database without substantial loss of information. First,a factor analysis was applied to the initial standardized data setconsisting of 8 or 9 variables (3 or 4 climatic and 5 trajectoryvariables introduced in Section 4) in order to reduce the original setof variables to fewer variables. These new variables called factorscan be viewed as the main climate/trajectory features that poten-tially influence the daily mean PM10 concentration. The optimumnumber of retained factors is determined by the criterionof reaching a prespecified percentage of the total variance (Jolliffe,1993). This percentage value was set at 80% in our case. Next,
Fig. 2. 3D clusters of the backward trajecto
a special transformation of the retained factors was performed todiscover to what degree the above-mentioned explanatory vari-ables (3 or 4 climatic and 5 trajectory variables) affect the resultantvariable (daily mean PM10 concentration), and to give a rank oftheir influence (Jahn and Vahle, 1968).
2.6. Statistical characterization of PM10 exceedance episodes
The role of long-range transport is studied by analyzing thecluster occurrences on days when 24-h mean PM10 concentrationsexceed the limit value of 50 mg m�3. Two statistical indices of dailyPM10 exceedance episodes associated with trajectory clusters arecalculated in the same manner as in Borge et al. (2007). For a givensite and cluster i, INDEX1 is defined as
INDEX1ið%Þ ¼ Dð>50Þi$100Di
; (1)
where Di is the number of occurrences of cluster i, and Dð>50Þi is thenumber of 24-h PM10 exceedances. INDEX1 gives the likelihood ofan exceedance for a given cluster. INDEX2 is defined as
INDEX2ið%Þ ¼ Dð>50Þi$100E
; (2)
where E is the total number of 24-h PM10 exceedance days recor-ded at a given site. INDEX2 can be interpreted as the likelihood ofcertain trajectory being present on a PM10 exceedance day.
ries retained, Thessaloniki, h ¼ 500 m.

Fig. 3. The individual clusters of the backward trajectories retained, enclosed by their convex hulls, Thessaloniki, top view, h ¼ 500 m.
L. Makra et al. / Atmospheric Environment 45 (2011) 2630e26412634
3. Results
3.1. Thessaloniki
The 3D clustering produced ten clusters based on CCRMSD. Allof the trajectories with colour-coded clusters, all of the clusterswithout trajectories but with their 3D convex hulls for the top viewand all trajectory clusters enclosed by their transparent convex hullas well as their 90� rotated version are presented in Fig. 2. A verticalview of the trajectory clusters enclosed by their transparent 3Dconvex hulls has also been added.
The individual clusters (Fig. 3), with the name of the sourceregions and their standardized average PM10 concentrations aretabulated (Table 2). Pairwise comparisons of the cluster averagesfound 29 significant differences among the possible 45 cluster pairs(64.4%). Hereafter only clusters of the above-mentioned significantly
different cluster-averaged PM10 levels were then considered andanalyzed (Fig. 3; Table 2).
Clusters 1, 4 and 10 have the highest INDEX1 values, namely37.1%, 38.9% and 34.6%, respectively (Fig. 8). The high INDEX1 valueof these three clusters is in agreement with their high mean PM10concentrations. Furthermore, the high standard deviation of cluster4 implies a higher chance of extreme PM10 episodes for this cluster.The first and third highest INDEX2 values (18.2% and 14.7%)belonging to cluster 10 and cluster 3 are characterized by highmean PM10 levels. Note that INDEX1 and INDEX2 are not inde-pendent parameters. When a cluster is frequent, a high INDEX1value means a high INDEX2 value (see cluster 10). Although cluster6 has a high mean PM10 level, it has medium-valued indices. Thehigh frequency of clusters 3, 6 and 10 and their low-moving back-ward trajectories emphasize the importance of these clusters inPM10 transport (Fig. 3; Table 2).

Table 2The individual clusters with the name of the source regions and their standardized average PM10 concentrations for each city, h ¼ 500 m (bold: maximum; italic: minimum)(The standardized PM10 values are dimensionless).
Cluster no. Thessaloniki Szeged Helsinki
Name of the source region PM10level
Name of the source region PM10level
Name of the source region PM10 level
1 North-western Europe 0.15 Central and Southern Europewith North Africa
0.28 Scandinavia and the ArcticSea region
�0.48
2 Eastern Europe �0.14 North-western Europe �0.09 Scandinavia and the ArcticSea region
�0.05
3 Central and Southern Europe 0.16 Mid-Atlantic e Western Europe �0.27 North-western Europe �0.364 Central and Southern Europe 0.41 Northern Europe �0.56 Eastern Europe 1.125 Mid-eastern and Southern Europe �0.09 Mid-Atlantic e Western Europe 0.35 Northern Scandinavia and
North-western Russia�0.17
6 the Balkan Peninsula and North Africa 0.15 Central Europe �0.12 Northern Atlantics �0.017 North-western Europe �0.28 Northern Europe �0.07 Western Europe �0.018 North-western Europe �0.46 Eastern Europe 0.11 Northern Europe 0.199 Mid-Atlantic e Western Europe 0.03 Mid-eastern Europe 0.38 Northern Europe 0.3010 Mid-eastern Europe 0.14 Mid-Atlantic e Western Europe 0.49 Eastern Europe 0.2411 North-western Europe �0.47
L. Makra et al. / Atmospheric Environment 45 (2011) 2630e2641 2635
Based on the above analysis, clusters 3, 4, 6 and 10 play thelargest role in PM10 transport to Thessaloniki. A substantial part ofclusters 3 and 4 (Central and Southern Europe), as well as cluster10 (Mid-eastern Europe) and the whole of cluster 6 (the BalkanPeninsula and North Africa) cover arid regions with a negativewater balance. These environments are favorable for turbulent aircurrents to take up and transport particles, and they in this way
Fig. 4. 3D clusters of the backward trajec
contribute to the measured PM10 exceedances. The role of theabove four clusters in PM10 transport is confirmed by their highmean PM10 levels (Table 2), high frequency (except for clusters4 and 6) (Fig. 3), high percentage of low-moving backtrajectories(except for cluster 4) (Fig. 2, lower panel) and high INDEX1 andINDEX2 values (Fig. 8). Cluster 6 (the Balkan Peninsula and NorthAfrica) indicates occasional North African dust intrusion over
tories retained, Szeged, h ¼ 500 m.
L. Makra et al. / Atmospheric Environment 45 (2011) 2630e26412636
Greece, in accordance with results of earlier studies (Balis et al.,2004; Katragkou et al., 2009). Cluster 10 (Mid-eastern Europe) isalso a major source of PM10 transport to Thessaloniki, strength-ening the finding of Katragkou et al. (2009). They showed thatnorth-eastern flows (our cluster 10) and southern flows (our cluster6) are the most frequent, and they can greatly influence the PM10level of Thessaloniki. Clusters 7 and 8 have the lowest mean PM10levels; they are both infrequent and includemostly high-moving airmasses, which is consistent with the finding of Katragkou et al.(2009) that the transport of particulate matter from North-western Europe to Thessaloniki is of limited importance (Fig. 3;Table 2).
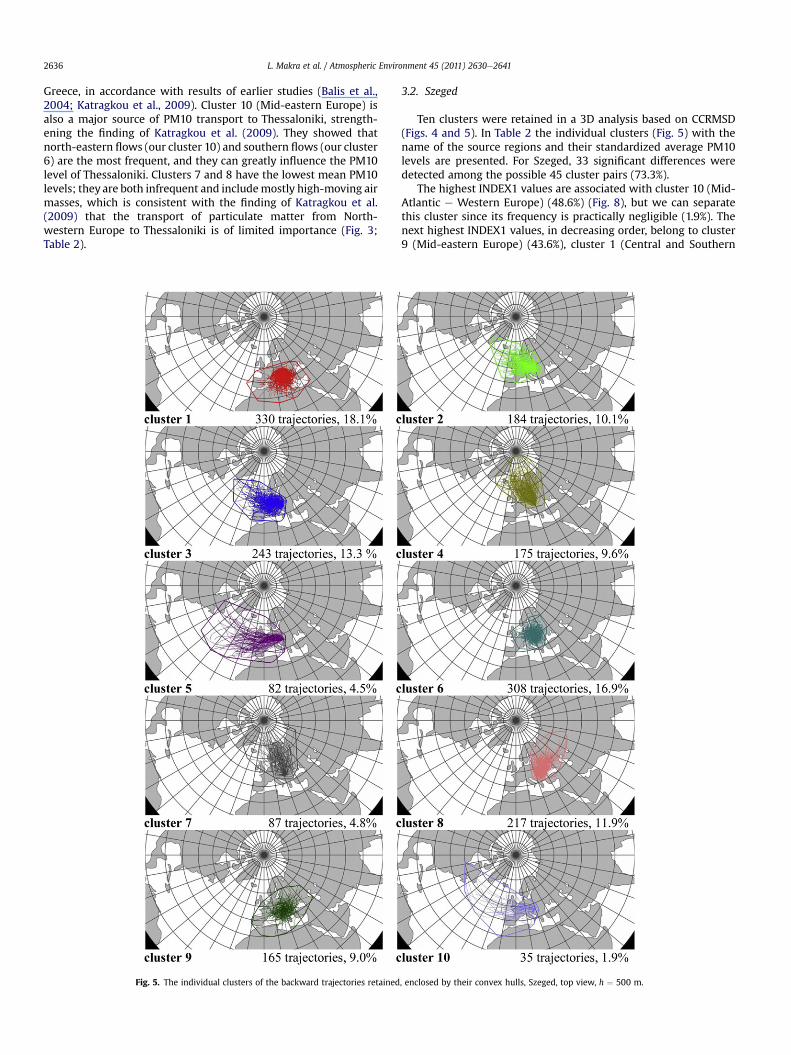
Fig. 5. The individual clusters of the backward trajectories retained
3.2. Szeged
Ten clusters were retained in a 3D analysis based on CCRMSD(Figs. 4 and 5). In Table 2 the individual clusters (Fig. 5) with thename of the source regions and their standardized average PM10levels are presented. For Szeged, 33 significant differences weredetected among the possible 45 cluster pairs (73.3%).
The highest INDEX1 values are associated with cluster 10 (Mid-Atlantic e Western Europe) (48.6%) (Fig. 8), but we can separatethis cluster since its frequency is practically negligible (1.9%). Thenext highest INDEX1 values, in decreasing order, belong to cluster9 (Mid-eastern Europe) (43.6%), cluster 1 (Central and Southern
, enclosed by their convex hulls, Szeged, top view, h ¼ 500 m.

L. Makra et al. / Atmospheric Environment 45 (2011) 2630e2641 2637
Europe with North Africa) (34.5%) and cluster 5 (Mid-Atlantic e
Western Europe) (31.7%). This is in agreement with the fact thatthese clusters have very high mean PM10 levels (Fig. 5; Table 2).
Accordingly, clusters 1, 5 and 9 are the most relevant in terms ofPM10 transport to Szeged, which is confirmed by their highestmean PM10 levels (Table 2), their high frequency (except for cluster5) (Fig. 5), high portions of low-moving backtrajectories (Fig. 4,lower panel) and high INDEX1 and INDEX2 values (except forcluster 5) (Fig. 8). Cluster 1 (Central and Southern Europe withNorth Africa), being the most frequent, includes short back-trajectories and, hence, slow-moving air masses. The regionenclosed by this cluster is generally dry, especially in spring, andwind erosion is frequently significant (e.g. the Hungarian GreatPlain within the Carpathian Basin; Mezosi and Szatmari, 1998),creating a source of PM10. Furthermore, an important part of thiscluster is over North Africa, and this shows that high PM10exceedance episodes can occasionally be related to low-moving airmasses coming from North Africa (Borbély-Kiss et al., 1999; Koltayet al., 2006). Cluster 5 (together with cluster 10) has the longest(fastest) backtrajectories. Even though they originate overa pollutant free region (the Mid-Atlantics), they take up andtransport a considerable amount of dust over Hungary aftercrossing Southern and Central Europe. This cluster is only of minorimportance due to its infrequent occurrence. Together with cluster1 (Central and Southern Europe with North Africa), cluster 9 (Mid-eastern Europe) is the most important for transporting PM10 toSzeged. Consequently, Central-, Southern- and Mid-eastern Europe
Fig. 6. 3D clusters of backward trajecto
are the most important sources of PM10 for Hungary. Most of theseregions, especially the Mediterranean, are warm and arid fora substantial part of the year, making it easier to uplift and trans-port particulates to the target area (Fig. 5; Table 2).
3.3. Helsinki
Eleven clusters were identified for Helsinki based on CCRMSD(Figs. 6 and 7). The individual clusters (Fig. 7), with the name of thesource regions and their standardized average PM10 concentra-tions are indicated (Table 2).
The highest INDEX1 values are associated with clusters havingthe highest PM10 levels; namely, in decreasing order, cluster4 (69.1%), cluster 10 (37.9%), cluster 8 (30.9%) and cluster 9 (29.6%)(Fig. 8). But the highest INDEX2 values, in decreasing order, areindicated by cluster 4 (18.4%), cluster 8 (16.7%) and cluster10 (14.7%). The INDEX2 value of cluster 9, having a highmean PM10level, is low due to its very low frequency. Clusters 1, 3 and 11 withthe lowest particulate concentrations have the lowest INDEX1 andINDEX2 values (Fig. 7; Table 2).
In summary, clusters 4 (Eastern Europe), 8 (Northern Europe)and 10 (Eastern Europe) are considered the most important. Theseclusters have the highest PM10 levels (Table 2), have a highfrequency (except for cluster 4) (Fig. 7) and have the highestINDEX1 and INDEX2 values (Fig. 8). Furthermore, these clustershave significant portions of low-moving backtrajectories (Fig. 6,lower panel). Note that cluster 9 (Northern Europe) also has a high
ries retained, Helsinki, h ¼ 500 m.
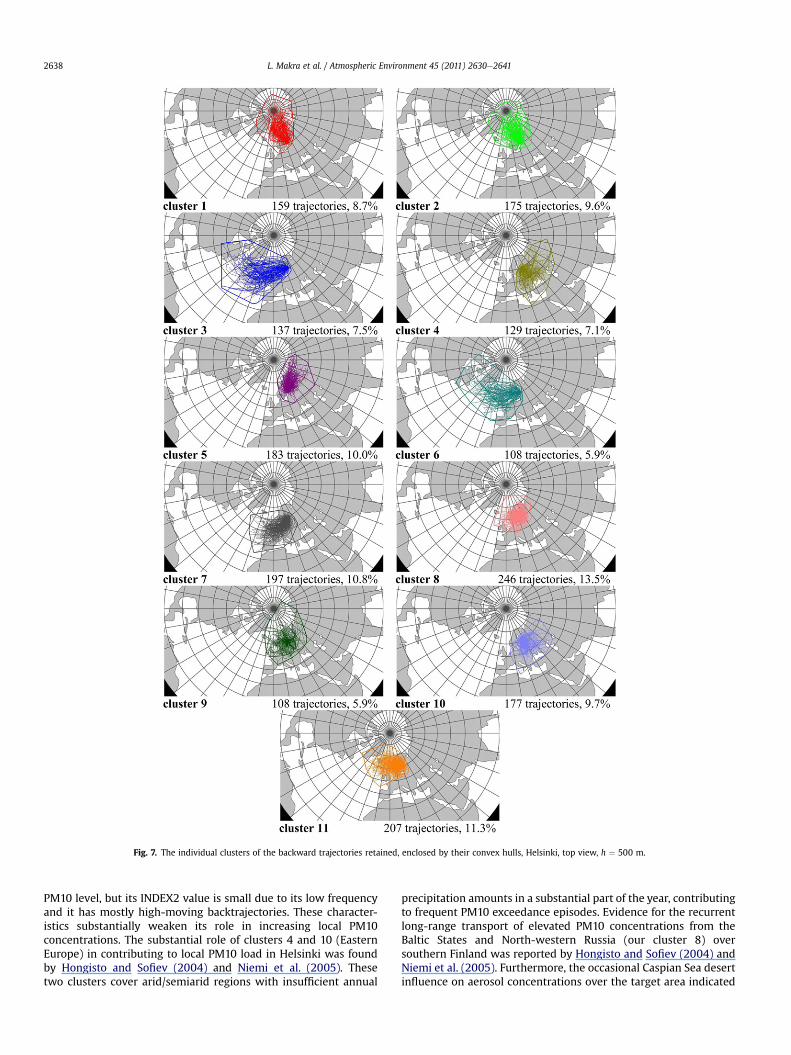
Fig. 7. The individual clusters of the backward trajectories retained, enclosed by their convex hulls, Helsinki, top view, h ¼ 500 m.
L. Makra et al. / Atmospheric Environment 45 (2011) 2630e26412638
PM10 level, but its INDEX2 value is small due to its low frequencyand it has mostly high-moving backtrajectories. These character-istics substantially weaken its role in increasing local PM10concentrations. The substantial role of clusters 4 and 10 (EasternEurope) in contributing to local PM10 load in Helsinki was foundby Hongisto and Sofiev (2004) and Niemi et al. (2005). Thesetwo clusters cover arid/semiarid regions with insufficient annual
precipitation amounts in a substantial part of the year, contributingto frequent PM10 exceedance episodes. Evidence for the recurrentlong-range transport of elevated PM10 concentrations from theBaltic States and North-western Russia (our cluster 8) oversouthern Finland was reported by Hongisto and Sofiev (2004) andNiemi et al. (2005). Furthermore, the occasional Caspian Sea desertinfluence on aerosol concentrations over the target area indicated

Fig. 8. Indices 1 and 2 for 3D clusters of the backward trajectories, h ¼ 500 m.
L. Makra et al. / Atmospheric Environment 45 (2011) 2630e2641 2639
by some backtrajectories of clusters 4 and 10 was previouslymentioned by Hongisto and Sofiev (2004).
4. Discussion and conclusions
A cluster analysis was applied to 4-day, 6-hourly backwardtrajectories arriving at Thessaloniki, Szeged and Helsinki over a 5-year period in order to identify the main atmospheric circulationpathways influencing PM10 levels at these sites. When performingANOVA, the decision on the significance of two cluster averages isbased on a modified t-test because the test is performed usingstandardized data instead of the original data. The Mahalanobismetric was used in order to avoid the need for a two-stage clusteranalysis introduced in Borge et al. (2007). The 3D delimination ofthe clusters, by the function “convhull” is a novel approach.Furthermore, presentation of vertical extension of the trajectoryclusters enclosed by their 3D convex hulls and, in this way,delimiting low-moving backtrajectories is a novel procedure.
When determining important clusters that mainly influencePM10 levels, the following aspects were considered: 1) the averagePM10 level of a given cluster should differ significantly from that ofanother cluster, 2) the average of the given cluster should be high,3) the INDEX1 value and/or INDEX2 value of the given clustershould be high. Two other factors could be important, namelywhether the given cluster has a high frequency and whether thegiven cluster has low-level backward trajectories.
For Thessaloniki, the major PM10 transport can be clearlyassociated with air masses coming from Central and SouthernEurope, the Balkan Peninsula and North Africa and Mid-easternEurope. The importance of these clusters is justified by largeregions that have a negative water balance in a substantial part ofthe year. The Balkan Peninsula and North Africa suggest occasionalNorth African dust intrusions over Greece, which are in accordancewith results obtained from related studies (Balis et al., 2004;Katragkou et al., 2009). Mid-eastern Europe is also a major sourceof PM10 transport to Thessaloniki. This conclusion is in accordancewith the results of Katragkou et al. (2009) who found that north-eastern flows (our cluster 10) and southern flows (our cluster 6)are the most frequent and they can influence the PM10 level of
Thessaloniki. Although clusters 7 and 8 have the lowest PM10levels, they are both infrequent and includemostly high-moving airmasses, suggesting that transport of particulate matter fromNorth-western Europe to Thessaloniki is of little importance (Katragkouet al., 2009).
For Szeged, clusters 1, 5 and 9 are the most relevant in PM10transport. Cluster 1, corresponding to Central and Southern Europewith North Africa, includes the occasional appearance of NorthAfrican-origin dust over Hungary and corroborates earlier studies(Borbély-Kiss et al., 1999; Koltay et al., 2006). Cluster 5 (Mid-Atlantic eWestern Europe) consisting of trajectories that pass overSouthern and Central Europe, transports a considerable amount ofdust over Hungary. However, this cluster is generally of littleimportance due to its infrequent occurrence. Together with cluster1, cluster 9 (Mid-eastern Europe) is the most important for trans-porting PM10 to Szeged. Consequently, Central-, Southern- andMid-eastern Europe are the most important sources of PM10 overHungary. Most of these regions, especially the Mediterranean, arewarm and arid for a substantial part of the year, making it easier touplift and transport particulates over the target area.
As regards Helsinki, clusters 4 (Eastern Europe), 8 (NorthernEurope) and10 (Eastern Europe) are considered themost important.The substantial role of clusters 4 and 10 in contributing to localPM10 load in Helsinki is in agreement with the findings of Hongistoand Sofiev (2004) and Niemi et al. (2005). These two clusters coverarid/semiarid regions with insufficient annual precipitationamounts for a substantial part of the year and contribute to frequentPM10 exceedance episodes. Evidence for the recurrent long-rangetransport of elevated PM10 concentrations from the Baltic Statesand North-western Russia over southern Finland was reported byHongisto and Sofiev (2004) and Niemi et al. (2005). An occasionalCaspian Sea desert influence on aerosol concentrations over thetarget area indicated by some backtrajectories of clusters 4 and 10strengthens earlier conclusions (Hongisto and Sofiev, 2004).
After classifying objective groups of backtrajectories and, in thisway, detecting the main circulation pathways for the cities in ques-tion, it is important to separate local and transported components ofthe actual PM10 levels. In other words, it is necessary to determinethe relative weight of these two components in the measured PM10

L. Makra et al. / Atmospheric Environment 45 (2011) 2630e26412640
concentration. There are several case studies available that allowoneto distinguish the long-range PM10 transport episodes from localPM10 pollution episodes (Escudero et al., 2006; Aarnio et al., 2008).Analyses of local meteorological conditions and air mass back-trajectories for a given city play an important role in developingmethods for the above purpose (Aarnio et al., 2008). An attempt ismade here using local meteorological parameters and componentsof the trajectories to discriminate these two pollution modes in theentire 5-year data set. Local PM10 pollution is characterized next viathe daily mean temperature, daily relative humidity and daily globalsolar flux. Snow depth is also considered for Helsinki, because thespring peak of PM10 typically covers thewhole snowmelt period forthis city (Anttila and Salmi, 2006). Long-range PM10 transport isdescribed by the real 3D length of the trajectories, the length of the3D trajectories as the crow flies, their ratio, as well as the averagedaily highest and lowest positions of the backward trajectories basedon their 4-day, 6-hourly positions. The latter two characteristics referto the vertical transport of PM10 in the atmosphere, which comesfrom either turbulent transport, dominating the vertical exchange ofPM10 in the boundary layer, or intense convective upwelling, whichresults in large amounts of particulates being transported from nearthe surface to high elevations (Ansmann et al., 2003).
As the PM10 level on a given day is substantially influenced bywhether it corresponds to a non-rainy or rainy day, the backwardtrajectories are divided into two groups, i.e. non-rainy and rainydays. This kind of classification of days reveals the role of precipi-tation in the quantity of transported PM10 (Querol et al., 2009).After performing a factor analysis, a special transformation wascarried out for each city with the two groups (rainy or non-rainydays) and the 500 m, 1500 m and 3000 m arrival heights of thebackward trajectories. Thus, altogether 3 � 2 � 3 ¼ 18 proceduresgave information about the weights of the local source and long-range transport reflected by the 8 (9 for Helsinki) explanatoryvariables. The main conclusion is as follows. Local PM10 pollution isgreater, both for non-rainy and rainy days, for Thessaloniki andHelsinki, while long-range transport plays a higher role both fornon-rainy and rainy days for Szeged. Adding up the weights of thelocal pollution and long-range transport, the average value of thetwo weights is larger for Szeged on non-rainy days and for Szegedand Helsinki on rainy days at the 500 m height compared to thehigher levels. Hence, the eight (nine) variables contain moreinformation on PM10 when using backtrajectories arriving at the500 m height in these three cases. For the other three cases (The-ssaloniki on non-rainy and rainy days, as well as Helsinki on non-rainy days) the results disagree with our preliminary expectationsbecause near surface air currents might be affected by severalfactors that substantially modify the ratio of the local and trans-ported particulates. Moreover, the variables contain more infor-mation at higher levels on the transported PM10 for Thessalonikion rainy days and for Helsinki on non-rainy days. The role of bothkinds of variables is essentially the same when considering rainy ornon-rainy days. Note that these findings are valid only for variationsof daily PM10 concentrations accounted for by the eight (nine forHelsinki) explanatory variables and nothing is known about thevariance portion not explained by these variables.
Acknowledgments
The authors would like to thank Roland Draxler for his usefuladvice and consultations on the HYSPLIT model, version 4.8 and toZoltán Sümeghy for the digital mapping in Fig. 1. This study wassupported by the EU-6 Quantify project [No. 003893 (GOCE)], aswell as the European Union and the European Social Fund [No.TAMOP 4.2.1/B-09/1/KMR-2010-0003 and TAMOP-4.2.1/B-09/1/KONV-2010-0005].
References
Aarnio, P., Martikainen, J., Hussein, T., Valkama, I., Vehkamäki, H., Sogacheva, L.,Härkönen, J., Karppinen, A., Koskentalo, T., Kukkonen, J., Kulmala, M., 2008.Analysis and evaluation of selected PM10 pollution episodes in the HelsinkiMetropolitan Area in 2002. Atmospheric Environment 42 (17), 3992e4005.
Analitis, A., Katsouyanni, K., Dimakopoulou, K., Samoli, E., Nikoloulopoulos, A.K.,Petasakis, Y., Touloumi, G., Schwartz, J., Anderson, H.R., Cambra, K., Forastiere, F.,Zmirou, D., Vonk, J.M., Clancy, L., Kriz, B., Bobvos, J., Pekkanen, J., 2006. Short-term effects of ambient particles on cardiovascular and respiratory mortality.Epidemiology 17, 230e233.
Anderberg, M.R., 1973. Cluster Analysis for Applications. Academic Press, New York.Anderson, B., 2008. Evaluation Methods for Long Range Transport. 9th
Modeling Conference Presentations. US Environmental Protection Agency,Technology Transfer Network Support Center for Regulatory AtmosphericModeling.
Annesi-Maesano, I., Forastiere, F., Kunzli, N., Brunekref, B., 2007. Particulate matter,science and EU policy. European Respiratory Journal 29, 428e431.
Ansmann, A., Bosenberg, J., Chaikovsky, A., Comeron, A., Eckhardt, S., Eixmann, R.,Freudenthaler, V., Ginoux, P., Komguem, L., Linne, H.,Marquez,M.A.L.,Matthias, V.,Mattis, I., Mitev, V., Muller, D., Music, S., Nickovic, S., Pelon, J., Sauvage, L.,Sobolewsky, P., Srivastava, M.K., Stohl, A., Torres, O., Vaughan, G., Wandinger, U.,Wiegner, M., 2003. Long-range transport of Saharan dust to northern Europe: the11e16 October 2001 outbreak observed with EARLINET. Journal of GeophysicalResearch e Atmosphere 108 (D24), 4783.
Anttila, P., Salmi, T., 2006. Characterizing temporal and spatial patterns of urbanPM10 using six years of Finnish monitoring data. Boreal Environment Research11, 463e479.
Balis, D.S., Amiridis, V., Nickovic, S., Papayannis, A., Zerefos, C., 2004. Opticalproperties of Saharan dust layers as detected by a Raman lidar at Thessaloniki,Greece. Geophysical Research Letters 31 (13), L13104.
Borbély-Kiss, I., Koltay, E., Szabó, G.Y., Bozó, L., Tar, K., 1999. Composition andsources of urban and rural atmospheric aerosol in eastern Hungary. Journal ofAerosol Science 30, 369e391.
Borbély-Kiss, I., Kiss, ÁZ., Koltay, E., Szabó, Gy, Bozó, L., 2004. Saharan dust episodesin Hungarian aerosol: elemental signatures and transport trajectories. Journalof Aerosol Science 35 (10), 1205e1224.
Borge, R., Lumbreras, J., Vardoulakis, S., Kassomenos, P., Rodríguez, E., 2007. Analysisof long-range transport influences on urban PM10 using two-stage atmospherictrajectory clusters. Atmospheric Environment 41, 4434e4450.
Coury, C., Dillner, A.M., 2007. Trends and sources of particulate matter in theSuperstition wilderness using air trajectory and aerosol cluster analysis.Atmospheric Environment 41, 9309e9323.
Dorling, S.R., Davies, T.D., 1995. Extending cluster analysis e synoptic meteorologylinks to characterise chemical climates at six northwest European monitoringstations. Atmospheric Environment 29, 145e167.
Dorling, S.R., Davies, T.D., Pierce, C.E., 1992. Cluster analysis: a technique for esti-mating the synoptic meteorological controls on air and precipitation chemistrye method and applications. Atmospheric Environment 26, 2575e2581.
Draxler, R.R., Hess, G.D., 1998. An overwiew of the HYSPLIT_4 modelling system fortrajectories, dispersion and deposition. Australian Meteorological Magazine 47,295e308.
Escudero, M., Stein, A., Draxler, R.R., Querol, X., Alastuey, A., Castillo, S., Avila, A.,2006. Determination of the contribution of northern Africa dust source areas toPM10 concentrations over the central Iberian Peninsula using the HybridSingle-Particle Lagrangian Integrated Trajectory model (HYSPLIT) model. Jour-nal of Geophysical Research-Atmosphere 111, D06210.
Gerasopoulos, E., Kouvarakis, G., Babasakalis, P., Vrekoussis, M., Putaud, J.P.,Mihalopoulos, N., 2006. Origin and variability of particulate matter (PM10)mass concentrations over the Eastern Mediterranean. Atmospheric Environ-ment 40 (25), 4679e4690.
Hongisto, M., Sofiev, M., 2004. Long-range transport of dust to the Baltic Sea region.International Journal of Environment and Pollution 22 (1e2), 72e86.
Jahn, W., Vahle, H., 1968. Die Faktoranalyse und ihre Anwendung. Verlag dieWirtschaft, Berlin (in German).
Jolliffe, I.T., 1993. Principal component analysis: a beginner’s guide e II. Pitfalls,myths and extensions. Weather 48, 246e253.
Jorba, O., Pérez, C., Rocadenbosch, F., Baldasano, J.M., 2004. Cluster analysis of 4-daybackward trajectories arriving in the Barcelona area, Spain, from 1997 to 2002.Journal of Applied Meteorology 43, 887e901.
Katragkou, E., Kazadzis, S., Amiridis, V., Papaioannou, V., Karathanasis, S., Melas, D.,2009. PM10 regional transport pathways in Thessaloniki, Greece. AtmosphericEnvironment 43 (5), 1079e1085 (special issue).
Koltay, E., Borbély-Kiss, I., Kertész, Z., Kiss, ÁZ., Szabó, Gy, 2006. Assignment ofSaharan dust sources to episodes in Hungarian atmosphere by PIXE and TOMSobservations. Journal of Radioanalytical and Nuclear Chemistry 267 (2),449e459.
Lee, Y.C., Yang, X., Wenig, M., 2010. Transport of dusts from East Asian and non-EastAsian sources to Hong Kong during dust storm related events 1996e2007.Atmospheric Environment 44 (30), 3728e3738.
Mahalanobis, P.C., 1936. On the generalized distance in statistics. Proceedings of theNational Institute of Sciences India 12, 49e55.
Mezosi, G., Szatmari, J.,1998. Assessment ofwind erosion risk on the agricultural areaof the southern part of Hungary. Journal of Hazardous Material 61, 139e153.

L. Makra et al. / Atmospheric Environment 45 (2011) 2630e2641 2641
Niemi, J.V., Tervahattu, H., Vehkamaki, H., Martikainen, J., Laakso, L., Kulmala, M.,Aarnio, P., Koskentalo, T., Sillanpaa, M., Makkonen, U., 2005. Characterization ofaerosol particle episodes in Finland caused by wildfires in Eastern Europe.Atmospheric Chemistry and Physics 5, 2299e2310.
Preparata, F.P., Hong, S.J., 1977. Convex hulls of finite sets of points in two and threedimensions. Communications of the ACM 20, 87e93.
Querol, X., Pey, J., Pandolfi, M., Alastuey, A., Cusack, M., Pérez, N., Moreno, T.,Viana, M., Mihalopoulos, N., Kallos, G., Kleanthous, S., 2009. African dustcontributions to mean ambient PM10 mass-levels across the MediterraneanBasin. Atmospheric Environment 43 (28), 4266e4277.
Salvador, P., Arti�nano, B., Querol, X., Alastuey, A., 2008. A combined analysis ofbackward trajectories and aerosol chemistry to characterise long-range trans-port episodes of particulate matter: the Madrid air basin, a case study. Scienceof the Total Environment 390, 495e506.
Salvador, P., Arti�nano, B., Pio, C., Afonso, J., Legrand, M., Puxbaum, H., Hammer, S.,2010. Evaluation of aerosol sources at European high altitude background sites
with trajectory statistical methods. Atmospheric Environment 44 (19),2316e2329.
Stohl, A., 1998. Computation, accuracy and application of trajectories e a review andbibliography. Atmospheric Environment 32, 947e966.
Tukey, J.W., 1985. The problem of multiple comparisons (1953). In: The CollectedWorks of John W. Tukey. Time Series, 1965e1984, vol. II. Wadsworth AdvancedBooks & Software, Monterey, CA.
Vanderstraeten, P., Lénelle, Y., Meurrens, A., Carati, D., Brenig, L., Delcloo, A.,Offer, Z.Y., Zaady, E., 2008. Dust storm originate from Sahara covering WesternEurope: a case study. Atmospheric Environment 42 (21), 5489e5493.
Vardoulakis, S., Kassomenos, P., 2008. Sources and factors affecting PM10 levels intwo European cities: implications for local air quality management. Atmo-spheric Environment 42, 3949e3963.
http://www.arl.noaa.gov/ready/hysplit4.html.http://dss.ucar.edu/datasets/ds090.0/.http://www.qhull.org.