Molecular Resolution Imaging of an Antibiotic Peptide in a Lipid Matrix
7
Subscriber access provided by University of Guelph Librar Journal of the American Chemical Society is published by the American Chemical Society. 1155 Sixteenth Street N.W., Washington, DC 20036 Article Molecular Resolution Imaging of an Antibiotic Peptide in a Lipid Matrix Slawomir Sek, Thamara Laredo, John R. Dutcher, and Jacek Lipkowski J. Am. Chem. Soc., 2009, 131 (18), 6439-6444• DOI: 10.1021/ja808180m • Publication Date (Web): 15 April 2009 Downloaded from http://pubs.acs.org on May 6, 2009 More About This Article Additional resources and features associated with this article are available within the HTML version: • Supporting Information • Access to high resolution figures • Links to articles and content related to this article • Copyright permission to reproduce figures and/or text from this article
Transcript of Molecular Resolution Imaging of an Antibiotic Peptide in a Lipid Matrix

Subscriber access provided by University of Guelph Librar
Journal of the American Chemical Society is published by the American ChemicalSociety. 1155 Sixteenth Street N.W., Washington, DC 20036
Article
Molecular Resolution Imaging of an Antibiotic Peptide in a Lipid MatrixSlawomir Sek, Thamara Laredo, John R. Dutcher, and Jacek Lipkowski
J. Am. Chem. Soc., 2009, 131 (18), 6439-6444• DOI: 10.1021/ja808180m • Publication Date (Web): 15 April 2009
Downloaded from http://pubs.acs.org on May 6, 2009
More About This Article
Additional resources and features associated with this article are available within the HTML version:
• Supporting Information• Access to high resolution figures• Links to articles and content related to this article• Copyright permission to reproduce figures and/or text from this article
Molecular Resolution Imaging of an Antibiotic Peptide in aLipid Matrix
Slawomir Sek,† Thamara Laredo,†,‡ John R. Dutcher,‡ and Jacek Lipkowski*,†
Departments of Chemistry and Physics, UniVersity of Guelph, Guelph, Ontario, Canada N1G2W1
Received October 16, 2008; E-mail: [email protected]
Abstract: In this work, we show molecular resolution scanning tunneling microscopy (STM) images ofgramicidin, a model antibacterial peptide, inserted into a phospholipid matrix. The resolution of the imagesis superior to that obtained in previous attempts to image gramicidin in a lipid environment using atomicforce microscopy (AFM). This breakthrough has allowed visualization of individual peptide moleculessurrounded by lipid molecules. We have observed several important features: the peptide molecules donot aggregate, the peptide molecules adopt a single conformation corresponding to a specific ion channelform, and the lipid molecules adjacent to the peptide molecules are systematically longer than those in thelipid matrix. These results constitute a new approach to obtain structural characteristics of antibiotic peptidesin lipid assemblies that is necessary for the understanding of their biological activity.
Introduction
The emergence of antibiotic resistance has made it necessaryfor the development of alternatives to traditional antibiotics.1
Many small peptides with 12-50 amino acid residues have beenidentified in recent years as having antimicrobial activity,2,3 andthis biological activity is believed to be strongly related to theirinteractions within the cell membrane.4 A necessary step inunderstanding the mechanisms of bioactivity of antimicrobialpeptides is the characterization of the structure of peptide-lipidassemblies. The linear gramicidins are the best understoodpeptide antibiotics 5-8 and hence they are ideal model systemsto investigate the properties of this class of peptides in the lipidenvironment. The natural mixture of gramicidins denoted asgramicidin D (gD) consists of ∼85% gramicidin A which is apentadecapeptide: Formyl-L-Val1-Gly2-L-Ala3-D-Leu4-L-Ala5-D-Val6-L-Val7-D-Val8-L-Trp9-D-Leu10-L-Trp11-D-Leu12-L-Trp13-D-Leu14-L-Trp15-Ethanolamine. In lipid bilayers or monolayersthe alternating L-D amino acid sequence allows the molecule to
fold as a right-handed 6.3 helix with 6.3 residues per turn. Theinterior of the channel is formed by the polar peptide backbonewith side chains projecting outward5-8 toward the lipids. Thehydrogen bonds between the tryptophans and the lipid polargroups orient the helix with the C-terminus turned to themembrane surface and the N-terminus to its hydrophobicinterior. When gramicidin molecules are present in the twoleaflets of a bilayer, they may form a dimer stabilized by sixhydrogen bonds between two N-end to N-end oriented moleculesto create an ion conductive channel spanning the membrane.5,6
The present knowledge concerning the structure of membrane-bound gramicidin comes chiefly from NMR9-12 and moleculardynamics simulation7,13,14 studies. Although this is the bestunderstood peptide-lipid system, there are still several importantunresolved issues such as: What is the degree of peptideaggregation in the lipid environment?15,16 What is the effect ofthe peptide on the nearest-neighbor lipids?7,14 Does the mem-brane thickness increase or decrease in the vicinity of thepeptide?14 What is the rotomeric state of tryptophans withinthe gramicidin molecules?13 Below, we demonstrate that high-resolution STM images of the peptide embedded in a monolayerof 1,2-dimyristoyl-sn-glycero-3-phosphocholine (DMPC) canprovide answers to these questions. Monolayers of phospholipidshave been frequently used as a model to study interactions ofantibacterial peptides with lipids.4 At present, high-resolution
† Department of Chemistry.‡ Department of Physics.
(1) Tenover, F. C. Am. J. Med. 2006, 119, S3, Suppl. 6A.(2) (a) Zasloff, M. Nature (London) 2002, 415, 389. (b) Take, O.
Biopolymers 2005, 80, 717.(3) (a) Hancock, R. E. W.; Rozek, A. FEMS Microbiol. Lett. 2002, 206,
143. (b) Tamago, R.; Portillo, A. C.; Gunn, J. S. Mechanism ofbacterial resistance to antimicrobial host peptides. In , MammalianHost Defense Peptides; Devine , D. A.; Hancock, R. E. W. CambridgeUniversity Press: UK, New York, 2004; p 323. (c) Hale, J. D.;Hancock, R. E. Expert ReV. Anti-Infect. Ther. 2007, 5, 951.
(4) (a) Volinsky, R.; Kolusheva, S.; Berman, A.; Jelinek, R. Biochim.Biophys. Acta 2006, 1758, 1393. (b) Weis, M.; Vanco, M.; Vitovic,P.; Hianik, T.; Cirak, J. J. Phys. Chem. B 2006, 110, 26272.
(5) Kelkar, D. A.; Chattopadhyay, A. Biochim. Biophys. Acta 2007, 1768,2011.
(6) Andersen, O. S.; Koeppe, R. E.; Roux, B. IEEE Trans. Nanosci. 2005,4, 10.
(7) (a) Woolf, T. B.; Roux, B. Proteins: Struct., Funct., Genet. 1996, 24,92. (b) Roux, B. Acc. Chem. Res. 2002, 35, 366.
(8) Wallace, B. A. Annu. ReV. Biophys. Biophys. Chem. 1990, 19, 127.
(9) Ketchem, R. R.; Hu, W.; Cross, T. A. Science 1993, 261, 1457.(10) Hu, W.; Cross, T. A. Biochemistry 1995, 34, 14147.(11) Ketchem, R. R.; Lee, K. C.; Huo, S.; Cross, T. A. J. Biomol. NMR
1996, 8, 1.(12) Ketchem, R. R.; Roux, B.; Cross, T. A. Structure 1997, 5, 1655.(13) Allen, T. W.; Andersen, O. S.; Roux, B. J. Am. Chem. Soc. 2003,
125, 9868.(14) Chiu, S-W.; Subramaniam, S.; Jakobsson, E. Biophys. J. 1999, 76,
1929.(15) Ivanova, V. P.; Makarov, I. M.; Schaffer, T. E.; Heimburg, T. Biophys.
J. 2003, 84, 2427.(16) Diociaiuti, M.; Bordi, F; Motta, A.; Carosi, A.; Molinari, A.; Arancia,
G.; Coluzza, C. Biophys. J. 2002, 82, 3198.
Published on Web 04/15/2009
10.1021/ja808180m CCC: $40.75 2009 American Chemical Society J. AM. CHEM. SOC. 2009, 131, 6439–6444 9 6439

STM images of a film of phospholipid in solution can beacquired for a monolayer. Therefore, we will be able to provideinformation concerning the peptide-lipid interaction in amonolayer only. However, we will point out that in several casesthe STM data are in accord with the results of NMR andmolecular dynamics studies of gD in DMPC bilayers. Molecularresolution STM images of a phospholipid bilayer supported ata conductive surface in air have already been reported.17 Withfurther methodological improvements, imaging of the supportedbilayer in a solution should also be possible in the future. Thiswork constitutes a significant step in this direction.
Experimental Section
A small bead which was obtained by melting a gold wire wasused as the working electrode. The bead was spot-welded to a goldplate. The atomically flat (111) facets at the bead surface were usedfor image acquisition. A gold ring served as the counter electrode,and a miniaturized Ag/AgCl (sat. KCl) was used as the referenceelectrode. The working electrode, the gold wire counter electrode,and the Teflon parts of the STM electrochemical cell were cleanedin piranha solution (concentrated H2SO4/30% H2O2, 3:1 v/v) for30 min and rinsed thoroughly with Milli-Q ultrapure water.(CAUTION: piranha solution reacts Violently with organic materialsand should be handled with extreme care.) Gold electrodes (workingand counter) were flame annealed and quenched in Milli-Q waterprior to the experiment. The STM images were acquired using aNanoscope II EC-STM connected to a Nanoscope IIIa controller(Digital Instruments, Santa Barbara, CA) with an A scanner. Theconstant current mode was used for imaging. The images wereacquired in a 0.1 M NaF (MV Laboratories Inc.) aqueous solutionat a potential of +0.2 V vs Ag/AgCl for which the charge densityat the gold electrode surface is close to zero using a tunnelingcurrent of 0.35 nA and a bias voltage of -0.45 V. The tungstenSTM tips were electrochemically etched in 2 M NaOH and thencoated with polyethylene in order to minimize the faradaic currents.The STM experiments were carried out at 18 ( 1 °C. DMPC andgramicidin D (Sigma-Aldrich, St. Louis, MO) were used withoutfurther purification to make 10 and 4 mg mL-1 stock solutionsrespectively in trifluoroethanol (TFE) (Sigma-Aldrich). GramicidinD contains ∼85% gramicidin A and a mixture of gramicidins Band C. In gramicidin B tryptophan-11 is replaced by phenylalanine,and in gramicidin C, by tyrosine.21 During analysis of STM images,efforts have been made to verify that features assigned to thechannel correspond to gramicidin A, the major component. Volumesof both the lipid and peptide solutions were added to test tubes toan overall concentration of 10% molar ratio of gD with respect tothe DMPC. The tubes were then heated to about 40 °C for 1 h,during which time the solutions were mixed in a vortex (Fisher,Vortex Genie 2) at least once. The TFE was then evaporated fromthe test tubes by vortex mixing while a stream of argon flowedover the surface of the solution. A thin film of the lipid-peptidemixture remained on the walls of the test tubes. Further dryingwas achieved by storing the test tubes under vacuum for at least12 h. The dry film in the test tube was dissolved in chloroform(Sigma-Aldrich), and a few drops of this solution were spread atthe surface of a water-filled Langmuir-Blodgett trough (KSV,Finland) equipped with a movable barrier and a Wilhelmy plate toform a monolayer. The trough was controlled by a computer usingKSV LB5000 v.1.70 software. The temperature of the subphasewas 18 ( 1 °C. The solvent was allowed to evaporate, and thecompression isotherm was recorded. The monolayers of either pureDMPC or DMPC/gramicidin (9:1 molar ratio) were transferred from
the air-water interface in a Langmuir trough (KSV LB 5000,Finland) onto a gold electrode surface at a surface pressure of 40mN/m, using the Langmuir-Blodgett technique.18 The compositionof the mixed monolayer is similar to the composition used inmolecular dynamics simulations,7 NMR experiments,9 and in recentX-ray diffraction19 and IR reflection spectroscopy20 studies of thissystem. After deposition, each sample was dried for approximately1 h at ambient conditions and then placed under the electrolytesolution within the electrochemical cell of the scanning tunnelingmicroscope. When the Langmuir-Blodgett method is used, the filmtransferred onto the gold surface retains its orientation at theair-solution interface. At the electrode surface the acyl chains ofthe film are exposed to water. Energetically this is an unfavorableconfiguration. However, we did not observe flip-flop of themolecules. Apparently the structure of the film is stabilized byinteractions between the polar heads of the lipids and the metal ordue to the solid-like nature of the film such reorganization iskinetically hindered. Milli-Q ultrapure water (resistivity g18.2 MΩcm) was used to prepare all solutions. The glassware was cleanedin a hot mixture of HNO3 and H2SO4 (1:3 v/v) for approximately1 h and then rinsed with large amounts of Milli-Q ultrapure water.
Results and Discussion
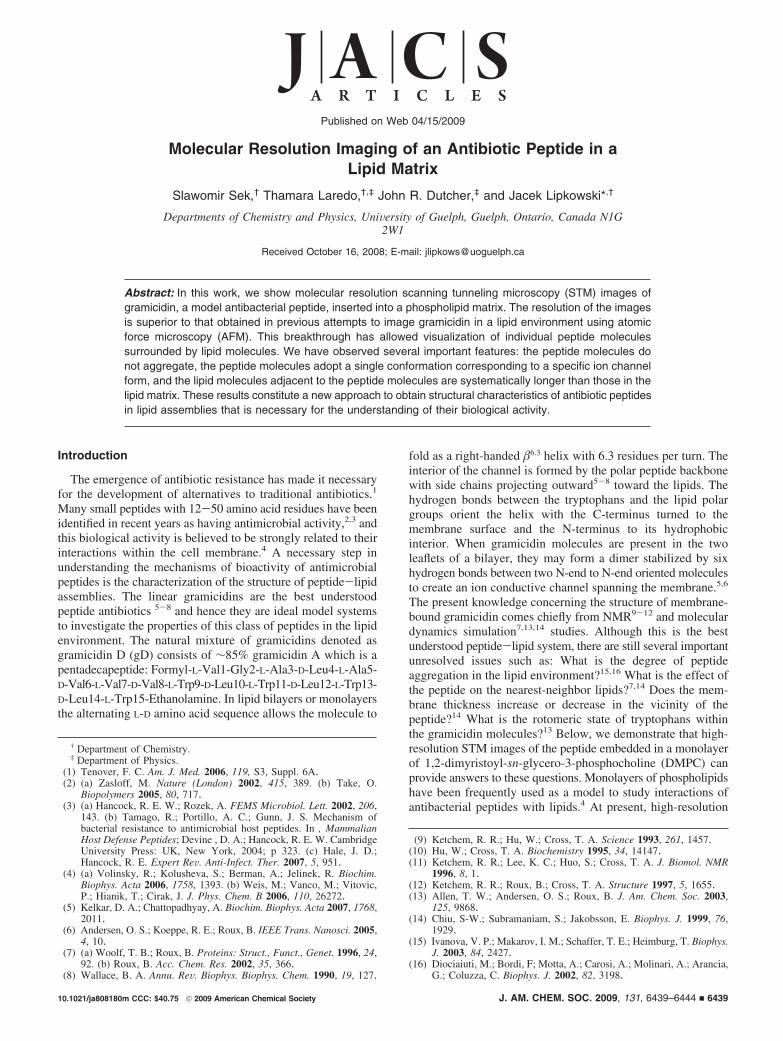
Figure 1a shows an atomic-resolution STM image of a bare,atomically flat, film-free, unreconstructed Au(111) electrodesurface, and Figure 1b shows molecular-resolution STM imagesof a pure monolayer of DMPC. The monolayer was depositedonto the Au(111) surface using the Langmuir-Blodgett tech-nique, and hence the polar groups of the DMPC molecules wereoriented toward the gold, with the acyl chains exposed to theelectrolyte. The model of the assembled system is sketched inthe TOC graphic. The images show the monolayer as seen fromthe solution side looking at the top of the acyl chains. At atemperature of 18 °C, the monolayer of DMPC spread at theair-water interface was in the tilted condensed state22 in whichthe molecules are packed into a hexagonal two-dimensional (2D)lattice.23 Figure 1b shows that the hexagonal packing of DMPCmolecules is preserved after the transfer onto the gold electrodesurface. The monolayer has remarkable long-range order, withthe average distance between adjacent bright spots in the imageequal to 0.5 ( 0.1 nm. This agrees closely with the distancebetween neighboring acyl chains of lipids packed into the 2Dhexagonal lattice with a lattice constant of 0.45 nm, asdetermined using X-ray diffraction.24 The agreement betweenthese numbers indicates that the hexagonal lattice seen in Figure1b is formed by the individual acyl chains of the DMPCmolecules. Several randomly distributed dark spots with dimen-sions comparable to individual acyl chains may be identifiedas defects.
Figure 1c shows an image of a monolayer of DMPC with a10% molar content of gramicidin molecules. The STM contrastreveals a hexagonal lattice of DMPC molecules with randomlydistributed, triangular-shaped dark features corresponding tocavities in the film. The average area of a single cavity is 2.0( 0.3 nm2, which is in good agreement with the area of theperpendicularly oriented 6.3-form of a gramicidin molecule,
(17) (a) Horber, J. K. H.; Lang, C. A.; Hansch, T. W.; Heckl, W. M.;Mohwald, H. Chem. Phys. Lett. 1988, 145, 151. (b) Smith, D. P. E.;Bryant, A.; Quate, C. F.; Rabe, J. P.; Gerber, Ch.; Swalen, J. D. Proc.Natl. Acad. Sci. U.S.A. 1987, 84, 969. (c) Gregory, B. W.; Dluhy,R. A.; Bottomley, L. A. J. Phys. Chem. 1994, 98, 1010.
(18) Ulman, A. An Introduction to Ultrathin Organic Films from Langmuir-Blodgett to Self-Assembly; Academic Press Inc.: New York, 1991.
(19) Harroun, T. A.; Heller, W. T.; Weiss, T. M.; Yang, L.; Huang, H. W.Biophys. J. 1999, 76, 937.
(20) Kota, Z.; Pali, T.; Marsh, D. Biophys. J. 2004, 86, 1521.(21) Sarges, R.; Witkop, B. J. Am. Chem. Soc. 1965, 87, 2027.(22) Li, M.; Retter, U.; Lipkowski, J. Langmuir. 2005, 21, 4356.(23) Kaganer, V. M.; Mohwald, H.; Dutta, P. ReV. Mod. Phys. 1999, 71,
779.(24) Fischer, A.; Sackmann, E. J. Phys. (Paris) 1984, 45, 517.
6440 J. AM. CHEM. SOC. 9 VOL. 131, NO. 18, 2009
A R T I C L E S Sek et al.
determined by Urry25 to be 2.15 nm2, and the value 2.5 nm2
calculated with a probe having a radius of 0.13 nm by Woolfand Roux.7a The length of the 6.3-monomer is equal to 1.3 nm5-8 which is less than the ∼1.7 nm length of the acyl chains ofa DMPC molecule.7a Therefore, gramicidin molecules in thesingle -helix form are expected to be buried within the DMPCmonolayer and to be visible in the STM image as cavities. Incontrast, the double-stranded helix conformation of gramicidinforms a 2.6-3.1 nm long pore8 that is much longer than thelength of the acyl chains, and this form would be seen in theSTM images as a protrusion.
Figure 2 illustrates the time evolution of the STM images.The images were acquired from the same 200 × 200 nm2 areaof the sample, but to avoid tip-induced changes in the film, theywere taken from different spots. They show that, as timeproceeds, the monolayer becomes smoother and more orderedand the contrast in the image becomes sharper. The improvedstability of the piezo scanner and improved thermal equilibriumat later times contribute to the improved quality of the STMimages.
Taking 2.3 nm2 as the area for each gD molecule and 0.5nm2 as the area for each DMPC molecule, one can estimate thenumber of DMPC molecules per one molecule of gD in theimaged area to be: 1:24, 1:14. and 1:17 in the three images,
respectively. The fluctuations in the monolayer composition seenin these images illustrate that gD molecules are not uniformlydistributed in the DMPC matrix. Furthermore, the amount ofgD in the monolayer is smaller than in the mixture injectedonto the air-solution interface of the Langmuir trough, indicat-ing that gD did not mix ideally with DMPC in the film.
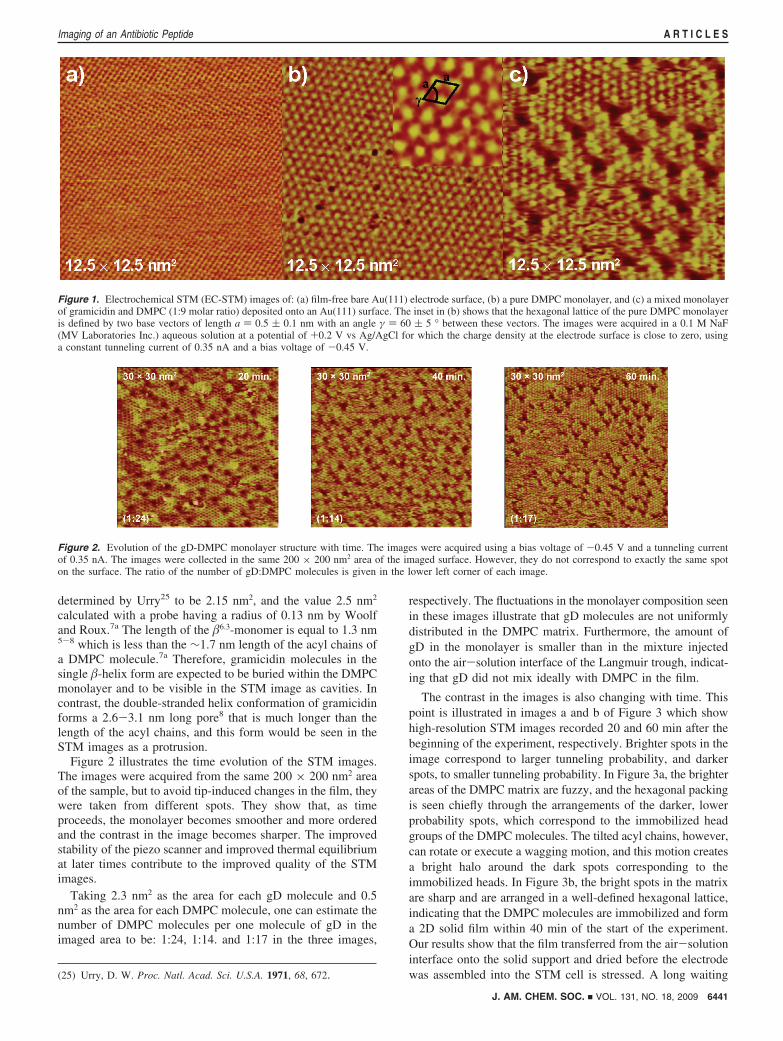
The contrast in the images is also changing with time. Thispoint is illustrated in images a and b of Figure 3 which showhigh-resolution STM images recorded 20 and 60 min after thebeginning of the experiment, respectively. Brighter spots in theimage correspond to larger tunneling probability, and darkerspots, to smaller tunneling probability. In Figure 3a, the brighterareas of the DMPC matrix are fuzzy, and the hexagonal packingis seen chiefly through the arrangements of the darker, lowerprobability spots, which correspond to the immobilized headgroups of the DMPC molecules. The tilted acyl chains, however,can rotate or execute a wagging motion, and this motion createsa bright halo around the dark spots corresponding to theimmobilized heads. In Figure 3b, the bright spots in the matrixare sharp and are arranged in a well-defined hexagonal lattice,indicating that the DMPC molecules are immobilized and forma 2D solid film within 40 min of the start of the experiment.Our results show that the film transferred from the air-solutioninterface onto the solid support and dried before the electrodewas assembled into the STM cell is stressed. A long waiting(25) Urry, D. W. Proc. Natl. Acad. Sci. U.S.A. 1971, 68, 672.
Figure 1. Electrochemical STM (EC-STM) images of: (a) film-free bare Au(111) electrode surface, (b) a pure DMPC monolayer, and (c) a mixed monolayerof gramicidin and DMPC (1:9 molar ratio) deposited onto an Au(111) surface. The inset in (b) shows that the hexagonal lattice of the pure DMPC monolayeris defined by two base vectors of length a ) 0.5 ( 0.1 nm with an angle γ ) 60 ( 5 ° between these vectors. The images were acquired in a 0.1 M NaF(MV Laboratories Inc.) aqueous solution at a potential of +0.2 V vs Ag/AgCl for which the charge density at the electrode surface is close to zero, usinga constant tunneling current of 0.35 nA and a bias voltage of -0.45 V.
Figure 2. Evolution of the gD-DMPC monolayer structure with time. The images were acquired using a bias voltage of -0.45 V and a tunneling currentof 0.35 nA. The images were collected in the same 200 × 200 nm2 area of the imaged surface. However, they do not correspond to exactly the same spoton the surface. The ratio of the number of gD:DMPC molecules is given in the lower left corner of each image.
J. AM. CHEM. SOC. 9 VOL. 131, NO. 18, 2009 6441
Imaging of an Antibiotic Peptide A R T I C L E S
time (tens of minutes) is required to anneal out the stress toform well-ordered monolayers.
The tryptophans of the gramicidin molecules are hydrogenbonded to the polar heads of the DMPC molecules,5-7 and thisinteraction orients the peptides with the C-terminus pointing tothe gold surface and the N-terminus directed toward the solution.Therefore, the STM images show the top view of the channelas seen from the N-terminus end. The contrast produced by thegramicidin molecules changes gradually across the cavities,becoming darker and approximately circular in the center ofthe triangular features. We interpret these darkest regions inthe center as the lumens of ion channels within the helices. Thediameter of this area is 0.4 ( 0.1 nm, which is in agreementwith the inner diameter of the 6.3-helical channel.
To facilitate interpretation of Figure 3, top views of twochannel structures available in the Protein Data Bank (PDB)are shown below the STM images. They differ chiefly by therotameric states of the indol ring of Trp9. In the PDB:1MAGstructure determined for the channel embedded in DMPCbilayers by solid state NMR,9-13 the indols of Trp9 and Trp15
are stacked. In contrast, in the PDB:1JNO structure of thechannel in SDS micelles, determined using solution NMR,26
the two indol rings are splayed away. Solid state NMR is unableto uniquely determine the orientation of Trp9,
10,13,26 and hence,it has not been certain which of the two structures is predominantin the lipid matrix. The molecular dynamics calculations byAllen et al.13 suggest that Trp9 can rotate, spending 80% and20% of its time in the 1JNO conformation and the 1MAGconformation, respectively, when surrounded by DMPC mol-ecules that are in the liquid crystalline state. However, ourmonolayer is in the 2D crystalline state and such rotation isexpected to be forbidden. Seen from the top, the PDB:1JNOstructure has a trapezoidal shape. In contrast, the PDB:1MAGstructure has a regular triangular shape with each side ∼1.7nm in length.
One can also draw a circle through the outermost positionsof the indol rings of tryptophans in both models. The radii ofthe circles are equal to 0.9 and 0.95 nm, for the 1MAG and1JNO structures, respectively. Figure 3 shows that the triangularcavities in the STM images are also contained in the circle withradius 0.9 nm. Therefore, the shape and dimensions of the PDB:1MAG structure are in agreement with the shape of thetriangular cavities seen in the STM image in Figure 3.Specifically, the positions of the dark spots in the corners ofthe triangular cavities correspond well to the location of theindol rings in the PDB:1MAG model and this structure may besuperposed on the cavity. In the 1MAG model shown in Figure3, the channel has a pyramidal structure with the broad basenext to the gold surface and the narrow end directed towardthe STM tip. The chains of lipids that are adjacent to the peptidewould be forced to lean against its external surface and thereforewould be tilted toward the channel. In Figure 3, the three smallerspots within the circle are assigned to the acyl chains of theneighboring lipids. They belong to the hexagonal lattice of thelipid matrix, and they change the contrast with time like therest of the lipids. The acyl chains are longer than the channel,and hence they obstruct the view of the other side chains at thebase of the gramicidin channel such as Leu10, Leu12, Leu14.Consequently, the footprint of the channel in the DMPC matrixis determined primarily by the position of the indol groups. Thetriangular geometry of the footprint indicates that Trp9 and Trp15
are stacked as in the PDB:1MAG structure. The monolayer isin the 2D solid state, under a high lateral pressure of 40 mNm-1; hence, it is not surprising that the peptide folds into thismore compact conformation.
The images also provide unique molecular level informationconcerning the relative magnitude of the peptide-peptide andpeptide-lipid interactions. Recent AFM studies reported thatgramicidin molecules in a DMPC matrix aggregate 15,16,27 intoclusters with estimated aggregation numbers ranging from ∼6to ∼40. However, the resolution of the AFM images wasinsufficient to image individual gramicidin molecules. Incontrast, the high resolution STM images shown in Figures 1cand 3 demonstrate unequivocally that the gramicidin moleculesare dispersed in the lipid monolayer and are surrounded by atleast one layer of bound lipids (boundary lipids) that preventdirect peptide-peptide contact. Clearly, the peptide-lipidinteractions are stronger than the peptide-peptide interactionsand prevent peptide aggregation caused by the formation ofpeptide complexes of the type described by Brasseur et al.28
This result is in agreement with thermodynamic studies of thegramicidin-DMPC interactions in monolayers spread at theair-solution interface.4b It is also in agreement with the resultsof NMR studies of a stack of multiple bilayers.29,30 One shouldalso note that due to the conical shape of the gramicidin channelaggregation of the peptides would result in a spontaneouscurvature that would introduce additional elastic stress into theplanar system. Conversely, such aggregation would be favoredin nonplanar systems such as the HII phase.28
The effect of the hydrophobic coupling between integralmembrane proteins and the lipid acyl chains on the membranestructure is another issue that has been actively discussed in
(26) Townsley, L. E.; Tucker, W. A.; Sham, S.; Hinton, J. F. Biochemistry2001, 40, 11676.
(27) Mou, J.; Czajkowski, D. M.; Shao, Z. Biochemistry 1996, 35, 3222.(28) Morrow, M. R.; Davis, J. H. Biochemistry 1988, 27, 2024.(29) Oradd, G.; Lindblom, G. Biophys. J. 2004, 8, 980.(30) (a) Lee, A. G. Biochim. Biophys. Acta 2003, 1612, 1. (b) Watnick,
P. I.; Chan, S. I.; Dea, P. Biochemistry 1990, 29, 6215.
Figure 3. EC-STM images of individual gramicidin channels in a mixedmonolayer of gramicidin and DMPC deposited onto a Au(111) surfaceacquired (a) 20 min and (b) 40 min after the beginning of the experiment.The images were collected at a potential of +0.2 V vs Ag/AgCl (sat. KCl),using a constant tunneling current of 0.35 nA and a bias voltage of -0.45V. Below the images are two models from the Protein Data Bank of thegramicidin molecules; the tryptophans are shown in red; Leu10, Leu12, andLeu14 are shown in dark green; Leu4 is shown in light green; and theremaining residues are shown in gray.
6442 J. AM. CHEM. SOC. 9 VOL. 131, NO. 18, 2009
A R T I C L E S Sek et al.

recent literature.4,7,14,31 The STM images shown in Figures 1cand 2 provide direct evidence that gramicidin molecules do notdisturb the hexagonal packing of the lipids in regions in whichthe lipids are close-packed, with no measurable change in thespacing and orientation of the lipid matrix.
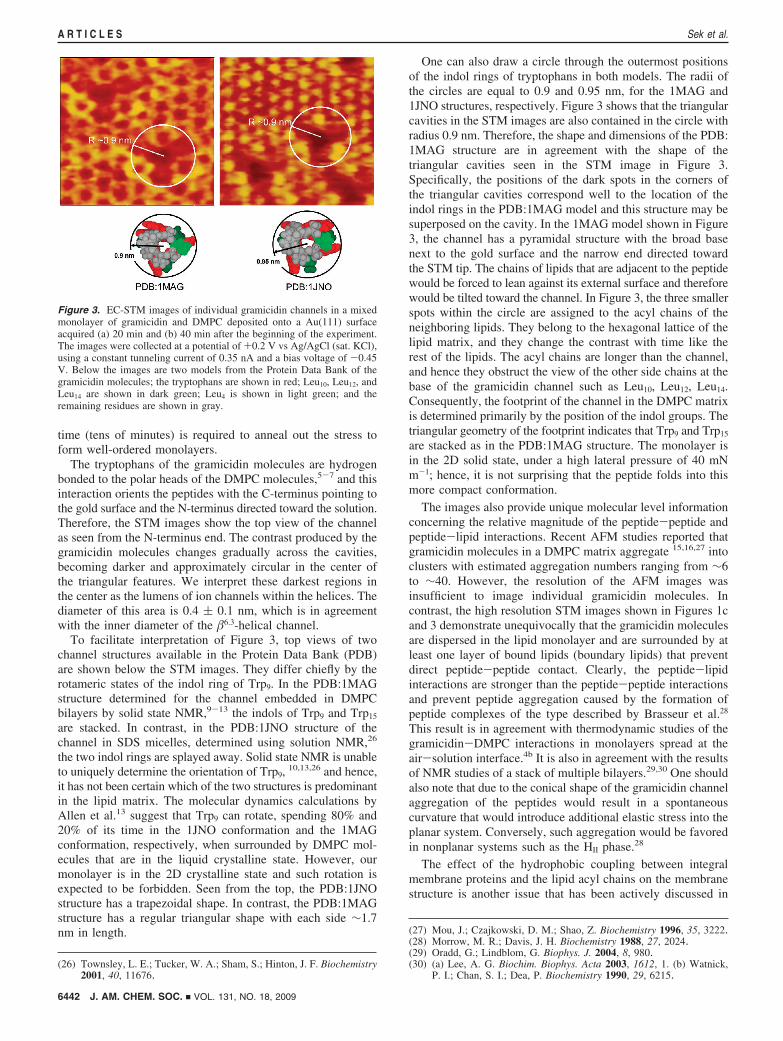
However, the images also show a difference in the contrastbetween the boundary and bulk lipids. To visualize thesedifferences more clearly, the contrast in Figure 4a has beenenhanced by a careful selection of color coding. One can nowsee clearly that spots corresponding to boundary lipids are higherthan spots corresponding to lipids at larger distances from thepeptide. This point is illustrated further by Figure 4b which plotsthe height difference-distance profiles taken from the centerof the channel in the direction marked by the dashed line inFigure 4a. We have measured ∼200 such profiles for fivedifferent images. The histogram in Figure 4c shows thedistribution of the height difference between the boundary andbulk lipids.
Unequivocally, DMPC molecules adjacent to the gramicidin(the boundary lipids) are longer by about ∼0.1 nm than thelipids in the bulk of the matrix. The image in Figure 1b showsthat the height distribution in the lipid matrix is uniform in theabsence of gramicidin. The nonuniform distribution of lipidheights is observed only in the presence of the peptide. It is thepeptide-lipid interactions that lead to these changes. This resultis in agreement with molecular dynamics simulations 7,14 whichdemonstrated that the acyl chains of DMPC molecules that arein direct contact with the peptide have a higher-order parameter,and hence, are longer than chains of the lipids in the bulk. Weemphasize that the STM experiments presented in this studyprovide information about a difference in the heights between
the lipids adjacent to the peptide and the lipids in the bulk ofthe matrix only. They provide no information about the effectof the peptide on the overall thickness of the monolayer whichdepends on the average tilt of the lipids. The images allow oneto count the number of boundary lipids. The counting of lipidsaround 50 channels gave the following distribution: 6 lipids for30% of the channels, 7 lipids for 50% of the channels, and 8lipids for 20% of the channels. On average, the number of lipidssurrounding each gramicidin molecule is 7 ( 1 which isconsistent with molecular dynamics calculations that assumed8 nearest-neighbor lipids.7
Finally, a close inspection of the STM contrast in Figure 4reveals that the brightness of the spots corresponding to thechains of boundary lipids is not uniform. Specifically, the spotsin locations indicated by the red dots in the inset to Figure 5are systematically brighter than spots in locations marked withthe blue dots. To quantify this trend, a statistical analysis ofthe height differences was performed separately for spots atlocations marked with the red dots and for spots marked withthe blue dots. The corresponding histograms are plotted in Figure5. The results demonstrate that the red chains are systematicallyhigher than the blue chains by ∼0.025 nm. The blue chains arelocated at the corners of the triangular cavity in the proximityof tryptophan residues. The red dots mark lipids that are adjacentto the other side chains of the peptide. The STM images providedirect experimental evidence that not all boundary lipids interactequally strongly with the peptide. Further, they show that thefive lipids interacting with tryptophans behave somewhatdifferently than the three lipids exposed to other residues ofthe peptide. This result is in agreement with molecular dynamicssimulations by Woolf and Roux7a and with recent ESR studies.20
Specifically, the ESR studies by Kota et al.20 indicated that aboutthree to four DMPC molecules are motionally restricted by theinteraction with the external surface of the gramicidin 6.3
(31) Costa-Filho, A. J.; Crepeau, R. H.; Borbat, P. P.; Ge, M.; Freed, J. H.Biophys. J. 2003, 84, 3364.
Figure 4. (a) EC-STM image of a mixed monolayer of gramicidin and DMPC (1:9 molar ratio) deposited onto a Au(111) surface. The image was collectedat a potential of +0.2 V vs Ag/AgCl (sat. KCl), using a constant tunneling current of 0.35 nA and a bias voltage of -0.45 V. (b) Height difference-distanceprofiles measured along the direction of the yellow dashed line in part (a). (c) Histogram of the height difference between the DMPC molecules surroundingthe peptide and the DMPC molecules in the bulk of the matrix. Data were collected from five different images.
J. AM. CHEM. SOC. 9 VOL. 131, NO. 18, 2009 6443
Imaging of an Antibiotic Peptide A R T I C L E S

channel. The difference in the mobility of the boundary lipidsresults from different interactions of DMPC molecules withtryptophans and other specific sites on the peptide surface.20
Summary and Conclusions
A mixed monolayer of gramicidin and DMPC (1:9 molarratio) was transferred from the air-solution interface of aLangmuir trough onto a monoatomically flat surface of the
Au(111) electrode using the Langmuir-Blodgett technique. Thisdeposition procedure ensures that the lipids are oriented withthe polar heads next to the metal surface. The monolayer-coatedelectrode was then assembled into an electrochemical STM cellthat was filled with an electrolyte solution. This ordering of thephospholipid and peptide molecules within the monolayer wasmonitored by recording high-resolution STM images. At 18 °C,the areas containing only phospholipids formed a 2D solid withhexagonal order. The peptides were seen in the images ascharacteristic triangular cavities. These are the first molecular-resolution images of an antibiotic peptide in a lipid matrix. Wehave analyzed the STM images to obtain unique quantitativeinformation concerning peptide aggregation and peptide-lipidinteractions. We have also provided direct evidence that thepeptide affects only the properties of the lipids next to thepeptide and does not affect the ordering of lipids in the bulk ofthe matrix. Our studies have shown that STM can be a powerfultool to obtain structural characteristics of antibiotic peptides inlipid assemblies that are necessary for the understanding of theirbiological activity.
Acknowledgment. This work was supported by grants fromthe Natural Sciences and Engineering Research Council of Canadaand the Advanced Foods and Materials Network. J.R.D. and J.L.acknowledge support from the Canada Research Chair (CRC)program.
JA808180M
Figure 5. Histogram of the height difference between the DMPC moleculessurrounding the peptide and the DMPC molecules in the bulk of the matrix.The lipids adjacent to tryptophans are shown in blue, and the lipids adjacentto other side chains of the peptide are shown in red. Inset: positions oflipids are indicated in blue and red, corresponding to the histograms of theheight differences plotted in the main section of the figure.
6444 J. AM. CHEM. SOC. 9 VOL. 131, NO. 18, 2009
A R T I C L E S Sek et al.