Molecular Analysis Of Changes In ABO Blood Group Antigen ...
284
MoTECULAR AN¡,.rYSrs oF CTT,INGES INABO BIOOD GNOUP ANUGEN EXPNESSION IN H¡..NMATOLOGICAL M¡.UGNANCY DnNrsn S. O'KEEFE B.Sc. (HoNS) A thesis submitted in total fulfillment of the requirements for the degree of Doctor of PhilosoPhY Department of Medicine University of Adelaide, Adelaide, South Australia October 1 99s
-
Upload
khangminh22 -
Category
Documents
-
view
0 -
download
0
Transcript of Molecular Analysis Of Changes In ABO Blood Group Antigen ...

MoTECULAR AN¡,.rYSrs oFCTT,INGES INABO BIOOD GNOUP
ANUGEN EXPNESSION INH¡..NMATOLOGICAL
M¡.UGNANCY
DnNrsn S. O'KEEFE B.Sc. (HoNS)
A thesis submitted in total fulfillment of the requirements forthe degree of Doctor of PhilosoPhY
Department of Medicine
University of Adelaide,Adelaide, South Australia
October 1 99s

Nothing in this world can take the place of persistence
Talent will not; nothing is more common than unsuccessful men
with tulenl
Genius will not; unrewarded genius ìs almost a proverb.
Education witt not; the world is full of educated derelicts.
Persistence and determínation alone are omnipotent-
Calvin Coolidge

'To (Dean
lFor everytñing

T^rgln on CoNTENTS
Summary..
Declaration................
Acknowledgments
Publications................
Conference Presentations .....................
List of abbreviations used in this thesis
CHeprnn Oxn: Rrvtnw oF THE Llrnurunn
1.0 Introduction..........
1.1 Genetics and biochemistry of the ABO blood group system
1.2 Precursor structures .............
1.3 The H antigen..
1.4 The Lewis system.......
1.5 The I system....
1.6 The molecular basis of the ABO blood group
1.7 The A2 allele...
1.8 The A3 and B3 alleles
1.9 The Ax and cis-AB alleles
1.10 Another kind of O allele
1.11 Intron and exon structure of the ABO gene
1.12 Interactions between the different blood group systems
1.13 Loss of blood group antigens in haemopoietic malignancy""""''
1.14 Masking of antigens by sialyl-transferases
1.15 The association between chemotherapy and loss of ABH
antigens
1.16 Loss ofthe H antigen precursor
xll
xiii
xiv
XV
xvi
xviii
2
J
.5
.7
.9
.11
.13
.14
.15
.17
.18
.18
..t9
..19
..21
23
24
I

t.r7
1.18
1.19
1.20
t.2t
1.22
t.23
1.24
Cmprrn Two: Gnxnnlr. MATERIALS aND Mnrnoos
2.0 Reagents and solutions
2.1 Solutions used for the analysis of red cells..."'..'.
Antibodies
30% solution of polyvinyl pynolidone (PVP) .. . ..'
Phosphate-buffered saline (PBS )
Loss of the I antigen...
Intolerance to "self' antigens
Intrinsic factors that may modiff ABH antigens..........'
A genetic basis for loss of ABH antigens
Loss of A or B antigens - an indicator of pre-leukaemic status?..
Family studies of patients with loss of A or B antigens
Loss of the ABH antigens in carcinoma..........
Relationship between loss of ABH antigens and tumour
.........25
.........27
',.,.'...27
...,....,28
.........30
.........3 1
..,,,.'.'34
35
36
aggresslveness
1.25 Biochemical studies of blood group antigens in tumours
1.26 Studies using monoclonal antibodies that detect the A and B
glycosyltransferases
1.27 Genetic analysis of ¡rothelial cell lines with loss of blood group
A antigen expression
1.28 Expression of incompatible A antigen in carcinoma...'..........'....'
1.29 The haemopoietic malignancies ..........'..
1.30 Disruption of the ABL proto-oncogene at9q34.l in CML.....
l.3l Disruption of other genes at9q34 in leukaemia
1.32 Tumour suppressor genes and loss of ABO antigens
1.33 Aim of this project......
37
.........40
..........40
..........42
..........44
..........45
..,...'.,.46
..........49
.51
.51
.51
.51
.51
ii

2.2
2.3
Solutions used for cell isolation and culture......
Trypsin-versene.........
Growth Media.......
Solutions for molecular biology
EDTA (ethylenediamine tetra-acetic acid), 0.5M ...
TEN1 buffer........
Phenol
TE buffer..
TESI buffer
Solution D..............
DEPC (diethylpyrocarbonate) treated HzO . .. .'
Loading buffer (6x). .. . .
5x Tris-Borate (TBE) bufier.......
20x SSPE
lOmgiml Salmon Sperm DNA.........
Sephadex column......
Prehybridization mix.....
l00x Denhardt's solution
Stripping solution.....
40mM dNTP solution
Ligase 10x buffer
IPTG stock solution (0.lM)
X-Gal (5Omg/ml)
Luria Broth (LB) Medium.,
Preparation of LB plates with ampicillin/tPTcD(-Gal..
..',.,...'..52
,. ,.',.....52
..,.,.',....52
............52
............52
5)
.............52
.............53
.............53
.............53
.............53
.............53
.............53
.............53
.............53
.............54
..............54
''....'.',,...54
....,...'.','.54
..,......,..'.54
..............55
..............55
..............55
..............55
.............55
lll

2.4 Techniques used for serological analysis of red ce|Is..........
2.4.1 Preparation of red cells for long-term storage
2.4.2 Thavang frozen red cells
2.4.3 Blood grouping
2.5 Cell isolation, culture and regular maintenance..'............
2.5.1 Isolation of the mononuclear cell fraction from patient
samples
2.5.2 Cell lines.........
2.5.3 Freezing and thawing of cells
2.6 Molecular biology techniques
2.6.1 Preparation of genomic DNA
Phenol-Chloroform extraction .
Salting out procedure for extracting DN4.........
2.6.2 Preparation of total RNA.........
2.6.2.1 Modiflrcation of the RNA isolation method for isolating RNA
and DNA from limited patient samples....
2.6.3 Quantitation of DNA and RNA
2.6.4 Polymerase Chain Reaction (PCR)....'.'
Primer Design
Synthesis and isolation of oligonucleotides.'.
Standard amplification conditions.'... ".......
2.6. 5 Reverse-transcriptase polymerase chain reaction (RT-PCR) .,.....
Removal of contaminating DNA from RNA prior to reverse-
transcriPtion..........'....
2.6.6 Gel electrophoresis .........
Agarose gel electroPhoresis
Polyacrylamide gel electrophoresis .......' ..
56
56
.56
.57
59
59
59
60
61
6t
6t
6t
62
63
63
64
64
65
65
66
66
67
67
67
lv

2.6.7 Southern blot analysis...............
Preparation of samples
Electrophoresis .........
Alkali blotting procedure.
Radio-labelling of probes .............
Procedure for membrane hybridisation ...
Washing the membrane ...........
Autoradiography
Re-use of blots...
2.6.8 Purification of PCR products for use in cloning and sequencing
experiments
2.6.9 Cloning of PCR products...
Ligation of purified PCR product into the pGEM -T Vector..
Preparation of competent bacterial cells
Transformation of XL l-Blue cells..........
Analysis of Transformants
Screening bacterial colonies for recombinant plasmids using
PCR
Small scale isolation of recombinant plasmid...
Larger scale isolation of recombinant plasmids
2.6.10 Sequencing
Automatic sequencing
Denaturation of plasmid template for manual sequencing.
Manual sequencing
Sequencing gels
.67
.67
.68
.68
.69
.69
.69
.70
.70
.70
.71
.71
.71
.72
.72
..........72
..........73
..........74
..........74
..........75
..........75
.....,...,75
',....,,..76
v

Cnnr'rnR TuRnn: Rno Cnr,l SnRoLocv
3.0 Introduction..........
3.1 Considerations and difficulties encountered when collecting samples
from patients with changes in ABO blood group status
3.1.1 Evidence that mixed-freld reactions are not perceived
3.2 Patients used in this study.........
3.2.1 Patients with haematological malignancy and loss of A or B
antigens
3.2.2 Ante-natal patients with loss of A antigen expression..'.'.......'..'
3.2.3 Red cell analysis ..............
3.2.4 Cylogenetics....
3.2.5 Quality of samples .............
Case-histories of patients used in this study (Table 3-1).........'.
Summary..
Cnlrrnn Foun: Gnxorwrxc rHE ABO Locus
4.0 Introduction.........
4.1 Development of a sensitive method for molecular ABO genotyping
4. 1. I Rationale..........
4.1.2 Materials and Methods
4.1.3 Results and Discussion
4.2 ABO genotyping of patients with malignancy
78
79
80
83
83
85
86
87
88
89
96
4.2.1
4.2.2
Materials and Methods .............
Results and Discussion ..........
4.2.2.1 Patients with malignancy..........
4.2.2.2 Patients with haematological malignancy and loss of
ABO antigens............
,...99
....100
....100
....102
....1,02
....108
....109
....109
....109
vl
rt2

4.2.2.3 Ante-natal patients with abnormal A antigen
expression detected during routine screening..
4.3 Development of a method to genotype the A2 allele...
4.4
4.3. I Rationale...........
4.3.2 Materials and methods....
4.3.3 Results and Discussion
A2 Genotyping of patients with loss of A antigen expression
4.4.1 Results and Discussion
4.4.1.1 Patients of A2 blood goup
4.4.1.2 A2 genotyping of patients with loss of A antigen
expression and haematological malignancy. '
4.5 Confirmation of allele dosage using Southern blotting..
4.5.1 Rationale.....
4.5.2 Materials and Methods
4.5.3 Results and Discussion
Summary
Cn¡,rrsnFrvn: E¡rpnnssrox oFTHE ABO Gnxn
5.0 Introduction...............
5.1 Development of a sensitive method for ABO phenotyping................'
5. 1. I R¿tionale..........
5.2 Positive controls for the reverse-transcription reaction.......
5.2.1 Assessment of p-actin as a positive control for the reverse-
transcription reaction.
5.2.2 Materials and methods....
5.2.3 Results and Discussion
.l l8
.118
.l 19
. 119
.120
.122
.t22
.122
...125
...126
...127
...r27
...128
...130
..133
..134
..134
..134
...134
...135
...135
vu

5.2.4 Assessment of B-globin as a positive control for the reverse-
transcription reaction
5.2.5 Materials and Methods
5.2.6 Results and Discussron
5.3 Expression of the AIIO gene.
5.3.1 Materials and methods....
5.3.2 Results and Discussion
5.4 Sequencing of the new "O" AIIO allele
5.4.1 Materials and Methods
5.4.2 Results and Discussion
5.5 Development of a PCR method to detect the 02 allele........
5.5. I Rationale..........
5.5.2 Materials and methods....
5.5.3 Results and Discussion
5.6 Development of a modified method to assess the relative expression of
the AiB and O alleles.
5.6.1 Materials and methods....
5.6.2 Results and Discussion
5.7 Detection of a minor splice variant of the ABO gene
5.8 Analysis of ABO gene expression in patients with colon c4ncer..............,
5.8.1 Expression of the ABO gene in colon tumours
5.9 Analysis of ABO gene expression in patients with haematological
malignancy and loss of antigen expression
Patient 4N............
Patient GN............
Patient MR...........
Patients NR and WM..........
Patient M4...........
...13ó
...137
....137
....138
....139
....139
....142
....142
....r42
....147
....t47
....148
....149
.........150
.........1s1
.........151
.........155
159
159
..161
..163
..164
..t64
..165
..165
vlll

5.10
Patient CG............
Patient PM...........
Patient 84............
Patients WD and SR............
Patients KN and DH............
Imprinting and loss of ABO antigens.. ......
5. 10. I Results and Discussion..............
.165
.166
.166
.167
.167
.170
.r7t
.t74
177
178
178
180
180
Summary
Cmsrnn Sx: Axlr,ysls or rnn AonrwLATE KINASE I Gnxn
6.0 Introduction.........
6. I Rationale............
6.2 Theoretical localization of the BanI restriction enrqe polymorphism
in the AKl gene
6.2.1 Materials and Methods
6.2.2 Results and Discussion ......
6.3 Theoreticallocalization of the Taqlrestiction enzyme polymorphism in
the AKI gene.........
ó.3.1 Materials and Methods
6.3.2 Results and Discussion
6.4 Actual Localization of the Taqlpolymorphism.....
6.4.1 Materials and Methods
6.4.2 Results and Discussion
6.5 Expression analysis of the polymorphic TaqI site.
6.5.1 Results and Discussion
ó.6 Sequencing of the new AKI allele
6.6,1 Materials and Methods
6.6.2 Results and Discussion
.....182
.... . 1 83
.....183
.....185
.....185
,.... . 1 86
,.....187
......187
,.....188
......188
......189
lx
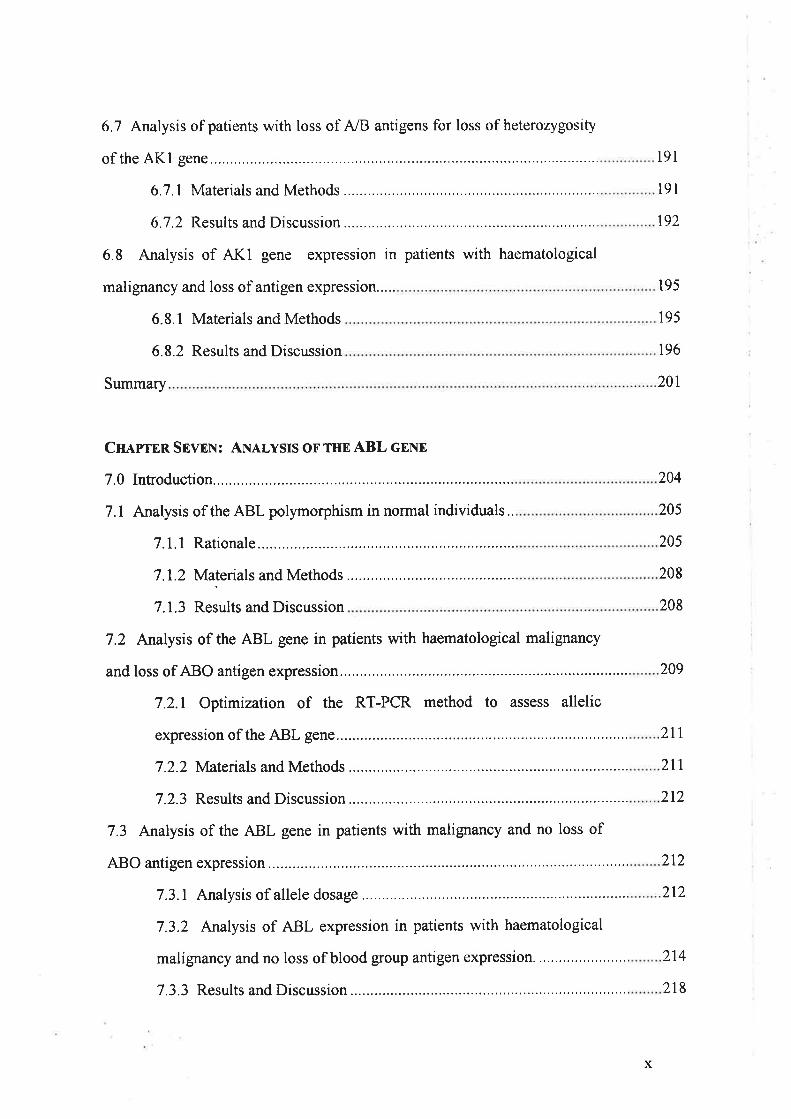
6.7 Analysis of patients with loss of A/B antigens for loss of heterozygosity
of the AKI gene
ó.7.I Materials and Methods
6.7.2 Results and Discussion
6.8 Analysis of AKl gene expression in patients with haematological
malignancy and loss of antigen expression.....
6.8.1 Materials and Methods
6.8.2 Results and Discussion
Summary
Cnerrnn SnvnN: Ax¡,r-vsrs oF THE ABL cnun
7.0 Introduction..........
7.1 Analysis of the ABL polymorphism in normal individuals..
7.1. I Rationale..........
7.1.2 Materials and Methods
Z. f .3 nesults and Discussion
7.2 Analysis of the ABL gene in patients with haematological malignancy
and loss of ABO antigen expression
7.2.1 Optimization of the RT-PCR method to assess allelic
expression of the ABL gene.
7.2.2 Materials and Methods
7.2.3 Results and Discussion
7.3 Analysis of the AIIL gene in patients with malignancy and no loss of
ABO antigen expression ...............
7.3.1 Analysis of allele dosage
7.3.2 Analysis of ABL expression in patients with haematological
malignancy and no loss of blood group antigen expression
7.3.3 Results and Discussion
t9l
l9l
192
195
195
t96
20t
204
205
205
208
208
209
2rl
211
2t2
2t2
212
214
218
x

Surnmary
Cnlvrnn Etcnt: CoxcluuNc DlscussloN
Future Directions
BIBLIOGRAPIIY...........
Appnxnx ,4'...............
Table 1. Comparison of AIIO genotype with ABO blood group of
patients with a wide range of haematological malignancies....'...........
Table 2. Comparison of ABO genotype of tumours and blood group
of patients
Appnxnx 8...............
Table l: Patients analysed at the ABL locus.
..220
222
224
226
255
256
259
260
26t
xl

Summary
Loss of expression of the A and B antigens of the ABO blood group system from
the red cells of patients with haematological malignancy was first observed in the
1950s. Loss of antigen expression per se is probably not of direct importance in
disease progression, but reflects a genetic alteration that has occurred in the
malignant stem cell, as both the leukaemic cells and erythrocytes can be derived
from the same precursor.
The recent cloning of the coding region of the ABO gene has made it possible to
investigate loss of AIIO antigens at the molecular level. This thesis describes the
development of techniques to genotype and simultaneously assess allele dosage at
the ABO locus using PCR and allele-speciflrc restriction enzyme digestion. Fifteen
patients with a variety of haematological malignancies and loss of A and/or B
antigen expression were analysed. Loss of antigen expression in two cases was not
due to changes occurring at the ABO locus. Four of the remaining thirteen patients
had abnormal allele dosage of the ABO gene; one with physical loss of the A allele,
one patient with two copies of the O allele and one A allele, and two patients that
had lost the O allele. As the O allele of the ABO gene is non-functional, and loss of
a non-functional allele can not provide a growth or other advantage to the cell, it
was concluded that the changes seen at the ABO locus are an indication of other
genetic events occurring in the same chromosomal region.
Analysis of the relative expression of the ABO alleles using RT-PCR and restriction
enzyme digestion revealed that the A allele was transcriptionally silenced in four
patients. However, these four patients, all of whom genotyped as AO, expressed
the O allele. As monoallelic expression of autosomal genes usually indicates
imprinting, studies of the patients and their parents were carried out to determine if
there was any parental bias in the contribution of the affected allele. Including data
from the literature, 11 of 12 patients with loss of A or B antigen expression had lost
xll

expression of the maternally inherited allele of the ABO gene. Therefore, it seems
highly likely that imprinting is involved in the etiology of this phenomenon.
Other reports show that some patients with loss of A or B antigens have markedly
reduced levels of the enzyme adenylate kinase 1. As both the ABO and AKI genes
are located in chromosome band 9q34, it was possible that the AKI gene was also
affected by the silencing or loss of heterozygosity (LOH) event occurring at the
ABO locus. A Taql restriction enzyme polymorphism in exon 7 of the AKI gene
was identified. Using this polymorphism, it was determined that the loss of
heterozygosity event occurring at the ABO gene in one patient, does not extend to
the AKI gene. However, analysis of the allelic expression of the AKI gene in a
patient with severely reduced AKI enzyme activity and allelic silencing of the ABO
gene, revealed decreased expression ofone ofthe alleles, although this patient had
normal allele dosage at the AKl locus. It was therefore concluded that this patient
has allelic silencing of both the linked ABO and AKI genes.
As recurrent LOH in a given region usually indicates the presence of a tumour
suppressor gene, the ABL gene, which is located in between the ABO and AKl
genes, was examined. The ABL gene is involved in regulation of the thc cell cycle,
and therefore it can be considered a potential tumour suppressor gene. Two
patients with allelic silencing of the ABO gene and no LOH at the ABO locus were
examined. Although both patients had normal allele dosage at the AIIL locus,
expression analysis of the ABL gene was inconclusive. Although normal controls
always produced repeatable results using three different PCR-based methods for the
analysis, the relative allelic expression of the ABL gene in the patients was highly
variable. The reasons for this are unclear, but are probably due to low mRNA copy
numbers of the AIIL gene in these patients.
This is the first report of LOH events occurring at the ABO locus and of allelic
silencing in haematological malignancy, and represents as yet undescribed genetic
and epi-genetic mechanisms for leukemogenesis.
xiii


AcTxowLEDGMENTS
I am sincerely grateful to my supervisors, Dr. Alex Dobrovic and Dr. Ed Sage for
their support throughout my PhD. In particular, I would like to thank Dr. Sage for
his encouragement, and for the financial support of this project. I am grateful to Dr.
Alex Dobrovic for allowing me the freedom to determine the direction of my
project, and also for his concern over my domestic well-being. I would also like to
thank the Haematology/Oncology fundraising committee, whose dedication to
raising funds for the department provided the means for this project, and also new
laboratories. Similarly, I would also like to thank the QEH research foundation for
providing my supplementary PhD scholarship.
I would like to express my sincere appreciation to the following people who helped
me out with friendly advice: Peter Laslo, Jenny Hardingham, Terry Gooley, Jing
Xian-Mi, Peter (Chartie) Charles, Belinda Farmer, Mark Shepherd, Wendy Hart,
Fiona Thompson, David Petersen, Malcolm Green, Ravi K¡ishnan, Prue Cowled
and Andreas Evdokiou. A special thanks to Alex Dobrovic, Jenny Hardingham,
Steve Cooper and Peter Laslo for proof-reading drafts of this thesis, and for doing
so speedily.
Thanks to Dean Bacich, for helpful suggestions conceming the analysis of the AKI
gene polymorphism, and to all the people who provided patient samples, especially
Elaine Batchelder from St. Vincent's hospital, Melbourne, who publicised this
research at appropriate conferences.
I am indebted to Professor Jenny Graves, for she is a constant source of inspiration
to me, and also to my parents, for their belief in the value of education. Thanks
must also go to my dear friend Suzy Byers, for her constant encouragement.
Finally, I would like to thank my fiancé, Dean Bacich, for his support,
encouragement, and lively scientific discussions (!), without whom this project
might never have been completed.
xtv

PunucrrloNs
Publications arising directly from the work in this thesis:
O'Keefe DS, Dobrovic A: A rapid and reliable method for genotyping the ABO
blood group (1993). Human Mutation 2:67-70
Dobrovic A, O'Keefe DS, Sage RE, Batchelder E: Imprinting and loss of ABO
antigens in leukaemia (1993). Blood 1ó84-1685.
O'Keefe DS, Dobrovic A: A Rapid method for genotyping the A2 and 02 alleles of
the ABO gene (in preparation).
O'Keefe DS, Dobrovic A: Allelic silencing of the ABO gene is responsible for loss
of blood group antigen expression in leukaemia (in preparation).
Publications arising indirectlyfrom the work in this thesis:
Evdokiou A, Webb GC, Peters GB, Dobrovic A, O'Keefe DS, Forbes U, Cowled
PA: Localizationof the human $owth arrest-specific gene (GASI) to chromosome
bands 9q21.3-q22. a region frequently deleted in myeloid malignancies (1993).
Genomics 18731-733.
xv

Coxrnnnxcrc PnnSENTATIoNS
I nternat io nul meet ings :
Cold Spring Harbour Laboratory Symposium on Quantitative biology: DNA and
Chromosomes, June 1993, Cold Spring Harbour, New York. O'Keefe DS,
Dobrovic A. Allelic silencing is responsible for loss of ABO antigens in
haemopoietic malignancy.
National meetings:
The Genome conference, February 1992, Lorne, Victoria. O'Keefe DS, Dobrovic
A: Loss of the ABO blood group and its association with malignancy.
The Genome conference, February 1993, Lorne, Victoria. O'Keefe DS, Dobrovic
A: Loss of the ABO blood group in malignancy.
Genetics Society of Australia, July 1993, Adelaide, South Australia. O'Keefe DS,
Dobrovic A: Loss of the ABO blood group in myeloid malignancy.
Haematology Society of Australia annual meeting, September 1993, Hobart,
Tasmania. O'Keefe DS, Dobrovic A: Loss of the ABO blood group in malignancy.
Australian and New ZealandJournal of Medicine23 I40.
The Boden conference on the role of DNA methylation in biological processes,
February 1994, Th¡edbo, NSW. O'Keefe DS, Dobrovic A: Allelic silencing is
responsible for the loss of ABO blood g¡oup antigens in haemopoietic malignancy.
xvl

(conference presentations continued)
The Genome conference, February 1994, Lorne, Victoria. O'Keefe DS, Dobrovtc
A: Allelic silencing is responsible for the loss of ABO blood group antigens in
haemopoietic mali gnancy.
Haematology Society of Australia annual meeting, September 1994, Perth, Western
Australia. O'Keefe DS, Dobrovic A: Allelic silencing is responsible for the loss of
ABO btood group antigens in malignancy. Australian and New Zealand Journal of
Medicine 24:237.
The Cancer conference, February 1995,Lorne, Victoria. O'Keefe DS, Dobrovic A:
Simultaneous allelic silencing of linked genes in haematological malignancy.
The Genome conference, February 1995, Lorne, Victoria. O'Keefe DS, Dobrovic
A: Simultaneous allelic silencing of linked genes in haematological malignancy
(winner of the Promega Award).
Adelaide Blood Club annual scientific meeting, April 1995, Adelaide, South
Australia. O'Keefe DS, Dobrovic A: Simultaneous allelic silencing of the linked
ABO and AKI genes in haematological malignancy.
xvll
MAKIAMLbpBMcDNACMLcpsdHZODNAdNTPddNTPHbkbLOHmbMDS
Frg
plMNCMPDmRNANATAntoD*PCRPB
QEHRAEBRNA
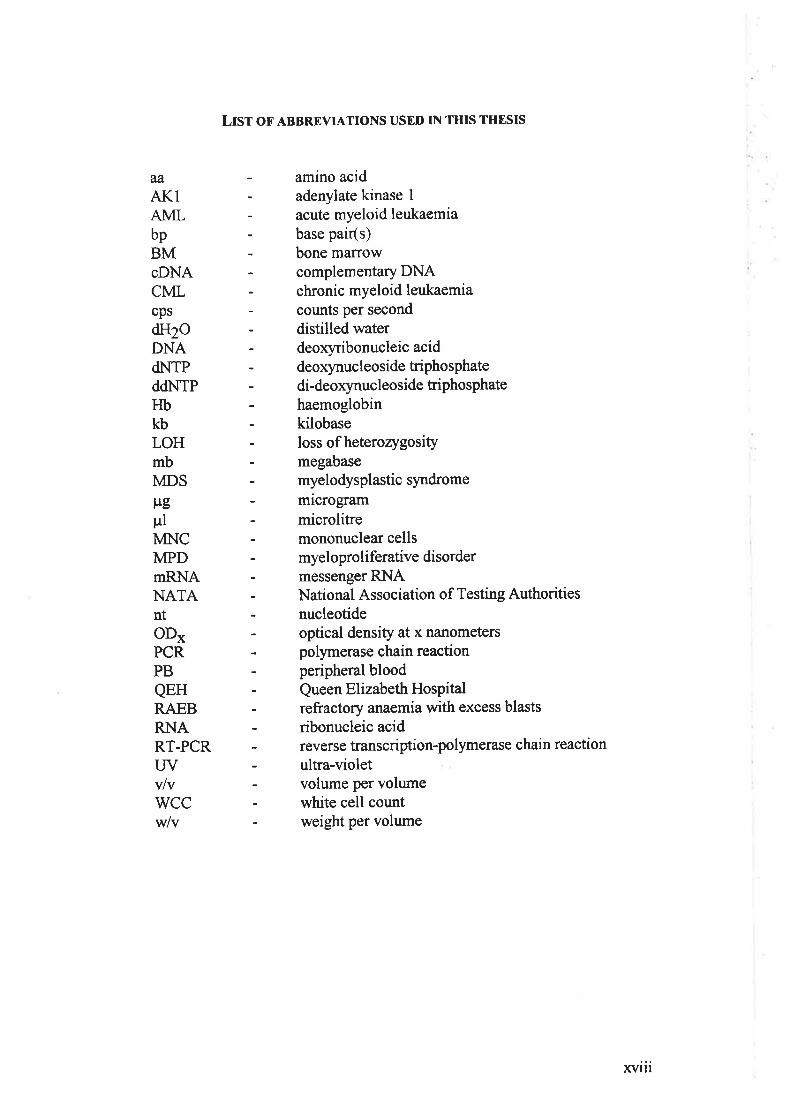
Lrsr on ABBREVIATIoNS usED IN THIS THESIS
amino acidadenylate kinase 1
acute myeloid leukaem iabase pair(s)bone marrowcomplementary DNAchronic myeloid leukaemiacounts per second
distilled waterdeoxyribonucleic aciddeoxynuc leoside tripho sphate
di-deoxynucleoside triphosphatehaemoglobinkilobaseloss of heterozygositymegabasemyelodysplastic syndrome
microgrammicrolitremononuclear cellsmyelopro liferative disordermessenger RNANational Association of Testing Authoritiesnucleotideoptical density at x nanometerspolymerase chain reactionperipheral bloodQueen Elizabeth Hospitalrefractory anaemia with excess blasts
ribonucleic acidreverse transcription-polymerase chain reaction
ultra-violetvolume per volumewhite cell countweight per volume
RT.PCRIJVvlvwccw/v
xvlll

Cn¡.prERONn
Rnvrnw Or Tnn Lrrnn¿,TURE

1.0 INrnoDUCTroN
The relationship between the development of cancer and alterations in blood group
antigens is poorly understood Although red cell antigens are of vital practical
importance in blood transfusion, their primary functional roles in the physiology of
the normal individual are still unknown. What is known however, is that oncogenic
transformation in almost all human cancers, is accompanied by numerous changes
in cell membranes and cell surface carbohydrate structures. These changes may
have a direct effect upon the metastatic potential of the cell in carcinoma, or even
upon the uncontrolled proliferation of cells, as seen in haematological
malignancies.
Loss of ABO blood goup antigens from the surface of carcinoma cells and from the
red cells of some patients with haematological malignancy has been observed since
the 1950s. It is the aim of this thesis to investigate the molecular mechanisms
underlying changes in ABO blood group antigens in carcinogenesis, particularly in
haematological malignancies of the myeloid lineage. In order to understand the
functional significance of changes in ABO blood group carbohydrate structures in
malignancy, it is first necessary to summarise the basic genetic and biochemical
principles of the ABO system.
2

1.1 Genetics and biochemistry of the ABO blood group system
The ABO blood group system was discovered by Karl Landsteiner in 1900, who
noted that serun from some individuals agglutinated red cells from other
individuals. Later studies revealed that these antigens could be detected on the
surface of most endothelial and some epithelial cells, and they were therefore
termed the AIIH "histo-blood group" antigens. The world wide frequency of the
most common blood groups in the Caucasian population is: 45Yo O group, 32yo Al
group, l0% B group, 9yo A2 group, 3% AtB group and lVo A2B (reviewed in
Harmening-Pittiglio, I 986).
The gene responsible for ABO blood goups does not code for the specific antigens
themselves. Instead, it codes for glycosyltransferases capable of catalyzing the
transfer of specific sugars to carbohydrate chains of a precursor molecule (the H
antigen; see Figure 1-1).
H-antigenA-antigen
Type II precursor
A-transferase+UDP-GalNAc
I p ',tJ
p t,4
Ac _à
Gal
GIJGal
JuR
Jo t,, H-transferase
f o t,,
Gal
IuR
Gal
fuR
B-transferase+UDP-Gal
B-antigen
J
Acp 1,3
Gal
IuR
Figure l-1 Simplified diagram of ABH biosynthesis. Bold type represents the sugar added Rcorresponds to the asparagine-linked, serine/threonine-linked or lipid-tinked glycoconjugate
backbone. The immunodominant regions of the antigens are framed. Sugar abbreviations and
complex names of the transferases are as in Table l-1; GlcNAc is N-acetyl-glucosamine (adapted
from Lowe, 1993).
J
GalNAc
",,tcrl,2
tsFucp 1,4
d(-Fucþ r,4
1,4
Galrt,t
a 1,2
FFuc

The protein coding region of the ABO gene is 1065 base pairs long and encodes a
354 amino acid glycosyltransferase with a molecular weight of 4l kilo Daltons.
The transferase consists of three domains; a short N-terminal, a hydrophobic
transmembrane domain, and a long C-terminal domain. The soluble fonn of the
transferase lacks the N-terminal and hydrophobic domains, thus the catal¡ic
domain probably resides in the C-terminus (Yamamoto et al., 1990a).
There are four common alleles of the gene, Al, 42, B and O, which are inherited in
a simple co-dominant Mendelian fashion. The Ar and B alleles differ by several
single base substitutions, resulting in amino acid changes in the glycosyltransferase,
some of which incur differential specificity for nucleotide-sugar donors (see Table
l-1), (Yamamoto et al., 1990b; Yamamoto and Hakomori, 1990). The A2 allele
differs from the Ar allele at two nucleotide positions, resulting in a transferase that
is a weaker catalyst than the Ar transferase (see discussion on ABO subgroups in
section 1.7). The O allele has a single base deletion at position 261, but is
otherwise identical to the Ar allele. This deletion leads to a frameshift mutation,
resulting in premature termination of translation due to the formation of a stop
codon at position 352 (Yamamoto et al., 1990b). This mutant protein is
enzymatically inactive; incapable of converting the precursor H antigen. Therefore
the term ABH antigens (as opposed to ABO blood group and the ABO gene), is a
more accurate description of this system, and I will refer to it accordingly
throughout the rest of this thesis.
4

Antigen Glycosyltransferase Nucleotide(Sugar Donor)
lmmunodominant Sugar
H a-2-L-fu cosvltransferase GDP-Fuc* L-fucose
A a-3 -N-acetylgalactosaminvltransferase UDP-GalNAcl N-acetyl-D-galactosamine
B a-3 -D-ealacto svltransferase UDP-Galt D-galactose
Table l-1 Donor nucleotides and immunodominant sugars responsible for H, A and B antigenspecifi cities (from Harmening-Pitti glio, I 9 8 6).
The ABO glycosyltransferases catalyze the addition of sugars to the H antigen in the
Golgi apparatus, however the transferase is also found in a soluble extracellular
form that is probably produced by proteolytic cleavage of the membrane-bound
region just beyond the hydrophobic region (Weinstein et al., 1987). The soluble
form of the transferase might also be determined by the use of an alternative start
codon (ATG found at nt 157-159), as this would encode a protein with enzymatic
capabilities but lacking the hydrophobic anchor needed to localized the en4rme to
the Golgi membrane (Shaper et al., 1988).
1.2 Precursor structures
The blood group oligosaccharides use one of four types of precursor structures
synthesised by human cells. Type I and II precursors are at the termini of linear and
branched chain oligosaccharides (which are attached to asparagine, serine, or
threonine residues, or to membrane-associated lipid molecules), and can be
distinguished by the linkage of Galactose to N-acetyl-glucosamine; B1-+3 and 1+4
respectively. Type III chains are attached via O-linked glycosylation to
serine/th¡eonine-linked oligosaccharides, and Wpe IV chains are only found
associated with lipids (reviewed in Lowe, 1993).
tGDP-Fuc
tUDP-GalNAclUDP-Gal
guanosine-diphosphate L-fu cose
uridine diphosphate-N-acetyl-D-galactoseuridine diphosphate galactose
5

Ectoderm Endoderm
mcsoderm
bone marrow
skin vascularendothelium
& respiratorymucoSae
primarysensoryneurons
ABH TYPE TIindc¡rendcnt of thc Sccretor gene
ABHTYPEI&IIdcpcndcnt on thc prrsence of thc Sccretor gcnc
Figure 1-2. Type I and [I chain ABH antigen expression in various tissues (adapted from Oriol,leeo).
Type I precr¡rsors are found in the epithelia that line the pulmonary, urinary and
gastrointestinal tracts, and salivary glands (reviewed in Oriol, 1990), and are
converted to ABH antigens in the presence of the secretor gene; subsequently
forming secreted ABH molecules. These secreted molecules are then passively
adsorbed from plasma onto lymphocytes and erythrocytes. Type II chains are
synthesised by the red cells themselves. Therefore red cells, along with the
epidermis, mostly express ABH type II determinants (see Figure l-2),(Oriol et al.,
198ó; Clausen and Hakomori, 1989).
Type III ABH antigens are carried on mucins synthesised by the gastric mucosa and
by cells that line ovarian cysts (reviewed in Sadler, 1984). There are also A-
associated type III and IV antigens on glycolipids from A erythrocytes (Clausen ef
al., 1985), these structures have multiple repeats of the A epitope. Type IV ABH
antigens have also been found on red cells (Clausen e/ al., 1986). The four basic
chain types are depicted in Figure 1-3.
6

H
ü t,2 u t,l
H
Type I
Acp l,l
Þ t,4
G Acp 1,3
Type It Type III
Ac
ul
Type IV
AcÞ 1,3
Gal
J"a l,-l
I u,,o
Glc
Iu'Cer
tAcp 1,3
Ac
p 1,3
p l,'r
n n
pp
Figure 1-3 Simplified Type I, II, m and IV linear H determinants. The immunodominant region is
framed. R correspondsto an asparagine-linked, serine/threonine-linked or lipidlinked glycoconjugate
backbone. Single lactosamine units are enclosed in brackets, and may be repeated multiple times
within a potymer. Type III determinants are linked via O-glycosylation to the serine/th¡eonine
backbone. Type IV chains are linked to lipids, indicated by Cer; ceramides.(reviewed in Clausen and
Hakomori, 1989).
1.3 The H antigen
Production of A and B antigens on red cells not only relies on synthesis of the
appropriate glycosyltransferases, but also on the presence ofthe precursor H antigen
(refer to Figure 1-1). Expression of the H antigen is in turn controlled by separate
genetic systems. The F{h, secretor (Sese) and Lewis (Lele) systems are relevant to
this discussion as they are intimately related to the expression of A and B antigens.
The Hh system comprises two alleles, H and an extremely rare null allele, h. The H
allele produces the enzyme s.-2-L-fucosyltransferase, which modifies a precursor
carbohydrate structure by the addition of L-fucose. The resulting structure is then
able to be directly converted to the A or B antigen by the appropriate
glycosyltransferase. Individuals who inherit two copies of the h allele cannot
synthesize the H antigen, and correspondingly cannot produce either A or B
antigens on their red cells regardless of whether or not they produce the A or B
7
H
1,3
a 1,2 c t,2
cal (-
H

glycosyltransferases. This is known as the Bombay Phenotype (reviewed in
Watkins, 1980).
The enzyme a-2-L-fucosyltransferase is also coded for at a second locus, by the
secretor gene (Oriol et al., 1981). The secretor system is generally considered to
control the expression of this enzyme in cells of salivary glands, while the FIh
system directs expression of the H antigen on the surface of red blood cells.
Although both H and Secretor loci are found on chromosome 19 (Larsen et al.,
1990; Ball et al., 1991), the two cr-2-L-fucosyltransferases they encode differ
significantly in their catalytic properties (Sarnesto et al., 1992).
Biochemical studies (LePendu et al., 1985; Kumaeaki and Yoshida, 1984;
Betteridge and Watkins, 1985) have revealed that of these two different a-2-L-
fucosyltransferases, the enzyme determined by the H allele preferentially converts
type II precursor chains, while the secretor determined transferase prefers type I
chains. Although both these enzymes are present in gastric mucosa and salivary
glands, only the enzyme that prefers type II chains and is determined by the H gene,
is found in red cells (Betteridge and Watkins, 1986).
The type II H determinant is present on the surface of all red cells of an individual
carrying the H allele. As H is converted to the A and B antigens, people of O blood
group have considerably more exposed H antigen on the red cell surface than do
people of A and B blood groups. Formation of the A and B antigens by the addition
of sugars to the H precursor diminishes red cell reactivity with H-antisera.
Therefore, when the reactivity of red cells of various blood goups with anti-H are
compared, the strongest reaction is with O cells, and decreasing in the order
A2>A2B>B>Ar>ArB (Mollison, 1979). The different glycosyltransferases convert
the H antigen with variable efficiency, accounting for the maximum reactivity from
8

O cells (no conversion of H), and the minimal reactivity with AtB cells, in which
nearly all available H is converted.
1.4 The Lewis system
The Lewis system is also integral to this discussion as the amount of Lewis antigens
on red cells is dependent on ABH gene expression. Lewis antigens are soluble and
found in saliva and plasma (Grubb, 1951) and are normally passively adsorbed from
the plasma onto the erythrocyte membrane. The five most common Lewis antigens
are Leâ, Leb, Lec, Led, and Lex. However, none of these antigens are produced by
alleles of the same gene. The Lewis gene (Le), codes for al+3ll+4-L-
fucosyltransferase (Johnson et al., 1992). The recessive allele of the gene (le) is a
null allele, and individuals homozygous for this allele are known as Lewis negative
as opposed to Lewis positive individuals (LeLe or Lele), who express either Lea or
Leb antigens. This enzyme converts the precursor type I chain by the addition of
fucose to N-acetyl glucosamine, and competes with a-2-L-fucosyltransferase
(secretor determined) for precursor substrate. Conversion of the precursor substrate
by the Lewis encoded enzyme results in the Lea antigen (Figure 1-4). The Lewis
fucosyltransferase and secretor determined o-2-L-fucosyltransferase work
sequentially (and only in this order), to produce a di-fucosylated type I structure, the
Leb antigen (Figure 1-4). Therefore Leb is only found in persons who are secretors
and Lewis positive. Subsequently,Lea and Leb antigens are expressed in the same
tissues that express type I chain H determinants.
9

(x I .-l(- Fuc
p l,3
Le"Gal
p 1.3r¡l..l
[J l.3
Fuc
rrl.2
0l .3
Gal
J','.tGlc
J.:'
Gal
IB'.*Glc
ü'Cer
Figure 1-4 Structures of the Lewis A and B glycosphingolipids. The rectangle encloses the
immunodominant region of each structure. Cer (Ceramide) links the molecule to the red cell
membrane (Lowe, 1993).
The Lewis C (Lec) antigen was fîrst detected using an antibody isolated from a
group O, Le(a-b+) woman (Gunson and Latham, 1972). This antibody reacts with
red cells from Lewis negative, non-secretors and with Lewis negative, Bombay
phenotypes. Although it is called a Lewis antigen, Lec is the basic type I precursor
chain before the addition of fucose (Watkins, 1980).
Lewis D is also expressed in the absence of the Lewis gene. The Led antigen is
detected in Lewis negative, H and Se positive individuals (Potapov, 1970). In fact,
the structure of the Led antigen is type I H, as shown previously in Figure 1-3.
The naming of the Lewis X antigen is somewhat ambiguous. Anti-Lex was first
described by Andresen and Jordal in 1949; it reacts with all blood goups except Le
(a-b-). It is thought that Lex may be Leâ, and that anti-Lex is able to react with red
cells that carry very few Lea antigens (Schenkel-Brunner and Hanfland, 1981). In
1984 however, Hakomori named another antigen Lex, which is also known as Stage
Specific Embryonic Antigen (SSEA-l; Hakomori, 1984). This is a Lewis
fucosylated type II chain, but is not the same antigen that was first detected by
Andresen and Jordal in 1949 (see Figure 1-5).
l0

Le.(SSEA-l)
Gal
R
Figure 1-5 Structure of the Lex antigen, which is otherwise known as the Stage Specific Embryonic
Antigen (SSEAI). R represents the underlying glycoconjugate, which is either a protein- or lipid-linked oligosaccharide, or a free oligosaccharide (Lowe, 1993).
1.5 The I system
The ABH genes interact with another blood group system in the formation of their
antigenic structures; the Ii system. Type II chain H antigens can be divided into
four classes' ; H¡, H2, H3 and H4. The Ht and H2 (unbranched) structures
demonstrate strong i, but weak I antigenic activity (Hakomori, 1981). The H, and
H4 structures are branched glycolipids with strong I antigen activity, as
demonstrated by precipitation and inhibition of agglutination reactions (Hakomori,
1981). Koscielak proposed that the I gene codes for the enzyme responsible for the
branching of the type II precursor structure, and that addition of the L-fucose by the
enzyme encodedbythe H gene results inH, and t{o(Koscielak,l977). Thus the i
antigen would represent the unbranched or linear type II precursor before
fucosylation by the H gene encoded a-2-L-fucosyltransferase (Figure 1-6).
' It is important to realise that Roman numerals are used to describe H antigens based on any of the
four precursor structures, ie. HI, HII etc. The four classes of H described as H1, Hz,H¡ and H4 are
differentiated by minor variations of the type II precursor chain they are carried on; the most
important and significant difference being that H¡ and H2 re formed from linear, unbranched
structures while H3 and Ha are based on branched type II chains.
11

IIr L-Fucal -+2calÊl-)4GlcNAcpl -) 3Galpl
-) ¿clc-) cer
H2 L-Fucal -)zcatpr-)4GlcNAcBl -)
:catBt-) +ctcNncpl-) 3GalBt-) 4Glc--) cer
II3 L-Fuo,l -)ZCatB
l-)4GlcNo"U\
I cur pr+ 4GlcNAcpl -) rcatpt-) 4Glc-) cer
L-Fuc,l -)
zcatP t
-) 4GlcNAcP I
H¡ NeuAccr,ts)3Galpl-) +GtcNnc0\
I C"r pr-> 4GlcNAcpl -)
3calpl-) 4Glc-) Cer
)Galpl-)4GlcNAcPl
2
1Fua¿l
Figure l-6 Structures of the four different H antigen glycolipids formed from the type II precursor.
H1 and H2 are linear structures while H3 and H4 are branched at the middle galactose; up to five
branches may be carried per chain. NeuAc represents a sialosyl group ( Hakomori, 1984).
The red cells of newborn infants carry high levels of i, and very little I (Jenkins er
al., 1960). However, Marsh (Marsh, 1961) showed that between birth and 18
months of age, the levels of the i antigen gradually decrease, while a reciprocal
increase in the I antigen occurs. Marsh also noted that this change corresponds with
the gradual disappearance of fetal haemoglobin, and the switch to adult
haemoglobin production, however there is no other evidence to link these two
events functionally. Although the amount of I and i on the red cells of adults
varies, (Jenkins et al., 19ó0; Marsh et al., l97I), generally there is very little i.
However, in some disease states the expression of both I and i is altered. The
importance of these changes will be discussed in due course (see section 1.17).
/
t2

1.6 The molecular basis of the ABO blood group
The cloning of the gene responsible for ABO blood groups has substantially
increased our understanding of the mechanisms behind not only the most common
groups, but has also made it possible to determine the rnolecular basis of sorne of
the less common subgroups.
The complementary DNA (oDNA) encoding the A glycosyltransferase (Yamamoto
et al., 1990a) was isolated from a cDNA library constructed using RNA from a
stomach cancer cell line (MKN45). The library was probed with PCR products
which were generated using degenerate primers based on information gained from
partial amino acid sequencing of the purified transferase enzyme by Clausen er
al.(1990). Northern analysis using the A transferase cDNA as a probe revealed
multiple transcripts (the number and sizes of the transcripts is not indicated), in one
stomach cancer, and three colon cancer cell lines. The blood group phenotypes of
the cell lines were A, O, B and AB, indicating that the O gene is expressed.
Southem analysis implied that the A transferase is most likely coded for by a single
copy gene (Yamamoto et a1.,1990a).
The B and O alleles of the ABO gene were subsequently cloned and sequenced,
using the Ar glycosyltransferase cDNA as a probe (Yamamoto et al., 1990b). The
B allele differs from the A allele by 7 single base substitutions within the protein-
coding region. Four of these differences lead to amino acid (aa) substitutions and
correlate with the A or B phenotype of a cell. The remaining 3 substitutions do not
alter the aa sequence, and do not consistently associate with a particular phenotype;
therefore they probably represent functionally silent polymorphisms. The four
amino acid substitutions are found at aa 176 (4, arginine; B, glycine), 235 (4,
glycine, B, serine), 266 ( A, leucine, B, methionine), and 268 (4, glycine; B,
alanine).
l3

Yamamoto and Hakomori (1990), constructed chimeric cDNAs containing vartous
combinations of these single nucleotide substitutions and transfected them into an
O genotype cell line. They found that while the residue at amino acid position 176
has little, if any, effect on sugar substrate utilization, the residues at266 and 268 are
vitally important. Constructs containing only the base changes for these two amino
acids conferred the appropriate specificity of the A or B transferase, regardless of
the other two polymorphism's presence or absence. The authors fail to mention
however, the effect (if any) of the amino acid substitution at position 235.
Other alleles at the ABO locus
1.7 The A2 allele
A common subgroup of A is the A2 group. Red cells expressing the A2 antigen are
characterised by their ability to react with anti-A, but unlike A1 cells, they do not
react with a plant lectin derived from Dolichos Biflorus, The incidence of the A2
phenotype varies between races, but is approximately 20% of the A group
Caucasian population (Yamamoto et al., 1992). The A2 transferase is a weaker
catalyst than the Al transferase, and has different pH optima, cation requirements
and Km values (Schachter et al., 1973). Yamamoto and his colleagues (1992) used
a PCR/sequencing approach on genomic DNA from A2blood group individuals.
Only the last two protein-coding exons of the gene were examined, however two
differences in comparison to the Ar sequence were identified. The first of these
differences is a single base substitution that results in an amino acid change at
position 156; a leucine is present in the A2 transferase, whereas the Al transferase
contains a proline. The second change is a single base deletion located at the C-
terminus (position 1059-1061 in the Ar allele), which alters the reading frame and
subsequently produces a protein with an extra 2l amino acids. Using cDNA
constructs varying only by the single base deletion (all constructs contained the
t4
single base substitution), Yamamoto and his associates demonstrated a 30-50 tbld
decrease in transtèrase activity produced from transfected HeLa cells containing
the C-terminus deletion. This group did not carry out any transfection experiments
to determine the effect (if any) of the single base substitution, although every A2
allele sequenced contaìned both the substitution and the deletion, and therefore both
alterations may be important.
1.8 The A3 and 83 alleles
Yamamoto and his group (Yamamoto et al., 1993a; Yamamoto et al., 1993b;
Yamamoto et al., 1993c; Yamamoto et al., 1993d) have extended their molecular
analysis of ABO alleles to include some of the weaker and rarer subgroups (see
Figure I-7 for a summary diagram comparing most of the ABO alleles). These
subgroups can be distuinguished by their serological reactivity. The A3 group
characteristically shows a mixed-field agglutination with anti-A reagents; that is,
not all the red cells agglutinate. Similarly, in red cells of 83 blood group,
approximately two-thirds of the cells are agglutinated. Cells from individuals of
both these types of blood groups have virtually no detectable transferase activity,
and no transferase is found in the individual's serum, even in secretors (Lopez et al.,
teTe).
Yamamoto sequenced the last two coding exons of the ABO gene for each of these
alleles. This region contains about glVo of the soluble form of the transferases,
therefore one would expect most differences between alleles to be contained within
this region. It appears that there is significant heterogeneity amongst the A3 and 83
alleles. Yamamoto (1993a) reports that in ABO alleles of 2 out of 4 individuals of
A3 blood group, there was a single base substitution resulting in an amino acid
change (Asp-+Asn), which is predicted to alter the activity of the enzyme.
Similarly, an A-EIO allele from one of the 3 E}3 individuals also had a (different)
15

t06l
.4 allelet'l trn ", lrnr tl*
A a[elei2¡ 353 aa
Asp291
Leu26656
Àrgt76 216
Lcr
CC
.da[ele
.d a[ele(l)
.d allele(2)
.da[ele
B allele
d a[ele(1)
É allele(2)
Leu
Asn
G
Ser
Scr
Ser
Orallelell7 zt
O allele
cis-ABLeu
Figure l-7 Schematic comparison of cDNA nucleotide and deduced amino acid sequences of alleles
of the ABO blood group system. Al (1) represents most Al alleles. The Al (2) allele is the originallypublished sequence found in GenBank and Yamamoto et al., 1990a, and has a trinucleotide deletion
(TAG, due to alternative splicing or a splicing error in the cell line from which it was derived;
Yamamoto, 1994), as indicated by the delta symbol. The shaded rectangle in the O and A2 alleles
portrays the different amino acid sequence due to frame shifting caused by the single base deletion.
The arrow symbol indicates the N-terminal of the soluble form of Al transferase. Only the regions
sequenced and compared are shown (modified from Yamamoto, 1994).
t6
single base substitution (Arg+Trp). However, in t-our of the cases, there was no
sequence difference between the presumed Ar and 83 alleles, and the common Al or
B alleles respectively. It is possible that there are differences in these alleles
located outside the region sequenced. Yamamoto (1993a) suggests that alternative
splicing of the normal Ar and B alleles may affect the activity of the enzymes
responsible for A3 and 83 blood group antigens, or that lesions may exist in (as yet
unknown) ABO modifuing genes.
1.9 The A'and c¡s-AB alleles
A similar approach was employed to determine the molecular basis of the rare A*
and cis-AB blood groups (Yamamoto et al., 1993c;Yamamoto et al., 1993d). The
A* blood group is characterised by lack of agglutination of red cells with anti-A,
and weak agglutination with anti-A,B (Lopez et al., 1979). Individuals of this
subgroup have very weak A-transferase activity in the sen¡rn, and anti-Ar antibodies
are usually present. Additionally, A* secretors carry minute amounts of A substance
(Salmon et al., 1984b).
The cis-AB blood group was first recognized in 1964 (Seyfried et al., 1964) rn a
family where the blood groups of the father, mother, their two children and the
mother's mother were O, A2B, A2B, A2B and O respectively, suggesting that the A
and B alleles were inherited on a single chromosome. Yamaguchi et aL(1965)
reported an A2B3 blood group, showing weak activity of both the A and B antigens.
Family studies once again suggested that the A and B genes were inherited together
on one chromosome, hence the term cls-AB. As both these blood gtoups are
extremely rare, Yamamoto's group only studied one case of A*, and two unrelated
cases of ciç-AIl (Yamamoto et al., 1993c,1993d). The A* allele was found to have
a single base change relative to the Ar allele, leading to an amino acid substitution
(Phe-+lle). The cis-A-E| alleles from both individuals studied proved to be identical;
t7

both contained the single base substitution found in the A2 allele, and a substitution
at aa position 268, one of the substitutions that differentiates the A and B alleles
(Figure l-7), and is vitally important fbr B-transferase activity (ie. galactose sugar
specificity), (Yamamoto and Hakomori, 1990).
1.10 Another kind of O allele
During these studies, the Yamamoto group encountered another type of O allele,
the 02 allele. Comparison of this allele with the Ar allele revealed that the single
base deletion typical of most O alleles, was not present. There was however, three
single base substitutions resulting in two amino acid substitutions. The first two
substitutions, at nt297 and 526, are both found in the B allele. The third
substitution is found at nt802, and results in the introduction of a charged amino
acid, arginine, as opposed to the neutral amino acids, glycine and alanine that are
found in the A and B alleles respectively. An expression construct containing these
differences exhibited no Ar enzymatic activity (Yamamoto et al., 1993b),
suggesting that the arginine substitution may block catalytic activity. The
frequency of this new allele has been determined in the Danish population, and is
approximately 3.7% (Grunnet et al., 1994).
1.11 Intron and exon structure of the ABO gene
The molecular basis for regulation of expression of the ABO gene has not yet been
determined. There is however, information on the intror/exon structure of the gene
(Lee and Chang, 1992; Grunnet et al., 1994; Yamamoto et al., 1995). The ABO
gene consists of at least 7 coding exons which span over 18kb of genomic DNA.
The six introns begin at nucleotides 28, 98, 155, 203,239 and 374. Most of the
coding region lies in exon 7, which is 688bp and encodes 229 of the 354 amino
acids of the transferase. At least 7 alternatively spliced and prematurely spliced
cDNAs were also isolated during these analyses; however all of the cDNAs
18

examined were from tumour cell lines, and the authors concluded that the splice
variants seen are probably not representatìve of the normal situation (Yamamoto e/
al., 1995).
1.12 Interactions between the different blood group systems
It is now obvious that the different blood group systems are intimately related, with
many of the enzymes described utilizing the same substrate. It therefore follows
that if the expression of one or more of the enzymes is down-regulated in any way
(ie. either by mutation at the DNA level, as in the O allele, or by other
mechanisms), there will be more substrate available for the other enzymes to
convert, or more antigen available to react with a given antibody. This explains
why the blood of O group individuals reacts more strongly with anti-H than that of
say, AB individuals. Similarly, if A or B transferase were inactive or down-
regulated in a Lewis positive individual, then there would be more precursor H
antigen (type It chain) available to the fucosyltransferase encoded by Lewis, and
thus more conversion to the Lex antigen. In fact, an increase in Lex antigen has
been noted in a variety of malignancies, and will be discussed in the ensuing
sectrons.
1.13 Loss of blood group antigens in haemopoietic malignancy
Changes in blood group antigen expression in relation to disease were first
observed in acute leukaemia (Wiener and Gordon, 1956; Van Loghem et al., L957;
Stratton et al., 1958; Salmon et al., 1958; Salmon et al., 1959; Gold er al., 1959;
Tovey, 1960, and Bhatia and Sanghvi, 1960). Although most of these reports were
based on patients with "weakened" expression of the A antigen in acute myeloid
leukaemia (AML), many other investigators have also reported loss or weak
expression of the A, B and H antigens in AML (Salmon and Salmon,1965;
19

Kurokowa et al., 1969;Lay et ql., l9ó t; Undevia et al., 1966 Richards, 1962; Bird
et al., 1976; Yoshida et al., 1985), in acute lymphatic leukaemia (ALL), the chronic
leukaernias (CML, CLL) and pre-leukaemic disorders including the
myeloproliferative disorders (MPD), and myelodysplastic syndromes (NDS)
(Dreyfus et al., 19ó9; Ogata and Hasegawa, 1977; Kuhns et al., 1978; Kolins et al.,
1978; Salmon et al., 1984). There are also some reports of Ii antigen changes
(Salmon et al., l9ó6; McGinniss et al., 1964; Schmidt et al., 1965; Salmon, 1976)
as well as changes in the expression of the Lea and Leb antigens (Kolins et al.,
1978). In most cases where there is "weakening" or complete loss of the A, B or H
antigens from the red cells, the antigens are present in the saliva of the patient
(dependent on secretor status)(Renton et al., 1962; Bernard et al., 1965; Kolins er
al., 1978; Matsuki et al., 1992), suggesting that the defect leading to loss of the
antigens is confined to the haemopoietic compartment, and the patients do in fact
have the genetic capability of producing the appropriate antigen.
It is interesting that in at least 50Yo of the A3 and 83 blood group samples they
examined, Yamamoto and his group (1993a) found no changes at the DNA level
that should cause a reduction in the expression of the appropriate antigen. Both
these groups are extremely rare and are characterised by mixed-field reactions, a
phenomenon most often seen in leukaemia patients (reviewed in Gunz and Baikie,
1974). It is possible that there is some other mechanism besides mutational
inactivation that is down-regulating the expression of the appropriate transferases
in these subjects, and that this mechanism may be of importance in the etiology or
progression of haemopoietic malignancy.
20

The loss of ABH antigens per se is probably not of importance in the disease
progression. Bombay individuals which are deficient in A, B and H antigens (on-),
show no red cell or other abnormalities (Wallace and Gibbs, 1936); and it is
obvious that there is no selection against O blood group individuals considering
they make up nearly 50Yo of the population. Therefore changes in erythroc¡e
antigens may reflect a genetic disturbance that has occurred in the malignant stem
cell, as both leukaemic cells and red cells can be derived from the same myeloid
precursor (Fialkow et al., 1931).
Alternatively, loss of the ABH antigens may indicate that a profound change has
occurred in the cell membrane, leading to altered spatial distribution of the
antigens and subsequently changes in their reactivity with anti-sera. Gottfned
(1971), and Hildebrand et al.(1971), studied lipid patterns in leukaemic cells and
suggested that the expression of lipids reflects the cells' immaturity. Furthermore,
they pointed out that even small changes in lipid content can have major affects on
the membrane properties, for example physical and electrical attributes. These
sfudies however, were not carried out on erythrocytes, which by definition are
terminally di f ferentiated and therefore m ature.
1.14 Masking of antigens by sialyt-transferases
In the studies referred to above (eg. Wiener and Gordon, 1956), there are generally
dual populations of red cells evident, these can be divided into two categories;
normal A and weak A, and normal A and "not A". A third category exists,
consisting of a single population of cells that do not agglutinate at all. The f,rrst
two of these categories are characterised by the appearance of a mixed-field
reaction when the red cells are incubated with the appropriate anti-body. The
21

proportion of normal A cells to weak A or A negative cells is assumed to represent
the ratio of normal erythrocytes to those derived from the leukaemic stem cell.
Kassulke et al.(1969), compared normal leukocytes to leukaemic cells and red
cells, and found that changes in the red cell groups were reflected in the leukaemic
cells. In addition, the leukaemic cells expressed the sialic acid-containing M
antigen, which is not normally present on leukocytes. This lead the authors to
propose that "masking" of the appropriate antigens by a sialyl-transferase had
occurred during the malignant transformation, and facilitated the expression of the
M antigen. Kassulke's group later tested this hypothesis (Kassulke et al., l97l)by
incubating leukaemic cells with neuraminidase, an enzyme which removes sialic
acid. They found that in cell populations where A or H antigen expression was
decreased, the treatment increased their expression, and decreased the expression
of the sialic acid containing M and N antigens. Treatment wrth neuraminidase
produced no changes in antigen expression on normal leukocytes. Evidence
contrary to this hypothesis was presented by Renton and his associates (Renton e/
al., 1962), who described a patient with eosinophilic leukaemia. This patient
exhibited four independent populations of red cells, A, B, O and AB. The patient's
sen¡m had no antibodies to A or B, implying that before the onset of disease, the
blood grouped as normal AB. Family studies indicated that the patient was in fact
genetically Al B. If sialic-acid was masking the antigens, one would expect to see
an AB population and an O group population, not four different populations. The
argument against the hypothesis that masking of antigens occurs by sialic acid is
likewise supported by many other studies of patients in which decreased red cell A
or B antigen is accompanied by an increase in the H antigen (eg. Salmon et al.,
1984). Further studies are required to understand the role of sialyl-transferases in
leukaemia.
22

1.15 The association between chemotherapy and loss of ABII antigens
Starling and Fernbach (1970) conducted a study of 30 children with acute
leukaernia. All the children were blood group A, and changes in A antigen
expression were reported in 1 I of these patients over the period of one year. The
investigators concluded that changes in blood group A antigen expression bore no
relation to disease status, but a correlation was found with treatment of the disease.
While this may be true for the pediatric leukaemias, in nearly every patient study
described in section 1.13, mixed-field reactions representing changes in blood
group antigen expression were observed at presentation of the patient; before
diagnosis or treatment. Furthermore, changes in antigen expression seem to reflect
the disease course, in that blood groups progress towards normal with remission
(ie. there was strong agglutination with the appropriate anti-body), whereas relapse
is associated with decreased blood group antigen expression (Richards, 1962;
McGinniss et al., 1964; Salmon et al., 1969; Kolins et al., 1978; Salmon et al.,
1984).
Considering that chemotherapy usually induces remission, it is unlikely that
treatment causes loss of the antigens. There is at least one case however, where the
patient's blood group returned to normal Al at terminal relapse of acute myeloid
leukaemia (Hoogstraten et al., 1961). This might be explained by failure of the
malignant red cell precursors to differentiate into mature erythrocytes as the
disease progressed, with the Ar red cells being derived from residual normal stem
cells that had retained the capacity for differentiation.
23

1.16 Loss of the H antigen precursor
Section 1.1 described the formation of the A and B antigens by the sequential
addition of sugars to a carbohydrate chain. The precursor to A and B is H, and it
follows that loss of the H antigen would lead to loss of A and/or B expression on
the red cell surface. Some of the cases presented report decreased levels of H
antigen on the red cells (ie. Majsþ et al., 1967). Other investigators (Kuhns et al.,
1978) have reported a general deficiency of cr-2-L-fucosyltransferase (H-
determined) in the serum of the majority of leukaemic patients (AML and ALL)
and a negligible change in the A/B transferases. Furthermore, the levels of serum
o-2-L-fucosyltransferase increased to normal values during remission (achieved by
chemotherapy), and a decrease in the enzyme was consistent with drug resistance
and subsequent relapse. As a-2-L-fucosyltransferase converts the I antigen (type
II) precursor into the H antigen, it is likely that there would also be a deficiency of
the precursor, H, in these patients.
The widespread occurrence of a decrease in a-2-L-fucosyltransferase suggests that
it is unlikely to play a primary role in loss of the ABH antigens in leukaemia, as
loss of A or B antigens is a relatively rare event. Salmon et al.(I984), considered
the Kuhns' group results concerning the negligble changes in the serum A and B
transferases to be of little significance, as these transferases are released from
many epithelial tissues, while the a-2-L-fucosyltransferase (H-transferase) is
predominantly produced by the haemopoietic lineage. Salmon's group therefore
decided to study the activity of the A, B and H transferases in the red cell
membrane. These studies were carried out on the red cells of eight patients (2
AML Ml, AML M2, AML M6,2 cML, and2 patients that were in remission).
24
The results showed that seven of the patients had normal serum H-transtèrase
levels, while one had a significantly higher level. [n all these cases, the patients'
red cells exhibited mixed-tield reactions when tested with anti-A or anti-B anti-
sera. The red cells were divided into A (or B) positive and A (or B) negative
populations, and the membrane transferase activities determined. Comparisons
between the cell populations in each case showed a signiflrcant decrease in the
activity of the A or B-transferase, while the H-transferase was equally active in
both populations. All of the patients did not have blood transfusions for at least
three months prior to these experiments, therefore it is likely that the synthesis of
the A and B determinants was blocked at the production of the A or B-transferase
in the cells derived from the malignant stem cell.
In the same study, Salmon et al.(1984) showed that in A antigen negative cell
populations, incubation with B-transferase, its metallic co-factor manganese, and
galactose, could produce normal B-antigenicity. One of these red cell populations
came from a patient with a severe lack of sen¡m H-transferase, yet the red cells
were able to be converted to the B antigen. These results confirm the irrelevance
of serum transferase levels with respect to loss of ABO antigens from the red cell
surface.
1.17 Loss of the I antigen
Loss of the I antigen might also be thought to be related to loss of ABH antigens, as
I is the precursor to the H (type II) antigen. Loss of the I (adult) antigen has been
observed in many cases of leukaemia (Salmon et al., 19ó6; McGinniss et al., 1964;
Schmidt et al., 1965; Salmon,1976), but not one of these studies describes loss of
the i (fetal) antigen; to the contrary, most of the results show an increase in the
25

amount of i in leukaemia. As i is the precursor to [ (as described in section 1.5),
loss of the I-transferase would naturally lead to a defrciency of I and an excess of i.
However, the i antigen can also be converted to H and subsequently to the A or B
antigen. This is further supported by the fact that red cells from neonates, which
almost exclusively express the i antigen, usually react strongly with anti-A or anti-
B anti-sera. Therefore loss of I should not lead to loss of ABO.
Schmidt et al.(1965), found that the red cells of 38 out of l24leukaemic patients
were I negative. They also found that several mycoplasma organisms that are
known to cause pneumonia can block or destroy the I antigen on norïnal red cells
in vitro. They suggested that mycoplasmae may be opportunistic secondary
invaders in leukaemic patients. Giblett and Crookston, (1964), also found loss of I
in the red cells of patients with thalassemia major, and paroxysmal nocturnal
hemoglobinuria. The authors concluded that the increased expression of i, and
decreased expression of I was the result of decreased marrow transition time, a
phenomena which also occurs in the leukaemic marrow (Hillman and Giblett,
1965).
Two erythroleukaemic cell lines, K562 and FIEL exhibit strong i activity (Kannagi
et al., 1983). A small population of the K562 cells express the I antigen, but the
HEL cell line shows no detectable I. It is clear from these studies, which included
assaying for Lex and H activity, that unbranched type II chain accumulation occurs
in human leukaemia, possibly due to a blocked synthesis of blood group
determinants (Hakomori, 1984). It also is of interest that the i antigen of K562 is
converted to I when cells are induced to differentiate by retinoic acid (Testa et al.,
te82).
26

1.18 Intolerance to "self' antigens
In a report by Gold et al. (1959), a patient suffering from AML was described. At
presentation, approximately ZYo of the patient's red cells were agglutinated by a
strong anti-A anti-body. Clinical remission followed treatment, as did a return to
350lo "normal" A2 red blood cells. When the patient subsequently relapsed,\Yo of
red cells in peripheral blood and marrow agglutinated with anti-A, and there were
no anti-A anti-bodies in the patient's serum. However, an in vlvo experiment
showed that Ar red cells radioactively labelled with chromium-5l and transfused
into the patient survived for a much shorter time in the patient's circulation than
similarly labelled group O cells. Unfortunately the patient died at this point, and
the possibility that he was intolerant to small amounts of Al blood could not be
confirmed. Interestingly, family studies indicate that the patient's true blood group
was indeed Al.
1.19 Intrinsic factors that may modify ABH antigens
It is possible that glycosidases (enzymes which destroy A or B antigens), or other
intrinsic factors may exist in at least some patients with altered antigen expression,
and modify the A or B determinants. To test this idea, Salmon et al. (1961)
transfused normal Al cells into a leukaemic patient with weakened A expression.
Separation of the normal transfused cells from the leukaemic cells in vitro
indicated that the transfused cells retained their original antigenic strength. These
results exclude the possibility of some intrinsic factor (such as glycosidases)
modi$ing the A antigen, at least in this patrent.
27

1.20 A genetic basis for loss of ABH antigens
From the information presented, there is strong support for a genetic origin of this
phenomenon. Several investigators have suggested that there are chromosomal
alterations in some of these patients, and that these changes may be associated with
loss of the ABH antigens. Ducos et al. (1964), discussed an AML patient that lost
expression of the A antigen, and also exhibited a pair of constricted chromosomes.
ln 1964, cytogenetic techniques to distuinguish chromosomes were not available,
thus Ducos and his associates were limited to inferring that the gene corresponding
to the loss of the A antigen resided on one of the medium group of chromosomes
(group 6-12). Ragen et al. (1968), also described a patient with acute
myelomonocytic leukaemia, with decreased expression of A antigen and a
chromosomal abnormality. However, the cytogenetic changes in these reports
vary, and it would therefore be of interest to study these patients now, given the
advances in cytogenetics since the 1960s.
Salmon et al. (1968) produced perhaps the strongest evidence for a genetic basis of
loss of ABH blood groups. The patient described by Salmon exhibited two distinct
populations of red cells. Over 13 years, the patient's grouping changed very little
(ie. approximately 45Yo of cells agglutinated with anti-Ar, and about 70% with
anti-H). Although the patient had been permanently exposed to benzene in her
youth, she had no signs of disease. Benzene is an agent which is known to cause
leukaemia, in particular acute leukaemia (Gunz and Baikie, 1974). The fact that
this woman was exposed to a leukaemogenic agent and exhibited blood group
changes characteristic of leukaemic patients, yet did not develop leukaemia, is
extremely interesting. Whether or not this patient was pre-leukaemic will be
considered elsewhere in this discussion (section l.2l).
28

The red cell populations tìom this patient were separated (by agglutination with
anti-A) and assayed tbr activity of a number of enzymes unrelated to the ABH
system. Changes in the activity of the red cell enzyme, adenylate kinase I (AKl)' ,
were noted. The A-positive cells had normal activity of both AK, and AK,
(enzyme polymorphisms of AKI), while the A-negative cells were AK, positive
and AK, deficient (see Figure l-8). The ABH system is not functionally related to
AKl. However, the ABO gene is located in ch¡omosome band 9q34.1-34.2, while
the AKI gene is in 9q34.1 (Attwood et al., 1994).
Figure l-E Red cell adenylate kinase I enzyme electrophoresis results from a patient with loss of Aantigens. Lane l: AK2AK1 phenotypefromAl redcells. Lane2'. AKIAK1 phenotypefromweakA red cells from the same patient (Salmon et al., 1968).
Only two other groups have investigated the possibility of concurrent changes in
AIIH and AKl. Kahn et al. (1971), described a patient with erytholeukaemia that
exhibited a mixed-field-reaction with anti-A. Although only 50% of the patient's
red cells agglutinated with anti-A, the unagglutinated "O" cells were strongly H-
'Adenylate kinase I is a phosphotransfèrase, and catalyses the reversible reaction
2ADP <+ ATP + AMP (Fildes and Harris, 1966).
2
29
posltlve. Again, AKl activity was significantly decreased in the A-negative
population (by approximately 80%), compared to the relatively nonnal value of the
A-positive population.
A more recent report (Marsden et al., 1992) describes a patient with acute non-
lymphoc¡ic leukaemia (ANLL), loss of A antigen and a signihcant decrease in
AKI activity (66IU/gHb; the normal range is220-340IÍJlgFIb) Assuming there is a
genetic basis for changes in ABH blood groups, it appears more than coincidental
that the expression of these two linked genes has simultaneously decreased.
1.21 Loss of A or B antigens - an indicator of pre-leukaemic status?
The patient described by Salmon and his colleagues in 1968 exhibited loss of A
antigen with a simultaneous depression in AKI activity. This patient however, was
supposedly healthy, although she had been exposed to the leukaemogenic agent
benzene all her working life. It is possible that loss of A or B antigens is indicative
of some genetic event predisposing the individual to frank leukaemia.
Support for this hypothesis lies in the report of another patient, studied by Lopez
and associates (Lopez et al., 1986). The patient was a four year old girl who
underwent a routine blood group examination. Her red cells exhibited a mixed-
field reaction with anti-A, and subsequent studies revealed a decrease in membrane
bound A-transferase activity. Blood and bone marïow smears showed a moderate
dysmyelopoietic state. Eighteen months later, the child developed AML. At this
point in time, 70o/o of her cells grouped as O, whilst the other 30%o appeared to be
A2. Family studies revealed that she should have inherited an Ar gene. Although
30

changes were also observed with the I antigen (loss of [, increase in i),
agglutination with anti-H was slightly less than in normal controls.
These results suggest that loss of ABo antigens may be one of the first indicators
of disease' Assuming loss of antigens reflects a genetic change that has occurred inthe malignant stem cell, these changes may be one of the first of many in a possibly
multi-step process leading to the deveropment of frank leukaemia.
1.22 Family studies of patients with loss of A or B antigens
Family studies of patients with loss of A or B antigens often indicate that thepatient should have inherited an Ar gene, yet the cells that agglutinate with anti-Abehave as A2 cells, as they do not agglutinate with the plant lectin from Dolichos
biflorus' Salmon (1976), compared the activity of the A-transferase in two of his
patients' and their offspring that must have inherited the same gene. The patient,s
partners were both blood group O, and the offspring both A, therefore the ofßpringmust have inherited the A genes from their respective leukaemic parents. In both
these cases, the patients' enzymes were significantly less active than the enrymeproduced by their offspring.
The A2 enzyme is very similar to the Ar enzyme (see section 1.7). However, the A2
transferase is less efficient at converting substrate, and this results in fewer Aantigen sites. These studies imply that although a normal Al allele is present in
these patients (or at least was present before onset of disease), the
glycosyltransferase it produces is somehow less efficient at converting the H-
31

substrate and subsequently acts in a similar manner to the glycosyltransferase
produced by the A2 allele.
There are a number of possible explanations that could account for the altered
behaviour of the ABO gene. Somatic mutation is an obvious one, as is altered
transcription of the gene (either reduced transcription or disruption of the normal
'RNA by alternative spricing), or the presence of modi$ing genes. until the
recent cloning of the ABo cDNA in 1990 (yamamot o et al., 1990a), it was notpossible to determine if the gene was mutated in these patients, or to analyse its
transcriptional status; these studies are yet to be carried out.
Rubinstein et al. (1973) accounted for the altered behaviour of the ABo gene byproposing the existence of a dominant suppressor of the A and B genes. In a family
study, they found a hearthy blood donor of brood group o, who was had no anti-A
in his sen¡m. The subject was also a secretor, and had a reduced amount of Asubstance in his saliva. The red cells carried the normal amount of H antigen.
Adsorption/elution tests on the red cells with anti-Ar (a sensitive method fordetermining if minute amounts of antigen are present), revealed that the cells infact eluted anti-Al. These results indicate that the patient is actually Ar, although
his red cells do not agglutinate with anti-A at all. Similar studies were carried out
on the donor's maternal half-brother, who was also blood group o but who lacked
anti-B in his serum' Red cells from this individual eluted anti-B, and therefore he
appears to genetically be blood group B. It can be seen from the pedigree in Figure
1-9 that the subjects (7 and 10) must have inherited the A and B alleles from their
respective fathers, but the expression of these genes is modified in some way by agene inherited from their mother.
32

Asec. A,H
osec. H
3
B
21
45AO
sec. A,H sec. H
6o
sec. H
7o
sec. A,Hno anti-A
8o
sec. H
non-sec
910BO
sec.B,H sec. B,Hno anti-B
Figure l-9 Pedigree described in Rubinstein et al (1973), to support the hypothesis that a dominantsuppressor ofthe A and B genes exists. sec.=secretor ; non-sec.=non-secretor ofABH substance insaliva' Subject 7 and lo are group o, yet secretor, serum antibodies and family data indicate thatthey should be A and B blood group respectively. AII the subjects are healthy donors.
It must be remembered that in all of the cases discussed, there is loss of antigens
and sometimes a colresponding increase in the antigen's precursor, but (with one
exception), the appearance ofneo-antigens has not been described. This suggests
that there is a block in the synthesis of the appropriate carbohydrates, most likely
occurring at the genetic level.
There is one case where a patient exhibited neo-antigens. Hocking (rg7l),presented a female AML patient who prior to disease had consistently typed as
group O. During her disease, the patient developed septicaemia and 70o/o of her
red cells agglutinated with anti-A. Treatment with Daunorubicin resulted in
recovery from the septicaemia, and a subsequent return to normal O blood group.
It is likely in this case that bacteria produced some kind of A-like transferase, thus
converting the patients O cells temporarily to A.
JJ
1.23 Loss of the ABII antigens in carcinoma
Changes in A, B and H determinants in a large variety of human cancers was
originally observed in Masamune's laboratory (Masamune e/ al., l95g; Masamune
and Hakomori, 1960). other reports involved changes in blood group antigen
expression in ovarian carcinoma (Metoki et a\.,1989), prostrate cancer (Idikio and
Manickavel, 1991), gastric cancer (David et al., 1993), lung carcinoma (Miyake er
al., 1992), cervical carcinoma (Davidsohn et a1.,1969;Grifhn and wells, 1993), the
urothelium of patients with chronic cystitis (Orntoft et a1.,1989), pancreatic cancer
(Davidsohn et al., l97I), squamous cell carcinoma of the head and neck (Wolf er
a'1., 1990), oral malignant and premalignant lesions (Dabelsteen et al.,
I983;Dabelsteen et al., 1991), uterine/endometrial carcinoma (Tsukazaki et al.,
1991); testicular germ cell tumours (Dabelsteen and Jacobsen, l99l), transitional
cell carcinoma of the bladder (Mandel et al., lg92) and colon carcinomas (Dahiya
et al., 1989).
There are a number of differences between the results on blood group changes in
the haemopoietic disorders and the epithelial cell carcinomas described above.
Firstly, it appears that the phenomenon occurs much more readily in carcinoma,
with some authors proposing a direct relationship between metastasis and loss ofABH antigens (Davidsohn, lg72). Secondly, the tumours often express
incompatible antigens, that is patients of O or B blood group have tumours that
express "4" antigens (Metoki et al., l9s9). Although changes in ABH antigens in
carcinoma and haemopoietic disease may arise from two completely different
mechanisms, it is important to analyse the data in both areas, as there may be
significant similarities in the etiology of this phenomenon.
34

The study of ABH antigens in carcinoma is in some ways less complicated than
studying antigen expression in the leukaemias. A major problem with leukaemia is
the diseased cells may be (and usually are) mixed with normal cells. It is therefore
difficult to compare nonnal and malignant cells from the one person. On the other
hand, solid tumours are more easily separated from the surrounding nonnal tissue;
providing a control for comparison using immunohistochemical and other
techniques (for example mixed agglutination on cell suspensions, and specific red
cell adherence assays). Perhaps this is why changes in ABH antigens have been far
more extensively studied in the carcinomas than in the haematological
malignancies.
1.24 Relationship between loss of ABH antigens and tumour aggressiveness
Davidsohn's group reported that A and B antigens are lost in all anaplastic tumours,
but retained in differentiated tumours and benign adenomas. This was first seen in
gastric tumours and later in cancers of the ovrry, skin, tongue, larynx, bladder and
cervix (Davidsohn et al., 1966; Kovarik et al., 1968). Idikio and Manickavel
(1991) repeated this study on prostate carcinomas, and they also examined the
tumours for expression of the H antigen. They found that loss of ABH antigens
correlated with increasing grade of carcinoma, with I out of 3 grade 2 tumours
positive for the A antigen, I out of 6 grade 3 tissues positive for the B antigen, and
no grade 4 or 5 carcinomas positive for the A, B or H antigens (out of 4). The
largest and most convincing study comes from Davidsohn (1972). Davidsohn
developed the specific red cell adherence test, which allowed him to study tissue
sections that were up to 35 years old. He studied 355 primary carcinomas of the
uterus, cervix, lung, pancreas and stomach, and 578 metastatic carcinomas from
these tumours (Table 1-2). These results show that with few exceptions, loss of
ABH antigens precede the formation of distant metastases.
35

Staining for A, B or If antisens
Tumour type total negative(o/ol
partial(%l
positive(o/"1
lung-primaw
104 ee (e5) I (l) 4 (4)
l(0s)
2 (2)
lung-metastases
206 204 (ee) l (0.s)
uterine/cefTrx-Drrmary
102 8e (87) l l (l l)
uterine/cerrix-metastases
t23 l l4 (e3) e (2) 0
pancreatic-DrtmarT
54 4s (83) 4 (8) s (e)
pancreatic-metastases
79 66 (84) I (l) l2 (rs)
s (s)
8 (5)
stomach-Drimarv
95 70 (74) 20 (21)
stomach-metastases
r70 r4e (88) 13 (7)
totalprimarytumours
355 303 (8s) 36 (10) 16 (1s)
totalmetastases
578 s33 (e2) 24 (4) 2t (4)
Table l-2 Expression of d B and H antigens on primary tumour tissues and metastases derivedfrom these tumours (modified from Davidsotn,l97Z).
1.25 Biochemical studies of blood group antigens in tumours
Originally, blocked biosynthesis of A antigen from the H, glycolipid was observed
in gastric cancer tissue, as compared with norrnal mucosa, by analysis of glycolipid
patterns and in vitrr¡ conversion of H (in the A negative tumour tissue) to A by the
36

A transferase (Stellner and Hakomori, 1973). Furthermore, in tissues where
synthesis of A and B antigens was blocked due to lack of a functional transfèrase,
there was accumulation of the precursor type t and type II H chains, and the Lex
antigen in some of the tumours. Some other cases of adenocarcinoma accumulated
Lea structures, as well as carbohydrates with Leb activity due to an enhanced
fucosyltransferase activity (Hakomori and Andrews, 1970). Studies using
monoclonal antibodies directed against Lex have shown specific reactivity with
human colonic, gastric and lung cancers as well as myelogenous leukaemia
(Brockhaus et al., 1982; Gooi et al., 1983; Huang et al., 1983a and Huang et al.,
1983b). Lex is widely distributed in various normal tissues and cells, however, the
reason behind its accummulation in a large variety of human cancers is unknown.
1.26 Studies using monoclonal antibodies that detect the A and B
glycosyltransferases
White et al. (1990), produced an antibody üKHl), specific to the A1 transferase.
Characterisation of this antibody revealed that it cross-reacted with the B
transferase; a not unexpected result considering the genetic similarity of the two
transferases. This antibody does not detect any protein in O blood group
individuals, supporting the hypothesis that the single base deletion in the O allele
leads to a truncated and immunologically distinct protein (Yamamoto et al.,
1990b). Mandel et al. (1990), used this antibody to study the biosynthetíc
regulation of A and B antigens in epithelial tissue, using oral epithelia as a model.
They concluded that the presence of the transferase in the cytoplasm (probably the
golgi apparatus) of the cells directly correlated with the appearance of the antigens
on the cell surface, and suggested that expression of the A and B blood group
antigens is directly regulated at the transcriptional level of the ABO
glycosyltransferase.
37

Further analyses using the WKHI antibody were carried out to compare the
expression of the transferases in normal and malignant epithelia (Mandel el al.,
1992). Of 9 bladder tumours examined, the conesponding normal bladder tissue
was found to co-express both A or B antigens, and the A/B transferase. No staining
with either antibodies to the transferases or the antigens was observed in the
tumour tissue from 3 patients with grade III tumours, and in 2 patients with grade II
tumours. However, tumour tissues from 2 other grade II patients, and 2 patients
with grade I tumours, were postitive for the antigens and the transferases.
Mandel et al. (1992) also examined normal and malignant oral epithelium,
although the results are dependent on secretor status and more difficult to inte¡pret
than those from the bladder carcinomas. In secretors, normal oral tissue was found
to co-express both the A and/or B antigens and the transferase. However, in non-
secretor tissue, there was expression of the transferase but no corresponding
expression of the antigens; probably due to the lack of type I H precursor that is
normal in these individuals (see Section 1.3). From the staining patterns, it appears
that all of the squamous cell carcinomas derived from oral epithelia examined in
this study were from patients of positive secretor status. In 8 out of the 18
carcinomas, neither the antigens or the transferase were present. In the other 10,
staining was sporadic with antibodies to both the antigens and the transferase.
Interestingly,2 carcinomas had more intense staining with both antibodies when
compared to the normal tissue. Dysplastic tissue adjacent to the carcinoma was
examined in 3 patients; one of which showed loss of both the antigens and the
transferase, the other two had sporadic staining.
38

The third group of tumours examined in this study were from colonic epithelrum.
These tumours were all from patients of either A or B blood group, and four of the
tumours were from the distal colon, while 2 were from the proximal region of the
colon. It should be noted here that tumours from the distal colon do not exhibit
loss of the A and B determinants, conversely they show onco-developmental
expression of these antigens, as normal distal tissue does not express A and B
antigens (Yuan et al., 1985). Mandel et al. (1992), showed that in the carcinomas
derived from the proximal region, both the A and B antigens were expressed in the
same cells as the transferase; as they were also in the normal adjacent tissue. In the
samples from the distal colon, however, both the normal and malignant tissue
expressed the transferases, although only the tumour tissue expressed the antigens.
Mandel et al. (1992), concluded that the onco-developmental expression of the A
and B antigens in the distal colon is not regulated by the expression of the
transferase, and is probably dependent on the presence ofthe precursor H antigen.
These studies indicate that, at least in malignant epithelia, loss of A and B antigens
is due to loss of the appropriate glycosyltransferase, and that this loss is probably
directly regulated by the transcriptional regulation of the gene encoding the
transferase. This might also explain the accumulation of the Lex antigen in
epithelial carcinomas and AML described in the preceding section, as loss of the
A/B transferase would diminish competition by the Lewis encoded
fucosyltransferase for the H precursor substrate.
39

1.27 Genetic analysis of urothelial cell lines with loss of blood group A antigen
expression
Meldgaard et ul. (1994) examined the ABO gene in two cell lines that had loss of A
antigen expression. The cell lines were derived from normal ureter (Hu ó09) and
bladder mucosa (HCV 29), adjacent to tumours. tn both cases, the patients from
whom these cell lines originated, had been treated with inadiation. The authors
reported that the cell line Hu 609 genotyped as A plus a mutated allele (the
mutation was not dehned), and the cell line HCV 29 genotyped as AA. Southern
analysis of genomic DNA from both cell lines did not reveal any gross changes at
the ABO locus, and Northern analysis indicated the ABO gene was expressed,
although biochemical analyses indicated no detectable A-transferase activity.
There seems to be a number of problems with these experiments. Firstly, the
authors do not explain why they chose to use cell lines derived from normal
mucosa, and not from the tumours themselves. There is no mention of whether or
not the tumours themselves had lost expression of the A antigen, although the
authors admit that loss of A antigen in cell lines derived from normal tissue is
peculiar, and hence may not reflect the phenomenon seen in vivo. The fact that the
ABO gene is expressed, but active transferase is not, suggests some kind of
mutational inactivation of the gene, which could have been introduced by the
irradiation treatment received by the patients from whom these cell lines originated.
1.28 Expression of incompatible A antigen in carcinoma
ln tumours of O or B patients, neo-expression of A-like antigens have been
observed (Hakomori et al., 1967), although the molecular basis of this expression
is unclear. Yokota et al. (1981), suggested that the A-like antigen could be a
fucose-less A determinant, while Breimer, 1980, suggested it could be a di-
fucosylated A structure, based on mass spectometry results. It has long been
40

known that the Forsmann antigen cross-reacts with blood group A, and hence the
possibility that the A-like antigen is in fact the Forsmann antigen has been studied
by several groups. The enzyme responsible for synthesis of the Forsmann antigen
is greatly increased in most squamous cell carcinomas and in some
adenocarcinomas (Taniguchi et el., lgsl). Mori et al. (19s3) used
immunofluorescence studies to show that Forsmann antigen is expressed in various
human lung, breast and gastric cancer cell lines. However, the A-like antigen
expressed in gastrointestinal tumours from O or B group individuals is structurally
different from the Forsmann antigen (Hakomori et al., lg77).
Recently, David et al. (1993) used the monoclonal antibody developed to the A/B
transferase to confirm the presence of the true A antigen in 3131 cases of gastric
tumours from blood group O individuals. The histologically unaffected tissue
adjacent to the tumours did not stain with the antibodies, and genotyping of the
ABO gene in the tumour tissue revealed an OO genotype. Five other cases had an
AJike antigen, but did not stain with the antibodies. Based on these results, it was
postulated that alternative splicing of the ABO gene may have occurred. If the so-
called second exon (the intror/exon structure of the 5' end of the gene is not
entirely known), was spliced out, the reading frame of the O allele would remain
intact and could theoretically produce a glycosyltransferase capable of converting
the H antigen to A. Interestingly, one of the patients examined in this study had
two tumours, one positive for the true A antigen, the other tumour negative.
The evidence so far presented in this discussion indicates that changes in the ABO
gene could explain loss of the A and B antigens in carcinoma and the haemopoietic
malignancies, at least in some patients. Some leukaemias are reported to have
4L

disturbance of, or translocations in 9q34, the same chromosomal band that the
ABO gene is located in. [t is therefore pertinent to include a discussion of the
haernopoieti c mal i gnancies.
1.29 The haemopoietic malignancies
Leukaemia is almost always fatal, however little is known about the origin of the
disease itself. In his introduction to a chapter on classification of the leukaemias,
Edward Henderson provides a quote from an eminent haematolologist of the l9th
century, Virchow, made in 1849; "This is what we lcnow about leukaemia: during
normal blood cell production the cells dffirentiate into specific types. In a
pathologic situation the dffirentiation into specific cells is blocked. This
disturbance of normal differentiation - so called leukaemia - is a disease sui
generis. Il'e htow the sequelae of this disease, we don't lvtow its origin.".
Henderson goes on to state that this is essentially still the case today (Henderson,
1ee0).
Leukaemia may best be defined as the abnormal proliferation of haematopoietic
precursor cells that do not retain the capacity to differentiate normally to mature
blood cells (Figure l-10). As a consequence, the leukaemias have been divided into
two main categories according to the predominant cell type; lymphoid and myeloid.
This distinction is made on morphological grounds, although certain cases of acute
leukaemia de$ this kind of classification, in which case the disease is classihed as
acute undifferentiated leukaemia (AUL).
There are also other haematological malignancies that do not strictly classifu as
leukaemias, as they still retain the capacity for differentiation, but exhibit a clonal
expansion of cells (ie. myeloproliferative disorders), or, as in the myelodysplastic
syndromes, there is no uncontrolled proliferation, yet the differentiation of the cells
42

to their mature forms is blocked at some point. Both the myeloproliferative
disorders (Ì\æD) and the myelodysplastic syndromes (MDS) can lead to acute
leukaemia (reviewed in Sawyers et al., l99l).
---à igt- Platelets
Red blood cells
Myeloid progenitor
Neutrophils
+-+ Macrophages
Pluripotent stem
---à B lymphocytes
Lymphoid pro
+ T lymphocytes
Figure 1-10 Simplified version of the cell lineages of the haemopoietic system. Inleukaemia, differentiation of the progenitor cells to mature blood cells is blocked at somepoint (from Sawyers et al., l99l).
Loss of A and B antigens occurs mainly in the myeloid malignancies, which include
chronic and acute myeloid leukaemia, the myelodysplastic syndromes, and
myeloproliferative disorders. At onset, chronic myeloid leukaemia is essentially a
myeloproliferative disorder in which the cells retain their full capacity for
differentiation. This chronic phase is eventually followed by a blast crisis, in which
differentiation of the cells is arrested at a progenitor stage.
There are eight subtypes of acute myeloid leukemia, classified according to the
French-American-British (FAB) scheme; AML M0 to M7. A summary of the
-
@
0oo
43

classifications and sirnplified features of the various subtypes of AML and the
myelodysplastic syndromes referred to in this thesis is shown in Table l-3 below.
Table 1-3 French-American-British classification of acute myeloid leukaemia and myelodysplasticsyndrome (from Henderson, 1990). pB indicates peripheral utoã¿; glvf is bone ¡¡ur.o*.
1.30 Disruption of the ABL proto-oncogene at9q34.l in CML
CML cells have a characteristic translocation t(9;22), which is found in the
malignant pluripotent haemopoietic stem cells and all their progeny. The
translocation, disrupts the Abelson oncogene (ABL) on chromosome 9 (9q34.1),
and the BCR (break-point cluster region) gene on chromosom e 22
(22qIl'2)(reviewed in Dobrovic et at., l99l). The derivative chromosome 22 is
known as the Philadelphia ch¡omosome (Baikie et at., 1960). The philadelphia
chromosome is also found in lo/o of AML and20%o of adult ALL cases (reviewed in
Dobrovic et al., 1991), and some myeloproliferative disorders (Heim and Mitelman,
1987).
FAB classifications of AML Simplified tionAML MO acute undifferentiated stem cell leukaemiaAML MI acute myeloid leukaemia or acute non-lymphoc¡ic
leukaemia without maturationAML M2 leukaemia with maturationAML M3 leukaemiaAML M4 leukaemiaAML M5 leukaemiaAML M6AML M7 leukaemia
FAB subsets of myelodysplastic syndrome Characteristicsanaemra <l% blasts in PB < 5% blasts in BM
refractory anaemia with ringed sideroblasrs (RARS) <lolo blasts in PB; <5% blasts with ringed sideroblasts>l5olo of nucleated cells in BM
chronic myelomonocytic leukaemia (CMML) <5% blasts with peripheral monocytosis (>l x I tn5-20Yo blasts in BM
anaemia with excess blasts <5% blasts in 5-20Yo blasts in BMrefractory anaemia with excess blasts in transformation >5olo blasts inPB;20-30Yo blasts in BM
44

The ABL gene codes for a tyrosine kinase which is predominantly localised in the
nucleus (Van Etten et ol., 1989). The BCR-ABL fusion protein exhibits enhanced
(cytoplasmic) tyrosine kinase activity, possibly due to the loss of a negative
regulatory domain from the 5' end of the gene (Konopka et al., 1984; Konopka and
witte, 1985' Kloetzer et al., 1985; Clark et al., 1987; Jackson and Baltimore, 1989).
Daley et ol. (1990), introduced the protein produced from the fusion of the 5' region
of the BCR gene, and the 3'end of the ABL gene into cultured murine bone marrow
cells, and transplanted them into syngeneic mice; the mice subsequently developed
a disease similar to CML, confirming that the BCR/ABL protein is a potent
leukaemogenic agent.
Although ABL is located between the AKI and ABO genes in 9q34 (Attwood et al.,
1994), it is unlikely that disruption of this region by the translocation leads to loss
of ABO antigens, as approximately 90Yo of CML patients have the Philadelphia
chromosome (Nowell and Hungerford, 1960; Rowley, 1973), but loss of A and B
antigens seems to be a relatively rare event.
1.31 Disruption of other genes at 9q34 in leukaemia
A subset of patients with AML carry a t(6;9)(p23;q34) translocation. Von Lindern
et al. (1992), cloned an aberrant transcript produced in these patients and concluded
that the 5'part of the DEK gene from 6p23 forms a fusion protein with the 3' region
of the CAN gene at9q34. The CAN gene lies approximately 360kb distal to ABL
(Von Lindern et al., 1990). Kraemer et al. (1994), inferred from the cDNA
sequence of the CAN gene that there was partial homology (at the amino acid level)
to the putative rat nucleoporin (nuclear pore complex) protein, Monoclonal
antibodies were subsequently developed to the rat protein, and used to probe
proteins produced by E. coli expressing the CAN cDNA construct. The results lead
the investigators to conclude that the CAN gene probably encodes a nucleoporin,
45

and is an oncogene involved in leukaemogenesis. However, confirmation of this
awaits further molecular analyses.
Disruption of the CAN gene could be related to loss of ABO antigens. However, no
translocation or other cytogenetic changes have been associated with patients in
which blood group antigens have been observed to date. Therefore if the CAN gene
is disrupted in loss of ABO patients, it is either due to microdeletions not detected
during cytogenetic analysis, or by some other means, for example gene silencing.
Another gene found in 9q34.3 that is also disrupted in leukaemia is the
lranslocation-Associated "Notch" homolog, known as the TAN1 gene. The gene
was found by cloning the translocation breakpoint [t(7;9)(q3a;q34.3)], from a
patient with acute T-cell lymphoblastic leukaemia (T-cell Al,I,),(Ellisen et al.,
1991). TANI is highly homologous to the Drosophila Notch gene, hence its name.
Ellisen et al. (1991) found that the (7;9)G3a;q34.3) translocation resulted in
truncation of the TAN1 transcript in 3 cases of T-cell ALL, and interpreted the
observations to mean that TANI is integral to normal lymphocyte function. At
least one other "Notch" homolog is expressed in human bone marrow, suggesting
that TANI and other members of the "Notch" family could be involved in
haematopoiesis (Milner et al., 1994).
1.32 Tumour suppressor genes and loss of ABO antigens
Tumour suppressor genes (TS genes), might best be defined as recessive oncogones;
that is functional loss of both copies of the gene is required for transformation
(reviewed in Stanbridge, 1990). The presence of a TS gene is generally deduced by
recurrent deletions and loss of heterozygosity (LOH) in a region of the genome.
46

Loss of ABO antigens might in fact be due to deletion or inactivation of an entire
region of 9q34, this is supported by the AKI data. As loss of ABO or AKl is not
likely to be important in the aetiology of these leukaemias, these results may
indicate the presence of a TS gene in the 9q34 region. The AK data presented by
Salmon et al., 1968 (see Section 1.20), suggestedthatthere was allelic loss of the
AKl product. If there were allelic loss of AKl and ABO, one would expect allelic
loss of the presumed TS gene (ie. loss of heterozygosity). The other "normal" copy
of the TS gene would have to also have undergone some alteration in expression to
satisfu TS criteria. This could be due to mutational inactivation, as is seen in the
P53 tumour suppressor gene, or epigenetic inactivation of the normal copy of the
gene.
An example of epigenetic inactivation of a tumour suppressor gene is the human
Hl9 gene. The Hl9 gene is normally imprinted, that is only the maternally
inherited copy of the gene is expressed (Zhang et al., 1993). However, in Wilm's
tumours, both copies can be inactivated (Moulton et al., 1994) or the maternal
(active) allele lost (Zhang et al., 1993). It appears that genomic imprinting and
transcriptional silencing of genes might also be involved in the pathogenesis of a
number of other human cancers (reviewed in Tycko, 1994).
There is some evidence that a TS gene for leukaemia may exist on the long arm of
chromosome 9. Deletions of 9ql l-9q32 repeatedly occur in AML (Trent et al.,
1989). The region 9q22 appears to be the minimal recurrent deletion in a variety of
AML, MPD, and MDS disorders, and a putative TS gene (Growth Arrest Specific 1,
GAS-I) has been mapped to this region (9q21.3-q22) (Evdokiou et al., 1993).
Perhaps a more likely candidate for a TS gene on 9q is in fact the ABL gene.
Recent evidence suggests that the nuclear tyrosine kinase encoded by ABL
47

negatively regulates cell growth; and therefore, loss of both copies of ABL would
lead to growth deregulation (Sawyers et al., 1994: Mattioni et al., 1995).
48

1.33 Ann oF THrs PRoJECT
The aim of the project described within this thesis is to determine the molecular
basis of loss of AIìO antigens in haematological malignancy. Expression of the A
and B antigens is directly dependent on expression of the ABO glycosyltransferase,
and this transferase appears to be reduced or absent in the red cells of some patients
with haematological malignancy. As loss of A and B antigens per se is unlikely to
be important in cancer progression, and as these changes reflect a genetic event that
is occurring in the malignant stem cell, they may indicate the presence of the
tumour suppressor gene in the region of 9q34. It is therefore important and relevant
to examine the molecular changes at the ABO locus which result in this
phenomenon.
49

CnnprERTwo
GENnRAL M¿,.rnRrALSANoMnrnoDS

2.0 RntceNTS AND soLUTroNS
All reagents were of anal¡ical grade and, unless otherwise stated, were obtained
from distributors of Ajax chemicals (Sydney, Australia), Amersham Australia
(North Ryde, Australia), Amrad-Pharmacia Biotech (Melbourne, Australia), BDH
Laboratory Supplies (Poole, England), Biorad Laboratories (North Ryde, Australia),
Boehringer-Mannheim (North Ryde, Australia), Bresatec (Thebarton, Australia),
Commonwealth Serum Laboratories (CSL, Parkville, Australia), Difco (Detroit,
USA), Gibco-BRL Life Technologies (Australia)" Sigma Chemical Co. (St Louis,
USA), New England Biolabs (Genesearch, Brisbane, Australia), Progen Industries
(Darra, Australia), Promega (Melbourne, Australia), Selby (Australia), and eiagen
(Chatsworth, USA).
2.1 SoluuoNs usED FoR THE ANALysrs oF RED CELLS
Antibodíes
Anti-A, anti-B, anti-AB (Epiclone @ murine monoclonal antibodies for blood
grouping), anti-H (Uex europaeus lectin), and anti-At (Dolichos biflorus lectin)
were all obtained from CSL, and used neat.
30% solutíon of polyvínyl pyrrolidone (PW)
30g of PVP (Mw 40,000) was dissolved in 100mls of a 0.6% saline solution.
Phosphate-buffered saline (PBS )137mM NaCl2.7mM KCI4.3mM Na2HPOa.7H2O1.4mM KH2PO4
51

2.2 SoluuoNs usED FoR cELL rsoLATroN AND cULTURE
Trypsín-versene0.1% Trypsin (Difco)O.I% EDTA99.8% RPMII 640 (Gibco-BRL)
Growth MedÍa
Media (DMEM or RPMI 1640; Gibco-BRL), was diluted in dH2O according to the
manufactwer's instructions, and supplemented with 3.7gll NaHCO3 (Sigrna),
60¡rg/ml benrylpenicillin (Sigma), S0¡rg/ml dihydrostreptomycin (Glaxo), and
100¡rg/ml L-glutamine (Sigma), 3,5gll D-glucose (added to DMEM only; Sigma).
HAT medium was essentially DMEM containing I x FIAT solution (Gibco-BRL).
All media were filter sterilized using a0.22¡tNI disposable filter (Cornwell), before
the addition of fetal calf serum (CSL) to a final concentration of l0%.
2.3 SoIurIoNs FoR MoLEcULAR BIOLOGY
E DTA (et hy lenediamíne tetra-acetíc acíd), 0. 5 M186.19 of Na2EDTA.ZH¡O was dissolved in 700m1 H2O and the pH adjusted to 8.0
with l0M NaOH, before adjusting the total volume to llitre.
TENI balþr50mM Tris-HCl, pH82mM EDTA400mM NaCl
Phenol
2-3 grains (0.1%) of 8-hydroxyquinoline (Sigma), were added to 100mls of phenol
(Sigma). The phenol was equilibrated by washing it 100mls of 0.5M Tris-HCl (pH
8.0). The phenol was drawn from the Tris-HCl, and washed with 100mls of 0.1M
Tris-HCl (made with DEPC treated H2O; pH 8.0). This step was repeated until the
phenol was pH 7.8. Finally, 0.2o/o vlv p-mercaptoethanol (Sigma) was added and
the phenol stored at 4C and used within 4 weeks, or stored at -20C until required.
52

TE bufferlOmM Tris-Cl, pH 8.0lmM EDTA, pH 8.0
TESI bufferl0mM Tris-Cl pH 8.0
lmM EDTA100mM NaCl
Solutíon D4M guanidinium isothiocyanate (Sigma)25mM sodium citrate, adjusted to pH 7 with citric acid0.50lo sarcosyl0. lM 2-mercaptoethanol (Sigma)
D E PC (díethy lpyrocarbonate) treated H 2O
0.2mls of DEPC (Sigma) was added to 100mls of ultrapure H2O. The solution was
shaken vigorously every l0 minutes for thr, before autoclaving.
Loading bulþr (6x)50% glycerolO.2MEDTA, pH 8.30.05% bromophenol blue
5x Trß-Borate (TBE) bulþr
To 1600mls of dH20, 108g of Tnzma base, 55g of boric acid, and 40mls of 0.5M
EDTA (pH I 0) was added. The volume was then adjustedto2litres with dHz0.
20x SSPE3.óM NaCl0.2M Sodium phosphate0.02M EDTA pH7.7
l0mg/ml Salmon Sperm DNA
l00mgs of salmon sperrn DNA (Sigma), was dissolved in lOmls of dH20 to which
200p1 of lON NaOH was added. The mixture was boiled for 10 minutes and
sheared using an 18-gauge needle.
53

Sephadæ column
0.259 of Sephadex G50 (Pharmacia) was suspended in ómls of dH20 and allowed to
swell for at least 2hrs at 65oC. A Poly-Prep chromatography column (Biorad), was
filled with 2mls of Sephadex solution and placed inside a 50ml tube. Excess liquid
was removed from the column by gravity flow. The column was then flushed with
190¡rl of 200mM B-mercaptoethanol and 10¡rl of lOmg/ml salmon sperm, and
centrifuged at 70 x g for 10 minutes, at which time the column was ready for use.
Prehybrídìzatíon mix5xSSPE0.5% SDS5x Denhardt's solution
1 00x Denhørdtts solutìon2Yo F icoll (Flow laboratories)2Yobovine serum albumin2o/oPYP (lvtw 40,000)
Strþpíng solution5mM Tris-Cl, pH8200pM EDTA0.02% sDS
40mtl[ úNTP solution
A 40mM stock solution of dNTPs containing approximately lOmM of each
nucleotide was prepared. 50mgs of each dNTP (2'-deoxy-adenosine-5'-triphosphate
disodium salt; 2'-deoxy-cytidine-5'-triphosphate disodium salt; 2'-deoxy-guanosine-
5'-triphosphate disodium salt and 2'-deoxythymidine-5'-triphosphate tetrasodium
salt; Boehringer-Mannheim), were pooled and dissolved in gmls of DEPC treated
water. The pH of the solution was adjusted to pH 7.0 by drop-wise addition of lM
Tris-base, after which the final volume of the solution was adjusted to lOmls.
54

Ligase I0x buffer300mM Tris-HCl, pH 7.5l00mM MgCl2100mM DTTlOmM ATP
IPTG stock solution (0.1M)1.2g IPTG (Sigma)H20 to 50mls, filter sterilized
X-Gal (S0mg/ml)50mg of x-gal powder (Progen), was dissolved in lml of Dimethyl Formamide(Sigma).
Luría Broth (LB) MedíumI 0g Bacto-tryptone (Difco)59 Bacto-yeast extract (Difco)59 NaCldH20 to I litrebrought to pH 7.0 (using 10N NaOH), and autoclaved.
Preparatíon of LB plates wíth ampícillín/IPTGã(Gøl
l5g of agar (Difco) was added to I liter of LB medium and boiled. When the
medium had cooled to 50oC, ampicillin (Sigma), was added to a final concentration
of 1O0pg/ml, IPTG to a final concentration of 0.5mM, and X-gal (Progen) to a final
concentration of 80¡rg/ml. Approximately 35mls of medium was poured into each
85mm petri dish and allowed to set. The plates could be used immediately or
stored at 4oC for up to one month.
55

2.4 TncHxreuts usf,D FoR sERoLocrcAL ANALysrs oF RED cELLs
Red cells from patients were generally not available, although blood groups and in
some cases other test results were available from the various laboratories that
supplied the samples. In some cases, frozen red cells were able to be obtained
from Dr Alex Dobrovic. Where fresh or frozen samples were available,
preparation of red cells and blood grouping was carried out as described in the
methods below.
2.4.1 Preparation of red cells for long-term storage
Red cells were separated from the other components of the blood or bone marrow
by density gradient centrifugation (see 2.5.1). The cells were then resuspended in a
two-fold excess of PBS, and washed by centrifugation at 300 x g for 10 minutes.
The supernatant was removed and the cells washed twice more. All traces of PBS
were removed, and a 1:1 mix of packed red cells in a 30Yo solution of PVP. The
mixture was allowed to stand for 10 minutes, before being frozen dropwise in liquid
rutrogen.
2.4.2 Thawing frozen red cells
When red cells were required, two to five frozen pellets were dropped in l0mls of
37'C PBS, inverted and sedimented by centrifuging at 300 x I for l0 minutes.
Depending on the amount of haemolysis, this step was repeated until the
supernatant was clear. The supernatant was then removed and the cells
resuspended in PBS to produce an approximate concentration oî 5o/o v/v red cells.
56

2.4.3 Blood grouping
One drop of anti-serum was added to one drop of red cell suspension (5% red cells
in PBS). If the tile method of typing was being used, the cell/anti-sera mixture was
dropped onto a tile, gently agitated for l-2 minutes and then given a score of 1-12
based on the NATA approved" method of quantiffing agglutination, as shown in
Figure 2-1. If the tube method was used, the cell/anti-sera mixture was centrifuged
for 20 seconds at 600 x g. The cell button was then gently dislodged, and the
sample scored as above for agglutination. Positive and negative controls were
included in all tests. If thawed red cells were being analysed, blood from healthy
individuals that had been frozen for a minimum of th¡ee weeks was used for the
controls.
If a mixed-field reaction \¡/as observed, the non-agglutinating cells were aspirated
and washed in 300¡rl of PBS three times (700 x g for 20 seconds). The cells could
then be resuspended in PBS (usually about 50¡rl), and tested for agglutination with
other anti-bodies (eg. anti-H lectin)
* NATA (National Association of Testing Authorities, Australia). Alt tests performed in Australian
hospital laboratories must be NATA certified.
57

Score Grade Macroscopic Appearance
- t2 ++++ Complete agglutination, a single
agglutinate of strongly reactive
red cells.
t0 +++ Strong reaction, I or 2 large
agglutinates.
8 ++ Skong reaction, a number of large
agglutinates.
(+) Weak granularity in cell suspension.
r¡¿-*'æ{*H+!-,,,-,nf;) 5 + Many small agglutinates
Gt i : '- t- .'.L-
ì3
0 0 An even cell suspension.
Figure 2-1. Scoring agglutination reactions. The examples shown use the "tube"
method for blood grouping, however the scoring system is the same for both the
tube and the tile methods.
58

2.5 Cnu rsoLATIoN, cULTURE AND REcULAR MATNTENANCE
2.5.1 Isolation of the mononuclear cell fraction from patient samples
Peripheral blood or bone marrow samples were obtained from patients and
centrifuged for 5 minutes at 500 x g. The plasma was removed and the remaining
cells diluted in a two-fold excess of PBS. A density gradient was prepared by
carefully underlaying the suspension with an appropriate volume of sterile Ficoll-
Hypaque (Flow laboratories), generally l0mls of Ficoll-Hypaque to a 40ml
suspension of cells, plasma and PBS. Centrifugation was carried out for 25
minutes at 300 x g. The mononuclear cells were then isolated by aspiration from
approximately the middle of the gradient, and washed at least two times in a two-
fold excess of PBS (500 x g, 10 minutes).
2.5.2 Cell lines
Cell lines were maintained in either HAT medium, DMEM or RPMI 1640, at37"C
in a humidified atmosphere supplemented with 5% CO2. When cells reached
confluency, they were either detached from their support by treating them with
trypsin solution (adherent cell lines), or placed directly into 10ml tubes (suspension
cell lines). Details of the specific cell lines used in this study are shown in Table 2-
l; all cell lines were from laboratory stocks, except for the LIM series of cell lines,
which were kindly provided by Dr. R.H. Whitehead from the Ludwig Institute for
Cancer Research at the Royal Melbourne Hospital, Melbourne, Victoria, Australia.
Karyotypes are not included as they were either not available, or inconclusive
because there were so many marker chromosomes and/or unidentified double-
minute chromosomes. It is however, worthy to note that the cell line K562 does
not contain a norrnal chromosome 9, although it does contain a Philadelphia
chromosome.
59

Cell line Tvpe culture tvDe Reference
K562 CML - eMhroleukaemia suspensron ATCC'databaseHiMeg CML - megakaryoc¡ic
leukaemiasuspenslon unpublished; personal
communication with DrAlex Dobrovic
KCL22 CML suspensron Kubonishi and Miyoshi,(1e83)
FML eMhroleukaemia suspensron ATCC database
HL6O promyelocvtic leukemia suspenslon ATCC database
TIT29 colon carcinoma adherent monolayer ATCC database
sw480 colon carcinoma adherent monolaver ATCC database
LIM I863 colon carcinoma orsanoid/suspension Whitehead et al.. 1992LIvÍ,2412 colon carcinoma susDensron rWhitehead et al.. 1992LIM I2I5 colon carcinoma adeherent monoalyer Whitehead et al., 1992LIM 2405 colon carcinoma adeherent monoalyer Whitehead et al., 1992
LIJVÍ,2463 colon carcinoma adeherent monoalyer Whitehead et al., 1992.
Table 2-1. Details of cell lines used in this study
2.5.3 Freezing and thawing of cells
Isolated cells were prepared for freezing by resuspending them at a concentration
of 107 cells per ml in RPMI 1640 (Gibco), containing20% fetal calf serum (CSL),
or autologous plasma. DMSO (dimethyl-sulfoxide, Sigma) was then added
dropwise to a final concentration of 10%. The cells were then placed in l.5ml
aliquots in cryopreservation tubes (Nunc), and stored in liquid nitrogen.
Thawing of the cells was accomplished by agitating the ampoules in a water bath at
37"C. As soon as they were tha,wed, the cells were pelleted (2 minutes at 12,000 x
g), and either DNA or RNA prepared as described below (see Sections 2,6.1 and
2.6.2). If it was required that the cells maintain viability after thawing, they were
instead placed in a tube to which l0mls of the appropriate g¡owth media was added
drop-wise. The cells .'ù/ere then washed three times in growth media (10 minutes at
300 x g per wash), to remove any last traces of DMSO.
' ATCC is an abbreviation for the American Tissue Culture Collection
ó0

2.6 MoInCULAR BIOLOGY TECHNIQUES
2.6.1 Preparation of genomic DNA
Two methods were used to isolate genomic DNA from leukocytes, tumour samples
and cultured cells. The phenol-chloroform method was used to isolate DNA for
use in Southern hybridization experiments, while the "salting out" procedure was
used to prepare DNA for use in PCR expenments.
P heno l-Chlo roþ rm øct ractío n
Standard techniques (Sambrook et.al, 1939) were combined and modified as
follows: Up to 20 million cells (or the equivalent of macerated tumor tissue) were
resuspended in 500¡rl of TEN1 buffer to which 100¡rl of lOmgiml Proteinase K
(Sigma) and 100¡rl of 20% SDS (sodium dodecyl sulfate) was added. Following an
overnight digestion at 37"C, the DNA was extracted with 500¡rl of phenol, and the
resulting aqueous phase was collected and extracted once with
phenol:chloroform:isoamylalcohol (50:49:1) and finally with 500¡rl of
chloroform:isoamylalcohol (49:1). The DNA was precipitated with either an equal
volume of isopropanol or two volumes of absolute ethanol, by centrifuging in a 1.5
ml microfuge tube at 12,000 x g for 30 minutes. The resulting DNA pellet was
then washe d in 70% ethanol, vacuum dried and dissolved in 400¡rl of TE buffer or
distilled water, and stored at 4"C.
Saltíng out procedurefor øctractíng DNA
This procedure was modified from Miller et. al., 1988. Cell lysis was carried out
as described for the phenol-chloroform extraction method, with the exception that
TES1 buffer was substituted for the TEN1 buffer. After digestion, an equal
volume of 3M NaCl was added to the solution, and the tube shaken vigorously.
6T

The tube was then placed on ice for l0 minutes, betbre centrifuging for l0 minutes
at 7,000 x g. The supernatant containing the DNA was removed, whilst carefully
avoiding the protein pellet at the bottom of the tube. The DNA was then
precipitated and redissolved in the same manner as described for the phenol-
chloroform extraction.
2.6.2 Preparation of total RNA
Total RNA rwas prepared from lymphocytes, bone malrow, cultured cells or tumor
tissue for use in RT-PCR and Northern hybridization experiments using a modified
version of the method published by Chomczynski and Sacchi (1987). Cells were
counted and five to ten million were lysed by vortexing briefly in 500¡rl Solution
D. Where RNA was to be prepared from tumours, the fresh tissue was snap-frozen
in liquid nitrogen and then fixed in Tissue-TEK O.C.T compound (Miles
Diagnostics, USA). A cryostat machine was then used to slice 15-30 sections of
17¡.rm thickness, which were then placed directly in Solution D. The presence of
fixative did not appear to adversely affect the RNA isolation. Specimens were
stored in Solution D at -20'C indefinitely.
When RNA was required, the specimens in Solution D were thawed on ice.
Extraction was carried out by sequentially adding 50¡.rl 2M NaAc (pH 4.5), 500¡rl
Phenol (saturated with DEPC treated water) and 100prl chloroform:isoamylalcohol
(a9:1). The cell suspension was then vortexed thoroughly and allowed to rest on ice
for 15 minutes. The organic and aqueous phases were separated by centrifuging for
8 minutes at 7,000 x g. After centrifugation, the top 400¡rl of the aqueous phase
was transferred to another tube and mixed with 400¡rl of isopropanol, then placed at
-80oC for 20 minutes to ovemight to precipitate the RNA. The RNA was
sedimented at 12,000 x g for 20 minutes before the pellet was washed in 70Vo
62

ethanol and vacuum dried. The dried pellet was dissolved in 50¡.rl of DEPC treated
water
2.6.2.1 Modification of the RNA isolation method for isolating RNA and DNA
from limited patient samples
If 5x10⁶ cells or less were available from patients, the RNA extraction method
described in2.6.2 was scaled down appropriately, and carried out in a 0.5m1 tube.
After the top % of the aqueous phase was removed for RNA precipitation, an
equivalent amount of TEN1 buffer was added to the remaining aqueous and organic
phases. The minture was then vortexed and centrifuged for 5 minutes at 7,000 x g
to separate the phases. Almost all of the aqueous phase was then removed, and
DNA precipitated using two volumes of absolute ethanol, or one volume of
isopropanol. The pellet was washed and dried as described in2.6.2.
2.6.3 Quantitation of DNA and RNA
To quantitate DNA and RNA, 5¡rl of sample was diluted in 1000¡rl of water and the
optical density at 260nm was determined using the Genequant DNA calculator
(Pharrnacia). Concentration of DNA was based on one OD unit being equivalent to
50pg of DNA per ml, while for RNA the concentration was calculated on the basis
that one OD unit was equivalent to 40 þgof RNA per ml of solution.
63

2.6.4 Polymerase Chain Reaction (PCR)
Primer Design
Primers were designed with the assistance of the Primer (version 0.5), computer
program, (copyright 1991, Whitehead Institute for Biomedical Research). Criteria
requested by the program were set to:
Optimal primer length: 24
Minimum primer length: 22
Maximum primer length: 26
Optimal primer melting temperature: 70.0"C
Minimum acceptable primer melting temperature: 65.0oC
Maximum acceptable primer melting temperature: 75.0'C
Minimum acceptable primer GC% 20
Maximum acceptable primer GC% 80
Salt concentration (mM) 65
DNA concentration (nM) 50
Maximum number of unknown bases (Ns) allowedallowed in primer 0
Maximum acceptable primer self-complementarity(number of bases)
Maximum acceptable 3' end primer self-complementarity(number of bases)
GC clamp- how many 3'bases
Product range
12
8
0
variable
64

Synthesís and isolatíon of oligonucleotides
Oligonucleotides were synthesised on 0.2¡,rM columns (Pharmacia-LKB) in a
Pharmacia-LKB Gene Assembler Plus DNA synthesizer according to the
manufacturer's instructions by Mr Terence Gooley at the The Queen Elizabeth
Hospital. Initially, excess synthesis reagents were removed from the column by
centrifuging in 1.5m1 Sarsdedt tubes for 1 minute at 1,000 x g. The
oligonucleotides were cleaved from their support using 28% NH4OH; the column
was placed in 1.5mls of -80'C NH4OH, and centrifuged again for I min at 1,000 x
g to soak the column. Cleavage was achieved by incubation at 37oC overnight.
The ammonia solution was then removed and vacuum dried for approximately 2
hours, after which time the oligonucleotide pellet was resuspended in lml of TE.
The concentration of the oligonucleotides was determined as described for DNA
(see 2.6.3), with the exception that one OD unit was assumed to represent an
oligonucleotide concentration of 3 3 ¡rglml.
Standard amplíJicatio n condítíons
Unless stated otherwise, all PCR reactions were carried out as follows. Genomic
DNA was isolated as described in section 2.61 of this chapter. Target DNA
(100ng), was placed in a 0.5m1 reaction tube in a total reaction volume of 50¡rl
containing 100ng of each of the oligonucleotide primers to be used, 0.8mM dNTPs,
0.5 units of Taq DNA polymerase (Boehringer-Mannheim), in the presence of the
buffer supplied by the manufacturer. The reaction was overlaid with one drop of
mineral oil (Sigma), to prevent evaporation. The DNA was then denatured by
heating the reaction to 94oC for 5 minutes, before amplihcation was achieved by 35
cycles of 96oC for 24 seconds, 60oC for 30 seconds , and 72oC for 1 minute. If the
amplified product was to be used for cloning, a final extension of 72oC for 5
65

minutes was added to the standard protocol. The reaction was carried out in a
water-cooled thermal cycler (ARN Electronics, Belair, South Australia).
2.6.5 Reverse-transcriptase polymerase chain reaction (RT-PCR)
Total RNA was isolated as described in section 2.6.2 of this chapter. Reverse-
transcription was then accomplished as follows: 1¡rg of RNA was mixed with 0.5¡tg
of random-hexamers (Pharmacia) in a total volume of 20¡.rl of DEPC treated water.
The RNA/random primer mix was then denatured by heating to 60oC for 5 minutes,
followed by cooling on ice for 3 minutes. Twenty micro-litres of a reaction master-
mix was then added, bringing the total reaction volume to 40p1, containing 200
Units of MMLV reverse-transcriptase (Gibco-BRL), I x First strand buffer (Gibco-
BRL), 10mM DTT (Gibco-BRL) and 2mM dNTPs. The reaction was placed at37"
C for one hour, after which time 60¡.rl of sterile (but not DEPC treated), water was
added. The resulting cDNA was then stored at -20oC. RT-PCR was carried out
using 5¡,rl of the cDNA mix as target, under the same amplification conditions
described for genomic DNA in section 2.6.4 oîthis chapter.
Removal of contamínatíng DNAfrom RNA prior to reverse-transcríptíon
In some cases, it was desirable to remove contaminating DNA from RNA
preparations. RNA (l¡,tg), random hexamers (0.5pg), l¡rl of l0 x DNAse I buffer
(Gibco), and 1 unit of Amplification grade DNAse (Gibco), were incubated for 12
minutes at room temperature in a total volume of 10¡rl. To stop the reaction, 10¡rl
of 2mM EDTA was added, and the mixture heated to 70oC for 10 minutes. The
reaction was then cooled on ice for three minutes, and the reverse transcription
master mix added as described above.
66

2.6.6 Get electrophoresis
Agarose gel electrophoresìs
PCR products were routinely resolved on 1.5o/o horizontal agarose slab gels
(Progen), containing 1O0ng/ml of ethidium bromide (Biorad), in 0.5 x TBE buffer.
Bands were visualised by subjecting the gel to [fV (25anm) light, and photographed
using Polaroid 665 film. The resulting negatives were scanned on a G670
densitometer (Biorad), for densitometric analysis and transfer to this thesis. The
scans in this thesis are shown as the negative image to enhance them.
Poly acry lamíde gel electrop horesís
Digested PCR products were generally resolved on 8% vertical polyacrylamide gels
(29:1, acrylamide:bis ratio). A40% stock solution of acrylamide (29:l; acrylamide:
bis-acrylamide ratio), obtained from Biorad, was diluted in lx TBE buffer, to which
420¡i of a l\Yo solution of ammonium persulfate (Biorad) and 10¡rl of TEMED
(BRL), was added. Bands were visualised by staining the gel in ethidium bromide
(5pg/ml) and subjecting the gel to UV (254nm) light.
2.6.7 Southern blot analysis
Preparatíon of samples
Genomic DNA was prepared and quantitated as described ( 2.6.1 and 2.6.3).
Restriction digests were then performed on the DNA according to the
manufacturers'instructions. Generally, 10pg of DNA was digested with 20 units of
erlzyme in the appropriate buffer for 12 hours (total volume 70¡rl). The restricted
DNA was then concentrated by the addition of li 10th volume 3M NaAc, 2 volumes
of ethanol, and precipitation at -20"C overnight, After centrifugation and washing
67

in70Yo ethanol, the dried DNA pellet was resuspended in 15¡.rl of HrO and 3prl of
6x loading buffer.
Electrophoresis
The digested DNA samples were electrophoresed ina0.9o/o,0.5xTBE agarose gel,
at 40V overnight. The gel was stained with ethidium bromide (O.5pg/ml) and
photographed next to a ruler to allow graphical determination of band sizes later,
The gel was then placed in 0.25M HCI for 20 minutes to depurinate the DNA, after
which time it was rinsed in distilled water in preparation for the alkali blotting
procedure.
Alkalí blottíng p rocedure
A tray was filled with alkali transfer buffer (0.4M NaOH) and covered with a sheet
of glass on which three sheets of Whatman 3MM filter paper were placed to form a
wick. The gel was placed top side down onto the wick and surrounded with cling
film to prevent buffer leakage. A sheet of Hybond N+ membrane (Amersham),
was placed on top of the gel, and th¡ee more pieces of Whatman paper (wetted
with transfer buffer) and a stack of absorbent paper towels placed above. A glass
plate laid on the paper towels and weighted with a 100m1 bottle of liquid ensured
an even transfer from the whole gel to the membrane. The transfer was allowed to
proceed for between three to twelve hours. After blotting, the membrane was
rinsed briefly in2 x SSPE, wrapped in cling film and stored at 4C.
68

Radío-labelling of p ro bes
The Gigaprime DNA labelling kit (Bresatec), was used to label DNA with a-32P-
dCTP (Bresatec) by the random-priming method. Up to 200ng of DNA was
labelled according to the manut'acturer's instructions. The labelled probe was then
isolated from unincorporated nucleotides and primers by placing it on a prepared
Sephadex column, and centrifuging for 6 minutes at 90 x g. The eluate containing
the purified probe was retrieved and used immediately'
P roc edure for membrane hy brídizatío n
Hybridizations were carried out in bottles in a rotary incubator (Hybaid). The
membrane was prehybridized at 65'C for one to five hours in 25mls of
prehybridization mix. Sheared and denatured salmon sperm (100¡rg),was added as
a blocking agent. After prehybridization, 200ng of the labelled probe was
denatured by heating to 1000C for five minutes, snap-cooled on ice, and added to
the bottle. Hybridization was then carried out at 60-65"C for at least 12 hours.
Washìng the membrane
Following hybridization, the membrane was washed twice in 2xSSPE, 0.1%SDS at
room temperature for ten minutes. The wash solution was then replaced with
lxSSPE, 0.1%SDS and incubated at 65oC for 15 minutes, after which time the
counts emitted from the filter were measured. If the counts were between two and
twenty counts per second (cps), the filter was wrapped in cling fìlm and
autoradiographed. Membranes with higher cps were sometimes washed in a high
stringency wash (0.1xSSPE,0.1%SDS), again at ó5oC for fifteen minutes before
autoradiography.
69

Autoradìography
The membrane was wrapped in cling film and placed in a cassette next to X-ray
fîlm (Hyperfilm, Amersham), and exposed at -80oC for a minimum of twelve
hours. The film was then developed using an automatic developer (Kodak
Australia).
Re-use of blots
Membranes could be stripped and re-probed by immersing them in a solution of
boiling 0.5% SDS, and allowing to cool to room temperature. If this method failed
to remove the probe, the membrane was boiled in stripping solution (described in
2.3) for thr.
2.6.8 Purification of PCR products for use in cloning and sequencing
experiments
PCR products for use in cloning or sequencing were either directly purified or
isolated from a low-melting point agarose gel (Progen Australia), before
purification. Primers, nucleotides and non-specific products were removed using
the Wizard (Magic) PCR Preps kit (Promega). To isolate PCR product from
agarose, the desired band was excised and melted at 70C. When the agarose was
thoroughly melted, one ml of Wizard resin was added, and the slurry vortexed for
20 seconds. To purifr PCR products directly, 30-300¡rl of PCR product was added
to l00pl of direct purification buffer, vortexed, one ml of Wizard preps resin
added, and vortexed briefly 3 times over a one minute period. The DNA/resin
slurry was then passed though a Wizard minicolumn attached to a 2ml syringe
(Terumo), after which the column was washed by flushing it with 2mls of 80%
isopropanol (Sigma). The column was dried by placing it in a microcentrifuge tube
70
and centrifuging it for 20 seconds at 12,000 x g. The DNA was eluted from the
column by adding 50¡rl of TE and centrifuging it for 20 seconds at 12,000 x g.
2.6.9 Cloning of PCR products
The pGEM-T vector (Promega) is prepared by digesting pGEM-5Zf(+¡ (Promega)
with EcoRV and the addition of a 3'terminal thymidine to both ends. As Taq DNA
polymerase contains template-independent terminal A transferase activity, this
makes the pGEM-T vector an ideal plasmid for cloning of PCR products, therefore
we chose to use this system for cloning of PCR products.
Preparation of competent cells, transformation and analysis of recombinant
plasmid DNA was carried out essentially as described in Promega's "Protocols and
Applications Handbook", with slight alterations as described below.
Ligation of puríJìed PCR product ínto the pGEM -T Vector
Vector (50ng), and a variable amount of purified PCR product (in a 1:1 - 1:3 molar
ratio respectively) were incubated for 3h¡s at 15oC, in ligase buffer with one Weiss
unit of T4 DNA-ligase enzyme (Promega), in a total reaction volume of l0¡rl. The
reaction was terminated by heating to 72C for 10 minutes.
Preparatíon of competent bacterial cells
XLI-Blue (XLl-B) bacterial cells (Bullock et al., 1987) were used for cloning of
PCR products. A single colony was used to inoculate 5mls of LB (containing
1Opg/ml Tetracycline) and incubated overnight at37"C in a shaking waterbath. Of
the overnight culture, lml was introduced into 25mls of LB (containing
71

tetracycline). The cells were harvested while in the exponential growth phase, as
determined by the optical density at 600nm (0.4-0.6, approximately 2hrs after
inoculation). The cells were then cooled on ice t'or 10 minutes, before they were
sedimented by centrifugation at 3,000 x g (4'C) for 5 minutes. The resultant pellet
was resuspended in 2mls of 0.lM CaClr/2OmM MgClr, and incubated on ice for 1-
2 hours before transformation.
Transformatíon of XLI-Blue cells
The competent cells were transformed with 2pl of ligation mix, or the equivalent
of 1Ong of vector DNA. An aliquot of cells were also transformed with supercoiled
plasmid DNA (eg. pBluescripÐ as a positive control. Briefly, 200¡.rl of competent
cells were placed on ice with ligated DNA and vector. The mix was then incubated
at 42C for 2 minutes in a water bath. The transformed cells were then placed on
ice for ten minutes, then rested at room temperature for a further ten minutes. LB
containing 20mM glucose (900¡rl) was then added, and the cells allowed to recover
at 37oC for one hour. The transformed cells were plated onto agar plates
containing tetracycline (l0¡rg/ml) and ampicillin (5Opg/ml), 0.5mM IPTG and
8O¡rg/ml X-Gal, and incubated overnight at37"C.
A na ly s is of T r ansfo r mants
Standard colour selection allowed white (recombinant) colonies to be
differentiated from colonies not containing parent vector (blue). The colonies were
picked from the plate using sterile toothpicks, which were then used to inoculate
firstly 5mls of LB broth containing tetracycline and ampicillin (20 and 5Opg/ml
respectively), and secondly PCR reaction mix containing universal sequencing
primers (see below). The inoculated cultures were incubated overnight.
72

Screening bacterìal coloníes for recombínant plasmids usíng PCR
The standard PCR conditions described in2.6.4 were used to detect the presence of
recombinant plasmids from freshly picked bacterial colonies, wlth the fbllowing
exception. The amplification reaction was carried out in a Peltier-cooled thermal
cycler (PTC-100, MJ Instruments, USA). An initial denaturation of 5 minutes was
followed by 35 cycles of 94"C for 42 seconds, 55oC for I minute, and 72oC for I
minute. The primers used for this reaction were the universal forward and reverse
pUCAvIl3 sequencing primers (Promega), which span nt 2,944-177 of the pGEM-T
vector sequence. The size of the products were estimated from l.5Yo agarose gels.
Parent vector produced a236bp band, while vector plus insert produced a band of
236bp plus the size of the inserted fragment.
Small scale ísolatíon of recomhinant plasmid
Of each of the overnight cultures, l.5mls was placed in a microcentrifuge tube and
centrifuged at 12,000 x g for I minute. The supernatant was aspirated and the
petlet resuspended by vortexing in 100¡rl of ice-cold lysis buffer (25mM Tris-HCl,
pH 8.0, l0mM EDTA, 50mM glucose). After incubation for 5 minutes at room
temperature, 200p1 of 0.2N NaOFV l% SDS was added and mixed with the cells by
inversion. After incubation on ice for 5 minutes, 150¡.rl of ice-cold potassium
acetate solution þH a.S) was added, mixed by inversion, and again incubated on
ice for 5 minutes. Bacterial cell debris and DNA was then sedimented by
centrifugation at 12,000 x g for 5 minutes and the supernatant containing the
plasmid DNA aspirated and placed in a fresh tube. Bacterial RNA was then
degraded by the addition of DNase-free RNase A (Boehringer-Mannheim), at a
f,rnal concentration of 20p/ml and incubation at 37oC for half an hour. Degraded
RNA and the RNase A were then removed from the preparation by
phenol/chloroform extraction. The solution \À/as extracted once with an equal
73

volume of phenol/chloroform:isoamylalcohol (49:1) by vortexing for I minute
befbre centrifugation 12,000 x g for 5 minutes. The aqueous phase was then
extracted once with an equal volume of chlorofonn: isoamylalcohol (49:l) and
again vortexed and centrifuged. The plasrnid DNA was precipitated by the
addition of 2.5 volumes of ethanol and incubation at -80oC for l0 minutes. This
was followed by centrifugation for 5 minutes at 12,000 x g, and the DNA pellet
was then rinsed withT}o/o ethanol before drying under vacuum. The dried plasmid
DNA pellet was then dissolved in 30¡.rl of sterile water.
Larger scale isolatíon of recombínant plasmids
If plasmids were to be used for sequencing, purification was carried out from a
25ml bacterial culture using Qiagen tip-100 Plasmid Midi-prep kit, according to the
manufacturer's instructions. Briefly, the bacteria were pelleted by centrifugation at
15,000 x g, at 4oC for l0 minutes. The bacterial pellet was resuspended in 4ml of
the supplied buffer Pl. Following the addition of 4mls of the supplied P2 buffer,
the mixture was incubated at room temperature for 5 minutes. A 4ml aliquot of the
supplied buffer P3 (chilled) was added, and the mixture incubated on ice for 15
minutes. Bacterial debris was pelleted by centrifuging the mixture at 30,000 x g, at
4oC for 30 minutes. The supernatant was immediately removed and centrifuged
again (30,000 x g at 4oC for 30 minutes) to pellet any remaining bacterial debris. A
Qiagen tip-100 was equilibrated with 4mls of the supplied buffer QBT. The
supernatant containing the plasmid was then applied to the tip, and the tip washed
twice with lOmls of the supplied buffer QC. The plasmid DNA was then eluted
from the tip with 5mls of the supplied buffer QF, and precipitated with 0.7 volumes
of isopropanol (Sigma), by centrifugation at 15,000 x g at 4oC for 30 minutes. The
resultant DNA pellet was washed with 5mls of cold 70Vo ethanol and air dried
before being dissolved in 50¡rl of TE.
74

2.6.L0 Sequencing
Automatic sequencíng
Sequencing of PCR products was performed at Flinders Medical Centre, Bedford
Park, South Australia on an ABI model 373^ automatic sequencer (Applied
Biosystems). The sequence was read by the software supplied with the sequencer
(version 2.0.15). The sequence was also read manually as the high background
fluoresence of the red label (thymidine), was not taken into account by the program.
Subsequently, bases that were called as "N" by the progrcm could often be resolved
manually.
Denaluration of plasmid templatefor mnnual sequencíng
Plasmid DNA was diluted in 20¡;.J of H2O containing 20¡rg of RNase A
(Boehringer-Man¡heim), and incubated at37"C for 15 minutes. The mixture was
then incubated a fuither 15 minutes with the addition of 5¡.rl lM NaOFV lmM
EDTA. A mini-spin column was then prepared by piercing a 1.5m1 tube with a
needle, into which a small plug of fibre-glass wool was placed, overlayed with
500¡.rl of Sepharose CL-6B (Pharmacia). The column was centrifuged for 3 minutes
at 500 x g, and the DNA mixture then added and the spin repeated; the eluate being
collected in a clean 1.5m1 tube placed underneath the tube containing the column.
An aliquot (7¡rl) of the denatured plasmid was used in the sequencing reaction.
Manual sequencing
Denatured plasmids (4pg) were manually sequenced using the Sequenase version
2.0 DNA sequencing kit (Amersham-UsB), according to the manufacturer's
instructions.
75

Briefly, the denatured plasmid,2¡;.J of the supplied reaction buffer, and 0.5prnol of
the sequencing primer (universal pUCAvll3 forward or reverse sequencing primers
as described in 2.6.9), were brought to a total volume of 10¡.rl by the addition of
dH2O. The primer was annealed by heating the mixture for 2 minutes at 65oC, and
then slowly cooling it to room temperature (20-30 minutes). The reaction was
chilled on ice, and a mixture of 1¡.rl 0.lM DTT, 2¡.rl labeling mix (dGTP, diluted 1:5
just before use), 1¡rl 3sS dATP (l0¡rCi/¡rl and 10¡rM dATP at 1000Cilmmol;
Bresatec), and 2pl of diluted Sequenase Polymerase (diluted 1:8 in the supplied
glycerol enzyme dilution buffer just before use). Primer extension was
accomplished by incubating the reaction at room temperature for 5 minutes. The
reactions were then terminated by the addition of 3.5¡rl of the labeling reaction to
each of 4 tubes (labelled A,C,G and T), containing 2.5¡rl of the appropriate supplied
termination mixes (ddATP, ddCTP, ddGTP, ddTTP, at room temperature), and
incubated at 37oC for 5 minutes. The reactions were then stopped by the addition
of 4prl of the supplied Stop solution. The reactions were concentrated and
denatured by heating them to 95'C with the lids open for a few minutes before
loading 3¡rl per lane onto a polyacrylamide sequencing gel.
Sequencing gels
Sequencing reactions were resolved on 6%o polyacrylamide gels containing 7M
urea. A 40% stock solution of acrylamide (19:1; acrylamide: bis-acrylamide),
obtained from Biorad, was diluted in I x TBE buffer, to which 420¡tl of a I0o/o
solution of ammonium persulfate (Biorad) and 70¡.rl of TEMED (BRt), were added.
Electrophoresis was carried out at 55 watts for 2-3 hours, after which time the gel
was soaked in 5o/o acetic acid, l5Yo methanol to remove the urea. The gel was then
gently attached to Whatman gel drying paper and dried under vacuum at 60'C, The
dried gel was then exposed to Hyperfilm-MP (Amersham) overnight.
76

Cn¿.prERTnnnn
Rnu Cnr,r, SnnoLoGY

3.0 lurnoDucrroN
The A and B antigens of the ABO blood group system are formed by sequential
addition of specific sugars to precursor carbohydrate structures. It fbllows that
changes in A or B antigen expression might be due to any break in this chain of
events. For example, if the precursor H antigen was absent, there would be loss of
A and/or B antigens, regardless of whether or not the ABO gene was expressed. As
the aim of this project was to specifically examine the ABO gene for molecular
changes in patients with full or partial loss of A or B antigens, it was necessary to
determine the presence/absence of the H antigen on red cells from these patients.
The aim of this chapter is to provide essential background to the rest of this thesis,
and to describe difflrculties encountered during this project, that in some ways
explain why the observation of loss of A and B antigens is so rare.
78

3.1 COXSTUCRATIONS AND DIFFICULTIES ENCOUNTERED WHEN COLLECTING
SAMPLES FROM PATIENTS WITH CHANGES IU ABO BLOOD GROUP STATUS
Patients with changes in ABO blood group are relatively rare, and samples are
difficult to obtain for a number of reasons. One major difficulty is that blood group
changes in patients are often not recognized. Changes in blood group antigen
expression are usually characterized by what is termed a "mixed-field reaction"
(mfr). This refers to a partial agglutination of red cells with the appropriate
antibody, implying the presence of cells that do not express the corresponding A or
B antigen. Alternatively, if some of the cells are expressing lower amounts of A or
B antigen, a weak reaction may be seen. In a weak reaction, all of the cells
agglutinate, however the agglutinates are very small and easily disrupted. In most
cases with loss of A or B antigen expression, there is a combination of cells that
appear to express small amounts of antigen, cells that do not express any antigen,
and cells expressing antigen. Weak and mixed-field reactions are rarely reported
and can be difficult to determine, particularly considering the methods routinely
used for ABO blood group typing.
There are two common methods used to determine ABO blood group. In the "tile"
method, one drop of diluted blood is mixed with one drop of any of the commonly
available antisera and placed on a transparent plastic tile over an illuminated box.
Agglutination is easily observed, as is non-agglutination of cells. In Figure 3-1, the
tile method has been used to show various amounts of O blood group cells
combined with decreasing numbers of A group red cells; simulating mixed-field
reactions of varying strengths. Using this method, it is possible for the practiced
eye to determine the presence of as low as 5Yo O cells in 95Vo A red cells.
However, the majority of modern blood transfusion laboratories use the "tube" test.
This is considered to be more sensitive, although my results show that this is only
true in the case of agglutination; a positive result. Briefly, the tube test consists of
79

adding one drop of diluted blood to one drop of antibody. The mixture ts
centrifuged, and the red cell pellet is then gently dislodged, and agglutination
scored on a scale of 1 to 12 (see Section 2.4.3), where a score of 12 represents
complete and strong agglutination.
3.1.1 Evidence that mixed-field reactions are not perceived
Towards the end of the practical work of this thesis, I was demonstrating ABO
blood grouping to another student. As it happened, the sample I chose (patient SR)
exhibited a definite mixed-field reaction with anti-A, but not with anti-B, or anti-
A,B (see Figure 3-2). I immediately contacted the Blood Transfusion Unit at the
QEH, who had also grouped the same specimen. I was surprised to learn that the
unit had scored the sample as 12 for all three antibodies. As always, two staff
members had independently grouped the specimen and both had obtained the same
results. At my request, they again grouped the sample. This time the scores were
12 for anti-B and anti-A,B, and l0 for anti-4. I was assured that I was mistaken in
believing this to be a mixed-field reaction. Later the same day, the sample was
grouped yet again, this time by the supervisor of the laboratory, who scored 12 for
anti-B and anti-A,B, but 6 for anti-A.
These events led me to carry out a small experiment. Btood samples consisting of
30o/o and 50% O blood group cells respectively in A group cells, were scored
blindly by the Blood Transfusion Unit, using the standard methods accepted by the
National Association of Testing Authorities (NATA). The samples scored 12 and'
10 respectively. The sample with the score of 12 (ie. the sample wrth a 70:30 mix
of A:O cells) was unequivocally gtouped as A blood group in this case. In practice,
the sample with the score of 10 (ie. the sample that was a 1:1 mix of O and A cells),
should be further investigated by the laboratory supervisor, however from my
experience this is not always the case.
80

100% A
Patient SR
anti-A anti-B anti-AB
Control A grouP blood
anti-A
Figure 3-2. anti-AB'1 " anti-AB'
compareo wlrHowever, the on for a
further five minutes revealed several larger agglut cells did
not agglutinate at all. These results indiõate lóss of the A antþen, but not the B antigen from the red
cells ofthis patient.
95o/o Ã5o/o O
70Vo A30o/o O
30o/o A70o/o O
50A95o/o O
100% o
A1 red cells were mixed with O
Note that as few as 5% O cells
with that of the control 100% A
cells. In normal A (including Al, A2 and AB) ind ound color is always crystal clear
blue. However in the panetivittr 5% O cells, it can be seen that the background is a slightly "muddy"
off-blue color. The intensþ ofthe blue background decreases as the percentage of O cells increases,
until no agglutination can bã seen in the mixture of 95%o O cells and SYo A cells' The a¡row indicates
the ag$utìnate in the mixture of 30%o AandT}Yo O red cells'
81

The main function of a blood transfision laboratory is to provide appropriate blood
packs for use in a transfusion, and the most important information regarding
transfusions is obtained fiom the cross-match between patient serum and donor red
blood cells. Therefore it is the presence of ABO antigens and the lack of antibodies
in the patient's serum that is of consequence to the blood transfusion staff, as
opposed to our interest in loss of ABO antigens. As these methods are NATA
certified, there is no reason to believe that this is not the case throughout Australia.
A mixed-field reaction does not always indicate loss of ABO antigens from the
patient's own red cells. Although patients are generally transfused with their own
blood group, they may be transfused with several units of O blood in an emergency.
It is therefore possible that blood taken from an A or B group patient transfused
within the last 120 days (the red cell life time) with O blood, may exhibit a mixed-
field reaction. In this case the non-agglutinated red cells would be the donor O red
cells. Patients who have undergone an allogeneic bone marrow transplant from a
different blood group donor could also exhibit a mixed field reaction once the
donor stem cells engraft, the resultant haemopoietic cells mixing with the patients
own cells. It is therefore important to determine the transfusion and transplantation
status of patients' samples.
It is of some interest to note that every time I presented this work at conferences
where personnel from blood transfusion laboratories were present, I was informed
that this phenomenon was not as uncommon as previously supposed. It appears that
weak and/or mixed-field reactions are actually seen at least once a year in most
laboratories but are usually considered ofno consequence.
Given that approximately 50Vo of individuals are O blood group - and therefore
changes occurring at the ABO locus would not be observed by blood grouping
82

methods, and the evidence that mixed-field reactions are rarely reported, the
molecular events that lead to loss of A and B antigens are probably much more
common than has been previously realised.
3.2 PIunrrrs USED IN THIS STUDY
Patient samples reported to exhibit mixed-field reactions or weak antigen
expression, were obtained from several Australian hospitals. Table 3-1 details
these patients, including cytogenetic results, samples obt¿ined, and blast counts in
bone marrow or peripheral blood. Blast, and sometimes white cell counts (WCC),
were used as a crude estimate of the proportion of cells in a particular sample
derived from the malignant clone for the molecular studies. There are however,
significant problems with this method, and these will be discussed in further deøil
in Chapter 4. To the best of our knowledge, none of these patients had received a
blood fiansfi¡sion from a different blood group donor in the three months prior to a
peripheral blood sample being taken, or had had an allogeneic bone marrow
fansplant.
3.2.1 Patients with haematological malignancy and loss of A or B antigens
Fifteen patients with loss of A or B antigen expression and some fonn of
haematological malignancy were obtained for this study. Fourteen had either AML
or MDS, although in the AML patients there was no noticeable clustering to any
particular FAB subtype. One patient had CML. Examination of the age at
presentation of the patients with haematological malignancy revealed two distinct
age groups; 8 of the patients were 35 years old or under, while'l were over 55 (see
Figure 3-3). According to the South Australian cancer registry's report on the
epidemiology of cancer over the last eighteen years (published July, 1995), the
median age atpresentation for patients with AML is 65-69 (range 0 to 85+¡, while
83

for MDS, the median is 75-79 (range 0 to 8S+¡. Excluding the patients with ALL,
CML and two patients with AML and loss of the precursor H antigen (which will be
addressed elsewhere in this discussion), 3 of the 7 patients with loss of A and/or B
antigen expression and AML were aged under 35 at the date of presentation, while
2 of the 4 patients with loss of A and/or B antigen expression and MDS were aged
under 32. Obviously, patient numbers are small, and therefore may not be truly
representative of a large population of patients with loss of A/B antigen expression
and haematological mali gnancy.
Age at presentation of patients with loss of blood group antigen erpression
Age atpresentetion
Figure 3-3. Scattergram showing the age distribution of patients with loss of d B or H antigens and
haematological malignancy. O indicates patients with MDS; A indicates patients with AML; Oindicates patients with AML and loss of the precursor H antigen; I is a patient with ALL and -indicates a patient with CML.
There are no reports in the literature of a correlation between loss of blood group
antigen expression and age at presentation, however most of the studies have
consisted of only one or two patients. By combining data from the literature where
age at presentation was included in the report (Salmon et al., 1958; Salmon et al.,
1959; Gold et al., 1959; Hoogstratenet al., 1961; Salmonet al., 1961; Renton ¿/
al., 1962; Undevia et al., 1966; Ragen et al., 1968; Dreyfus et al', 1969;Bird et al',
100
EO
60
40
20
¡AOAA
AO
o
o
o
o^t^_
84

1976; Kolins et al., 1978; Yoshida et al., 1985;Lopez et al., 1986; Matsuki et al-,
1992) it is possible to determine that of twenty patients with AML or MDS and loss
of A or B antigen, 8 were 38 years old or under at presentation (ages 4,19,20,24,
26,32,35 and 38), and 12 were 45 or older (45, 51, 52, 52, 58,58, 59, 60, 66, 70,
76 and 82). Two cases also had a reduction in H antigen expression (ages 4 and
51). Including our patients (but excluding patients with loss of H), the median age
at presentation of patients with loss of AIB antigens and AML or MDS is 52. It
seems, therefore, that the age distribution seen in our group of patients with loss of
AIB antigen expression and haematological malignancy is reflected in the literature.
As AML and MDS usually affects an older age group, but patients with loss of ABO
antigens seem to be affected indiscriminately of their age, is it possible that antigen
loss is in fact an indication of a different type of disease? It is not possible to
determine from the literature if there are other characteristics of the diseases
suffered by patients with loss of antigen expression that distinguish them from
patients with haematological malignancy and no loss of antigen expression.
3.2.2 Antenatal patients with loss of A antigen expression
Samples from three patients with loss of A antigen expression that had no
haematological malignancy, and who were supposedly healthy, were obtained for
this study. Interestingly, all three of these patients were pregnant. Furthermore,
one of these patients was gfouped at several stages throughout two pregnancies- At
two and five months of the respective pregnancies, the patient grouped as A1,
however at the birth of both children, she grouped as A3. This suggests that loss of
antigen expression in this patient is directly related to pregnancy, as after the birth
of her first child, the patient's blood group retumed to nomral Al. Subsequently,
the mechanism by which loss of antigen expression occurs during pregnancy is
probably not related to changes seen in haematological malignancy.
85

3.2.3 Red cell analysis
From the information provided from the respective blood transfusion laboratories, it
was clear that loss of B antigen expression was due to loss of H antigen expression
in two cases (patients TF and SC). These patients were subsequently excluded from
the rest of the study. However, it is interesting to note that for patient TF, the red
cells that had lost H antigen expression had also lost I (adult) antigen expression.
Furthermore, these cells expressed the fetal i antigen, and also carried fetal
haemoglobin. The cell population in this patient that expressed the B, H and I
antigens, also expressed adult haemoglobin. This suggests that some of the red
cells in this patient had undergone an onco-fetal change; reflecting the expression
pattern of antigens on the red cells from some new borns* .
Two other patients, DH and KN, exhibited mixed-field reactions with anti-A, anti-B
and anti-A,B. The cells that did not agglutinate with anti-A were aspirated, washed,
and mixed with anti-B (as described in Section 2.4.3). Most of the cells
agglutinated, however there was still a population that did not agglutinate. These
cells were then aspirated, and tested against anti-AB. Again, none of the cells
agglutinated; the cells were then tested against anti-H. All the cells agglutinated
strongly with anti-H. These experiments were repeated by taking the cells that did
not react with anti-B in the origrnal grouping reaction. It appeared that in both of
these patients, there were four distinct populations of red cells; A, B, O and
(presumably) AB. This appears to be similar to the case reported by Renton et al.,
1962 (see Section 1.14).
' Expression patterns of the A" B and H antigens in newborns is extremely variable. While red cells
from some neonates may exhibit a very weak reaction with A and B antibodies, red cells from other
neonates agglutinatejust as strongly as red cells from adults (personal experience).
86

Serum transferase activities were measured in the patient WD (Geoff Magfin;
personal communication); activity of the A-transferase was between that of Al and
A2 controls, while B-transferase activity was norrnal. However, the activity of the
H-transferase in the senrm was 20o/o of normal controls. Although this might
indicate that loss of A antigen expression in this patient is due to absence of the
precursor H antigen, normal agglutination of red cells was seen with anti-B,
implying that there was sufficient precursor available. As discussed in section 1.16,
senrm transferase activities are not a reliable indicator of membrane transferase
activities, and decreases in senrm H-transferase occur in the majority of leukaemic
patients while loss of A and B antigens are relatively rare.
Auto-antibodies directed against the A antigen were detected in the serum of
patients MR and GN. One might propose that loss of the A antigen occurred first,
and due to constant exposure to intestinal flora that expresses AJike antigens, the
patients developed A-antibodies, because the A antigen was no longer recognised as
"self'. Alternatively, it might be proposed that the patients developed the auto-
antibodies first, and therefore selected against red cells expressing the A antigen.
Patients with concurrent loss of A or B antigens and reduced red cell adenylate
kinase 1 activity have been described in the literature (see Section 1.20). We were
able to obtain samples from one such patient, who was described by Marsden et al.,
1992. AKI activity was not measured in any of the other patients in this study.
3.2.4 Cytogenetics
Finally, one last item of important information can be gained from Table 3-1. None
of the patients have any changes affecting chromosome 9, much less 9q34, as
determined by cytogenetics. The only exception to this is the patient CG, who had
87

the Philadelphia chromosome characteristic of his disease (CNtr-). In this case, it is
interesting to note that the patient at one stage had two distinct leukaemic clones.
At presentation, cytogenetics revealed only one Philadelphia chromosome.
However, by 2lll2l91, approximately 50Yo of metaphases had one Philadelphia
chromosome, while the remainder had two Philadelphia chromosomes, (and a
normal chromosome 9). The sample we obtained from this patient was dated
9112193, nearly two years after this finding. As no cytogenetic data was available
for this date, the assumption was made that the new clone had completely replaced
the original leukaemic clone by this time. As the ABO gene is located distally to
the ABL gene, it is translocated with the distal end of the ABL gene to chromosome
22 to form the Philadelphia chromosome. Therefore, it was concluded that the
patient CG had three copies of the ABO gene per leukaemic cell.
3.2.5 Quality of samples
Progress on this project was seriously hampered by two major factors. Firstly, it
was diffrcult to obtain more than a couple of million cells from each of the patients
from other hospitals. The second major problem was the quality of the samples
when we received them. Most of the samples were sent to us by courier on dry ice,
however couriers "lost" the packages for anything from a few hours to several days.
In one case (CG), whole peripheral blood samples arrived in our laboratory 14 days
after the blood was taken from the patient! It was also diffrcult to obtain remission
or other samples from these patients, as in all the cases the patient either declined
further treatment, left the country, underwent an allogeneic transplant, or died'
88

T¡ble &1. Det¡ils of patients with loss of A or B rntigens obt¡ined for this study. When red cells were available from the patients, blood grouping was
performed to coofirm and sometimes add to the information zupplied with the sample (indicated by *).
Source
Elaine Batchelder,St. Vincent'sHospital, Fitzroy,Victoria.
Rick Tocchetti,Institute forMedical and
VeterinarySciarce, Adelaide,
South Australia.Dr. GeorgeKannourakis,Royal Children'sHospital,Melbourne,Victoria.
Samples obtained
B]ù'-{613189
670lo erythroblasts
BM27l9l92
þresentation)19% blasts38% erythroblasts54YoCD34+
BM2U8l92All cell lines showed
abnormalmorphology; blastcells 5.8%;promyelocytes 15.6Yo
PB 419192
neutrophils and
lymphocytes low,monocytes normal
BM l511193 (post-transplant), remission.
Details
The patient was previously bloodgrouped as d but on6l3l89 there was a
mfr with anti-A (approx. 12%ó cellswereA negative). The direct Coombs test
revealed the presence ofan auto-antibody.
\rye¿k A2 antigen expression.
Agglutination of the red cells with U/ereuropaeus lectin scored 9, as opposed tocontrol cells which scored 0 (Al), I (42)and 12 (O). The patient's diseaseprosressed to AML M23113193.At presentation the patient's blood group
was Al. By July, l992,the patient'sgroup was O by forward typing, A byreverse grouping. Auto-antibodiesappeared to be present as the patient
exhibited a reaction to A group blood.The patient rec¿ived a bone malTo\¡t
transplant from an O blood group donoron9l9l92.
Cytogenetics
B}',{6/3189,14115metaphases
46,XY,del(2o)(ql l)
BM46 XY,no. ofmetaphasesscored unknown
PB, l r/4/88,l5l15 metaphases
46,)O(BIù.d28lv92,7l7metaphases
45,W\-7BM 2316192,
34134 metaphases
45,W\-7
Diagnosir
RAEB
RAEB
MDS
Age atPresenf¡tion
57
3l
l0
D¡te ofBirth
2ltv28
t6l5l60
t3lt2l77
Se¡
M
M
F
Petient
MR
AN
GN
89

Table 3-lSource
Dr. RE Sage,
The QueenElizabethHospital,Woodville, SouthAustralia.
GeoffMagrin,Alfred Hospital,Prahraq Victoria.
Elaine Batchelder,St. Vincent'sHospital, Fitzroy,Victoria.
Elaine Batchelder,
St. Vincent'sHospital, Fitztoy,Viaoria.
Samples obtained
Whole PB (frozen).t0/t2l9lcase notes
unavailable.
BM2lsl9073% er¡hroblasts,l8% blasts.
BlM7l3l89> 85Yo
blastsPB lllll9l >85o/o
blastsPleural effi¡ssionl5lll9l - mostlyleukaemic cells.
PB t8l2l89>35% blasts
Details
The patient's red cells exhibited a mfrwith anti-Al. Both cell populationsagglutinated strongly with anti-H. The
patient succumbed to the disease
aooroximatelv one month later.
Red cells separated into two distinctpopulations, B and O. The B cells wereH and I positive, while the O cells wereH and I negative, but i positive. The Bcells had adult haemoglobin, howeverthe O cells canied fetal haemoglobin.
The patient had thromboc¡openia since
age 3. It is not clear when the patient's
red cells first exhibited a mfr with anti-A.The cells were separated into A+ and A-populations; both populations expressed
the H antigen+. By late 1990, the cellsgrouped as O.
Weak A-antigen expression.H antigen status unknown.
Cytogenetics
BIôll9lt2l9t,2 metaphases
46,).]Yl2lmetaphases
45.XY.-7B,]Ù'l315190,29129
metaphases
46,)O(,del(20)(q13. l).
46 XYthroughout thedisease exceptB,i[''{2216190,
8ll5 46)fY;411545 XY -7;311545).Y,-7t(12;X)(pl3;pl l)
Bi0'lr4HE9l5l19 metaphases
46,W.. 2
metaphases had
45 chromosomes,while 2metaphases had
44. Thehypodiploidy wasnon-clonal.
AML Ml
Diagnosis
AML M6
AML M6
AML M2
35
Age atPresentation
24
34
l9
DOB
t0/t167
t9lv56
3l3l6t
t9s4
Sex
M
F
M
F
Patient
PM
TF
NR
MA
90

Table 3-l
The QueenElizabethHospital,Woodville, SouthAustralia.
Source
Dr. KathrynMarsder¡Universþ ofTasmani4 Hobart,Tasmania.
PB t7l8l9494% blasts.
Samples obtained
PB91618997o/oblasts.
Detsils
The patient presented with primary
acquired sideroblastic anaemia whichevolved into AML with er¡hroidfeatures. In July 88,5OYo ofher red
cells grouped as Ñ,5ú/o as O. Red cell
H antigen expression was noÍnal,however serum A blood grouptransferase activity was low. In August1989, red cell adenylate kinase I activitywas 66IU/glIb (normal range220-340ru/gHb). One mono-clonal anti-
body ofseveral tested revealed that the
patient's red cells expressed the Lewis Bantigen; onlhe l4l7l88 the patient was
Le (a-b-), however on the 5/12188, the
tlæe was Le (a-b+) (Marsdenet al.,1992\.
On the l8l2l93 the patient presented fora routine surgical procedure, at whichtime she grouped as normal AB.However, when the patient presented in1994 with AML, her red cells showed a
mfr with anti-A but not anti-B or anti-
dB. The cells expressed the H antigen,
but did not agglutinate wtth DolichosbiÍlorus lectin*.
Cytogenetics
BM lE/3/88,l3l19 metaphases
a6,)oÇt(l;3)þ36;q2l)6/19 metaphases
a6,)oÇt(l;3)þ36;q2l),t(14;17)(q32;q2l').BM April, 1989
l5l15 metaphases
46,)OÇt(l;3Xp36
;q2l),t(la;17)(q32;q2t).
20120 metaphases
46,Ð(.AML M3
Diagnosis
AML MO
Age atPresentation
73
'n26/5123
DOB
l9l3
F
Sex
F
SR
P¡tient
WM
9t

Table 3-lSource
Helen Haysom,
Royal MelbourneHospital,Melbourne,Victoria.
GeoffMagrin,Alfred Hospital,Commercial rd.,
Prahran, Victoria.
Peggy Nelson,
Royal PrinceAlfred Hospital,Camperdown,New SouthWales.
Samples obtained
PB 9lt2l93wCC 125 x loe/I,50% blast cells.
PB26lltl87case notes
unavailable.
B][l2tl6l93case notesunavailable.
Details
25-30Yo of the patient's red cells
agglutinated with anti-A. The patient's
red cells expressed the H antigen,
however the agglutinates were easily
disrupted. It is possible that this was
related to the fact that the cells were
received by our laboratory 14 days afterphlebotomy*. Blast crisis occurred inApril, 1993.
The patient's red cells exhibited a weakreaction with anti-A, but a normal
reaction with anti-8. Serum transferases
were measured, and revealed normal
levels ofthe B transferase, but the level
of the A transferase was between normal
Al and 42. Serum H transferase activity
was20%o of the normal controls.
The patient's red cells exhibited a mfrwith anti-B. The unagglutinated red
cells did not agglutinate with anti-H.
Cytogenetics
BM l7ll/8sl2l12 metaphases
46,YY,t(9;22)(q34;ql l).BIû''{2vt2l9tI l/24 metaphases
46,YY,t(9;22)(q34;qtr)lt3l2448,XY +8,
t(e;22)(q3a;ql l)+ der(22)t(e;22)G3a;qI t).
BM s/ll/872/2 metaphases
46,Ð(..
BM 8/3/939/9 metaphases
46,XY.
Diagnosis
CML
ALL LI
AML M?
Age atPresentation
l3
23
62
DOB
28lttl72
unknown
2319129
Sex
M
F
M
Patient
CG
WD
SC
92

Table 3-lSource
Rick Tocchetti,Institiute forMedical and
Vetinary Science,
Adelaide, South
Australia.
Elaine Batchelder,
St. Vincent'sHospital, Fitzroy,Victoria.
Pam Pussell,
Institute ofClinical Pathologyand MedicalResearcl¡,rvVestmead
HospitalWestmead, NSW2145.
Samples obtained
B,]Ù'dsl7l94
30% myeloblastsl8% erythroblasts
PB t5l6l92wcc 13.7,
77%oblast cells.
PB t6ll2l94wcc 12.l72%oneuttoPhils, l0%lymphocytes and 18%
monocytes.
Details
The patient's red cells exhibited a mfr
with anti-d anti-B, and anti-dB. There
was no reaction with Dolichos bifloruslectin. Agglutination with anti-H was
strong (score 5, comPared to I for a
normal AB control). The cells were able
to be separated into 3 distinct
oopulations; A, B and O*.
The patient's red cells exhibited a mfr
with anti-A anti-B, and anti-AB. Three
distinct red cell populations could be
distinguished; A B, and O. The red
cells expressed the H antigen+.
No diagnostic ma¡rolv was taken due tothe patient's age. No detectable A-antigen was on red cells, however there
ìva{¡ no anti-A in serum, and the patient
secretes normal anounts of soluble A-antigen. The patient's red cells express
H-antigen and were able to absorb and
elute anti-A
Cytogenetics
BIùl7l94,46)c{.
B,Ir|ll2815192,
35/35 metaphases
46,YY
not done
Diagnosis
AML M2
AML MI
Suspected
MDS
Age atPresentation
62
74
87
DOB
2418132
22lLlt8
30t9107
Sex
F
M
M
P¡tient
KN
DH
BÀ
93

Table 3-lSource
David Roxby and
Alec Morley,Flinders MedicalCentre, BedfordPa¡k, SouthAustralia.
Samples obtained
PB 30/6/89No abnormalities inperipheral blood;alterations consistent
with pregrancy.
Details
Blood grouped as normal A 219187,
with no anti-bodies detected. On the
614188 the patient underwent a caesa¡ian
section, and required a bloodtransfusion. At this time she grouped as
42, with some anti-Lea detected in her
sen¡m and was transfused \ilith 42, L€a
negative blood. On the 2214188 thepatient was grouped as A3 and once
again anti-Lea positive. The patient was
again blood grouped on the l/2/89, at
which time she was once again ¿ normal
Al and had no anti-bodies in her serum.
The cell blood picture was normal. On
the 30/6/E9, the patient again presented
for another caesarian section, and again
typed as Ax/43. This time she was
transfused with A! Lea- blood. Bloodcollected on the 30/6/89 was also
grouped agair¡, 4 days later by another
techniciar¡ who this time grouped it as
O. In our laboratory incubation withanti-A or anti-AB for l0 minutes at
room temperature revealed weakagglutinatioq however all the
aggregates were very small, and easily
disrupted. The cells stronglyagglutinated with anti-H*. The patient's
saliva contained H-substance, but no Asubstance.
Cytogenetics
Not done.
Diagnosis
Pregnant
Age atPresent¡tion
34
DOB
1953
Sex
F
Patient
GB
94

Source
David Petersen,
The QueenElizabethHospital,Woodville, SouthAustralia.
David Petersen,
The QueenElizabethHospital,Woodville, SouthAustralia.
Samples obtained
PB t9l8l94Blood film did notindicatehaematologicaldisorder.
PB t6/3194Blood film did notindicatehaematologicaldisorder.
Details
Previously grouped as B, now groups as
A2B+. The Kleihauer test showed no
fetal blood contamination. We wereasked to determine if this patient had
acquired the A-antigen.
This patient was detected during routineblood grouping of ante-natal patients.
Previously she had grouped as normalAB (June, 1992). On the 1613194 thepatient's red cells agglutinated normallywith anti-B and anti-dB, however there
was a mixed-field reaction with anti-A.Agglutination with Dolichos bifloruslectin was absent, suggesting no Alantigen on the patient's cells*. The
Kleihauer test confirmed the absence offetal cells in the maternal blood.
Cytogenetics
Not done
Not done.
Diagnosis
Pregnant
Pregnant
Age atPresentation
3l
l9
DOB
1963
t975
Sex
F
F
P¡tient
SK
rrt
95

Suprn¡¡.nv
Bone marrow or peripheral blood samples from eighteen patients with loss of A
and/or B antigen expression were collected from hospitals around Australia. Of
these, fourteen had AML or MDS and one had CML, reflecting the bias of patients
with loss of ABH antigens to the myeloid malignancies, and in particular to AML
that is seen in the literature. Two patients that had loss of B antigen expression,
also had loss of the precursor H antigen expression, and were subsequently
excluded from the rest of this study. Of the patients with haematological
malignancy, there seemed to be an over-representation of individuals under the age
of 35, compared with the median age at presentation for AML and MDS, which is
65'69 and 75-79 respectively. The abnormal age distribution seen in our group of
patients is reflected in the literature, suggesting an as yet unknown relationship
between loss of antigen expression and disease.
Interestingly, although the ABo gene is located on ch¡omosome 9, none of the
patients with loss of ABO antigens and AML or MDS had any cytogenetic changes
involving ch¡omosome 9. However, the patient with CML had two copies of the
Philadelphia chromosome, and one normal chromosome 9, indicating that there is
probably three copies of the ABO gene per leukaemic cell.
Two of the patients with AML had been previously grouped as normal AB, but
during their disease exhibited three distinct populations of red cells simultaneously;
A, B and O. Presumably a fourth population of AB cells was also present, but our
blood grouping techniques could not conclusively prove this. This suggests that
multiple clones of red cells are present in these patients, and that there is some form
of selection occurring against the ABo gene, or possibly a closely linked gene.
96

Three patients with loss of A antigen expression supposedly had no haematological
malignancy, however all three were pregnant. One of these patients was grouped
throughout two pregnancies. The patient reverted to normal blood group A after
her first pregnancy, but at the birth of her second child, she again exhibited loss of
A antigen expression. It therefore appears that pregnancy somehow influences A
antigen expression, and that loss of antigen expression during pregnancy is probably
not related to that seen in haematological malignancy.
The ensuing chapters of this thesis detail a molecular analysis of the ABO gene rn
patients with abnormal A/B antigen expression.
97

Cu¿.prERFoun
GnNoTYPING TIrE ABO Locus

4.0 [NrRonucrroN
Classical methods for ABO genotyping rely on a combination of red cell serology
and family studies. These methods were not appropriate for this study as they are
limited by the availability of family members, and are restricted to typing of red
cells. Even if family members are available, the genotype of a particular individual
can not always be determined. The major aim of the experiments contained within
this chapter was to develop a sensitive method for ABO genotyping directly from
DNA, and to subsequently examine patients with haematological malignancy, both
with and without blood group changes, for loss of heterozygosity at the ABO locus.
99

4.1 DTvtIoPMENT oF A SENSITIvE METHOD F.OR MOLECULAN ABO GENOTYPING
At the beginning of this study two methods existed for molecular genotyping of the
ABO locus. Both were described by Yamamoto et al. (1990b). The flrrst method
involved Southem blot analysis of genomic DNA, while the second was a multistep
method entailing PCR, restriction endonuclease digestion, blotting and hybridisation
wth radio-labelled probes. These methods were considered unacceptable for the
present study for several reasons. Southern blotting requires large amounts of intact
genomic DNA (typically lOpg or more per lane). As only limited amounts of DNA
was available from patients exhibiting blood group changes, Southern analysis was
not a viable option for genotyping. The PCR method described by Yamamoto et al.
(1990b), is time consuming, requires lpg of target DNA, and involves the use of
radio-active nucleotides. Therefore the aim of this set of experiments was to
develop a rapid and reliable method for ABO genotyping that was sensitive enough
to avoid the use of radio-active probes.
4.1.1 Rationale
Analysis of the primers used by Yamamoto et al. (1990b), revealed markedly
different melting temperatures (Tms) within the primer sets, which results in
inefficient amplification of the target DNA. It was not possible to alter these
primers, as they were based on unpublished intron sequences. Subsequently,
completely new sets of primers with matched Tms were designed, based on the
published cDNA sequence (Yamamoto et al., 1990a;b).
As the intention was to amplif, genomic DNA and only the oDNA sequence was
available for the gene, an attempt was made to determine intron/exon boundaries
using consensus splice sites (Shapiro and Senapathy, 1987). The consensus splice
junction sequence for oDNA is 5'AGG 3', which theoretically occurs approximately
once in every 64 base pairs of random sequence. Nevertheless, two sets of primers
100

were designed flanking (1) the site at 261 which distinguishes the O, and A/B
alleles, and (2) position 703, which differentiates the B and O/A allelesr.
Theoretically, the three major alleles could be distinguished by restriction enzyme
digestion of the two amplified products (see Figure 4-1). To avoid ampliffing intron
and therefore unknown sequence (and possibly too large a region to ampli$r), the
primer sets were designed to amplifu small regions of DNA, containing as few AGG
sites as possible.
26r 703
O allele
A allele
B alleleBstEII Alul
Figure 4-l Diagrammatic representation of the three major ABO alleles. Two fragments spanning
poiitions 261 and 703 of the cDNA sequence are amplified by PCR. Each allele can be differentiated
by its unique pattern ofrestriction sites.
I This method for ABO genotyping has since been published (O'Keefe and Dobrovic, 1993). At this
stage however, all base pair numbering was based on the published cDNA sequence (Yarnamoto el al.,
1990a;b); the single base pair deletion in the O-allele was at nt 258. Since that time Yamamoto has
published a review on the molecular genetics of the ABO blood group (Yamamoto, 1994). He states
lhat the sequence published in the 1990 paper was based on a cDNA clone, FY-59-5, which unlike
most At alleles, lacks the trinucleotide TAG at position 240-242, This sequence is however, present
in genomic DNA, and Yamamoto suggests that the absence of these three residues in the cDNA may
be due to alternative splicing or a splicing error. Consequently, the new numbering is used tkoughoutthis thesis, however numbering in our paper is based on the originally published sequence.
101

4.1.2 Materials and Methods
A multiplex PCR reaction in a total volume of 75¡rl was performed on l00ng of
target DNA, using l00ng of each of the following primers under the conditions
described in section 2.6.4.
AOI 5' TGACACCGTGGAAGGATGTCCTCGT 3'
AO2 5' TGAACTGCTCGTTGAGGATGTCGA 3'
AB1 5' CGCATGGAGATGATCAGTGACTTC 3'
AB2 5' GCTCGTAGGTGAAGGCCTCCC 3'
(sense)
(anti-sense)
(sense)
(anti-sense)
Diagnostic restriction enzyme digestions were performed for 10-16 hours on four
10prl aliquots of each PCR product using 7 units of KpnI, BstEII, Msp I (all from
New England Biolabs), and Alu I (Boehringer-Mannheim), in a total volume of
14¡.11, according to the manufacturer's instructions. The restricted products were
then resolved on 8% polyacrylamide gels (see Section 2.6.6) and stained with
ethidium bromide in order to visualise the bands.
4.1.3 Results and Discussion
Two regions of the ABO glycosyltransferase gene are amplified, each containing a
diagnostic restriction enzyme site (Fig. 4-l). Primers AOl and AO2 ampliff the
region from nt 230-328 of the published oDNA sequence. They utilise the
polymorphic KpnI and EsrEII sites to differentiate the O allele from A and B alleles,
and generate a product of either 98 or 99bp, depending on whether or not an O allele
is involved (although this size difference was not resolved on either acrylamide or
agarose gels). The second pair of primers are termed ABI and AI|2, and amplifo a
181bp product (nt 562-742). Digestion of this product with MspI and HpaÍI
distinguishes the A and O alleles from the B allele. All four primers were designed
with melting temperatures matched to within 3.5oC to allow multiplex
r02

amplification, and therefore facilitate rapid screening of large numbers of genomtc
DNA samples. PCR conditions were varied to allow optimal amplif=rcation of both
products within the multiplex reaction.
Each ABO genotype has a unique pattern following digestion of the multiplex
product (Table 4-1, Fig. 4-2,Fig.4-3). The success of this method was tested by
applying it to 40 (non-randomly selected) DNA samples from healthy individuals, of
known blood group; 14 O, l0A, l0B, and 6A8 blood group individuals.
ABOgenotvpe
Kpnl BsfEII Mspl Alul
oo 181,67 181,98 140,98 181,98
AA 181,99 181,68 140,99 181,99
AO l8l,99,67 181,98,68 140,98199 181,98/99
BB 181,99 181,68 159,99 140,99
BO 181,99,67 181,98,68 159,t40,98199 181,140,98/99
AB 181,99 181,70 159,140,99 181,140,99
Table 4-1 Pattern of restriction fragments (sizes in base pairs) visualised after digestion of the
multiplex PCR product.
103

r90
147
I r0/ul
b/
M undoo AO AA
Figure 4-2. ABO genotyping. Diagnostic restriction enzyme digestion of multiplex PCR amplified
productyields a unique pattel'n of bands for each of the genotypes; OO, AO and AA. Lanes 1,5 and
9 a¡e PCR ploduct that has been digested with KpnI;2,6 and l0 are Bs¡EII digests; 3,7 and I 1 are
MspI digests; 4,8 and 12 are AluI digests. Multiplex PCR ptoduct before digestion is indicated by
"und". The marker (M) is pUClg plasmid digested with HpaII; Sizes of the lelevant marker bands
shown are in base pairs.
123456789101112
123456789101112
190
147
110/l l l
67
MBO BB AB
Figure 4-3. ABO genotyping. Diagnostic restriction enzyme digestion of multiplex PCR amplifiedproduct yields a unique pattern of bands for each of the genotypes; BO, BB and AB. Lanes 1 ,5 and 9
are PCR product that has been digested with KpnI;2,6 and l0 are BsIEII digests; 3,7 and 77 are Mspl
digests; 4,8 and 12 arc Alul digests. The marker'(M) is pUC19 plasmid digested with I1pøII. Sizes
of the relevant marker bands shown are in base pails.
t04

To ascertain if this method was applicable to the Australian aboriginal population,
96 DNA samples from a population of Central Australian aborigines kindly
provided by Professor Boettcher of Newcastle University, NSW, were analysed.
The results are shown in Table 4-2.
ABO genotype
Blood oo AO AA
O (n:43) 43 0 0
A (n:53) I 42 10
B (n:o)
Table 4-2 Blood group versus ABO Genotype of an Australian aboriginal population. Aboriginals ofB blood group are extremely rare, and none were found in this particular population (pers. comm.
Professor Boettcher).
The use of complementary pairs of restriction enzymes to control for incomplete
digestion is necessary for unequivocal genotyping. For example, to type O, the PCR
product is digested with both KpnI andBstEII. Normally, cutting vath KpnI alone is
suffrcient to type the O allele. However if digestion were to be absent or
incomplete; OO, AO or BO individuals could be falsely q/ped. The use of BsrEtr
controls for absent or incomplete KpnI digestion. Where there is no KpnI digestion,
there should be full BsTEII digestion.
An analogous situation holds for MspI and Alul digestion at position 703. Here, the
use of both enzymes is important as the MspI digested product in Binon-B
heterozygotes consistently has a markedly more intense upper band, resembling
incomplete digestion (Fig. 4-3, lanes 3 and 11). Alternatively, digestionwith AIUI
approximates the expected l:l ratio.
As a control for MspI cutting, the AB2 primer (anti-sense primer) was positioned so
that it contained another MspI site,lgbp downstream from the diagnostic site. The
105

primer site cuts completely even though the diagnostic MsTrI site is cut less than
expected 50% in B/non-B heterozygotes. In samples that are homozygous f'or the
diagnostic MspI site (OO or AA or AO), complete digestion is typical (Fig 4-2, lanes
3, 7 and, 1l) at both sites. Identical results are obtained with increased
concentrations of MspI or with the use of the MspI isoschizomer, HpaII (data not
shown). Therefore the apparent incomplete digestion of the non-B allele in
heterozygotes is not due to insufficient enzyme.
Incomplete digestion in heterozygotes can be explained by the presence of a
proportion of heteroduplexes with one strand containing the MspI recognition site
and the other lacking the recognition site. Different restriction enzymes appear to
be adversely affected by heteroduplex formation to different extents. This point is
accentuated by the fact that Alul digested products from heterozygous BO and AB
individuals yields an approximate l:1 ratio (Figure 4-3, lanes 4 andl2). However,
after these characteristics are taken into account, the correct genotype can be readily
deduced.
After this method was established, two other laboratories published ABO
genotyping methods. Uggozoli and Wallace (1991), presented an elegant method
using 8 primers in a multiplex PCR approach. However, this method required the
use of radio-labelled probes to detect specific signal. Chang et al. (1992),
independently developed a PCR based method similar to ours, yet it varies from our
method in two important respects. We use a multiplex PCR approach which is the
method of choice when samples and time are limited. Our method also uses
complementary pairs of enzymes to eliminate the assignment of incorrect genotype
as a consequence of incomplete or absent digestion, whereas Chang et al. (1992)
carry out two separate amplif,rcation reactions, and digest only with KpnI or MspI.
106

One would assume that each of our primer pairs are contained within the same
exons, as the PCR products are of the correct size as predicted from the cDNA
sequence. A recent paper (Yamamoto et al., 1995), describes the intron/exon
structure of the gene. Surprisingly, the primer AOI encompasses an intron/exon
boundary.
AOI ABI\
5r 3rry vt
203 239 S374 \- 1065
Ao2 AB2
Figure 4-4 Schematic representation of the genomic structure of the ABO gene beginning from intron
4, modified from Yamamoto et a1.,1995 to include the positions of the ABO genotyping primers. The
boxes represent exons, the solid bars introns, and the dashed line unlnown sequence. The (coding)
exons are numbered; Roman numerals identify introns.
As the primer AOl is designed from nt 230-257 of the oDNA sequence, 9 base pairs
could not bind to the genomic DNA (Figure 44). Furthermore, when this primer
was designed, the TAG sequence in the O, B and conrmon A1 alleles was not
known. Subsequently, this primer probably anneals poorly to the target DNA at this
site, forming a structure as showl in Figure 4-5. This may explain the poor
amplification of the 98/99bp product in the multiplex PCR relative to the 181bp
fragment amplified by primers ABI and AB2.
230primer AOI 5' TGACACCGTGGAAGGATGTÇÇTÇG'T 3'
ABo sequenc. L t sc arr"å¿ll¿¿l+¿+¿J+JJ+
Figure ,l-5. Probable structure formed by primer AOI and the known genomic sequence of the ABO
g;". Th. bold type in the primer represents sequence now known to be contained in exon 5, whilst
ih" ,..t of the primer is derived from exon 6. The extra trinucleotide TAG now known to be part ofthe real Arl}tli cDNA sequence is represented by bold type, while the lower case letters represent the
published intron 5 sequence.
As this information \¡/as published subsequent to the completion of the experimental
work of this thesis, a new primer was not designed to replace primer AOI'
107

However, although this sequence data does explain the less efficient amplification
ofthe 98/99bp product, our conclusions are not afïected.
Although this technique reliably predicted the blood groups of 40 healthy
individuals, a single discrepancy in the Australian aboriginal population was
detected. As shown in Table 4-2, one individual genotyped as oo, yet the blood
group of this person was supposedly A. This result was repeatable, and may be
explained by a simple sample mix-up at the point of collection of the blood.
Alternatively, a number of complex hypotheses could be proposed to explain this
result (ie. alternative splicing of the O allele to produce a functional A transferase).
However, no other samples (either DNA or RNA), were available from this
individual, and therefore this matter could not be investigated any further.
4.2 AB,O cnNoryprNc oF pATTENTs \ryrrH MALTcNANcy
The aim of this set of experiments was to use the ABo genotyping method
described above, to compare the ABo genotype with blood group data in three
major goups of patients. The first group of samples were from patients who had
presented at the QEH over the last I years, and included patients with a wide range
of haematological malignancies. This group also included patients with colon
carcinoma. It was hoped that this comparison might lead to some discrepancies
between ABO genotype and the patient's reported blood group, which could increase
the number of patients with loss of blood group antigens for this study. The second
group of samples the ABO genotyping method was applied to were those supplied to
us from other hospitals from patients with haematological malignancies and
observed loss of blood group antigen expression. The third group consisted of
"normal" individuals, which during routine blood grouping procedures exhibited
108

mixed-field reactions or were described as having "acquired antigens". These
particular patients were all pregnant, but were presumably healthy.
4.2.1 Nlaterials and Methods
Specimens taken at presentation of the patients with haematological malignancy
were used where possible. If mononuclear cells from bone maffow aspirates were
not available, peripheral blood mononuclear cells were analysed. DNA samples
from histologically normal mucosa adjacent to colon tumours, and whole tunìour
specimens were kindly provided by Wendy Hart from the Dept. of Gastroenterology
at the Queen Elizabeth Hospital.
Genotyping of patients AN, GN, MR, MA, CG and PM that had loss of A antigen
expression was carried out on 2-5¡i of DNA isolated as described in Section2.6.2.l.
As DNA isolated by this method is contaminated by RNA, no attempt was made to
quantitate the sample. Furthermore, amplification of DNA from all the patients
with abnormal antigen expression and the corresponding normal controls was
carried out for 45 cycles, as opposed to 35 cycles that was used for the original
technique. Each sample was amplified on at least 3 separate occasions; a multiplex
reaction was carried out the first time but on subsequent occasions only the 181 or
the 98/99bp band was amplified to allow more efficient ampliflrcation of the
particular target (this was really only necessary for amplification of the 98/99bp
band; amplification of which was inhibited due to competition wrth the 181bp
fragment as described previously).
4.2.2 Results and Discussion
4.2.2.1 Patients with malignancy
Eighty-five patients with haematological malignancy were randomly chosen for this
study. The blood groups of the patients appeared to represent the normal
distribution, in that 505% were O, 36.4% were A, 9.4%owere B and 3.50á were AB.
109

Comparison of blood group and ABO genotype revealed discrepant results in three
patients (all patient details and results are tabulated in Appendix A, Table 1). Of the
3l patients whose blood group was A, 23 genotyped as AO, while 8 were AA.
Therefore the genotype of all A group people agreed with their blood Broup, as did
the genotype of the 8 patients whose blood group was B (7 BO and 1 BB), and the
three patients whose blood group was AB. However, of the 43 patients whose blood
group was O,3 did not genotype as OO.
One patient (RR), was examined at 6 different stages of disease (ALL). The
presentation specimen genotyped as normal OO, in accordance with the patient's
blood group. However, in remission, the patient genotyped as AO, although
compared to normal AO samples, there was virtually no O allele. Again in relapse,
the patient genotyped as normal OO. This problem was resolved by examination of
the patient's case notes, which revealed remission was induced by an allogeneic
transplant from the patient's sister. Cytogenetic analysis revealed that in remission,
the (male) patient's bone marrow had 29130 )O( metaphases, with one XY
metaphase. This suggests that the transplanted marrow had engrafted and replaced
the patient's own bone ma¡row. Presumably the sister, who was A blood goup,
genotypes as AA. These results revealed another use for the ABO genotyping
method; that is detection of engraftment of an allogeneic malrow.
The two other patients with discordant serology/genotyping results were MCG and
DN. ABO genotyping clearly showed a normal AO genotype, but both patíents were
unequivocably blood group O, Fortunately, blood group results on patient MCG
from 16 years previously were available; at which time the patient's blood gfoup was
also O. At this time, (the first report of an 02 allele had not been published), these
patients were retained as candidates for loss of ABO antigens to be analysed at the
RNA level.
110

It should be considered that these experiments may not have detected some patients
with loss of ABO antigens. If loss of antigen expression was due to physical loss of
one or both alleles of the ABO gene, and the proportion of leukaemic cells in the
sample analysed was sufficient to mask the contribution of normal cells, and the red
cells were also affected by this change (that is, mature red cells were derived from a
malignant stem cell), then perhaps some patients with loss of antigen expression
would have been overlooked.
An effort to determine the proportion of leukaemic cells in each of the 85 samples
examined was made, however it was discovered that this was virtually impossible
for the majority of patients A significant number of the blood and bone malrow
samples that had been sent to our laboratory had not been analysed using the
differential cell count that might have given an indication of the number of
leukaemic blast cells in the sample (for peripheral blood samples), or in the case of
bone marrow specimens, the specimen was considered to poor to examine. In the
cases where differential cell counts or bone malrow reports were available, it was
stitl impossible to determine the number of leukaemic derived cells, simply due to
the nature of leukaemia and haematological malignancies. In some cases, it was
safe to assume that virtually all the cells in the sample were from the leukaemic
clone, for example where bone marrow contained 95% blast cells (compared to a
normal maximum of 5%). However, as this only occurred in a limited number of
cases, this data was left out of this thesis.
The ABO genotyping method was also applied to 17 colon carcinomas, and the
results compared those obtained from histologically normal mucosa adjacent to each
of the tumours, and with the patient's blood group (see Appendix A, Table 2). The
choice of patients was biased towards "not O" blood group, with the aim that
tumours that had loss of heterozygosity at the ABO locus might be detected. Of the
111

10 patients of blood group A, 7 of the corresponding tumours genotyped as AO,
while three genoryped as AA. Of the other tumours, 4 from O, 2 B and I AB blood
group patients, the genotype coffesponded with the patient's blood group. In each
case the results from the tumour and normal tissue were identical.
In all of the patients that were heterozygous at the ABO locus, visual comparison of
the relative intensities of the alleles compared to normal controls did not reveal any
imbalance, suggesting that none of the patients had loss of heterozygosity.
4.2.2.2 Patients with haematological malignancy and loss of ABO antigens
ABO genotyping of the patients with haematological malignancy and loss of A
and/or B antigens described in Chapter 3, revealed that all were heterozygous at this
locus. This made it possible to examine the patients for loss of heterozygosity,
which produced some interesting results (Table 4-3, Figures 4-6 and 4-7). As only a
single base pair differentiates the ABO alleles, amplification of the polymorphic
regions of the alleles should represent allele dosage in the original DNA sample.
There should not be preferential amplification of one allele, because at the binding
sites of the primers, the alleles are not distinguished. Furthermore, the sizes of the
amplified products are virtually identical, therefore size of the amplified product
should not influence the representation of any particular allele in the resulting PCR
product. Nevertheless, as a control for artifactual amplihcation, all patient samples
were amplified and digested on at least 3 separate occasions, and normal
heterozygous controls were always amplified at the same time.
Loss of heterozygosity in AO genotype patients was defined as over-digestion of the
98/99bp fragment with either KpnI or BstEII, and under-digestion with the
altemative enzyme. For example, in Figure 4-6, genotyping of patient MR reveals
slight digestion of the 98/99bp fragment with KpnI, and almost complete digestion
t12

AN GN BM GN PB GN PT MR NR PE NR PB WM MA CG PM BA AO ctrl
Figure 4-6. Allele dosage of the ABO gene in patients who genotype AO. Samples are paired digests (KpnI, BslEII) of the 98l99bp product.
When more than one sample of a patieniwas analysed, the sample is identified (BM- bone marrow; PB- peripheral blood; PT - post-transplant;
PE- pleural effusion).
WD KN DH SR AB ctrl
Figure 4-7. Alleledosage of the ABO gene in patients who genotype AB. Samples are paired digests (MspI, AluI) of the 181bp product.
113

with BsrEII. In normal heterozygous controls, the relative intensity of the two bands
is always the same, regardless of whether the product was digested with KpnI or
BstEII. Consequently, it was concluded that the partial digestion of PCR product
generated from patient MR with KpnI, and over-digestion with Bsr¿-II, represented
loss of heterozygosity of the O allele in this patient.
Table 4-3. ABO genotyping of patients with loss of antigen expression and haematological
maligrrancy. Normal allele dosage is indicated by a dash in the appropriate column.
Of the nine AO genotype patients examined, two had loss of heterozygosity of the A
allele (GNr and CG' ), and two had loss of the O allele (AN and MR). Of course,
PCR genotyping can only reveal an imbalance in the representation of the alleles.
Although in most cases this would be due to loss of heterozygosity, duplication of an
allele would give the same results. All of these experiments were carried out
# The differences in the relative intensities of the alleles (in patients GN and Aì{) are subtle but clearly
seen by examination of the negative from which Figure 4-6 was produced. Photographs prepared
from the negative did not retain the resolution of the original picture, and were the same as the
scanned negative.'The sample from patient CG shown in Figure 4-6 is probably incompletely digested with Kpnl, as
three repeats of this experiment in each case revealed a significantly more intense lower band.
Patient Sample Type Date ABOchance
ABOgeno
Abnorm¡l allele dosage
AN BM 2712192 A+O AO reduction in O
GN BM 419192 A+O AO reduction in A
GN BM 2rl8l92 A+O AO reduction in A
GN BM t5lt/93 A+O AO reduction in A
MR BM 613189 A+O AO reduction in O
NR PE 2v2/91 A-+O AO
NR PB rL/v9r A-+O AO
NR BM 713189 A-+O AO
WM PB 916189 A+O AO
MA PB t8l2189 A-+O AO
CG PB rolt2l93 A-+O AO reduction in A
PM whole blood t0/t2l9t A-+O AO
BA PB 16/t2194 A-+O AO
WD PB 26lLu87 AB-+B AB
KN BM 517194 ABmfr ABDH PB t5l6192 ABmfr AB
SR PB 17l8l94 AB+B AB
t14

without knowledge of the patient's karyotype, or the percentage of blast cells in the
particular sarnple (except for patient WM) [t was therefore obvious when the
cytogenetic results on patient CG became available, that unequal allele dosage was
in fact due to duplication of the O allele of the ABO gene. As shown in Chapter 3,
Table 3-1, this patient had CML, and2 Philadelphia chromosomes as lvell as one
cytogenetically normal chromosome 9. As the ABO gene is translocated with the
ABL gene to join chromosome 22 and form the Philadelphia chromosome, it follows
that there would be 3 copies of the ABO gene. As ABO genotyping indicates there
are more copies of the O allele than there are of the A allele in this patient,
presumably the chromosome 9 carrying the O allele has taken part in the
translocation event. If this is so, and therefore the leukaemic cells in this patient
still carry a normal A allele, why did this patient lose expression of the A antigen?
To date, nothing is known about the regulation of the ABO gene. One could
postulate a feed-back mechanism; that is when levels of the ABO transferase are
high enough, the gene "switches" off. In this case, two expressed copies of the O
allele might lead to down-regulation of the A allele on the normal chromosome 9.
The problem with this theory however, is that the O allele does not produce a full
length product. It appears then that either the protein product that is produced by
the O allele before truncation is in some way sufficient to lead to down-regulation of
the A allele, or that regulation of the ABO gene takes place at the RNA level.
Alternatively, the A allele in the leukaemic cells of this patient may carry a
mutation, making it non-functional.
Loss of the A allele in patient GN is probably due to loss of heterozygosity of the
ABO gene, and explains loss of the A antigen from her red cells. Although samples
taken from three different time points in this patient's disease were genotyped, and
all showed loss of the A allele, it should be remembered that the sample from
ll5

t5lll93 (sample GN PT), was taken four months after the patient underwent a bone-
marrow transplant and was in clinical remission. The patient was transplanted with
bone-marrow tiom her sister, who was blood group O. Subsequently, it appears that
the allogeneic manow has almost completely replaced the patient's own maffow, as
evidenced by a faint non-digested band in the KpnI digested sample, and the
corresponding faintly visible digested band in the BslEII digested lane, which is
indicative of the presence of a small amount of A allele.
In the remaining f,rve AO genotype patients, the relative intensity of the allelic bands
was identical to that of normal controls, suggesting that there was no loss of
heterozygosity at the ABO locus. However, it might be argued that the proportion of
leukaemic cells in the samples from these patients was too small for loss of
heterozygosity to be detected. The number of blast cells in each of the particular
samples was used to estimate the minimum number of leukaemic-derived cells, as
shown in Table 4-3. As loss of heterozygosity of the ABO gene was able to be
determined in patient GN, who had the least number of blast cells of all the patients,
it was concluded that the five patients with normal relative intensity of the alleles
did in fact have equal allele dosage. In the cases of patient PM and BA, blast cell
counts were unavailable. However, a bone marrow report from patient PM
indicated >80yo blast cells at approximately the same time that the PB sample was
taken. Furthermore, this patient succumbed to the disease shortly after, indicating
that there was probably a significant proportion of leukaemic derived cells in the
patient's PB sample. The patient BA, had no detectable A antigen on his red cells,
and succumbed to his disease several months after the PB sample was taken. The
assumption was therefore made that if LOH was occurring, it would have been
detected.
lt6
To test the sensitivity of the ABO genotyping method, varying proportions of AO
and OO genotype cells were mixed, and DNA prepared from them. Differences in
the relative intensity of the bands following PCR/digestion, could be determined
(visually) from samples with as few as 18% OO cells and 82% AO cells.
Theoretically, this mixture would represent a sample in which 18% of the cells had
physical loss of the A allele and duplication of the O allele by mitotic
recombination. If loss of heterozygosity was due to a simple deletion, the mixture
of 18% OO and 82o/o AO cells would represent a sample with 30% O/- cells, and
70% AO cells. Densitometry was not used to increase the sensitivity of these
experiments, as placement of the base-line is too subjective when differences
between the band intensities are so subtle they can not be determined visually.
Comparison of the genotyping results from patients GN and AN implies that both
samples have approximately equivalent amounts of cells with LOH. However, the
corresponding BM reports on these patients would suggest that there were more
cells derived from the leukaemic clone in patient AN (19% blast cells compared
with 5.8% blasts in the bone marrow sample from GN). These results are probably
an indication of the inadequacy of using blast cell counts to quantitate the number of
leukaemic cells. Furthermore, if LOH was only occurring ín 5.8Yo of the cells from
the patient GN, it would have been below the threshold for detection.
The same principles were applied to the examination of AB genotype patients for
LOH. In these cases, digestion of the 181bp fragment with MspI and Alul was
compared to that of normal AI! controls. In all four cases, the relative intensity of
the allelic bands was identical to the normal controls, indicating no difference in
allele dosage. Although the samples from 3 of these patients had more than 30o/o
blast cells, a differential cell count on the sample from patient WD was not
available, and therefore no conclusions could be made from the results on this
t17

patient. It was concluded that the patients KN, DH and SR did not have loss of
heterozygosity at the ABO locus.
4.2.2.3 Antenatal patients with abnormal A antigen expression detected during
routine screening
Three ante-natal patients (BG, HT, and SK) exhibited abnormal blood group
serology, as described in Chapter 3. Briefly, BG had grouped on different occasions
as Al, 42, A*/43 and O. FIT had grouped on two different occasions as normal AB,
and subsequently as weak A, normal B. SK has previously grouped as B, and
subsequently as A2B (described by the Blood Transfusion Unit at the QEH as
acquired A antigen). The samples used for genotyping these patients were all from
the most recent time point (indicated by bold type). Genotyping of the patients
revealed that all three possessed an A allele; BG genotyped as normal AO, while HT
and SK genotyped as AB (data not shown).
These results show that the patient SK did not have acquired A antigen, but was tn
fact was a true AB blood goup. However, these results did not explain the weak
expression of the A antigen in these patients. It could be hypothesised that the
patients carried the A2 allele, which encodes a transferase that is less efficient at
converting the precursor H antigen than the Al transferase. These patients were
therefore retained for further analysis, to see if they did in fact possess the A2 allele.
4.3 DnvnloPMENT oF A METHoD To cENoTYPE THE A2 ALLELE
Approximat ely l0o/o of all individuals fall into the A subgroup, 42. A2 can be
defined as a weak reaction with anti-A, and no reaction with Dolichos biflorus
lectin As a weak reaction with anti-A might sometimes be the result of loss of the
Al glycosyltransferase, a molecular method to define the A2 allele was subsequently
developed to determine if some of the patients who had been blood grouped as A2
ll8

did in t'act canied the A2 allele or could possibly have low expression of the Al
glycosyltransferase.
4.3.1 Rationale
The A2 allele is characterised by two differences from the Al allele. There is a
single base substitution at nt 467, resulting in a leucine at amino acid 156 in the A2
glycosyltransferase, where normally a proline residue exists in the Al allele.
Secondly, there is a single base deletion in one of the three C residues at nucleotides
1059-1061, close to the carboxyl terminal of the gene (Yamamoto et al., 1992).
Analysis of the single base change at nt 467 (C in Al, t in A2) reveals that the base
change destroys an MspI restriction enzyme site present in the Al allele, and creates
a PvuIl site in the A2 allele (see Figure 4-8). Primers spanning this region of DNA
were subsequently designed.
467
Ar atlete GACCAGCCGGCC
d atlele GACCAGC TGGCC
Figure 4-8 Comparison of the Al and A2 allele sequences. The C-+T transition at rú 467 is
represented by bold type. The MspI restriction enzyme recognition site in the Al allele is underlined,
as is the Pv¡II site in the A2 allele
4.3.2 Ívlaterials and methods
Primers spanning the region of interest, nt 467 of the ABO cDNA sequence, were
designed. Genomic DNA was isolated from 4 healthy individuals of A2 blood
group, and amplified using the following pnmers:
Al0
AB2
5' TTCCTGAAGCTGTTCCTGGAGACG 3'
5' GCTCGTAGGTGAAGGCCTCCC 3'
(sense)
(anti-sense)
119

PCR was carried out as described in Section 2.6.4. Ten microliter aliquots of the
resulting PCR products (357bp), were digested for 8 hours in a total volume of 20p1,
with l0 units of Msp[ or PvuII restriction endonuclease (New England Biolabs),
according to the manufacturer's instructions. The digested samples were then
resolved ona2Yo agarose or 8Yo polyacrylamide gel (Section 2.6.6).
4.3.3 Results and Discussion
The primers chosen amplifu the region from nt 385-742, and the resultant 357bp
PCR product was digested with MspI and PvuII. This method was applied to DNA
samples from 4 healthy individuals of blood group 42, and also samples from O, Al
and B individuals. Using the ABO genotyping method for the three major alleles, it
was determined that all the A2 blood group samples were heterozygous for the A
and O alleles. Digestion vnth MspI or PvuII resulted in a number of different sized
bands, as the region amplified contains at least one other site for each enzyme. The
predicted band sizes as determined from the cDNA sequence (Yamamoto et al.,
1992) are shown in Table 4-3.
Genotvoe MspI PvUII
oo/AlAl 204.82 234.123
AIO 204.82 234.123
A20 204.113.82 234.123.82
A2ñ 204-t13 234-82
Table 4-4. Fragment sizes (bp) of visualised restricted PCR products amplified by primers Al0 andAB2. The O, Al and B alleles contain identical restriction sites (with the exception that the B allele has
one less MspI site), hence all possible genotypes are not listed. The fragment amplified is 357bp,however this region contains other restriction sites for both Mspl and Pw¿II, which act as a control fordigestion; hence if there is complete digestion the 357bp fragment will not be present.
r20

Analysis of DNA samples from individuals of various blood goups (including A2
blood group) confirmed the reliability of this technique (see Figure 4-9).
357
234
t2382
r234s67Figure 4-9. Detection of the A2 allele of the ABO gene. Genomic DNA was amplified using primers
410 and AB2, and digested with PwII. Lanes 1 and 6 are from OO and A1A1 genotype individuals
respectively. Lanes 2-5 are products generated from A2 blood group individuals, all four genotype as
ÑO. Lane 7 is undigested PCR product. Note that the 82bp band only appears in the A2 individuals.
The sizes ofthe bands are indicated in base pairs.
Digestion with MspI produced the predicted band sizes for all genotypes (results not
shown). However, this enzyme seemed particularly refractory to digesting
heteroduplexes, as digested bands were poorly visible, reminiscent of the results
obtained with MspI digestion for the ABO genotyping method. As digestion with
PvuII detects the A2 allele, and incomplete digestion is controlled for by the
existence of another PvuII site within the PCR product (at nt 508), it is not
necessary to digest with both enzymes. Subsequently, all further experiments using
this PCR method only included digestionwithPvull.
Close examination of Figure 4-9 reveals that although this genotyping method
reliably detects the Ñ allele, digestion vnth PvuII does not approximate the
expected 1:1 ratio. In fact, PvuII does not seem to be sensitive to heteroduplex
formation at all, with over half of the product digested in two of the lanes (lanes 2
and 3). It seems that, unlike most of the other enzymes used in this study, PvulI can
t2l

digest heteroduplexes. Digestion conditions were varied, however there was either
very little digestion, or over-digestion. Conditions ranged frorn 7 units of enzyme
over 5 hours (lack of digestion as evidenced by the presence of a strong band at
357bp, and a weak band at 82bp), to 10 units for 5 hours to overnight (digestion of
heteroduplexes). Regardless of the source of this variation in digestion, the
technique was used to analyse patient samples for the A2 allele, however it was not
considered a reliable indicator of allele dosage.
4.4 ^2
GnNoryprxc oF pATTENTS wrrH Loss oF A ANTTcEN ExpRESSToN
This method was applied to patients from our collection of specimens for whom
blood group data had been recorded as either A2 or A2B. Patients that had been
provided to us as "loss of ABO patients" were also tested, as were the ante-natal
patients, which had all been grouped as either Ñ or A2B at least at one stage in
their case history.
4.4.1 Results and Discussion
4.4.1.1 Patients of A2 blood group
Normally the blood transfusion unit at the QEH does not divide patients of A blood
group into the subgroups Al and A2. However, if there is a notably weak reaction
\ /lth anti-A, or anti-Al appears in the patient's serum, further analysis on that
particular sample will be carried out. Further analysis usually consists of testing the
sample for agglutination with the lectin, Dolichos biflorus. Lack of agglutination
with this lectin results in the blood group A2 being recorded. Of the 34 A and AB
blood group patients with haematological malignancy described in 4.2.2.1, one
patient was recorded as A2B (ID 068152); no other patients were reported as either
A2 or A2B. The A2 genotyping method was applied to this patient to determine ifthe patient was truly A2B, or possibly had weak Al expression. To determine if the
source of weak A antigen in the three patients from the ante-natal clinic might be
122

explained by the presence of the A2 glycosyltransferase, these patients were also
examined using this rnethod.
-82bp
M1234
Figure 4-10. PCR A2 genotyping of patients with weak A antigen expression or blood group 42.
Lane l, patient 068152; lane 2,8G, lane 3 HT; lane 4, SK. The marker (M), is pUCl9lHpall Nlfour patients exhibit the 82bp band indicative of the ABO A2 allele.
PCR genotyping revealed the A2 allele in all four patients (see Figure 4-10). It was
therefore concluded that the patient 068152 was truly A2B blood group, SK and HT
were A2B, and BG was A2O. It is interesting to note that the patient BG, had
previously been blood grouped as Al. Regardless of the original blood group of this
patient, does the presence of the A2 allele explain the weak A antigen expression
seen in the red cells of these patients?
Economidou et al.(1967), made quantitative measurements of the number of A
antigen sites on red cells in ABO blood group heterozygotes (see Table 4-5).
Although these measurements reveal a large range in A antigen expression for each
of the groups, there is approximately a ten-fold difference in the number of A
antigen sites in AIB and A2B heterozygotes. This probably explains the weak A
antigen expression in the AB patients examined here. The fact that one of these
patients (SK) had previously grouped as B however, suggests there may be an
intrinsic variability in the normal expression of the A antigen, perhaps controlled by
123

as yet unknown factors. This hypothesis might also explain the tìndings with the
patient BG, who had been previously grouped as At but subsequently grouped as
42, Ax/43 and O. One common f'actor between these 3 patients is that they were all
pregnant, suggesting that perhaps pregnancy may induce changes in ABO antigen
expresslon.
Blood qroup A antisen sites
AlB 4-8 x 10s
AIO 8-12 x 10s
A2B 4-12 x l}a
A20 15-40 x 104
Table 4-5. Number of A antigen sites on red cells from individuals heterozygous for the ABO alleles
(Economidou et al., 1967).
An association between low expression of A antigen and pregnancy has been
documented. Schachter et al.(1971), assayed the level of N-
acetylgalactosyltransferase (the A transferase), from the serum of two pregnant
women who were blood group Al, and found that the levels were significantly
reduced compared to normal controls. Tilley et al. (1978), later confirmed these
results by assaying serum levels of the A transferase in six Al and three A2 group
women who had given birth within the last 48 hours. In the Al women, enzyme
levels were 47o/o of that of the normal Al controls, while in the A2 women, levels
were approximately 670/o of normal A2 controls. Serum H-transferase activity was
also assayed, and although there was a slight decrease in the new mothers compared
to normal controls, it was not significant. Interestingly, Tilley et al.(I978), also
found that the levels of A transferase in the group A infants of these mothers was at
least as high (if not higher), than that of the normal adult controls.
Weak expression, or complete loss of the Lewis B antigen is commonly seen tn
pregnant women (reviewed in Wallace and Gibbs et al., 1986; personal
r24

communication with personnel in the Blood Transfusion unit at the eEH).However, in the case of Lewis antigens, the situation is quite different to that of the
loss of A antigens. Hammer et ul. (1981), found that the level of Leb glycolipid in
the blood of pregnant women was the same as normal controls. Furthennore, two
thirds of the Leb antigen \À/as attached to plasma lipoprotein, with the remaining
third bound to red cells. The authors concluded that loss of Leb antigen from the red
cells was due to the increased ratio of lipoprotein to red cell mass (more than four-
fold), that occurs during pregnancy. Therefore, more of the Leb antigen could bind
to lipoproteins.
obviously loss of A and Leb antigen expression during pregnancy occurs by
completely different mechanisms. It seems that the only explanation for the
decrease in A transferase activity and the corresponding loss ofA antigen expression
during pregnancy is that there is inhibition of the A transferase, perhaps due to
hormonal changes.
4.4-1.2 A2 genotyping of patients with loss of A antigen expression andhaematological malignancy.
A2 genotyping of patients with loss of, or weak A antigen expression and
haematological malignancy revealed that four of the nine A blood group patients
(44.4%)' and two of the four (50%) AB group patients, carried the A2 allele (see
Table 4-6)' As only 24% of A and 34% of AB blood group individuals are A2 and
A2B respectively (Adelaide Blood Bank statistics), it seems that these results show a
correlation between the A2 allele and patients with loss of A antigen expression.
t25

Patient ABO genotvoe
AN A20GN A20MR A20NR AIOWM AIOMA AIOCG A20PM AIOBA AIOWD A2BKN'. AIBDH* AIBSR A2B
Table 4-6. Results following ABo genotyping of the A2 allele in patients with loss of A antigenexpression and haematological malignancy. i patients that exhibited loss of A and B antigenexpression.
Both the ante-natal patient BG, and the patient GN had previously been blood
grouped as Al. As both the patients genotype as A2o, it seemed there is a
discrepancy between the genotype and the patients' original blood goups. These
concerns were discussed with Dr. Hay and other personnel from the Adelaide Blood
Bank, who confirmed that if the Dolichos lectin used for grouping was either old or
incorrectly diluted, it could agglutinate A2 red cells; subsequently A2 group cells
could be incorrectly grouped as Al. When asked if they had ever seen changes ofthis type in regular blood donors, they admitted that in the past eight years two
donors had exhibited dramatic changes in expression of the A antigen. In both ofthese cases the donors had been referred to haematology clinics for further testing.
Both donors were subsequently diagnosed with leukaemia.
4.5 Cox¡lRMATroN or, ALLELE DOSAGE USING SOUNTCNX BLOTTING
As further confirmation that the group of patients with loss of ABO antigens had no
change in allele dosage, Southern blotting was carried out on specimens of which
there was sufficient amounts of DNA available. As no probe was available for the
126

AIIO gene' the first aim in this section was to clone a segment of the coding region
for subsequent use as a probe.
4.5.1 Rationale
Yamamoto et al. (1990) used southern blotting of genomic DNA to genotype
individuals at the ABO locus. As the probe used (a full length cDNA clone) was not
available to us, it was necessary to generate a probe. The Southern results from
Yamamoto's group revealed two major bands of l0 and 6kb, in Ao or Bo genotype
samples when digested with BsräII. Theoretically, a 4kb band should have been
detected with the 6kb band, however the authors do not explain the lack of this band
in their Southerns (it appears the 4kb band has been cut out of the picture).
Nevertheless, these results indicated that no BstEII sites other than the diagnostic
site at nt 26I were detected by the full length cDNA probe. Therefore, it was
feasible to generate a smaller probe using primers already in the laboratory. The
primers chosen to generate ABO PCR product for cloning span nt 562-742 of exon 7
of the ABO cDNA sequence.
4.5.2 Nlaterials and Methods
Genomic DNA from an individual of genotype BO was amplified using primers
ABI and AB2 as described in 2.6.4. The resultant product was purified and cloned
into the modiflred pGEM5zf(+) (pGem-T), cloning vector as described in section
2.6.9. Manual sequencing was then performed in both directions to confirm the
presence of the appropriate insert (2.6.10). Southern blot analysis of B,stEII digested
genomic DNA, was carried out as described in section 2.6.7, the blot was washed in
0.lxsSC,0.l% sDS at 65oc, for 15 minutes. The blot was then exposed at -gOoc
for 3 days.
t27

4.5.3 Results and Discussion
Two clones were analysed (6J and 7J). Sequencing revealed that 6J contained the
B-allele, in a sense orientation for the T7 RNA polymerase transcription initiation
site, and 7J contained the O allele, in a sense orientation for the SP6 RNA
polymerase transcription initiation site. The clone 7J was used as a probe for the
Southern blot, and revealed two bands (1Okb and 4kb), in all individuals tested (see
Figure 4-lI).
There was enough DNA to examine patients NR, WM and CG. However, analysis
of genomic DNA from patient CG on a O.8Vo agarose gel revealed laddering of the
DNA, characteristic of apoptotic specimens. This is probably explained by the fact
that this blood specimen was received at the QEH 14 days after it was taken from
the patient. Regardless, the specimen was analysed on the Southern, however it
yielded faint bands of 10 and 4kb amongst a smear of non-specific background;
therefore no conclusions could be drawn from Southern blotting of this specimen.
The remaining two patients however, showed the 10 and 4kb bands seen in the
normal AO genotype control.
O allele 1
A allele 4kl-
WM NR AO ctrl
Figure 4-LL. Southern blot analysis to determine allele dosage of the ABO gene. Lane I is patient
WM, lane 2 is patient NR (BM 113189), and lane 3 is DNA from a normal AO genotype individual.
t28

Given that the samples analysed from WM and NR contained 97Vo and 85% blast
cells respectively, it is clear that neither of the patients has loss of heterozygosity of
the ABO gene, compared to the normal control. Unfortunately, when this gel was
being prepared for Southern blotting, the acid-nicking step was accidently omitted.
Other Southerns where the gel had been acid-treated yielded much clearer 10kb
bands, however this Southern was not considered important enough to waste another
l0¡rg of precious patient DNA repeating it.
129

Sunnnn.tnv
Methods for distinguishing the four rnajor alleles of the ABO blood group gene were
developed. Subsequent genotyping of samples from patients with haernatological
malignancy and colon carcinomas from patients of known blood group revealed
discrepancies in two cases. Two patients, both with CML, genotyped as normal AO,
but had always blood grouped O with no indication of any A antigen expression.
These patients were retained for further analysis. Sixteen patients with abnormal
antigen expression were analysed, thirteen had a haematological malignancy, and
three were pregnant, but otherwise healthy. Four of the patients with
haematological malignancy had unequal allele dosage of the ABO gene; two had
loss of the A allele, and two had loss of the O allele. In one of the patients with
"loss" of the A allele, cytogenetics revealed the presence of two Philadelphia
ch¡omosomes, and hence it was assumed that the Philadelphia chromosome carried
the O allele. Loss of the A allele in the other patient explains the weak A antigen
expression seen in this patient. In the patients who were pregnant, two genotyped as
ÑB.. It was postulated that weak antigen expression in these patients could be
explained by the fact that the transferase encoded by the A2 allele is significantly
less efficient at converting the precursor H antigen when competing with the B
transferase. This argument does not explain the weak A antigen expression seen in
the third ante-natal patient, who genotyped as A2O, as expression was so weak in
this patient that she at one stage was considered blood group O. It was concluded
that A transferase activity can be inhibited during pregnancy, probably by an as yet
undefined mechanism induced by hormonal changes.
Finally, AEIO genotyping of eleven of the patients with weak antigen expression and
haematological malignancy was not able to yield an explanation, as nine of the
patients had no detectable loss of heterozygosity at the ABO locus, and two had loss
of the non-functional O allele.
130

Although loss of antigen expression in these eleven patients might be due to a
mutation in the ABO gene, the fact that two patients had loss of the O allele
indicates some kind of larger event is occurring. Furthermore, these results suggest
that the ABO gene is not the primary locus involved in this event, as there would be
no selective advantage for a cell that had lost expression of a non-functional allele.
As loss of antigen expression in most of the patients was not able to be explained by
this PCR analysis of the DNA encoding the ABO gene, the next step in this project
was to examine the expression of the gene.
I
131
CnaprERFrvr
ExpnESSroN oF THE ABO cENE

5.0 lNrnooucrroN
In the previous chapter, patients with loss of blood group antigens were examined
for loss of heterozygosity at the ABO locus. ABO genotyping revealed that nine of
the patients had no loss of heterozygosity, and two of the patients had loss of the O
allele. As these results could not provide an explanation for loss of antigen
expression in these patients, the next logrcal step in this study was to analyse
expression of the ABO gene at the molecular level.
The relative expression of the various alleles of the ABO gene at the mRNA level
has not been described in the literature. Therefore, the first aim of the experiments
contained within this chapter was to develop a sensitive molecular method for ABO
phenotyping, and subsequently determine the expression of the various AIIO alleles
in healthy individuals. The second major aim of this set of experiments was to
examine expression of the ABO alleles in leukaemic cells from patients with loss of
ABO blood group antigens.
t33

5.1 DnvuopMENT oF A sENSrrrvE METHoD FoR ABO pHENoryprNG
Yamamoto et al. (1990a), used Northern analysis to examine expression of the
AIIO gene. Northern analysis and RNase-protection assays were considered for this
study, however disregarded due to the large amount of intact mRNA required for
these types of analyses. Consequently, we decided on an RT-PCR approach,
followed by allele specific restriction enzyme digestion.
5.1.1 Rationale
At this stage of this project, the intron-exon structure of the ABO gene had not been
elucidated. As a result, primers spanning a region of approximately 500bp of the
cDNA sequence were designed, to increase the chance of the amplified region
spanning one or more introns and therefore specifically amplifuing oDNA. The
first consideration before attempting RT-PCR of the ABO gene however, was to
develop an appropriate positive control for the reverse-transcription step.
5.2 Posruvn coNTRoLS FoR THE REvERSE-TRANscRrprIoN REAcTIoN
5.2.1 Assessment of B-actin as a positive control for the reversetranscription
reaction
Initially, it was considered that B-actin expression would be an appropriate control
for these experiments. B-actin is assumed to be constitutively expressed in all cells,
and therefore would make an ideal positive control for reverse-transcriptions.
Primers were designed to the p-actin gene so that they spanned an intron-exon
boundary, and the expression of the p-actin gene in peripheral blood examined.
t34

5.2.2 Materials and methods
RNA was isolated from peripheral blood from healthy volunteers, reverse-
transcribed and subjected to PCR as described (see Sections 2.6.2 and 2.6.5), using
the following primers:
B-actin A 5' TGTACGCCAACACAGTGCTGTCT 3'
p-actin B 5' CGTCATACTCCTGCTTGCTGATCC 3'
(sense)
(anti-sense)
PCR conditions were: 94oC for 5 minutes, followed by 35 cycles of 96oC for 30
seconds, and 60oC for 30 seconds (a "bounce" PCR). Aliquots (7pl) of the resulting
PCR products were resolved on a I.5Yo agarose gel.
5.2.3 Results and Discussion
The primers designed span nt 2638-2962 of the p-actin genomic DNA sequence
(Genbank accession number M,-10277). This region contains part of exon 5, intron
E and exon ó of the gene. The predicted size of PCR product generated from
genomic DNA is 324bp, while PCR product generated from cDNA would be
expected to be 2l3bp (intron E is 11lbp). It is clear from Figure 5-1 that the 213bp
product is obtained from amplification of oDNA (lanes I and 2), however
amplification of genomic DNA (lanes 3, 4 and 5) also produces a band of 2l3bp.
This finding could not be explained by contamination with PCR product, as the p-
actin gene had never been amplified in this laboratory before, and samples without
DNA were always negative. It is interesting to note that amplification of DNA also
produced a faint smear at approximately 324bp (Figure 5-1, lanes 3, 4 and 5 as
indicated by the arrow).
135

331
242190
M12345Figure 5-1. PCR amplification of B-actin. The marker is pUCl9lHpaII (M). PCR products weregenerated from normal peripheral blood cDNA (lanes I and 2), and genomic DNA (lanes 3, 4 and 5).
The expected band of approximately 3l2bp is generated from cDNA, however a similar size band is
generated from genomic DNA. A very faint smear of approúmat ely 324bp, the expected product size
from guromic DNA can be seen in lanes 3,4 ar,Ld 5, and is indicated by the arrow.
Consultation of the literature and Genbank revealed that there are at least 19
processed B-actin pseudogenes in the human genome (Leavitt et al., 1984), which
have approximately 95o/ohomology with the B-actin cDNA sequence. Therefore, it
was concluded that B-actin was not a suitable positive control for RT-PCR, as
products generated from oDNA and contaminating genomic DNA in RNA
preparations could not be distinguished. Since these results were obtained, other
laboratories have published similar findings (Taylor and Heasman,1994).
5.2,4 Assessment of B-globin as a positive control for the reverse-transcriptionreaction
It was expected that cells expressing the ABO gene would also express the B-globin
gene, therefore primers were designed to the B-globin gene and analysed using RT-
PCR.
136

5.2.5 Materials and Methods
RNA was isolated from peripheral blood from healtþ volunteers, reverse-
transcribed and subjected to PCR as described (see Sections 2.6.2 and 2.6.5), using
the following primers:
B-globin A 5' GCAAGGTGAACGTGGATGAAGTTG 3'
B-globin B 5' GCTTGTCACAGTGCAGCTCACTCA 3'
(sense)
(anti-sense)
PCR conditions were: 94oC for 5 minutes, followed by 35 cycles of 96oC for 30
seconds, and 60oC for 30 seconds. Aliquots (7¡rl) of the resulting PCR products
were then electrophoresed on a l.5o/o agarose gel.
5.2.6 Results and Discussion
The primers designed ampliff nt 62,236 - 62,605 of the genomic DNA sequence of
the B-globin gene cluster region on chromosome 11 (Genbank accession number
U01317). The sense primer is located in exon 1 of the B-haemoglobin gene, while
the anti-sense primer is located in exon 2. The primers span intron l, which is
131bp long. Therefore the expected size of amplified product from genomic DNA
is 369bp, while a product of 238bp should be generated from cDNA.
M1234Figure 5-2. PCR amplification of B-globin. The marker is pUCl9lHpaII (M) PCR products were
generated from normal peripheral btood cDNA (lanes 1 and 2), and genomic DNA (lanes 3 and 4).
The expected band of approximately 238bp was generated from cDNA' while a band of 369bp was
generated from genomic DNA.
404331
242
137

It can be seen from Figure 5-2 that amplification using the chosen Þ-globin primers
produces the expected bands of 238bp from peripheral blood cDNA (lanes 1 and 2),
and 3ó9bp from genomic DNA (lanes 3 and 4). However, expression of B-globin is
supposedly restricted to the red cell lineage. As we were repeatedly able to ampli$,
p-globin from normal peripheral blood mononuclear cells, either the cell
preparations were contaminated with reticulocytes, or this method is detecting
illegitimate transcription of the p-globin gene. Transcription of the B-globin gene
has been shown before in a number of inappropriate cell types, including
lymphocytes (reviewed in Kaplan et al., 1992). Regardless of the natwe of the
transcript (either legitimate or illegitimate), amplification of p-globin was
consistent, and therefore considered an appropriate positive control for the reverse-
transcription reaction, and was used as such throughout the rest of this study.
5.3 ExpnnssloN oF THE ABO GENE
Initially, the primers used to examine the relative expression of the ABO alleles
were two of the primers used in the ABO PCR genotyping method described in the
previous chapter. The primers, AOI and AB2, span nt 231-742 (exons 5-7) of the
oDNA sequence of the ABO gene (Yamamoto et al., 1990a; Yamamoto et al.,
1995). The predicted size of the amplified product generated from cDNA using
these primers is 5l2bp. Table 5-l shows the predicted fragment sizes after
digestion with the restriction enzymes KpnI and BstEII for various phenotypes.
Kpnl BstEII
oo 481,30 512
AO/BO 5t2.481.30 512.481.30
AA/BB/AB 512 481.30
Table 5-1. Predicted fragrnent sizes after digestion of the 5l2bp ABO RT-PCR product with the
diagnostic restriction enzymes þnl and BslEII, for various phenotypes.
138

5.3.1 Materials and methods
RNA was isolated from peripheral blood leukocytes of healthy volunteers, cell
lines, and peripheral blood mononuclear cells from patient MCG (taken when the
patient was in blast crisis). RT-PCR was carried out as described (see Sections
2.6.2 and2.6.5), using the following primers:
AOI 5' TGACACCGTGGAAGGATGTCCTCGT 3'
AB2 5' GCTCGTAGGTGAAGGCCTCCC 3'
(sense)
(anti-sense)
The optimal conditions for this reaction were diffrcult to determine, however the
final conditions chosen \ryere: 94oC for 5 minutes, followed by 45 cycles of 94'C
for 1 minute, 65oC for 1 minute and 72C for 1.5 minutes. The PCR reaction was
carried out in a Corbett Research FTS-I thermal sequencer. Aliquots (10¡rl), of
each of the reactions were then digested overnight in a total volume of 14¡rl, with 7
Units of KpnI or .BslEII, and resolved on an ïVo polyacrylamide gel as described
(see Section2.6.6).
5.3.2 Results and l)iscussion
No product was obtained from amplification of cDNA derived from the peripheral
blood leukocytes of normal individuals. This is not surprising as leukocytes only
express small amounts of ABH antigens, and it is thought this occurs by adsorption
of the antigens from plasma (see Chapter 1). As expected, no product was obtained
from genomic DNA. Products of the expected size were obtained from peripheral
blood from the patient MCG, and all of the cell lines tested, excluding HL60 and
HiMeg. Digestion of the products vath KpnI and BsTEII revealed two bands of the
expected sizes, from which the phenotype of the cells could be determined (as
shown in Figure 5-3 and Table 5-2).
139

51481-
12 34 56 78
T'igure 5-3. ABO phenotyping. RT-PCR product generated from cDNA was digested with þnl(lanes 1, 3, 5, and 7\ or BstF,II (lanes 2, 4,6, and 8), and resolved on an 8% polyacrylamide gel. The
samples were from the oell lines SW480 (genotype AA, lanes I and 2), and HT29 (genotype AO,
lanes 3 and 4), the patient MCG (genotype AO, lanes 5 and 6), and the cell line K562 (genotype OO,
lanes 7 and 8).
RT-PCR revealed that both K562 and I{EL (both genotype OO) expressed the O
allele (Figure 5-3, lanes 7-8; FIEL is not shown), and SW480 (genotype AA)
expressed the A allele (lanes I and 2). The phenotyping results for HT29 and the
patient MCG wero unclear (lanes 3-6); both of these samples genotyped as AO,
however there was no digestion of the RT-PCR product with KpnI, suggesting no
expression of the O allele in these samples. Identical results were obtained for all
the heterozygous cell lines tcsted, regardless of whether the genotype was AO or
BO (see Table 5-2). However, both K562 and FIEL exhibited complete digestion
with KpnI, and therefore it could be concluded that the O allele is expressed.
140

Cell Line Type ABO eenotvpe ABO nhenotvoe
K562 CML - erythroleukaemia oo oKCL22 CML AO A
HiMes CMl-Megakaryocytic leukaemia AO no exDresston
HEL eryth¡oleukaemia oo oHL6O promyelocytic leukaemia AO no expresslon
Fil29 colon carcinoma AO A
sw480 colon carcinoma AA ALIM I863 colon ca¡cinoma oo oLt.vI2412 colon carcinoma AO ALßv[2463 colon ca¡cinoma oo oLIM 1215 colon carcinoma BO B
LIM 2405 colon carcinoma oo o
Table 5-2. ABO phenotyping results from cell lines as deduced by RT-PCR and diagnostic
restriction enz]¡me digestion of ABO mRNA.
Digestion of the RT-PCR products from MCG and HT29 with BsrEII, which digests
the A and B alleles, revealed a small undigested fraction of the product - although
SW480 digested completely with this enzyme. This result was repeatable, and can
be explained by the presence of a small amount of O allele. If this were so,
heteroduplex formation could be suffrcient to completely inhibit digestion with
Kpnl, however digestion with.BsrEII would be expected to be incomplete as it too is
refractory to heteroduplex digestion. The most likely explanation for the relatively
low amount of O allele present in heterozygous samples is that the O allele mRNA
is less stable than that of the A or B alleles; this point will be discussed in further
detail elsewhere in this chapter.
Although DNA from the patient MCG genotyped as AO, blood group results from
this patient 16 years before the onset of disease reported the patient as
unequivocally blood group O. However, the results shown here suggest that the
patient exclusively expressed the "4" allele, and are identical to that of the cell
lines HT29, LIM l2l5,Lfú2412 andKCL22, all of which genotyped as AO or BO.
Two conclusions were made from this set of experiments. Firstly, the primers
chosen for this analysis were unsuitable for these experiments as the difference
t41^

between the 512 and 481bp fragments was too subtle. Secondly, the patient MCG
could possess an new kind of O allele, not characterised by the single base deletion
atnt26l.
5.4 SneuuNcING on rHE NE\ry "O" ABO ALLELE
As the phenotyping results on patient MCG were inconclusive, it became clear that
there could be a mutation in the "A-like" allele, that made it non-functional. As the
fragment amplified spans approximately half of the coding region of the gene, it
seemed appropriate to begin with sequencing this region. It appeared that there was
no significant amount of contaminating transcript from the "normal" O allele, as
evidenced by lack of digestion of the PCR product with KpnI, therefore sequencing
was carried out directly on the ABO RT-PCR product generated from this patient.
5.4.1 Materials and Methods
The ABO RT-PCR product generated from the patient MCG in section 5.3.1 was
purified and sequenced on an automatic sequencer using the primers AOI (sense
sequence), and AB2 (anti-sense sequence), as described in Sections 2.6.8 and2.6.9.
5.4.2 Results and Discussion
The product was sequenced in both directions, and a consensus sequence derived
from both the sequences (for the original sequence data, see Figures 5-4 and 5-5
over the page). Comparison of the consensus and nt 262-707 of the Al-allele
sequence revealed three single base substitutions, two of which would confer
amino-acid changes on the protein. Figure 5-6 summarizes the differences found:
142

23 MC GDNA 5'
DyeTermindor{AnyPrimer}Lane 23Signal: G:256 A:120 T:81 C:66
Points 607 to 68O0 Bæe 1: 607
432 MATRIX FILED.O'Keefe QEH
Tue, Dec 15, 1 992 2:13 PM
X:0 to &t15 Y: 0lo 1200P4e1of2ffffi,^
Model 3734Version 1 .1-1 ACGAGNTCAACG AG G GCT T G GT T GGGGNGG TNACCC
IA
I
A6020
ACATCCTC80CCCATTGTqnNCC C C I{ TTN
10
TTCCTG150
ACGTGÂTCAAG A G AG170140
NTGTNC160TTNNTGTCATTGGGTT
li0CAG AANAC
!û0GTTCAGG90
I
I
GCCGGACCGACTATGTNAC
I'ii
CGCG250
G G TG240G TCCÂC
210GGCCAC
200CT TCA-TG
190AAgu u Au
180
TGCGCA ÂG T T G T CG A 'G
N T G
IGTGTTGGGGACCGGT
260
CGTNTC324
TGGAAG310
A C A AG300
TG G GC G290
G C A TG G A G ATCAGTG340
TCTGCGA350
GGNGCT360
TC AG GG370
TG G A T T380
C TG GT G390
G CG TG G Â400
Figure 5-4. Raw sequencing data (sense direction) of the new o allele from patient MCG Three bases deviate from the published Al sequence' as indicated by the arrows'
¿
t43

24 MC GDNA 3DyeTermin dølAnYPrimer I
Lane24G:416 A:273T:120 C:105
Polnts 647 to 6900 Base 1: 8[7432 MATRIX FILED.O'Keefe QEH
Tue, Dec 15, 1992 2:13 PM
X:0 to 6517 Y:0 to 1200Pagel of2ffffi""
Model373AVersion 1.1-1
I
I
II
G90
GCCT-AGATCTCCGCAGGG ÏAAGGTGTÕCGTAGCT AÕÖTCC 80TG G AG Ï C
70CGAAC
60NNNGCT{G20
NNI{NTINAT10
ì
Il
I
I
I\
iI
I
t
I
III
ì
!
I
A70
CTGCGÙfCGACCAGGTTCCACGCGTTG A AG TG A AGc
I1t0TGTCCA CG CTG
140ATCCAC
130G AACT C100
ì
\
It,,
\i\
I
II
cc cCTCCAGCGCC190
CTCCA 2s0AC CGG
G ACA CG G CG CCTGCC
2¿toACTGAC
230CTTGT
210CTGCCA
200
AÂ TG GT G GTC T TTC 400A CG T N TA G C T TCCAGGA C A C A G TT A A C C39Û
T G GN AÀ380AAÅG
360C C G TL1340
ÂG TGTG GCG AC A CGGTCGÖûGUbUAUVT
3270
iiii
ACÕAT320ÂG TÂG
300G A AG A
2SAT3A-¿GC264
Signal:
Figure 5-5. Raw sequencing data (anti-sense direction) of the new o allele from patient MCG. Three bases deviate from the published A1 sequence, as indicated bY the
a
¿urows (continued over Page).t44

=ffi,^24 MC GDNA 3DyeTermindor lAnYPriner ÌLane24
Pohts 647to 6900 Bæe'l: 8[74-32 MATRIX FILED.O'KeefeQEH
Tue, Dec15,1992 2:13PMX: 0 to ô.517 Y: 0 to 1200
Pqe2ot2
Model373AVersion 1-1.1 Signal: G:416 Æ273T:120 C:105
N1{ÀA AA NA AAAAT CT N
510N NT N
500NCNN
520CGA¿190
AGCAT'AAT CCCT GAGATCTGTG GA410
GTTA
C TG A4m
GTTC430
GTTGGGG
480GGA
470CGAm
l- I
Figrrc S5 (continued) 145

292 5'
526 5'
ArgCGCGGCGlv
J A1 allelepatient MCG
Figure $6. Comparison of the patient MCG sequence and the common Al allele. Nucleotide and
infened amino-acid differences are indicated by bold type.
It is interesting that the second substitution in this new allele, A+G at position 297,
is also found in the B allele, as is the third substitution, C+G at position 526 (a.a.
176, arg¡rune+glycine; Yamamoto et al., 1990b).
Some time after this work was completed, another type of O allele was published;
the 02 allele (Yamamoto et a1.,1993b). This sequence was compared with our new
O allele. The substitutions at positions 297 and 526 were the same in both alleles,
however the substitution in our new O allele at position 294 was not reported in the
02 allele. Later, another goup sequenced 3 more 02 alleles from the Danish
population (Grunnet et al., 1994). Once again, the change we forurd at position 294
was not reported in these alleles. As only 4 02 alleles have been sequenced in this
region, it is possible that this base change is another (silent) polymorphism of the
ABO gene.
Alternatively, close examination of the raw sequencing data (see Figures 5-4 and 5-
5 position 60 and 452 respectively), reveals that in both the forward and reverse
sequence, there is a smaller peak corresponding to nt294 of the ABO sequence. In
the forward sequence, the smaller peak indicates a cytosine, while in the reverse
sequence, the smaller peak indicates the presence of guanine. As the common A
allele has a cytosine at nt 294, it is possible that at some stage early in the
Gly ThrGGC ACA 3'
GGA ACGGly Thr
Al allelepatient MCG
t46

amplification reaction, Taq DNA polymerase incorrectly incorporated adenine
instead of a cytosine. This scenario is unlikely for two reasons. Firstly, it is
obvious that most of the transcripts sequenced have an A at nt 294; given that
presumably there were a reasonable number of ABO cDNA transcripts at the start
of the reaction, there should not be such a bias to one particular mutated transcript.
Secondly, smaller peaks are produced by background fluorescence throughout the
sequence, and as such it is possible that the smaller peaks seen beneath the adenine
peak at 294 in the forward sequence, and the thymine in the reverse sequence, are
due to non-specific background.
It now remained to be determined whether or not the other patient who genotyped
as AO by our standard method, yet was blood group O (patient DN), also possessed
the 02 allele. As no frozen samples were available from this patient, it was not
possible to carry out RT-PCR and sequencing as for patient MCG. Therefore a
method to determine the presence of the 02 allele directly from genomic DNA was
developed.
5.5 DnvnlopMENT on A PcR METHoD To DETEcT rHE 02 ALLELE
5.5.1 Râtionale
Grunnet et al. (1994) used PCR genotyping to determine the presence of the 02
allele in individuals of O blood group. The method described however, required
1¡rg of DNA target for amplifîcation, and is followed by restriction digestion of the
product, blotting and hybridisation with a radio-labelled probe. We wished to
develop a quick, sensitive method to distinguish the 02 allele from the A allele,
preferably avoiding the use of radio-active probes.
Given that samples we wished to examine for the 02 allele were from blood group
O individuals, who had previously genotyped as AO (as described in Chapter 4), it
r47

was only necessary to examine the gene at one site to distinguish the A and 02
alleles. We chose to use the substitution at nt 526, which is a C in the Al allele, but
a G in the B and 02 alleles. As the samples were already genotyped as AO, it does
not matter that this method does not distinguish between the B and 02 alleles. The
base substitution in the 02 allele creates a NarI restriction enzyme site, where there
is a ^BssHII restriction enzyme site in the Al allele, as shown in Figure 5-7 below:
5r
BSSHII514
GTGCTGGAGGTCC GCGC CTAC 3 nle'and da[eles
o', g a[elesGTGCTGGAGGTæGCGCCTAC
Narl
Figure 5-7. Comparison of the nucleotide sequence of the 5 major ABO alleles at position 526. The
Al, A2 and O alleles can be distinguished by digestion with the restriction enzyme EssHII, from the
02 and B alleles, which digest with the enzyme NarI.
5.5.2 Materials and methods
Genomic DNA from normal individuals that had previously been ABO genotyped
using the PCR genotyping method described in Section 4.1.2, and the patients MCG
and DN, was amplified using the primers A10 and AB2 as described for the A2
genotyping method (Section 4.3.2). Aliquots of the resultant PCR product (10p1),
were digested with 10 Units of the restriction enzyme .BssHII (New England
Biolabs), according to the manufacturels instructions. The digested products \À/ere
resolved on 1.8% agarose gels (Section2.6.6).
148

5.5.3 Results and Discussion
DNA from individuals of genotype OO, AO, AA, BO and BB was amplified and
digested with the en-q/me BssHIL Figure 5-8 shows the expected pattern of bands
from the various genotypes, that is, digestion of O and A alleles, and no digestion of
B alleles. Digestion of the site at nt 526 produces two bands, of 216 and 141 base
palrs.
357
216741
M1 3 4 5 6 MCc DN
Figure 5-8. Detection of the 02 allele. PCR product generated from genomic DNA was digested
with -BssHII. Complete digestion is seen in individuals of OO (lane 1), AO (lane 2), and AA (lane 3)
genotype, while partial digestion is seen in an individual of BO genotype (lane 4), and no digestion in
a BB individual (lane 5). Undigested product is shown in lane 6, while samples from the patients
MCG and DN, who genotype AO, exhibit the same pattern as the BO individual, indicating the
presence of the 02 allele. The marker (M) is pUClglHpaIL
As the 02 allele,like the B allele, does not have a BssHII restriction site within this
PCR product, it would be expected that OrO2 heterozygous individuals would
produce the same pattern of bands as a BOI heterozygous individual following
application of this method, Figure 5-8 shows the application of this method to
samples from the patients MCG and DN. Although the enzyme BssHII is extremely
sensitive to heteroduplex formation (as was the enzyme NarI; data not shown), it
can be seen that the patient MCG genotypes as OlO2, which was expected from the
sequencing data described in Section 5.4. Patient DN, who blood grouped
unequivocally as O, yet was genotyped as AO using the genotyping method
described in Section 4.1.2, also genotypes as O1O2 . Therefore, as the apparent
anomaly between the blood groups and ABO genotypes of these patients had been
explained, they were excluded from the rest of this study.
149

5.6 Davtlopn¡nNT o[' A MoDIFIED METHoD To ASSESS rHE RELATwE
EXPRESSIoN oT.THE A/B nxu O NIININS.
The RT-PCR method described in Section 5.3 was considered inadequate for the
purpose of this study, as the difference between digested and undigested fragments
was too subtle, even when the fragments were resolved on 8%o polyacrylamide gels.
Therefore the aim of this set of experiments was to develop a new RT-PCR method
to assess expression of the AIIO gene. Primers to a smaller region of the ABO
cDNA sequence were designed; shorter regions of oDNA ampliff more efftciently
than larger regions, especially when the target RNA for the reverse-transcription
reaction is partially degraded.
When designing primers to a smaller region of the gene, it was necessary to make
the concession that only one of the diagnostic restriction sites could be included in
the region to be amplified. Consequently, the primers used for this set of
experiments span nt 12-329 (exons 1-6) of the ABO oDNA sequence (Yamamoto er
al., 1990a; Yamamoto et al., 1995). Following restriction enzyme digestion of the
resulting RT-PCR product with the enzymes KpnI and .BsrEII, the relative
expression of the A or B and the O alleles should be able to be determined (see
Table 5-3 for predicted fragment sizes).
KpnI BstEII
oo 249 316
AO/BO 249.376 249,316
AA/BB/AB 316 249
Table 5-3. Predicted fragment sizes after KpnI or BstEII digestion of the 3l6bp ABO RT-PCR
product for individuals of various phenotypes. The numbers shown in grey indicate band sizes
expected from analysis of the cDNA sequence, that were not detected in AO and BO heterozygotes
using the ABO RT-PCR method described in Section 5.3.
150

5.6.1 Materials and methods
RNA was isolated from histologically normal bone marrow taken from patients
with breast cancer, umbilical cord-bloods, and peripheral blood stem cell
collections from patients with breast cancer. The RNA was reverse-transcribed and
subjected to PCR as described (see Sections 2.6.2 and 2.6.5), using the following
primers:
PA5' 5' TTCCGGACGCTGTCCGGAJÂvAAC ar
AO2' 5' TGAACTGCTCGTTGAGGATGTCGA 3'
(sense)
(anti-sense)
The primer PA5' was designed by a student in the laboratory, Peter Laslo, for
cloning pulposes, and subsequently contains an artificially created SrzI restriction
site (a T replaces a G in the original sequence; indicated in lower case).
Aliquots of the PCR product (10p1), were then digested for 8-16 hours with 10 units
of each of the enzymes KpnI and BsrEIL The digested products were then resolved
on 8% polyacrylamide gels or 2Yo agarose gels (see Section 2.6.6).
5.6.2 Results and I)iscussion
No PCR product was generated from DNA, or from peripheral blood mononuclear
cells derived from normal individuals. Therefore it was concluded that the primers
spanned at least one intron (the intron/exon structu¡e had not been published when
these experiments were carried out), and the mononuclear cell fraction from
peripheral blood of normal individuals does not express ABO mRNA. Digestion of
the RT-PCR product generated from normal bone malrow mononuclear cells from
individuals of AO, BO and OO genotype is shown in Figure 5-9.
' AO2 is one of the primers also used for the ABO PCR genotyping method described in Chapter 4.
151

316-249-
12345678910F'igure 5-9. RT-PCR of the ABO gene after diagnostic restriction enzyme digestion. RT-PCR
products \¡/ere generated from individuals whose genotype was OO (lanes I and 2), AO (lanes 3-6),
BO (lanes 7 and 8) andAB (lanes 9 and 10). Theproductwas digested withKpnl (lanes 1,3,5,7 and
9), orBs/EII (lanes2,4,6,8 and 10).
The results obtained for the cell lines in Section 5.3, were conf,irmed using the
modifîed RT-PCR. Normal bone marrow from 7 adults, and 1ó fetal umbilical cord
bloods were also examined for ABO expression. All results were repeated at least
three times from the reverse-transcription step, and were always the same for a
given individual. Of the 5 OO genotype individuals, all expressed the O allele.
Two AA genotype individuals both expressed the A allele; while the one AB
individual examined showed the expected pattern (complete digestion with BslEII).
Ten AO, and five BO genotype individuals were examined, and in all cases the
results were identical to that shown in Figure 5-9. It seems that although the O
allele is expressed in OO genotype individuals, in individuals heterozygous for the
O allele, the majority of the steady-state mRNA encoding the ABO
glycosyltransferase consists of the A or B allele.
This finding is most easily explained by the proposed relative stability of the alleles.
The O allele has a single base deletion which leads to a premature stop-codon (see
Chapter l). The instability of transcripts with premature stop-codons has bçen well
documented for a number of genes (Dunn et al., 1989; Lim et al., 1992; Cheng and
Maquat, 1993, and references therein). Lim et al., 1992 quantitated a decrease in
steady state levels of mutant mRNAs of the human B-globin gene during a block in
1s2

RNA polymerase II catalysed transcription. This lead to the proposal that
premature stop-codons leading to early termination of translation reduces the
stability of cytoplasmic mRNA, as has been observed for a number of genes
including the Rous sarcoma virus gag gene, the rabbit B-globin gene, and the yeast
URA3 and His4 genes.
The mechanism by which such transcripts are more susceptible to nucleol¡ic
cleavage is not understood, as the transcripts are polyadenylated, although a single
nucleotide change may alter the secondary struchre of the mRNA (Lim et al.,
1992). It is possible that the actual translation process influences degradation of
mRNAs with premature stop-codons. For example, when a ribosome is stalled at a
stop-codon, perhaps some kind of structure is formed that enhances the mRNA's
susceptibility to RNase attack. Alternatively, structural changes might take place
following translation of a complete reading frame, such that the recently translated
mRNA has increased stability (Lim et al.. 1992).
Altematively, analysis of human triosephosphate isomerase (TPI) gene transcripts
with premature stop-codons revealed that the cytoplasmic half-life of these mRNAs
was the same as non-mutant alleles, however the mutant transcript only constituted
approximately 20%o of the total TPI mRNA in both the nuclear and cytoplasmic cell
fractions (Cheng and Maquat, 1993). These authors also found that both the mutant
and normal alleles were transcribed at the same rate, hence they proposed that some
kind of metabolic process occurs in the nucleus that affects the stability of mRNAs
with premature stop-codons, as has been suggested for the DFIFR gene and the
minute virus of mice.
Studies on inherited mutant alleles of the retinoblastoma tumour suppressor gene
(RB1), correlate most closely to the results seen here for the ABO gene. Dunrt et al.
153

(1989), found that in the normal lymphocytes of patients with retinoblastoma
tumours, mutant alleles with premature stoÞcodons were not detected, but the
normal allele was. However, in tumours from these patients where the normal
allele was physically lost, only the mutant allele was expressed. The authors
propose that the functional RBI gene product either directly or indirectly regulates
its own transcription. When the functional product is lost, transcription of the
mutant allelc is increased to compensate for loss of the functional product.
Subsequently, the mutant transcript would be detected, despite its instability,
because it is being over-expressed.
In all of these cases, a reduction in mRNA stability was observed, regardless of
whether the premature stop-codon was generated by a frame-shift or a nonsense
mutation. The premature stop-codon in the O allele of the ABO gene, is due to a
single base deletion at nt 26l,Ieading to formation of a stop-codon at nt 352 and
subsequently early termination of translation at a.a.118. Presumably the stability of
the O allele mRNA is reduced, and like the RBl gene, it could be proposed that the
functional A or B allele product regulates ABO transcription. In OO genotype
individuals, transcription of the gene would be enhanced to compensate for the lack
of gene product, allowing detection of the transcript using RT-pcR. This
hypothesis is further supported by the RT-PCR results obtained for patient MCG,
whose genotype was OlO2. The 02 allele, which although it is non-functional does
not contain a premature stop-codon, was expressed, while no Ol allele RT-PCR
product could not be detected in this individual. Alternatively, perhaps the levels of
O allele mRNA are so low that it can only be detected by RT-PCR when there is no
competition with the A or B alleles. This seems a less likely explanation however,
as other investigators have demonstrated approximately equivalent amounts of
ABO mRNA in cell lines derived from A, B and O blood group individuals, using
Northern analysis (Yamamoto et a1.,1990a).
154

Interestingly, two samples (both AO genotype), repeatedly seemed to express
slightly more O allele relative to the A allele than seen in other heterozygous
samples. One sample (Figure 5-9, lanes 3 and 4), was from an umbilical cord blood
sample, while the other (not shown) was from a peripheral blood stem cell
collection (PBSC), It was possible that these samples were from A2O
heterozygotes, and that the stability of the A2 allele mRNA is altered by the single
base deletion and subsequent frame-shift at the three prime end of the coding
region. However, both samples genotyped as AlO. Furthermore, four of the AO
samples that showed virtually no expression of the O allele were genotyped; two
genotyped as A2O.' It is possible that in the individuals from which the cord blood
and PBSC samples were derived, the promoter of the A allele is less active than that
of the O allele, perhaps due to a polymorphism.
Further analysis of the transcriptional regulation of the ABO gene is required to
support these hypotheses, however for the purposes of this project, the normal
relative expression of the ABO alleles was sufficient to continue with a
comparative analysis of normal individuals and patients with loss of A or B antigen
expression.
5.7 DM¡CTION Of.A MINOR SPLICE VARIANT OF THE ABO GENE
During the RT-PCR analyses described above, it was noted that some samples
sometimes exhibited a different size band to the expected 316bp (see Figure 5-10;
Iane 2). The result was not consistently repeatable from the same reverse-
transcription, although it seemed to occur approximately once in every ten times a
' It was not possible to genotype all the AO control samples for the A2 allele, as the A2 genotyping
method was the final new technique developed for this project, and by this stage most of the samples
had been exhausted.
155

particular sample was amplified. The band (approximately 500bp) was usually
seen in addition to the 316bp fragment, and was detected in control bone marrows,
umbilical cord bloods, cell lines and the PBSC samples.
489/s01
1234
Figure 5-10. RT-PCR of ABO mRNA. Lane l: pTJClglHpaII marker; lane 2'. a splice variant of the
ABO gene; lane 3: RT-PCR product of the expected size; lane 4: SPPI/EcoRI marker. The sizes ofrelevant marker bands are given in base pairs.
Products of this size from individuals of various genotypes were digestedwith KpnI
and BslEII (data not shown); digestion resulted in the same pattern and relative
intensity of bands as digestion of the 316bp product from the same individuals (ie.
in AO/BO individuals there was complete digestion with BsTEII and no digestion
withKpnl), with the exception that the fragment sizes were different.
To determine if this band was truly a splice variant of the ABO gene, PCR product
generated from a cord blood was cloned and (partially) manually sequenced by
Peter Laslo. Analysis of the sequence obtained revealed complete identity between
nt 12 andnt 98 for the ABO oDNA sequence and the variant sequence (see Figure
8060
ls6
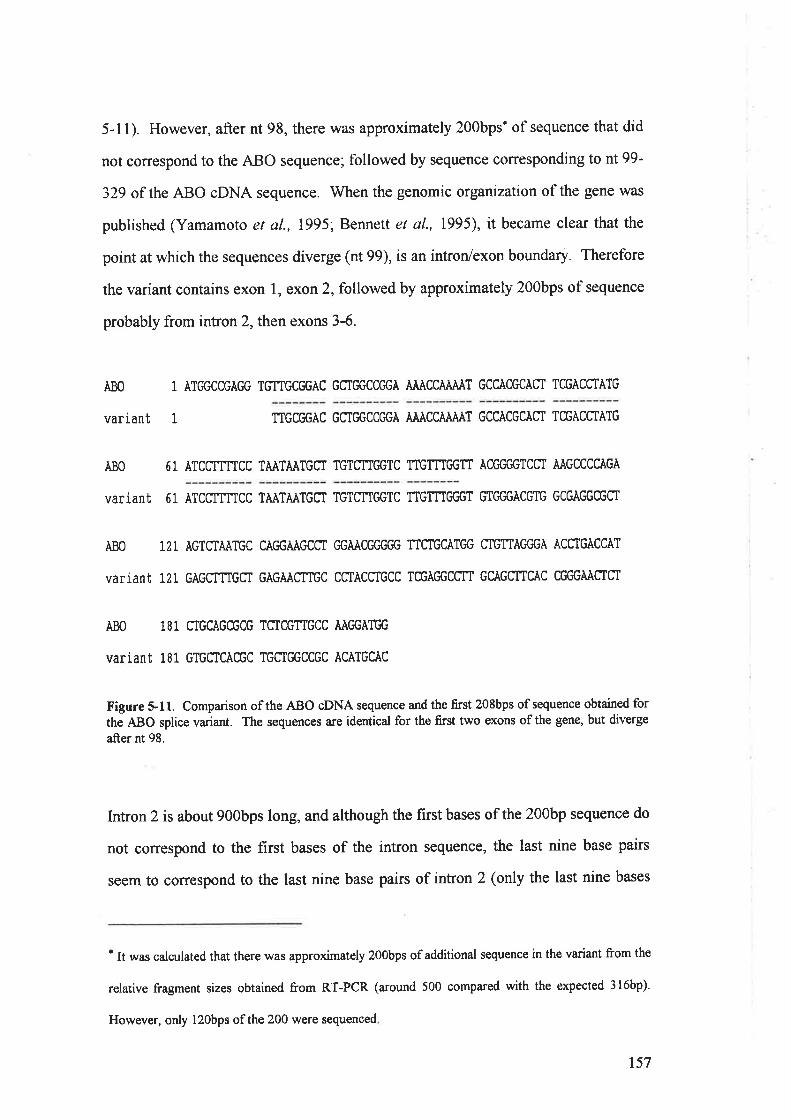
5-11). However, after nt 98, there was approximately 200bps' of sequence that did
not conespond to the ABO sequence; followed by sequence coffesponding to nt 99-
329 of the ABO cDNA sequence. When the genomic organization of the gene was
published (Yamamoto et al., 1995; Bennett et al., 1995), it became clear that the
point at which the sequences diverge (nt 99), is an intron/exon boundary. Therefore
the variant contains exon l, exon 2, followed by approximately 200bps of sequence
probably from intron 2, then exons 3-6.
ABO
variant
1 ÀTC,GCCGÀGG TGTTGCGGÀC GMC,GCCGGÀ AÀÀCCÄÀÀÀT GCCÀCGCAST TCGACCTÀTG
TTGCGGÀC GCTGGCCC'GÀ ÀÀÀCCÄÀÄÀT GCCÀCGCÀfi TCGACCTÀTG
Ä80
variant
51 ÄTCCTTTTCC TÀÀTÀÀTGII TGTqTTC'GTC TTGTTTGGfi ÀCEGC'GTCCI ÀÀGCCCCÀGÀ
5 1 ÀTCCTTTTCC TÀÀTÄÀTGST TGTCNC'GTC TTGTTTGC'GT GTGGGÀCGTG GCGAGGCGCT
ÀBO 121 ÀGTCIAÄTGC CÀC,GÀÄGCCT C'GÀÄCGGGC# TTCTGCÀTGG CTGTTÀC'GGÀ ÀC TGÀCCÄT
variant 121 GÀGCTTTGCI cÀGÀÀgtTGC CffÀCCtGCC TCGÀC'GCCIT GCÀGCTTCÄC CCfiGÄÀffgf
ABO 181 CTGCAGCGCG TSTCGTTGCC AÀGGÀTGG
variant 181 GTGCICÄCGC TGCIC'GCCGC ACATGCAC
Figure 5-11. Comparison of the ABO oDNA sequence and the first 208bps of sequence obtained for
the ABO splice variant. The sequences are identical for the first two exons of the gene, but diverge
after nt 98.
Intron 2 is about 900bps long, and although the first bases ofthe 200bp sequence do
not correspond to the first bases of the intron sequence, the last nine base pairs
seem to correspond to the last nine base pairs of intron 2 (only the last nine bases
' It was calculated that there was approximately 200bps of additional sequence in the variant from the
relative fragment sizes obtained from RT-PCR (around 500 compared with the expected 3l6bp).
However, only l2Obps ofthe 200 were sequenced
1
157

have been published; Bennett et al., 1995). Although our sequence lacks a T in this
region (see Figure 5-12), this is probably because the resolution of the bands was
limiting; hence two Ts versus three Ts in a row was diffrcult to determine.
However, two separate sequencing reactions did not reveal a G, where the last base
of intron 2 is a G. Further sequencing of this region is required to confirm this, but
at this stage we concluded that the extra 200bps in our variant sequence was the
final 200bps of intron 2. A similar splice variant isolated from an adenocarcinoma
cell line has been reported (Yamamoto et al., 1995). This variant (known as clone
FY-69-7), also contains part of the second intron sequence, although the actual
sequence has not been reported. However, this clone also lacked exon 5, while our
variant contains exon 5 (see Figure 5-13).
ACGGGABO
variantilrllll.TTACGGGill
CTT-int"o@
Figure 5-12. Compa¡ison of the ABO genomic sequence and the 3' end of the extra 200bp s€quence
seen in the ABO variant.
IIIIITVVVI VII
1000
29 99 156 204 240 375!o*900
I
['1
ABO1065
variant [tr.fl!!tKFY-69-7
Figure 5-13. Comparison of the genomic organization of the ABO gene and sequences of the variant
clone,. and clone FY-69-7. Open boxes indicate coding exons. Numbers in bold indicate the
nucleotide in the cDNA sequence at which a particular exon begins. Numbers between exons 8re
approximate sizes of introns according to Bennett et al., 1995, Only the sequence obtained for our
variant clone is shown, while the v-shaped line in the variant and FY-69-7 represent intron sequence
spliced into the ABO transcript.
158

lt appears that our variant, if translated, is non-functional, as a premature stop-
codon exists in frame at nt 130 (see Figure 5-14). Furthermore, the amino-acid
sequence deviates from that of the maturely spliced ABO transcript after 32
residues. Similar flrndings have been reported by Yamamoto et al. (1995).
918273645545' ÀTG GCC GÀG GTG TTG CC'G ÀCG CTG GCC C'GÀ AÀÀ CCÄ ÀÀÀ TGC CÀC GCA CTT CGÀ
Met Àia GIu VaI Leu Àrg Thr Leu AIa Gly Lys Pro Lys Cys His AIa Leu Àrg
63 72 81 90 99 108
CCt ATG ÄTC CIT TIC ffÄ ÀTÀ ATG CtT GTC TIG GTC TTG In c6G TGT GCiG ÀCG
Pro l'let IIe Leu Phe Leu lle Met Leu VaI Leu VaI Leu Phe Gly Cls GIy Thr
117 126TGG CGÀ C'GC GCI GÀG CTT TGC TGÀ 3'Trp Arg Gly Àia Glu Leu Cys ***
Figure 5-14. Predicted amino acid sequence encoded by the ABO splice variant. Translation wouldbe prematurely terrninated as a result of the stop codon at nt 130, producing a non-functional protein
product.
5.8 A¡q,ÀLySIS OFABO GENE EXPRESSION IN PATIENTS IVITH COLON CANCER
ABO gene expression was examined in the tumours genotyped in chapter 4.
Although the genotype of these tumours in each crrse agreed with the blood group
of the patient, it was possible that the ABO gene was not being êxpress€d; leading
to loss of A/B antigen expression that is commonly seen in carcinoma (see Section
1.23). The aim of this set of experiments was to determine whether or not these
tumours expressed the ABO gene, using RT-PCR and immunohistochemistry.
5.8.1 Expression of the ABO gene in colon tumours
RT-PCR was carried out as described in Sections 5.3 and 5.6. All 17 of the
tumours expressed the ABO gene, and digestion of the RT-PCR product revealed
the expected pattern and/or relative intensity of the bands in 15 cases. However,
tumours from 2 patients (ID Q232171 a¡d 508864), repeatedly exhibited more O
159

allele derived product than seen in normal controls (approximately 40-50% of the
total RT-PCR product; data unable to be shown). The tumours were graded as
Duke's stage B and C and genotyped as AO and BO respectively. It appeared
therefore, that the A and B alleles of these tumours were being down-regulated, as
genotyping had previously shown no difference in allele dosage relative to that of
the normal mucosa adjacent to the tumour and to normal controls. Although DNA
isolated from normal tissue adjacent to the tumour was available, neither RNA nor
actual tissue was available to compare the expression patterns found in the tumours
with normal expression in the patient.
If the A or B alleles were being down-regulated, it would be expected that antigen
expression in the tumours was also suppressed. To determine if this was the case,
immunohistochemistry was attempted by Ms Vivian Pascoe, Dept. of
Histopathology at the QEH. However, staining of the tumours and normal stomach
mucosa was not repeatable; therefore no conclusions could be made from these
experiments. Furthermore, it was not clear how much normal tissue contaminated
the tumour samples.
Although these results indicated disruption of ABO gene expression may play a role
in colon carcinoma, we did not have the appropriate skills to carry out a conclusive
study. Furthermore, we had knowledge that several major groups were (and still
are) specifically examining expression of the ABO gene in carcinoma (ie. Henrik
Clausen, Fumi-ichiro Yamamoto and Sen-itiroh Hakomori), subsequently, we
decided not to pursue this avenue of investigation any further.
160

5.9 AXNIYSIS OF'ABO CEXN EXPRESSION IN PATIENTS WITH HAEMATOLOGTCAL
MALIGNANCY AND LOSS OF ANTIGEN EXPRESSION
To determine if the AIIO gene was being expressed in patients with haematological
malignancy and loss of antigen expression, samples were examined using the
method described in Section 5.6., with the exception that cDNA was amplified for
45 cycles, using lU of Taq DNA polymerase (as opposed to 35 cycles and 0.5U of
Taq normally used). Normal controls were always amplified simultaneously, and
produced the expected results. ABO RT-PCR product could be generated from all
but three samples (GN PB 419192; PM and BA), although strong bands were
obtained following amplification of cDNA from patients PM and BA with the p-
globin primers (not shown). The fact that ABO RT-PCR product was able to be
generated from PB samples from some of the other patients (eg. WM, NR and CG),
but not from normal PB samples indicates the different cell populations present in
PB of patients with haematological malignancy. For example, blast cells are not
normally found in PB. Furthermore, there could be increased numbers of other
immature cell forms in the PB of these patients that express the ABO gene.
RT-PCR product generated from samples from AO genotype patients was digested
with KpnI and BslEII (see Figure 5-15 and Table 54). All but two of the samples
solely expressed the O allele; there was no expression of the A allele of the ABO
gene. For the sake of simplicþ, the results have been combined with loss of
heterozygosity studies in Chapter 4, and are described on a case by case basis.
161

AN GN BM GN PT MR NR PB NR PE WM MA CG T]NI)
Figure 5-15. RT-pCR and differentiation of the alleles of the ABO gene in patients with loss of A antigen expression and haematological
-ulignunry. Samples are paired digests (KpnI, BslEII) of the 316bp ABO RT-PCR product. When more than one sample of a patient was
analysed, itt tu-pt. is identified (BM- bone marrow PB- peripheral blood; PT - post-transplant; PE- pleural effusion). rrlJì\iDrr is undigestedpCR product. Complete digestion of the product vnth KpnI,as seen in patients AN, GN, NR, WM and MA indicates expression of the O allele,
and is identical to the pattern of bands obtained from a normal O blood goup individual. Complete digestion of the product with BsrEII, as
seen in patient MR indicates sole expression of the A allele, as is seen in normal A blood group individuals. The pattern of bands in patient CG
reveals ìh. pr.r.rr"e of O allele transcripts, but the majority of the ABO mRNA in this patient is derived from the A allele. The weak bands
seen in the iamples from patients NR and WM have resulted from digestion of an ABO splice variant, and probably indicate transcription ofthe variant has also occurred from the O allele of the ABO gene, as the digestion pattern is the same as that seen of the variant in normal blood
group O individuals.
162

Patient Antigenttlost" ABO genotype LOH ABO RT.PCRproduct
ABO expression
AN A A20 o ./ oGN A A20 A
^/o
MR A A20 o { ANR A ArO { oWM A AIO { oMA A ArO 't/ oCG A A2o+o ./ AOPM A AIO nlaBA A AtO nla
WD A A2B ./ nd
SR A A2B"J
nd
KN A/B AIB ./ nd
DH A/B AIB ./ nd
Table 5-4. Summary of the results obtained from analysis of the ABO gene in patients with loss ofA/B antigens and haematological malignancy. LOH indicates the allele lost if LOH had occurred, a
dash indicates normal allele dosage. The assumption that patient CG had 3 copies of the ABO gene is
indicated by his genotype. A tick below the heading ABO RT-PCR product indicates a positiveresult; a dash indicates no ABO RT-PCR product was able to be amptfied, however the samples fromthese patients expressed the p-globin gene. n/a:not applicable; nd:alleles were not distinguished.
Patíent AN
Genotyping of this patient revealed that most cells were probably AO, but some
cells had physically lost the O allele. The red cells of the patient however, had lost
expression of the A antigen. RT-PCR and restriction enzyme digestion (herein
termed ABO phenotyping), revealed that of the cells in this patient's bone marro%
those expressing the ABO gene only expressed the O allele. These results are best
explained by the presence of multiple leukaemic clones, at least one of which had
LOH at the ABO locus, and one had transcriptional silencing of the A allele of the
ABO gene. As the cells expressing the ABO gene only expressed the O allele, loss
of A antigen expression from the patient's red cells could be explained.
163

Patìenl GN
Three different samples from this patient were examined. ABO genotyping
revealed that in pre-transplant BM and PB samples, the A allele of the ABO gene
was physically lost. The post-transplant (remission) BM sample genotyped OO,
reflecting replacement of the patient's marrow with that of her OO genotype donor.
In accordance with the genotyping results, ABO phenotyping only showed
expression of the O allele in both BM samples; once again indicating that in the cell
population expressing the ABO gene, only the O allele was expressed. This was
probably the same cell population that had physically lost the A allele. RT-PCR of
the pre-transplant PB sample of this patient was unsuccessful as determined by lack
of B-globin RT-PCR product. This was almost certainly due to RNA degradation,
which was confirmed by gel analysis. Loss of A antigen expression from the red
cells of this patient was therefore due to loss of the A allele of the ABO gene.
Patíent MR
Genotyping of this patient revealed physical loss of the O allele, probably in most
cells. ABO phenotyping showed the normal pattern of expression for an AO
heterozygote; that is expression of the A allele. These results do not seem to
explain loss of A antigen expression from the patient's red cells. However, analysis
of the patient's serological details described in Chapter 3 (Table 3-1), indicates that
on|y l2%o of the red cells did not express the A antigen. Ft¡rthermore, H antigen
expression was not determined in this patient. There are two possible explanations
for the results obtained for this patient: the cells that had lost A antigen expression
in fact had lost expression of the precursor H antigen, or the major leukaemic clone
in this patient had physical loss of the O allele, while a minor clone existed that
either had physical loss or transcriptional silencing of the A, or both the A and the
O alleles.
t64

Patients NR and llM
The results from both of these patients are most striking. Both genotyped as AO,
and both had loss of A antigen expression from their red cells. Equal allele dosage
was confirmed by Southern blotting of samples tiom the patients that contained
>85yo blast cells, and therefore were almost purely derived from the leukaemic
clone. ABO phenotyping revealed that the O allele r¡/as expressed, while there was
no indication of A allele expression. Furthermore, digestion of the ABO splice
variant described in Section 5.7, from both patients revealed that it too was
transcribed from the O allele, as the product completely digested with KpnI.
Subsequently, loss of A antigen expression in these patients was explained by
transcriptional silencing of the A allele of the AIIO gene, an allele specific event, as
the O allele was expressed.
Patíent MA
ABO genotyping again revealed equal allele dosage of the A and O alleles, however
ABO phenotyping revealed that in the cell population expressing the ABO gene,
there was transcriptional silencing of the A allele. Hence, loss of A antigen
expression was explained.
Patíent CG
This patient was diagnosed with CML. By combining AEIO genotyping and
cytogenetic results, we concluded that the leukaemic cells of the patient each
carried two copies of the O allele, and one copy of the A allele. ABO phenotyping
revealed expression of both the A and the O alleles, although the O allele
represented significantly more of the total ABO RT-PCR product than usually seen
in normal individuals. This could be explained by the presence of two copies of the
O allele being simultaneously transcribed with the A allele. This hypothesis does
not, however, explain loss of A antigen fromT}Yo of patient's red cells. As 30% of
t65

the patient's cells were expressing A antigen, it is possible that the results are
complicated by the presence of cells expressing normal relative amounts of the
alleles. Analysis of the AEIO gene in this patient would best be determined by
erythrocyte culture; in which case individual colonies expressing the AEIO gene
could be examined.
Patíent PM
No ABO RT-PCR product could be generated from the PB sample obtained from
this AML patient. However, a strong band was obtained following amplification of
the oDNA with the p-globin primers; indicating the success of the reverse-
transcription reaction. As the sample used was PB, it is possible that lack of ABO
amplification was merely a representation of the normal situation, as PB from
healthy individuals does not contain significant numbers of cells that express the
ABO gene. Alternatively, it is more likely that the PB sample from patient PM
contained cells that would normally express the ABO gene, and the gene has been
inactivated as part of the pathogenic process. For the duration of this project,
amplification of oDNA from PB samples from patients with AML and CML
(without loss of antigen expression) has always resulted in ABO RT-PCR product,
which probably indicates the expression pattern of blast cells. Therefore it was
concluded that the most likely explanation for loss of A antigen expression in this
patient was inactivation of both alleles of the ABO gene.
Patient BA
Genotyping of this patient did not reveal abnormal allele dosage, although the
percentage of malignant cells in the PB sample examined was unclear. Like the
patient PM, there \ryas no amplification of the ABO mRNA, although p-globin RT-
PCR produced a strong band. Unlike the patient PM, patient BA had (suspected)
MDS. The differential cell count of the PB sample examined did not report any
t66

blast cells or erythrocyte precursors. Subsequently, no conclusion could be reached
concerning loss of A antigen expression in this patient without examination of a
bone marrow sample, which was not available.
Patíents IAD and SR
Both of these patients genotyped as AB and had lost expression of the A antigen
from their red cells. ABo RT-PCR was not attempted on patient WD, as no RNA
could be isolated from the patient's sample. While patient SR expressed an ABO
RT-PCR product, our method does not distinguish the A and B alleles, and hence
the relative expression of the alleles was not determined. Attempts to develop such
a method were terminated, as only one contol AB sample was available. It is
possible that the weak A antigen expression seen in these patients was due to the
fact that both carried thc A2 allele. As described in Chapter 4, the A2 transferase is
significantly less effrcient at converting the precursor H antigen than the B
transferase. Therefore, whether or not there was acfual antigen loss, or A2 antigen
expression in these patients was at the lower end of the normal range, remains
unresolved.
Patíents KN and DH
These patients both exhibited distinct populations of red cells; A, B, o and
(presumably) AB. No abnormal allele dosage could be shown, and samples from
both patients expressed the ABO RT-PCR product. Even if a method had been
developed to determine the relative expression of the A and B alleles, it would not
have been useful due to the multiple red cell populations. The best way of
examining these patients would be erythrocyte culture, in which case single BFU-E
(Blast-Eorming Units, Erythroid) colonies could be analysed both for allele dosage
and ABO gene expression. This was attempted as part of Ms Michelle Pedler's
167

honours project in the laboratory, but no colonies were obtained, probably due to
technical problems with the procedure.
Although some of the patients were reported to have weak A antigen expression, no
expression of the A allele was detected (eg. patient MA). One explanation for this
is that the defect in ABO transcription is limited to the haemopoetic lineage.
Subsequently, secreted antigens could be adsorbed by the red cells, leading to weak
A antigen expression. However, secretor status was unknown in most of the
patients. Another possible explanation is conversion of the precursor H antigen on
the cell's surface by serum (AlB) transferases. However, this would not explain the
complete loss of antigen expression seen patients GN, BA, and NR.
Perhaps the most likely explanation for the weak antigen expression seen in some
of these patients is the time point in their disease at which they were examined. As
described in Chapter 3, mixed-field and weak reactions are rarely observed. By the
time such a reaction is noted, a significant number of the cells are usually affected.
As antigen expression in such patients tends to decrease with progression of the
disease, it is possible that the red cells in the patient's circulation consist of a
mixture of "old" cells normally expressing the A antigen that are derived from a
normal progenitor cell, while those with loss of antigen expression are derived from
the leukaemic progenitor. In this situation, large agglutinates of the "old" cells
would take longer to form because they would be interspersed by red cells not
expressing the A antigen. Therefore, if the agglutination reaction was allowed to
continue (with mixing) for longer than usual, the cells would form larger
agglutinates more characteristic of a mixed-field reaction. In fact, this is exactly
what occurred with the blood-grouping reaction on patient SR shown in Figure 3-2.
168

If this hypothesis was correct, it would follow that the patient MA was examined
during a transition period, at the point where although cells expressing the A
antigen remained in the circulation, the only cells expressing the ABO gene were
derived from the leukaemic clone.
Finally, it should be considered that when PB samples from patients with loss of
antigen expression were examined, cells were present that expressed the ABO gene,
whereas in normal individuals no expression is seen. Therefore one would expect
that the cells expressing the ABO gene in the PB of these patients are in fact solely
derived from the leukaemic clone. The exception to this is patient CG, whose PB
sample expressed the A allele. However, it could be argued that excess
reticulocytes or other ABO expressing cells derived from normal progenitors were
in the patient's circulation as a specific feature of his disease (CML); the numbers
of erythroid progenitors are known to be increased in the blood of CML patients
(Henderson and Lister, 1990).
What appears to be transcriptional silencing of the A allele may in fact be due to an
abnormal alternative splicing event. The A allele could be spliced in such a way
that one (or both) of the regions containing the primers is spliced out; therefore
amplification would only be able to occur from the normally spliced O allele. This
would imply an allele-specific splicing event, which is possible if there is a
mutation altering a splice site. However, two of the patients were also examined
using the RT-PCR method described in Section 5.3. Both patients (NR and WM;
data not shown), only expressed the O allele. As this method uses two different
primers and all four primers used for these two methods are in different exons (1, 5,
6 and 7), it is unlikely that such an event has occurred.
169

One obvious explanation for the results seen is that the A allele has a mutation in
the promoter region, or that the promoter region is deleted. Alternatively, there
could be mutation leading to a premature stop-codon and subsequently disrupted
mRNA stability, although this would require the transcript to be less stable than the
O allele. While these events can not be ruled out, the findings in Chapter 4 that
LOH is occurring at the ABO locus strongly suggest that loss of A/B antigens is an
indication of a larger event that is occurring. It was therefore concluded that the
most likely explanation for loss of expression of the A allele, was transcriptional
silencing of a single allele of the ABo gene probably due to some kind of
epigenetic change.
5.10 IUpnINTINGAIID LoSs oFABO ANTIGENS?
The results obtained in the previous section show transcriptional silencing of a
single allele of the ABO gene has occurred in several cases. Mono-allelic
expression of an autosomal gene is almost always indicative of imprinting.
Although the ABO gene is obviously not normally imprinted or subject to random
allelic exclusion (otherwise AB, AO and BO individuals would exhibit distinct cell
populations), it is possible that at some stage during embryonic development, or
during development of some cell lineages, imprinting of the ABO gene occws.
Furthermore, during a period of this project, it was thought that the ABL gene,
which is closely linked to the ABO gene, was imprinted. Hazs et al. (1992) used
cytogenetic polymorphisms of the ch¡omosome 9 centromere to show that in CML
patients, the chromosome 9 portion of the Philadelphia çhromosome was almost
always paternally derived. However, imprinting or random allelic exclusion of the
ABL gene was not supported by molecular studies (Melo et al., 1994; Melo et al.,
1995). Whether or not ABL is imprinted is still being argued in the literature (Haas,
1995, Litz,1995). As our results indicate possible imprinting of the AIIO gene, we
t70

Table 5-5' ABo blood groups of patients with haematological malignancy and loss of A antigenexpressioq and their parents.
Some of the reports of patients with loss of A or B antigens in the literature include
family studies. We were able to find-nine such cases, all of which were informative
(see Table 5-6). In eight of the nine cases, expression of the maternally inherited
ABO allele was affected.
attempted to determine if there was any parental bias in the contribution of the
affected allele.
5.10.1 Results and Discussion
We were able to obtain the parental blood groups of four patients with loss of Aantigen expression (Table 5-5). Three cases were informative, and in all three
cases, the silenced allele was maternally derived.
Patient Blood group Mother's bloodgrouD
Father's bloodgroup
AN A A oNR A A oPM A A BGN A A A
Table 5-6' ABO blood group changes/inferred genotypes of patients with haematological malignancyand their parents, as deduced Êom the literature. EL refeis to erythroleukaemia; CLL is chroniclymphatic leukaemia. { indicates the father's blood group *u, not reported, however the authorsstate that the Al allele of the patient was maternally inherited. For the sake of simplicity, the bloodgroup changes have been summarised to indicate the antigen lost; eg. ',AlO-+Ou å, oppor.¿ to ',"mixture of Al and weakly A positive cells".
Patient'sblood sroun
Age Diagnosis Mother'sblood grouo
Father'sblood srouo
Reference
Alo-+o ? AML 4l oo Van Loghem et al., 1957Alo+o 32 AML oo AIO Salmon et al., 1958Alo+o ? AML AIO A20 Salmonet al. 1959Al-+O 26 AML AIB * Salmon et al., 1959
Alo-+o l9 AML 4l oo Gold el t959A2o-+o l0 EL ñ oo Salmon et ql., 196lAB-+A 40 CLL BO AO Richards, 1962B+O 24 AML AIB ? Undevia et al., 1966
A2o-+o ? leukaemia A20 oo Salmon, 1976
t7l

Including our data, the maternally derived ABO allele was affected in 11/12
patients. If the parental contribution of the affected allele was randomly
determined, the probability of observing loss of expression of the same sex parent's
allele in 1l or more of the patients is 0.006. These results indicate that silencing of
A or B alleles may occur as a result of imprinting. This would imply that the
imprint was not erased following the neo-natal period, at least in some cells.
Subsequently, it is possible that loss of antigen expression is merely a reflection of
the clonal expansion that occurs in malignancy, and in fact has no role in the
pathogenesis of the disease. Alternatively, other linked genes might be silenced in
addition to the ABO gene. If one of these genes was a tumour suppressor gene,
physical loss of, or a mutation in the expressed copy, would lead to
leukaemogenesis.
The latter hypothesis is further supported by the data on patient AN. In Section 5.9,
it was proposed that there were two leukaemic clones in this patient, one of which
had physically lost the O allele, and one of which had silencing of the A allele. It is
possible that silencing of the A allele occurred first, and physical loss of the O
allele occt¡rred in one such cell as a "second hit", producing the second clone.
Subsequently, there would be a clone of cells in which the ABO gene, and possibly
closely linked genes were completely knocked out, and a clone of cells in which a
putative tumour suppressor gene w¿rs still active.
This hypothesis however, does not explain the results seen for patient MR, who
genotyped AO, but had physically lost the O allele from the majority of his cells.
Although this patient expressed the A allele, only l2Yo of his red cells had actually
lost A antigen expression. If loss of A antigen expression from these cells was due
to silencing of the A allele, then the implication would be that the first event was
LOH, and the second event silencing. Could it be possible that the mechanism by
172

which maintenance of appropriately imprinted genes occurs, can be "switched on"
under abnormal conditions?
If such a phenomenon could occur, it might explain the results from patients KN
and DH. These patients both exhibited four distinct populations of red cells, which
could be determined by serological analysis because both patients originally
grouped as AB. While three populations of red cells could easily be explained by
proposing silencing of one allele, and evolution of the clone by deletion of the other
ABO allele, it is difficult to explain the presence of four red cell populations.
Furthermore, whatever events are leading to this phenomenon, could be occurring
in the patients who genotype AO and have loss of A antigen expression, as
serological analysis would not expose this kind of event in these patients. However,
it could be argued that the event occurring in the patients with four red cell
populations does not happen very often, as there is only one similar case reported in
the literature (Renton et al., 1962).
t73

Suunmnv
An RT-PCR method utilising restriction enzyme digestion to differentiate the A/B
and O alleles of the ABO gene was established. Examination of normal AO and
BO genotype individuals revealed that the majority of steady-state ABO mRNA is
derived from the A or B allele. The stability of O allele mRNA is probably reduced
due to the presence of a prematwe stop-codon, a phenomenon which is commonly
seen in other genes. In individuals of OO genotype however, the O allele was
expressed, implying that transcription of the ABO gene is directly regulated by its
own gene product.
In the previous chapter, two individuals who genotyped as AO but were
unequivocally blood group O were identified. Expression of the ABO gene was
examined in one of these patients, and the expressed allele sequenced. Sequence
analysis revealed several single base substitutions, one of which leads to an amino-
acid change. This allele was later cloned and sequenced by another group, and
identiflred as the 02 allele. We subsequently developed a PCR method to
distinguish the 02 allele from the Al allele, and analysis of the second patient who
had previously genotyped AO revealed that her true genotype was OlO2.
During analysis of ABO gene expression in normal individuals, it became clear that
a splice variant of the gene existed, probably constituting of a minor proportion of
the total ABO mRNA, as it could not be consistently amplified from the same
reverse-transcription reaçtions. This variant was cloned and sequenced, and
comparison of the sequence obtained with that of the ABO cDNA sequence
revealed that approximately 200bps of intron 2 sequence was spliced into the
transcript at the intron/exon boundary of the 3'end of exon 2. A similar variant has
been cloned by another group, although there are two important differences
between the variants. Firstly, ours was cloned from normal tissue (umbilical cord
174

blood), while the other variant was cloned from an adenocarcinoma cell line.
Secondly, the other variant does not contain exon 5, while our variant does. The
variant is predicted to be non-functional, as a stop-codon exists in frame, and would
lead to termination of translation after just 43 residues.
Analysis of ABO gene expression in samples from patients with loss of A and/or B
antigens and haematological malignancy showed that I0ll2 expressed the ABO
gene. Of the nine AO genotype patients examined, seven solely expressed the O
allele, while one expressed significantly more O allele than controls, and the final
patient had normal A allele expression. It was concluded that although the A allele
was physically present in four of the samples, it was transcriptionally silenced. One
patient had lost the A allele, presumably from the cells that were expressing the
ABO gene. The results in the two patients in which expression of the A allele was
detected are best explained by the presence of multiple leukaemic clones and/or the
presence of significant amounts of normal cells.
As mono-allelic expression of autosomal genes is usually associated with
imprinting, data from the patients presented here and compiled from the literature
was investigated to determine if there was any bias in the parent contributing the
affected allele. The results were highly significant; the affected allele was
maternally derived in IIll2 cases.
As it is unlikely that the ABO gene is the primary locus at which this event is
occurring, the next stage in this project was to define the affected region, beginning
with a study of the linked AKI gene.
175

CnnprER Srx
AN¿,.rYSrs oF THEAonNYLATn KrNasE 1 GENE

6.0 INTRODUCTION
The previous chapters have shown that in at least in some patients with loss ofblood group antigens, loss of antigen expression is due to transcriptional silencing
or physical loss of a single allele of the ABO gene. Salmon et al. (196g), and Kahn
et al' (1971) reported a simultaneous decrease in red cell antigens and the red cell
enzyme, adenylate kinase 1 (AKl; see section 1.20). patient wM, who was also
described by Marsden et al. (rgg2), also had simultaneous loss of A antigen
expression and a decrease in AKl activity. The AKI gene is located approximately
15 megabases closer to the centromere than the ABO gene, at9q34 (Attwood et al.,
1994). Considering the proximity of these two genes, and the biochemical evidence
suggesting concurrent loss of ABo antigens and AKI activity, we wished to
examine the AKI gene at the molecular level.
Prior to this study, none of the reported porymorphisms in the AKr gene had been
localised to the transcribed region. Consequently, it was not possible to examine
the relative expression of the alleles, using RT-pcR. Although there are two
electrophoretically distinguishable isozymes of AKl, AKI and AK2 Gildes and
Harris, 1966)' and the genetic sequence of the AKI variant has been determined
(Matsuura et al., 1989), the sequence of the AK2 isozyme has not been reported.
This chapter describes the localization of a known restriction en;rqepolymorphism to the transcribed region of the AKI gene, and subsequent studies
using this and other polymorphisms to examine the AKI gene for LoH and mono-
allelic expression in patients with loss of A or B antigen expression.
177

6.1 RnrloNALE
A literature search revealed three papers describing restriction enzyme
polymorphisms in the AKI gene. Puffenberger and Francomano (1991), described
DdeI and, KpnI polymorphisms within intron 5 of the gene. As a cDNA
polymorphism was sought, this information was temporarily disregarded. Bech-
Hansen et al. (1989), described a TaqI polymorphism detected by Southern
analysis, using a probe containing a region of the AKI gene. Schuback et al.
(1991), used the same probe to detect a BanI restriction enzyme polymorphism.
Comparison of the probe sequence used by Bech-Hansen et al. (1989), and
Schuback et al. (I99I), and the known genomic sequence of AKI (Matsuura et al.,
1989), allowed an approximate localizationof the polymorphic Banland ZaqI sites.
6.2 Tnnonnnc^lr, LocALtzATroN oF THE BANI RESTRrcrroN ENzyME
POLYMORPHISM IN THE AKl CNXN
The probe described by Bech-Hansen et al. (1989), was a 3.25kb BamIn genomic
DNA fragment, known as phAKlB3.25, which spans exons 2-5 (nt3,463-6,794) of
the AKI gene. Schuback et al. (1991), reported that Southern blotting of BanI
digested DNA with the phAK1B3.25 probe detected a constant band of 1.7kb, and
two polymorphic bands of 2.2 and 1.6kb (frequency 0.76 and 0.24 respectively), in
a study carried out on individuals from the North American population. Analysis of
BanI restriction sites in the genomic sequence of the AKI gene revealed two
possible positions for the polymorphic BanI site (see Figure 6-1).
178

3037
B 3623
5223 /5237 5474 s763
BBB
74r2
B1.6
1.6
Figure 6-1. Diagrammatic representation of the AKI gene, from nt 3,037-7,412. BqnI restrictionendonuclease sites a¡e indicated by "8". The numbers within the boxes a¡e the predicted fragmentsizes in base pairs. The shaded grey box represents the phAKlB3.25 probe used by Schuback el a/.,1991, to probe BønI digested DNA. The dotted lines represent possible sites for the BanIpolymorphisms, to produce the l.6kb band (based on the sequence in Matsuura et al., 1989).
The origin of the constant 1.7kb band can be determined from Figure 6-1 (ie. the
l649bp fragment). The 14, 237 and 289bp fragments were probably not detected
due to their small size. The identity of the 2.2kb polymorphic band can also be
determined from Figure 6-1. In order to produce the 1.6kb fragment, the
polymorphic site must be in the vicinity of either nt3,623 or nt4,637 (indicated by
the dotted lines in Figure 6-1). These nucleotides are located within introns I and2
of the gene respectively, with several hundred base pairs of intron sequence on
either side. Therefore it was considered unlikely that the BanI plymorphic site
existed within the transcribed region of the gene. However, to test this, cDNA
specific primers spanning exons l-5 of the AKl gene were designed, and the
amplified product examined for a Banl polymorphism.
Bech-Hansen et al. (1989), reported that the phAKlB3.25 probe did not detect any
polymorphisms in genomic DNA digested with the following enzymes: Bamlil.,
Bglll, BsfEII, EcoRI, HindIII, MboI, Mspl, PstI, PvuII, Rsal, S¿cI and XbaI. As the
region of the AKI gene that was to be amplif,red to test for a BanI polymorphism
comprises about 46Yo of the entire transcribed region of the gene, the AKI RT-PCR
product was also examined for polymorphisms using the following restriction
enzymes: TaqI, Hhal, BslNI, DdeI, Alul, KpnI and Mspl.
2186 237 289 t649
179

6.2.1 Materials and Methods
RNA was isolated from 12 umbilical cord bloods and reverse-transcribed as
described previously (see Sections2.6.2 and 2.6.5). Amplification of 5pl of cDNA
under the standard conditions was carried out using the following primers:
AKCD A 5' CACCCCTCCCCAGAGAGCACTGAC 3'
AKCDB 5' ATTGACTTTGGCCACCATGGCATC 3'
(sense)
(anti-sense)
Digestion of l0¡rl aliquots of the resulting RT-PCR product with l0 units of the
restriction enzymes: Banl, TaqI, HhaI, .BsfNI, Ddel, Kpnl, Msl $ew England
Biolabs), and AIuI (Boehringer-Manneheim), was carried out according to the
manufactwer's instructions. The restricted products were resolved on 8%
polyacrylamide gels as described in Section2.6.6.
6.2.2 Results and l)iscussion
The primers designed span nt 971-6703 of the AKI genomic DNA sequence
(Matsuura et al., 1989). The sense primer is located in exon I and 2 (nt 28-51 of
thc cDNA sequence), while the anti-sense primer is in exon 4 (nt 329-306 of the
cDNA sequence). Therefore it was predicted that these primers would generate a
302bp band from cord blood oDNA, and no product from genomic DNA. The
results obtained confirmed this, as is shown in Figure 6-2. No AKI product was
generated from peripheral blood mononuclear cells.
180

Mt234s67
Figure 6-2. Amplification of AKl using the primers AKCDA and AKCDB. No product is generated
from genomic DNA (lanes l, 2 and3), or from peripheral blood mononuclear cell cDNA (lanes 6 and
7). A 302bp product was generated from umbilical cord blood cell cDNA (lanes 5 and 6). The
marker (M) is pUCl9lHpaII.
The 302bp product generated by the primers AKCDA and AKCDB has a single
BanI rcstríction site (position 5,763 of the genomic AKI sequence). This was used
as an internal control far BanI digestion. Of the 12 samples tested, none contained
an additionalBanl site (datanot shown). This is not surprising, as exons 2 and3
comprise only 76bp; compared with introns 1 and 2, which consist of
approximately 4,500bp. From the reported allele frequencies (Schuback et al.,
1991), one would expect four of the 12 individuals examined to be heterozygous for
this polymorphism, if it were contained within the region amplifred. It was
therefore concluded that the BanI polymorphic site was probably in either the first
or second intron of the AKI gene.
Digestion of the AK1 product with the other enzymes yielded the predicted sizes
and number of bands; AluI(S),BslNI (3), DdeI(3), HhaI(l), Kpnl(l), MspI (4) and
TaqI (l) (data not shown). It was concluded that the region amplified by the
AKCDA and AKCDB primers was not highly polymorphic for any of these
enzymes.
181

6.3 TneORnrtCnl LOCALIZATION OF THE TtQl RESTRICTION ENZYME
POLYMORPHISM IN THE AKI GENE
Bech-Hansen et a/. (1989), reported that the phAKlB3.25 probe detected two
polymorphic bands of 6.4 and 5.5kb in TaqI digested genomic DNA, with allele
frequencies of 0.79 and 0.21 respectively. Other (constant) bands detected were a
strong l.3kb and two weaker 0.3kb and 1.4kb bands. Combined wrth the
information gained from the genomic sequence, the restriction map shown in Figure
6-3 was constructed.
2195 3603 487815163 7507 11350 12188
1408 1275 i 2344 3843
TTTT
Figure 6-3. Diagrammatic representation of the AKI gene, from nt 2,195-12,188 (the end of the
knãwn sequence), Taqlrestnction endonuclease sites are indicated by "T". The numbers within the
boxes a¡e the predicteà fragrnent sizes in base pairs. The shaded grey box represents the 3.25kb
Bamln fragment used by Bech-Hansen et at. (1989), to probe ZaqI digested DNA. The map is
drawn to scale.
The origin of the constant 1.3, 0.3 and 1.4kb bands described by Bech-Hansen et al-
(1989), can be determined from Figure 6-3, implying that the Taql polymorphism is
in the three prime end of the gene. However, considering this map, it would be
expected that one of the polymorphic bands was approximately 2.3kb. The
polymorphic bands detected by Bech-Hansen et al. (1989), however, \ryere
estimated at 6.4 and 5.5kb. However, if the TaqI restriction site at nt 7 ,507 did not
exist, a fragment of about 6.2kb would be detected. This was considered a likely
scenario, therefore the first step in these experiments was to test if the Taql site at
nt7,507 did in fact exist in the general population.
TT
t82

6.3.1 Materials and Methods
Primers spanning the region of interest, nt7,507 in the AKl gene, were designed.
The sequence of these primers was based on (but different to) those described by
Puffenberger and Francomano, (1991), and ampliff nt7,405-8,424. These primers
also span the DdeI and KpnI polymorphisms within intron 5 of the AKI gene.
Genomic DNA from 5 individuals was amplified using the following primers:
AKGEN2A
AKGEN2B
5' CAGGATGGCACCCCACACACG 3'
5' CGGCACCTACAACAGCCCTGGAAG 3'
(sense)
(anti-sense)
PCR was ca¡ried out as described in Section 2.6.4 with the exception that the
followrng amplification cycles were employed; 94oC for 5 minutes, followed by 35
cycles of 96oC for 30 seconds, ó3'C for 30 seconds, and 72C for I minute. Ten
microliter aliquots of the resulting PCR products (1019bp), were digested ovemight
in a total volume of 20¡rl, with 10 units of TaqI resñction endonuclease (New
England Biolabs), according to the manufacturer's instructions. As a control for
TaqI digestion, DNA isolated from lambda phage was also digested. The restricted
samples were then resolved ona2%o agarose gel (Section2.6.6).
6.3.2 Results and l)iscussion
None of the five samples digested vøth TaqI, although the control, Lambda phage
DNA completely digested (data not shown). These results suggested that the Taql
restriction enzyme site at nt 7,507 in the AKl sequence did either (i) not exist; was
simply a sequencing error, or (ii) was in fact the polymorphic site, or (iii) was either
unique to the individual or the Japanese population the original sequence was
determined in.
183

If the site at nt 7,507 was the polymorphic site, then the ó.4kb band detected by
Bech-Hansen et al. (1989), could be explained. However, the presence of the 5.5kb
band would require both loss of the Taql site at nt 7,507, and gain of another laql
site at about nt 10,500, simultaneozsþ. This was therefore considered unlikely.
Based on the assumption that the TaqI site at nt 7,507 was rare or non-existent, at
least in the South Australian population, the following updated restriction map was
produced:
2r95 3603 48795163 11350 12188
1408 r27s þ'þ 6187
T T TT s900 10500 1
Figure 6-4. Updated Taq I restriction map of the region nt 2,195-12,188 of the AKI gene. The
AKt probe is indicated byìhe grey rectangle. Constant ZaqI sites a¡e marked by uT". The proposed
6.4 G.Ðkb band detected by Bech-Hansenet ql. (1989), is shown in bold, whilst the two possible
polymorphic sites are indicated by dotted lines at nt 5,900 and 10,500'
As indicated in Figure 64, there were two possible sites for the TaqI
polymorphism. The 5.5kb band detected by Bech-Hanseî et. al. (1989), could be
accounted for if a polymorphic site existed at either nt 10,500, or at nt 5,900.
However, if the site was indeed at nt 5,900, one would also expect to see a smaller
band, of around 700bp. As bands as small as 300bp were able to be detected by the
Bech-Hansen group, there is no reason a band at 700bp would not consistently
appear with the 5.5kb band. Based on this reasoning, it was postulated that the
polymorphic TaqI site existed within several hundred base pairs of nt 10,500.
184

6.4 AcruntLoct¡t-tzATloN or run ?70I POLYMORPHISM
Primers were subsequently designed to span nt 10,194-11,073 of the AKl gene'
The sense primer (AKTA), was located in exon 6, while the anti-sense primer
(AKTB), was positioned in exon 7 (see Figure 6-5). Subsequently, the predicted
size of the amplification products generated from genomic DNA and cDNA were
879bp and 637bp respectively.
bp879(--I
5r
34 5 67
6.4.1 Materials and Methods
Genomic DNA from 30 un¡elated normal individuals was isolated and amplified as
described (see sections 2.6.1 and 2.6.4), using the following primers:
10'
5' GCGGCTGGAGACCTATTACAAGGC 3'
5' CAAGGCAGGCATGGAACATATGCT 3'
lg4 11,073
(sense)
(anti-sense)
3r
21
Figure 6-5. Genomic organization of the AKl gene. Boxes represent exons, and the exon numbers
a¡e shown below the boies. Black boxes indicate the coding region while white boxes represent
untranslated regions. Exon l: nt 944-983; exon 2: 3,948-3,988; exon 3: 5'534-5,569; exon 4: 5'742'
5,905; exon 5:6,656-6,772; exon 6: 10,075-10,266; exon 7: 10,508-12,188. The protein coding
rágion of the gene begins at nt 3,982 and ends at 10,577 (Matsuura et al., 1989)' The position of the
¡ñfn an¿ nffg ptitn"tt and the 879bp fragment they ampüry from genomic DNA is shown'
AKTA
AKTB
185

Following amplification, l0¡rl aliquots of PCR product were digested overnight in a
total volume of 20pl with 7 units of the restriction enzyme, TaqI (New England
Biolabs), in the buffer supplied by the manufacturer, according to the
manufacturer's instructions. The restricted products were then resolved on 1.5%
agarose gels (Section 2.6.6).
6.4.2 Results and l)iscussion
Of the 30 individuals analysed" digestion of the AKI product with Taqf produced
two fragments in 12 of the samples, of approximately 879 and 430 base pairs (see
Figure 6-6 for an example). None of the individuals tested were homozygous for
the 430bp fragment, however the cell line K562 was. As K562 supposedly does not
contain a normal chromosome 9 (ATCC database), and AKI is located proximally
to the ABL gene and therefore not translocated to form the Philadelphia
chromosome, it appears that one of the many marker ch¡omosomes in this cell line
carries the AKI gene. This is supported by the fact that according to the ATCC,
K562 expresses AKI enzyme. As there is no TaqI restriction site between nt
10,194-11,073 of the published AKI sequence, and the fact that only some of the
individuals tested were found to possess this restriction site, it was concluded that
the region amplified did in fact encompass a polymorphic Taql site. Bech-Hansen
et al. (1989), examined 100 unrelated Caucasians for this polymorphic site. Using
the allele frequencies determined by Bech-Hansen et al. (1989), it can be calculated
that approximately 33%o of individuals should be heterozygous (2pq; 2 x 0.79 x
O.2l). In this study of the South Australian population, 12130 (40%) individuals
were heterozygous for the TaqI polymorphism. It was therefore concluded that the
polymorphisms detected by the Bech-Hansen group, and the polymorphism
detected by this PCR method were the same. Subsequently, the alleles are referred
to as D (no TaqI site) and d (contains the TaqI site), according to the precedent set
by Bech-Hansen et al. (1989).
18ó

980
720
480
M1234Figure 6-6. Determination of the TaqI polymo¡phism in the AKI gene. Digestion of the 879bp PCR
product generated from genomic DNA by the primers AKTA and AKTB with TaqI reveals a
polymorphism; homozygous (DD) individual (lane l), heterozygous (Dd) individual (lane 2), the cell
lineK562 is homozygous for the allele containingthe TaqI site (dd; lane 3), undigested product is in
lane 4, (M) is SPP-I lücoF.l. Sizes of relevant marker bands are shown.
Digestion of the product should, theoretically, yield two bands. As the digested
band seen was around 430bp, and the PCR product was originally 879bp, it was
concluded that the polymorphic TaqI site was in the middle of the amplihed region.
If the site was in the middle of the product, then the two bands expected could run
together, and appear as one 4301440bp fragment.
6.5 ExpnnssroN ANALYSIS oÍ'THE PoLYMoRPHTc IA OI sITE
To determine if the polymorphism existed in exon 6, intron 6 or exon 7 of the AK1
gene, cDNA from Dd individuals, and the cell line K562, was analysed.
6.5.1 Results and I)iscussion
As expected,K562 expressed AK1. RT-PCR and digestion vnth TaqI revealed that
in normal bone marrow, both alleles are expressed (see Figure 6-7). These results
also mean that the polymorphism must be contained within the transcribed region
187

of the AKl gene. To deterrnine the precise localization of this polymorphism, RT-
PCR product generated from K562 was sequenced.
¡- 501/489
Ml DD Dd dd und M2
Figure 6-7. AK RT-PCR product from DD and Dd genotype individuals and K562 (dd), digested
with TaqI. Sizes of the relevant marker bands (Ml; SPP-l/EcoRI andM2; pUCl9/HpøII) shown are
in base pairs "und" is undigested RT-PCR product.
6.6 SneunNCINc ox'THE NEw AKI ALLELE
To determine the precise location of the polymorphic TaqI site, sequence analysis
was carried out using the cell line K562, which only contained the allele with the
TaqI site (the d allele).
6.6.1 Materials and Methods
AK1 PCR products were generated from genomic DNA and oDNA frorn the cell
lineK562 as described in Sections 6.4.1 and 6.51. The products were purified and
sequenced on an automatic sequencer using the prirners AKTA (forward sequence),
and AKTB (reverse sequence), as described in Sections 2.6.8 and2.6.9.
188

6.6.2 Results and Discussion
Analysis of the fow sequences derived from the AK PCR products allowed
construction of a consensus sequence spanning nt 10,285-11,019 of the AKI
genomic DNA sequence. Only one difference between the consensus sequence and
the published sequence (Matsuura et al., 1989), was detected. This difference, a
single base substitution (A+C at nt 10,630, Figures ó-8 and 6-9), was confirmed in
three of the four sequences obtained. The fou¡th sequence (AK RT-PCR product
with the reverse primer, AKTB), was unreadable in this region.
10,629 TAGAtilTCGA
AKI
K562
Figure 6.8. Comparison of the nucleotide sequence of the published AKl gene, and the sequence
derived from the cell line K562. A single base substitution at nucleotide 10,630 (A-+C), creates a
ZaqI resuiction endonuclease recognition site.
The A+C substitution at nt 10,630 of the AKI sequence is located in the 3'
untranslated region of the gene, and as expected creates a Taql restriction site
(TCGA). The substitution does not create a new polyadenylation site, and does not
seem to alter the stability of the mRNA, as evidenced by the fact that in the normal
heterozygote, both alleles are expressed (Figure 6-7). Furthermore, as the
polymorphism is within the 3'unüanslated region, it is not the change responsible
for production of the AK2 isozyme.
189

tffi* Sample 15 K5t2cDil'lA AKIA Sgnal G:'133 A:53 T:41 C32DyeTermirntalAryPri mer I
432 MAIÎIX FILE
Hag€ I Or z
Thu,Apr6,1995 1230PMWed, þr 5,'1995 5:13 PM
Model 3734Version 2-0.'1 S
Lane 15 Points 141 to7750 Bæe 1:141
CNCÏ NNAGCGCC GÅNTTNTÀTNAGAGGNGTGGTA NTGTGN GC A AGG TC A ACGCT G A6 GGCTCCG TG G ACAGHG T CT
40 50 m 70TC80
T CCCAG G T CfG CA CC O ACC T90 100
11.m
GG ACGNCCT AA AG lAGA A ACG
1r0 120
¡lìiI
I
i'r
TGG ÂG GCGCT TCCCCÀGT TCAG AG CCCCGN CCCACC CCG TC CT G À TT CG ÂGG TGCT CCTGGN C TG AG CG CÀGNG CC TC c.¡+Cc CTGN CC TG CTG ÀG CA CAG A CG G ÀG G A AG O GGCf
200 trn 22tî æa
J-e0 140 r50 t60 17 t80 19C
.ATC CTG TT T TCÂ TGG ÁCAG CTG AGCACTAAAGGA?æ 270
ATTTCTTê.GG ACATTTGGTT TTACTGT T2SO 30Cl
T TTT CT C TG CT -IC CAG T T GGAG TTG ATT CA TN T G CTTG Tt'l C C T
310 g20 330 340
240 250
Ê1
CCTGGTCCGCA AGTCTCCAGNCGCN CÀACCCTCCGTTTCCTCCTCCAG TCTGCCTT TGGGCAGACÀCC CCTCCTCTTAGT
350 360 370 380 390 400 4fo 420
GCCCTTOCCNCGGACAGGGGNATTI{TTTTGCCCTTNÀAG3ANCCI{GCTJTTTCAGTTGNTGGf'IGCCCCCT TCCGTÁCGG
45O 460 47D 480 4n 5ÛO 51O szo
T CTGGTGGGNÀGGTCCÇG430 440
ÊGG AATNTTTCAAA CCAGA TN CCN530 540 550
Figure 6-9. Raw sequencing data (sense) derived from pcR product generated from cDNA of the cell lineK562,using the primers AKTA and AKTB The single nucleotide
diñerence to the published AKI sequence is indicated by the arrow'190

Localisation of the polymorphic site allowed calculation of the band sizes following
digestion of the PCR product. Product generated from genomic DNA of a dd
homozygous individual would yield two bands of 436 and 443bps. The size
difference of Tbps would not be resolved on an agarose gel, and explains the results
seen in Figure 6-6. Product generated from cDNA from a dd individual would yield
bands of 443 and 194 following digestion tuthTaqI.
6.7 AXEIYSTS OF. PATIENTS WITH LOSS OF A/B IXTTGENS F'OR LOSS OF
HETE'ROZYGOSITY OX'THE AKl CNXN
Analysis of genomic DNA from the thirteen patients with loss of AIB antigen
expression and haematological malignancy was carried out to determine if LOH
was occurring at the AKl locus. To increase the number of informative patients,
the TaqI and the published KpnI and, DdeI polymorphisms (Puffenberger and
Francomano, 1991) were investigated.
6.7.1 lvlaterials and Methods
To analyse the KpnI and Ddelpolymorphisms, PCR was carried out as described in
Section 6.3.1. An aliquot of the resulting PCR product (10¡rl), was then digested
overnight with 10 umts of KpnI or Ddel in a total volume of 20¡tl, according to the
manufacturer's instructions (New England Biolabs). The bands were resolved on
l.5Yo agarose gels. The Taqlpolymorphism was examined as described in Section
6.4
t9t

6.7.2 Results and I)iscussion
The genotyping results for the AK1 gene are shown in Figures 6-10, 6-11 and 6-12,
and are summarised in Table 6-1. Complete digestion with TaqI and KpnI was
controlled for by spiking the reactions with the 98bp ABO product generated from
an OO genotype individual (using the primers AOI and AO2 as described in
Chapter 4). This product contains a single TaqI site, and in OO individuals, a KpnI
site. Due to the small fragment sizes produced by digestion of the control PCR
product, it was necessary to resolve the bands on acrylamide or higher percentage
agarose gels (the digest was divided in two and run on different gels; not shown).
Complete digestion with DdeI was controlled for by the presence of a non-
polymorphic site within the PCR product.
M WM MR MA ctrl
Figure 6-10. Digestion of PCR product generated from genomic DNA using the primers AKTA and
AKTB with TaqI. Patient samples are annotated; ctrl is a normal heterozygous individual. The
marker (M) is SPP-I lEcoR.L
192

-->
MA WD HD SR Cl C2 und
Figure 6-LL. Digestion of PCR product generated from genomic DNA using the prlmers
AKGEN2A and AKGBN2B with Ddel. Patient samples are indicated; Cl and C2 are normal
heterozygous individuals; und is undigested PCR product. The allelic bands are marked by the
aIïow.
C1 MA C2 und
Figure 6-12. Digestion of PCR product generated from genomic DNA using the primers
AKGEN2A and AKGEN2B with KpnI. Cl is an individual homozygous for the KpnI containing
allele, and C2 is a normal heterozygous individual; und is undigested PCR product. The pattern and
relative intensity of the bands is identical in the patient MA and the normal heterozygous control.
Band sizes are shown in base pairs.
t93

Patient AKgenotype
(Tø,oIl
AKgenotype(KpnIl
AKgenotype(Ddell
AN* DDGN* DDMR* DdNR DDWM Dd het
MA Dd het het
CG DDWD DD het
KN DDDH DD het
PM DDBA DDSR DD het
Table 6-1. Results from analysis of the AKI gene. "Het" indicates the patient was heterozygous for
the polymorphism, "-" indicatès the patient was homozygous. The standa¡d Ddnotation was used for
the TqL polymorphism.
Digestion of the AKGEN2 product .wrth DdeI can detect four different alleles
between 500 and 700bps in size. Only two of the alleles were seen in our patients,
which is not surprising as the frequencies of the two most common alleles is 53 and
40%. The frequency of the allele containing the KpnI site is 90%, while the
frequency of the allele lacking the site is 10% (Puffenberger and Francomano,
1991). Digestion of the allele containing the KpnI site produces two fragments, of
639 and 380bps.
Allele dosage was determined by comparing the relative intensity of the allelic
bands with that of normal controls. Seven of the thirteen patients examined were
informative for at least one of the three polymorphisms, and all had equivalent
allele dosage. Only one of the three patients that had LOH at the ABO locus (AN,
GN and MR) was informative; patient MR. This patient was heterozygous for the
Taql polymo¡phism, and although LOH at the ABO locus was obvious in this
patient, there is clearly equivalent allele dosage at the AKI locus. As the region of
t94

chromosome nine that was physically lost in patient MR did not include the AKI
gene, it was concluded that the proposed tumour suppressor gene is located distally
to the AKI locus.
6.8 AXNT,VSIS OF AKl CNXN EXPRESSION IN PATIENTS \ryITH HAEMATOLOGICAL
MALIGNANCY AND LOSS OF ANTIGEN EXPRESSION
Although the LOH study described in the previous section excluded involvement of
the AKI locus, it was possible that the silencing event occurring at the ABO locus
could also affect the AKI gene. For this reason, the aim of the next set of
experiments was to determine the normal relative expression of the D and d alleles
of the AKI gene, and to subsequently examine the patients who were heterozygous
for the Taqlpolymorphism for mono-allelic expression of the gene.
The three patients who were heterozygous for the TaqI polymorphism were MA,
MR and WM. WM is the patient who had significantly decreased red cell AKI
activity (Marsden et al., 1992).
6.8.1 Materials and Methods
Amplification of RT-PCR product was carried out essentially as described in
Section 6.5, with the exception that all samples were DNase treated before reverse-
transcription (see Section 2.6.5). This was necessary, as contaminating DNA in the
RNA preparation amplified in addition to the cDNA target. Following digestion of
the PCR product, the relative intensities of the cDNA-derived bands could not be
calculated as digestion of the 879bp PCR fragment generated from DNA could also
contribute to the intensity of the 443bp band. As DNase treatment seems to
adversely affect the effîciency of the reverse-transcription reaction, samples were
subjected to 45 cycles of PCR. The rest of the experiments in this chapter were
195

carried out using ultra-pure water from Biotech lnternational (Western Australia),
as opposed to water from the hospital Millipore purification systems.
6.8.2 Results and Discussion
At this point in the project, only one "normal" BM control that was heterozygous
for the TaqI polymorphism was available (this was a remission marrow from a non-
Hodgkin's lymphoma patient). However, it was noted that the different water being
used in the laboratory (see Section 6.8.1), signifîcantly increased the efficiencies of
some PCR reactions. Furthermore, the efficiency of the AKl RT-PCR reaction was
increased, as it was now possible to generate product from normal peripheral blood
mononuclear cell cDNA. Subsequently, peripheral blood samples from normal
individuals were used as controls for this part of the study. Eight heterozygous
individuals were examined, in order to determine the normal relative expression of
the alleles. However, the results were not repeatable; aliquots of the same reverse-
transcription reaction amplifîed simultaneously often revealed markedly different
relative intensities of the allelic bands. This was not due to incomplete digestion,
as often the allele containing the TaqI site was more intense than the allele without
the site, and the control fragments always digested completely. Furthermore, the
results could not be explained by star-activity of TaqI, as the digestion pattern was
the same after I hour as it was after 22 hours.
To see if the non-repeatability of these results was in fact due to the DNase
treatment of the RNA prior to the reverse-transcription reaction, identical RNA
samples, both treated and non-DNase treated, were reverse-transcribed
simultaneously. Digestion of PCR product obtained from these experiments with
T'aqI revealed significant differences between the relative intensities of the allelic
bands following DNase treatment (Figure 6-13). This is mostly aptly demonstrated
in the sample from control individual 3, (C3; lanes 3 and 6 after the marker). In the
196

DNase treated sample from this individual, there is complete digestion of the RT-
PCR product, which would indicate a dd phenotype. However, in the sample that
was not DNase treated, there is quite obviously equal expression of both alleles.
720-480360
- Mcl c2 c3 cl c2 c3 c4 cs c6 c7 L c8
+DT +DT +DT -DT .DT -DT -DT -DT -DT +DT +DT -DT
Figure 6-L3. TaqI digestion of the AKTAQ RT-PCR product generated from DNase treated (+DT),
and non-DNase treated (-DT) RNA from eight control individuals (C1-C8), and the cell line LIM1215 (L), all of which genotyped Dd for the TaqI polymorphism. The marker (M) is SPP-l/EcoRI.
Sizes ofthe relevant marker bands are in base pairs.
The most likely explanation for the inconsistencies seen in DNase treated
specimens is that the number of mRNA copies of the AKI gene in normal PB
mononuclear cells is extremely low. As DNase digestion severely decreases the
efflrciency of the RT-PCR reaction (at least in our system; multiple methods of
DNase treatment and inactivation were tested to try and increase the efficiency, to
no avail), the obvious way to avoid this problem was to omit the DNase treatment
of the RNA. While excluding the DNase treatment revealed repeatable results in
the control samples, and minimal contamination of DNA, the patient RNA samples
we wished to analyse had significant DNA contamination.
To avoid this problem, the patient and control samples were amplified following
RT-PCR without DNase treatment. The products were resolved or, 0.9% low
197

melting point agarose gels, and the product generated from cDNA isolated and
purified using the Wizard PCR preps kit (see Section 2.6.8). Unfortunately,
digestion of the purified product was severely inhibited, presumably by one of the
ingredients of the kit. Increasing digestion times to 24 hours, and enzyme
concentrations (up to 20 units per reaction), did not result in complete digestion of
the control PCR products.
The most obvious way to solve this problem would be to avoid contaminating DNA
altogether, by designing another primer to replace AKTA. If the sense primer was
located in exon 5 instead of exon 6, amplification of DNA contaminating RNA
samples would be unlikely to occur, as this region spans just over four kilobases.
Although this approach would be simple and effective, there was insufficient time
to carry out the experiments.
Although DNase-treatment of RNA from the control individuals did not yield
consistent results, two of the three patients with loss of A antigen always produced
the same result. While no product at all could be generated from DNase'treated
RNA from the patient IvÍ4" sfiong bands were obtained from the patients WM and
MR. Presumably the cell populations in the samples from these patients exhibit
higher expression of the AKI gene, as product was able to be obtained before the
implementation of the "new" water and subsequent increase in the efficiency of the
RT-PCR reaction. Furthermore, the sample from MR was from bone marrow
consisting ol 670/o erythroblasts. If one was to accept that both alleles of the AKI
gene afe expressed in equal amounts, it would appear that the patient MR has
normal expression (see Figure 6-14). However, digestion of the RT-PCR product
from patient WM indicated that expression of the d allele was down-regulated
relative to the D allele (see Figure 6-14). Identical results were obtained from foru
different (DNase treated) reverse-transcription reactions of this patient.
198

MRCDNA+DT
WMCDNA
+DT
\ryMCDNA+DT
WMCDNA
-DT
WMDNA
Figure 6-14. Taql digestion of the AKTAQ PCR product generated from reverse-transcribed,
DNase-treated RNA in the patients MR and WM (indicated by oDNA +DT), and from non-DNase-
treated RNA from patient WM (cDNA -DT). An estimate of the relative intensities of the allelic
bands in patient WM oDNA (non-DNase treated) can be made by correcting for the presence ofcontaminating DNA by comparing the digested RT-PCR product with the digested PCR product
generated from genomic DNA of this patient. After correcting for the presence of genomic DNA' itappears that the d allele of the AKI gene is reduced in expression relative to the D allele in this
patient. The two DNase-treated samples from patient WM were generated from different RTs.
Non-DNase treated RNA from patient WM \^/as also subjected to RT-PCR, and
although aband generated from DNA is visible, digestion of the product reveals an
imbalance in the relative intensities of the alleles (see Figures 6-14 and 6-15).
637
tì;'çÈFf,È:'.
-
443
MWM
Figure 6-15. TaqI digestion of the AKTAQ RT-PCR product generated from non-DNase treated
RNA from the patient WM. The marker (M) is SPP-I l4coF.l. The 879bp band generated from DNA
is visible; although digestion of this band would contribute to the intensity of the 443bp band, the 637
band generated from cDNA is much stronger in intensity than the 443 band.
879
t99

Although TaqI digestion of the product amplified from DNA would contribute to
the intensity of the lower (aa3bp) band, the intensity of this band is still
significantly less than that of the 637bp band. Given that non-DNase treated
controls show approximately equal intensity of the two bands, it appears that there
is transcriptional silencing of the d allele of the AKl gene in the patient WM. If
these results were in fact a true indication of the relative amounts of the AKl
alleles, it would appear that although the A allele of the AEIO gene is completely
silenced in patient WM, there is only partial silencing of the AKI gene. This could
be explained by an overall higher expression of AKI than of the ABO gene. The
expression of both genes is supposedly restricted to red cell precursors, however
although AKI expression could be detected in normal PB samples using the "new"
water, expression of the ABO gene still remained undetected. Therefore, while
expression of the ABO gene from normal cells in the PB of patient WM is not able
to be detected, perhaps expression of AKI from normal cells is - leading to
detection of transcripts (albeit, imbalanced in their relative intensities), from both
alleles.
Non-DNase treated RNA from the patient MA was reverse-transcribed, and the
band corresponding to cDNA product isolated and purified using Wizard Preps, as
described above. The purified product was then amplified in three separate PCR
reactions. Digestion of the product was complete; implying transcriptional
silencing of the D allele (data not shown). The results on patient MA must be taken
with extreme caution, expression of the AKl gene was limiting as no product could
be generated from DNase-treated RNA, and only a very weak band could be
generated from non-DNase treated RNA. Therefore the product that was purified
and re-amplified might not be a true indication of the relative expression of the
AKI alleles.
200

Suvrn¡¡.nv
A previously known Tcql RFLP in the AKI gene was localised and sequenced. A
single base change (A+C at nt 10,630) was responsible for the polymorphism, and
is located ín the 3' untranslated region of the gene. Subsequent studies using this
and two other polynorphisms of the gene to examine patients with loss of A/B
antigens and haematological malignancies showed equal allele dosage at the AKI
locus in all seven informative patients. One of these patients had LOH at the ABO
locus. As this patient had equivalent allele dosage of the AKI gene, it was
concluded that if a tumour suppressor gene is in this region, it is located distally to
the AKI gene.
As the TaqI polymorphism is in exon 7 of the AKI gene, attempts were made to
determine the normal relative expression of the AKI allele. Although a number of
technical problems were experienced when using DNase-fieated RNA, it appears
that in normal individuals, both alleles are equally expressed. The patient MR also
seems to have normal expression of the AKl gene. Unfortunately, the results in
patient MA are not convincing as expression of the AKl gene appeared to be
extremely low in this patient, which could lead to preferential amplification of one
allele and subsequently not represent the true relative amounts of the AKI alleles.
The patient WM, who also had significantly reduced red cell AKI activity,
consistently gave the sa.rne result from DNase-treated, and non-DNase treated
reverse-transcription reactions; markedly reduced expression of the d allele of the
AKI gene. Until the results can be confirmed using a different set of primers (and
the problem of DNA contaminating RNA samples can be avoided), it was
concluded that the patient WM has transcriptional silencing of single alleles of the
linked AKI and ABO genes.
201

As the region of chromosome 9q that is physically lost in patient MR does not
include the AKI gene, the next step in this project was to further define the affected
region. Subsequently, the next chapter describes the analysis of the ABL gene,
which is located between the ABO and AKI genes.
202

Cn¡.prERSnvnx
AN¡.TYSIS OF THE ABL GENN

7.0 INTRODUCTION
The ABL gene is located 5mb closer to the centromere than the ABO gene' and is
approximately lOmb distal to the AKl gene (Kwratkowski et al" 1993)'
Examination of the ABL locus was undertaken primarily because of the close
proximity of the ABL and ABO genes, and secondly due to the evidence suggesting
that ABL is involved in regulation of the cell cycle and can act as a tumour
suppressor gene (Sawyefs et at., 1994). The ABL gene is ubiquitously expressed, at
low levels. There are two major splice variants of the gene, which contain one of
two altemative first exons, known as la and lb (Shtivelmaî et al., 1986), although
differential expression of the variants in haematopoietic cells has not been reported.
Until December of lg94,it was not possible to study allelic expression of the ABL
gene, as there were no known exonic polymorphisms. Melo et al. (1994), described
a polymorphic marker in exon 1l of the ABL gene. The polymorphism is a single
base pair silent mutation, from cytosine (allele "c") to guanine (allele "G"), in the
third base of codon 784 of the ABL type la transcript. This chapter describes the
analyses of patients, both with and without altered blood group antigens' for LOH
and altered allelic expression using this polymorphism.
204

7.1 Axllvsrs oF rUN ABL POLYMORPHISM IN NORMAL INDryIDUALS
The first aim of these experiments was to confîrm that the alleles distinguished by
the BsrNI polymorphism are equally expressed in peripheral blood mononuclear
cells from normal individuals.
7.1.1 Râtionale
Approximately 16% of normal individuals aÍe heterozygous for the ABL
polymorphism described by Melo e/ at. (1994),the most common allele of which is
the "C" allele. The polymorphism is able to be detected by restriction enzyme
digestion of PCR product generated by ABL exon 11 specific primers with BslNI,
as shown in Figure 7-l below.
B* B
- -Figure 7-1. Diagrammatic representation of the primers used by Melo el al. (1994), to determine the
,"I"ti¡n. allelic expression of the ABL gene relative to intron-exon bounda¡ies. Restriction enzyme
digestion of PCR product generated using the primers Jl and J2 with -B$/NI was used to Senotype
inãivi¿uats. The relative Jxpression of the ABL alleles in individuals heterozygous for the BsINI
polymorphism (indicated by -n*;
B indicates non-polymorphic BslNI sites) was determined using a
nesie¿ p'Cn approach. The first round of cDNA amplification was carried out using the primers J3
and J2;the PCR product was then diluted l:1000 and lpl used as template for amplification using the
primers Jl and J4.
The oligonucleotide primers Jl and J2 used by Melo et al. (1994) to genotype
individuals for the BsfNI polymorphism, are both contained within exon 11 of the
ABL gene. Consequently, both DNA and oDNA can be amplified with the same set
of primers. To avoid amplification gf genomic DNA when examining allelic
expression of the gene in peripheral blood mononuclear cells, l/Lelo et al. (1994),
used a nested PCR approach. The first round of ampliflrcation was canied out using
a primer spanning the intron/exon junction of exons 10 and 11, (J3; nt 1657-1681
of the ABL |a transcript; Genbank accession number IJO7653), and a primer from
J2J4
J1J3
Exon 11Exon 10
205

within exon I I (J2; nt 2615-2640). Theoretically, these primers should specifically
amplifli reverse-transcribed mRNA, and not contaminating genomic DNA in RNA
preparations (see Figure 7-2).
10<<>>1 ITCAC TCCAAGGGCCAGGGAGAGAGCGAT CCTC
l6s3 1685
Figure 7-2. Positioning of primer J3 so that it spans the intror/exon boundary of exons l0 and I I ofthe ABL transcript (the dinucleotide "AT" at the 3' end of the primer is in exon I l). The primer is
distinguished from surrounding sequence by bold type.
The PCR product generated by the primers J3 and J2 was then diluted (1:1,000),
and 1¡.rl of the dilution used as template for a second round of amplif,rcation using
primers specific to exon I I (Jl; nt2180-2205 and J4; nt 2563-2588). To control for
carry-over genomic DNA contamination, ABL intron specific primers were used on
the diluted RT-PCR product. Using this approach, Melo et al. (1994) reported that
although the PCR product generated in both genotyping and phenotyping reactions
was refractory to digestion due to heteroduplex formation, the ratio of the alleles
was approximately the same in both cases. The authors subsequently concluded
that both the C and G alleles were equally expressed in normal individuals (see
Figure 7-3).
DNA
CDNA
Figure 7-3. Relative expression of ABL alleles distinguished by the BstM polymorphism in normal
individuals as determined by Melo et at., 1994. The arrows indicate the allelic bands; the lower band
in constant. Lane I is a CC individual; lanes 2-13 are CG individuals while lane 14 is a GG individual.
As the relative intensities of the bands generated from cDNA a¡e identical to that from DNA' it was
concluded that the C and G alleles are equally expressed in normal individuals.
206

To analyse the ABL locus, the approach described by Melo e/ a/. (1994), was
followed, with two exceptions. To genotype individuals for the 8s/NI
polymorphism, amplification was carried out using the primers Jl and J4
(compared with Jl and J2 used by Melo er al., 1994). The second alteration to the
procedwe described by Melo et al. (1994), was relatively minor. Primers Jl and J4
were altered slightly, by the addition of an A and a T respectively to the 5' ends of
the oligonucleotides. This was done primarily to enhance the binding of the
primers to the appropriate region in exon 11. A diagrammatic representation of the
fragments sizes obtained after digestion of the PCR product is shown in Figure 7-4.
JBB2180 2588
c t4l 32 235
cCagg
B
l4l 267
cGagg
Figure 7-4. Diagrammatic representation of the ABL exon I I region amplified by the primers Jl and
¡+. ¡stt U restriction sites are indicated by "8"; the polymorphic site that is present in the "C" allele is
indicated by an arrow. Fragment sizes after digestion of the 408bp PCR product generated from the
"C" and "G" alleles are shown in base pairs.
G
207

7.1.2 l{laterials and Methods
Genomic DNA was prepared from 30 unrelated individuals as described (see
Section 2.6.1). PCR was carried out as described in Section 2.6.4, with the
following primers:
JI 5' AAGGACACGGAGTGGAGGTCAGTCA 3'
J4 5' TTGGTGCACCTGAGCCTGCTTTGCT 3'
(sense)
(anti-sense)
Diagnostic restriction enzyme digestions were performed on 10¡rl aliquots of each
sample, in a total reaction volume of 20¡rl containing 7 units of BsrNI (New
England Biolabs), in the buffer supplied by the manufacturer, according to the
manufacturer's instructions. The restricted products were resolved on 2o/o agafose
gels (see Section 2.6.6).
To analyse the relative expression of the ABL alleles in individuals heterozygous
for the BsrNI polymorphism, RNA was prepared from peripheral blood
mononuclear cells, DNase-treated and reverse-transcribed as described in Sections
2.6.2 and2.6.5. Five pl of cDNA was then amplified as described above, with the
exception that 45 cycles of PCR were employed (as opposed to 35 cycles used for
genotyping). To ensure the absence of genomic DNA in the reverse-transcription,
parallel reactions without reverse-transcriptase were also amplifi ed.
7.1.3 Results and Discussion
Of the 30 normal individuals examined, 26 (56.67%) were CC homozygotes, and 4
(13.33%) were CG heterozygotes. No GG homozygotes wero detected.
Comparison of the relative intensities of the allelic bands obtained from DNA and
cDNA in the 4 heterozygous individuals revealed approximately the same ratios in
all samples. As the relative intensities of the bands obtained from amplihcation of
208

DNA from normal individuals presumably represents a 1:l ratio of the alleles, it
was concluded that there was equal expression of the alleles in normal heterozygous
individuals. The relative intensities of the alleles differ slightly to that reported by
ll/relo et al., 1994 (compare Figures'7-5 and 7-3). This is probably due to increased
amounts of heteroduplex formation obtained by the different cycling conditions
used by Melo ¿f aL, 1994.
MDR DR DR DR
C1 C2 C3 C4
Figure 7-5. Relative expression of the ABL alleles distinguished by BsrNI restriction enzyme
digestion in peripheral blood of four normal individuals (Cl-4). Genomic DNA (D) and RNA(DNase-treated, reverse-transcribed; R) samples from each of the individuals are paired. Sizes of the
relevant ptJClglHpaII marker (M) bands are indicated in base pairs. "und" is undigested PCR
product.
7.2 AN¡.LvsIs oF THE ABL cENE IN PATIENTS wITH HAEMAToLocICALMALIGNANCY AND LOSS OF ABO ANTIGEN EXPRESSION
Two patients with haematological malignancy and loss of ABO blood group antigen
expression were heterozygous for the ABL polymorphism. Both patients (WM and
NR), had equal allele dosage at the ABO locus, but transcriptional silencing of the
A allele. Similarly, both patients had equal allele dosage at the ABL locus.
Furthermore, initial RT-PCR experiments showed loss of expression of the G allele
of the ABL gene (see Figure 7-6). Only samples where the negative control for
DNA contamination (ie. the parallel reverse-transcription reaction without reverse-
transcriptase added) was completely negative following amplification with the
und
209

primers Jl and J4 were considered. However, it was noted during these
experiments that digestion of DNA contaminating the RNA samples was not always
complete; some of the DNase-treated negative controls still produced PCR product.
Furthermore, the results from multiple reverse-transcriptions in the patients WM
and NR gave varying results. It appeared that although the intensity of the band
corresponding to the G allele was reduced relative to that seen in the normal
controls, the amount of reduction seen from multiple RT-PCR reactions was not
always the same.
A B
MR D und RDNRWM
Figure 7-6. Analysis of the ABL gene in patients with transcriptional silencing of the ABO gene.
Panel A shows digestion of the PCR product with BsINI from DNA (D) and DNase-treated, reverse-
transcribed RNA (R) from patient WM. Panel B shows digestion of the product obtained from DNAand DNase-treated reverse-transcribed RNA from patient NR. The marker (M) is pUCl9/HpaII,"und" is undigested PCR product. While there appears to be abnormal allelic expression of the ABLgene in both patients, independent RT-PCR reactions did not give repeatable results.
As the varying results in the patient samples could be due to contaminating DNA,
the DNase incubation was altered from 12 minutes at room temperature, to l0
minutes at 37"C, to increase activity of the enzyme. Lack of contaminating DNA
was confirmed by amplifying the samples with intron-specific primers to the AKl
gene (AKGEN2A and B; as described in Section 6.3.1). No bands corresponding to
the intron-specific product could be detected following the enhanced DNase
2r0

treatment and 50 cycles of PCR in any samples. Although ABL RT-PCR product
could be generated from oDNA prepared from RNA treated in such a way from
normal individuals, no product could be generated from the patient WM and NR
samples. The amount of RNA in the reverse-transcription was increased from 1¡rg
to 2-2.5¡tgbut only very weak bands could be generated. It seemed therefore, that
expression of the ABL gene is reduced in these patient samples. As experiments in
this thesis have already shown that a combination of low gene expression and
DNase-treatment can lead to non-repeatable results (as described in Chapter Six of
this thesis), a more sensitive method was required to analyse the ABL gene in these
patients; avoiding DNase treaÍnent altogether.
7.2.1 Optimization of the RT-PCR method to assess allelic expression of the
ABL gene
The nested PCR method described by Melo et al. (1994) was used on non-DNase
treated reverse-transcribed RNA. The J2 primer was modified by the addition of
two nucleotides, GT, to the 5' end. The addition of these two nucleotides
theoretically increases the melting temperature of the J2 primer, such that it is
closer to the melting temperature of its pair, the J3 primer.
7.2.2 Materials and Methods
Amplification of oDNA specific product was achieved by a nested PCR reaction, as
described (Melo et al., lgg4). The first round of amplification was carried out for
35 cycles in a total reaction volume of 50p1, containing 5pl of oDNA, as described
in Section 2.6.4, with the following primers:
J3 5' TCCAAGGGCCAGGGAGAGAGCGAT 3'
J2 5' GTGCTTGTGCCTCCTCACTCTGGAC 3'
(sense)
(anti-sense)
2lr

The resulting PCR product was diluted l:1000 in water, and 1¡rl used for the second
round amplitication for 45 cycles with the primers Jl and J4, and digested with
BsfNI as described above (7.1.2). To control for carry-over genomic DNA
contamination, the diluted RT-PCR product was subjected to PCR using the
AKGEN2A and B primers for 45 cycles.
7.2.3 Results and Discussion
Normal controls \¡rere again examined, and independent RT-PCR/restriction
enzyme digestion gave the same results as shown in Figure 7-5. Again, analysis of
the patients WM and NR showed reduced expression of the G allele relative to the
C allele (not shown). Given these results, and the fact that ABL could be a tumour
suppressor gene, patients with haematological malignancy and no loss of ABO
antigen expression were examined for relative allelic expression of the ABL gene.
7.3 AX¡,I.YSIS OF THE ABL GENE IN PATIENTS WITII MALIGNANCY AND NO LOSS
OF ABO ANTIGEN EXPRESSION
7.3.1 Analysis of allele dosage
Samples from eighty-fotu patients with a broad range of haematological
malignancies were genotyped for the ABL polymorphism. Most, but not all of the
patients were the same as those genotyped at the AIIO locus and described in
Appendix A; patients with CML were excluded from this analysis because one
would expect that there was differential expression of the ABL alleles, given that
one allele is driven by the promoter of the BCR gene after the formation of the
Philadelphia translocation. Furthermore, increased expression of the ABL allele
involved in the BCR/ABL translocation relative to that of the "normal" ABL allele
in CML patients has recently been shown (Melo et al., 1995). Fifteen of the
patients (17.5%) were CG heterozygotes; 68 (80.9%) were CC homozygotes, and
one patient genotyped GG (1.19%). It is unlikely that any patients who were
2t2

recorded as homozygous were in fact heterozygous but had LOH, as the number of
CG heterozygotes obtained was slightly higher than that reported in the normal
individuals (17.8% compared with l3% of the normal individuals examined in this
study, and l6Yo reported by Melo et al., 1994)'
Normal tissue from thirty-five patients with colon cancer was also examined for the
ABL polymorphism. Interestingly, only one of the patients was heterozygous
(2.9%). Thirty-three Qa%) of the patients genotyped as CC, while one patient
genotyped as GG. Analysis of tumour tissue from the heterozygous patient showed
normal allele dosage at the ABL locus. The low number of heterozygous patients
with colon cancer is presumably due to sampling variation; although it would be of
interest to see if this trend continues by examining more patients.
The cell lines LIM 2405, LIM 1863, Lßtr l2l5,LßÁ2412,Ífl29,IIEL, KCL22,
HiMeg, HL60, E\VI2,JK, and K562 were also examined for the ABL polymorphism;
all were CC homozygotes or C hemizygotes. The colon-carcinoma cell line SW480
however, was a CG hetero4ygote and had normal allele dosage.
None of the 15 heterozygous patients with haematological malignancy showed
abnormal allele dosage at the ABL locus, although no regard was given to the
amount of leukaemic cells in each of the particular samples. To ensure that there
was equal allele dosage at the ABL locus in these patients, different samples from
13 of the patients were examined. Every effort r¡ias made to analyse samples that
had a minimum of 50o/o blast cells, although in one case the number of blast (or
leukaemic) cells in the samples could not be estimated as no patient results were
available. Descriptions of these patients and the samples analysed have been
tabulated in Appendix B. Analysis of these samples again showed normal allele
dosage at the ABL locus (see Figure 7-7). As at least 12 of these patients had a
2r3

minimum of 50Vo leukaemic-derived cells, and subsequently abnormal allele dosage
should be obvious, it was concluded that there was no LOH occurring at the ABL
locus.
Figure 7-7. Allele dosage of the ABL gene in 15 patients with haematological malignancy as
revealed by the BsrNI polymorphism. Patients 4 and 5 are the patients WM and NR (the PB sample
is shown; the results from the PE sample of this patient were identical), that had loss of blood group
antigen expression; the rest of the patients are described in Appendix B of this thesis. The marker
(M) is pUClglHpaII. Cl-4 are normal controls.
7.3.2 Ãnalysis of ABL expression in patients with haematological malignancy
and no loss of blood group antigen expression.
Eleven of the thirteen patients examined using the nested RT-PCR method
described in Section 7.3.7 clearly had abnormal relative expression of the alleles,
with complete loss of both the C and the G alleles in different patients (data not
shown). However, multiple PCR reactions carried out on the same (and different)
RT reactions did not reveal consistent results. In fact, for all but two of the thirteen
patients and one cell line (SW480) examined using this method, the relative
intensities of the allelic bands showed extreme variation in the same individual. In
the two patients that produced consistent results (patients 6 and 8), both patients
were examined 9 times, from 3 different reverse-transcription reactions, and the
relative intensities of the allelic bands were always the same as seen in the normal
controls (data not shown).
214
The inconsistencies seen in most of the patients could not be explained by
variations in the efficiency of the reverse-transcription reactions, or the PCR
reactions, as normal controls were always reverse-transcribed and subjected to PCR
simultaneously, and always gave the expected results. Although RNA from the
normal controls was not isolated at the same time as that from the patients, RNA
from the two patients which consistently showed normal expression of the ABL
gene \¡/as isolated at the same time as that from the patients that gave inconsistent
results. Furthermore, analysis of the RNA preparations for integrity by gel
electrophoresis showed that the RNA from patient 6 was extremely degraded.
Therefore, the abnormal results in the other patients could not be explained by the
presence of partially degraded RNA.
To determine if it was possible to generate the ABL PCR product from genomic
DNA following the nested protocol, 100ng of DNA was subjected to amplification.
In fact, the ABL PCR product could be amplified from the diluted product obtained
using the gDNA "speciflc" primers J3 and J2, although nothing could be amplified
from the same diluted product using primers to an intron in the AKl gene. The first
round PCR product could not be visualised on a gel (even after 45 cycles of
amplifîcation), so it was possible that non-specific amplification of the ABL gene
was occurring. In fact, closer analysis of the J3 primer revealed another possible
binding site within exon 11 of the AIIL gene (Figure 7-8).
215

B B*J4 J2
B,/
-JIJ3
J3*
alternative binding site
TCC.AAGGGCCAGGGAGAGAGCGAT
Figure 7-8. Alternative binding site of the primer J3 (indicated by *). Sixteen of the twenty-four
baies in the primer can bind to rft 2095-2119 of the ABL type la transcript. Therefore, amplification
of Jl/J4 product can occur from genomic DNA following the nested protocol described ll.'felo et al.,
1994.
Therefore, the first round of PCR with the primers J3 and J2 could give rise to a
product from genomic DNA, although this region would probably not ampli$ very
efficiently as 8 of the 24 base pairs of the J3 primer are mismatches. The nested
RT-PCR method was subsequently considered unsuitable for analysis of expression,
as DNA contaminating the reverse-transcriptase reaction could also give rise to a
transcript. This result has interesting implications for the conclusions made by
Melo ¿f al. (1994), who used this method to show bi-allelic expression of the ABL
gene in colony-forming unit granulocyte/macrophage colonies (CFU-GMs).
Although these authors do not describe how they carried out reverse-transcriptions
on the colonies, presumably they lysed single colonies to isolate RNA.
Subsequently, genomic DNA would have been present in the reverse-transcription
and could have given rise to ABL PCR product.
In an attempt to avoid using the nested PCR reaction, the primers J3 and J4 were
used to ampliff cDNA. After 45 cycles of amplification, the expected 930bp
product could be detected in the normal controls and the two patients that
consistenfly showed bi-allelic expression of the ABL gene (patients 6 and 8)'
Howeve¡, nq PCR praduct at all could be detected in any of the other patient
Exon 10 Exon 11
216

samples. The results indicate that the most likely explanation for the non-
repeatable results in most of the patient samples is a combination of low ABL gene
expression, and amplification of DNA contaminating RNA preparations'
Incidentally, amplification with the primers J3 and J4 sometimes also gave rise to a
shorter product of around 500bp, which is the size expected if the J3 primer was
binding non-specifically to genomic DNA.
To ensure that the ABL gene was being expressed in these patients, and as shorter
regions of oDNA ampliff more effrciently, a new set of primers spanning exon 7-ll
of the ABL gene were designed. The primers ampliff a 590bp product, from nt
ll4l-1730 of the ABL type la fianscript, and do not span the BsrNI polymorphism'
Although these primers are termed J5 and J6, it should be noted that they are not
related to the primers of the same name described by Melo et al., 1995'
J5
J6
5' TGATTTTGGCCTGAGCAGGTTGAT 3'
5' GCTCTTTTCGAGGGAGCAATGGAG 3'
(sense)
(anti-sense)
Following 45 cycles of amplification under the standa¡d conditions described in
Section 2.6.4 of this thesis, the 590bp band was amplified in all of the patient
samples. Although this method is not quantitative, the intensities of the bands were
the same as that of the normal controls (except for patient 15 in which the intensity
of the band was significantly weaker). No product could be amplified from
genomic DNA using this set of primers. It was subsequently concluded that the
ABL gene was expressed in the patient sarnples'
It was not possible to design cDNA specific primers spanning a shorter region of
the ABL gene that also spanned the polymorphic site. In a final attempt to analyse
the relative expression of the ABL alleles, another primer, JlQ was designed.' This
2t7

primer lies in exon 10, 5' of the J3 primer (nt 1615-1641 of the ABL type la
transcript).
J10 5' TGCAGAGCACAGAGACACCACTGACG 3' (sense)
Amplification of cDNA was canied out using the primers J10 and J2, for 45 cycles
(94C,1'; óOoC, I';72C 1'). The product was then diluted (1:100) and 1pl used as
template for 45 cycles of ampliflrcation with the primers Jl and J4. The resultant
PCR product was then digested with Bs/NI as described above. Up to 200ng of
genomic DNA subjected to this nested PCR reaction did not give rise to a PCR
product.
7.3.3 Results and Discussion
For this final round of experiments, only the patients that had loss of blood group
antigen were examined (WM and NR). Again, repeatable results were obtained
from amplification of oDNA from normal individuals. However, the results from
multiple reverse-transcriptions of patients WM and NR were not consistent (Figure
7-9), although amplification of cDNA with the primers J5 and J6 revealed the
presence of ABL mRNA (see Figure 7-10; the relative positioning of the primers is
shown in Figure 7-ll). Ultimately, no conclusions concerning the relative allelic
expression of the ABL gene could be drawn from these analyses. The most likely
reason for this is a founder effect, as a result of low oDNA copies of exon 11
mRNA in the patients; hence amplification of the region using the PCR technique
gives unreliable results because of the initial target copy number.
218

M WM NR NR Controls undPB PE
Figure 7-9. Non-repeatability of the ABL RT-PCR method for examining relative allelic expression
in the patients WM and NR. Three reverse-transcriptions from WM, NR peripheral blood (PB) and
NR pleural effusion (PE) samples were selected at random and subjected to PCR, as were fivereverse-transcriptions from normal individuals. Digestion of the PCR product with BsrNI reveals
markedly different relative intensities of the allelic bands in the different reverse-transcriptions fromthe patient samples, while the normal controls show relatively constant band intensities. "und" isundigested PCR product; the marker (M) is pUC19lHpall.
\ryM NR PBCNd2
NR PE
Figure 7-10. Expression of the ABL gene in the patients WM, and NR as determined by RT-PCR ofthe same reverse-transcriptions analysed in Figure 7-9 above. The markers are SPPl/EcoRI (M1)
and pUCl9lHpaIl (M2). "C" indicates a control individual.
J6 J4B
J2*
-J5
--JlO J3
-J1
Exon 7 Exon L1.Exon L0
Figure 7-11. Relative positioning of all the primers used for analysis of the ABL gene.
2t9

Suunnnnv
Analysis of the AIIL gene in two patients with haematological malignancy and
transcriptional silencing of the A allele of the ABO revealed equal allele dosage in
both patients. Furthermore, normal allele dosage was determined in 13 patients
with haematological malignancy and no loss of blood group antigen expression.
A number of different methods were attempted to examine the relative allelic
expression of the ABL gene, but although normal controls and two patients with
haematological malignancy consistently showed equal expression of both alleles,
none of the methods produced repeatable results in the rest of the patients. The
most likely explanation for these results is that the ABL gene is expressed at low
levels in these patients, or at least cDNA copies of mRNA corresponding to exon
l1 of the gene is present at very low levels. The reason for this remains elusive, but
should be investigated further by using improved RT-PCR techniques or other (as
yet unknown) polymorphisms in the gene. To improve upon the RT-PCR technique
the primer J2 could be used to prime the reverse-transcription instead of random-
hexamers, and thus enrich the cDNA for the specific region of ABL being
examined. Therefore, the founder effect that appears to be occurring could be
avoided. Another improvement would be to use a thermostable reverse-
transcriptase such as "Superscript" (Gibco), which is active at higher temperatures.
Carrying out the reverse-transcription at a higher temperature would help to
eliminate any abnormal secondary structure of the ABL exon 11 mRNA which
might be affecting the efhciency of the reactions in these patients.
220

Cu¡,prERErcnr
CoNcLUDTNc DrscussroN

The aim of this thesis was to determine the molecular basis for loss of ABO blood
group antigens from the red cells of patients with haematological malignancy.
While loss of antigen expression is rarely reported, the actual molecular events
leading to this phenomenon might be an indication of a more common genetic
event occurring in haematological malignanctes.
At least three different mechanisms are responsible for loss of blood group antigen
expression. The first, loss of the precursor H antigen was responsible for loss of B
antigen expression in two patients. Physical loss (loss of heterozygosity), of the A
allele of the ABO gene which has been localised to chromosome band 9q34, was
responsible for loss of A antigen expression in one case, while transcriptional
silencing of the A allele of the gene was responsible for loss of A antigen
expression in four other cases. One of the most interesting findings from the
analysis of the ABO gene in patients with loss of antigen expression was physical
loss of the non-functional O allele. As loss of a non-functional allele cannot
provide a growth or other advantage to the cell, it is an indication of a larger event
occurring that some times includes the ABO locus. As recurrent loss of
heterozygosity events indicate the presence of a tumour suppressor gene, other
genes were analysed in these patients to define the recurrently lost region.
Analysis of the linked AKl gene revealed that loss of heterozgosity occurring at the
ABO locus (at least in one patient) does not include the AKl gene. As the AKl
gene is closer to the centromere than the ABO gene, this also excludes involvement
of the candidate tumour suppressor gene, the Growth Arrest Specific I (GASI)
gene. The GASl gene, which we mapped to 9q21.3-q22 (Evdokiou et al., 1993), is
in a region recurrently deleted in AML, MDS and MPD (Trent et al., 1989).
222

Analysis of the relative allelic expression of the AKI gene in a patient with allelic
silencing of the ABO A allele, revealed transcriptional silencing of a single allele of
the AKI gene. Presumably other genes in this l5mb region are also silenced,
including a tumour suppressor gene. Given that some of the genes in this region are
expressed in haematopoietic cells (eg. TANI), it could also be hypothesised that
silencing and subsequent reduced expression ofthese genes also contributes to the
overall features ofthe disease.
The finding of both physical loss of the O allele of the ABO gene and
transcriptional silencing of the A allele in one patient, indicates that the presumed
tumour suppressor gene in this region is closely linked to the ABO gene. Following
this hypothesis, one copy of the gene would be transcriptionally silenced, and the
other physically lost. Subsequently, the gene would be completely functionally lost
from the cell. In the patients with transcriptional silencing of a single allele of the
ABO gene, it is proposed that there is also transcriptional silencing of a linked
tumour suppressor gene on the same chromosome. Functional loss of the other
copy of the tumour suppressor would either be by deletion, mutational inactivation,
or another silencing event.
A likely candidate for the tumour suppressor gene in the 9q34 region is the ABL
gene. However, if ABL is indeed a tumour suppressor, it might have been expected
that at least one of the patients with haematological malignancy and no loss of
blood group antigen expression had loss of heterozygosity at the ABL locus.
Alternatively, it could be possible that the ABL gene is more susceptible to
transcriptional silencing or other events than physical loss, for reasons as yet
unknown. The finding that AI¡L, or at least the oDNA copies of mRNA transcripts
containing the region examined in exon I I of the ABL gene, appear to be under-
expressed in most patients with haematological malignancy relative to that of
223

norrnal controls, could be important. It is possible that the majority of precursor
stem or "blast" cells normally express very low amounts of AIIL, although in two
patients with haematological malignancy and large numbers of blast cells, ABL
appeared to be normally expressed (patients 6 and 8 in Appendix B). Furthermore,
in three other patients (patients 3, 14 and 15 in Appendix B), the majority of cells in
the samples examined were lymphocytes. As the cells examined from normal
control individuals were also mainly lymphocytes, it seems that reduced expression
of the ABL gene is not merely a consequence of the cell type examined.
Future Directions
Comparatively little is known about the pathogenic process involved in the
haematological malignancies relative to that of solid tumours. Most of what we
know about leukaemia and other haematological malignancies has come from
studies of the genes involved in translocation breakpoints (eg. CML). The work in
this thesis demonstrates the difficulties involved when working with samples from
patients with haematological malignancy, in which the "tumour" is completely
disseminated and interspersed with normal cells. The best way of avoiding this
problem and allowing comparisons between normal and malignant cells in the same
individual is to analyse single haematopoietic colonies (eg. CFU-GM, BFU-E) using
PCR and RT-PCR. An additional advantage of this technique would be that
differenl evolved leukaemic clones could also be distinguished at the molecular
level.
To further localise the tumour suppressor gene, analysis of the patients with loss of
heterozygosity at the ABO locus using micro-satellite markers which are highly
polymorphic and found in almost all genes should prove to be very useful.
Similarly, the patients with allelic silencing of the ABO gene could be examined for
224

monoallelic expression of other genes in the 9q34 regipn using exonlc
polymorphisms.
Transcriptional silencing of the ABO gene is most likely to be due to allele-specific
methylation of the promoter region. The recent cloning of the 5' untranslated
region of the gene (Yamamoto et al., 1995), will now permit analysis of
methylation patterns in the patients with transcriptional silencing of the A allele of
the ABO gene and no loss of heterozygosity. Similarly, the promoter region of the
AKl gene could also be examined for methylation in the patient that appears to
have transcriptional silencing of both the ABO and AKl genes. It would also be
interesting to determine if the silenced alleles in this patient are on the same
chromosome, which could be achieved using somatic cell hybrid analysis. Given
that 1l of 12 patients with loss of A or B antigen expression and haematological
malignancy had lost expression of the maternally inherited allele, it seems highly
likely that imprinting of the 9q34 region is involved in this phenomenon.
In conclusion, this thesis provides the first insight into the molecular basis for loss
of ABO blood group antigens in haematological malignancy, and the first report of
loss of heterorygosity at the ABO locus in haematological malignancy. The finding
that transcriptional silencing of a single allele of the ABO gene is more often
responsible for loss of antigen expression than physical loss of the gene is intriguing
and may represent an as yet uncharacterised epi-genetic event occurring in
malignancy.
225

BTnTTOGRAPTIY

Attwood J, Chiano M, Collins A, Donis-Keller H, Dracopoli N, Fountain J, Falk C,
Goudie D, Gusella J, Haines J, Armour JAL, Jeffreys AJ, Kwiatkowski D, Lathrop
M and Matise T (1994) CEPH Consortium Map of Chromosome 9. Genomics
19.203-214.
Baikie AG, Court-Brown WM, Buckton KE, Harnden DG, Jacobs PA and Tough
IM (1960) A possible specific chromosome abnormality in human chronic myeloid
leukaemia. Nature 1 88: I 165- 1 166.
Ball SP, Tongue N and Gibaud A (1991) The Human chromosome 19 linkage
group Futl(H), Fut2(Se), LE, LU, PEPD, C3, APOC2,DI957 and Dl9S9. Annals of
Human Genetics 5 5 :225 -233.
Bech-Hansen, NT, Marshall, KJ and Kraus, SL (1989) Taql RFLP in human
adenylate kinase-l (AKl) gene region on chromosome 9. Nucleic Acids Research
17 (10):4004.
Bennett EP, Steffensen R, Clausen H, Weghuis DO and van Kessel AG (1995)
Genomic cloning of the human histo-blood group ABO locus. Biochemical and
Biophysical resea¡ch communications 206:3 18-325.
Bernard J, Bessis M, Bussard A, Ducos J, De Grouchy J, Lejeune J, Salmon C,
Seligmann M and Wurmser R (1965) Changements de groupes sanguins dans les
leucémies. Nouvelle Revue Française d'Hématolo g¡e 5 :29 l'308.
Betteridge A and Watkins WM (19S5) Variant forms of cr-2-L-fucosyltransferase in
human submaxillary glands from blood group ABH "secretor" and "non-secretor"
individuals. Glycoconj ugate Journal 2:6I -7 8.
227

Betteridge A and Watkins WM (1986) Acceptor substrates specificities of human cr
-2-L-fucosyltransferases from different tissues. Biochemical Society Transactions
l3:1126-1127.
Bhatia HM and Sanghvi LD (1960) A variant of blood group A in a leukaemia
patient. Indian Journal of Medical Science 14:534-535.
Bird GWG, Wingham J, Chester GH, Kidd P and Payne RW (1976) Erythrocyte
membrane modification in malignant disease of myeloid and lymphoreticular
tissues. British Journal of Haematolory 33:295-299.
Breimer ME (1980) Adaptation of mass spectrometry for the analysis of tumor
antigens as applied to blood group glycolipids of a human gastric carcinoma.Cancer
Research 40:897-908.
Brockhaus M, Magnani JL and Herlyn M (1982) Monoclonal antibodies directed
against the sugar sequence of lacto-N-fucopentaose III are obtained from mice
immunized with human tumours. Archives of Biochemistry and Biophysics
217:647-651.
Bullock WO, Fernandez JM and Short JM (1987) XLl-Blue: A hieh efficiency
plasmid transforming recA Escherichiq coli strain with beta-galactosidase
selection. Biotechniq ues 5 :37 6-37 8.
Carter S, Glatstein F and Livingston R (1982) Principles of cancer treatment.
McGraw-Hlll, p 392-393 .
Chang JG, Lee LS, Chen PH, Liu TC, Lin SF and Lee JC (1992) Rapid genotyping
of the ABO blood group. Blood 79:2176-2177.
228

Cheng J and Maquat LE (1993) Nonsense codons can reduce the abundance of
nuclear mRNA without affecting the abundance of pre-mRNA or the half-life of
cytoplasmic mRNA. Molecular and Cellular Biology 131892-1902.
Chomczynski P and Sacchi N (1987) Single-step method for RNA isolation by
acid guanidinium thiocyanate-phenol-chloroform extraction. Analytical
Biochemistry 162:1 56- I 59.
Clark SS, Mclaughlin J, Crist WM, Champlin R and Witte ON (1987) Unique
forms of the abl tyrosine kinase distinguish Ph-positive CML from Ph-positive ALL.
Science 235:85-88.
Clausen H, Levery SB, Nudelman E, Tsuchiya S and Hakomori S (1985) Repetitive
A epitope (type 3 chain A) defined by blood group Al-specific monoclonal
antibody TH-l: chemical basis of qualitative Al and A2 distinction. Proceedings of
the National Academy of Sciences (USA) 82:1199-1203.
Clausen H, Levery SB, NudelmanB, Baldwin M and Hakomori S (1986) Further
characterization of type 2 and type 3 chain blood group A glycosphingolipids from
human erythrocyte membranes. Biochem istry 25 :7 07 5 -7 085 .
Clausen H, White T, Takio K, Titani K, Stroud M, Holmes E, Karkov J, Thim L and
Hakomori S (1990) Isolation to homogeneity and partial characterization of a histo-
blood-group-A defined Fuccrl-2Gala1-3-N-acetylgalactosaminyltransferase from
human lung tissue. Journal of Biological Chemistry 265:1139-1145.
229

Clausen H and Hakomori S (1989) ABH and related histo-blood group antigens;
lmmunochemical differences in carrier isotypes and their distribution. Vox Sang
56:1-20.
Dabelsteen E, Vedtofte P, Hakomori SI and Young WW (1983) Accumulation of a
blood group antigen precursor in oral premalignant lesions. Cancer Research
43:1451-1454.
Dabelsteen E, Clausen H and Mandel U (1991) Aberrant glycosylation in oral
malignant and premalignant lesions. Journal of Oral Pathology and Medicine
20:361-368.
Dabelsteen E and Jacobsen GK (1991) Histo-blood group antigens as
differentiation markers in testicular germ cell tumours. APMIS 99:391-397.
Dahiya, R, Itzkowitz, SH, Byrd, JC and Kim, YS (1989) ABH blood group antigen
expression, synthesis, and degradation human colonic adenocarcinoma cell lines.
Cancer Research 49 :45 50-4556.
Daley GQ, Van Etten RA and Baltimore D (1990) Induction of Chronic
Myelogenous Leukemia in mice by the p2l0 bcrlabl gene of the Philadelphia
ch¡omosome. Science 247'.824-830.
David L, Leitao D, Sobrinho-Simoes M, Bennett EP, White T, Mandel U,
Dabelsteen E and Clausen H (1993) Biosynthetic basis of incompatible histo-blood
group A antigen expression: Anti-A transferase antibodies reactive with gastric
cancer tissue of type O individuals. Cancer Research 53:5494-5500.
230

Davidsohn I, Ni LY and Stejskal R (1971) Tissue isoantigens A, B, and H in
carcinoma of the pancreas. Cancer Research 31.1244-1250.
Davidsohn [, Kovarik S and Ni LY (1969) Isoantigens A, B and H, in benign and
malignant lesions of the cervix. Archives of Pathology 87:306-314.
Davidsohn I, Kovarik S and Lee CL (1966) A, B and O substances rn
gastrointestinal carcinoma. Archives of Pathology I 1 :3 I 1 -90.
Davidsohn I (1972) Early immunologic diagnosis and prognosis of carcinoma.
American Journal of Clinical Pathology 57:715-730.
Dobrovic A, Peters G and Ford JH (1991) Molecular analysis of the Philadelphia
chromosome. Chromosoma 100:479-486.
Dreyfus B, Sultan C, Rochant H, Salmon C, Mannoni P, Carton JP, Boivin P and
Galand C (1969) Anomalies of blood group antigens and erythrocyte enzymes in
two types of ch¡onic refractory anaemia. British Journal of Haematology 16:303-
312
Ducos, J, Ruffie, J, Marty, Y, Salles-Mourlan, AM and Colombies, P (1964) Does
a connexion exist between blood group modifications observed in leukaemia and
certain ch¡omosomal alte rations? Nature 203 : 432'433 .
Dunn JM, Phillips RA, ZhuX, Becker A and Gallie BL (1989) Mutations in the
RBI gene and their effects on transcription. Molecular and Cellular Biology
9:4596-4604.
23r

Economidou J, Hughes-Jones NC and Gardner B (1967) Quantitative
measurements concerning A and B antigen sites. Vox Sang 12:321-328.
Ellisen LW, Bird J, West DC, Soreng AL, Reynolds TC, Smith SD and Sklar J
(1991) TAN-I, the human homolog of the Drosophila Notch gene is broken by
chromosomal translocations in T-lymphoblastic neoplasms. Cell 66:649 -661.
Evdokiou A, Webb GC, Peters GB, Dobrovic A, O'Keefe DS, Forbes IJ and Cowled
PA (1993) Localization of the human g¡owth arrest-specific gene (GASI) to
ch¡omosome bands 9q21.3-q22, a region frequently deleted in myeloid
malignancies. Genomics 1 8:73 l-733.
Fialkow P, Sing JW, Adamson JW, Vaidya K, Dow LW and Ochs J (1981) Acute
non-lymphocytic leukemia: Heterogeneity of stem cell origin. Blood 57:1068-1073.
Fildes RA and Harris H (1966) Genetically determined variation of adenylate
kinase in man. Nature 209:261-262.
Giblett ER and Crookston MC (1964) Agglutinablility of red cells by anti-i tn
patients with thalassaemia major and other haematological disorders. Nature
201:1138-l 139.
Gold ER, Tovey GH, Benney WE and Lewis FJW (1959) Changes in the group A
antigen in a case of leukaemia. Nature 183:892-893.
232

Gooi HC, Thorpe SJ and Hounsell EF (1983) Marker of peripheral blood
granulocytes and monocytes of man recognized by two monoclonal antibodies
VEPS and VEP9 involves the trisaccharide 3-fucosyl-N-acetyllactosamine.
European Journal of Immunology 13:306-312.
Gottfried EL (1971) Lipid patterns in human leukocytes maintained in long-term
culture. Journal of Lipid Research 12:531-537.
Griffin NR and Wells M (1993) Semiquantitative immunohistochemical studies of
blood goup antigen A,B,H, ¡.a, Leb structures and Ii backbone chains in the
normal human cervix and in cervical adenocarcinoma. Histochemical Joumal
25:228-241.
Grunnet N, Steffensen R, Bennett EP and Clausen H (1994) Evaluation of histo-
blood group ABO genotyping in a Danish population: Frequency of a novel O allele
defined as 02. Vox Sang 67:210-215.
Gunson FIH and Latham Y (1972) An agglutinin in human sen¡m reacting with
cells from Le(a-b-) non-secretor individuals. Vox Sang22:344'353.
Gunz F and Baikie AG. Leukemia, Grune and Stratton, New York,1974
Haas OA, Argyriou-Tirita A and Lion T (1992) Parental origin of chromosomes
involved in the translocatio n t(9 ;22). Nature 3 59 : 4 | 4 4 I 6 .
Haas OA (1995) Are ABL and BCR imprinted? No definitive answers, but more
questions. Leukemia 9:7 40-7 43.
233

Hakomori S, and Andrews H (1970) Sphingoglycolipids with Leb-activity, and the
co-presence of Lea- and Leb-glycolipids in human tumour tissue. Biochimica et
B iophysica Ãcta 202:225 -228.
Hakomori S (1934) Philip Levine Award Lecture: Blood group glycolipid antigens
and their modifications as human cancer antigens. AJCP 82 (6):ó35-648.
Hakomori SI, Koscielak J, Bloch KJ and Jeanloz, RW (1967) Immunologic
relationship between blood group substances and a fucose-containing glycolipid of
human adenocarcinoma. The Journal of Immunology 98:31-38.
Hakomori S, Wang SM and Young W\M (1977) Isoantigenic expression of
Forssman glycolipid in human gastric and colonic mucosa: Its possible identity
with "A-like antigen" in human cancer. Proceedings of the National Academy of
Science (USA) 7 4:3023-3027 .
Hakomori S (1931) Blood group ABH and Ii antigens of human erythrocytes:
chemistry, polymorphism, and their developmental change. Seminars in
Haematology 18:39-62.
Hammer L, Mansson S, Rohr T, Chester MA, Ginsburg V, Lundbland A and Zopf D
(1981) Lewis phenotype of erythrocytes and Leb-active glycolipid in serum of
pregnant women. Vox Sang 40:27-33.
Harmening-Pittiglio D (1986) Genetics and biochemistry of A, B, H and Lewts
antigens. In: Wallace ME and Gibbs FL. (Eds.), Blood group systems: ABH and
Lewis. Technical workshop on ABH and Lewis, Karger, Basel 198ó, pp. 1-56.
234

Heim S and Mitelman F. Cancer cytogenetics, AR Liss, New York, 1987
Henderson ES and Lister TA. (Eds.) Leukemia, W.B. Saunders Company,
Philadelphia, 1990.
Hildebrand, J, Stryckmans, P and Stoffun, P (1971) Neutral glycolipids in leukemic
and nonleukemic leukocytes. Joumal of Lipid Research 12:361-366.
Hillman, RS and Giblett, ER (1965) Red cell membrane alteration associated with
"marrow stress". Journal of Clinical Investigation 44:17 30'1736.
Hocking DR (1971) Blood group change in acute myeloid leukaemia. The Medical
Joumal of Australi a 2:902-903.
Hoogstraten B, Rosenfield RE and Wasserman LR (1961) Change of ABO blood
type in a patient with leukemia. Transfusion l:32'35.
Huang LC, Brockhaus M, Magnani JL, Cuttitta F, Rosen S, Minna JD and Ginsburg
V (1983a) Many monoclonal antibodies with an apparent specificity for certain
lung cancers are directed against a sugar sequence found in lacto-N-fucopentaose
III. A¡chives of Biochemistry andBiophysics 220:318-320.
Huang LC, Civin CI, Magnani JL, Shaper JH and Ginsburg V (1983b) Myl, the
human myeloid-specific antigen detected by mouse monoclonal antibodies is a
sugar sequence found in lacto-N-fucopentaose III. Blood 6l 1020'1023.
Idikio, HA and Manickavel V (1991) Conelation of blood group antigen
expression and oncogene-related proteins in malignant prostatic tissues. Pathology
Research in Practice 187:189-197.
235

Jackson P and Baltimore D (1989) N-terminal mutations activate the leukemogenic
potential of the myristoylated form of c-abl. EMBO Journal 8:449-456.
Jenkins WS, Marsh WL, Noades J, Tuppett RA, Sanger R and Race RR (1960)
Vox Sang 5:97.
Johnson PH, Donald ASR, Feeny J and Watkins WM (1992) Reassessment of the
acceptor specificity and general properties of the Lewis blood group gene
associated a-314 fucosyltransferase purified from human milk. Glycoconjugate
Journal 9:251-264.
Kahn A, Vroclans M, Hakim J and Boivin P (1971) Differences in the two red-cell
populations in Erythroleukemia. The Lancet October 23:933'933.
Kannagi R, Papayannopoulou T and Nakamoto B (1983) Carbohydrate antigen
profiles of human erythroleukemia cell lines FIEL andK562. Blood 62:1230-1241.
Kaplan JC, Kahn A and Chelly J (1992) Illegitimate transcription: Its use in the
study of inherited disease. Human Mutation l:357'360.
Kassulke JT, Hallgren HM and Yunis EJ (1969) Studies of red cell isoantigens on
peripheral leukocytes from normal and leukemic individuals. American Journal of
Pathology 56:333-347.
Kassulke JT, Stutman O and Yunis EJ (1971) Blood-group isoantigens in leukemtc
cells: Reversibility of isoantigenic changes by neuraminidase. Journal of the
National Cancer Institute 46',120 I-1208.
236

Kloetzer W, Kurzrock R, Smith L, Talpaz M, Spiller M, Gutterman JU and
Arlinghaus R (19S5) The human cellular abl gene product in the chronic
myelogenous leukemia cell line K562 has an associated tyrosine protein kinase
activity. Virology 140:230-238.
Kolins J, Holland PV and McGinniss MH (1978) Multiple red cell antigen loss in
acute granuloc¡ic leukemia. Cancer 42:2248-2253.
Konopka JB, Watanabe SM and Witte ON (1984) An alteration ofthe human c-abl
protein in K562 leukemia cells unmasks associated tyrosine kinase activity. Cell
37:1035-1042.
Konopka JB and Witte ON (1935) Detection of c-abl tyrosine kinase activity in
vitro permits direct comparison of normal and altered abl gene products. Molecular
and Cellular Biology 5:3116-3123.
Koscielak J (1977) Chemistry and biosynthesis of erythroc¡ic membrane
glycolipids with A, B, H and I blood group activities. ln: Mohn JF, Plunkett RW,
Cunningham RK and Lambert RM. (Eds.), Human Blood Groups. Proceedings of
the Fifth International Convocation of Immunology, Karger, Basel 1977, pp. 143-
149.
Kovarik S, Davidsohn I and Stejskal R (1963) ABO antigens in cancer. Detection
with the mixed cell agglutination reaction. Archives of Patholory 86:12'2I.
237

Kraemer D, Wozniak RW, Blobel G and Radu A (1994) The human CAN protein,
a putative oncogene product associated with myeloid leukemogenesis, is a nuclear
pore complex protein that faces the cytoplasm. Proceedings of the National
Academy of Sciences (USA) 91: 15 19-1523.
Kubonishi I and Miyoshi I (1933) Establishment of a Phl ch¡omosome postttve
cell line from chronic myelogenous leukemia in blast crisis. International Journal of
Cell Cloning 1:105-17.
Kuhns WJ (1973) Biosynthesis of cellular ABO antigens. Defective expression on
neoplastic cells. Transfusion I 8:389.
Kumazaki T and Yoshida A (1984) Biochemical evidence that secretor gene, Se, is
a structural gene encoding a specific fucosyltransferase. Proceedings of the
National Academy of Sciences (USA) 81.4193-4197 .
Kurokawa H, Katsura S, Kamadu M, Matsuo W, Tokhwa K, Satodate R and Sasaki
K (1969) Increase of fetal hemoglobin and loss of blood group antigen B in a
patient with leukemia. Tohoku Journal of Experimental Medicine 99:35 (abstract
only seen).
Kwiatkowski DJ, Henske EP, Ozelius L, Gusella JF and Haines JL (1993) A high
resolution linkage map of human9q34.1. Genomics 17:587-591.
Larsen RD, Ernst LK, Nair RP and Lowe JB (1990) Molecular cloning, sequence
and expression of human GDP-fucose; B-D-galactoside 2 cr-L-fucosyltransferase
cDNA that can form the H btood group antigen. Proceedings of the National
Academy of Sciences (USA) 87:6674-6678.
238

Leavitt J, Gunning P, Porreca PN, Ng SY, Lin CS and Kedes L (1984) Molecular
cloning and characterisation of mutant and wild type human b-actin genes.
Molecular and Cellular Biology 4:1961-1969.
Lee JC and Chang JG (1992) ABO genotyping by polymerase chain reaction.
Journal of Forensic Sciences 37'.1269-1275.
LePendu J, Cartron JP, Lemieux RU and Oriol R (1985) The presence of at least
two different H-blood-group-related B-D-Gal a-2-L-fucosyltransferases in human
senrm and the genetics of blood goup H substances. American Journal of Human
Genetics 37.749-760.
Ley AB, Harris JP and Brinkley M (1961) Alteration of erythrocyte antigen B in
acute leukemia. Proceedings of the American Association of Blood Banks (p72).
Lim S, Sigmund CD, Gross KW and Maquat LE (1992) Nonsense codons in human
B-globin mRNA result in the production of mRNA degradation products. Molecular
and Cellular Biology 12:1149-116l.
LitzCE (1995) The parental origin of the Philadelphia chromosome: evidence of
additional, recurring recombinatorial events. Leukemia 9 :7 44-7 45.
LopezM, Benali J and Bony V (1979) Activity of the IgG and IgM ABO antibodies
against some weak A (43, 6x, fiend¡ and weak B(B3, 3x¡ red cells. Vox Sang
37:281-285.
239

Lopez M, Bonnet-Gajdos M, Reviron M, Janvier D, Huet M and Salmon C (1986)
An acute leukaemia augured before clinical signs by blood group antigen
abnormalities and low levels of A and H blood group transferase activities in
erythrocytes. British Journal of Haematology 63 : 5 3 5-5 3 9.
Lowe JB (1993) The blood goup-specific human glycosyltransferases. In: Byres C.
(Ed.), Bailliere's Clinical Haematology, Bailliere Tindall, Great Britain 1993, pp.
465492.
Majsþ A, Jakoubkova J and Machackova M (1967) Frequency and serological
character of changes of group ABH-antigens in blood diseases and malignant
tissues. Neoplasma 14:41-48.
Mandel U, White T, Karkov J, Hakomori S, Clausen H and Dabelsteen E (1990)
Expression of the histo-blood group ABO gene defined glycosyltransferases in
epithelial tissues. Journal of Oral Pathology and Medicine 19.251-256.
Mandel U, Langkilde NC, Orntoft TF, Hamilton-Therkildsen M, Karkov J, Reibel J,
White T, Clausen H and Dabelsteen E (1992) Expression of histo-blood-group-
A/B-gene-defined glycosyltransferases in normal and malignant epithelia:
correlation with AIB carbohydrate expression. International Journal of Cancet 52:7'
12.
Marsden, KA, Pearse, AM, Collins, GG, Ford, DS, Heard, S and Kimber, RI (1992)
Acute leukemia with t(l;3)(p36;q21), evolution to t(l;3)(p36;q2l),
t1a;n)@32;q2|), and loss of red cell A and Leb antigens. Cancer Genetics and
Cytogenetics 64: 80-85.
240

Marsh WL, Nichoiss ME and Reid ME (1971) The definition of two I antigen
components. Vox Sang 20:209-17.
Marsh WL (1961) Anti-i: A cold antibody defîning the Ii relationship in human red
cells. British Journal of Haematology 7.200'209.
Masamune H, Kawasaki H, Abe S, Oyama K and Yamaguchi Y (1958) Molisch
positive mucopolysaccharides of gastric cancers as compared with the
corresponding components of gastric mucosa. Tohoku Journal of Experimental
Medicine 68:81-91 (as cited in Hakomori, 1984).
Masamune H and Hakomori S (1960) On the glycoprotein and
mucopolysaccharides of cancerous tissue, in particular references on "cancer blood
group substance". Symposia in Cell Chemistry 10'.37 (as cited in Hakomori, 1984).
Matsuki T, Shimano S and Furukawa K (1992) Altered expression of blood group
A and H antigens on red cells from an acute leukemic patient. Experimental
Clinical Immunogenetics 9 : 125 -129 .
Matsuura S,Igarashi M, TanizawaY,Yamada M, Kishi F, Kajii T, Fujii H, Miwa S,
Sakurai M and Nakazawa A (1989) Human adenylate kinase deficiency associated
with hemol¡ic anemia. The Journal of Biological Chemistry 264:10148-10155.
Mattioni T, Jackson PK, Bchini-Hooft van Huijsduijnen O and Picard D (1995)
Cell cycle arrest by tyrosine kinase Abl involves altered early mitogenic response'
Oncogene I 0: 1325-l 333.
241

McGinniss, MH, Kirkham, WR and Schmidt, PJ (1964) Modified expression of the
ABO, I and H antigens in Acute Myelogenous Leukaemia. Transfusion 4.310.
Meldgaard P, Holmes EH, Bennett EP, Clausen H, Zeuthen J, Wolf H and Orntoft
TF (1994) Blood group ABO related glycosylation of urothelial cell lines:
Immunocytological, enzymatic, and genetic characterization. Cancer Research
54:2440-2447.
Melo JV, Yan X-H, Diamond J and Goldman JM (1994) Lack of imprinting of the
ABL gene. Nature Genetics 8:318-319.
Melo JV, Yan X-H, Diamond J and Goldman JM (1995) Balanced parental
conhibution to the ABL component of the BCR-ABL gene in chronic myeloid
leukemia. Leukemia 9:734-745.
Metoki R, Kakudo K, Tsuji Y, Teng N, Clausen H and Hakomori S (1989)
Deletion of Histo-blood Group A and B Antigens and Expression of lncompatible A
Antigen in Ovarian Cancer. Journal of the National Cancer Institute 8l (15):1151-
1157.
Miller SA, Dykes DD and Polesþ I{F (19SS) A simple salting out procedure for
extracting DNA from human nucleated cells. Nucleic Acids Research 16:1215
Milner LA, Kopan R, Martin DIK and Bernstein ID (1994) A human homologue of
the Drosophila developmental gene, Notch, is expressed in CD34+ hematopoietic
precursors. Blood 83.2057 -2062.
242

Miyake M, Taki T, Hitomi S and Hakomori SI (1992) Correlation of expression of
HlLevlLeb antigens with survival in patients with carcinoma of the lung. The New
England Journal of Medicine 327'.14-18.
Mollison PL (1979) Blood Transfusion in clinical medicine. 6th edn. Blackwell
Scientific Publications, Oxford, UK.
Mori T, Sudo T and Kano K (1933) Expression of heterophile Forssman antigens
in cultured malignant cell lines. Journal of the National Cancer Institute 70:811-
814.
Moulton T, Crenshaw T, Hao Y, Moosikasuwan J, Lin N, Dembitzet F, Hensle T,
Weiss L, McMorrow L, Loew T, Kraus W, Gerald W and Tycko B (1994)
Epigenetic lesions at the H19 locus in Wilms' tumour patients. Nature Genetics
7:440-447.
Nowell PC and Hungerford DA (1960) A minute chromosome in human chrontc
granulocytic leukemia. Science 132:1497.
OgataH and Hasegawa S (1977) Undetectable ABO isoagglutinin in a patient with
chronic myelocytic leukemia. Transfusion 17 .65 I -654.
Oriol R, LePendu J and Mollicone R (1986) Genetics of AIIO, H, Lewis and
related antigens. Vox Sanguinis 5116l-171.
Oriol R, Danilovs J and Hawkins BR (1931) A new genetic model proposing that
the Se gene is a structural gene closely linked to the H gene. American Journal of
Human Genetics 33:421-431.
243

Oriol R (1990) Genetic control of the fucosylation of ABH precursor chatns.
Evidence for new epistatic interactions in different cells and tissues. Journal of
lmmunogenetics 17 :23 5 -245 .
Omtoft TF, Hvid H, Clausen H, Hakomori S and Dabelsteen E (1989) Loss of
Blood Group ABO-Related Antigen Expression in Urothelium from Patients with
Ch¡onic Cystitis. Laboratory tnvestigation 60 (2):3 05-3 I 0.
Potapov MI (1970) Detection of the antigen of the Lewis system, characteristic of
the erythrocytes of the secretor group Le(a-b-). Problems of Hematologic Blood
Transfusion (USSR) 11.45-49 (as cited in wallace and Gibbs, 1986).
Puffenberger EG and Francomano CA (1991) PCR-based detection of polymo¡phic
DdeI andKpnl sites in intron 5 of the adenylate kinase (AK1) gene. Nucleic Acids
Research 19:l161.
Ragen, PA, McGuire, P and Antonius, JI (1968) Decreased formation of
erythrocyte antigen A and a consistent chromosome abnormality in a patient with
myelomonocytic leukemia. Acta Haematologica 3 9:309-3 I 9.
Renton, PH, Stratton, F, Gunson, FIFI and Hancock, JA (1962) Red cells of all four
ABO groups in a case of leukaemia, British Medical Journal February 3,294-297.
Richards, AG (19ó2) Loss of blood-group-B antigen in chronic lymphatic
leukaemia. The Lancet July 28,178'179.
244

Rowley, J (1973) A new consistent chromosomal abnormality in chronic
myelogenous leukemia identified by Quinacrine flourescence and Giemsa staining.
Nature 243:290-293.
Rubinstein, P, Allen, FH and Rosenfield, RE (1973) A dominant suppressor of A
and B. Vox Sanguínis25.377-381.
Sadler JE.:Biosynthesis of glycoproteins: formation of O-linked oligosaccharides in
Ginsburg V and Robbins PW. (Eds.), Biology of Carbohydrates, Wiley, New York
1984, pp. 199-288.
Salmon C, Andre R and Dreyfus B (1959) Existe-t-il des mutations somatiques du
gène de groupe sanguin A au cours de certaines leucémies aiguës?. Revue Française
Études Clinique et Biologie 4:468471.
Salmon C and Salmon D (1965) Défîcit en antigène H chez certains sujets de
groupe O atteints de leucémie aiguë. Revue Française Études Clinique et Biologie
10..212-214.
Salmon C (1976) Blood gfoups changes in Preleukemic states. Blood Cells 2:2ll'
Salmon C, Andre R and Philippon J (1961) Agglutinabilité normale des hématies
41 fiansfusées à trois malades leucémiques de phénotype A modifié. Revue
Française Études Clinique et Biologie 6:792-795.
220
245

salmon c, seger J, Mannoni P, Bahno-Duchery J and Liberge G (1968) Une
population d'érythrocytes avec anomalie simultanée des phénotypes induits par les
gènes des locus ABO et adenylate kinase. Revue Française Études Clinique et
Biologie 13:296-298.
Salmon C, Cartron JP and Rouger P. The human blood gtoups, Masson Publishing,
New York, USA, 1984b.
Salmon C, Dreyfus B and Andre R (195S) Double population de globules, différant
seulement par I'antigène de groupe ABO, observée chez un malade leucémique.
Revue dTlématologie 13 : 148-153.
Salmon C, Cartron JP, Lopez M, Rahuel C, Badet J and Janot C (1984) Level of
the A, B and H blood group glycosyltransferases in red cell membranes from
patients with malignant hemopathies. Blood Transfusion and Immunohaematolory
27:625-637.
Salmon C, Salmon D, Micouin C and Berthier J (1966) Étude quantitative de
I'antigène 'I' dans les érythrocytes des sujets atteints de leucémie aigue. Nouvelle
Revue Française Hématologi e 6 :5 63 -5 67 .
Salmon C, Rochant H, Mannoni P, Cartron JP, Jacquet A, Liberge G and Dreyfus B
(1969) Étude des modifications des antigènes de goups sanguins dan 1l cas
'd'anémies réfractaires', Nouvelle Revue Française Hématologie 9 : 1 13'124.
Sambrook J, Fritsch EF and Maniatis T. Molecular Cloning: A Laboratory Manual,
Cold Spring Harbour, New York, 1989.
246

Sarnesto A, Koklin T, Hindsgaul O, Thurin J and Blaszozyk-Thurin M (1992)
Purification of the secretor-type beta galactoside alpha 1-2 fucosyltransfèrase from
human serum. Journal of Biological Chemistry 267:2737-2744.
Sawyers CL, Denny CT and Witte ON (1991) Leukemia and the disruption of
normal hematopoiesis. Cell 64:337 -350.
Sawyers CL, Mclaughlin J, Goga A, Havlik M and Witte O (1994) The nuclear
tyrosine kinase c-abl negatively regulates cell growth. Cell77 12l-131.
Schachter H, Michaels MA, Crookston MC, Tilley CA and Crookston JH (1971) A
quantitative difference in the activity of blood group A-specific N-
acetylgalactosaminyltransferase in s€nrm from Al and ¡2 human subjects.
Biochemical and Biophysical Research Communications 45 : 1 0 1 1 - 1 0 1 8.
Schachter H, Michaels MA" Tilley CA, Crookston MC and Crookston JH (1973)
Qualitative differences in the N-acetyl-D-galactosaminyltransferases produced by
human Al and A2 genes. Proceedings of the National Academy of Science (USA)
70:220-224.
Schenkel-Bnurner H and Hanfland P (1931) Immunochemistry of the Lewis blood
group system III. Studies on the molecular basis of the Lex property. Vox Sang
40:358-366.
Schmidt PJ, Barile MF and McGinniss MH (1965) Mycoplasma
(pleuropneumonia-like organisms) and blood group I; associations with neoplastic
disease. Nature 205.37 l-372.
247

Schuback DE, Ozelius L and Breakfield XO (1991) Ban[ RFLP at AKI locus
(9q3a). Nucleic Acids Research l9:5798.
Seyfried H, Walewska I and Werblinska B (1964) Unusual inheritance of ABO
group in a family with weak B antigens. Vox Sang9:268'277.
Shaper NL, Hollis GF, Douglas JG, Kirsch IR and Shaper JH (1988)
Characterization of the full length oDNA for murine þ-1,4-galactosyltransferase.
Novel features at the 5'end predict two translational start sites at two in-frame
AUGs. Journal of Biological Chemistry 263:10420'10428.
Shapiro MB and Senapathy P (1937) RNA splice junctions of different classes of
eukaryotes: sequence statistics and functional implications in gene expression.
Nucleic Acids Research 15.7 155-7 17 4.
Shtivelman E, Lifshitz B, Gale RP, Roe BA and Canaani E (1986) Alternative
splicing of RNAs transcribed from the human abl gene and from the bcr-abl fused
gene. Cell 47:277-284.
South Australian Cancer Registry's report (July 1995): Epidemiology of cancer rn
South Australia, January 1977 to December 1994. Published by the South
Australian Cancer Registry, Adelaide, South Australia.
Stanbridge EJ (1990) Human tumor suppressor genes. Annual Review of Genetics
24:615-657.
Starling KA and Fernbach DJ (1970) Changes in strength of A antigen in children
with acute leukemia. Transfusion l0:3-5.
248

Stellner K and Hakomori SI (1973) Enzymic conversion of "H1-glycolipid" to A or
B-glycolipid and deficiency of these enzyme activities in adenocarçinoma.
Biochemical and Biophysical Research Communications 55.439-445.
Stratton, F, Renton, PH and Hancock, JA (1953) Red cell agglutinability affected
by disease. Nature 18l:62-63.
Taniguchi N, Yokosawa N, Narita M, Mitsuyama T and Makita A (1981)
Expression of Forssman antigen synthesis and degradation in human lung cancer.
Journal of the National Cancer Institute 67:577'583.
Taylor JJ and Heasman PA (1994) Control genes for reverse transcriptase
polymerase chain reaction (RT-PCR). British Joumal of Haematology 86'.444'445.
Testa U, Henri A, Bettaieb A, Titeux M, Vainchenker'W, Tonthat H, Docklear MC
and Rochant H (1932) Regulation of i- and I-antigen expression in the K562 cell
line. Cancer Research 42:4694-4700.
Tilley CA, Crookston MC, Crookston JH, Shindman J and Schachter H (1978)
Human blood group A- and H-specified glycosyltransferase levels in the sera of
newborn infants and their mothers. Vox Sang 34:8-13.
Tovey GH (1960) Changes in the group A antigen in leukaemia. Proceedings of the
7th Congress of the European Society of Haematology, London 1959, ppll67-1170.
Trent JM, Kaneko Y and Mitelman F (1939) Report of the committee on structural
chromosome changes in neoplasia. Human Gene Mapping l0: Tenth international
workshop on human gene mapping. Cytogenetics and Cell genetics 5I:533-562.
249

Tsukazaki K, Sakayori M, Arai H, Yamaoka K, Kurihara S and Nozawa S (1991)
Abnormal expression of blood group-related antigens in uterine endometrial
cancers. Japanese Journal of Cancer Research 82934-941.
Tycko B (1994) Genomic imprinting: mechanism and role in human pathology
American Journal of Pathology 144'.431-441.
Ugozzoli L and Wallace RB (1992) Application of an allele-specific polymerase
chain reaction to the direct determination of ABO blood group genotypes.
Genomics 12.670-674.
Undevia JH, Bhatia HM, Sharma RS and Parekh JG (1966) Modification of group
B in acute myeloid leukaemia. Indian Journal of Medical Research 54 1145-1149.
Van Etten RA, Jackson P and Baltimore D (1939) The mouse type IV c-abl gene
product is a nuclear protein and activation of transforming ability is associated with
cytoplasmic location. Cell 5 8:669-678.
Van Loghem JJ, Dorfmmeier H and van der Hart M (1957) Two antigens with
abnormal serologic properties. Vox Sang 2:16-24.
Von Lindern M, Fornerod M, Van Baal S, Jaegle M, De Wit T, Buijs A and
Grosveld G (1992) The translocation (6;9), associated with a speciflrc subtype of
acute myeloid leukemia, results in the fusion of two genes, dek and can, and the
expression of a chimeric, leukemia-specifc dek-can mRNA. Molecular and Cellular
Biology 12:1687-1697.
250

Von Lindern M, Poustka A, Lehrach H and Grosveld G (1990) The (6;9)
chromosome translocation, associated with a specific subtype of acute
nonlymphocytic leukemia, leads to aberrant transcription of a target gene on 9q34.
Molecular and Cell ular B iology 10'.40 L 6-4026.
Wallace ME and Gibbs FL. (Eds.), Blood group systems: ABH and Lewrs'
Technical workshop on ABH and Lewis, Karger, Basel 1986, pp. 1-56.
Watkins WM (1930) Biochemistry and genetics of the ABO, Lewis, and P blood
group systems. Advances in Human Genetics 10:1-136.
Weinstein J, Lee EU, McEntee K, Lai PH and Paulson JC (1987) Primary skucture
of B-galactoside a2, 6-sialyltransferase: Conversion of membrane-bound enryme
to soluble forms by cleavage of the NH2-terminal signal anchor. Journal of
Biological Chemistry 262:17 7 3 5 -17 7 43 .
White T, Mandel U, Orntoft TF, Dabelsteen E, Karkov J, Kubeja M, Hakomori S
and Clausen H (1990) Murine monoclonal antibodies directed to the human histo-
blood-group-A transferase (UDP-GalNAc: Fucql-2Galcrl-3-N-
Acetylgalactosaminyltransferase) and the presence therein of Nlinked histo-blood
group A determinant. B iochemistry 29 :27 40'27 47 .
Whitehead RH, Zhang HH and Hayward W (1992) Retention of tissue-specific
phenotype in a panel of colon carcinoma cell lines: Relationship to clinical
correlates. Immunology and Cell Biology 70'.227-236.
Wiener AS and Gordon EB (1956) A hitherto undescribed human blood group,
Am. British Journal of Haematolory 2:305-307.
2sl

Wolf GT, Carey TE, Schmaltz SP, McClatchey KD, Poore J, Glaser L, Hayashida
DJS and Hsu S (1990) Altered antigen expression predicts oucome in squamous
cell carcinoma of the head and neck. Joumal of the National Cancer Institute
82rs66-1572.
Yamaguchi H, Okubo Y and HazamaF (1965) An A2B3 phenotype blood showing
an atypical mode of inheritance. Proceedings of the Japanese Academy 4l:316-320
(as cited in Wallace and Gibbs, 1986).
Yamamoto F and Hakomori S (1990) Sugar-nucleotide Donor Specificity of Histo-
blood Group A and B Transferases Is Based on Amino Acid Substitutions. Journal
of Biological Chemistry 265 .19257 -19262.
Yamamoto F, Marken J, Tsuji T, White T, Clausen H and Hakomori S (1990a)
Cloning and characterization of DNA complementary to human UDP-GalNAc. Fuc
g,'l-2Galo'-3GalNAc transferase (histo blood group A transferase) mRNA. Journal
of Biological Chemistry 265:1146-1 1 5 1.
Yamamoto F, Clausen H, White T, Marken J and Hakomori S (1990b) Molecular
genetic basis of the histo-blood group ABO system. Nature 345:229-233.
Yamamoto F, McNeill PD and Hakomori SI (1992) Human histo-blood group A2
transferase coded by A2 allele, one of the A subtypes, is characteizedby a single
base deletion in the coding sequence, which results in an additional domain at the
carboxyl terminal. Biochemical and Biophysical Research Communications
187:366-374.
2s2

Yamamoto F, McNeill PD, Yamamoto M, Hakomori SI, Hanis T, Judd WJ and
Davenport RD (1993a) Molecular genetic analysis of the ABO blood group system.
1. Weak subgtoups: A3 and 83 alleles. Vox Sang 64116-119'
Yamamoto F, McNeill PD, Yamamoto M, Hakomori SI, Bromilow LM and Duguid
JKM (1993b) Molecular genetic analysis of the ABO blood group system: 4.
Another type of O allele. Vox Sang 64175-178.
Yamamoto F, McNeill PD, Yamamoto M, Hakomori SI and Hanis T (1993c)
Molecular genetic analysis of the ABO blood group system: 3. Ax and B(A) alleles.
Vox Sang 64'.171-174.
Yamamoto F, McNeill PD, Kominato Y, Yamamoto M, Hakomori SI, Ishimoto S,
Nishida S, Shima M and Fujimura Y (1993d) Molecular Genetic Analysis of the
ABO blood group system: 2. cis-AB alleles. Vox Sang 64:120-123.
Yamamoto F and Hakomori S (1990) Sugar-nucleotide Donor Specificity of Histo-
blood Group A and B Transferases Is Based on Amino Acid Substitutions. Journal
of Biological Chemist ry 26 5 :19257 -19262.
Yamamoto FI (1994) Recent progress in the molecular genetic study of the histo-
blood group ABO system. Immunohaematology l0:l-7.
Yamamoto FI, McNeill PD and Hakomori SI (1995) Genomic organization of the
human histo-blood group ABO genes. Glycobiology 5:51-58'
253

Yokota M, Warner GA and Hakomori S (19S1) Blood group A'like glycolipid and
a novel Forssman antigen in the hepatocarcinoma of a blood gfoup O individual'
Cancer Research 41 :4 1 85-4 190.
Yoshida A, Kumazaki T, Dave V, Blank J and Dzik WH (1985) Suppressed
expression of blood group B antigen and blood group galactosyltransferase in a
Preleukemic subject. Blood 66:990-992.
Yuan M, Itzkowitz sH, Palekar A, Shamsuddin AM, Phelps PC, Trump BF and
Kim YS (1985) Distribution of blood group antigens A, B, H, Lewisa, and Lewisb
in human normal, fetal, and malignant colonic tissue. Cancer Research 45'.4499'
451 1.
zhang Y, Shields T, crenshaw T, Hao Y, Moulton T and Tycko B (1993)
Imprinting of human H19: Allele-specific CpG methylation, loss of the active
allele in Wilms tumor, and potential for somatic allele switching. American
Journal of Human Genetics 53 113-124.
254


Table 1. Comparison of ABO genotype with ABO blood group of patients witha wide range of haematoloqical malignancies.
Key: ALLAMLAULABLMDSMDS.t.
acute lymphoblastic leukaemia
acute myeloid leukaemiaacute undifferenti ated leukaemiaacute bi-phenotypic leukaemiamyelodysplastic syndromemyelodysplastic syndrome in transformation to acute
leukaemiarefractory anaemia with excess blasts
refractory anaemia with excess blasts- in transformation toRAEB -RAEB.t.
acute leukaemiaMPD - myeloproliferative disorderCML - chronic myeloid leukaemiaCLL - chronic lymphoblastic leukaemia
CMML- chronic myelomonocytic leukaemia
HCL - hairy cell leukaemiaTP - thromobcytopeniaWM - V/aldenstrom's macroglobulinaemiaBM - bone m¿urow asPirate
PB - peripheral bloodspleerVthyroid refers to biopsies of these organs
Where it was specified in bone mfurow reports, FAB subtypes (ie. Ml-M7), were
also included.
256

PatientII)
Diagnosis ABOsenowpe
ABOqroup
Sample ID Sampletvoe
Date
016232 AML oo o BM 216194
l 60825 AML oo o c04088 BM 715188
207290 AML BO B PB t017l92
221257 AML oo o BM 2513lez
318122 AML oo o t20763 BM 2U12190
3232t3 AML oo o BM 2313192
5 10832 AML AA A BM t8l8l92
2t4890 AML MI oo o PB 1014192
482499 AML MI oo o 120714 PB 9lrl790
438680 AML M2 oo o 120476 BM 217190
529175 AMLM2A44 oo o BM Dresentatlon
327298 AML M3 AO A 120084 BM 24110190
45 1028 AML M3 AO A BM 2stsl92
072084 A]\4L M4 AA A t20461 BM r8l6/90
r46612 AML M4 oo o r20849 BM rr/2191
I 5 1907 AML M4 oo o t21s75 BM 2U5192
337200 AML M4 AO A 120860 BM t4l2l9t
426r68 AML M4 AO A BM t6l9l92
434471 AML M4 oo o c04083 PB 4lsl88
493577 AML M4 oo o t21534 BM 8/1192
509672 AML M4 AA A PB t0l8/92
5 10023 AML M4 oo o PB 518192
52r522 AML M6 oo o 112504 BM 2!5193
052295 AML M7 AO A BM 8/8192
495102 ABL AO A t2r277 BM t6l8l9t406326 ATIL oo o c04248 BM 6/t0l9l413314 AUL AO A PB 4ltU92
463260 AUL. oo o t2t322 BM 519191
03 1686 MDS AO A PB 3014192
043638 MDS oo o 12t4tO BM 29110191
081282 MDS BO B PB 2913/93
1 10030 MDS oo o BM 13ltt/92
167069 MDS AO A 120052 BM t7ltl90I 85998 MDS AA A BM Uv93
188346 MDS AA A PB 8/7192
224836 MDS BO B BM 8lt2l93
279492 MDS AO A PB 5/tv92
40015 I MDS oo o c00428 BM 23lr|88433924 MDS oo o BM t3l5l92
437720 MDS AB AB 121206 BM tolTl9l
448281 MDS oo o BM t&l8l92
482245 MDS oo o 120717 BM 9lttl90525193 MDS AA A BM 12/9193
FMCDT MDS BO B BM presentatton
459580 MDS.t oo o r2t356 BM 4lt0l9L
068 l 52 RAEB-t AB AB c04532 BM 2118189
3 10971 RAEB-t oo o r20596 BM 2818190
066179 MPD oo o co4636 BM 23111/89
263600 MPD BO B t20668 spleen tslr0l90
458245 MPD AO A sDleen 9lrv92168727 CMML AA A 120644 PB 2110190
187003 CMML AO A r20640 BM tl10l90
257

Patientil)
Diegnosis ABOsenotYDe
ABOqrouD
Sample ID Sampletvne
Drte
043200 ALL oo o c04047 BM l4l3/88
264630 ALL oo o 120974 BM 9l4l9t
334321 ALL oo o 12t795 BM 516192
480781 ALL oo o 120854 BM 12l219r
RR ALLL2 oo o c04l l0 PB 7t6188
024568 CLL oo o 12t744 BM 13l5l92
183 16 CLL AO A 12t782 BM 216192
195788 CLL AO A 121437 Thwoid 13lrr19l
215842 CLL AO A c04084 BM s/5/88
3 18 179 CLL BO B c041 15 BM l616/88
415132 CLL AO A co4052 BM 2518193
447214 CLL BO B r04325 BM 211t2188
474631 CLL AB AB t21474 BM 29l|U9t154706 CML AO A 120598 PB 30/8i90
t69032 CML oo o 12t758 PB 2215192
210507 CML BB B c04268 PB l4ll 1/88
278035 CML AO A t20474 PB 2916190
299578 CML oo o 120974 PB tvU9l420701 CML oo o co4s96 PB t9170189
428501 CML oo o 121705 BM 2414192
455201 CML AO A c044ss BM 26ls/89
456001 CML oo o c04472 BM t5l6/89
457096 CML AO A c04550 BM 1!9189
457442 CML AO A c04497 BM t317l89
465208 CML oo o 12t469 BM 27ltv9r507817 CML AA A t21802 PB tjl6192
527787 CML AO A PB presentation
DN CML AO o r2t4t3 BM 2slel91
QMCG CML AO o BM 715190
469521 HCL AO A r20663 BM t5lt0l90
125332 TP oo o c04523 BM 15/8/89
50039s TP oo o 121668 PB 30/3/92
226193 WM oo o t20656 BM tÙll0l90
258

Table 2. Comparison of ABO genotype of tumours and blood of patients.
Patientil)
Sample TumourDuke'sstage
ABOGenotype
ABOGroup
508254 recto-sigmoidaltumour
B AO A
Q232r7r transverse colontumour
B AO A
223966 ascending colontumour
B AA A
t8t262 ascending colontumour
B AO A
5t3ls4 transverse colontumour
C AA A
196384 ascending colontumour
C oo o
501579 recto-sigmoidalfumour
A oo o
08489s ascending colontumour
C oo o
500162 ascending colontumour
B AB AB
316369 transverse colontumour
B AA A
508864 ascending colontumour
c BO B
Q23183 ascending colontumour
B AO A
r30623 ascending colontumour
B AO A
50s233 ascending colontumour
D AO A
300521 ascending colontumour
B BO B
1s2896 ascending colontumour
B AO A
084625 recto-sigmoidaltumour
B oo o
tDuke's stages are classified according to Carter el ql', 1982. A simplified
is: Duke's A - lesion confined to the mucous
penetration of the muscularis propria
metastases to the lymPh nodes
advanced; metastases to liver, lung, bone etc.
guide to the classificationmembrane (non-invasive)
Duke's BDuke's CDuke's D
259


Table 1: Patients analysed at the ABL locus.
Patient II) Diagnosis SampleType
SampleDate
BlastCells(%l
1 068152 RAEB-t +AMLM4 or M5
BM 7lsl90 66
2 490580 MDS.t BM 4lr019t >95
J 188346 MDS PB 2217192 95.7#
6 526084 AML Ml PB 6t9193 72
7 426168 AML M4 BM 1619l92 50
8 r01998 AML M4 BM 23ltll94 9s
9 434471 AMLMl BM 30/9/88 95
10 0t6232 ALLL2 BM 2t6194 >95
11 410885 ALLL2 BM 2sl6190 100
t2 SW AML M3 PB 6194 N/A
13 480781 ALLL2 BM 3n0190 64
14 447214 CLL PB t6l819r 97*
15 226t93 WM BM 3014190 98'
The abbreviations used in this table are defined in Appendix A.
# The figure given refers to the white cell count of the patient (normal range is 4-10'5)
'The figure given refers to the percentage of lymphocytes in the patient sample.
261

p.36 Table 1-2: The percentage of uterine/cervix metastases with partial staining
should be 7o/o and ttre p.rr"oìãg" of positively staining primary tumours (total)
should read5Yo.
p. l72,1ine 4. The statistical test used is a binomial expansion.
Enn¡.r¡,
194, line 9. The sentence should read: "Six of the thirteen patients-.'" (rather than
seven).