
Collisional and molecular spectroscopy in an ultracold Bose–Bose mixture
Upload
independentCategory
view
2download
0
arX
iv:0
712.
1617
v1 [
nlin
.PS]
10
Dec
200
7
MODULATIONAL INSTABILITY IN BOSE–EINSTEIN
CONDENSATE IN OPTICAL SUPERLATTICE
Ekaterina A. Sorokinaa 1 and Andrei I. Maimistova 2
a Department of Solid State Physics, Moscow Engineering Physics Institute,
Kashirskoe sh. 31, Moscow, 115409 Russia
ABSTRACT
Steady state distribution of the probability amplitudes and the site popula-
tion in the one dimensional optical superlattice was found. It was shown that
this solution of the equations which describe the dynamics of the Bose-Einstein
condensate in superlattice is unstable at the sufficiently high density of the
bosons. The expression for increment of the modulational instability was found
on base of the linear stability analysis. Numerical simulation demonstrates the
evolution of the steady state distributions of bosons into the space array of the
solitary peaks before the chaotic regime generation.
PACS : 03.75.Lm, 03.75.Hh 42.50.,32.80.Pj
1 electronic address: [email protected] electronic address: [email protected]
1

1 Introduction
Interference of the several plane waves of monochromatic radiation can form
a diffraction pattern in which the electric field strength periodically varies in
space. Resulting periodic system of the microscopic potentials is designated as
optical lattice [1, 2, 3]. Bose-Einstein condensates (BECs) trapped in optical
lattice have been studied in sufficient detail [4, 5, 6]. The dynamics of atoms in
an optical lattice can be described by two methods. The first method is based
on the nonlinear Schrodinger equation with a periodic potential [7, 8]. In papers
devoted to investigation of the Bose-Einstein condensation, this equation is often
called the Gross-Pitaevskii equation [9, 10, 11]. The second method answering
the tight-binding approximation is based on the Hubbard model, where the
operators of creation and annihilation of fermions are replaced by the operators
satisfying the commutation relations for bosons. The resulting model is often
called the Bose-Hubbard model [12, 13, 14, 15].
Recently the optical lattices with two sorts of microscopic potentials in a
unit cell have attracted attention [16, 17, 18, 19, 20]. In analogy with theory
of solid state crystals, this periodic system of the microscopic potentials can
be named optical superlattice. Due to the difference of the energy levels of
microscopic potentials quantum tunneling between the nearest-neighbor sites is
absent. Also, at low temperatures thermoactivated transport of an atom from
one site of the micropotential to the other site is absent. However, the photo-
induced transport of atoms along the optical superlattice is possible under the
condition for the Raman resonance[12, 21, 22]. A similar process is known in
nonlinear optics as a coherent population transfer and in solid state physics of
low dimensional systems as coherent transfer of electrons or excitons in a system
of coupled quantum dots.
Under CW electromagnetic radiation the different nonlinear excitations can
propagate in the optical superlattice. It is important to emphasize that parame-
ters of these excitations can be controlled by additional radiation, which defines
hopping rates between the adjacent sites.
2

Frequently the steady state wave motion takes place in various physical
systems. Due to the interplay between dispersive and nonlinearity effects a
week perturbation of the steady state wave may induce the exponential growth
of the perturbation. That phenomenon is the modulational instability of a
steady state wave. Some times modulational instability results in train of the
soliton-like waves. But it does not always happen.
Modulational instability in BECs in the case of the ordinary optical lattices
was investigated in [23, 24, 25]. It was shown that modulational instability is
basic mechanism by which solitons are created in BEC. The kind of solitons
(i.e., bright or dark one) depends on sign of the scattering lengths.
In this paper we consider the dynamics of the site populations for optical
superlattice with two sorts of microscopic potentials in a unit cell. The generated
Bose-Hubbard model describing this system in the tight-binding approximation
was used in [21, 22] to write the system of equations of motion for probability
amplitudes of the site population. These equations are employed as the basis for
present investigation. We found the stationary distribution of the probability
amplitudes. It should be pointed out that this distribution is not homogeneous
one, as opposed to the case of ordinary optical lattices. The main result is an
analytic expression for the modulational instability increment, which depends on
the site population and the wave number of harmonic weak perturbations. This
expression was obtained on base of the linear stability analysis. The numerical
simulation shows that instability leads to strongly non-regular pattern.
2 Model and basic equations
Let us consider the one-dimensional optical superlattice with two kinds of sites
in the tight-binding approximation [12, 13]. The microscopic potentials of one
depth correspond to sites with an even number, and microscopic potentials of
other depth correspond to sites with an odd number. Sites labeled by even
numbers contain bosons in the ground state |ga > with the energy εa. Sites
labeled by odd numbers contain bosons in the ground state |gb > with the
3
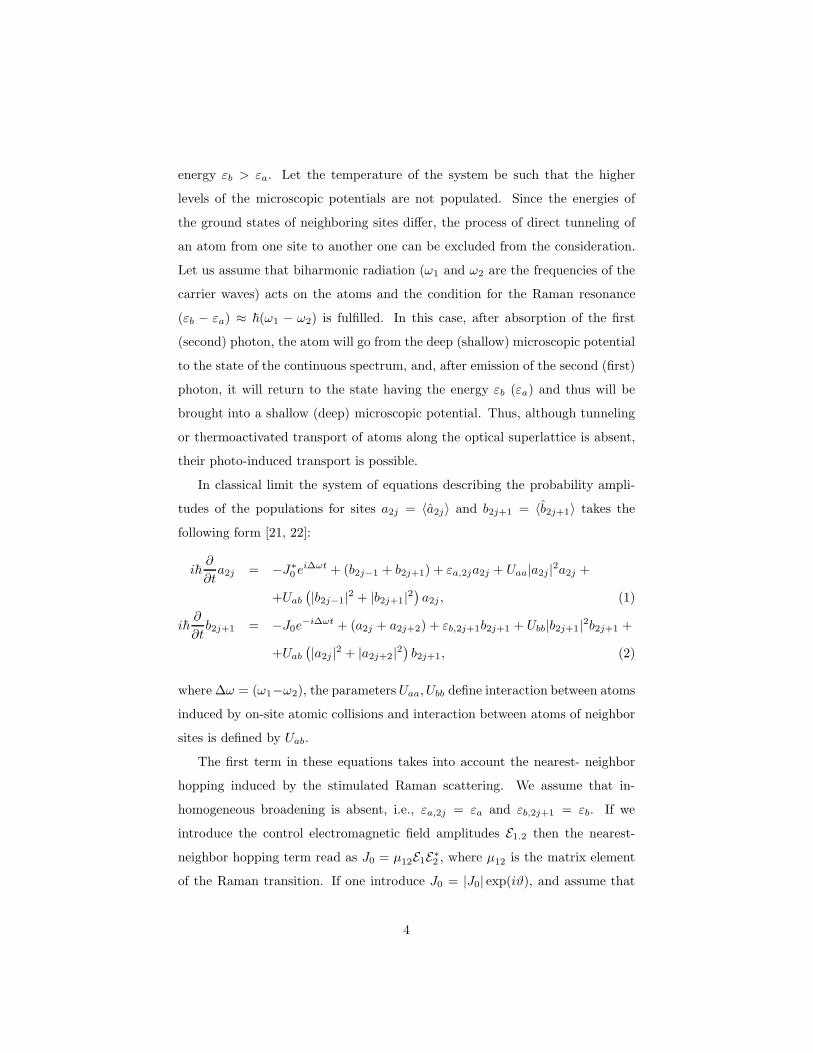
energy εb > εa. Let the temperature of the system be such that the higher
levels of the microscopic potentials are not populated. Since the energies of
the ground states of neighboring sites differ, the process of direct tunneling of
an atom from one site to another one can be excluded from the consideration.
Let us assume that biharmonic radiation (ω1 and ω2 are the frequencies of the
carrier waves) acts on the atoms and the condition for the Raman resonance
(εb − εa) ≈ ~(ω1 − ω2) is fulfilled. In this case, after absorption of the first
(second) photon, the atom will go from the deep (shallow) microscopic potential
to the state of the continuous spectrum, and, after emission of the second (first)
photon, it will return to the state having the energy εb (εa) and thus will be
brought into a shallow (deep) microscopic potential. Thus, although tunneling
or thermoactivated transport of atoms along the optical superlattice is absent,
their photo-induced transport is possible.
In classical limit the system of equations describing the probability ampli-
tudes of the populations for sites a2j = 〈a2j〉 and b2j+1 = 〈b2j+1〉 takes the
following form [21, 22]:
i~∂
∂ta2j = −J∗
0 ei∆ωt + (b2j−1 + b2j+1) + εa,2ja2j + Uaa|a2j |2a2j +
+Uab
(
|b2j−1|2 + |b2j+1|
2)
a2j , (1)
i~∂
∂tb2j+1 = −J0e
−i∆ωt + (a2j + a2j+2) + εb,2j+1b2j+1 + Ubb|b2j+1|2b2j+1 +
+Uab
(
|a2j |2 + |a2j+2|
2)
b2j+1, (2)
where ∆ω = (ω1−ω2), the parameters Uaa, Ubb define interaction between atoms
induced by on-site atomic collisions and interaction between atoms of neighbor
sites is defined by Uab.
The first term in these equations takes into account the nearest- neighbor
hopping induced by the stimulated Raman scattering. We assume that in-
homogeneous broadening is absent, i.e., εa,2j = εa and εb,2j+1 = εb. If we
introduce the control electromagnetic field amplitudes E1.2 then the nearest-
neighbor hopping term read as J0 = µ12E1E∗2 , where µ12 is the matrix element
of the Raman transition. If one introduce J0 = |J0| exp(iϑ), and assume that
4

control electromagnetic fields have a constant phase, then ϑ can be included
into complex value of the probability amplitudes b2j+1. Thus we can substitute
b2j+1 → b2j+1 exp(iϑ) = b2j+1, after that suppose the parameter J0 as real
value. If the interaction between atoms of neighbor sites is neglected then the
system of resulting equations takes the following form
i∂a2j/∂τ = −(
b2j−1 + b2j+1
)
+ βa|a2j |2a2j,
i∂b2j+1/∂τ = − (a2j + a2j+2) + δb2j+1 + βb|b2j+1|2b2j+1,
(3)
where ∆ε = (εb − εa) − ~∆ω, βa = Uaa/|J0|, βb = Ubb/|J0|,, δ = ∆ε/|J0|. We
use the normalized time variable τ = t|J0|/~. For the sake of simplicity we will
assume that the exact resonance condition is hold, i.e., δ = 0.
3 Stationary solution
It should remark that the atomic transport between neighbor sites in superlat-
tice is absent if the phases of amplitudes a2j and a2j+2 as well as b2j−1 and
b2j+1 will be opposite one.
Fig. 1 represents schematically the probability amplitudes configurations
in superlattice. Thin line arrows correspond to even sites the twin-line arrows
correspond to odd sites. Sing of the probability amplitude is indicated by orien-
tation of the arrow, i.e., plus (minus) corresponds to directed up (down) arrow.
The configurations shown in Fig.1 (a) and (b) are characterized by same energy,
hence we can except the existence of the solution of the equations (3) which de-
scribe the domain wall separated these two configurations. However, there we
will not consider this case.
The insertion of the ansatz a2j = (−1)ja(τ) and b2j+1 = (−1)jb(τ ) into
equations (3) results in following system of equations for the probability ampli-
tudes
i∂a
∂τ= βa|a|
2a, i∂b
∂τ= βb|b|
2b (4)
Equations (4) show that populations of the sites of each sublattice are indepen-
5

dent. It is convenient rewrite the equations (4) in term of real variables
a(τ ) = u(τ ) exp{ϕa(τ )}, b(τ ) = w(τ ) exp{ϕb(τ )}
that leads to the system of simple real equations
∂u
∂τ= 0,
∂w
∂τ= 0,
∂ϕa
∂τ= −βau2,
∂ϕb
∂τ= −βbw
2.
Solutions of these equations read as
u(τ ) = u0, w(τ ) = w0, ϕa(τ ) = ϕa0 − βau20, ϕb(τ ) = ϕb0 − βbw
20 (5)
Choosing of the initial phases we can state the configuration of the initial prob-
ability amplitude distribution as it shown in Fig.1 (a)(ϕa0 = ϕb0 = 0), or in
Fig.1(b) (ϕa0 = 0, ϕb0 = π).
4 Stability analysis for stationary distribution
Stability of the solution found above will be analyzed in the framework of the
linear stability theory. Let us consider the small perturbations of the stationary
distribution
a2j = (−1)ja(τ ) + δa2j , b2j+1 = (−1)jb(τ) + δb2j+1, (6)
with
a(τ ) = u0 exp{−βau20τ}, b(τ ) = w0 exp{−βbw
20τ}
The initial phases are chosen in the following form: ϕa0 = 0, ϕb0 = 0.
The linear equations associated with (3) read as
i∂
∂τδa2j = − (δb2j−1 + δb2j+1) + 2βau2
0δa2j + βaa2δa∗
2j , (7)
i∂
∂τδb2j+1 = − (δa2j + δa2j+2) + 2βbw
20δb2j+1 + βbb
2δb∗2j+1, (8)
If one substitute δa2j(τ ) = p2j(τ ) exp{−βau20τ}, δb2j+1(τ ) = q2j+1(τ ) exp{−βbw
20τ},
than (7) and (8) can be rewritten as
i∂
∂τp2j = − (q2j−1 + q2j+1) exp{i(ϕb − ϕa)} + βau2
0
(
p2j + p∗2j
)
,
6

i∂
∂τq2j+1 = − (p2j + p2j+2) exp{i(ϕa − ϕb)} + βbw
20
(
q2j+1 + q∗2j+1
)
.
Assume that the constant probability amplitudes (or the site population of
superlattice) are related by the following expression
βau20 = βbw
20 = λ1. (9)
In this case the phase difference ϕb−ϕa will be constant. We can put it to zero.
Thus, the system of linear equations for small perturbations takes the form
i∂p2j/∂τ = − (q2j−1 + q2j+1) + λ1
(
p2j + p∗2j
)
,
i∂q2j+1/∂τ = − (p2j + p2j+2) + λ1
(
q2j+1 + q∗2j+1
)
.(10)
Substitution of the following expressions
p2j = A exp(2ijkl) + B exp(−2ijkl)
q2j+1 = C exp{i(2j + 1)kl} + D exp{−i(2j + 1)kl}(11)
into the differential-difference equations (10) leads to the system of linear dif-
ferential equations
i∂A/∂τ = −2 cosklC + λ1 (A + B∗) , i∂A∗/∂τ = 2 cosklC∗ − λ1 (A∗ + B) ,
i∂B/∂τ = −2 cosklD + λ1 (A∗ + B) , i∂B∗/∂τ = 2 cosklD∗ − λ1 (A + B∗) ,
i∂C/∂τ = −2 cosklA + λ1 (D∗ + C) , i∂C∗/∂τ = 2 cosklA∗ − λ1 (C∗ + D) ,
i∂D/∂τ = −2 cosklB + λ1 (C∗ + D) , i∂D∗/∂τ = 2 cos klB∗ − λ1 (D∗ + C) .
It is convenient introduce new variable ξ = λ1τ and constant parameter µ =
2 coskl/λ1 = 2 coskl/βau20. From the foregoing equations one can obtain the
system of equations of second order
∂2A/∂ξ2 = −µ2A + 2µC, ∂2C/∂ξ2 = −µ2C + 2µA,
∂2B/∂ξ2 = −µ2B + 2µD, ∂2D/∂ξ2 = −µ2D + 2µB.(12)
Now, the characteristic equation for this system of equations (12) can be deter-
mined easily
Υ(σ) = Det
σ2 − µ2 2µ 0 0
2µ σ2 − µ2 0 0
0 0 σ2 − µ2 2µ
0 0 2µ σ2 − µ2
= 0 (13)
7

Stability of the solutions of the equations (5) is determined by the roots of this
equation, which can be written as
σ2± = µ2 ± 2|µ| = (|µ| ± 1)
2− 1.
Instability of the configuration of site population under consideration means
that imaginary part of the any root is not zero. But if σ2± is positive one, then
Imσ = 0. One should note that σ2+ ≥ 0 for any |µ|, whereas σ2
− ≥ 0 only at
|µ| ≥ 2. Hence, one can conclude that the configuration of site population is
stable under following condition
| cos kl| ≥ βau20 (14)
In terms of physical meaning variable this inequality is read as
Ubbw20 = Uaau2
0 ≤ |J0|| cos kl|. (15)
Else, the modulation instability takes place if
| cos kl| < βau20 (16)
The amplitude of small perturbations varies as exp(iσ±ξ) = exp(iσ±λ1τ ). As
it was indicated above exponential growing of the amplitude is related with
parameter σ−λ1. The imaginary part of σ−λ1 is the instability increment G(k),
i.e., :
G2(k) = 4| coskl|(
βau20 − | cos kl|
)
(17)
If we consider the first Brillouin zone −π/2 ≤ kl ≤ π/2, then the stability
region lies into interval − arccos(βau20) < kl < arccos(βau2
0). The instabil-
ity regions are determined by the inequalities −π/2 < kl < − arccos(βau20),
arccos(βau20) < kl < π/2. One can found that the instability increment is
zero at boundary points of these regions. Maximum of the increment placed at
points kml = ± arccos(βau20/2) and maximum magnitude of increment is equal
to Gm = G(km) = βau20. And at βau2
0 > 2 the increment, ones taken at point
kml = 0, has maximum value Gm = 2√
βau20 − 1.
8

Fig.2 show the dependence of the instability increment on wave number of
the weak perturbation and on nonlinearity parameter λ1 = βau20 = βbw
20 . This
parameter is defined by the population of the superlattice sites. As one can
see increasing of the λ1 results in decreasing of the stability region. At λ1 ≥ 1
the instability region occupies first Brillouin zone totally. All solutions (5) are
instable.
5 Numerical analysis
The aim of numerical simulation is study of the evolution of stationary con-
figuration of the site population found above in response to a weak harmonic
perturbation. Throughout this simulation relation βau20 = βbw
20 is assumed.
The equations (3) with δ = 0 were solved at the following initial (τ = 0) condi-
tions
a2j(0) = (−1)ju0 exp{−iλ1τ} + δa cos(kl(2j))
b2j+1(0) = (−1)jw0 exp{−iλ1τ} + δa cos(kl(2j + 1))
There we consider the periodic boundary condition: bn+1 = b1, an+2 = a2,
where n is total number of sites in superlattice. The superlattice length was
chosen to be multiple of the half-period of perturbation.
As example we represent results of the numerical simulation of the modu-
lational instability in superlattice containing 400 sites, where the initial values
for probability amplitudes are a(0) = 2, b(0) = 3, perturbation amplitude is
δa = 0.01 and perturbation wave number is k = 0.039/l (l is distance between
neighbor sites). If nonlinearity parameter λ1 = βau20 is over one the modula-
tional instability manifests itself causing an exponential growth of small per-
turbations of the harmonic wave (Fig.3) and (Fig.4). By using the initial value
probability amplitude of population for site of a -type, (i.e., a(0)) and the same
value at time τ , i.e. a(τ ), one can calculate the instability increment according
to formula Gnum = ln[(a(τ ) − a(0))/δa]/τ (the same we can done for site of b
-type). On the other hand, value of the increment G is determined by formula
(17). For βau20 = 2.5 (that corresponds to βa = 0.625 and βa = 0.277) we
9

obtained Gnum = 2 and G = 2.4. If the value βau20 is descried up to one under
condition that all parameters of system are fixed, instability persists. However,
the instability increment reduces progressively downstream. For βau20 < 1 the
regions of stability and instability appeared. Thus we can conclude that insta-
bility state of the site population is typical for high populations of the sites in
superlattice and for the case, where an on-site interaction between bosons dom-
inates over photo-induced transport. Otherwise one can observe stable state
picture: oscillation of an excess population near stable value, as shown in Fig.5.
Now we consider dynamics of the perturbations with different spatial fre-
quencies. The nonlinearity parameter βau20 , which put to be less than one,
is fixed, but wave number of the harmonic perturbation k (see expression for
initial conditions) will be varied. We can expect transition from stability to
instability at kl = arccos(βau20) because of the stability region lies into in-
terval − arccos(βau20) < kl < arccos(βau2
0). Put βau20 = 0.99 (βa = 0.2475,
βb = 0.11). Fig.6 and Fig.7 represent the time dependences of the site pop-
ulations (i.e., square of modulus of probability amplitudes) respectively for
k1l = 0.10244 (cos(k1l) = 0.9948) and k1l = 0.18124 (cos(k1l) = 0.9836).
6 Conclusion
In this work we have studied Bose-Einstein condensates in the one dimensional
optical superlattice with two kinds of microscopic potentials (sites of the lat-
tice). It was assumed that the deep of these potentials is enough the system to
be described by the Bose-Habbard model. Steady state distribution of the prob-
ability amplitudes of site population was found on base of the earlier derived
system of equations (3) [22], determining the dynamic of probability amplitude
of sites filling (or the probability to find the boson in this site) in superlattice.
Feature of this stationary state is the phase alternating, i.e., phases of prob-
ability amplitude of one-type sites change on π while going from one site to
another. The stability of such state of BEC for small perturbations depends on
the nonlinearity parameter βau20 and also on the frequency of modulation by
10
itself. When the value of βau20 exceeds one, the found distribution is unstable
for all wave numbers from Brillouin zone. However, when βau20 is less than
one the instability region in the Brillouin zone are determined by inequalities
−π/2 < kl < − arccos(βau20) and arccos(βau2
0) < kl < π/2. So, the bosons dis-
tribution is modulationaly instable for short wavelength perturbation, whereas
the long wavelength perturbations dump out. If the nonlinearity parameter (or
the average number of bosons in one site of superlattice) decreases, the instabil-
ity region reduces. The values of the instability increment found by analytically
were compared with the results of numerical simulation, and good agreement
between them was found in the field, where the linear analysis of stability is
valid.
The nonlinear regime of the modulational instability was studied by using
the numerical simulation. It was shown that the number of maxima in popula-
tion distribution on sites appears. It should be remarked that the preliminary
calculations demonstrate the development of chaotic behavior of the considered
system.
It is necessary to notice that in ordinary optical lattice the equations of mo-
tion for the probability amplitudes of the sites population in continual limit may
be transformed into the nonlinear Schrodinger equation having soliton solutions.
It describes approximately the spatial solitons in ordinary optical lattices. In
case under considering here the equations of motions (3) in continual limit result
in more complex equations, which are not like to be completely integrable. So it
is not necessary to expect formation of solitons chain as result of modulational
instability. Inelastic interaction between solitary spatial waves appearing there,
likely will leads to chaotic bosons distribution per sites.
Finally, we assume it not required an especially effort for generalisation of the
present results on the 2D cases, e.g., for the simple square or cubic superlattice.
11

Acknowledgment
We are grateful to S.O. Elyutin for valuable discussions. The work was sup-
ported by the Russian Basic Research Foundation (Grant No 06-02-16406).
References
[1] K. Berg-Sørensen, K. Mølmer, Phys.Rev. A 58, 1480 (1998)
[2] A. Kastberg, W.D. Phillips, S. L. Rolston, R. J. Spreeuw, P. S. Jessen,
Phys. Rev. Lett. 74, 1542 (1995).
[3] L. Guidoni, P. Verkerk, Phys. Rev. A 57, R1501 (1998).
[4] M.P.A. Fisher , P. B. Weichman, G. Grinstein, D. S.Fisher, Phys.Rev. B.
40, 546 (1989).
[5] A. Hemmerich, M. Weidemuller, T.Esslinger, C. Zimmermann, T. Hensch,
Phys.Rev.Lett. 75, 37 (1995).
[6] O. Morsch, M. Oberthaler, Rev.Mod.Phys. 78, 179 (2006).
[7] Dae-Il Choi, Qian Niu, Phys. Rev. Lett. 82, 2022 (1999).
[8] F.Kh. Abdullaev, B.B. Baizakov, S.A. Darmanyan, et al., Phys. Rev. A 64,
043606 (2001).
[9] L.P. Pitaevskii, Phys. Usp. 41, 569 (1998).
[10] F. Dalfovo, S. Giorgin, L.P. Pitaevskii, Rev. Mod. Phys. 71, 463 (1999).
[11] A.J. Leggett, Rev. Mod. Phys. 73, 307 (2001)
[12] D. Jaksch, C. Bruder, J.I. Cirac, C.W. Gardiner, P. Zoller, Phys.Rev.Lett.
81, 3108 (1998).
[13] F. Massel, V. Penna, Phys.Rev. A. 72, 053619 (2005).
[14] O. Fialko, Ch. Moseley, K. Ziegler, Phys.Rev. A 75, 053616 (2007)
12

[15] D. Jaksch, P. Zoller, Ann.Phys. 315, 52 (2005).
[16] A. Goerlitz, T. Kinoshita, T.W. Haensch, A. Hemmerich, Phys.Rev. A. 64,
011401(R) (2001).
[17] P. Buonsante, V. Penna, A. Vezzani, Phys.Rev. A. 70, 061603(R) (2004).
[18] Chou-Chun Huang, Wen-Chin Wu, Phys.Rev. A. 72, 065601 (2005).
[19] A.B. Bhattacherjee, J.Phys. B. 40, 143 (2007).
[20] D. Witthaut, E.M. Graefe, S. Wimberger, H.J.Korsch, Phys.Rev. A. 75,
013617 (2007).
[21] A.I. Maimistov, S.O. Elyutin, Izv.RAS, ser.phys. 68, 264 (2004).
[22] A.I. Maimistov, Optics and spectroscopy 97, 920 (2004).
[23] B.B.Baizakov, V.V.Konotop, M. Salerno, J.Phys. B. 35, 5105 (2002).
[24] V.V.Konotop, M. Salerno, Phys.Rev. A. 65, 021602(R) (2002).
[25] Guang-Ri Jin, Chul Koo Kim, Kyun Nahm, Phys.Rev. A. 72, 045601
(2005).
13
FIGURE CAPTIONS
Fig. 1. Two allowed configurations of the probability amplitudes distribution in
superlattice (a) ϕa0 = ϕb0 = 0, (b) ϕa0 = 0, ϕb0 = π..
Fig. 2. Instability increment G(k) versus k and λ1.
Fig. 3. Strong modulational instability. Evolution of the site populations in
superlattice for nonlinearity parameter βau20 = 2.5. .
Fig. 4. Evolution of the sites populations for nonlinearity parameter βau20 =
2.5. Solid line corresponds to site with maximum of value of initial perturba-
tion, dash line corresponds to site with maximum of negative value of initial
perturbation, dot lines correspond to sites with intermediate value of the initial
perturbations.
Fig. 5. Same as in Fig.4 but for nonlinearity parameter βau20 = 0.8. and the
dot lines correspond to sites with minimum value of initial perturbation.
Fig. 6. Dynamic of weak harmonic perturbation with k1l = 0.10244, of the
stability region..
Fig. 7. Same as in previous figure, but for harmonic perturbation with
k1l = 0.18124. One can see, that the distribution is instable now (Gnum = 0.08,
G = 0.14).
14

This figure "figur1.jpg" is available in "jpg" format from:
http://arxiv.org/ps/0712.1617v1
This figure "figur2.jpg" is available in "jpg" format from:
http://arxiv.org/ps/0712.1617v1

This figure "figur3.JPG" is available in "JPG" format from:
http://arxiv.org/ps/0712.1617v1

This figure "figur4.JPG" is available in "JPG" format from:
http://arxiv.org/ps/0712.1617v1

This figure "figur5.JPG" is available in "JPG" format from:
http://arxiv.org/ps/0712.1617v1

This figure "figur6.JPG" is available in "JPG" format from:
http://arxiv.org/ps/0712.1617v1

This figure "figur7.JPG" is available in "JPG" format from:
http://arxiv.org/ps/0712.1617v1
Copyright © 2022 FDOKUMEN