Simulation and Analysis of High-Pressure Condensate Field ...
13
56 Copyright © 2019 The Society of Chemical Engineers, Japan Journal of Chemical Engineering of Japan, Vol. 52, No. 1, pp. 56–68, 2019 Simulation and Analysis of High-Pressure Condensate Field Gas Propane Recovery Process Hong Jiang and Shijian Zhang School of Petroleum and Gas Engineering, Southwest Petroleum University, Chengdu, China, 610500, China Keywords: High Pressure Condensate Field Gas, Propane Recovery, HPA Process, Aspen HYSYS, Simulation, Energy Consumption Comparison The HPA (High Pressure Absorber) process was studied in detail using three sets of typical high-pressure condensate field gas. The CECUP (Comprehensive Energy Consumption for Unit Production) served as the basis for evaluating energy consumption, and by using ASPEN HYSYS software to simulate and analyze the three HPA processes, and process III was considered better. The method for obtaining the best HPA process under certain conditions was determined by analyzing the operating variables such as inlet split ratio, de-ethanizer pressure and absorber pressure. The adaptability of the HPA process was analyzed using three feed gases with different richness, compared with the DHX process, and obtaining the adaptability range of HPA process to feed gas pressure and richness. Introduction Natural gas liquid (NGL) recovery indicates recovering hydrocarbons that are heavier than CH 4 from natural gas to improve the economic benefits of the gas field. e NGL recovery process is mainly divided into an ethane recovery process and a propane recovery process. e ethane recov- ery process recovers the ethane component compared to the propane recovery process, and ethane is always used as the feed gas that is cracked to produce ethylene, so ethane recovery will bring better economic benefits to the gas field. However, if there is no available ethylene cracking plant near the gas field or if the ethane prices are low (McCann, 2016), it is better to choose a propane recovery process to recover LPG and heavier hydrocarbons from natural gas and leave ethane in the residue gas. is paper focuses on gas fields in the Tarim Basin of China. ese fields are located in the desert, lack supporting facilities and have no available ethylene cracker in the vicin- ity. ere is no market for ethane products, and a new eth- ylene fabrication facility will lead to high costs. erefore, in this paper, we focus on propane recovery for the feed gas from these gas fields. e feed gas pressure of these gas fields is high (mostly over 6 MPa, some even exceeding 10 MPa), the treatment capacity of these fields is large and the fields belong to a large-scale high-pressure condensate field gas field. At the same time, these fields serve as the main gas source of China’s West-to-East natural gas transmission project, which always needs high residue gas pressure (usu- ally higher than 6 MPa). erefore, it is important to select the proper propane recovery process to improve recovery and reduce energy consumption. Few journals have examined the propane recovery pro- cess. e reference (Fissore and Sokeipirim, 2011) used the gas subcooled process (GSP) process to study the effects of some major operating variables on propane recovery and energy consumption. Although there are many patents on the propane recovery process (the common propane recov- ery process is shown in Table 1 (Campbell and Wilkinson, 1979; Khan and Haliburton, 1985; Buck, 1986; Paradowski et al., 1987; Campbell et al., 1996, 1989; Foglietta et al., 2002; Cuellar et al., 2007, 2008). most of these processes can achieve high propane recoveries ( >99%) only under suitable conditions, and most of these sets of conditions are narrow. Once beyond the scope of adaptation, there may be a substantial declpine in propane recovery or higher energy consumption. e GSP process can be used to recover either ethane or propane, and it is suitable for lean gas and feed gas pressure over 4 MPa (Ortloff Engineers, 2010). Propane recovery in the GSP process is usually not high, at generally only approximately 90%. In view of the shortcomings of low propane recovery in the GSP process, the split-flow reflux (SFR) process uses a portion of the separated gas of the cryogenic separator to cool the overhead gas and produce a reflux. is method effectively recovers most of the propane in the de-ethanizer overhead gas. Propane recovery using the SFR process could reach 99%, but the SFR process is suitable for lean gas, and its residue gas compressor energy consumption is higher than that of GSP. e overhead re- cycle (OHR) process is the Ortloff Engineering Ltd.—pro- posed dual-column propane recovery process at an early time, adding an absorber and a de-ethanizer. Overhead gas is cooled as the absorber refluxes. e simple column over- head recycle (SCORE) process is considered an improve- Received on October 2, 2017; accepted on February 24, 2018 DOI: 10.1252/jcej.17we314 Correspondence concerning this article should be addressed to S. Zhang (E-mail address: [email protected]). Research Paper
-
Upload
khangminh22 -
Category
Documents
-
view
3 -
download
0
Transcript of Simulation and Analysis of High-Pressure Condensate Field ...

56 Journal of Chemical Engineering of Japan Copyright © 2019 The Society of Chemical Engineers, Japan
Journal of Chemical Engineering of Japan, Vol. 52, No. 1, pp. 56–68, 2019
Simulation and Analysis of High-Pressure Condensate Field Gas Propane Recovery Process
Hong Jiang and Shijian ZhangSchool of Petroleum and Gas Engineering, Southwest Petroleum University, Chengdu, China, 610500, China
Keywords: High Pressure Condensate Field Gas, Propane Recovery, HPA Process, Aspen HYSYS, Simulation, Energy Consumption Comparison
The HPA (High Pressure Absorber) process was studied in detail using three sets of typical high-pressure condensate �eld gas. The CECUP (Comprehensive Energy Consumption for Unit Production) served as the basis for evaluating energy consumption, and by using ASPEN HYSYS software to simulate and analyze the three HPA processes, and process III was considered better. The method for obtaining the best HPA process under certain conditions was determined by analyzing the operating variables such as inlet split ratio, de-ethanizer pressure and absorber pressure. The adaptability of the HPA process was analyzed using three feed gases with di�erent richness, compared with the DHX process, and obtaining the adaptability range of HPA process to feed gas pressure and richness.
Introduction
Natural gas liquid (NGL) recovery indicates recovering hydrocarbons that are heavier than CH4 from natural gas to improve the economic benefits of the gas field. The NGL recovery process is mainly divided into an ethane recovery process and a propane recovery process. The ethane recov-ery process recovers the ethane component compared to the propane recovery process, and ethane is always used as the feed gas that is cracked to produce ethylene, so ethane recovery will bring better economic benefits to the gas field. However, if there is no available ethylene cracking plant near the gas field or if the ethane prices are low (McCann, 2016), it is better to choose a propane recovery process to recover LPG and heavier hydrocarbons from natural gas and leave ethane in the residue gas.
This paper focuses on gas fields in the Tarim Basin of China. These fields are located in the desert, lack supporting facilities and have no available ethylene cracker in the vicin-ity. There is no market for ethane products, and a new eth-ylene fabrication facility will lead to high costs. Therefore, in this paper, we focus on propane recovery for the feed gas from these gas fields. The feed gas pressure of these gas fields is high (mostly over 6 MPa, some even exceeding 10 MPa), the treatment capacity of these fields is large and the fields belong to a large-scale high-pressure condensate field gas field. At the same time, these fields serve as the main gas source of China’s West-to-East natural gas transmission project, which always needs high residue gas pressure (usu-ally higher than 6 MPa). Therefore, it is important to select
the proper propane recovery process to improve recovery and reduce energy consumption.
Few journals have examined the propane recovery pro-cess. The reference (Fissore and Sokeipirim, 2011) used the gas subcooled process (GSP) process to study the effects of some major operating variables on propane recovery and energy consumption. Although there are many patents on the propane recovery process (the common propane recov-ery process is shown in Table 1 (Campbell and Wilkinson, 1979; Khan and Haliburton, 1985; Buck, 1986; Paradowski et al., 1987; Campbell et al., 1996, 1989; Foglietta et al., 2002; Cuellar et al., 2007, 2008). most of these processes can achieve high propane recoveries (>99%) only under suitable conditions, and most of these sets of conditions are narrow. Once beyond the scope of adaptation, there may be a substantial declpine in propane recovery or higher energy consumption.
The GSP process can be used to recover either ethane or propane, and it is suitable for lean gas and feed gas pressure over 4 MPa (Ortloff Engineers, 2010). Propane recovery in the GSP process is usually not high, at generally only approximately 90%. In view of the shortcomings of low propane recovery in the GSP process, the split-flow reflux (SFR) process uses a portion of the separated gas of the cryogenic separator to cool the overhead gas and produce a reflux. This method effectively recovers most of the propane in the de-ethanizer overhead gas. Propane recovery using the SFR process could reach 99%, but the SFR process is suitable for lean gas, and its residue gas compressor energy consumption is higher than that of GSP. The overhead re-cycle (OHR) process is the Ortloff Engineering Ltd.—pro-posed dual-column propane recovery process at an early time, adding an absorber and a de-ethanizer. Overhead gas is cooled as the absorber refluxes. The simple column over-head recycle (SCORE) process is considered an improve-
Received on October 2, 2017; accepted on February 24, 2018DOI: 10.1252/jcej.17we314Correspondence concerning this article should be addressed to S. Zhang (E-mail address: [email protected]).
Research Paper
Vol. 52 No. 1 2019 57
ment over the OHR process. The absorber and de-ethanizer are combined into a single column. Some of the gas flow is side-drawn from the upper portion of the column and cooled to enter the reflux accumulator. The liquid separated by the reflux accumulator serves as the reflux of the column. The OHR and SCORE propane recovery processes could recover over 99% of propane in the feed gas (Pierce et al., 2017), but SCORE has a wider range of adaptation (Ortloff Engineers, 2005a). A feed gas pressure less than 4 MPa or richer feed gas may require the addition of a refrigeration system. The recycle split vapor (RSV) commonly serves as the ethane recovery process. When only propane recovery is performed, the recovery is close to 100%. However, com-pared to other propane recovery processes, RSV needs to in-crease the height of the de-ethanizer, and increases the heat exchanger flow path. The residue gas compressor energy consumption will increase significantly. The RSV process is applicable to natural gas with a feed gas pressure over 4 MPa (Ortloff Engineers, 2005b). Similar to SCORE, the supplemental rectification with compression (SRC) process side-draws a gas flow from the de-ethanizer as reflux, but compared to SCORE, SRC reduces the reflux accumulator and a pump. For only propane recovery, the propane recov-ery of SRC is lower than that of SCORE, and the former can flexibly interconvert between ethane recovery and propane recovery processes according to the market price of ethane (Ortloff Engineers, 2014). The direct heat exchange (DHX) process was proposed by ESSO Ltd. in 1984 and is the most widely used propane recovery in China. DHX applies a dual-column structure. Propane recovery using DHX could rise to over 99%, and DHX has a strong adaptability for rich feed gas and various inlet conditions. Randall Gas Technolo-gies Ltd. also calls this process a traditional propane recov-ery process (Mowrey and Foglietta, 2002). The CRYOMAX dual-column propane recovery (CRYOMAX DCP) was de-veloped by Technip Ltd. in France, with a principle that is similar to the DHX process. They both absorb C3+ compo-sition in the absorber with the action of condensation and absorption. CRYOMAX DCP propane recovery could reach 98% (Price et al., 2012), but its structure is more complex. The high-pressure absorber (HPA) process was designed by Randall Gas Technologies Ltd. for high-pressure (typically >7 MPa) natural gas with a high residue gas pressure re-quirement, which can significantly decrease the residue gas
compressor energy consumption. The HPA process could also be used for ethane or propane recovery. The recovery achieved by the HPA process could easily reach 99% when only propane is recovered.
The HPA process has a wide adaptability range for feed gas of different richness and inlet conditions. This process is equivalent to an improvement of the DHX process to adapt to the high pressure of the feed gas and higher residue gas pressure requirements. With the HPA process, the ab-sorber pressure is decoupled from the de-ethanizer pressure through the de-ethanizer overhead compressor. The absorb-er pressure is higher than the de-ethanizer pressure, which significantly decreases the residue gas compressor energy consumption by increasing the absorber pressure as much as possible with sufficient feed gas pressure.
This paper focuses on the study of propane recovery with high-pressure condensate field gas, and the most appropri-ate process is the HPA process. In this paper, the concept of comprehensive energy consumption for unit product is introduced, and we use comprehensive energy consumption for unit product as the basis for evaluating the energy con-sumption of the process. There are three structural forms for the current HPA process, and a better process is determined by comparison in this paper. The method for determining the appropriate parameters of HPA under different condi-tions was obtained by adjusting the operating variables such as the inlet split ratio, de-ethanizer pressure and absorber pressure. The adaptability of the HPA process was analyzed under feed gas with different levels of richness, different feed gas pressures and different residue gas pressure conditions. The HPA process is compared with the DHX process to determine the dividing line between HPA and DHX under different conditions, obtaining an approximate adaptability range of the HPA process for propane recovery from high-pressure condensate field gas.
1. Basic Conditions
1.1 Feed gas composition and main simulation parameters
High-pressure condensate field gas is usually richer than gaseous field gas and leaner than oil field-associated gas, and propane recovery processes are often sensitive to the richness of the feed gas. The GPM (Price et al., 2004) value
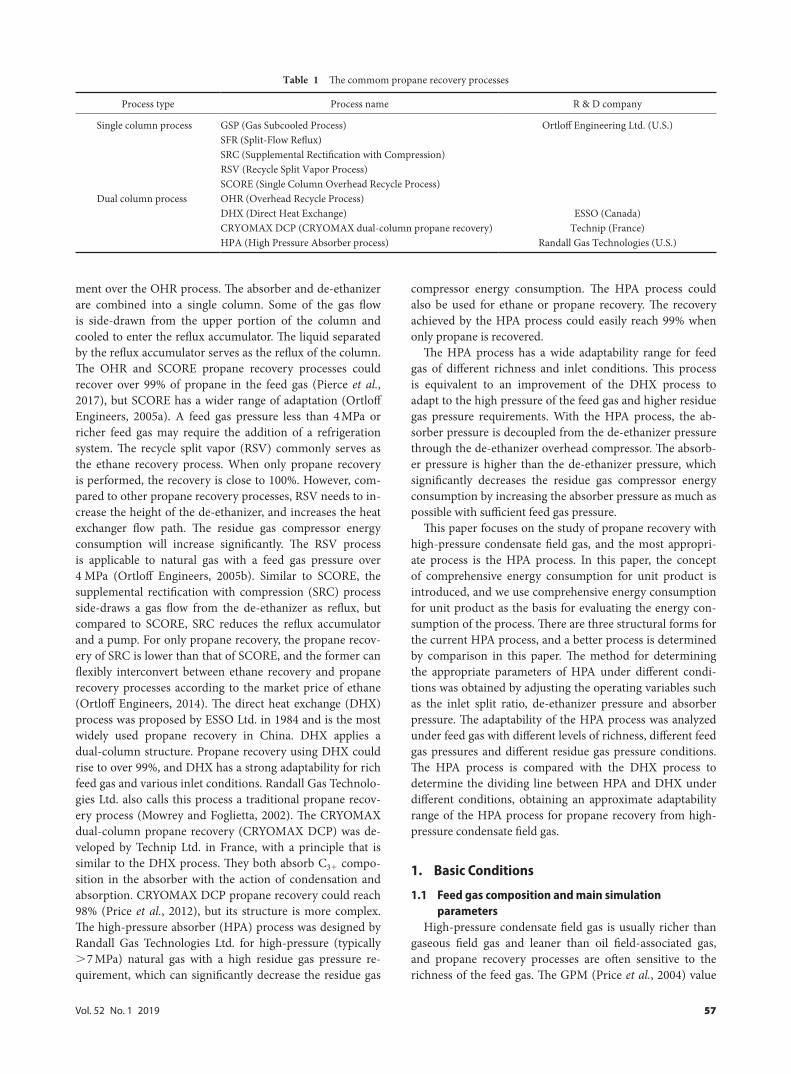
Table 1 The commom propane recovery processes
Process type Process name R & D company
Single column process GSP (Gas Subcooled Process) Ortloff Engineering Ltd. (U.S.)SFR (Split-Flow Reflux)SRC (Supplemental Rectification with Compression)RSV (Recycle Split Vapor Process)SCORE (Single Column Overhead Recycle Process)
Dual column process OHR (Overhead Recycle Process)DHX (Direct Heat Exchange) ESSO (Canada)CRYOMAX DCP (CRYOMAX dual-column propane recovery) Technip (France)HPA (High Pressure Absorber process) Randall Gas Technologies (U.S.)

58 Journal of Chemical Engineering of Japan
is used as the basis for evaluating the richness of the natural gas in this paper.
GPM is a method of expressing “richness” of a gas by use of “gallons per thousand standard cubic feet of gas” (GPM), i.e., could be characterized by the gallons per thousand
cubic feet of recoverable hydrocarbons in the gas. This method allows for comparisons of gas compositions singly, and it is obtained by multiplying the mole percent of each component by the factors shown in Table 2, which is based on the pressure of 101.325 kPa and temperature of 15.56°C (Foglietta, 2004).
The GPM value of condensate field gas is usually between 2–4. Without considering propane refrigeration, we selected three typical compositions of high-pressure condensate field gas (Table 3) in the Tarim area as feed gas to study the HPA process. The GPM value of Feed 1 is approximately 2.32, which constitutes lean condensate field gas. Feed 2 is richer than Feed 1, which is normal richness condensate field gas. Feed 3 belongs to a richer condensate field gas, the GPM of which is close to 3.44.
The commercially available software ASPEN HYSYS ver-sion 8.8 was used in this work to simulate and analyze the
Table 2 GPM factors
Component Factor
Ethane 0.267Propane 0.275i-Butane 0.327n-Butane 0.315i-Pentane 0.366n-Pentane 0.362Hexane 0.411Heptanes+ 0.461
Table 3 Typical composition of high-pressure condensate field gas
Components [mol%] Feed 1 (Lean) GPM Feed 2 (Normal) GPM Feed 3 (Rich) GPM
N2 0.1920 2.8409 0.9164CO2 0.4760 0.1043 0.3655C1 90.9021 86.2988 86.3094C2 5.8001 1.5486 7.5790 2.0236 7.2607 1.9386C3 1.5900 0.4373 1.7121 0.4708 3.1431 0.8643iC4 0.3130 0.1024 0.3146 0.1029 0.6556 0.2144nC4 0.3490 0.1100 0.3812 0.1201 0.6097 0.1920iC5 0.1040 0.0381 0.1744 0.0638 0.1285 0.0470nC5 0.0833 0.0302 0.1501 0.0543 0.0837 0.0303C6 0.0650 0.02672 0.1409 0.0579 0.1163 0.04778C7 0.0680 0.1667 0.2220C8 0.0473 0.0833 0.1292C9 0.0076 0.0301 0.0391C10 0.0026 0.0137 0.0128C11 0.0000 0.0313 0.0052 0.0768 0.0081 0.1024C12 0.0000 0.0028 0.0000C13 0.0000 0.0011 0.0000C14 0.0000 0.0005 0.0000C15 0.0000 0.0003 0.0000
Total 100 2.3246 100 2.9702 100 3.4368
Table 4 Main invariant parameters in process simulation
Feed gas flow rate (104 m3/d, 20°C, 101.325 kPa) 1500Feed gas temperature [°C] 30Heat exchanger min approach temperature [°C] 4Absorber pressure drop [kPa] 20The number absorber theoretical trays 8De-ethanizer pressure drop [kPa] 30The number of de-ethanizer theoretical trays 24The second feed location of the de-ethanizer 7The third feed location of the de-ethanizer 15Turbine expander adiabatic efficiency [%] 85Compressor adiabatic efficiency [%] 75De-ethanizer overhead gas split ratio TEE-102 (heat exchange flow/total gas flow, mol·h−1/ mol·h−1) 0.6Feed gas maximum simulated pressure [MPa] 9De-ethanizer product specification (ethane component fraction in reboiler liquid) 0.02Property fluid package Peng RobinsonPropane recovery requirement [%] ≥99

Vol. 52 No. 1 2019 59
typical high-pressure condensate field gas. To ensure that the HPA process is comparable in parameter analysis, it is necessary to control some of the parameters. Some main invariant parameters in process simulation are shown in Table 4. In this paper, the column pressure refers to the column bottom pressure, inlet split ratio (TEE-101) refers to the molar flow ratio of stream 3 to stream 1, and pro-pane recovery is the ratio of propane mass flow in the C3+ condensate to propane mass flow in stream 1. In this paper, controlling the propane recovery at 99% is the basis for pro-cess simulation and energy consumption comparison, when the process can make propane recovery over 99%, adjust-ing the inlet split ratio to maintain a propane recovery of 99%, and regard it as a process of meeting the requirements. When propane recovery is below 99% because of lower feed gas pressure or richer feed gas, we consider that the process with maximum recovery to be the best process and use it for comparisons with other processes.
1.2 Energy consumption comparison methodBecause the compressors, pumps, reboilers and other
facilities use different types of fuel and because the cost of these fuels is different, the power cannot be used to com-pare the energy consumption of different facilities. In this paper, the energy consumption of the main unit facilities in the process is quantitatively evaluated by the method of Comprehensive Energy Consumption for Unit Produc-tion (CECUP) according to the Chinese National Standard of General principle for calculation of the comprehensive energy consumption (GB/T2589-2008, 2008). The energy consumption of the various facilities is multiplied by the corresponding conversion factor into equivalent energy con-sumption, and the equivalent energy consumption values are added together to obtain the comprehensive energy con-sumption of the whole process. The comprehensive energy consumption calculation method is shown in Eq. (1). The comprehensive energy consumption of the whole process divided by the total product flow is CECUP, and the calcula-tion method is shown in Eq. (2).
1
( )n
i ii
E e p=
= × (1)
Here, E is the comprehensive energy consumption, n is the number of fuel types, ei is the consumption of fuel i, and pi is the conversion factor of fuel i, which is the equivalent value of energy.
gEe G= (2)
Here, eg is the Comprehensive Energy Consumption for Unit Production (CECUP) and G is the total product flow.
The C3+ condensate fractionation process after the de-ethanizer is not considered in this paper, and the C3+ con-densate at the bottom of the de-ethanizer is assumed to be the only product, so G is the mass flow of the C3+ conden-sate. The energy consumption of the residue gas compressor, de-ethanizer overhead compressor and de-ethanizer reboiler
account for the vast majority of energy consumption in the HPA process. Therefore, ignore the energy consumption of pumps, air coolers and other facilities. We are concerned mainly with the CECUP into which all of the compressors and reboiler are converted. If all compressors are powered by electricity, the reboiler is powered by heat transfer oil (the heat transfer oil is heated by fuel gas). The method of con-verting electricity and heat transfer oil into comprehensive energy consumption follows Eqs. (3) and (4). The national standard specifies that the units of energy converted to pri-mary energy should be expressed in terms of standard coal equivalent when calculating the comprehensive energy con-sumption. The low heating value equivalent of 29.3 kJ is 1 kg of standard coal equivalent [kgce].
1 1 1 24H Q C= × × (3)
Here, H1 is the value of electricity converted to comprehensive energy consumption(104 MJ/d), Q1 is electric power (kW), and C1 is the electric power conversion factor (11.84 MJ/kW·h).
2 2 2 3/ 3600 24H Q C C= × × × (4)
Here, H2 is the value of heat transfer oil converted to com-prehensive energy consumption [104 MJ/d], Q2 is reboiler heat transfer power [kW], C2 is the heat transfer coefficient of the heat transfer oil (usually takes 1.1), and C3 is the heat transfer efficiency of heat transfer oil (usually takes 0.85).
2. Process Simulation and Analysis
2.1 HPA process description and comparisonThe currently known HPA process has three heat ex-
change forms. HPA process I (Mowrey and Foglietta, 2002) is shown in Figure 1, process II (CB&I, 2015) is shown in Figure 2 and process III (Foglietta et al., 2002) is shown in Figure 3. Feed gas in process I is pre-cooled by resi-due gas, and the liquid hydrocarbons separated from the cryogenic separator then flow into the cryogenic separator (V-101). The gas separated from the cryogenic separator flows into the absorber (T-101) bottom after deep cooling by the turboexpander (K-102). The separated liquid from the cryogenic separator is heated by feed gas and enters the lower-middle part of the de-ethanizer (T-102). De-ethaniz-er overhead gas is cooled by absorber bottom condensate and enters the de-ethanizer overhead reflux accumulator (V-102). The liquid separated from the accumulator serves as the reflux of the de-ethanizer. The gas separated from the accumulator is pressurized by the de-ethanizer overhead compressor (K-101) and deeply cooled by the residue gas, and then flows into the absorber top. Residue gas is pressur-ized by the turboexpander compression end (K-103) after double heat exchange with the absorber reflux and feed gas. To meet the residue gas pressure requirements, residue gas needs to be pressurized by the residue recompressor (K-104) and then be cooled by the air cooler (AC-101). In process I, the absorber bottom condensate exchanges heat with the de-ethanizer overhead gas, and then flows into the de-ethanizer

60 Journal of Chemical Engineering of Japan
at a lower temperature (approximately −30°C). At the same time, because the feed gas does not undergo pre-cooling enough, the propane recovery is low. The absorber bottom condensate with a low temperature and large flow is used to pre-cool the feed gas, which makes up for the shortcomings in that the feed gas is not sufficiently pre-cooled in process I. The de-ethanizer overhead gas is cooled by the absorber overhead residue gas in process II. Process III combines the features of processes I and II, with the absorber bottom con-densate cooled by de-ethanizer overhead gas and then pre-cooled feed gas, and the rest is the same as process I. Since the fractionation units for C3+ condensate after the de-etha-
nizer are the same, we do not consider it in this paper.Feed 1 was used to simulate the three processes under a
de-ethanizer pressure of 3.8 MPa and absorber pressure of 4 MPa. Table 5 and Figure 4 show that the heat exchange structure of process I is unreasonable. Feed gas is pre-cooled only by residue gas, and liquid hydrocarbons are separated from the cryogenic separator, which results in insufficient feed gas pre-cooling and a higher cryogenic separator tem-perature. Absorber bottom condensate flows into the de-ethanizer at a lower temperature, which results in a higher reboiler power. Process I shows a low propane recovery over a wide range. Only if the feed gas pressure reaches 9 MPa
Fig. 1 HPA process I flow diagram
Fig. 2 HPA process II flow diagram
Fig. 3 HPA process III flow diagram

Vol. 52 No. 1 2019 61
can the propane recovery reach 99%. Process I has a high demand for feed gas pressure. Process I could be considered the worst of the three processes in the heat exchange struc-ture. Propane recovery for processes II and III can maintain 99% in the feed gas pressure range of 7–9 MPa. The main unit (compressors and reboiler) CECUP of processes II and III is very close when the feed gas pressure is 7 MPa, but with an increase in feed gas pressure, the energy saving advantages of process III become increasingly obvious. The characteristic of process II is that a large amount of cold is used for feed gas pre-cooling, which sometimes results in a separator temperature below the critical temperature (Figure 5). There is only a gas phase in the cryogenic sepa-rator, and no condensate liquid phase is produced, which may cause a conventional cryogenic separator to operate in an unstable condition. To maintain a propane recovery of 99%, the inlet split ratio of process II is smaller than the process III, leading to insufficient utilization of the absorber bottom condensate cold. The absorber bottom condensate exchanges heat with the feed gas and flows into the de-eth-anizer at a low temperature, which causes the high energy
consumption of the de-ethanizer reboiler. We find that with the increase of the feed gas pressure, the temperature of the absorber bottom condensate flowing into the de-ethanizer is sharply reduced, and the reboiler power of the de-ethanizer increases significantly. Therefore, process II is not suitable
Table 5 Comparison of the main parameters of three different HPA processes
Process typesFeed gas pressure [MPa]
Cryogenic separator
temperature [°C]
Temperature of absorber bottom
condensate flowing into de-ethanizer [°C]
Inlet split ratio
(TEE-101)
De-ethanizer reboiler power
[kW]
Temperature of residue gas after heat exchange with feed
gas [°C]
Residue recompressor
power [kW]
Process I 7 −38.33 −29.55 0.1 7038 26 61997.5 −35.79 −28.78 0.12 8170 26 58248 −33.5 −28.36 0.16 9248 26 54858.5 −31.37 −28.17 0.22 10291.95 26 51729 −29.09 −27.87 0.26 11253.9 25.72 4846
Process II 7 −42.35 −7.857 0.22 6346 25.26 63997.5 −43.23 −19.22 0.227 7189 25.44 63158 −43.85 −23.27 0.26 7809 25.01 62558.5 −42.29 −30.36 0.25 8922 25.58 60889 −42.54 −34.44 0.25 10137 26 5791
Process III 7 −42.18 −1.28 0.242 6184 24.64 63627.5 −39.21 15.78 0.348 5903 19.84 57848 −35.97 21.07 0.419 5893 15.81 52288.5 −32.78 23.69 0.484 5875 11.78 46749 −30.35 25.02 0.534 5866 8.558 4214
Fig. 4 Effect of feed gas pressure on propane recovery and CECUP in different HPA processes
Fig. 5 Phase envelope of Feed 1

62 Journal of Chemical Engineering of Japan
for high pressure natural gas.While process III overcomes the shortcomings of the ex-
cessive pre-cooling of the feed gas in process II, the temper-ature level of the absorber bottom condensate rises after ex-changing heat with the de-ethanizer overhead gas, so more feed gas can be split to exchange heat with absorber bottom condensate, which will not cause the cryogenic separator temperature to be too low. The temperature of the absorber bottom condensate flowing into the de-ethanizer is sig-nificantly increased after double heat exchange, and the de-ethanizer reboiler energy consumption is slightly reduced. As the feed gas pressure increases, the inlet split ratio can be greatly increased. The temperature of the residue gas will become lower after the heat exchange with feed gas, which significantly reduces the residue recompressor power. This is the main reason for the significant reduction in CECUP with feed gas pressure increase. Taking the feed gas pressure at 9 MPa as an example, process III saves 28.59 kgce/t and 35.99 kgce/t compared to processes I and II in CECUP. To maintain the propane recovery of 99%, equivalent to 886.56 t daily production of C3+ condensate, process III can save energy 742659.8 MJ/d and 934883.8 MJ/d. The energy sav-ing effect is considerable. Therefore, from both the propane recovery and energy consumption points of view, process III is the most efficient and versatile process. The subsequent
analysis of the operating variables and adaptability are car-ried out based on the process III.
2.2 Operating variable analysis of HPA ProcessThe analysis of HPA process operating variables mainly
includes the study of the inlet splitting ratio, de-ethanizer pressure and absorber pressure. Since these parameters are the main influencing parameters for propane recovery and energy consumption throughout the HPA process, the best process can be determined under the given conditions by adjusting these parameters. We use Feed 1 to analyze these three parameters for this section.
2.2.1 Inlet splitting ratio analysis The HPA process has a high propane recovery for high-pressure condensate field gas. It is easy to achieve a propane recovery of 99% or more. Usually, the energy consumption of the HPA pro-cess increases rapidly when the propane recovery is higher than a certain value, and the change in propane recovery is quite small at that time, so blindly improving the recovery is clearly uneconomical. Under the condition that the ab-sorber pressure is determined, the inlet feed gas split ratio is the most influential parameter for the energy consumption of the main unit. In this paper, when the propane recovery reaches 99%, the corresponding state is called the “high ef-ficiency point” and serves as the basis for determining the appropriate inlet split ratio. As shown in Figure 6, point H could be considered the “high efficiency point” of the process under a feed gas pressure of 8 MPa, de-ethanizer pressure of 3.8 MPa, absorber pressure of 4 MPa, and an suitable inlet split ratio of 0.42. Now, the recovery is high, but the energy consumption is in a low state. Upon continu-ing to increase the inlet split ratio, the propane recovery will decline rapidly. However, if the inlet split ratio is less than 0.42, the propane recovery will be slightly higher than 99%, but the energy consumption is too high, which is not economical. Compared to the state of inlet split ratio of 0.25, with a propane recovery of 99.85%, the CECUP of the “high efficiency point” state is decreased by 19.35%, which is a remarkable energy-saving effect. Therefore, it is necessary to optimize the inlet split ratio to find the “high efficiency point” in each process study. Figure 7 shows the trend of the
Fig. 6 “High efficiency point” selection diagram
Fig. 7 Effect of feed gas pressure on optimal inlet splitting ratio and CECUP Fig. 8 Pressure–enthalpy relationship for de-ethanizer bottom liquid

Vol. 52 No. 1 2019 63
optimal inlet splitting ratio and CECUP as feed gas pressure increases. The effect of the inlet feed gas split ratio on energy consumption is that when the cold quantity of the system increases, the flow of stream 3 should be increased as much as possible. The increase of the flow into the de-ethanizer temperature of the absorber bottom condensate after ex-changing heat with the de-ethanizer overhead gas helps re-duce the de-ethanizer reboiler power. Therefore, the residue gas temperature will be lower after exchanging heat with the feed gas because stream 2 flow is reduced.
2.2.2 De-ethanizer pressure analysis With the HPA process, absorber pressure is decoupled from the de-etha-nizer pressure by a de-ethanizer overhead compressor. The
lower the de-ethanizer pressure is, the lower both the reboil-er power and the relative increase in de-ethanizer overhead compressor power are. To maintain the separation efficiency and stability of the de-ethanizer, the de-ethanizer pressure has an upper limit. A pressure–enthalpy diagram of the de-ethanizer bottom liquid is shown in Figure 8. To ensure that there is a sufficient pressure drop between the de-ethanizer pressure and the pressure at critical conditions (the de-etha-nizer is always unconverged when its pressure is over 4 MPa during process simulations), the maximum pressure of the simulated de-ethanizer is controlled at 3.8 MPa in this paper. The de-ethanizer pressure was changed to study its effect on the energy consumption of the HPA process. Take an HPA process with feed gas at 8 MPa and absorber pressure 4 MPa as an example. As shown in Figure 9, with the increase in the de-ethanizer pressure, the power of the reboiler increas-es, but the residue recompressor power and CECUP change weakly. Therefore, we consider that the increased reboiler power and the reduced power of the de-ethanizer overhead compressor are approximately equivalent to the CECUP as the de-ethanizer pressure rises. The same rule is followed for other feed gas pressures above 7 MPa. To reduce the cost of manufacturing the de-ethanizer overhead compressor, it is advisable to increase the de-ethanizer pressure, so 3.8 MPa is the optimum de-ethanizer pressure for the HPA process.
2.2.3 Absorber pressure analysis The effect of the ab-sorber pressure on the energy consumption of the residue recompressor in the HPA process is significant, so the ab-sorber pressure should be increased as much as possible when the expansion refrigeration is cold enough. However, an excessive increase in absorber pressure will reduce the turbine expansion cooling effect, which affects propane re-covery. Under different absorber pressures, adjusting the inlet split ratio to achieve a “high efficiency point” (propane recovery=99%), simulation produces the CECUP–absorber pressure relationship curve in Figure 10. When the feed gas pressure reaches 7 MPa, the absorber pressure up to 4 MPa could cause the propane recovery to reach 99%, and the absorber pressure could be increased with feed gas pres-sure. Using a feed gas pressure of 8 MPa as an example,
Fig. 9 Effect of inlet split ratio and de-ethanizer pressure on recovery and energy consumption
Fig. 10 The relationship between CECUP and absorber pressure in the HPA proces

64 Journal of Chemical Engineering of Japan
the absorber pressure increases from 4 to 4.4 MPa, and the CECUP of the process can be reduced by 12.74%. Upon continuing to increase the absorber pressure, due to a lack of cooling, the propane recovery is unable to meet the require-ments. When the feed gas pressure increased to 9 MPa, the absorber pressure can reach 4.8 MPa, and the CECUP of the HPA process is further reduced. Compared to the absorber pressure of 4 MPa, the CECUP decreases by 19.16%. The effect of optimizing the absorber pressure on the energy consumption of the entire propane recovery facility is sig-nificant.
Under the condition of feed gas pressure at 9 MPa, ab-sorber pressure is at 4.8 MPa, and de-ethanizer pressure is at 3.8 MPa. The cryogenic separator is in a supercritical condition. Now, the temperature of the cryogenic separator is −40.24°C. Below the critical temperature of −39.43°C, there is no liquid separated from the cryogenic separa-tor. Therefore, the HPA process needs to be modified for this condition. As shown in Figure 11, the new process removes the heat exchanger used for the cryogenic separa-tor separating liquid and feed gas. The cryogenic separator can be used with a special vortex-type separator for the Aux Sable NGL recovery plant. The separator is smaller than the conventional cryogenic separator, and when the cryogenic separator is in the supercritical condition, the separator acts
primarily as a dryer (Cairo et al., 2002).
2.3 HPA process adaptability analysisSince the HPA process is modified from the traditional
DHX process to adapt to high-pressure natural gas, the adaptability analysis of the HPA process is to determine the dividing line between the HPA and DHX processes. HPA is suitable for feed gases above 7 MPa (Mowrey and Foglietta, 2002), but with a change in the feed gas richness and residue gas pressure requirements, the dividing line is not accurate. Therefore, it is necessary to analyze the adaptability of HPA under various conditions, such as feed gas richness, feed gas pressure and residue gas pressure requirements.
Compared to the HPA process, the DHX process removes the de-ethanizer over the compressor and adds a cryo-genic pump. A flow diagram of the DHX process is shown in Figure 12. The DHX process has a wide adaptability for feed gas with pressures higher than 4 MPa, which can produce a propane recovery of 99% or more for feed gas with different richness. However, due to the upper limit of the de-ethanizer pressure (3.8 MPa, described above), the maximum absorber pressure can only reach approximately 3.5 MPa, which results in the residue recompressor power in the DHX process being high. The most suitable HPA de-eth-anizer pressure is 3.8 MPa, as described above, so the HPA
Fig. 11 HPA process flow diagram under supercritical conditions
Fig. 12 DHX process flow diagram

Vol. 52 No. 1 2019 65
process absorber pressure should not be less than 4 MPa. The HPA process will have no advantage over the DHX pro-cess if the de-ethanizer and absorber pressure are reduced. We use three feed gases with different richness levels, as shown in Table 3, to study the general adaptability range of the HPA process under different conditions.
(1) Analysis of HPA adaptability to Feed 1Feed 1 is simulated through the DHX and HPA processes,
maintaining the absorber pressure at 3.5 MPa and a propane recovery of 99% (high efficiency point) in the DHX process simulation. The relationship between the feed gas pressure and booster pressure of the turbine expander forms curve I, as shown in Figure 13. The HPA process was simulated ac-cording to the adjusting principle in Section 2.2, and the ab-sorber pressure at different feed gas pressures was adjusted to maintain a recovery rate of 99%. The relationship between the feed gas pressure and booster pressure of the turbine expander in the HPA process forms curve II, as shown in Figure 13. The adaptability range of the HPA process can be divided into three parts, as shown in Figure 13, by curve I and curve II.
When the feed gas pressure and the corresponding resi-due gas pressure requirements are within the range of area ①, the DHX process is used preferentially. Compared to the DHX process, the HPA process in this range increases the absorption tower pressure with no advantage, and the cost is higher, so area ① is not suitable for the HPA pro-cess. When the feed gas pressure is less than 6.2 MPa and the residue gas pressure requirement is less than 4 MPa, the DHX process can further reduce the energy consumption by reducing the absorber pressure and the de-ethanizer pres-sure. In the range of area ②, due to the high pressure of the HPA absorber, the HPA process can have a higher booster pressure of the turbine expander than the DHX process without adding a residue recompressor. For example, if the residue gas pressure requirement and feed gas pressure meet the curve II relationship, the DHX process needs to add a residue recompressor. Because of the large flow of residue gas, the residue recompressor power in DHX is much higher than the de-ethanizer overhead compressor power in the HPA process (Figure 14). Under the same processing scale
conditions, the difference in other equipment costs is small, and the low-power HPA de-ethanizer overhead compres-sor has a certain cost advantage. Figure 14 shows that the increases in the residue recompressor power consumption in the DHX process lead to a substantial increase in the total energy consumption of the entire facility. The CECUP of the HPA process is only approximately 60% of the DHX process. Therefore, regardless of the equipment investment or en-ergy consumption, in the area ②, the HPA process has more advantages compared to the DHX process. When the feed gas pressure and the corresponding residue gas pressure requirements are within the range of area ③, both the DHX and HPA processes need to add a residue recompressor. In the range of area ③, the HPA process has more energy-saving advantages. The highest CECUP ratio (HPA/DHX) is 91.53%, and the lowest is 67.97% (Figure 15). In the range of area ③, with a lower residue gas pressure requirement and higher feed gas pressure, the HPA process will have a more obvious energy-saving effect compared to the DHX process. For Feed 1, the HPA process can achieve the “high efficiency point” when the feed gas pressure is higher than 7 MPa. Therefore, when the GPM value of the feed gas is less
Fig. 13 HPA and DHX process adaptability dividing line for Feed 1
Fig. 14 Comparison of HPA and DHX process energy consumption under curve II
Fig. 15 CECUP comparison of Feed 1 under different feed gas pres-sure and residue gas pressure

66 Journal of Chemical Engineering of Japan
than 2.32, the minimum efficient feed gas pressure can be lower than 7 MPa.
(2) Analysis of HPA adaptability to Feed 2The HPA adaptability approach for Feed 2 is the same as
for Feed 1. However, because Feed 2 is richer, the expansion cooling effect is made worse. When the feed gas pressure reaches 6.6 MPa, the DHX process can cause the propane recovery to reach the “high efficiency point” (Figure 16). When the HPA absorber pressure is 4 MPa, if propane re-covery needs to reach 99%, the feed gas pressure needs to be higher than 7.5 MPa. The richer the feed gas is, the narrower the high efficiency range is. The best absorber pressure of HPA for Feed 1 and Feed 2 at different feed gas pressures is shown in Figure 17. Because the feed gas is richer, under the same feed gas pressure conditions, the best absorber pres-sure under Feed 2 is slightly lower than Feed 1. When the feed gas pressure reaches 9 MPa, the best absorber pressure could reach the same value. Figure 18 depicts the energy saving effect (CECUP percent ratio of HPA and DHX) of the HPA process compared to the DHX process at different feed gas pressures and residue gas pressures. Compared to Feed 1, the CECUP ratio of Feed 1 changes more intensely with feed gas pressure. When the feed gas pressure is below 8.5 MPa, the energy-saving effect of Feed 1 is better than
Feed 2 that uses the HPA process relative to using the DHX process, but when the pressure exceeds 8.5 MPa, the energy-saving effect of Feed 2 will be better than that of Feed 1. If the feed gas pressure is not particularly high (such as below 8.5 MPa in Figure 18) and the HPA process is in the high efficiency range, the leaner gas using the HPA process will have a better energy-saving effect than will the richer gas.
Fig. 16 HPA and DHX process adaptability dividing line for Feed 2
Fig. 17 Comparison of the best absorber pressure of the HPA process for different feed gases
Fig. 18 Comparison of CECUP with different feed gas pressure and residue gas pressure for Feed 2
Fig. 19 CECUP comparison of Feed 1 and Feed 2
Fig. 20 Propane recovery of DHX and HPA processes at different feed gas pressures

Vol. 52 No. 1 2019 67
However, if the feed gas pressure continues to increase, the cold is more adequate, and the energy-saving effect of the richer gas will be further improved or be even better than the leaner gas. Figure 19 shows that under the same condi-tions, the higher the feed gas pressure is, the richer the feed gas is. Further, the HPA process will have a lower CECUP. With the increase of external input pressure, the energy con-sumption per unit of energy consumption of the main unit will be larger than the unit. With an increase in residue gas pressure, the CECUP difference between richer and leaner gas will increase.
(3) Analysis of HPA adaptability to Feed 3Figure 20 shows that Feed 3 is so rich, that the HPA pro-
cess propane recovery could reach 99% only with a feed gas pressure of not less than 9 MPa, and the recovery is less than 90% when the feed gas pressure is less than 8 MPa, show-ing that the HPA process has a very narrow range for richer gases such as Feed 3. For Feed 3, when the feed gas pres-sure is higher than 7.9 MPa, the DHX process can cause the propane recovery to reach 99%. Therefore, using a feed gas pressure of 7 MPa as the dividing line for the HPA and DHX process is not very accurate. When the feed gas pressure is less than 7.9 MPa, to ensure propane recovery, the DHX process needs to reduce the absorber and de-ethanizer pres-sures. When the feed gas pressure is below 9 MPa, propane recovery is rapidly decreasing, so the HPA process is not necessarily suitable for richer gas (such as richer than Feed 3) without propane cooling.
Conclusion
In this paper, the HPA process is used to simulate pro-pane recovery for high-pressure condensate field gas. Three HPA processes are compared and analyzed. The process III is the better process of the three processes under high-pressure conditions because of more efficient utilization of cold, a more reasonable heat exchange structure, and higher propane recovery and the lowest energy consumption.
Based on the process III, the method for determining the best HPA process under certain conditions was determined by analyzing the inlet split ratio, de-ethanizer pressure and absorber pressure. The appopriate inlet split ratio was deter-mined by the “high efficiency point”, the best de-ethanizer pressure being 3.8 MPa, and the highest absorber pressure under “high efficiency point” conditions being considered a reasonable column pressure. At the same time, for super-critical conditions, an improvement of the HPA process was proposed to improve HPA process adaptability under differ-ent conditions.
According to the best process determination method pro-posed in the analysis of the operating variables, the adapt-ability range of the HPA process was analyzed using three feed gases with different richness, and the HPA process was compared with the DHX process to determine the adapt-ability range of the HPA process. It is better to use the DHX process in area ① through the relationship curve between feed gas pressure and the booster pressure of the turbine
expander. In the range of areas ② and ③, the energy con-sumption saving advantage of the HPA process is obvious, and it is better to adopt the HPA process. As the feed gases become richer, the HPA efficient range becomes narrow, but the CECUP value decreases. With an increase in the feed gas pressure, the CECUP of the HPA process decreases sig-nificantly, the difference between the energy consumption of rich and lean gas increases, and the richer gas becomes more sensitive to feed gas pressure than does the leaner gas. When the feed gas is rich to a certain degree, the propane recovery will be significantly reduced without a propane refrigeration system. At that time, it is unreasonable to reduce the re-covery requirements to select the HPA process. If the GPM value of the feed gas is less than 2.32, the HPA process could be used for feed gas with an inlet pressure below 7 MPa. If the GPM value of the feed gas is greater than 3.44, the HPA process is not suitable for a feed gas pressure over 9 MPa.
Acknowledgement
The author would like to thank the financial support of professors Hong Jiang and Jiaqiang Jing.
Literature Cited
Buck, L. L.; “Separating Hydrocarbon Gases,” US Patent No.4617039 (1986)
Cairo, C., H. M. Hudson and M. C. Pierce; Unique Design Challenges in the Aux Sable NGL Recovery Plant, the 81st Annual Conven-tion of the Gas Processors Association, Dallas, U.S.A. (2002)
Campbell, R. E., J. D. Wilkinson and H. M. Hudson; “Hydrocarbon Gas Processing,” US Patent No.5568737 (1996)
Campbell, R. E., J. D. Wilkinson and H. M. Hudson; “Hydrocarbon Gas Processing,” US Patent No.4854955 (1989)
Campbell, R. E. and J. D. Wilkinson; “Hydrocarbon Gas Processing,” US Patent No.4157904 (1979)
CB&I, Ltd.; “CB&I’s Proprietary Randall Gas HPA™,” http://www.cbi.com/What-We-Do/Technology/Gas-Processing/Gas-Processing-Technologies/High-Ethane-Extraction-LPG-Recovery/HPA-SM, (2015)
Cuellar, K. T., T. L. Martinez, J. D. Wilkinson, J. T. Lynch and H. M. Hudson; “Hydrocarbon Gas Processing,” US Patent No.0078205 (2008)
Cuellar, K. T., J. D. Wilkinson, J. T. Lynch and H. M. Hudson; “Hydro-carbon Gas Processing,” US Patent No.7191617 (2007)
Fissore, D. and D. Sokeipirim; “Simulation and Energy Consumption Analysis of a Propane Plus Recovery Plant from Natural Gas,” Fuel Process. Technol., 92, 656–662 (2011)
Foglietta, J. H., H. Haddad, E. R. Mowrey, S. N. Patel and A. Sangave; “Cryogenic Process Utilizing High Pressure Absorber Column,” US Patent No.0157538 (2002)
Foglietta, J. H. ed.; “New Technology Aids in Efficient, High Recovery of Liquids from Rich Natural Gas Streams,” Lummus Process Tech-nology–Randall Gas Technologies, A Division of ABB Lummus Global Inc. Houston, U.S.A. (2004).
GB/T2589-2008; “General Principles for Calculation of Comprehensive Energy Consumption,” General Administration of Quality Su-pervision, Inspection and Quarantine of the People’s Republic of China (AQSIQ) (2008)
Khan, S. A. and J. Haliburton; “Process for LPG Recovery,” US Patent No.4507133 (1985)

68 Journal of Chemical Engineering of Japan
McCann, J. P.; Design and Operating Experience for Anadarko’s Lan-caster Facility, the 95th Annual Convention of the Gas Processors Association, New Orleans, U.S.A. (2016)
Mowrey, E. R. and J. H. Foglietta; “Efficient, High Recovery of Liquids from Natural Gas Utilizing a High Pressure Absorber,” Proceed-ings of the Eighty-First Annual Convention of the Gas Processors Association, Dallas, U.S.A (2002)
Ortloff Engineers, Ltd.; “Gas Processing Plants Licensed to Use Ort-loff Technology, Single Column Overhead Recycle Process,” http://www.ortloff.com/files/SCORE.pdf (2005a)
Ortloff Engineers, Ltd.; “Gas Processing Plants licensed to Use Ortloff Technology, Recycle Split Vapor Process,” http://www.ortloff.com/files/RSV.pdf (2005b)
Ortloff Engineers, Ltd.; “Gas Processing Plants licensed to Use Ortl-off Technology, Gas Subcooled Process,” http://www.ortloff.com/files/GSP-01.pdf (2010)
Ortloff Engineers, Ltd.; “Gas Processing Plants licensed to Use Ortl-off Technology, Supplemental Rectification with Compression,” http://www.ortloff.com/files/SRC-01.pdf (2014)
Paradowski, H., J. H. Castel and H. B. Parfait; “Method and Appara-tus for Cryogenic Fractionation of A Gaseous Feed,” US Patent No.4690702 (1987)
Pierce, M. C., K. T. Cuellar, J. T. Lynch and H. M. Hudson; 5th Gen-eration NGL / LPG Recovery Technologies for Retrofits, 96th An-nual Convention of the GPA Midstream Association, San Antonio, U.S.A. (2017)
Price, B., R. Denton, A. Dove and B. Friedman; Engineering Data Book, 13rd ed., Gas Processors Suppliers Association, Tulsa, U.S.A. (2012).
Price, B., F. G. Russell, D. J. Morgan and B. Heigold; Engineering Data Book, 12h ed., Gas Processors Suppliers Association, Tulsa, U.S.A. (2004)