Modulation of auxin signalling through DIAGETROPICA and ...
18
ORIGINAL ARTICLE Modulation of auxin signalling through DIAGETROPICA and ENTIRE differentially affects tomato plant growth via changes in photosynthetic and mitochondrial metabolism Willian Batista‐Silva 1,2 | David B. Medeiros 1,2 | Acácio Rodrigues‐Salvador 1,2 | Danilo M. Daloso 3† | Rebeca P. Omena‐Garcia 1,2 | Franciele Santos Oliveira 1,2 | Lilian Ellen Pino 4 | Lázaro Eustáquio Pereira Peres 4 | Adriano Nunes‐Nesi 1,2 | Alisdair R. Fernie 3 | Agustín Zsögön 1 | Wagner L. Araújo 1,2 1 Departamento de Biologia Vegetal, Universidade Federal de Viçosa, Viçosa, Minas Gerais, Brazil 2 Max‐Planck Partner Group at the Departamento de Biologia Vegetal, Universidade Federal de Viçosa, Viçosa, Minas Gerais, Brazil 3 Central Metabolism Group, Max Planck Institute of Molecular Plant Physiology, Potsdam‐Golm, Germany 4 Departmento de Ciências Biológicas, Escola Superior de Agricultura Luiz de Queiroz, Universidade de São Paulo, Piracicaba, Brazil Correspondence Wagner L. Araújo, Departamento de Biologia Vegetal, Universidade Federal de Viçosa, Viçosa 36570‐900, Minas Gerais, Brazil. Email: [email protected] Present Address † Departamento de Bioquímica e Biologia Molecular, Universidade Federal do Ceará, Fortaleza, Ceará, Brasil. Funding information Fundação de Amparo à Pesquisa do Estado de Minas Gerais (FAPEMIG), Grant/Award Num- bers: APQ‐01357‐14 and APQ‐01078‐15; Max‐Planck‐Gesellschaft; Brazilian Federal Agency for Support and Evaluation of Gradu- ate Education (CAPES); Conselho Nacional deDesenvolvimento Científico e Tecnológico (CNPq); Foundation for Research Assistance of the São Paulo State (FAPESP), Grant/Award Number: 2014/16553‐1 Abstract Auxin modulates a range of plant developmental processes including embryogenesis, organogenesis, and shoot and root development. Recent studies have shown that plant hormones also strongly influence metabolic networks, which results in altered growth phenotypes. Modulating auxin signalling pathways may therefore provide an opportunity to alter crop performance. Here, we performed a detailed physiological and metabolic characterization of tomato (Solanum lycopersicum) mutants with either increased (entire) or reduced (diageotropica—dgt) auxin signalling to investigate the consequences of altered auxin signalling on photosynthesis, water use, and primary metabolism. We show that reduced auxin sensitivity in dgt led to anatomical and physiological modifications, including altered stomatal distribution along the leaf blade and reduced stomatal conductance, resulting in clear reductions in both photosynthe- sis and water loss in detached leaves. By contrast, plants with higher auxin sensitivity (entire) increased the photosynthetic capacity, as deduced by higher V cmax and J max coupled with reduced stomatal limitation. Remarkably, our results demonstrate that auxin‐sensitive mutants (dgt) are characterized by impairments in the usage of starch that led to lower growth, most likely associated with decreased respiration. Collec- tively, our findings suggest that mutations in different components of the auxin sig- nalling pathway specifically modulate photosynthetic and respiratory processes. KEYWORDS auxin, metabolic adjustment, mitochondria, photosynthesis, plant hormones, respiration, stomata 1 | INTRODUCTION Plant hormones relay information about internal and external condi- tions and thereby allow the maintenance of cell homeostasis. Auxin was first identified as a plant hormone on the basis of its ability to stimulate differential growth in response to different stimuli (Davis, 2005). Auxin distribution within plant tissues controls an impressive variety of developmental processes (Vanneste & Friml, 2009). Although there are numerous chemical forms of auxin, the most abun- dant and physiologically relevant is indole‐3‐acetic acid (IAA; Enders & Received: 29 January 2018 Revised: 17 July 2018 Accepted: 20 July 2018 DOI: 10.1111/pce.13413 448 © 2018 John Wiley & Sons Ltd Plant Cell Environ. 2019;42:448–465. wileyonlinelibrary.com/journal/pce
-
Upload
khangminh22 -
Category
Documents
-
view
2 -
download
0
Transcript of Modulation of auxin signalling through DIAGETROPICA and ...

Received: 29 January 2018 Revised: 17 July 2018 Accepted: 20 July 2018
DOI: 10.1111/pce.13413
OR I G I N A L A R T I C L E
Modulation of auxin signalling through DIAGETROPICA andENTIRE differentially affects tomato plant growth via changesin photosynthetic and mitochondrial metabolism
Willian Batista‐Silva1,2 | David B. Medeiros1,2 | Acácio Rodrigues‐Salvador1,2 |
Danilo M. Daloso3† | Rebeca P. Omena‐Garcia1,2 | Franciele Santos Oliveira1,2 |
Lilian Ellen Pino4 | Lázaro Eustáquio Pereira Peres4 | Adriano Nunes‐Nesi1,2 |
Alisdair R. Fernie3 | Agustín Zsögön1 | Wagner L. Araújo1,2
1Departamento de Biologia Vegetal,
Universidade Federal de Viçosa, Viçosa, Minas
Gerais, Brazil
2Max‐Planck Partner Group at the
Departamento de Biologia Vegetal,
Universidade Federal de Viçosa, Viçosa, Minas
Gerais, Brazil
3Central Metabolism Group, Max Planck
Institute of Molecular Plant Physiology,
Potsdam‐Golm, Germany
4Departmento de Ciências Biológicas, Escola
Superior de Agricultura Luiz de Queiroz,
Universidade de São Paulo, Piracicaba, Brazil
Correspondence
Wagner L. Araújo, Departamento de Biologia
Vegetal, Universidade Federal de Viçosa,
Viçosa 36570‐900, Minas Gerais, Brazil.
Email: [email protected]
Present Address†Departamento de Bioquímica e Biologia
Molecular, Universidade Federal do Ceará,
Fortaleza, Ceará, Brasil.
Funding information
Fundação de Amparo à Pesquisa do Estado de
Minas Gerais (FAPEMIG), Grant/Award Num-
bers: APQ‐01357‐14 and APQ‐01078‐15;Max‐Planck‐Gesellschaft; Brazilian Federal
Agency for Support and Evaluation of Gradu-
ate Education (CAPES); Conselho Nacional
deDesenvolvimento Científico e Tecnológico
(CNPq); Foundation for Research Assistance
of the São Paulo State (FAPESP), Grant/Award
Number: 2014/16553‐1
448 © 2018 John Wiley & Sons Ltd
Abstract
Auxin modulates a range of plant developmental processes including embryogenesis,
organogenesis, and shoot and root development. Recent studies have shown that
plant hormones also strongly influence metabolic networks, which results in altered
growth phenotypes. Modulating auxin signalling pathways may therefore provide an
opportunity to alter crop performance. Here, we performed a detailed physiological
and metabolic characterization of tomato (Solanum lycopersicum) mutants with either
increased (entire) or reduced (diageotropica—dgt) auxin signalling to investigate the
consequences of altered auxin signalling on photosynthesis, water use, and primary
metabolism. We show that reduced auxin sensitivity in dgt led to anatomical and
physiological modifications, including altered stomatal distribution along the leaf blade
and reduced stomatal conductance, resulting in clear reductions in both photosynthe-
sis and water loss in detached leaves. By contrast, plants with higher auxin sensitivity
(entire) increased the photosynthetic capacity, as deduced by higher Vcmax and Jmax
coupled with reduced stomatal limitation. Remarkably, our results demonstrate that
auxin‐sensitive mutants (dgt) are characterized by impairments in the usage of starch
that led to lower growth, most likely associated with decreased respiration. Collec-
tively, our findings suggest that mutations in different components of the auxin sig-
nalling pathway specifically modulate photosynthetic and respiratory processes.
KEYWORDS
auxin, metabolic adjustment, mitochondria, photosynthesis, plant hormones, respiration, stomata
1 | INTRODUCTION
Plant hormones relay information about internal and external condi-
tions and thereby allow the maintenance of cell homeostasis. Auxin
was first identified as a plant hormone on the basis of its ability to
wileyonlinelibrary
stimulate differential growth in response to different stimuli (Davis,
2005). Auxin distribution within plant tissues controls an impressive
variety of developmental processes (Vanneste & Friml, 2009).
Although there are numerous chemical forms of auxin, the most abun-
dant and physiologically relevant is indole‐3‐acetic acid (IAA; Enders &
Plant Cell Environ. 2019;42:448–465..com/journal/pce
BATISTA‐SILVA ET AL. 449
Strader, 2015). Several processes are affected by IAA; among them are
cell expansion, formation of floral organs, vascular tissue differentia-
tion, apical dominance, side branching, and suppression of leaf abscis-
sion (Enders & Strader, 2015). Insights into auxin transport and
signalling have allowed significant advances in elucidating its role in
plant development. Manipulation of auxin signalling could be used to
alter crop performance; however, its effects on primary metabolism
remain largely unexplored (Leyser, 2017).
The auxin signalling pathway is mediated by a complex system of
transcriptional regulators of the AUXIN/INDOLE ACETIC ACID (Aux/
IAA) family (Delker, Raschke & Quint, 2008), controlling the interaction
between auxin and its receptors including TRANSPORT INHIBITOR
RESPONSE 1 (TIR1), which is a member of the AUXIN SIGNALING
F‐BOX PROTEIN (AFB) family (Leyser, 2017). Members of the Aux/
IAA gene family have highly specific spatial and temporal expression
patterns, thus contributing to the diversity of auxin responses in differ-
ent plant, tissues, organs, and developmental stages (Audran‐Delalande
et al., 2012). For instance, downregulation of the tomato (Solanum
lycopersicum) Aux/IAA9 (SlIAA9, also known as ENTIRE) generates a
constitutive auxin response associated to specific phenotypes, such
as leaf morphogenesis, whereby the compound leaves of tomato are
converted to simple leaves and the plants yield parthenocarpic fruits
(Wang et al., 2005). By contrast, the tomato diageotropica (dgt) mutant
is characterized by reduced sensitivity to auxin caused by loss of func-
tion in a cyclophilin A protein, with peptidyl‐prolyl trans‐cis isomerase
(PPIase) enzymatic activity (Oh, Ivanchenko, White, & Lomax, 2006).
The dgt mutation leads to pleiotropic phenotypes, including impaired
gravitropic response (Rice & Lomax, 2000), absence of lateral root
branching (Muday, Lomax, & Rayle, 1995), reduced polar auxin trans-
port and apical dominance (Ivanchenko et al., 2015), and altered vascu-
lar development (Zobel, 1973). Furthermore, DGT is essential in
determining final fruit size, through the control of cell division and cell
expansion (Devoghalaere et al., 2012). In addition, the dgt mutation is
also thought to disrupt a signalling cascade that includes the extracellu-
lar auxin binding protein 1 (ABP1; Christian, Steffens, Schenck, &
Lüthen, 2003), a putative receptor for a non‐canonical auxin signalling
pathway. Interestingly, mutants of dgt orthologs have been discovered
in the moss Physcomitrella patens (Lavy, Prigge, Tigyi, & Estelle, 2012)
and in rice (Oryza sativa; Zheng et al., 2013). These mutants display sim-
ilar phenotypes to tomato dgt plants and additionally exhibit altered
auxin sensitivity. Molecular and biochemical studies seeking to under-
stand the role of cyclophilins in the auxin response were performed
by studying the dgt ortholog from rice, LATERAL ROOTLESS 2 (LRT2;
Jing et al., 2015). In brief, the authors demonstrated that LRT2 can
directly regulate the stability of Aux/IAA proteins, with OsIAA11, con-
trolling the interaction betweenTIR1 and IAA and affecting the life span
of Aux/IAA proteins as a mechanism regulating auxin signalling.
Plant mitochondria play an essential and key role in the biosyn-
thesis of adenosine triphosphate (ATP) through oxidative phosphory-
lation (Plaxton & Tran, 2011). Accordingly, the tricarboxylic acid
(TCA) cycle in the mitochondria is fundamental in catalysing the oxida-
tion of acetyl‐CoA into CO2, simultaneously producing NADH,
FADH2, ATP, and carbon skeletons used as substrates for several met-
abolic processes (Araújo, Nunes‐Nesi, Nikoloski, Sweetlove, & Fernie,
2012; Fernie, Trethewey, Krotzky, & Willmitzer, 2004). These
compounds are essential to support plant growth and are of pivotal
importance in responses to different environmental conditions
(Berkowitz, De Clercq, Van Breusegem, & Whelan, 2016; Millar,
Whelan, Soole, & Day, 2011). Recent compelling evidence has shown
that plant hormones can regulate networks affecting mitochondrial
metabolism (Berkowitz et al., 2016). Interestingly, it has previously
been suggested that auxin regulates mitochondrial respiration to meet
the increased energy demand for growing cells (Leonova, Gamburg,
Vojnikov, & Varakina, 1985). Although the role of auxin in controlling
plant growth and development is well established, our understanding
on the connections between auxin and primary metabolism remains
limited. Early findings have demonstrated that compounds that inhibit
the TCA cycle and respiratory chain also inhibit auxin‐induced growth
(Thimann, 1977). Furthermore, connections between mitochondrial
function and auxin during plant growth and in response to stress have
been observed (Berkowitz et al., 2016; Ivanova et al., 2014).
Although the importance of auxin for sugar metabolism and
development has been established in tomato fruits (Gao et al., 2016;
Li et al., 2017; Sagar et al., 2013) and Chinese pear (Pyrus ussuriensis;
Huang et al., 2014), the potential consequences of auxin signalling
for metabolic aspects in leaves has not been investigated yet. Here,
we analysed tomato mutants with either increased (entire) or reduced
(dgt) auxin signalling. We therefore investigated how these mutations
influence plant growth, photosynthesis, water use, and respiration.
Our results demonstrate that dgt displayed a range of morphological
and anatomical alterations as well as reduced photosynthetic capacity.
By contrast, the entire mutant was characterized by changes in the
levels of TCA cycle intermediates and nitrogen‐related metabolites,
indicating that both genes controlling auxin signalling alter develop-
mental and metabolic programs in illuminated leaves.
2 | MATERIAL AND METHODS
2.1 | Plant material and growth conditions
Seeds of the tomato (S. lycopersicum cv.Micro‐Tom)wild‐type (WT) and
near isogenic lines dgt and entire in the same genetic background (cv.
Micro‐Tom), obtained as described previously (Carvalho et al., 2011),
were surface‐sterilized with 5% sodium hypochlorite for 10 min and
then washed with running distilled water and subsequently sowed in
a tray with commercial substrate (Tropstrato HT©). The phenotypes
of the dgt and entire individual mutants in the Micro‐Tom background
closely resemble those previously published for the same mutations in
other tomato cultivars (Wang et al., 2005; Ivanchenko et al., 2015).
Seven days after germination (or following the appearance of the
first true leaf), seedlings were transferred to 3.5‐L pots containing the
same commercial substrate supplemented with 5 g L−1 4:14:8 NPK.
Plants were grown in a greenhouse located in Viçosa (20°45′S,
42°15′W, 650 m above sea level), south‐eastern Brazil, with a mini-
mum of 400‐μmol photons m−2 s−1. Plants were watered regularly
and throughout the entire growth period were maintained under
naturally fluctuating conditions of light intensity, temperature, and rel-
ative air humidity. The mutated alleles were confirmed through Sanger
DNA sequencing in an ABI Prism 3100 platform using primers specific
450 BATISTA‐SILVA ET AL.
for DGT (Solyc01g111170), 5′‐GAGTCGCCGTTTTAGGCTTT‐3′ and
3′‐GCAACACAACAACCAATTACG‐5′ and ENTIRE (Solyc04g076850),
5′‐GTTGTCAAGTGTGTGACAGCC‐3′ and 3′‐TGTCACTTACACATAG
GGCCA‐5′. The relative abundance of transcripts was confirmed by
quantitative real‐time PCR (qRT‐PCR), using specific primer pairs for
DGT and ENTIRE: Forward 5′‐GAGTCGCCGTTTTAGGCTTT‐3′,
Reverse 5′‐GCAACACAACAACCAATTACG‐3′ and Forward 5′‐GTTG
TCAAGTGTGTGACAGCC‐3′, Reverse 5′‐TGTCACTTACACATAG
GGCCA‐3′, respectively (for details, see Table S4). All physiological,
biochemical, and molecular parameters analysed in the experiments
were performed on the third fully expanded source leaves from 4‐
week‐old plants. Additionally, the experiment was repeated at least
three times (even in different growth facilities) with similar pheno-
types observed each time.
2.2 | Growth analyses
Growth parameters were determined in 4‐week‐old plants by measur-
ing plant height, stem diameter, number of leaves, and specific leaf
area (SLA). Leaf area was measured using a scanner (Hewlett Packard
Scanjet G2410, Palo Alto, California, USA) and processing the resulting
images on ImageJ (Schneider, Rasband, & Eliceiri, 2012). SLA was
measured as described previously (Hunt, Causton, Shipley, & Askew,
2002). At the end of the experiment, plants were harvested by cutting
the shoot 1 cm above ground level, thus separating shoots from roots.
The roots, after water washing off soil contamination, and shoots were
placed in labelled paper bags and brought to a forced air circulation
oven at 70°C for 5 days; after which, the dry weight of roots and shoots
(stem, petioles, and leaves) was determined in an electronic balance.
2.3 | Stomatal density, stomatal index, and leafanatomy
After 2 hr under sunlight, leaf impressions were taken from the abaxial
and adaxial surface of the third fully expanded leaf with dental resin
imprints (Berger & Altmann, 2000). After shaping the leaf surfaces, nail
polish copies were made using a colorless glaze (von Groll, Berger, &
Altmann, 2002). The images were analysed under a light microscope
(Olympus model AX70TRF; Olympus Optical, Tokyo, Japan) equipped
with a U‐Photo System and digital camera (AxioCam HRc; Zeiss,
Göttingen, Germany). Stomatal density, stomatal index, and stomatal
pore aperture were determined in at least 10 different fields of
0.10 mm2 per leaf from at least seven different plants.
For leaf anatomy analyses, sections of the terminal leaflet of the
third fully expanded leaf were hand cut from the widest part of the
leaf using a razor blade and stored in 100% methanol for epidermal
analysis, or in formaldehyde–acetic acid in ethanol 70% (v/v) solution
for 24 hr for transverse analysis (Feder & O'brien, 1968) and after-
wards embedded in resin (historesin), sectioned in ~5‐μm RM 2155
Automated Microtome, Leica. Sections were next mounted on a
microscopy slide and stained with 1% (w/v) toluidine blue. Histological
sections were observed under a light microscope (Olympus model
AX70TRF; Olympus Optical, Tokyo, Japan) and images captured using
a digital camera (AxioCam HRc; Zeiss, Göttingen, Germany). Images
were analysed using ImageJ (Schneider et al., 2012).
2.4 | Water loss measurements
For water loss measurements, the weight of detached leaves, incu-
bated with the abaxial side up under the same growth conditions
described above, was determined over 4 hr at the indicated time
points. Water loss was calculated as a percentage of the initial fresh
weight (Araújo et al., 2011).
2.5 | Auxin sensitivity assays
In order to investigate root formation in response to auxin, an in vitro
assay was performed using cotyledon explants taken from 8‐day‐old
seedlings (after sowing) grown in culture medium. Five biological rep-
licates composed by a Petri dish containing 20 explants were used for
each treatment. The explants were kept for 10 days on Murashige‐
Skoog medium supplemented with vitamins B5 plus 30 g/L of sucrose,
6 g/L of agar, and 0.4 μM of NAA (α—naphthalene acetic acid—Sigma‐
Aldrich, St. Louis, MO, USA) at 25°C 16‐hr day/8‐hr night (Murashige
& Skoog, 1962). The auxin response curve using hypocotyl segments
was performed using 10‐day‐old seedlings (after sowing) grown under
greenhouse conditions. The explants were collected using a razor
blade (approximately 12 cm) and placed in Petri dishes containing
Kelly and Bradford solution (Kelly and Bradford, 1986) added with dif-
ferent IAA concentrations. After 24 hr, hypocotyls were scanned at
300 dpi, and the generated images were captured using a digital cam-
era (AxioCam HRc; Zeiss, Göttingen, Germany).
2.6 | Measurements of gas exchange and chlorophyllfluorescence
Gas exchange parameters were determined simultaneously with chlo-
rophyll a (Chl a) fluorescence measurements as described in (Medeiros
et al., 2016) using an open‐flow infrared gas exchange analyser system
(LI‐6400XT; LI‐COR Inc., Lincoln, NE) equipped with an integrated
fluorescence chamber (LI‐6400‐40; LI‐COR Inc.). Instantaneous gas
exchanges were measured after 1‐hr illumination during the light
period under 1,000 μmol m−2 s−1 at the leaf level (light saturation) of
photosynthetically active photon flux density (PPFD), determined by
A/PPFD curves–net photosynthesis (AN) in response to PPFD curves
(Figure S6 and Table S1). The reference CO2 concentration was set
at 400‐μmol CO2 mol−1 air. All measurements were performed using
the 2‐cm2 leaf chamber at 25°C, as well as a 0.5 stomatal ratio
(amphistomatic leaves), and leaf‐to‐air vapour pressure deficit was
kept at 1.2 kPa, and the amount of blue light was set to 10% PPFD
to optimize stomatal aperture. Briefly, the initial fluorescence emission
( F 0) was by illuminating dark‐adapted leaves (1 hr) with weak modu-
lated measuring beams (0.03 μmol m−2 s−1). A saturating white light
pulse (8,000 μmol m−2 s−1) was applied for 0.8 s to obtain the maxi-
mum fluorescence (Laskowski et al., 2008), from which the variable‐
to‐maximum Chl fluorescence ratio was then calculated: F v/
Fm = [( F m − F 0)/ Fm)]. In light‐adapted leaves, the steady‐state fluo-
rescence yield was measured with the application of a saturating
white light pulse (8,000 μmol m−2 s−1) to achieve the light‐adapted
maximum fluorescence ( F m´). A far‐red illumination (2 μmol m−2 s−1)
was applied after turning off the actinic light to measure the light‐
adapted initial fluorescence ( F 0´). The capture efficiency of excitation

BATISTA‐SILVA ET AL. 451
energy by open photosystem II reaction centers ( F v´/ F m´) was esti-
mated following Logan, Adams, and Demmig‐Adams (2007) and the
actual PSII photochemical efficiency (φPSII) was estimated as
φPSII = ( F m´ − F s)/ F m´ (Genty, Briantais, & Baker, 1989).
According to Genty et al. (1989), ΦPSII represents the number of
electrons transferred per photon absorbed in the PSII, the electron
transport rate (Jflu) was calculated as Jflu = ΦPSII·α·β·PPFD, where α is
leaf absorptance and reflects β the partitioning of absorbed quantum
between and PSI and PSII. The product αβ was determined according
with previous studies of optical properties using a double integrated
ball system ISP‐REF (OceanOptics, Inc., Dunedin, Florida, EUA), mea-
suring the reflectance (R) and transmittance (T) and then calculating
theabsorbtance (A), accordingwith the followedequation:A=1− (R+T).
The β value was considered the standard fraction of quanta (0.5) and α
was 0.85, where 0.425 is the product already shown in Gilbert, Pou,
Zwieniecki, and Holbrook (2012). Dark respiration (Rd) was measured
after 2 hr in the dark period (at night), using the same gas exchange
system described above, and it was divided by two (Rd/2) to estimate
the mitochondrial respiration rate in the light (RL; Niinemets, Díaz‐
Espejo, Flexas, Galmés, & Warren, 2009).
Photosynthetic light‐response curves (A/PPFD) were determined
using ambient CO2 concentration (Ca) of 400‐μmol CO2 mol−1 and
an initial PPFD of 1,000‐μmol photon m−2 s−1. PPFD was next
increased to 1,200 and 1,400 μmol m−2 s−1 and thereafter decreased
to 0 μmol m−2 s−1 (step changes to 1,000, 800, 400, 200, 100, 50,
25, 10, and 0 μmol m−2 s−1). Simultaneously, Chl a fluorescence
parameters were obtained (Wong, Chen, Huang, & Weng, 2012).
The responses of AN to Ci (A/Ci curves) were initiated at saturating
light of 1,000 μmol m−2 s−1 at 25°C under ambient O2 concentration
(21%). Measurements were taken at ambient CO2 concentration (Ca)
of 400 μmol mol−1, and once the steady state was reached, Ca was
decreased stepwise to 50 μmol mol−1. Upon completion of the mea-
surements at low Ca, Ca was returned to 400 μmol mol−1 to restore
the original AN. Next, Ca was increased stepwise to 1,600 μmol mol−1 in a total of 13 different Ca values (Long & Bernacchi, 2003). Fol-
lowing Rodeghiero, Niinemets, and Cescatti (2007), corrections were
made for the leakage of CO2 into and water vapour out of the leaf
chamber of the LI‐6400 and were applied to all gas exchange data.
A/Ci and AN/PPFD curves were obtained using the third leaf, totally
expanded.
2.7 | Determination of mesophyll conductance (gm),maximum rate of carboxylation (Vcmax), maximum rateof carboxylation limited by electron transport (Jmax),and photosynthetic limitations
The CO2 concentration in the carboxylation sites (Cc) was calculated
according to (Harley, Loreto, Di Marco, & Sharkey, 1992) as
Cc ¼ ðΓ* Jflu þ 8 AN þ RLð Þð Þ= Jflu–4 AN þ RLð Þð Þ;
where the conservative value of Γ* for tomato was taken from
(Hermida‐Carrera, Kapralov, & Galmés, 2016). Then gm was estimated
as the slope of the AN vs Ci–Cc relationship as gm = AN/(Ci–Cc).
Thus, gm was estimated based on average over the points used
in the relationship (Ci < 300 μmol mol−1). Furthermore, the methods
for estimating gm include several assumptions as well as technical
limitations, along with sources of error, which need to be considered
to obtain reliable values (Pons et al., 2009). gm was
estimated according to the (Ethier & Livingston, 2004) method,
which fits AN/Ci curves with a nonrectangular hyperbola version of
the Farquhar–von Caemmerer–Berry model, based on the hypothesis
that gm reduces the curvature of the Rubisco‐limited portion of an
AN/Ci curve.
From AN/Ci and AN/Cc curves, the maximum carboxylation veloc-
ity (Vcmax) and the maximum capacity for electron transport rate (Jmax)
were calculated by fitting the mechanistic model of CO2 assimilation
(Farquhar, von Caemmerer, & Berry, 1980), using the Ci and Cc based
on temperature of kinetic parameters of Rubisco (Kc and Ko), and Vmax,
Jmax, and gm were normalized to 25°C using the temperature response
and plug‐in equations as previously described (Sharkey, Bernacchi,
Farquhar, & Singsaas, 2007)
The photosynthetic limitations were estimated as described previ-
ously (Grassi & Magnani, 2005). Briefly, this method uses the values of
AN, gs, gm, Vcmax, Γ*, Cc, Km, and Km = Kc (1 + O/Ko) and permits the
partitioning into the functional components of photosynthetic con-
straints related to stomatal (ls), mesophyll (lm), and biochemical (lb) lim-
itations:
ls ¼gtotgs
∂AN
∂Cc
� �
gtot þ∂AN
∂Cc
� �
lm ¼gtotgmx
x∂AN
∂Cc
� �
gtot þ∂AN
∂Cc
� �
lb ¼ gtotgtot þ ∂AN=∂ Ccð Þ;
gtot is the total conductance to CO2 from ambient air to
chloroplasts: (gtot = 1/[(1/gs) + (1/gm)]). The fraction ∂AN/∂Cc was cal-
culated as
∂AN
∂Cc¼
Vcmax Γ* þ Km
� �h i� �
Cc þ Kmð Þ2:
2.8 | Determination of metabolite levels
Leaf samples were harvested in different time points along the light/
dark cycle (0, 3, 6, 9, 12, 15, 18, 19, 21, and 24 hr), immediately frozen
in liquid nitrogen and stored at −80°C until further analysis. The
extraction was performed by rapid grinding of tissue in liquid nitrogen
and immediate addition of the appropriate extraction buffer. The
levels of starch, sucrose, fructose, and glucose in the leaf tissue were
determined exactly as described previously (Fernie, Roscher, Ratcliffe,
& Kruger, 2001). Photosynthetic pigments were determined according
to the methods described by Porra, Thompson, and Kriedemann
452 BATISTA‐SILVA ET AL.
(1989). Malate and fumarate were determined according to Nunes‐
Nesi et al. (2007). Proteins and amino acids were also determined as
described previously (Gibon et al., 2004). The metabolites profile
was carried out in samples harvested at the middle of the day (Lisec,
Schauer, Kopka, Willmitzer, & Fernie, 2006). The extraction was per-
formed using 1 ml of methanol and shaking (800 rpm) at 70°C during
15 min; 60 μl of Ribitol (0.2 mg ml−1) was added as an internal stan-
dard. After that, the derivatization procedure was performed exactly
as described in Roessner et al. (2001). Peaks were manually annotated,
and ion intensity was determined by the aid of TagFinder software
(Luedemann, von Malotky, Erban, & Kopka, 2011), using a reference
library from the Golm Metabolome Database (Kopka et al., 2004)
and following the recommended reporting format (Fernie et al., 2011).
2.9 | Measurement of respiratory parameters basedon 14CO2 evolution
Estimation of the TCA cycle flux was calculated on the basis of 14CO2
evolution (Nunes‐Nesi et al., 2005). The experiment was carried out
following incubation of isolated leaf discs in 10‐mM 2‐(N‐
morpholine)‐ethanesulphonic acid (MES)‐KOH, pH 6.5, containing
0.3‐mM glucose (Glc) and supplied with 0.62 KBq ml−1 of [1–14C]–
or [3,4–14C] Glc under 150‐μmol photons m−2 s−1 light. Evolved14CO2 was trapped in KOH and quantified by liquid scintillation
counting. The fractionation of 14C‐labelled material was performed
exactly as detailed previously (Lytovchenko, Sweetlove, Pauly, &
Fernie, 2002). The results were interpreted following recommenda-
tions of ap Rees and Beevers (1960).
2.10 | Expression analysis by qRT‐PCR
qRT‐PCR analysis was performed exactly as described by Zanor et al.
(2009) with total RNA isolated from at least three biological repli-
cates. The samples were harvested and snap frozen in liquid nitro-
gen. RNA extraction was performed using TRizol® reagent
(Ambion, Life Technology) following the manufacturer's manual.
Digestion with DNase I (Ambion; http://www.ambion.com/) was per-
formed according to the manufacturer's instructions. The integrity of
the RNA was checked on 1% (w/v) agarose gels, and the concentra-
tion was measured before and after DNase I digestion using a
Nanodrop ND‐1000 spectrophotometer (http://www.nanodrop.
com/). DNA was synthesized from 1 μg of total RNA using Super-
Script III reverse transcriptase (Invitrogen; http://www.invitrogen.
com/) according to the manufacturer's instructions. The efficiency
of cDNA synthesis was estimated by semi‐quantitative PCR using
two primer pairs amplifying 5′ and 3′ regions of the constitutive
gene Actin (forward [5′‐GGTCCCTCTATTGTCCACAG‐3′] and
reverse [5′‐TGCATCTCTGGTCCAGTAGGA‐3′]. Gene expression
values were normalized based on the Actin (Solyc03g078400.2.1)
gene with the following primers, forward (5′‐GGTCCCTCTATTGT
CCACAG‐3′) and reverse (5′‐TGCATCTCTGGTCCAGTAGGA‐3′).
The primers used for qRT‐PCR were designed using the QuantiPrime
software (http:www.quantprime.de). Detailed primers information is
described in the Table S7.
2.11 | Experimental design and statistical analysis
The experiments were arranged in a completely randomized design. All
data passed the normality and equal variance Kolmogorov–Smirnov
tests and then the means were further analysed by a one‐way analysis
of variance and some cases in two‐way, when necessary. The means
separations were further performed by multiple comparison using a
most rigorous test in comparative statistics, the Tukey test
(P < 0.05). The means ± SE presented in the tables and figures were
obtained from seven independent replicates per genotype and when
was the case, over time.
3 | RESULTS
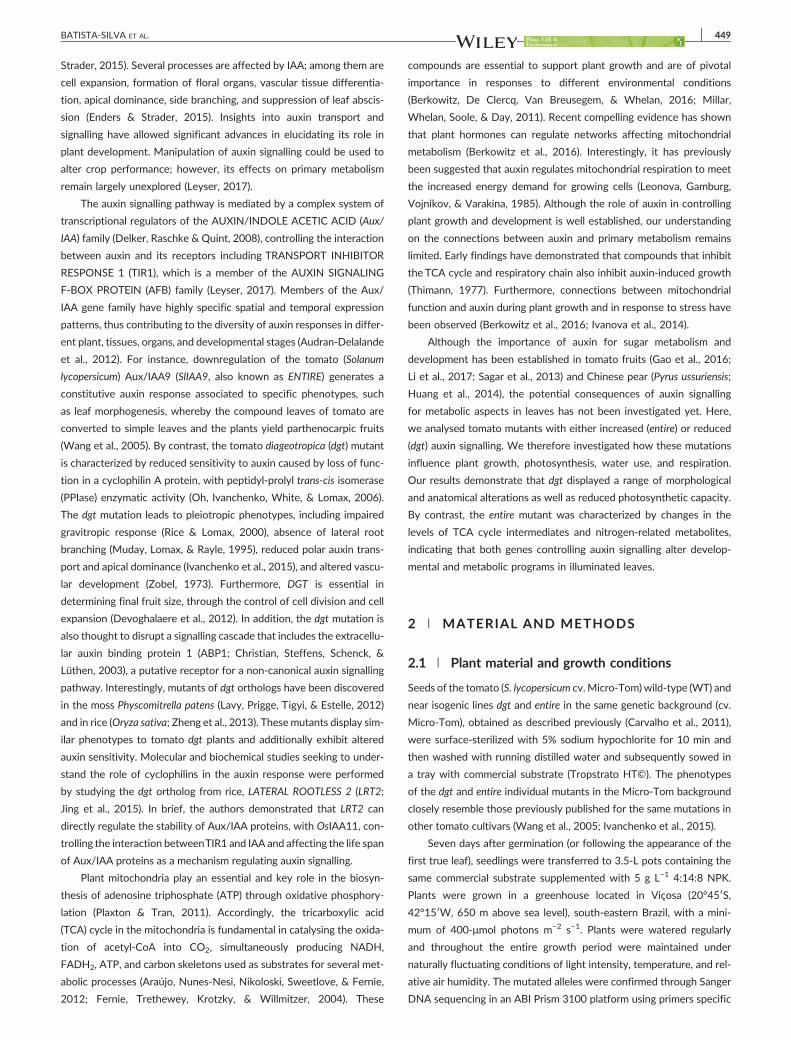
3.1 | Diageotropica mutation reduces plant growthand intrinsic water‐use efficiency
Here, we investigated the physiological and metabolic impacts of
fluctuations on auxin signalling using previously characterized
tomato mutants with either increased (entire, a mutation in the
SlIAA9 gene) or reduced (dgt) auxin signalling. The mutants show a
clearly distinct phenotype during vegetative growth (Figure 1a and
Table 1). In an attempt to show this differential sensitivity of auxin,
we initially confirmed that SlIAA9 and DGT expression were signifi-
cantly reduced in entire and dgt mutant plants, respectively
(Figure 1b). Furthermore, the expression of DGT in the entire mutant
and of SIIAA9 in the dgt mutant did not differ significantly compared
to WT control plants (Figure 1b). We next evaluated the expression
levels of the DGT and SIIAA9 genes in different tissues of WT plants.
Our results showed that the basal expression of both genes is highly
variable across the whole plant. Thus, while DGT is highly expressed
in roots, young leaves, mature leaves, and open flowers, SlIAA9 is
expressed in young leaves, mature leaves, flowers, and young fruits
(Figure S1). Our results are in good agreement with both previously
published results (Wang et al., 2009) and public RNA‐Seq data in
tomato cv. Micro‐Tom plants (http://tomexpress.toulouse.inra.fr/
select‐data).
In order to confirm the alteration in the auxin sensitivity in dgt
and entire plants, we next investigated the auxin dose effect on both
root formation and hypocotyl segment elongation (Figure S2). The
entire mutant plants do not present a significant increase in auxin
sensitivity when compared with WT although it does respond differ-
entially to exogenously applied auxin; moreover, entire presents a
significantly increased sensitivity in comparison with dgt mutant.
Thus, at 0.5 μM of NAA, 90% of explants from entire plants
displayed regenerated roots, while only 60% of the total in dgt
explants regenerated. In summary, dgt plants displayed reduced sen-
sitivity to auxin, characterized by reduced root production in
explants (Figure S2A,B) as well as failure of hypocotyls to elongate
(Figure S2C).
In an attempt to show the effect of changes in auxin signalling,
we decided to analyse whole plant traits of both mutants. The entire
plants were characterized by increased number of leaves and total
dry weight, but thinner leaves with reduced SLA and stomatal den-
sity (Table 1 and Figure S3). Although such leaf phenotypes could
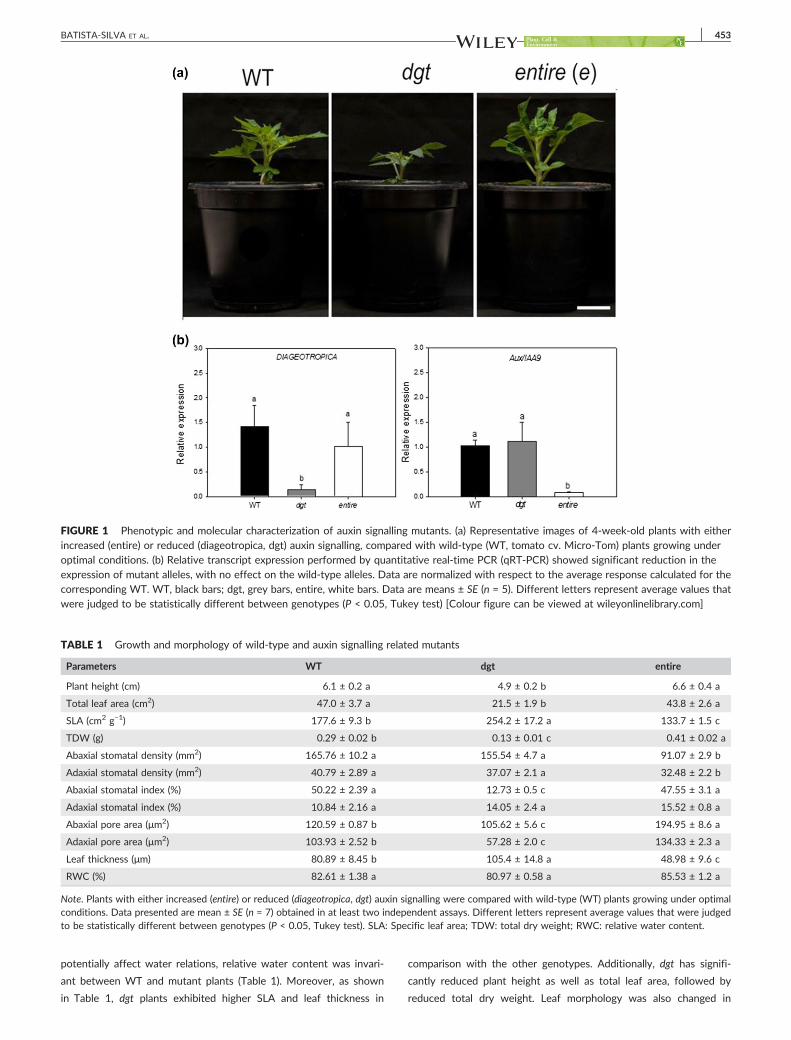
FIGURE 1 Phenotypic and molecular characterization of auxin signalling mutants. (a) Representative images of 4‐week‐old plants with eitherincreased (entire) or reduced (diageotropica, dgt) auxin signalling, compared with wild‐type (WT, tomato cv. Micro‐Tom) plants growing underoptimal conditions. (b) Relative transcript expression performed by quantitative real‐time PCR (qRT‐PCR) showed significant reduction in theexpression of mutant alleles, with no effect on the wild‐type alleles. Data are normalized with respect to the average response calculated for thecorresponding WT. WT, black bars; dgt, grey bars, entire, white bars. Data are means ± SE (n = 5). Different letters represent average values thatwere judged to be statistically different between genotypes (P < 0.05, Tukey test) [Colour figure can be viewed at wileyonlinelibrary.com]
TABLE 1 Growth and morphology of wild‐type and auxin signalling related mutants
Parameters WT dgt entire
Plant height (cm) 6.1 ± 0.2 a 4.9 ± 0.2 b 6.6 ± 0.4 a
Total leaf area (cm2) 47.0 ± 3.7 a 21.5 ± 1.9 b 43.8 ± 2.6 a
SLA (cm2 g−1) 177.6 ± 9.3 b 254.2 ± 17.2 a 133.7 ± 1.5 c
TDW (g) 0.29 ± 0.02 b 0.13 ± 0.01 c 0.41 ± 0.02 a
Abaxial stomatal density (mm2) 165.76 ± 10.2 a 155.54 ± 4.7 a 91.07 ± 2.9 b
Adaxial stomatal density (mm2) 40.79 ± 2.89 a 37.07 ± 2.1 a 32.48 ± 2.2 b
Abaxial stomatal index (%) 50.22 ± 2.39 a 12.73 ± 0.5 c 47.55 ± 3.1 a
Adaxial stomatal index (%) 10.84 ± 2.16 a 14.05 ± 2.4 a 15.52 ± 0.8 a
Abaxial pore area (μm2) 120.59 ± 0.87 b 105.62 ± 5.6 c 194.95 ± 8.6 a
Adaxial pore area (μm2) 103.93 ± 2.52 b 57.28 ± 2.0 c 134.33 ± 2.3 a
Leaf thickness (μm) 80.89 ± 8.45 b 105.4 ± 14.8 a 48.98 ± 9.6 c
RWC (%) 82.61 ± 1.38 a 80.97 ± 0.58 a 85.53 ± 1.2 a
Note. Plants with either increased (entire) or reduced (diageotropica, dgt) auxin signalling were compared with wild‐type (WT) plants growing under optimalconditions. Data presented are mean ± SE (n = 7) obtained in at least two independent assays. Different letters represent average values that were judgedto be statistically different between genotypes (P < 0.05, Tukey test). SLA: Specific leaf area; TDW: total dry weight; RWC: relative water content.
BATISTA‐SILVA ET AL. 453
potentially affect water relations, relative water content was invari-
ant between WT and mutant plants (Table 1). Moreover, as shown
in Table 1, dgt plants exhibited higher SLA and leaf thickness in
comparison with the other genotypes. Additionally, dgt has signifi-
cantly reduced plant height as well as total leaf area, followed by
reduced total dry weight. Leaf morphology was also changed in

454 BATISTA‐SILVA ET AL.
dgt plants, as observed by their reduced stomatal index and stoma-
tal pore diameters (Figures S3 and S4). These morphological alter-
ations culminated with changes in water use as demonstrated by
enhanced water loss in detached leaves of entire, whereas in dgt,
water loss was decreased, in comparison with WT (Figure S5 and
Table S1).
3.2 | The entire and diageotropica mutations alter theexpression profile of AUXIN RESPONSE FACTORS andAUXIN/INDOLE‐3‐ACETIC ACID INDUCIBLE genes
Auxin is considered a potent regulator of several aspects of plant func-
tion, and this response is dependent on several genes whose expres-
sion is upregulated in response to its application (Quint & Gray,
2006). Among the most thoroughly characterized gene families are
SAURs (Small Auxin‐Up RNAs), GH3s (Gretchen Hagen 3), and Aux/
IAAs (Auxin/INDOLE ACETIC ACID INDUCED) gene families, which are
induced within minutes of auxin application (Hedden & Thomas,
2008). These genes products, as well as the auxin response factors
(ARFs), likely confer specificity to the auxin response through regula-
tion of other transcription factors and effector genes (Leyser, 2017).
We therefore investigated the expression levels of genes involved in
auxin signalling, including IAA1, IAA2, IAA3, ENTIRE/IAA9, IAA19,
IAA29, ARF8, ARF10, DGT, and GH3, and observed that both gene
families (Aux/IAAs and ARFs) are differentially expressed in response
to changes in auxin signalling (Figure 2). Transcript analysis revealed
that ARF (ARF8 and ARF10), as well as IAA19 and IAA29 expression,
is upregulated in dgt mutant (Figure 2). In the entire mutant, the levels
of IAA1, IAA2, IAA3, IAA19, IAA29, and GH3 were upregulated in com-
parison with WT; however, no differences were observed in the
expression of IAA3, IAA19, and IAA29 between mutant lines. Our
results suggest that the DGT gene regulates the expression of mem-
bers of the ARFs and Aux/IAAs families, whereas SlIAA9 (ENTIRE) can
regulate genes of its own family (AUX/IAAs), as well as member of
the GH3 family (Figure 2).
3.3 | The entire mutation improves photosyntheticcapacity by reducing stomatal resistance
Given the alterations observed in morphology and growth, we next
performed a full characterization of the photosynthetic capacity of
dgt and entire mutants. In close agreement with the stomatal density
and stomatal index (Table 1), a significant reduction of net photosyn-
thesis (AN), stomatal conductance (gs), and transpiration (E) rates
(12.5%, 28.5%, and 32.1% lower that WT values, respectively) was
observed in dgt plants (Table 2). By contrast, significant increases in
AN, gs, and E (10.42%, 21%, and 12.5% of that of WT, respectively)
were observed in entire plants (Table 2). The dgt mutant further dis-
plays higher intrinsic water‐use efficiency (WUEi) than WT and entire
plants. Lower WUEi in entire plants is in agreement with stomatal pore
area (Table 2 and Figures S3 and S5). The higher CO2 uptake capacity
observed in entire was coupled with higher Rd (Table 2), significantly
higher than WT and dgt (nearly two‐fold in both cases). Despite these
changes, no significant alterations in photorespiration (PR), maximum
PSII photochemical efficiency ( F v/ F m), actual PSII photochemical
efficiency ( F v′/ Fm′), and the electron transport rate (Jflu) were found
among the genotypes (Table 2). Photosynthetic light response curves
revealed that mutants have altered AN at high PPFD. The light‐satu-
rated AN (APPFD), light saturation (Is), and light compensation (Ic) points
were significantly higher in entire plants, whereas only Is was reduced
in dgt plants with no alterations in light‐use efficiency (1/ϕ; Table S2
and Figure S6).
The response of AN to leaf internal CO2 concentration (AN/Ci
curves; Figure 3a) was also obtained and subsequently converted into
responses of AN to chloroplastidic CO2 concentration (AN/Cc curves;
Figure 3b). Essentially, both AN/Ci and AN/Cc curves were similar
regardless of genotype (Figure 3). Under ambient CO2 concentration
(400 μmol mol−1), Ci and Cc estimations were lower in dgt and higher
in entire plants compared with the WT (Table 3). gm estimated using
a combination of gas exchange and chlorophyll a fluorescence param-
eters via two independent methods did not show any significant dif-
ference between genotypes (Table 3). Considering that gm, as well as
RL, changes dynamically under different environmental conditions,
we performed a sensitivity curve response of gm under different RL
(Figure S7). This analysis was performed considering different percent-
ages of RL (100%, 75%, 50%, 25%, and 0%) and following the expected
changes in gm (Figure S7). Our results showed no significant changes in
gm despite alterations in RL even when 100% of RL was considered in
relation to Rd (1.51, 1.37, and 2.70 μmol CO2 m−2 s−1 in WT, dgt, and
entire, respectively). As shown in Table 3, the maximum carboxylation
velocity (Vcmax_cc) and maximum capacity for electron transport rate
(Jmax_cc) were similar between dgt and WT plants. On the other hand,
reduced Vcmax_ci and increased Vcmax_cc without impacting either
Jmax_Ci:Vcmax_Ci or Jmax_Cc:Vcmax were found in entire mutant plants
(Table 3). Moreover, the similarities in the Jmax:Vcmax ratios suggest
that although differences in AN were observed, an adequate functional
balance between carboxylation and electron transport rates probably
occurred despite changes in auxin signalling.
The overall photosynthetic limitations were next partitioned into
their functional components, namely, stomatal (ls), mesophyll (lm), and
biochemical (lb) limitations (Table 3). The photosynthetic rates were
mainly constrained by lb of around 50% in WT, whereas ls accounted
for, on average, 28% and 24% and lm contributed 22% and 26% in WT
and entire plants, respectively. Remarkably, lb was reduced to about
40% and followed by increased ls to around 38%, whereas lm contrib-
uted 22% in dgt plants. These analyses demonstrated that auxin sig-
nalling‐related mutants are affected mainly in ls, in agreement with
morphological alterations, particularly in dgt plants. Our results sup-
port the findings that variations in AN, as described in Tables 2 and
3, should be primarily associated with stomatal conductance. There-
fore, manipulation of auxin signalling could provide an effective means
to alter maximum photosynthetic rate and hence productivity.
3.4 | DGT and ENTIRE integrate auxin signalling andgrowth by modulating plant energy status
To further explore the consequences of changes in the auxin signalling
mutants, we conducted a detailed metabolic analysis in leaves. To this
end, we first measured the levels of starch, soluble sugars (glucose,
fructose, and sucrose), amino acids, and the organic acids, malate,

FIGURE 2 Relative transcript accumulation of members of SlIAA and SlARF family genes is affected in auxin signalling mutants. Relativeexpression levels of genes involved in auxin signalling (SlIAA and SlARF family genes) and homeostasis (GH3) are altered in tomato plants witheither increased (entire) or reduced (diageotropica, dgt) auxin signalling when compared with wild‐type (WT) plants growing under optimalconditions. The y‐axis values represent the relative expression levels calculated using the 2‐ΔΔCT method. Expression levels were normalized usingactin and ubiquitin3 as reference. Values are presented as means ± SE (n = 4) of independent biological replicates. Different letters representaverage values that were judged to be statistically different between genotypes (P < 0.05, Tukey test)
BATISTA‐SILVA ET AL. 455
and fumarate during a diel cycle. Briefly, this analysis revealed that dgt
plants were characterized by a significant increase in the levels of glu-
cose, fructose, sucrose, and fumarate during the light period, but with
no changes in malate and starch (Figure 4 and Table S3). Overall,
plants with higher auxin sensitivity (entire) did not show significant
changes in carbohydrate and organic acid levels during the diurnal
cycle in comparison with WT plants (Figure 4 and Table S3). Interest-
ingly, during the night, the usage of these accumulated metabolites in
dgt plants is not increased, and at the end of dark period, higher levels
were observed (Figure 4). Notably, starch metabolism seems to be
highly affected in dgt plants, particularly during the night, significantly
higher in comparison with WT and entire mainly from 9:00 pm until
3:00 am; however, at the beginning of the day, no differences
between genotypes were observed (Figure 4f and Table S3). In addi-
tion, the level of amino acids was significantly higher in leaves of entire
plants when compared with both WT and dgt; however, in roots, it

FIGURE 3 Net photosynthesis (AN) curves in response to sub‐stomatal (Ci) or chloroplastic (Cc) CO2 concentration in auxin signalling mutants(dgt and entire). A, AN/Ci curve, and B, AN/Cc. Plants with either increased (entire) or reduced (diageotropica, dgt) auxin signalling werecompared with wild‐type (WT) plants growing under optimal conditions. WT, black circles; dgt, open circles; entire, black triangles. Data aremeans ± SE (n = 7) obtained using the third fully expanded leaf from the apex of 4‐week‐old plants (vegetative stage)
TABLE 3 Photosynthetic characterization of auxin signalling mutants
Parameters* WT dgt entire
Ci (μmol CO2 mol−1) 276.32 ± 15.71 b 208.82 ± 19.78 c 333.31 ± 17.49 a
Cc (μmol CO2 mol−1) 163.88 ± 9.75 a 117.05 ± 7.97 b 147.89 ± 8.90 a
gm_Harley (mol CO2 m−2 s−1 bar) 0.215 ± 0.01 a 0.232 ± 0.024 a 0.211 ± 0.015 a
gm_Ethier (mol CO2 m−2 s−1 bar) 0.234 ± 0.03 a 0.244 ± 0.056 a 0.224 ± 0.034 a
Vcmax_Ci (μmol m−2 s−1) 66.92 ± 3.30 a 69.362 ± 2.838 a 55.744 ± 3.051 b
Vcmax_Cc (μmol m−2 s−1) 107.307 ± 2.42 b 108.56 ± 1.83 b 121.95 ± 1.32 a
Jmax_Ci (μmol m−2 s−1) 112.85 ± 6.97 a 112.68 ± 6.15 a 106.17 ± 6.45 a
Jmax_Cc (μmol m−2 s−1) 134.40 ± 2.69 142.35 ± 6.81 a 148.88 ± 1.56 a
Jmax_Ci:Vcmax_Ci 1.69 ± 0.11 a 1.62 ± 0.05 a 1.91 ± 0.10 a
Jmax_Cc: Vcmax_Cc 1.25 ± 0.04 a 1.31 ± 0.07 a 1.22 ± 0.02 a
Stomatal limitation (ls) 0.281 ± 0.015 a 0.381 ± 0.018 b 0.241 ± 0.007 a
Mesophyll limitation (lm) 0.229 ± 0.011 a 0.224 ± 0.018 a 0.258 ± 0.004 a
Biochemical limitation (lb) 0.493 ± 0.022 a 0.395 ± 0.012 b 0.501 ± 0.061 a
Note. Data were obtained in 4‐week‐old plants with either increased (entire) or reduced (diageotropica, dgt) auxin signalling and were compared with wild‐type (WT) plants growing under 400 μmol CO2 and 21% O2 and 1000 PAR. Values are presented as means ± SE (n = 7). Different letters represent averagevalues that were judged to be statistically different between genotypes (P < 0.05, Tukey test).
*Ci: sub‐stomatal CO2 concentration; Cc: Chloroplastic CO2 concentration; gm: mesophyll conductance to CO2 estimated according to the Harley andEthier; Vcmax_Ci or Cc: maximum carboxylation capacity based or Ci or Cc; Jmax_Ci or Cc: maximum capacity for electron transport rate based on Ci or Cc.
TABLE 2 Gas exchange and chlorophyll a fluorescence parameters are affected in auxin signalling related mutants
Parameters* WT dgt entire
AN (μmol CO2 m−2 s−1) 19.17 ± 0.62 b 16.78 ± 0.30 c 21.18 ± 0.31 a
gs (mol H2O m−2 s−1) 0.28 ± 0.01 b 0.20 ± 0.008 c 0.34 ± 0.018 a
E (mmol H2O m−2 s−1) 3.68 ± 0.26 b 2.50 ± 0.22 c 4.64 ± 0.28 a
WUEi (A/gs) 69.32 ± 1.80 b 83.01 ± 4.04 a 61.89 ± 1.93 c
Rd (μmol CO2 m−2 s−1) 1.43 ± 0.05 b 1.25 ± 0.11 b 2.94 ± 0.14 a
PR (μmol CO2 m−2 s−1) 3.69 ± 0.18 a 3.79 ± 0.29 a 3.66 ± 0.21 a
F V/ F m 0.84 ± 0.001 a 0.84 ± 0.001 a 0.83 ± 0.001 a
FV’/Fm′ 0.59 ± 0.01 a 0.59 ± 0.011 a 0.61 ± 0.012 a
Jflu (μmol m−2 s−1) 170.75 ± 3.71 a 161.54 ± 8.24 a 160.63 ± 4.92 a
Note. Data were obtained in 4‐week‐old plants with either increased (entire) or reduced (diageotropica, dgt) auxin signalling and were compared with wild‐type (WT) plants growing under optimal conditions. Values are presented as means ± SE (n = 7). Different letters represent average values that were judgedto be statistically different between genotypes (P < 0.05, Tukey test).
*AN: Net photosynthesis rate; gs: stomatal conductance; E: transpiration rate, WUEi: intrinsic water‐use efficiency; Rd: dark respiration; PR: photorespirationrate; F v/ F m: maximum PSII photochemical efficiency; F v′/ F m′; actual PSII photochemical efficiency; Jflu: eléctron transport rate estimated by chlorophyllfluorescence parameters.
456 BATISTA‐SILVA ET AL.
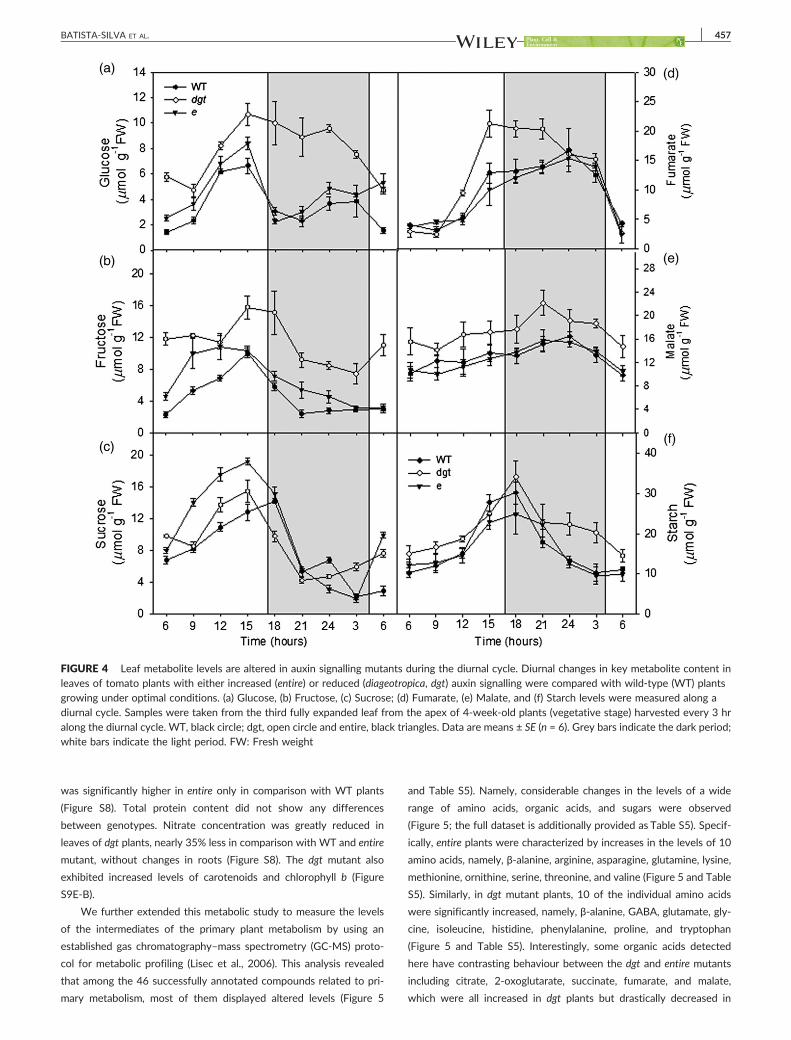
FIGURE 4 Leaf metabolite levels are altered in auxin signalling mutants during the diurnal cycle. Diurnal changes in key metabolite content inleaves of tomato plants with either increased (entire) or reduced (diageotropica, dgt) auxin signalling were compared with wild‐type (WT) plantsgrowing under optimal conditions. (a) Glucose, (b) Fructose, (c) Sucrose; (d) Fumarate, (e) Malate, and (f) Starch levels were measured along adiurnal cycle. Samples were taken from the third fully expanded leaf from the apex of 4‐week‐old plants (vegetative stage) harvested every 3 hralong the diurnal cycle. WT, black circle; dgt, open circle and entire, black triangles. Data are means ± SE (n = 6). Grey bars indicate the dark period;white bars indicate the light period. FW: Fresh weight
BATISTA‐SILVA ET AL. 457
was significantly higher in entire only in comparison with WT plants
(Figure S8). Total protein content did not show any differences
between genotypes. Nitrate concentration was greatly reduced in
leaves of dgt plants, nearly 35% less in comparison with WT and entire
mutant, without changes in roots (Figure S8). The dgt mutant also
exhibited increased levels of carotenoids and chlorophyll b (Figure
S9E‐B).
We further extended this metabolic study to measure the levels
of the intermediates of the primary plant metabolism by using an
established gas chromatography–mass spectrometry (GC‐MS) proto-
col for metabolic profiling (Lisec et al., 2006). This analysis revealed
that among the 46 successfully annotated compounds related to pri-
mary metabolism, most of them displayed altered levels (Figure 5
and Table S5). Namely, considerable changes in the levels of a wide
range of amino acids, organic acids, and sugars were observed
(Figure 5; the full dataset is additionally provided as Table S5). Specif-
ically, entire plants were characterized by increases in the levels of 10
amino acids, namely, β‐alanine, arginine, asparagine, glutamine, lysine,
methionine, ornithine, serine, threonine, and valine (Figure 5 and Table
S5). Similarly, in dgt mutant plants, 10 of the individual amino acids
were significantly increased, namely, β‐alanine, GABA, glutamate, gly-
cine, isoleucine, histidine, phenylalanine, proline, and tryptophan
(Figure 5 and Table S5). Interestingly, some organic acids detected
here have contrasting behaviour between the dgt and entire mutants
including citrate, 2‐oxoglutarate, succinate, fumarate, and malate,
which were all increased in dgt plants but drastically decreased in

FIGURE 5 Auxin signalling affects the relative metabolite content in tomato leaves. Changes in the relative metabolite content of tomato plantswith either increased (entire) or reduced (diageotropica, dgt) auxin signalling were compared to wild‐type (WT) plants growing under optimalconditions. Amino acids, organic acids, sugars, and sugar alcohols were determined by GC‐MS as described in Section 2. The full data sets fromthese metabolic profiling studies are additionally available inTable S3. Data are normalized with respect to the average response calculated for thecorresponding WT (to allow statistical assessment, individual plants from this set were normalized in the same way). Different colors representlevels of metabolite fold change where red is increasing and blue is decreasing. Data were normalized with respect to mean response calculatedfrom wild type. Values are presented as means ± SE (n = 6)
458 BATISTA‐SILVA ET AL.
entire plants when compared with WT and dgt (Figure 5 and Table S5).
Notably, ascorbate and dehydroascorbate were increased only in the
dgt mutant. A similar trend is also observed for sugar content in which
dgt plants display significantly increases in ribulose, glucose, fructose,
and sucrose, whereas maltose, ribose, and ribulose were reduced in
entire plants (Table S5). On assaying the levels of pyridine dinucleo-
tides and their ratios, we observed only few changes in the pyridine
nucleotides either at oxidized (NAD+ and NADP+) or at reduced
(NADH and NADPH) without changes in the ratio NADH/NADP+
and NADPH/NADP+ (Table S6). Remarkably, higher levels of NAD+
and NADH were observed in the dgt mutant when compared with
WT and entire, whereas decreased levels of NAD+ and NADP+.were
observed only in entire.
3.5 | Increased auxin signalling in entire affects theflux through the TCA cycle
Given the changes in Rd, sugar, and organic acid contents described
above, we next decided to assess the rate of respiration under normal
growth conditions by performing two complementary approaches. We
directly evaluated the rate of RL in the mutants lines (dgt and entire) by
measuring the 14CO2 evolution following incubation of leaf discs with
positionally labelled 14C‐glucose (14C‐Glc) to assess the relative rate of
flux through the TCA cycle and the metabolic flux analysis using 14C‐
label (Figure 6 and Table 4). This information is of pivotal significance
given that metabolic pathways, and the key regulatory points thereof
can be deduced using isotopically labelled substrates (Batista Silva,

FIGURE 6 Respiratory parameters are affected in leaf samples of auxin signalling mutants. Changes in respiration of tomato plants with eitherincreased (entire) or reduced (diageotropica, dgt) auxin signalling were compared with wild‐type (WT) plants growing under optimal conditions.Evolution of 14CO2 from isolated leaf discs in the light. The leaf discs were taken from 4‐week‐old plants and were incubated in 10‐mMMES‐KOHsolution, pH 6.5, 0.3‐mM glucose supplemented with 0.62 kBq ml−1 of (a) [1‐14C]‐Glc or (b) [3.4‐14C] at an irradiance of 100 μmol m−1 s−1. TheCO2 liberated was captured at hourly intervals in a KOH trap and the amount of radiolabel released was subsequently quantified by liquidscintillation counting. (c) Ratio of carbon dioxide evolution from C3,4 to C1 position. (d) Dark respiration measurements performed in 4‐week‐oldplants. WT, black bars; dgt, grey bars, entire, white bars. Values are presented as means ± SE (n = 4). Different letters represent average values thatwere judged to be statistically different between genotypes (P < 0.05, Tukey test)
BATISTA‐SILVA ET AL. 459
Daloso, Fernie, Nunes‐Nesi, & Araújo, 2016). For this purpose, we
recorded the evolution of 14CO2 following incubation of leaf discs in
light (approximately 150 μmol m−2 s−1), supplied with [1‐14C]‐Glc
and [3,4‐14C]‐Glc over a period of 6 hr. During this time, we collected
the 14CO2 evolved at hourly intervals. CO2 can be released from the
C1 position by the action of enzymes that are not associated with
mitochondrial respiration; however, this does not happen for CO2
released from the C3/C4 position (Nunes‐Nesi et al., 2007). Thus,
the ratio of CO2 evolution from C3,4 to C1 position of Glc provides
a strong indication of theTCA cycle regarding other carbohydrate oxi-
dation process. When the relative 14CO2 release of the mutants and
WT is compared for the various fed substrates, an interesting pattern
emerges with a significant reduction occurring in the entiremutant fol-
lowing 3 hr of incubation with [1‐14C]‐Glc (Figure 6a). Thus, when sup-
plied with [3,4‐14C]‐Glc, the 14CO2 release was significantly increased
in the entire mutant from 5 hr onward (Figure 6b). Similarly, the C3,4/
C1 ratio was significantly higher in the entire mutant in comparison
with WT and dgt (Figure 6c), revealing that there is a higher proportion
of carbohydrate oxidation by TCA cycle in illuminated leaves of entire
plants. Our results are in close agreement with the results of our met-
abolic profiling as showed above. In the same vein, Rd measurements
revealed an approximately 90% higher rates of CO2 evolution in entire
plants when compared with both WT and dgt genotypes (Figure 6d).
We next assessed the redistribution of radiolabel by incubating
excised leaf discs from 4‐week‐old plants of dgt, entire, and WT in
[U‐14C‐Glu] for period of 3 hr. The genotypes were characterized
by relatively similar total uptake; however, a differential radiolabel
distribution was observed between genotypes (Table 4). Interestingly,
when compared with WT and entire plants, the dgt mutant exhibited
higher values of incorporation in organic acid, sugars phosphate, sol-
uble sugars, starch, total protein, and cell wall (Table 4). Thus, our
data reveal a lower relative proportion of carbohydrate oxidation is
performed by the TCA cycle in the plants with reduced sensitivity
to auxin (dgt plants). In agreement with our metabolite profiles
described above, the mutant entire was characterized by a significant
increased radiolabel distribution to organic acids with reduced soluble
sugars without changes in starch (Table 4). These results are in close
agreement with the observation of changes of Rd in these plants. By
contrast, entire mutant plants displayed an accelerated rate of
oxidation of carbohydrates coupled with increases in respiratory rate
under light conditions as well as increased dark respiration (Figure 6d
and Table 4).
4 | DISCUSSION
4.1 | Photosynthetic capacity and metabolismadjustments in response to the modulation in auxinsignalling
Auxin acts as a general coordinator of plant growth and development
mainly by relaying information over both long and short ranges
(Leyser, 2017). The major mechanism by which auxin affects cellular
responses is via changes in transcription, and thus, several genes
change their expression profile rapidly in response to auxin (Paponov
et al., 2008). In addition, auxin is able to promote cell division in cul-
tured cellular suspensions, which is accompanied by increased respira-
tion (Leonova et al., 1985). It has been suggested that stimulation of
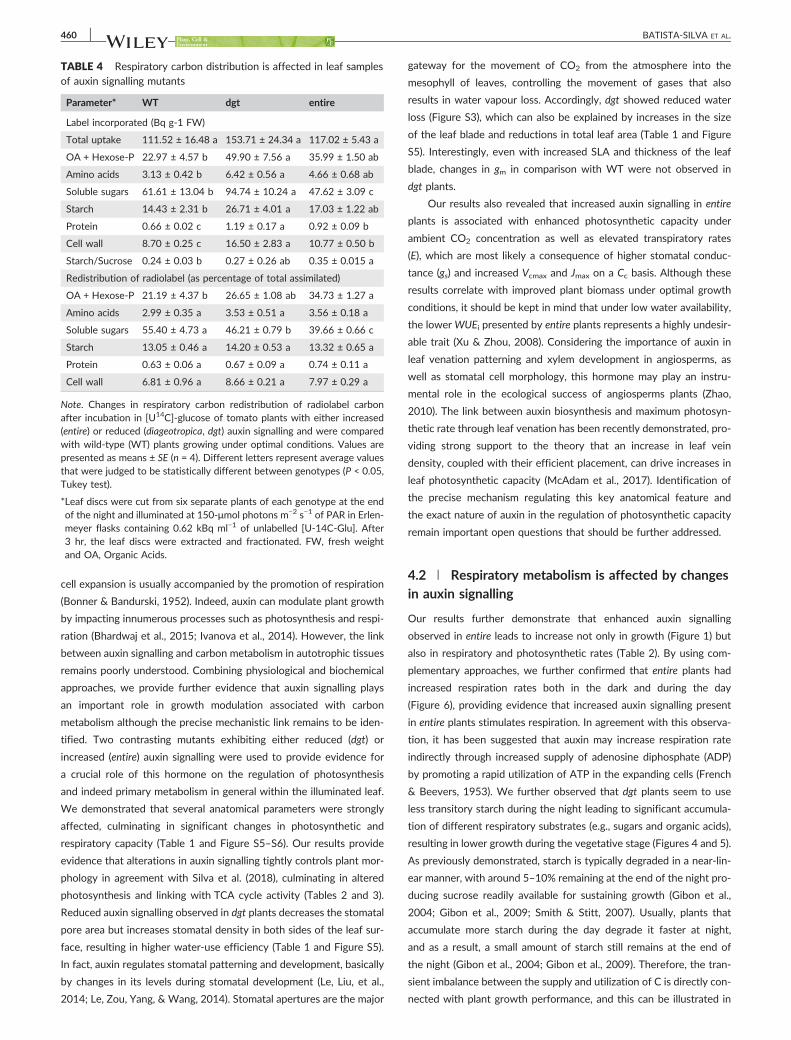
TABLE 4 Respiratory carbon distribution is affected in leaf samplesof auxin signalling mutants
Parameter* WT dgt entire
Label incorporated (Bq g‐1 FW)
Total uptake 111.52 ± 16.48 a 153.71 ± 24.34 a 117.02 ± 5.43 a
OA + Hexose‐P 22.97 ± 4.57 b 49.90 ± 7.56 a 35.99 ± 1.50 ab
Amino acids 3.13 ± 0.42 b 6.42 ± 0.56 a 4.66 ± 0.68 ab
Soluble sugars 61.61 ± 13.04 b 94.74 ± 10.24 a 47.62 ± 3.09 c
Starch 14.43 ± 2.31 b 26.71 ± 4.01 a 17.03 ± 1.22 ab
Protein 0.66 ± 0.02 c 1.19 ± 0.17 a 0.92 ± 0.09 b
Cell wall 8.70 ± 0.25 c 16.50 ± 2.83 a 10.77 ± 0.50 b
Starch/Sucrose 0.24 ± 0.03 b 0.27 ± 0.26 ab 0.35 ± 0.015 a
Redistribution of radiolabel (as percentage of total assimilated)
OA + Hexose‐P 21.19 ± 4.37 b 26.65 ± 1.08 ab 34.73 ± 1.27 a
Amino acids 2.99 ± 0.35 a 3.53 ± 0.51 a 3.56 ± 0.18 a
Soluble sugars 55.40 ± 4.73 a 46.21 ± 0.79 b 39.66 ± 0.66 c
Starch 13.05 ± 0.46 a 14.20 ± 0.53 a 13.32 ± 0.65 a
Protein 0.63 ± 0.06 a 0.67 ± 0.09 a 0.74 ± 0.11 a
Cell wall 6.81 ± 0.96 a 8.66 ± 0.21 a 7.97 ± 0.29 a
Note. Changes in respiratory carbon redistribution of radiolabel carbonafter incubation in [U14C]‐glucose of tomato plants with either increased(entire) or reduced (diageotropica, dgt) auxin signalling and were comparedwith wild‐type (WT) plants growing under optimal conditions. Values arepresented as means ± SE (n = 4). Different letters represent average valuesthat were judged to be statistically different between genotypes (P < 0.05,Tukey test).
*Leaf discs were cut from six separate plants of each genotype at the endof the night and illuminated at 150‐μmol photons m−2 s−1 of PAR in Erlen-meyer flasks containing 0.62 kBq ml−1 of unlabelled [U‐14C‐Glu]. After3 hr, the leaf discs were extracted and fractionated. FW, fresh weightand OA, Organic Acids.
460 BATISTA‐SILVA ET AL.
cell expansion is usually accompanied by the promotion of respiration
(Bonner & Bandurski, 1952). Indeed, auxin can modulate plant growth
by impacting innumerous processes such as photosynthesis and respi-
ration (Bhardwaj et al., 2015; Ivanova et al., 2014). However, the link
between auxin signalling and carbon metabolism in autotrophic tissues
remains poorly understood. Combining physiological and biochemical
approaches, we provide further evidence that auxin signalling plays
an important role in growth modulation associated with carbon
metabolism although the precise mechanistic link remains to be iden-
tified. Two contrasting mutants exhibiting either reduced (dgt) or
increased (entire) auxin signalling were used to provide evidence for
a crucial role of this hormone on the regulation of photosynthesis
and indeed primary metabolism in general within the illuminated leaf.
We demonstrated that several anatomical parameters were strongly
affected, culminating in significant changes in photosynthetic and
respiratory capacity (Table 1 and Figure S5–S6). Our results provide
evidence that alterations in auxin signalling tightly controls plant mor-
phology in agreement with Silva et al. (2018), culminating in altered
photosynthesis and linking with TCA cycle activity (Tables 2 and 3).
Reduced auxin signalling observed in dgt plants decreases the stomatal
pore area but increases stomatal density in both sides of the leaf sur-
face, resulting in higher water‐use efficiency (Table 1 and Figure S5).
In fact, auxin regulates stomatal patterning and development, basically
by changes in its levels during stomatal development (Le, Liu, et al.,
2014; Le, Zou, Yang, & Wang, 2014). Stomatal apertures are the major
gateway for the movement of CO2 from the atmosphere into the
mesophyll of leaves, controlling the movement of gases that also
results in water vapour loss. Accordingly, dgt showed reduced water
loss (Figure S3), which can also be explained by increases in the size
of the leaf blade and reductions in total leaf area (Table 1 and Figure
S5). Interestingly, even with increased SLA and thickness of the leaf
blade, changes in gm in comparison with WT were not observed in
dgt plants.
Our results also revealed that increased auxin signalling in entire
plants is associated with enhanced photosynthetic capacity under
ambient CO2 concentration as well as elevated transpiratory rates
(E), which are most likely a consequence of higher stomatal conduc-
tance (gs) and increased Vcmax and Jmax on a Cc basis. Although these
results correlate with improved plant biomass under optimal growth
conditions, it should be kept in mind that under low water availability,
the lower WUEi presented by entire plants represents a highly undesir-
able trait (Xu & Zhou, 2008). Considering the importance of auxin in
leaf venation patterning and xylem development in angiosperms, as
well as stomatal cell morphology, this hormone may play an instru-
mental role in the ecological success of angiosperms plants (Zhao,
2010). The link between auxin biosynthesis and maximum photosyn-
thetic rate through leaf venation has been recently demonstrated, pro-
viding strong support to the theory that an increase in leaf vein
density, coupled with their efficient placement, can drive increases in
leaf photosynthetic capacity (McAdam et al., 2017). Identification of
the precise mechanism regulating this key anatomical feature and
the exact nature of auxin in the regulation of photosynthetic capacity
remain important open questions that should be further addressed.
4.2 | Respiratory metabolism is affected by changesin auxin signalling
Our results further demonstrate that enhanced auxin signalling
observed in entire leads to increase not only in growth (Figure 1) but
also in respiratory and photosynthetic rates (Table 2). By using com-
plementary approaches, we further confirmed that entire plants had
increased respiration rates both in the dark and during the day
(Figure 6), providing evidence that increased auxin signalling present
in entire plants stimulates respiration. In agreement with this observa-
tion, it has been suggested that auxin may increase respiration rate
indirectly through increased supply of adenosine diphosphate (ADP)
by promoting a rapid utilization of ATP in the expanding cells (French
& Beevers, 1953). We further observed that dgt plants seem to use
less transitory starch during the night leading to significant accumula-
tion of different respiratory substrates (e.g., sugars and organic acids),
resulting in lower growth during the vegetative stage (Figures 4 and 5).
As previously demonstrated, starch is typically degraded in a near‐lin-
ear manner, with around 5–10% remaining at the end of the night pro-
ducing sucrose readily available for sustaining growth (Gibon et al.,
2004; Gibon et al., 2009; Smith & Stitt, 2007). Usually, plants that
accumulate more starch during the day degrade it faster at night,
and as a result, a small amount of starch still remains at the end of
the night (Gibon et al., 2004; Gibon et al., 2009). Therefore, the tran-
sient imbalance between the supply and utilization of C is directly con-
nected with plant growth performance, and this can be illustrated in
BATISTA‐SILVA ET AL. 461
mutants that are defective in the synthesis or degradation of starch.
As observed in dgt plants, in starchless mutants deffectives in Phos-
phoglucomutase (pgm), sugar accumulation is observed with a con-
comitant growth inhibition (Caspar, Huber, & Somerville, 1985;
Smith & Stitt, 2007; Stitt, Gibon, Lunn, & Piques, 2007). Additionally,
the adjustment of starch turnover to a decreased C supply must be
accompanied by a compensatory decrease in the rate of C utilization
for respiratory and growth process (Smith & Stitt, 2007; Stitt et al.,
2007; Stitt & Zeeman, 2012). The relationship between high respira-
tory rate and rapid growth could be explained, at least partially, by
the importance of the TCA cycle activity in the regulation of the pho-
tosynthesis in illuminated leaves, once the balance between C supply
and demand optimize the capacity to growth (Nunes‐Nesi, Araújo, &
Fernie, 2011; Smith & Stitt, 2007). Nevertheless, the metabolic and
molecular cues underlying such connections remain contentious, and
therefore, further work is still required to establish how exactly auxin
signalling is able to impact both photosynthesis and respiration.
A growing body of evidence shows that premature or incomplete
exhaustion of starch results in lower growth rates and that this bal-
ance requires appropriate changes in the rates of starch synthesis
and degradation (Smith & Stitt, 2007; Stitt & Zeeman, 2012). Even
small disturbances in leaf starch turnover affect metabolism and
growth. As such, incomplete exhaustion of starch during the night
(Figure 4) leading to an inefficient usage of carbon pool, coupled with
reduced respiration rates (Table 2) in dgt plants, might explain, at least
partially, the reduced growth observed (Figure 2). Considering that
starch is a major integrator in the regulation of plant growth to cope
with fluctuations in the C and energy status of the plant (Sulpice
et al., 2009), it is not surprising that starch biosynthesis in leaves is
highly regulated at multiple levels in response to distinct signals
including sugars and hormones such as cytokinins (Bahaji et al.,
2015), abscisic acid (Ramon, Rolland, Thevelein, Van Dijck, & Leyman,
2007), brassinosteroids (Oh et al., 2011), and more recently, also auxin
(Mishra, Singh, Aggrawal, & Laxmi, 2009; Sagar et al., 2013). More-
over, auxin acts as a repressor of starch accumulation directly by neg-
atively controlling the expression of ADP‐glucose pyrophospohrylase
in an antagonistic manner to cytokinin (Miyazawa et al., 1999). In
the same vein, Sagar et al. (2013) have shown that AUXIN RESPON-
SIVE FACTOR 4 (ARF4) is involved in the control of the sugar content
of tomato fruits, mainly by upregulation of genes and enzyme activi-
ties involved in starch biosynthesis, especially genes coding for ADP‐
glucose pyrophospohrylase. In rice, an auxin response factor,
OSARF18, plays a positive role of auxin signalling in starch synthesis
(Huang, Li, & Zhao, 2016). Moreover, in tobacco cells treated with
exogenous auxin, downregulation of starch‐related genes was
observed (Miyazawa et al., 1999). In root tips of Arabidopsis, starch
granule production is inhibited by the constitutive expression of an
auxin action repressor from rice (Luo et al., 2015).
These findings indicate that auxin most likely impacts starch accu-
mulation upstream of starch biosynthesis and degradation. The precise
pattern of consumption of starch during the night in entire plants
(Figure 4) coupled with enhanced respiration rates (Table 2) might also
explain why higher biomass was observed in this genotype. It should
also be mentioned that the profile of both organic acids and amino
acids as well as polyamines was strongly affected in entire plants.
The majority of organic acids including citrate, isocitrate, 2‐
oxoglutarate, succinate, and fumarate were decreased in entire plants,
whereras branched‐chain amino acids were reduced only in the dgt
mutant, with few variations on TCA cycle intermediates, suggesting
that dgt mutant is using branched‐chain amino acids more efficiently
as alternative respiratory substrates. Accordingly, carbon skeletons
from amino acids can be converted to precursors or intermediates of
the TCA cycle to support mitochondrial metabolism and ATP biosyn-
thesis, whereas oxidation of certain amino acids (e.g., leucine, isoleu-
cine, valine, lysine, and proline) can directly provide electrons into
the mitochondrial electron transport chain (Araújo et al., 2010,
Hildebrandt, Nunes‐Nesi, Araújo, & Braun, 2015). As such, the ele-
vated Rd and RL (Figure 6 and Table 2) coupled with changes in the
evolution of radiolabeled CO2 observed in entire plants provide further
support to our hypothesis that the TCA cycle is working faster in the
auxin signalling enhanced entire mutant. In good agreement with our
results obtained in terms of growth and metabolic adjustments in
auxin signalling mutants, we also identified an interestingly accumula-
tion of polyamines (PAs), mainly in entire mutant (Figure 5 and Table
S5). Notably, PAs plays a pivotal role in the regulation of plant devel-
opment, and it is involved inseveral physiological processes (Kusano,
Yamaguchi, Berberich, & Takahashi, 2007). Together with glutamine
and orthithine, PAs are part of the overall metabolism of nitrogenous
compounds, and accordingly, putrescine, spermidine, and spermine
are associated with nitrate nutrition, acting as a metabolic buffer and
maintaining the cellular pH under conditions where ammonium assim-
ilation occurs (Altman & Levin, 1993). In leaves, glutamate, glutamine,
aspartate, and asparagine are primary products of nitrogen assimila-
tion and therefore contributing to plant growth and biomass accumu-
lation (Lam et al., 1995). Our results suggest therefore that increasing
auxin signalling by changes in IAA9 expression impacts nitrogen
metabolism and increases plant growth partly explained by the action
of PAs triggering plant growth and development (Marco, Alcázar,
Tiburcio, & Carrasco, 2011). In contrast, dgt does not seem to be
affected when compared with WT, which can, at least partially, be
explained by the relatively few changes in TCA cycle intermediates
or even in amino acids involved in nitrogen metabolism. Finally,
changes in gene expression that only occur in the entire mutant could
be potentially good candidates for explaining physiological and meta-
bolic changes that occur only in this mutant, such as the consequences
of auxin on PA and nitrogen metabolism.
4.3 | DGT modulates Aux/IAA and ARF families geneexpression
Given the strong auxin‐associated phenotypes of the mutants, we
investigated the effect of downregulation of the SlIAA9 (entire) and
DGT on the expression of auxin responsive genes. The downregulation
of SIIAA9 resulted in alteration of several genes members of the same
family such as IAA2, IAA3, IAA19, and IAA29 as well as the GH3 gene,
which is related to auxin homeostasis. Accordingly, the mutation in
SlIAA9 seems to alter the expression pattern of other genes from the
same family, once the endogenous levels of auxin are differentially
perceived, selectively controlling the expression of SlIAA3 (Wang
et al., 2009). Moreover, this downregulation also increases the
462 BATISTA‐SILVA ET AL.
expression of SlIAA19 and SlIAA29, as well as ARF2 and ARF8, which
may contribute to the reduced auxin‐responsiveness in IAA3 mutant
plants (Chaabouni et al., 2009). Our findings strongly support the
hypothesis that different members of the Aux/IAA family are involved
in distinct developmental processes, which can be considered as an
important gene family to be further investigated in order to elucidate
their agricultural importance.
The mutation in DIAGEOTROPICA appears to be able not only to
modulate the expression of the genes of the Aux/IAA family, as shown
before by Nebenführ, White, and Lomax (2000), but also to affect the
expression of members of the ARFs family (ARF8 and ARF10; Figure 2).
Collectively, our results confirm that dgt participates in auxin signal
transduction and suggest a specific controlling mechanism in ARF
gene family. Additionaly, our results also suggest that the lack of dgt
function can also regulate SlARFs genes increasing the expression of
SlARF8 and SlARF10, which are both expressed in leaves. The ARF
gene family specifically controls auxin‐dependent biological responses
(Zouine et al., 2014). Interestingly, both SlARF8 and SlARF10 are
involved in similar processes during plant growth and development.
The expression profile observed here suggests that the product of
DGT seems to be not only an important player in leaf metabolism
(Figure 5) but is also able to modulate important genes associated with
fruit set and yield (Figure 2).
5 | CONCLUDING REMARKS
In summary, our study brings novel insights into the ability of auxin
signalling genes to control plant growth by adjusting leaf development
and central metabolism, simultaneously impacting both photosyn-
thetic and respiratory metabolism. Taken together, our findings indi-
cated that auxin signalling is a regulatory control point of not only
developmental but also metabolic processes including mitochondrial
and chloroplastidic metabolism in autotrophic tissues. Remarkably,
changes in auxin signalling are likely to impact not only carbon assim-
ilation and growth but also how plants rely on organic acids and amino
acid metabolism to support respiratory processes coupled to changes
in starch metabolism. Collectively, the results presented here demon-
strated that changes in auxin signalling are of crucial significance in
the regulation of both anatomical and physiological aspects that are
seemingly important to mediate plant growth and function. Our obser-
vations also highlight the integration of primary metabolisms and plant
development as a novel avenue in auxin signalling manipulation for
agronomic purposes. However, further experimentation focusing at
the level of guard cell development and function in response to
changes in auxin signalling will be required to fully define the precise
mechanism by which energy metabolism and hormone‐mediated con-
trol of growth are associated, as well as the significance of this con-
nection in response to suboptimal environmental conditions.
ACKNOWLEDGMENTS
Discussions with Prof. Dimas M. Ribeiro, Prof. Fábio M. DaMatta, and
Prof. Samuel C.V. Martins (all from Universidade Federal de Viçosa,
Brazil) were highly valuable in the development of this work. This
work was supported by funding from the Max Planck Society (to W.
L. A.), the Conselho Nacional de Desenvolvimento Científico e
Tecnológico (CNPq‐Brazil to W. L. A.), the Fundação de Amparo à
Pesquisa do Estado de Minas Gerais (FAPEMIG‐Brazil, Grants APQ‐
01078‐15 and APQ‐01357‐14 to A. N. N. and W. L. A.), and the
Foundation for Research Assistance of the São Paulo State (FAPESP‐
Brazil, grant 2014/16553‐1). We also thank the scholarships granted
by the Brazilian Federal Agency for Support and Evaluation of Gradu-
ate Education (CAPES‐Brazil) to W. B. S. D. B. M. was supported by a
CAPES post‐doctoral grant. Research fellowships granted by CNPq‐
Brazil to A. N. N. and W. L. A. are also gratefully acknowledged.
ORCID
Willian Batista‐Silva http://orcid.org/0000-0003-1144-1656
Adriano Nunes‐Nesi http://orcid.org/0000-0002-9581-9355
Wagner L. Araújo http://orcid.org/0000-0002-4796-2616
REFERENCES
Altman, A., & Levin, N. (1993). Interactions of polyamines and nitrogennutrition in plants. Physiologia Plantarum, 89, 653–658.
ap Rees, T., & Beevers, H. (1960). Pathways of glucose dissimilation in car-rot slices. Plant Physiology, 35, 830–838.
Araújo, W. L., Ishizaki, K., Nunes‐Nesi, A., Larson, T. R., Tohge, T., Krahnert,I., … Graham, I. A. (2010). Identification of the 2‐hydroxyglutarate andisovaleryl‐CoA dehydrogenases as alternative electron donors linkinglysine catabolism to the electron transport chain of Arabidopsis mito-chondria. The Plant Cell, 22, 1549–1563.
Araújo, W. L., Nunes‐Nesi, A., Nikoloski, Z., Sweetlove, L. J., & Fernie, A. R.(2012). Metabolic control and regulation of the tricarboxylic acid cyclein photosynthetic and heterotrophic plant tissues. Plant, Cell & Environ-ment, 35, 1–21.
Araújo, W. L., Nunes‐Nesi, A., Osorio, S., Usadel, B., Fuentes, D., Nagy, R.,… Tohge, T. (2011). Antisense inhibition of the iron‐sulphur subunit ofsuccinate dehydrogenase enhances photosynthesis and growth intomato via an organic acid–mediated effect on stomatal aperture. ThePlant Cell, 23, 600–627.
Audran‐Delalande, C., Bassa, C., Mila, I., Regad, F., Zouine, M., & Bouzayen,M. (2012). Genome‐wide identification, functional analysis and expres-sion profiling of the Aux/IAA gene family in tomato. Plant and CellPhysiology, 53, 659–672.
Bahaji, A., Sánchez‐López, Á. M., De Diego, N., Muñoz, F. J., Baroja‐Fernández, E., Li, J., … Almagro, G. (2015). Plastidic phosphoglucoseisomerase is an important determinant of starch accumulation in meso-phyll cells, growth, photosynthetic capacity, and biosynthesis ofplastidic cytokinins in Arabidopsis. PLoS One, 10, e0119641.
Batista Silva, W., Daloso, D. M., Fernie, A. R., Nunes‐Nesi, A., & Araújo, W.L. (2016). Can stable isotope mass spectrometry replace radiolabelledapproaches in metabolic studies? Plant Science, 249, 59–69.
Berger, D., & Altmann, T. (2000). A subtilisin‐like serine protease involvedin the regulation of stomatal density and distribution in Arabidopsisthaliana. Genes & Development, 14, 1119–1131.
Berkowitz, O., De Clercq, I., Van Breusegem, F., & Whelan, J. (2016). Inter-action between hormonal and mitochondrial signalling during growth,development and in plant defence responses. Plant, Cell & Environment,39, 1127–1139.
Bhardwaj, R., Kaur, R., Bali, S., Kaur, P., Sirhindi, G., Thukral, A. K., … Vig, A.P. (2015). Role of various hormones in photosynthetic responses ofgreen plants under environmental stresses. Current Protein and PeptideScience, 16, 435–449.
Bonner, J., & Bandurski, R. S. (1952). Studies of the physiology, pharmacol-ogy, and biochemistry of the auxins. Annual Review of Plant Physiology,3, 59–86.
BATISTA‐SILVA ET AL. 463
Carvalho, R. F., Campos, M. L., Pino, L. E., Crestana, S. L., Zsögön, A., Lima,J. E., … Peres, L. E. (2011). Convergence of developmental mutants intoa single tomato model system:'Micro‐Tom'as an effective toolkit forplant development research. Plant Methods, 7, 18.
Caspar, T., Huber, S. C., & Somerville, C. (1985). Alterations in growth, pho-tosynthesis, and respiration in a starchless mutant of Arabidopsisthaliana (L.) deficient in chloroplast phosphoglucomutase activity. PlantPhysiology, 79, 11–17.
Chaabouni, S., Jones, B., Delalande, C., Wang, H., Li, Z., Mila, I., …Bouzayen, M. (2009). Sl‐IAA3, a tomato Aux/IAA at the crossroads ofauxin and ethylene signalling involved in differential growth. Journalof Experimental Botany, 60, 1349–1362.
Christian, M., Steffens, B., Schenck, D., & Lüthen, H. (2003). Thediageotropica mutation of tomato disrupts a signalling chain usingextracellular auxin binding protein 1 as a receptor. Planta, 218,309–314.
Davis, P. (2005). Plant hormones: Biosynthesis, signal transduction, action.The Netherlands: Publisher Springer.
Delker, C., Raschke, A., & Quint, M. (2008). Auxin dynamics: the dazzlingcomplexity of a small molecule's message. Planta, 227(5), 929–941.
Devoghalaere, F., Doucen, T., Guitton, B., Keeling, J., Payne, W., Ling, T. J.,… Dayatilake, G. (2012). A genomics approach to understanding therole of auxin in apple (Malus x domestica) fruit size control. BMC PlantBiology, 12, 7.
Enders, T. A., & Strader, L. C. (2015). Auxin activity: Past, present, andfuture. American Journal of Botany, 102, 180–196.
Ethier, G., & Livingston, N. (2004). On the need to incorporate sensitivityto CO2 transfer conductance into the Farquhar–von Caemmerer–Berry leaf photosynthesis model. Plant, Cell & Environment, 27,137–153.
Farquhar, G.v., von Caemmerer, S.v., & Berry, J. (1980). A biochemicalmodel of photosynthetic CO2 assimilation in leaves of C3 species.Planta, 149, 78–90.
Feder, N., & O'brien, T. (1968). Plant microtechnique: Some principles andnew methods. American Journal of Botany, 55, 123–142.
Fernie, A. R., Aharoni, A., Willmitzer, L., Stitt, M., Tohge, T., Kopka, J., …DeLuca, V. (2011). Recommendations for reporting metabolite data.The Plant Cell, 23, 2477–2482.
Fernie, A. R., Roscher, A., Ratcliffe, R. G., & Kruger, N. J. (2001). Fructose 2,6‐bisphosphate activates pyrophosphate: fructose‐6‐phosphate 1‐phosphotransferase and increases triose phosphate to hexose phos-phate cycling in heterotrophic cells. Planta, 212, 250–263.
Fernie, A. R., Trethewey, R. N., Krotzky, A. J., & Willmitzer, L. (2004).Metabolite profiling: from diagnostics to systems biology. NatureReviews Molecular Cell Biology, 5, 763–769.
French, R. C., & Beevers, H. (1953). Respiratory and growth responsesinduced by growth regulators and allied compounds. American Journalof Botany, 40, 660–666.
Gao, J., Cao, X., Shi, S., Ma, Y., Wang, K., Liu, S., … Ma, H. (2016). Genome‐wide survey of Aux/IAA gene family members in potato (Solanumtuberosum): Identification, expression analysis, and evaluation of theirroles in tuber development. Biochemical and Biophysical Research Com-munications, 471, 320–327.
Genty, B., Briantais, J.‐M., & Baker, N. R. (1989). The relationship betweenthe quantum yield of photosynthetic electron transport and quenchingof chlorophyll fluorescence. Biochimica et Biophysica Acta (BBA) ‐ Gen-eral Subjects, 990, 87–92.
Gibon, Y., Bläsing, O. E., Palacios‐Rojas, N., Pankovic, D., Hendriks, J. H.,Fisahn, J., … Stitt, M. (2004). Adjustment of diurnal starch turnover toshort days: Depletion of sugar during the night leads to a temporaryinhibition of carbohydrate utilization, accumulation of sugars andpost‐translational activation of ADP‐glucose pyrophosphorylase inthe following light period. The Plant Journal, 39, 847–862.
Gibon, Y., Pyl, E. T., Sulpice, R., Lunn, J. E., Hoehne, M., Guenther, M., &Stitt, M. (2009). Adjustment of growth, starch turnover, protein
content and central metabolism to a decrease of the carbon supplywhen Arabidopsis is grown in very short photoperiods. Plant, Cell &Environment, 32, 859–874.
Gilbert, M. E., Pou, A., Zwieniecki, M. A., & Holbrook, N. M. (2012). Onmeasuring the response of mesophyll conductance to carbon dioxidewith the variable J method. Journal of Experimental Botany, 63,413–425.
Grassi, G., & Magnani, F. (2005). Stomatal, mesophyll conductance and bio-chemical limitations to photosynthesis as affected by drought and leafontogeny in ash and oak trees. Plant, Cell & Environment, 28, 834–849.
Harley, P. C., Loreto, F., Di Marco, G., & Sharkey, T. D. (1992). Theoreticalconsiderations when estimating the mesophyll conductance to CO2flux by analysis of the response of photosynthesis to CO2. Plant Phys-iology, 98, 1429–1436.
Hedden, P., & Thomas, S. G. (2008). Annual plant reviews, plant hormone sig-naling (Vol. 24). John Wiley & Sons.
Hermida‐Carrera, C., Kapralov, M. V., & Galmés, J. (2016). Rubisco catalyticproperties and temperature response in crops. Plant Physiology, 171,2549–2561.
Hildebrandt, T. M., Nunes‐Nesi, A., Araújo, W. L., & Braun, H.‐P. (2015).Amino acid catabolism in plants. Molecular Plant, 8, 1563–1579.
Huang, G., Li, T., Li, X., Tan, D., Jiang, Z., Wei, Y., … Wang, A. (2014). Com-parative transcriptome analysis of climacteric fruit of Chinese pear(Pyrus ussuriensis) reveals new insights into fruit ripening. PLoS One,9, e107562.
Huang, J., Li, Z., & Zhao, D. (2016). Deregulation of the OsmiR160 targetgene OsARF18 causes growth and developmental defects with analteration of auxin signaling in rice. Scientific Reports, 6, 29938.
Hunt, R., Causton, D., Shipley, B., & Askew, A. (2002). A modern tool forclassical plant growth analysis. Annals of Botany, 90, 485–488.
Ivanchenko, M. G., Zhu, J., Wang, B., Medvecká, E., Du, Y., Azzarello, E., …Dubrovsky, J. G. (2015). The cyclophilin A DIAGEOTROPICA geneaffects auxin transport in both root and shoot to control lateral rootformation. Development, 142, 712–721.
Ivanova, A., Law, S. R., Narsai, R., Duncan, O., Lee, J.‐H., Zhang, B., …Radomiljac J.D.;van der Merwe M. & Yi K. (2014). A functional antago-nistic relationship between auxin and mitochondrial retrogradesignaling regulates alternative oxidase1a expression in Arabidopsis.Plant Physiology, 165, 1233–1254.
Jing, H., Yang, X., Zhang, J., Liu, X., Zheng, H., Dong, G., … Qian, Q. (2015).Peptidyl‐prolyl isomerization targets rice Aux/IAAs for proteasomaldegradation during auxin signalling. Nature Communications, 6.
Kelly, M. O., & Bradford, K. J. (1986). Insensitivity of the diageotropicatomato mutant to auxin. Plant Physiology, 82, 713–717.
Kopka, J., Schauer, N., Krueger, S., Birkemeyer, C., Usadel, B., Bergmüller,E., … Stitt, M. (2004). GMD@ CSB. . DB: The Golm Metabolome Data-base. Bioinformatics, 21, 1635–1638.
Kusano, T., Yamaguchi, K., Berberich, T., & Takahashi, Y. (2007). Advancesin polyamine research in 2007. Journal of Plant Research, 120,345–350.
Lam, H.‐M., Coschigano, K., Schultz, C., Melo‐Oliveira, R., Tjaden, G.,Oliveira, I., … Coruzzi, G. (1995). Use of Arabidopsis mutants and genesto study amide amino acid biosynthesis. The Plant Cell, 7, 887–898.
Laskowski, M., Grieneisen, V. A., Hofhuis, H., Colette, A., Hogeweg, P.,Marée, A. F., & Scheres, B. (2008). Root system architecture from cou-pling cell shape to auxin transport. PLoS Biology, 6, e307.
Lavy, M., Prigge, M. J., Tigyi, K., & Estelle, M. (2012). The cyclophilinDIAGEOTROPICA has a conserved role in auxin signaling. Develop-ment, 139, 1115–1124.
Le, J., Liu, X.‐G., Yang, K.‐Z., Chen, X.‐L., Zou, J.‐J., Wang, H.‐Z., … Sack, F.(2014). Auxin transport and activity regulate stomatal patterning anddevelopment. Nature Communications, 5.
Le, J., Zou, J., Yang, K., & Wang, M. (2014). Signaling to stomatal initiationand cell division. Regulation of Cell Fate Determination in Plants, 56.
464 BATISTA‐SILVA ET AL.
Leonova, L., Gamburg, K., Vojnikov, V., & Varakina, N. (1985). Promotion ofrespiration by auxin in the induction of cell division in suspension cul-ture. Journal of Plant Growth Regulation, 4, 169–176.
Leyser, O. (2017). Auxin Signaling. Plant Physiology. https://doi.org/10.1104/pp.17.00765
Li, J., Khan, Z. U., Tao, X., Mao, L., Luo, Z., & Ying, T. (2017). Effects ofexogenous auxin on pigments and primary metabolite profile of post-harvest tomato fruit during ripening. Scientia Horticulturae, 219, 90–97.
Lisec, J., Schauer, N., Kopka, J., Willmitzer, L., & Fernie, A. R. (2006). Gaschromatography mass spectrometry–based metabolite profiling inplants. Nature Protocols, 1, 387–396.
Logan, B. A., Adams, W. W., & Demmig‐Adams, B. (2007). Viewpoint:Avoiding common pitfalls of chlorophyll fluorescence analysis underfield conditions. Functional Plant Biology, 34, 853–859.
Long, S., & Bernacchi, C. (2003). Gas exchange measurements, what canthey tell us about the underlying limitations to photosynthesis? Proce-dures and sources of error. Journal of Experimental Botany, 54,2393–2401.
Luedemann, A., von Malotky, L., Erban, A., & Kopka, J. (2011). TagFinder:Preprocessing software for the fingerprinting and the profiling of gaschromatography–mass spectrometry based metabolome analyses. InPlant Metabolomics (pp. 255–286). Springer.
Luo, S., Li, Q., Liu, S., Pinas, N. M., Tian, H., & Wang, S. (2015). Constitutiveexpression of OsIAA9 affects starch granules accumulation and rootgravitropic response in Arabidopsis. Frontiers in Plant Science, 6, 1156.
Lytovchenko, A., Sweetlove, L., Pauly, M., & Fernie, A. R. (2002). The influ-ence of cytosolic phosphoglucomutase on photosyntheticcarbohydrate metabolism. Planta, 215, 1013–1021.
Marco, F., Alcázar, R., Tiburcio, A. F., & Carrasco, P. (2011). Interactionsbetween polyamines and abiotic stress pathway responses unraveledby transcriptome analysis of polyamine overproducers. OMICS, 15,775–781.
McAdam, S. A., Eléouët, M. P., Best, M., Brodribb, T. J., Murphy, M. C.,Cook, S. D., … Gill, W. M. (2017). Linking auxin with photosyntheticrate via leaf venation. Plant Physiology, 175, 351–360.
Medeiros, D. B., Martins, S. C., Cavalcanti, J. H. F., Daloso, D. M., Martinoia,E., Nunes‐Nesi, A., … Araújo, W. L. (2016). Enhanced photosynthesisand growth in atquac1 knockout mutants are due to altered organicacid accumulation and an increase in both stomatal and mesophyll con-ductance. Plant Physiology, 170, 86–101.
Millar, A. H., Whelan, J., Soole, K. L., & Day, D. A. (2011). Organization andregulation of mitochondrial respiration in plants. Annual Review of PlantBiology, 62, 79–104.
Mishra, B. S., Singh, M., Aggrawal, P., & Laxmi, A. (2009). Glucose and auxinsignaling interaction in controlling Arabidopsis thaliana seedlings rootgrowth and development. PLoS One, 4, e4502.
Miyazawa, Y., Sakai, A., Miyagishima, S.‐Y., Takano, H., Kawano, S., &Kuroiwa, T. (1999). Auxin and cytokinin have opposite effects on amy-loplast development and the expression of starch synthesis genes incultured bright yellow‐2 tobacco cells. Plant Physiology, 121, 461–470.
Muday, G. K., Lomax, T. L., & Rayle, D. L. (1995). Characterization of thegrowth and auxin physiology of roots of the tomato mutant,diageotropica. Planta, 195, 548–553.
Murashige, T., & Skoog, F. (1962). A revised medium for rapid growth andbio assays with tobacco tissue cultures. Physiologia Plantarum, 15,473–497.
Nebenführ, A., White, T., & Lomax, T. L. (2000). The diageotropica muta-tion alters auxin induction of a subset of the Aux/IAA gene family intomato. Plant Molecular Biology, 44, 73–84.
Niinemets, Ü., Díaz‐Espejo, A., Flexas, J., Galmés, J., & Warren, C. R. (2009).Role of mesophyll diffusion conductance in constraining potential pho-tosynthetic productivity in the field. Journal of Experimental Botany, 60,2249–2270.
Nunes‐Nesi, A., Araújo, W. L., & Fernie, A. R. (2011). Targeting mitochon-drial metabolism and machinery as a means to enhancephotosynthesis. Plant Physiology, 155, 101–107.
Nunes‐Nesi, A., Carrari, F., Gibon, Y., Sulpice, R., Lytovchenko, A., Fisahn,J., … Fernie, A. R. (2007). Deficiency of mitochondrial fumarase activityin tomato plants impairs photosynthesis via an effect on stomatal func-tion. The Plant Journal, 50, 1093–1106.
Nunes‐Nesi, A., Carrari, F., Lytovchenko, A., Smith, A. M., Loureiro, M. E.,Ratcliffe, R. G., … Fernie, A. R. (2005). Enhanced photosynthetic perfor-mance and growth as a consequence of decreasing mitochondrialmalate dehydrogenase activity in transgenic tomato plants. Plant Phys-iology, 137, 611–622.
Oh, K., Ivanchenko, M. G., White, T., & Lomax, T. L. (2006). Thediageotropica gene of tomato encodes a cyclophilin: A novel player inauxin signaling. Planta, 224, 133–144.
Oh, M.‐H., Sun, J., Oh, D. H., Zielinski, R. E., Clouse, S. D., & Huber, S. C.(2011). Enhancing Arabidopsis leaf growth by engineering theBRASSINOSTEROID INSENSITIVE1 receptor kinase. Plant Physiology,157, 120–131.
Paponov, I. A., Paponov, M., Teale, W., Menges, M., Chakrabortee, S., Mur-ray, J. A., & Palme, K. (2008). Comprehensive transcriptome analysis ofauxin responses in Arabidopsis. Molecular Plant, 1, 321–337.
Plaxton, W. C., & Tran, H. T. (2011). Metabolic adaptations of phosphate‐starved plants. Plant Physiology, 156, 1006–1015.
Pons, T. L., Flexas, J., Von Caemmerer, S., Evans, J. R., Genty, B., Ribas‐Carbo, M., & Brugnoli, E. (2009). Estimating mesophyll conductanceto CO2: Methodology, potential errors, and recommendations. Journalof Experimental Botany, 60(8), erp081.
Porra, R., Thompson, W., & Kriedemann, P. (1989). Determination of accu-rate extinction coefficients and simultaneous equations for assayingchlorophylls a and b extracted with four different solvents: Verificationof the concentration of chlorophyll standards by atomic absorptionspectroscopy. Biochimica et Biophysica Acta (BBA)‐Bioenergetics, 975,384–394.
Quint, M., & Gray, W. M. (2006). Auxin signaling. Current Opinion in PlantBiology, 9, 448–453.
Ramon, M., Rolland, F., Thevelein, J. M., Van Dijck, P., & Leyman, B. (2007).ABI4 mediates the effects of exogenous trehalose on Arabidopsisgrowth and starch breakdown. Plant Molecular Biology, 63, 195–206.
Rice, M. S., & Lomax, T. L. (2000). The auxin‐resistant diageotropica mutantof tomato responds to gravity via an auxin‐mediated pathway. Planta,210, 906–913.
Rodeghiero, M., Niinemets, Ü., & Cescatti, A. (2007). Major diffusion leaksof clamp‐on leaf cuvettes still unaccounted: How erroneous are theestimates of Farquhar et al. model parameters? Plant, Cell & Environ-ment, 30, 1006–1022.
Roessner, U., Luedemann, A., Brust, D., Fiehn, O., Linke, T., Willmitzer, L., &Fernie, A. R. (2001). Metabolic profiling allows comprehensive pheno-typing of genetically or environmentally modified plant systems. ThePlant Cell, 13, 11–29.
Sagar, M., Chervin, C., Mila, I., Hao, Y., Roustan, J.‐P., Benichou, M., …Latché, A. (2013). SlARF4, an auxin response factor involved in thecontrol of sugar metabolism during tomato fruit development. PlantPhysiology, 161, 1362–1374.
Schneider, C. A., Rasband, W. S., & Eliceiri, K. W. (2012). NIH Image toImageJ: 25 years of image analysis. Nature Methods, 9, 671–675.
Sharkey, T. D., Bernacchi, C. J., Farquhar, G. D., & Singsaas, E. L. (2007).Fitting photosynthetic carbon dioxide response curves for C3 leaves.Plant, Cell & Environment, 30, 1035–1040.
Silva, W. B., Vicente, M. H., Robledo, J. M., Reartes, D. S., Ferrari, R. C.,Bianchetti, R. E., … Zsögön, A. (2018). SELF‐PRUNING Acts Synergisti-cally with DIAGEOTROPICA to guide auxin responses and propergrowth form. Plant Physiology, 176, 2904–2916.
Smith, A. M., & Stitt, M. (2007). Coordination of carbon supply and plantgrowth. Plant, Cell & Environment, 30, 1126–1149.

BATISTA‐SILVA ET AL. 465
Stitt, M., Gibon, Y., Lunn, J., & Piques, M. (2007). Multilevel genomics anal-ysis of carbon signaling during diurnal cycles: Balancing supply andutilization by responding to changes in the nonlimiting range. Func-tional Plant Biology, 34, 526–549.
Stitt, M., & Zeeman, S. C. (2012). Starch turnover: Pathways, regulation androle in growth. Current Opinion in Plant Biology, 15, 282–292.
Sulpice, R., Pyl, E.‐T., Ishihara, H., Trenkamp, S., Steinfath, M., Witucka‐Wall, H., … Piques, M. C. (2009). Starch as a major integrator in the reg-ulation of plant growth. Proceedings of the National Academy ofSciences, 106, 10348–10353.
Thimann, K. V. (1977). Hormone action in the whole life of plants. Amherst:Univ of Massachusetts Press.
Vanneste, S., & Friml, J. (2009). Auxin: A trigger for change in plant devel-opment. Cell, 136, 1005–1016.
von Groll, U., Berger, D., & Altmann, T. (2002). The subtilisin‐like serineprotease SDD1 mediates cell‐to‐cell signaling during Arabidopsis sto-matal development. The Plant Cell, 14, 1527–1539.
Wang, H., Jones, B., Li, Z., Frasse, P., Delalande, C., Regad, F., … Bouzayen,M. (2005). The tomato Aux/IAA transcription factor IAA9 is involved infruit development and leaf morphogenesis. The Plant Cell Online, 17,2676–2692.
Wang, H., Schauer, N., Usadel, B., Frasse, P., Zouine, M., Hernould, M., …Bouzayen, M. (2009). Regulatory features underlying pollination‐dependent and‐independent tomato fruit set revealed by transcriptand primary metabolite profiling. The Plant Cell, 21, 1428–1452.
Wong, S.‐L., Chen, C.‐W., Huang, H.‐W., & Weng, J.‐H. (2012). Usingcombined measurements of gas exchange and chlorophyll fluores-cence to investigate the photosynthetic light responses of plantspecies adapted to different light regimes. Photosynthetica, 50,206–214.
Xu, Z., & Zhou, G. (2008). Responses of leaf stomatal density to water sta-tus and its relationship with photosynthesis in a grass. Journal ofExperimental Botany, 59, 3317–3325.
Zanor, M. I., Osorio, S., Nunes‐Nesi, A., Carrari, F., Lohse, M., Usadel, B., …Willmitzer, L. (2009). RNA interference of LIN5 in tomato confirms itsrole in controlling Brix content, uncovers the influence of sugars onthe levels of fruit hormones, and demonstrates the importance ofsucrose cleavage for normal fruit development and fertility. Plant Phys-iology, 150, 1204–1218.
Zhao, Y. (2010). Auxin biosynthesis and its role in plant development.Annual Review of Plant Biology, 61, 49–64.
Zheng, H., Li, S., Ren, B., Zhang, J., Ichii, M., Taketa, S., … Wang, H. (2013).LATERAL ROOTLESS2, a cyclophilin protein, regulates lateral root initi-ation and auxin signaling pathway in rice.Molecular Plant, 6, 1719–1721.
Zobel, R. (1973). Some physiological characteristics of the ethylene‐requir-ing tomato mutant diageotropica. Plant Physiology, 52, 385–389.
Zouine, M., Fu, Y., Chateigner‐Boutin, A.‐L., Mila, I., Frasse, P., Wang, H., …Bouzayen, M. (2014). Characterization of the tomato ARF gene familyuncovers a multi‐levels post‐transcriptional regulation including alter-native splicing. PLoS One, 9, e84203.
SUPPORTING INFORMATION
Additional supporting information may be found online in the
Supporting Information section at the end of the article.
How to cite this article: Batista‐Silva W, Medeiros DB, Rodri-
gues‐Salvador A, et al. Modulation of auxin signalling through
DIAGETROPICA and ENTIRE differentially affects tomato plant
growth via changes in photosynthetic and mitochondrial
metabolism. Plant Cell Environ. 2019;42:448–465. https://doi.
org/10.1111/pce.13413