Modelling oil formation and migration in the southern part of the Suez rift, Egypt
14
Ad,-ances 10 Orgaole Geocbemlstry 1985 O,g. Geocllem. Vol. 10, pp. 1986 Printed in Great Britain. Ail rights reserved 0146·6380/8653.00 +0.00 Copyright © 1986 Pergamoo Journals Ltd Modelling oil formation and migration in the southern part of the Suez rift, Egypt P. UNGERER 1 , P. Y. CHÉh'ET I , I. MORETTI 1 , A. CHIARELU 2 and J. L. OUDIN 3 IInstitut Francais du Pétrole, 1--4 av. de Bois Préau, 92506 Rueil-Malmaison Cedex, France 2ELF-SNEAP, Tour Elf, 92080 Paris La Défense, France 3TOTAL, 228 av. du Haut Lévèque, 33605 Pessac Cedex, France (Received 18 September 1985; accepted 15 April 1986) Abstract-in order to improve the understanding of the formation and occurrence of hydrocarbons in the Suez sedimentary basin, the whole chain of geological processes leading to the accumulation of oil is reconstructed by the use of geological mathematical models. At first, a geodynamic model of rift formation considering the mantellic convection is used to compute the variations of heat fiow through time. A second step is the reconstruction of temperature lhrough time for each point of the basin. This is achieved bya model of heat transfer across the sediments, that makes use of the previously computed heat nows. Finally, the paleotemperatures are used in a third mathemalical model that represents the formation and migration of hydrocarbons in two dimensions. The amounts of oil generated are computed from a kinetic model and the migration of oil is computed from the Darcy's law, extended to the polyphasic oil/water flows by the consideration of relative permeabilities. These models have been applied to a typical SW-NE cross-section in the southern part of the Suez rift (Shoab-Ali structure), using literature data. As computed by the model, the formation of hydrocarbons became imporlttnt 6 Myr B,P. The present depth of ail formation is found to be around 3000 m deep, in good agreement with published data. The computed volume of oil accumulated at the top of the structure (280 million 01 3 ) is consistent with the estimation of the oil in place (165 million 01 3 ), the difference being explained by the uncertainties on the input data. The parameters that haye the greatest influence on ail formation and migration are the paleotemperaturcs, the petroleum potentials and the assumed geometry of the cross-section. The value of our mathematical models in such examples is that they help ta understand the process of oi! accumulation in the basin. Afterwards, they make possible to select the parameters favorable to the accumulation of important quantities of oil, or to make quantitative predictions concerning undrilled areas in the vieinity of schematic cross-section. Thus they are very useful tools in oil exploration. Key words: modelling, computer models, oil formation, oil generation, Suez rift, ail migration, paleotemperatures l, INTRODUCTION The Gulf of Suez (Egypt) corresponds to a con- tinental rift which started its evolution at the begin- ning of Miocene times (Garfunkel and Bartoy, 1977). Source rocks and sandy reservoirs are abundant in the pre-rift and in the post-rift sedimentary rocks (Shahin and Shebah, 1984; Nagaty 1982), while the Middle Miocene evaporite deposits ensure a good seal for the stratigraphie or structural traps deyel- oped during rifting. The presence of these thick evaporite layers sealing the traps tends to hide the underlying structures from the seismic investigation. Despite this difficulty, other exploration tools are useful to select the most prom.ising prospects. The purpose of this paper is ta demonstrate the applica- tion of geological mathematical modcls which de- scribe the various physico-chemical phenomena lead- ing to oil accumulation to an example of a producing oil field in the Gulf of Suez. The Shoah-Ali oil field, located offshore the South Sinai (Fig. 1), has been chosen since published geo- logical and geochemical data provide good con- straints to the mathematical models. This oil field, whose daily production will ultimately reach 47000 B.O.P.D., was originally discovered in 1977. It is now operated hy GUPCO (Gulf of Suez Petroleum Co.). The first mathematical model deals with the geo- dynamic evolution of the Suez rift and predicts the thermal evolution of the rift. After this, the predicted thermal history within the Shoab-Ali area is used as an input in a second model ta reconstruct the formation and migration of ail in two dimensions. 2. GEOLOGIC SEITING OF THE SHOAH-ALI AREA In order to model the formation of the Shoab-Ali oil field, a SW-NE geologiccross-section has been constructed which starts from the deepest part of the Central Basin (SW) to the Sinai shorclîne (NE) through the Shoab-Ali field (Figs 1and 2). This cross-section is based on a detailed analysis of the stratigraphy and tectonics of the arca. 2.1 Stratigraphy and depositional history (Fig. 3) The pre-Miocene stratigraphie section exhibits especially regional thickness changes (Chenet and Letouzey, 1983). In contrast, the Miocene and younger stratigraphie section is highly variable in thickness and facies because of the active rift tectonies which lead to the formation of a rugged topography. The stratigraphy of the Suez rift is summarized below after Nagaty (1982), Hassouba et al. (1984) and Shahin and Shebab (1984). QG IO:1--Q 247
-
Upload
systemes-electroniques -
Category
Documents
-
view
4 -
download
0
Transcript of Modelling oil formation and migration in the southern part of the Suez rift, Egypt
Ad,-ances 10 Orgaole Geocbemlstry 1985O,g. Geocllem. Vol. 10, pp. 247~260, 1986Printed in Great Britain. Ail rights reserved
0146·6380/8653.00 +0.00Copyright © 1986 Pergamoo Journals Ltd
Modelling oil formation and migration in the southern part of theSuez rift, Egypt
P. UNGERER1, P. Y. CHÉh'ET I, I. MORETTI1,
A. CHIARELU2 and J. L. OUDIN3
IInstitut Francais du Pétrole, 1--4 av. de Bois Préau, 92506 Rueil-Malmaison Cedex, France2ELF-SNEAP, Tour Elf, 92080 Paris La Défense, France
3TOTAL, 228 av. du Haut Lévèque, 33605 Pessac Cedex, France
(Received 18 September 1985; accepted 15 April 1986)
Abstract-in order to improve the understanding of the formation and occurrence of hydrocarbons inthe Suez sedimentary basin, the whole chain of geological processes leading to the accumulation of oilis reconstructed by the use of geological mathematical models.
At first, a geodynamic model of rift formation considering the mantellic convection is used to computethe variations of heat fiow through time. A second step is the reconstruction of temperature lhrough timefor each point of the basin. This is achieved bya model of heat transfer across the sediments, that makesuse of the previously computed heat nows. Finally, the paleotemperatures are used in a third mathemalicalmodel that represents the formation and migration of hydrocarbons in two dimensions. The amounts ofoil generated are computed from a kinetic model and the migration of oil is computed from the Darcy'slaw, extended to the polyphasic oil/water flows by the consideration of relative permeabilities.
These models have been applied to a typical SW-NE cross-section in the southern part of the Suez rift(Shoab-Ali structure), using literature data.
As computed by the model, the formation of hydrocarbons became imporlttnt 6 Myr B,P. The presentdepth of ail formation is found to be around 3000 m deep, in good agreement with published data. Thecomputed volume of oil accumulated at the top of the structure (280 million 013) is consistent with theestimation of the oil in place (165 million 013), the difference being explained by the uncertainties on theinput data. The parameters that haye the greatest influence on ail formation and migration are thepaleotemperaturcs, the petroleum potentials and the assumed geometry of the cross-section.
The value of our mathematical models in such examples is that they help ta understand the processof oi! accumulation in the basin. Afterwards, they make possible to select the parameters favorable tothe accumulation of important quantities of oil, or to make quantitative predictions concerning undrilledareas in the vieinity of schematic cross-section. Thus they are very useful tools in oil exploration.
Key words: modelling, computer models, oil formation, oil generation, Suez rift, ail migration,paleotemperatures
l, INTRODUCTION
The Gulf of Suez (Egypt) corresponds to a continental rift which started its evolution at the beginning of Miocene times (Garfunkel and Bartoy, 1977).Source rocks and sandy reservoirs are abundant inthe pre-rift and in the post-rift sedimentary rocks(Shahin and Shebah, 1984; Nagaty 1982), while theMiddle Miocene evaporite deposits ensure a goodseal for the stratigraphie or structural traps deyeloped during rifting. The presence of these thickevaporite layers sealing the traps tends to hide theunderlying structures from the seismic investigation.Despite this difficulty, other exploration tools areuseful to select the most prom.ising prospects. Thepurpose of this paper is ta demonstrate the application of geological mathematical modcls which describe the various physico-chemical phenomena leading to oil accumulation to an example of a producingoil field in the Gulf of Suez.
The Shoah-Ali oil field, located offshore the SouthSinai (Fig. 1), has been chosen since published geological and geochemical data provide good constraints to the mathematical models. This oil field,whose daily production will ultimately reach
47000 B.O.P.D., was originally discovered in 1977. Itis now operated hy GUPCO (Gulf of Suez PetroleumCo.).
The first mathematical model deals with the geodynamic evolution of the Suez rift and predicts thethermal evolution of the rift. After this, the predictedthermal history within the Shoab-Ali area is usedas an input in a second model ta reconstruct theformation and migration of ail in two dimensions.
2. GEOLOGIC SEITING OF THESHOAH-ALI AREA
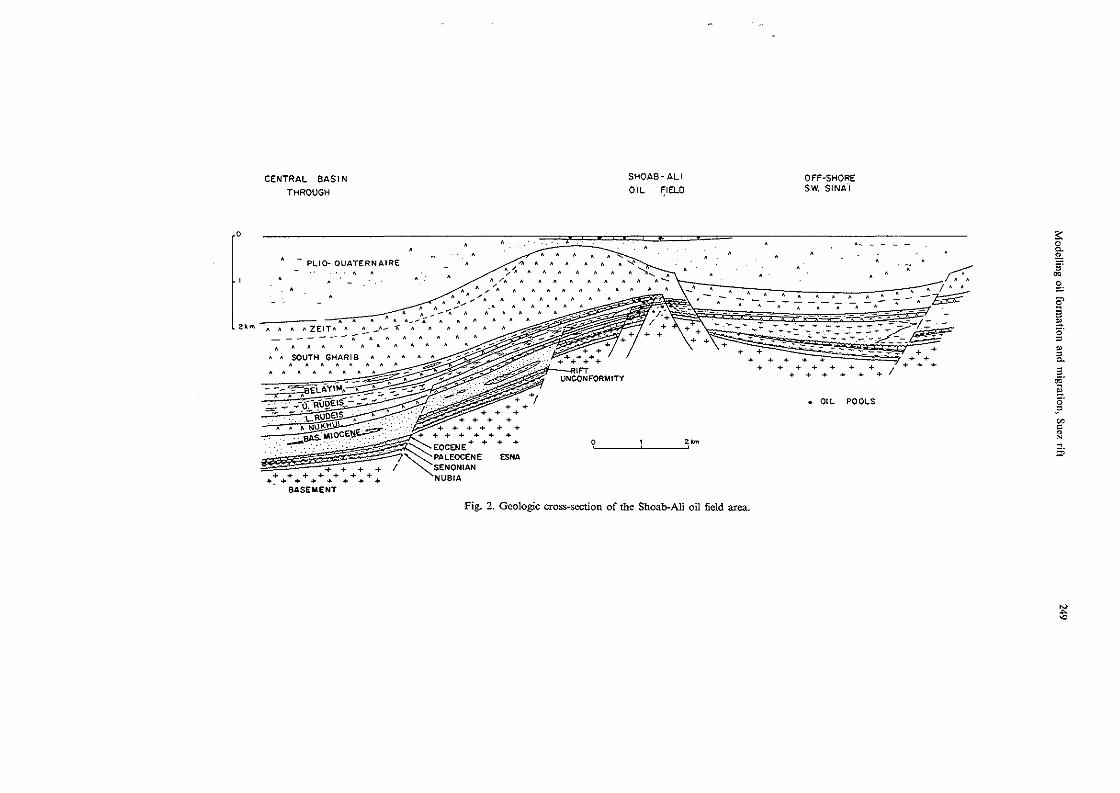
In order to model the formation of the Shoab-Ali oil field,a SW-NE geologiccross-section has been constructed whichstarts from the deepest part of the Central Basin (SW) to theSinai shorclîne (NE) through the Shoab-Ali field (Figs 1 and2). This cross-section is based on a detailed analysis of thestratigraphy and tectonics of the arca.
2.1 Stratigraphy and depositional history (Fig. 3)
The pre-Miocene stratigraphie section exhibits especiallyregional thickness changes (Chenet and Letouzey, 1983). Incontrast, the Miocene and younger stratigraphie section ishighly variable in thickness and facies because of the activerift tectonies which lead to the formation of a ruggedtopography. The stratigraphy of the Suez rift is summarizedbelow after Nagaty (1982), Hassouba et al. (1984) andShahin and Shebab (1984).
QG IO:1--Q247
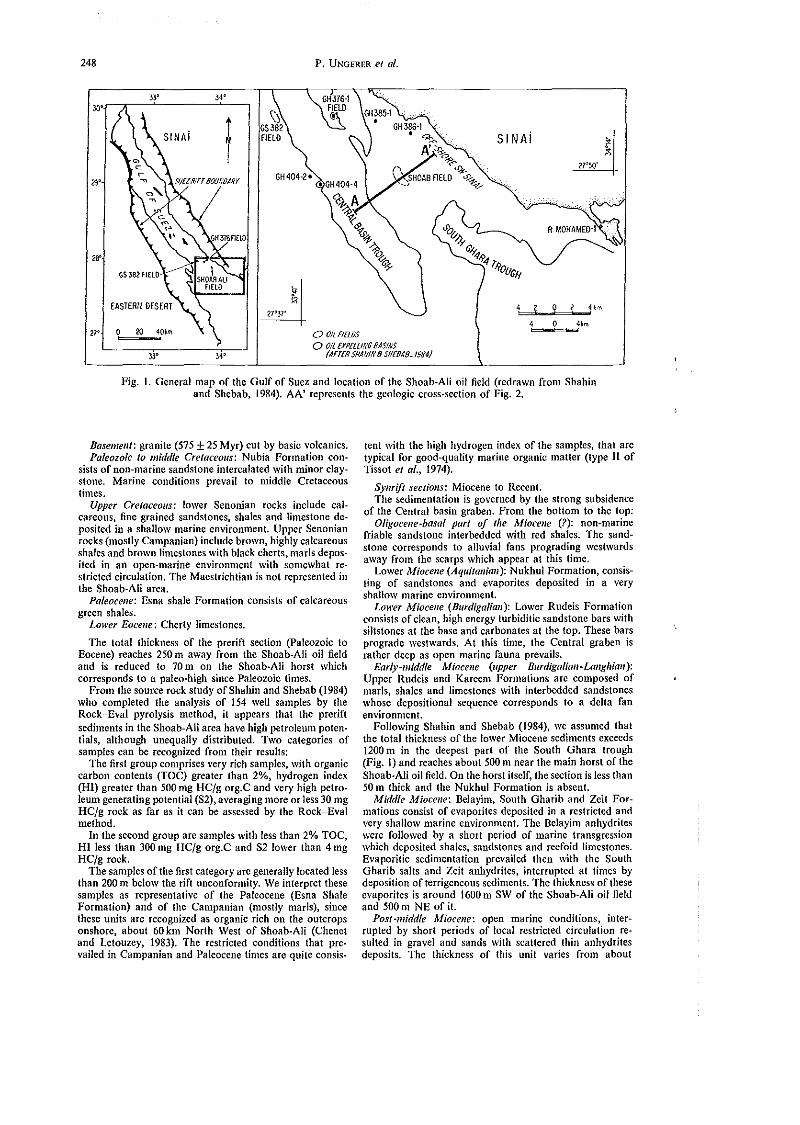
248 P. UNGERER el al.
o OILF!El[lSo Olt EXPEllII/G BASlliS
(AFTER $RA!lf/18 SffEBA8_ !984)
SINAi
bd......:'bd.....J'"b ....O~..;41,
Fig. 1. General map of the Gulf of Suez and location of the Shoah·Ali oi! field (redrawn from Shahinand Shebab. 1984). AA' represents the gcologic cross-section of Fig. 2.
Basemellt: granite (575 ±25 Mye) cut by basic volcanics.Paleozoic 10 middle Cretaceolls: Nuhia Formation con·
sists of non-marine sandstone intercalated \Vith minoT c1aystone. Marine conditions prevail to middle Cretaceouslimes.
Upper Cretaceolls: lower Senonian rocks include calcareous, fine grained sandstones, shales and Iimestone de·posited in a shaUow marine environmcnt. Upper Senonianrocks (mostly Campanian) include beown, highly calcareousshales and bmwn Iimestones with black cherts, maris depositcd in an open-marine environment with somewhat restricted circulation. The Maestrichtian is not represented inthe Shoab-Ali area.
Paleocelle: Esna shale Formation consists of calcareousgreen shales.
Lower Eocene: Cherty limestones.
The total thickness of the prerift section (paleozoic toEocene) reaches 250 m away from the Shoab-Ali oil fieldand is reduced to 70 m on the Shoab·Ali horst whichcorresponds to a paleo-high since Paleozoic times.
From the source rock study ofShahin and Shebab (1984)who completed the analysis of 154 weil samples by theRock-Eval pyrolysis method, it appears that the preriftsediments in the Shoab-Aii area have high petroleum potentials, although unequally distributed. Two categories ofsamples can he recognized from their results:
The first group comprises very rich samples, with organiccarbon contents (TOC) greater Ihan 2%, hydrogen index(Hl) greater than 500 mg HCjg org.C and very high petroJeum generating potenlial (S2), averaging more or less 30 mgHCjg rock as far as it can be assessed by the Rock-Evalmethod.
In the second group are samples with less than 2% TOC,HI less than 300 mg HC/g org.C and S2 lower than 4 mgHCfg rock.
The samples of the first category arc generally located lessthan 200 III below the rift unconformity. We interpret thesesamples as representative of the Paleocene (Esna ShaleFormation) and of the Campanian (mostly maris), sincethese units are recognized as organic rich on the outcropsonshore, about 60 km North West of Shoab-Ali (Chenetand Letouzey, 1983). The restricted conditions that prevailed in Campanian and Paleocene fimes are quite consis-
tent with the high hydrogen index of the samples, that aretypical for good-quality marine organie matter (type II ofTissot et (d., 1974).
SYllrift sectiolls: Miocene to Recent.The sedimentation is governed by the strong subsidence
of the Central basin graben. From the bottom to the top:Oligocclle-basal part of the Miocene (?): non-marine
friable sandstone interbedded with red shales. The sandstone corresponds to alluvial fans prograding westwardsaway from the scarps which appear at this time.
Lower Miocene (Aquitol/ioll): Nukhul Formation, consisting of sandstones and evaporites deposited in a veryshallow marine environment.
Lower Miocelle (Burdigaliall): Lowcr Rudeis Formationconsists of ciean, high energy turbiditic sandstone bars withsiltstones at the base and carbonates at the top. These barsprograde westwards. At this lime, the Central graben israther deep as open marine fauna prevails.
Early-middle Mioce1Je (upper Burdigalian-La1Jghian):Upper Rudeis and Kareem Formations are composed ofmaris, shales and limestones with interbedded sandstoneswhose depositional sequence corresponds to a delta fanenvironment.
Following Shahin and Shebab (1984), we assumed thatthe total thickness of the lower Miocene sediments excccds1200 m in the deepest part of the South Ghara trough(Fig. 1) and reaches about 500 m near the main horst of theShoab-Ali oil field. On the horst itself, the section is less than50 m thick and the Nukhul Formation is absent.
Middle M;occlle: Belayim, South Gharib and Zeit Formations consist of evaporites deposited in a restrieted andvery shallow marine environment. The Belayim anhydriteswere followcd by a short period of marine transgressionwhich deposited shales, sandstones and rcefoid limestones.Evaporitic sedimentation prevailed then with the SouthGharib salts and Zeit anhydrites, interrupted at times bydeposition of terrigeneous sediments. The thickness of theseevaporites is around 1600 m SW of the Shoab-Ali oi! fieldand 500 m NE of il.
Post-middle Mioce1Je: open marine conditions, interrupted by short periods of local restricted circulation rcsulted in grave! and sands with scattered thin anhydritesdeposits. The thickness of this unit varies from about
CENTRAL BASl N
THROUGH
SHOAB- ALI
OIL ~IELO
OFF-SHORESw. SINAï
ë.00
ê.o·?
r
~
~~.
~ë'8~o·=~=0.
o.::>
OIL POOLS
~ . ~_ " _' _ • A " A A / A A " A. .. '. ", ~./~_ ~"':;.':~ , • _ A " ,,--;:--,,- A A A ,,- --;;'-"-~/: 7 __ ''5: -,','.f?='=' ,.."" ;;~'~-,:::::::~-!- '\:. + :' --<-.',:- .:-=:=F~'"
+++++ -.~;++++++++++ +++
++++++/
o , Z-km. , ,
AT ! pr--==-- .. -
.'
~
~~A /" A/. /.. /
A " ... :--.... "
" .;. "--"
PLIO- QUATERNAIRE
,__"':~T~ :. ;: :',,_"-. .
" "SO~TH" GHARI B ".... '.~,-=.~~
,..- ,,- "SELAYIM" ,,~......~~=...----.u~~--.:.- .." :
, ...:.. .::l-RUDEIS' " " .. ' 'f,-'• " ~ NUKl'I_ """,, , •. ::.:.,.:_,... <l:iif!i..
.' -: .... BAS M\OCE~':'···: -:,l:;;~:::;;+:, ..::,~.. :: .. ::.,--:.-:.:.,-:::".'_ .. ', + + +++++++++~ 2 ",....,.....~ ::::S:::EOCENE+ + + +
... .... + ""-..~PALEOCENE ES
+. •• + • + ••••••• + / ""SENONIAN NABASEMENT ...... NUBIA
o
"m
Fig. 2. Geologie cross-section of the Shoab-Ali oil field area.
~

250 P. UNGERER et al.
L1THOLOGY
5YMBOLIZATION(MIGRATION MOOEL)
~s:-
I "- ~<t () fORMATION 9 0 >-0: 0 0 0:W n. F
w <tCl 0W <t Z:::; :>
0ID
ln
r..----------,-----1 5ail i::
POTENTIAL ~52 w
(mg/g rock) oc
SllIstone
wzwu2
>- .JQ.
0:
<t
ZEIT~
" w~
<0 1- .J<:> SOUTH, <:>
" " GHARIB.~ 0: w~, Z
~ w w BELAYIMu
0 <:>
'" 1-
"KAREEM
0: -RUDEISw;t<:>.J
NUKHUL
-------
...W ~ + +a +++ -520
o
Evaparlte 0
Evaporlle 0
Illilone 3.6
Evoporile 0
S!llalone Sondslone 3.6
Slitstone >Sondslone 3.6
Sondsl n 3.6Evoporlte 1 Sandstone o < 3.6
Sandstone 3.6
Sandstone 3.6
Carbonate 3.5
"Morl 28.0
Siltstone 1.5
Sandstone 1.5
Sasement 0
••
••
•
~~ Granite
t\~:(~;;;:l Sandstone
É~~1 Shole
~ L1mestone
l~" "AA1" A ... Anhydrite
_ Soit
Fig. 3. Lithologie succession the Shoah·Ali area, redrawn from Nagaty (1982), and symbols orthe variouslithologies used in the migration mode!.
1800 fi in the Central basin trough to Jess than 200 m al thetop of the maÎn salt diapir, west of the Shoah-Ali oil field.
Based on the source rock study of Shahin and Shebab(1984) the lower Miocene sediments have petroleum generating potentials (82) În the range 0.5-4 mg HCjg rock. Theirhydrogen index (HI) is moderate (100-400 mg HC/g org.C).According to the above authors, the possible source inter·vals are the Nukhul Formation, that con tains a type JIIorganic malter (terrestrial origin) and the lower RudeisFormation, with type II organic malter (marine origin). Themiddle Miocene and youngcr sediments, that will be shawnimmature in the whole area, do not need ta be consideredas possible source rocks.
2.2 SlruclUre (Fig. 2)As shown by Nagaty (1982) the horst of Shoab·Ali is
dominaled by an evaporitic dame caused by the flowage ofthe salt 2 krn west of the field. \Vell data show that thenormal faults were mainly active during Early Miocene.Afterwards, faulting was restricted 10 a few major faults,with an important vertical throw in sorne cases. Thissituation has been observed in other parts of the Suez riftlike the Abu Durba area (Chenet and Letouzey, 1983).Based on reasoning from this teclonic situation, we haveintroduced two deep normal faults in the Central basintrough although the exact position ofsuch Iikely faults is notprecisely known. Also, wc assumed that three rock units
ModeUing oil formation and migration, Suez rift 251
++++++-Itt++++
-1 t + + t t + + + t + \ CRUST ..+ t t + t t t
t+t'" +t ... +
RIFTING
~ EXTENSION ~
ASTHENOSPHERE UPWELLING
Fig. 4. Thinning of the lithosphere and extension of thecontinental crust. The amount of thinning in the Iithosphere
is lower than the crustal extension.
(Basal Miocene, Nukhul and Lower Rudeis Formations)tend to infill the faulted relief and thus exhibit major lateralthickness changes. We assume that the depth of the basin isknown with a 5% accuracy, even though no weIl data areavailablc in the two ftanking troughs.
2.3 Shoah-Ali oil accumulatioll
The Shoab-Ali oil field has an elongated NNW~SSE
oriented shape of 5 x 1.5 km dimension. The ail reservoirsare found in the weathered granites near the top of thebasemcnt, in the Nubia Formation and in the sandstonestrata of the Nukhul, Rudeis, Kareem and Belayim Formations. According ta Nagaty (1984), ail the ail reservoirshad the sarne pressure at the time of discovery (17.1 MPa at1680 m, that is nearly hydrostatic).
CRUST
3. MODELLING OF THE GEODYNAMICEVOLUTION OF THE RIFf APPLICATION
TO THE RECONSTRUCTION OF THETHERMAL HISTORY OF THE AREA
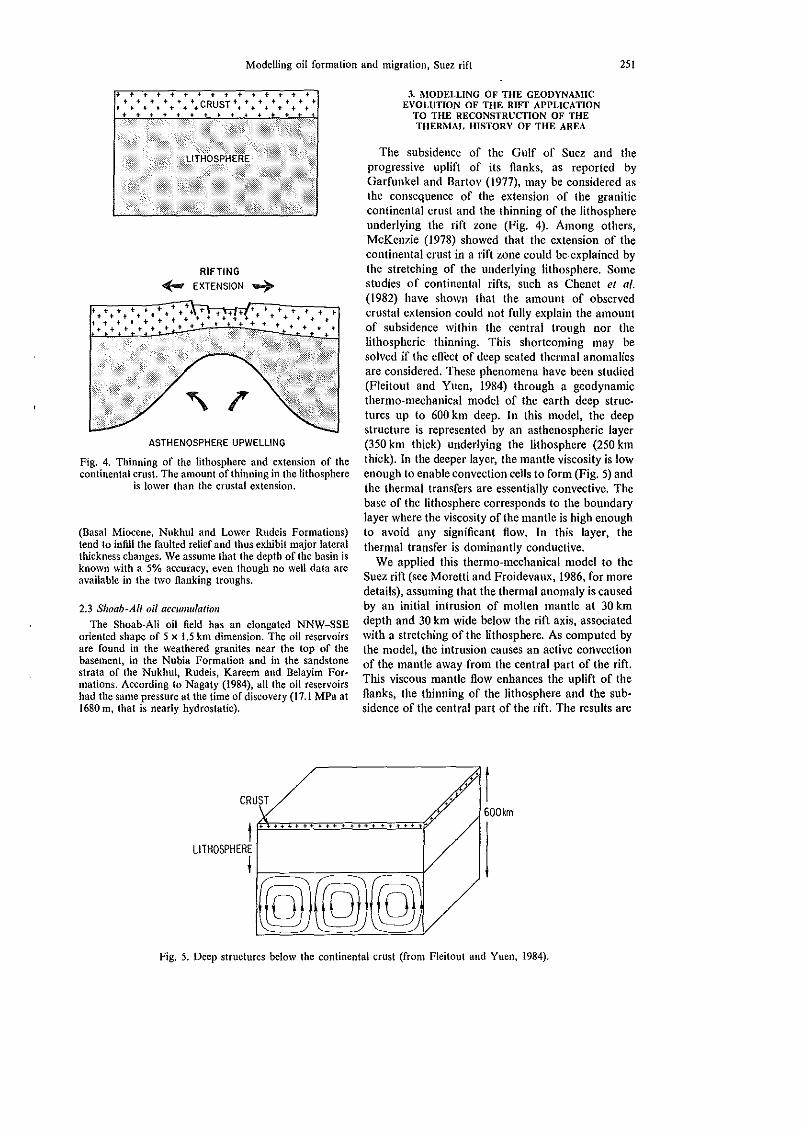
The subsidence of the Gulf of Suez and theprogressive uplift of its Ranks, as reported byGarfunke1 and Bartov (1977), may be considered asthe consequence of the extension of the graniticcontinental crust and the thinning of the lithosphereunderlying the rift zone (Fig. 4). Among others,McKenzie (1978) showed that the extension of thecontinental crust in a rift zone could be·explained bythe stretching of the underlying Iithosphere. Somestudies of continental rifts, snch as Chenet et al.(1982) have shown that the amount of observedcrustal extension could not fully explain the amountof subsidence within the central trough oor thelithospheric thinning. This shortcoming may besolved if the eDèct of deep seated thennal anomaliesare considered. These phenomena have been studied(Fleitout and Yuen, 1984) through a geodynamiethermo-mechanical model of the earth deep structures up to 600 km decp. In this model, the deepstructure is represented by an asthenospheric layer(350 km thick) underlying the lithosphere (250 kmthick). In the deeper layer, the manIle viscosity is lowenough to enable convection cells to form (Fig. 5) andthe thermal transfers are essentially convective. Thebase of the lithosphere corresponds to the boundarylayer where the viscosity of the mande is high enoughto avoid any significant flow. In this layer, thethermal transfer is dominantly conductive.
Wc applied this thermo-mechanical model to theSuez rift (see Moretti and Froidevaux, 1986, for moredetails), assuming that the thermal anomaly is causedby an initial intrusion of molten mantle at 30 kmdepth and 30 km IVide belolV the rift axis, associatedIVith a stretching of the lithosphere. As computed bythe model, the intrusion causes an active convectionof the manIle alVay from the central part of the rift.This viscous mantle Dow enhances the uplift of theftanks, the thinning of the lithosphere and the subsidence of the central part of the rift. The results are
GOOkm1~.'TI'3'3':J'E:';:'u.],·],·:J·E:·U·;:.]'.3':J'E:'E:';:'D!'fT
L1THOSPHERE
j 1-==--===-==1(@)(@)(Q)
Fig. 5. Decp structures below the continental crus! (from Fleitout and Yuen, 1984).
252 P. UNGERER el al.
CENTRALTROUGH... SHOAB ALI...100 i
~._--_.J-80 ct
560 '"~40 (!j.
20 ~
Î2030
TOTAL VAflIATION___
OEEPTHERMAl:ll ",........................ , ..._..._.....ANONAlY I/~ ,/' .......
STHETCH/NG ANO/,fALY. ,# • ".' ... ' " .~/l '.o••••••
J-."..,""I""i'!~~......-.....,...,...~.-.-J. h--~q..:..,......~,.........,~-+ 010 0 30 20 10 0
...---------AGE (my b.p.)----------
Fig. 6. Relative heat flow variations with lime for the center of the Suez rift and for the Shoab-Ali horstas predicted by the geodynamic models. The total variation is the SUffi of the deep thermal anomaly and
the strelching anomaly.
in good agreement \Vith the subsidence patterns andgravity data on the Suez rift.
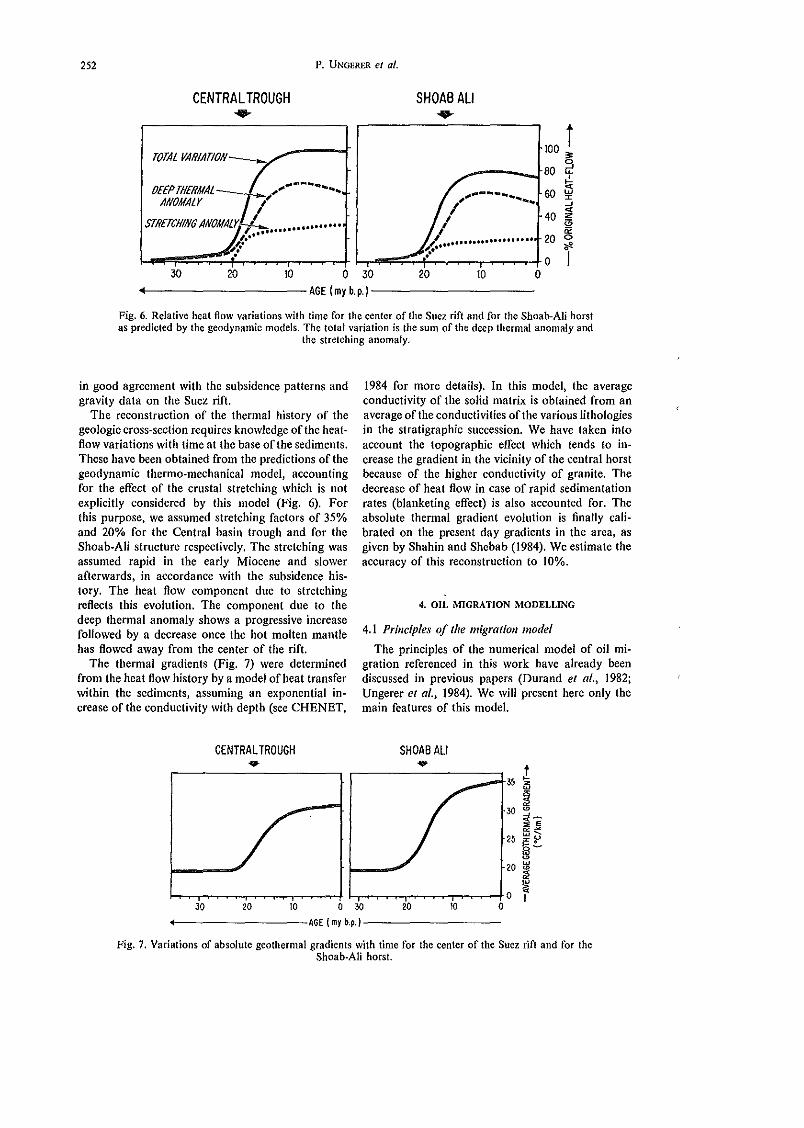
The reconstruction of the thermal history of thegeologic cross·section requires knowledge of the heatflow variations \Vith time al the base of the sediments.These have been obtained from the predictions of thegeodynamic thermo-mechanical model, accountingfor the effect of the crustal stretching which is notexplicitly eonsidered by this model (Fig. 6). Fortitis purpose, we assumed stretching factors of 35%and 20% for the Central basin trough and for theShoah-Ali structure respectively. The stretching wasassumed rapid in the carly Miocene and slowerafterwards, in accordance with the subsidence history. The heat flow component due to stretchingrefleets this evoJution. The component due to thedcep thermal anomaly shows a progressive inereasefollowed by a decrease once the hot molten mantlehas flowed away from the center of the rift.
The thennal gradients (Fig. 7) were determinedfrom the heat flow history bya model of heattransferwithin the sediments, assuming an exponential inerease of the conductivity with depth (see CHENET,
1984 for more details). ln this model, the averageconductivity of the solid matrix is obtained from anaverage of the eonduetivities of the various lithologiesin the stratigraphie succession. We have taken intoaccount the topographie effect which tends to increase the gradient in the vicinity of the central horstbecause of the higher conductivity of granite. Thedecrease of heat flow in case of rapid sedimentationrates (blanketing eifect) is also accounted for. Theabsolu te thermal gradient evoJution is finally calibrated on the present day gradients in the area, asgiven by Shahin and Shebab (1984). We estimate theaccuracy of this reconstruction to 10%.
4. OIL MIGRATION MODELLING
4.1 Princip/es of the migration model
The prineiples of the numerical model of oH migration referenced in this work have already beendiscussed in previous papers (Durand et al., 1982;Ungerer et al., 1984). We will present here only themain features of this model.
35 1i5
"i230 w
<1-,. E~~
25w'rU~ 00-ww
20w~~
0\ï1
01020
SHOAB ALI....
2030 10 0 30
<---------AGE Imrb.p.I---------
CENTRALTROUGH....
Fig. 7. Variations of absolute geothermai gradients \Vith time for the center of the Suez rift and for theShoah·Ali horst.
AGE 0.00o 1 ~ KM
,.'"
;::o0o
S-""~ë'
~g.~
~
~0-
~.~
~.
onooN
~.
" " " "..~~-~~,,.....;":=3\'~
~-'A_,_ '_._•"."::: .~;.:.•:'§i';';";'o;'
10---, $HAl(
c:::::;::::::;) SAND Œ::IZ:I CVA"OflITCS
c:=.::3 $II.T 0= IlASCMCNT
= MA"'!. ~"'lT(ACO ANDFRACTUREO 6AstlolCNT
= CAFlIlONATt
" " "" " "... .
" ,," ,,""
2
12~'~ c.7".-' - ~11 . "'7~~"'ê-::;'la:' .'-",,~~ """~ï _- : .6 '. - ... ;:- _., --~~
1
" " " " "181 "" " " " " ,," ""." ,," " "
i1iiliZâ~4S00 15000
IS00
1000
2000
3000
2500
'00
,-"•~ 4000
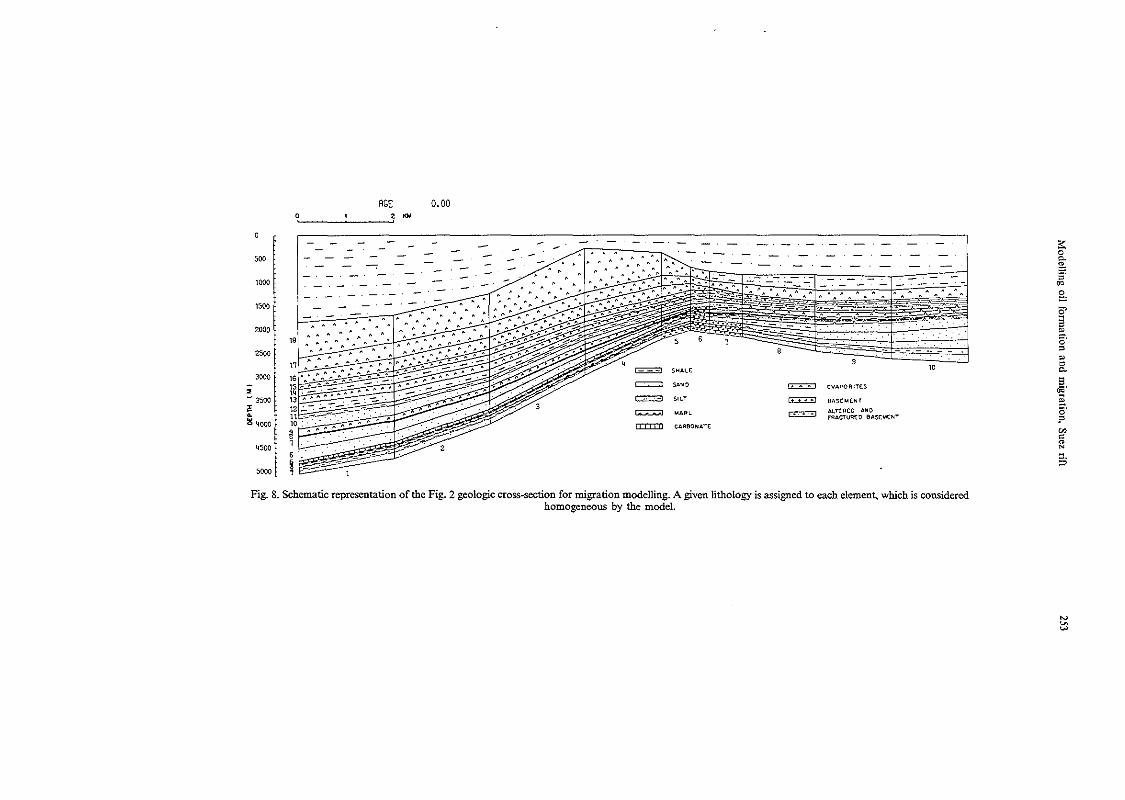
Fig. 8. Schematic representation of the Fig. 2 geologic cross~section for migration modelling. A given lithology is assigned to each element, which is considercdhomogeneous by the model.
~~
w
254 p, U~GERER el al.
The generation of oil from the sedimentary organicmatter is computed similarly to the kinetic modelpublished by Tissol and Espitalie (1975). Compaclionis rcpresented by the Jaw of effective stress, wherebyeffective stress is considered as a [uHction of porosity.Darcy's iaw, extended to polyphasic flows throughthe relative penneability concept, is lIsed to representthe fluid flow and pressure regime, as commonlyadopted in reservoir engineering. The intrinsic perme·ability of the sediments is computed from theirporosity and specifie surface arca by the KozenyCarman formula, as given by Scheidegger (1960).This formula accounts for the decrease of permeability \Vith porosity dec1ine. The relative penneabilitics for the oH and \Valef phases are computedfrom the oi! saturation. The purpose of this pragmatie solution is based on the îdea of a minimumsaturation level neeessary for expulsion of oil fromsource rocks (Durand, 1983).
The above mentioned set of equations has becnadoptcd because it represents several geological processes which oceur simultaneously:
-formation of hydrocarbons,-normal compaetion of sediments,-undereompaction and pressure build-up in imper-
vious sediments in case of rapîd loading or hydrocarbon formation,
-expulsion of oil from the source rocks (primarymigration),
-secondary migration of oil by buoyaney withincarrier beds,
-accumulation in traps,-Ieakagc through caprocks.
The data required for the model concern mainlythe geometry of the rock units in the cross-section,the age and Iîthology of the stratigraphie unHs, thetemperature history and the initial oil potential ofthe various stratigraphie unHs. The results consist ofa reconstruction of compaction (porosîty, pressure),oil generation (maturation levels) and migration histories (oil saturation in source rocks and reservoirs).Up to now, the model has proved efficient to accountfor oil genesis, pressure regimes and oil migration inseveral sedimentary basins.
4.2 SchematÎc representatioll of the Shoab-Ali crossseetioll
The geologie cross-section studied has been represenled by a grid of 190 elements that include thedeepest part of the graben, the Shoab·AIi structureand lhe next tilted block, Easl of the struclure (Fig.8). Concerning the faults, it was assumed that theygeneraUy did not interrupt the continuity of thepermeable sand units because of connections outsidethe plane of the cross·section.
4.2.1. Lith%gy. Eighl Iilhology types have beenintroduced in order to descrîbe the various strati·graphie units. Each type îs characterized essentiallyby the fol1owing parameters:
-porosityjeffective stress relationshîp,-specifie surface area,-rock matrix density,-oil potential of the kerogen,-kinetic parameters of kerogen maturation,-anîsotropy coefficient of permeabîlity,
The lithology types assigned to the various unitsare shown in Fig. 3. Due to the Jack of petrophysicaldata, these parameters were essentîally chosen fromprevious experience with application of the mode!.For shale, sandstone, carbonate and mari, we keptbasically the same set of specifie surface areas as înthe former applications of the model. Dased on thesevalues, that are consîstent \Vith the order of magnitude of measured surface areas for the relatedlithologies, permeabilîty values are computed usingthe Kozcny-Carman equation. The computed valuesare in agreement with measured permeabilities fromthe literature. According to prevîous experience thesevalues are also representative for pressure regimes inother sedimentary basins. For salt, evaporites andunaltered basement, the specifie surface arca wereselecled exceplionally high. Although they have nophysical meanîng, thîs was donc to lead to a negligible permeability on a geologic time scale. For thefractured basement, we assumed a rather lo\V specifiesurface area, which results in hîgh penneability, inorder to account for its possible reservoir behaviour.
The anisbtropy coefficients are not seleeted on thebasis of large scale anisotropy. Decause of the stratigraphie composition, the large scale vertical permeability is especially controlled by layers of moreimpervious lithologies and the horîzontal penneability layers of the Jeast impervious lithologies. Forthis reason, we selected anisotropy coefficients for theIilhology types lhal consisl of interbedded contrastedsediments: marIs (limestonejshale) and siltstone(shale/carbona tc/sandstone).
Finally, the compaction cUrves were derived froma combination of literature data and previous experience of the authors \Vith the mode!. In partîcular, theevaporites and the basement were assumed to have avery low porosity (0-5%).
The petroleum potential of the various intervalshave been obtained from an average of the results ofShahin and Shebab (1984), assuming as seen beforethat the organic·rich units in the pre-rift sedimentswere the Campanîan maris and the Paleocene EsnaShale Formation. The oil potentials lISed for themodel application are shown on Fîg. 3. The kineticparameters of the oil formatîon model for terrestrialand marine organic matter have been obtaîned froma specifie calibration method applied to a referencesource rock series (Ungerer et al., 1986).
4.2.2 Depositiollal and teetollÎe evollitioll. In the firststep, the mode} considers only one row of elements,and the other ro\Vs are added successively to the grid.The sedimentary unit in course of deposition, al·though not included in the grid, is accounted for în
Modelling oil formation and migration, Suez rift 255
(a)TRANSFORMATION
RATIO
1.0
0.5
(b)Oll
SATURATION
0.3
0.2
0.1
(c)EXCESS
PRESSURE
MPo
10
5
1.0
0.5
(d)MIGRATION
INDEX
o-'--.--~ ....<--,-,20 10 0
o-'-...--~---t"~~20 10 0
o-'-".==r--,-~~20 10 0
AGE (M.Y. B.P.)
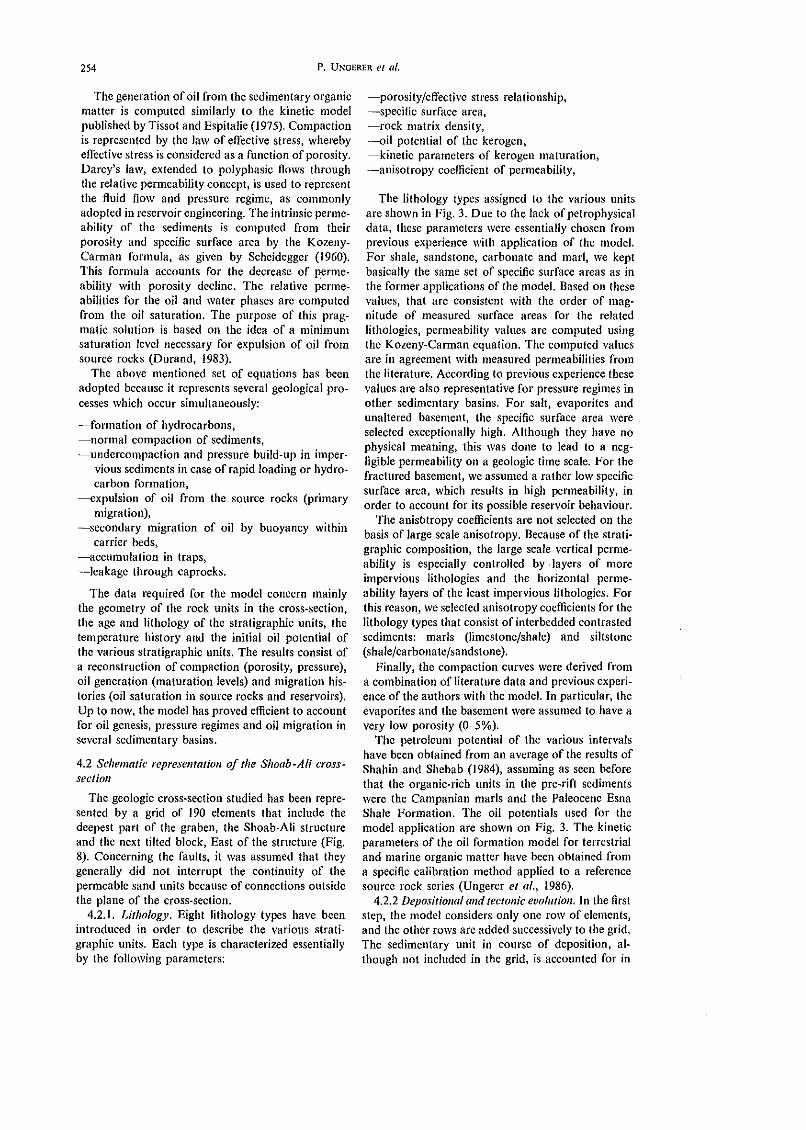
Fig. 9. Evolution with time for the following parameters coupled hy the model for the elemcntcorresponding to the Esna Shale Formation in the deepest central part of the Suez rift: (a) Transformationratio of the oil potenlial. (h) Oil saturation in the parous medium. (c) Excess pressure with referencc tohydrostatic pressure. (d) Migration index (amount of oi! prcsent/amount gcnerated in the source rock).
the model by the reconstruction of subsidence, pressure, and other parameters. Such a variable gridallows an easy description of sedimentation from theinformation given in Fig. 3. However, the modelcannot account explicitly for the major faulting in thestudy area. The period when the computed grid isvalid is between the last important fauIt movements(about 15 Myr B.P.) and the present lime. Before15 Myr B.P. the burial of the deepest sourCe rocksdoes not exceed 2000 m, which is insufficient to causeany sÎgnificant maturation in this basin. In addition,the South Gharib evaporites arc included in the gridat the right time of deposilion (13.4-11.5 Myr B.P.).Neglecting the faults is, therefore, no serious mistakefor the reconstruction of the processes of oil formation, migration and trapping after 1l.5 Myr B.P.
4.2.3 BOllndary conditions. We assumed that thefaults East of the Shoab·AIi oil field did not interruptthe continuity of the permeable units until theyreach the outcrops (not shown in Fig. 2). Consequently we considered the eastern boundary of thegrid to be in connection with a hydrostatic pressurezone. The symetry axis of the Suez basin was considered to represent an approximate western limit ofthe grid. This boundary was, therefore, treated asimpermeable.
4.3 Resulls
Before considering the foUowing results, it must hereminded that they may be subject to the uncertaintyassociated \Vith ail the geological and geochemical
data. In trus study, the results are generally indicatedtogether with the maximum variation (in parentheses)registered during the sensitivity analysis that will bediscussed later.
4.3.) Timing and distribution of oil formation. Thetiming of oil formation may he evidenced by considering the change of the transformation ratio of thepetroleum potential (TR) \Vith time, that we define asthe amount of ail generated in the source rock at acertain stage to the amount that would have beenformed in a complete evolution of the kerogen. Theevolution of TR versus time is shown on Fig. 9a forthe element representing the Esna Shale in thedeepest part of the graben. The stage of importantoil generation-arbitrarily related to TR = O.)-isreached at 6.0 Myr B.P. (± 1.5 Myr). The entirepetroleum potential is converted to oil at 2 Myr B.P.(± 1.5 Myr).
The other pre~rift sediments reach maturationpractically at the same age as the Esna Shale, due tothe litt le difference in burial rustory. On the otherhand, the lower and middle Miocene start to generateoil noticeably later. For instance, the stage of important oil generation is reached in the syncline bythe top Nukhul at 3.5 Myr B.P. (± 1.25 Myr) and bythe Kareem Formation at 1.5 Myr B.P. The Belayimsediments do not achieve significant maturity.
For a given source rock unit, the maturationoccurs later on the flanks of the structure than in thegraben. Indeed, the pre-rift source rocks located 4 kmWest of the Shoab·Ali structure, that are presently
AGE: 6.0 MY~
~
10
~ 10 -20%
• 20-100%
Oll SATURATION
0-5%
5 -10%
olZZ32kmo
3TR=O.I
...
"" .. "" " " ,," .. " Il "" ",," A" A",,",,",,"" Il ,,"" A A A""" A A,,' ,'," """",,','," ' , '"
17 ""A" """ """ A "" 1\ " 1\ 1\ " " 1\ 1\ A" A 1\ ,,1\ 1\
16 ,," "A ,," 1\ " " 1\ A
1 /1" 1\ " " " "",, """,, " "",,
~ --
0
500
E 1000
1500:cb:: 2000
~ 2500
3000
3500
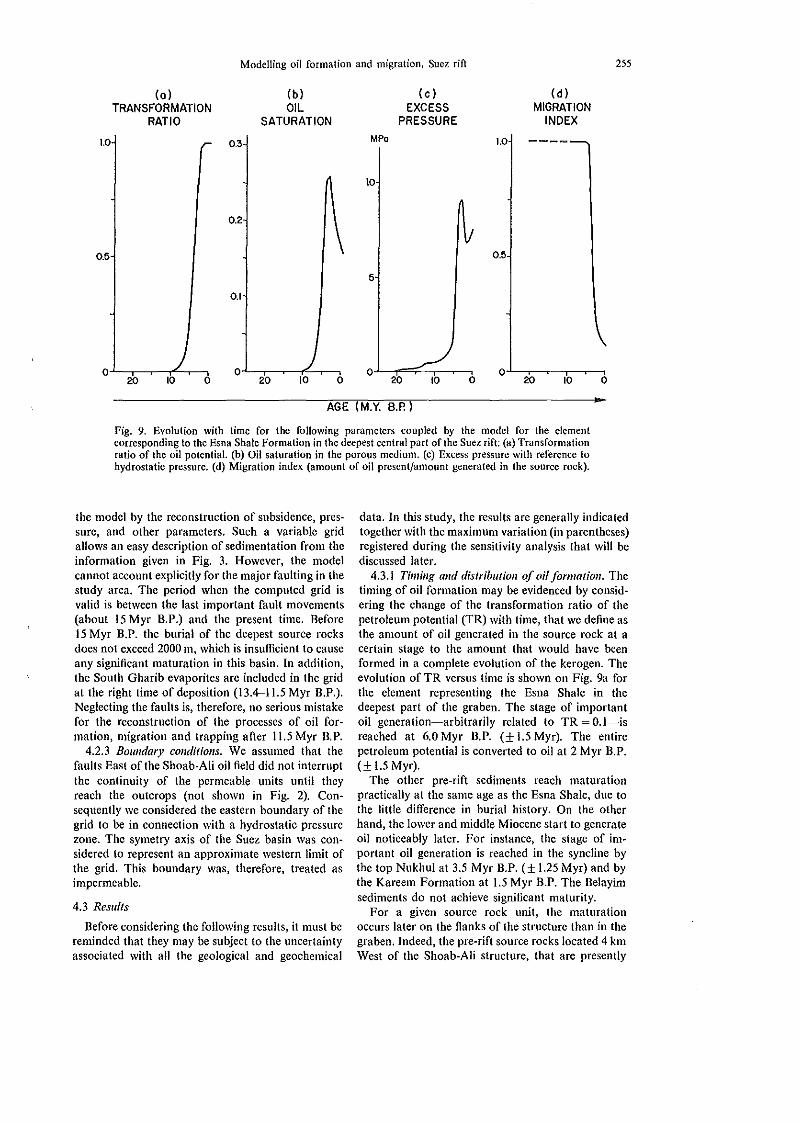
Fig. 10. Conditions for hydrocarbon generation and migration computed for the section at 6.0 Myr B.P. The line TR =0.1 reprcscnts the thrcshold ofsignificantoil generation. Oil saturations, indicatcd by four classes. show that only the pre~rift source rocks contain sorne hydrocarbons (pre·expulsion stage).
:0c:5m~m~
"-,~
109
~ 10-20%
• 20-100%
1\" 1\ A,. " A" Il
8
Oll SATURATION
00-5%
lZZ3 5 -\0%
, '1"" À1\ A 1\ 1\
,,, ,
o 1 2km, " '" !
AGE o MYOr,
500
1000
1500E - ,
, , , ,~ 2000 , , , ,,,. , , , , ,:c ,
2500, , , , ,
1- , , , ,Il. >7 ,
" : A 1\ A 1\" " .-'-,,"W 3000 ,. , , 1\ 1\ A 1\
.-'-" - , '0 .. , ,,. - -3500 1:>\ " /1
4000 l9~4500 .:::>.~
5000
Fig. Il. Conditions for hydrocarbon generation and migration computed for the cross~section at present tïme. The TR = 0.1 and TR = 0.9 lines represent thethreshold of significant oil generation and the end of oil generation zone respeetively. Oil saturations, indicatcd by four classes, show the accumulations at thetop (Shoab-Ali structure) and on the western side of the horst. The carrier rocks where the oil passed through have generally saturations in the range 1-4%
(not shown on this graph).

Modelling oil formation and migration, Suez rift 257
Stratigraphie unit Relative amounl (%)
Table 1. Relative amounts of oil generated up 10 presenl time bythe various sedimentary units in proportion 10 Ihe total amount ofoil generated in the cross-section (values in parentheses indicate the
maximum \'ariations obtained by sensitivity analysis)
3400 m deep, reached maturation 3 Myr later than inthe graben. In the area of the structure itself as weilas on its Eastern flank, the source rocks are found tobe immature (TR = 0.02 or lower). The deplh of theoil formation zone (Figs 10 and Il) is found to varybetween 3250 m (fianks of the structure) and 2850 m(graben). This variation is mainly due to the differentpresentMday geothermal gradients in the syncline(30°Cjkm) and on the crest (35°Cjkm). The cOlnputed depth of the oil formation zone may he compared with the Rock-Eval data reported by Shahinand Shebab (1984): in the two wells where a muturitytrend is c1early obvious (OH 404-2 and OH 376-1, forlocation see Fig. 1), the Tma-, = 435°C correspondingto the threshold of oil generation is reached at 3000 mdepth approximately. The agreement of our modelwith these maturity data is indeed quite good.
Comparing the amounts of oH generated by thevarious source rocks, their respective importance maybe estimated (Table 1). This shows that the majorsources are by far the Paleocene (Esna Shale ForMmation) and the Campanian marIs, aIthough they arethinner than the Miocene sediments. The totalamount of oil generated in the basin, assuming aJO km extension of the drainage area in the NW-SEdirection, is 560 million m' (±200 Mm').
4.3.2 Expulsion and migration ofoil. As mentionedearHer, a basic assumption of the model is that theexpulsion of oil from the source rock starts after asufficient oil saturation is reached in the porousmedium (about 15%). The variation of saturationwith time, as exemplfied in Fig. 9b for the Esna Shale,shows that this stage is reaehed about 5.5 Myr B.P.(± 1.5 Myr). The final decrease in oil saturation is ducto continued expulsion, once the oil formation ratehas slowed down. As a consequence of the high oilformation rate, which increases the volume of porefluids in the shale, a strong increase in pressure isfound by the model (Fig. ge). The beginning of oilexpulsion is evidenced by plotting the ratio betweenthe amount of oil still present in the source rock tothe amount generated (Fig. 9d). This migration indexis 1.0 until 5.5 Myr B.P. and decreases thereafter,attesting that oil expulsion has commenced soon afterthe stage of important oil generation was reached(6.0 Myr B.P.). This is a younger age than the oneeomputated by Shahin and Shebab (1984) who de termined an age of 10 Myr B.P. for the expulsion
BelayimRudeis·KareemNukhulLower EocenePaleocene (Esna Shale)CampanianBase Senonian and Nubia Sandslone
O(±O)5(±3)
12(±6)6(±3)
24(±5)48(±1O)5(+3)
threshold. The diflèrenee is probably due to thetemperature reconstruction which is not the same inour study. The migration index decreases to valuesaround 0.10, indicating that around 90% of the oi!generated is found to be expelled by the model.
These results cannot be controlled by weil data, butthey are in qualitative agreement with observationsreported for other rich source rocks such as theBakken Formation in the \Villiston Basin. For thissource rock, Meissner (1984) reports along with theformation of oil, a strong pressure and drastic reMsistivity increase which is the consequencc of majoroil saturation in the porous medium.
From the model, it is predicted that the excesspressure in the Esna shale Formation increaseswhereas the overlying Nukhul sandstone remainsalmost at hydrostatic pressure. The underlying Nubiasandstone is found slightly overpressured, which isthe resuIt of our assumption that this unit is interrupted by the fault bounding the Shoab-Ali structure.However, in the deep part of the graben, the pressureis found noticeably higher in the Esna Shale than inthe Nubia Sandstone. The expulsion of oil OCClICS,
therefore, not only upward, into the Nukhul sandMstone, but also downward into the lower Senanianand Nubia sandstone.
Once the oil has been expelled from the sourcerock, secondary migration is found to oceur updipwith a residual saturation of 1--4% in the sandstonesand 5 to 20% in less permeable sediments. Theseaverage saturation values are not claimed ta describereality predsely. Aetually, the oil probably migratesupdip with high saturations at the top of the carrierbeds and almost no saturation underneath. As aresult of the secondary migration and trappÎng, themodel founds an oil accumulation to form at the topof the Shoab-Ali structure at 3.5 Myr B.P. (±2 Myr),that is 2 Myr after the beginning of oil expulsion inthe deepest parts. This lime delay may be interpretedas the time necessary to reach a minimum oil saturMation in the carrier beds and to infill the possiblesmall seale traps along the migration paths. Thedistribution of oil saturations found by the model isshown by the Figs 10 and II. The aecumulatedelements at the top of the structure reach a Iimitsaturation of about 70% which reproduces the actualoi! field, including a small accumulation in the fractured basement. An additional accumulation is foundon the W flank of the structure, that corresponds tothe lower Senonian silt and Nubia sandstone incontact with the impervious basement through of amajor normal fault. This accumulation is not thoughtto represent the exact situation but it is in a schematicway indicative of what should happen if an importantfault causes such a trap to oceur, anywhere on the Wflank of the structure.
The pressure in the Shoab·Ali structure if round tobe in very slight exeess versus hydrostatie (16.9 MPaat 168 m depth) whieh is quite comparable with the17.1 MPa indieated by Nagaty (1982) at the same
258 P. UNGERER el al.
depth. The present Jack of communication betweensorne reservoirs, as reported by the same author, isexplaîned by the Iow permeability of the separatinglithologie units or faults, which is Jow at human limescales but sufficient to establish equilibrium of fluidpressure \Vith geologic lime pcriods.
Quantitatively, the mûst important contributors tothe accumulation arc round to he the Esna ShaleFormation and the Campanian. This result is consistent with the interpretation of Rohrbaek (1983) whoround the ails from the major fields in the Gulf ofSuez to he of marine type and of similar origin,whatcver the rcservoir age. The Nukhul sandstonc isal50 round to contribute but to a tnuch lesser extent.The Rudeis and Kareem Formations are Ilot roundto expell enough oil to enable secondary migration tooecur.
4.3.3 Order of magnitude of Ihe volume of ailaccumulation. In order to compute the volume of theoil accumulation from the model results, we willassume that the drainage area has a 10 km extensionin the NW-SE direction. This simplifying assumptionaims only to give an order of magnitude. It was thuscomputed that the volume of oil accumulated in theShoab·AIi structure was 280 million m' (± 120 Mm').This figure can be compared with an estimate of theactual volume from the work of Nagaty (1982). Theacreage of the field is 7.9 km' and the average heightof the oil column, excluding the evaporites, may beestimated to 120 m. Assuming then an average porosity of 25% and an average saturation of 70%, weobtain a volume of 165 million m3 of oil in place, therecoverable reserves being probably much less important. Tt scems that the model overestimates theaccumulated volume by a factor of 1.7. This isalthough thought very satisfactory if aIl the uncertainties of the data are considered, as will be shownin the sensitivity analysis. From the model, theShoah-Ali accumulation represents about 50% of theoil generated in the drainage area.
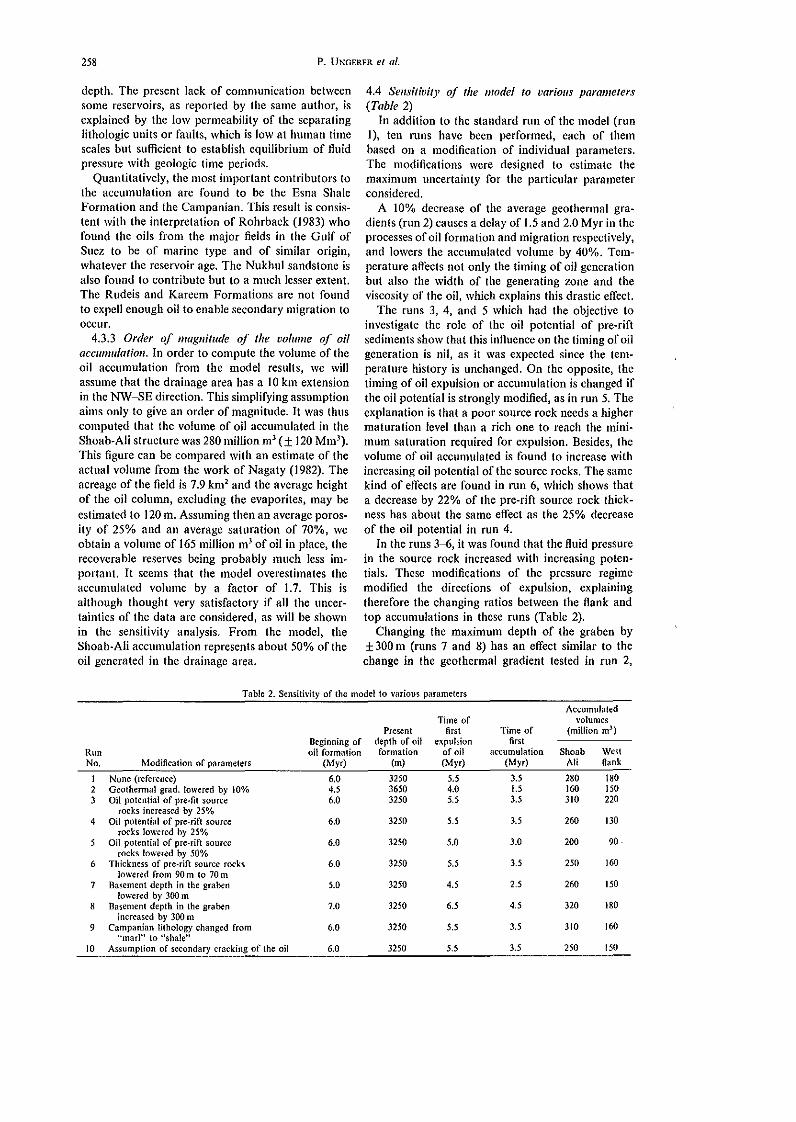
4.4 Sel/si/ivily of Ihe model la variolls paramelers(Table 2)
In addition to the standard run of the model (run1), ten runs have been performed, each of thembased on a modification of individual parameters.The modifications were designed to estimate themaximum uncertainty for the particular parameterconsidered.
A 10% decrease of the average geothennal gradients (run 2) causes a delay of 1.5 and 2.0 Myr in theprocesses of oil formation and migration respectively,and lowers the accumulated volume by 40%. Temperature aftècts not only the timing of oil generationbut also the width of the generatîng zone and theviscosity of the oil, which explains this drastic efièct.
The runs 3, 4, and 5 whieh had the objective toinvestigate the role of the oi! potential of pre-riftsediments show that this influence on the timing of oilgeneration is nil, as it was expected since the temperature history is unchanged. On the opposite, thetiming of oil expulsion or accumulation is changed ifthe oil potential is strongly modified, as in run 5. Theexplanatîon is that a poor source rock needs a highermaturation level than a rich one to reach the minimum saturation required for expulsion. Besides, thevolume of oil accumulated is found to increase withincreasing oil potential of the source rocks. The samekind of effects are found in run 6, which shows thata decrease by 22% of the pre-rift source rock thickness has about the same effect as the 25% decreaseof the oil potential in run 4.
In the runs 3--6, it was found that the fluid pressurein the source rock increased with increasing potentials. These modifications of the pressure regimemodified the directions of expulsion, explainingtherefore the changing ratios between the flank andtop accnmnlations in these runs (Table 2).
Changing the maximnm depth of the graben by±300 m (runs 7 and 8) has an effect similar to thechange in the geothermal gradient tested in run 2,
Table 2. Sensitivity of the model to various parameters
AccumulatedTime of volumes
Present first Time of (million ml)Beginning of depth of oi! expulsion first
Ruu oi! formation formation of oi! accumulation Shoab WestNo. Modification of parameters (Myr) (m) (My') (My,) Ali Rank
1 None (reference) 6.0 3250 5.5 3.5 280 1802 Geothemlal grad. lowered b}' 10% 4.5 3650 4.0 I.S 160 t503 Oi! potential of pre·fit source 6.0 3250 5.5 3.5 310 220
rocks increased by 25%1304 Oil potential of pre-rift source 6.0 3250 5.5 3.5 260
rocks lowered by 25%905 Oi! potential of pre·rift source 6.0 3250 5.0 3.0 200
rocks lowered b}' 50%3.5 250 1606 Thickness of pre·rift source rocks 6.0 3250 5.5
lowered from 90 m to 70 m7 Basement depth in the graben 5.0 3250 4.5 2.5 260 ISO
lowered by 300 m1808 Basement depth in the graben 7.0 3250 6.5 4.5 320
increased by 300 m1609 Campanian lithology changed from 6.0 3250 5.5 3.5 3tO
"mari" to "shale"10 Assumption of secondary cracking of the oi! 6.0 3250 5.5 3.5 250 ISO
Modelling oil formation and migration, Suez rift 259
that is a simultaneous modification of timing for oilformation and migration, and of accumulated volUmes. These effects are, however, less important thanin run 2. Compared to run l, the depth of the oilformation zone is practically unaltered, although theburial rates are ±5% different.
In run 9, the change of the Campanian lithologyfrom "mari" to "shale" resulted especially inhigher pressures in this unit as a result of the lowerpermeability. This did not influence strongly theaccumulated volumes shown in Table 2.
Final1y, wc tested the influence of the destructionof oil by thermal cracking (run 10) by introducing aunique secondary reaction, in the saille way as Tissotand Espitalie (1975), neglecting the gas formed forfluid flow computations. The accumulated volume isfound to decrease by only 15%, which indicates thatthe producing source rocks have expelled most oftheir oil before reaching the secondary cracking zone,which is found at 4500 m depth in the graben. Thisis in good agreement with the moderate amounts ofgas (450 standard ft' per bbl) in the Shoab·AIistructure as reported by Nagaty (1982).
In addition to these ten runs, wc investigated therole of an interruption of the carrier beds by a lowpermeability fault on the western Bank of the structure. The model predicted then no accumulation inthe Shoab Ali structure, the oil being trapped on theBanks only. This nm is not thought representative ofthe real situation and, therefore, is not shown inTable 2.
Considering that the uncertainties for the testedparamcters may add their effccts, it should be emphasized that the amounts of oil generated or acculllulated in the reference run may vary by a factor oftwo or three. The estimated volume of the Shoab·AIioil accumulation deereases, thercfore, within theuncertainty range of our model.
5. CONCLUSION
The Shoab·Ali arca presents several difficultieswith respect to modelling of basin evolution. First,the thermal regime is complcx, as a result of the lowerMiocene rifting. Thus, the variations of the heat flowhave to be computed from a specifie geodynamicmodel. Taking the intrusion of molten mantle intoaccount in our geodynamic model enabled us to getc10ser to the controUing factors Iike subsidence pattern, present day heat Bow and gravity anomaly inthe Suez Rift.
A second problem results from the Iimited knowl·edge of the structural geology outside the Shoab-Aiistructure itself. However, our knowledge of the outcropping series in the surrounding area greatly en·hanced the assessment of the lithologies and of therole of the faults for migration. In particular, itenabled us to assume that the pre-rift sequence showslow tateral variations and that the faults did generallynot interrupt the continuity of the permeable units.
Finally, the resufts of the combined geodynamicand migration model account for the basic knownfeatures of the Shoab-Aii prodllcing area:
--<1epth of the oil generation zone (2850-3250 ml,~pressure slightly above hydrostatic in the Shoab-
Ali oil field,-order of magnitude of the volume of the Shoab-Ali
oil accumulation.
These favorable resllits indicate that the modelmay be used for the evaluation of undrilled prospectsin the area or to understand the process of oilformation and migration, The formation of oil be·cornes important 6.0 Myr B.P. and the expulsionfrom the pre-rift source rocks is found to start shortlyafterwards 5.5 Myr B.P. The accumulation process isfound to start 3.5 Myr B.P. The 2 Myr time delaybetween expulsion and initiation of accumulationmay be interpreted as the time necessary to fillintermediate small traps and carrier rocks along themigration paths. The overall migration efficiency isfound to be around 50%, which is very high, It isinterpreted to result from the high proportion ofpermeable units, which favor the migration processes.
Finally, the sensitivity of the model tomodifications of the main geological parameters hasshown their relative importance. In this case, thevolume of the oil accumulation depends especially onthe temperature reconstruction and on the sourcerock potential but aiso on the depth of the deep basintrough and on the assumed lithology for the sourcerocks, These indications may be used to define favorable criteria required for discovering comparableprospects in the area:
-large drainage area----deep burial of the pre·rift source rocks downdip the
prospect-high geothermal gradients in the drainage area-significant thickness and oil potential of the source
rocks in adjacent wells
These geochemical parameters should be evaluatedtogether with the other exploration criteria (dosure,trap volume, reservoir occurrence, etc.), in order toincrease the probability of discovering additionallarge oi! accumulations.
Acknoll'ledgemellls-This paper was presented initially atthe Seminar "Source and Habitat of Petroleum in theArab Countries", held in Kuwait, 7-11 October, 1984. Theauthors with to thank the Organization of Arab PetroleumExporting Countries (OAPEC) who sponsored this semînarand kindly allowed this work to be published here.
REFERENCES
Chenet P. Y. (1984) Thermal transfer in sedimentary basins,paleotemperature reconstruction and maturation studiesin the Gulf of Lion margin. In Thermal phenomella insedimwwry basins (Edited by Durand B.), pp, 257-270.Editions Technip, Paris.
Chenet P. Y. and Letouzey J. (1983) Tectonique de la zonecomprise entre Abu Durba el Gebel Mezzazat (Sinai,
260 P. UNGERER et al.
Egypte) dans le contexte de J'évolution du Golfe deSuez. Bull. Ce1l1. Rech. Explor. Prad. El/-Aquitaine 7(1),201-215.
Chenet P. Y. t Montader! L., Gairaud H. and Roberts D. G.(1982) Extension ratio measurcments on the GaliciaPortugal and norlhern Biscay continental margins: Implications for evolutionary models of passive continentalmargins. Am. Assac. Pet. GeaI. Mem. 34 (Editcd byWatkin, J.), pp. 703-715.
Durand n. (1983) Present trends in organic geochemistry inresearch on migration of hydrocarbons. In Advallces illOrgante Geochemistry 1981 (Edited by Djomy M. et al.),pp. 117-128. Wiley, Chichester.
Durand B., Ungerer P., Chiarellî A. and Oudio 1. L., (1982)Modelisation de la migration de l'huile: Application àdeux exemples de bassins sédimentaires. Proc. IltllIVor/d. Pet. Congr., London, Sept. 1982. PDI(I), pp. 3-15.
Fleitout L. and Yuen D. (1984) Steady state, secondaryconvection beneath lithospheric plates with temperatureand pressure dependant viscosity. J. Geopllys. Res. 89,9227-9244.
Garfunkel Z. and Dartov Y. (1977) The teçtonics of the SuezRift. J. Geai. Surv. Israel?l, 1-41.
Hassouha A. D., Shafy A, Nashaat H. and Azazi G. (1984)Depositional history of Shoah-Ali field. A model forhydrocarhon exploration. EGPC 7111 Expl. or Seminar,Cairo, March 1984.
McKenzie D. (1978) Sorne rernarks on the development ofsedimentary basins. Earth Planet. Sei. Leu. 40, 25-32.
Meissner F. (1984) Petroleum geology of the Dakken For·mation, WiUiston basin, north Dakota and Montana.Am. Assac. Pet. Geai. Mem. 35(Edited by Demaison G.),pp. 159-180.
Moretli I. and Froidevaux C. (1986) Physical rnodels ofextensional tectonics. In Thermal Modelillg ill Sedimelltary Basil/s (Edited by Burrus J.). Editions Technip, Paris(in press).
Nagaty M. (1982) The seven reservoirs of the Shoab·AIi oilfield. EGPC 6tll Explor. Sem;1lar, Cairo.
Rohrback D. (1983) Crude oil geochemistry of the Gulf ofSuez. In Advanees ill Orgallic Geochemislry 1981 (Editedby Bjoroy M. et al.), pp. 39-48. WiJey, Chichester.
Scheidegger (1960) The Physics of flan' Througll PorollsMedia. University Press, Toronto.
Shahin A N. and Shebab M. M. (1984) Petroleum generation, migration and occurrence in the Gulf of Suezoffshore South Sinai. EGPC 7tll Explor. Semillar, Cairo,March 1984.
Tissot D. P. and Espitalie J. (1975) L'évolution de la matièreorganique des sédiments: application d'une simulationmathématique. Rev. IIISI. Fr. Pet. 30, 743-777.
Tissot D. P., Durand D., Espitalie J. and Comhaz A. (1974)Influence of the nature and diagenesis of organic matterin formation ofpetroleum. Am. Assoc. Pel. Geol. Bull. 58,499-506.
Ungerer P., Bessis F., Chenet P. V., Durand D., Nogaret E.,Chiarelli A, Oudin J. L. and Perrin J. F. (1984) Geolog·ical and geochemical models in oil exploration: principlesand practical examples. Am. Assac. Pet, GeaI. Mem. 35(Edited by Demaison G.), pp. 53-77.
Ungcrer P., Espitalié J., Marquis F. and Durand B. (1986)Use of kinetic models of organie matter evolution for thereconstruction of paleotemperatures. Application to theGironville weil (France). In Thermal Modeling ill Sedimentar)' Basins (Edited by Burrus J.). Editions Technip,Paris (in press).