Modelling of weather variability effect on fitophenology
28
Modelling of weather variability effect on fitophenology Zalika Črepinšek 1 , Lučka Kajfež-Bogataj 2 , Klemen Bergant 3 1,2 Biotechnical Faculty-Agronomy, University of Ljubljana, Slovenia 3 Nova Gorica Polytechnic, Slovenia Bled, ECEM/EAML 2004
Transcript of Modelling of weather variability effect on fitophenology

Modelling of weather variability effect on fitophenology
Zalika Črepinšek1, Lučka Kajfež-Bogataj2, Klemen Bergant31,2Biotechnical Faculty-Agronomy, University of Ljubljana, Slovenia
3Nova Gorica Polytechnic, Slovenia
Bled, ECEM/EAML 2004
PHENOLOGY – is the study of the TIMING OF RECURRING BIOLOGICAL PHASES, the CAUSES of their timing with regard to BIOTIC and ABIOTIC FORCES, and the INTERRELATIONS among phases of the same or different species (Lieth, 1997)

Early FORECASTING of the PHENOLOGICAL PHASES of WILD and CULTIVATED PLANTS is of great SUPPORT to VARIOUS SECTORS OF HUMAN ACTIVITY, particulary for all agricultural practices:
-SUITABILITY FOR PRODUCTION AND YIELD POTENTIAL
-LENGHT OF GROWING SEASON AND FROST FREE DAYS
-FROST DAMAGE PREVENTION
-EPIDEMIOLOGY OF DISEASES AND PESTS
-TIMING OF SOWING, SPRINKLING, HARVESTING, IRRIGATION...
-PREDICTING THE ONSET OF POLLEN SEASON
-CLIMATE CHANGE STUDIES (FUTURE AND PAST CLIMATE)
-ECOLOGICAL STUDIES (BIODIVERSITY, BIOCLIAMTIC ZONATIONS)
-AND MANY OTHERS...

WHY IS IMPORTANT TO STUDY WEATHER VARIABILITY EFFECT ON PLANTS
(PHENOLOGY) ?
We should make the best of favourable weather conditionsand try to avoid unfavourable onesto achieve optimal yield (quality and quantity)as far as food production is concerned

The aim of study was to
- EXPLAIN WEATHER VARIABILITY EFFECT ON PHENOLOGY
- WORKING OUT STATISTICAL MODELS that are able TO PREDICT LEAF UNFOLDING AND FLOWERING DATES of differents plants
The preconditions for the models were that the model developed must
- Considering PRINCIPLE OF PARSIMONIOUS
- Represent the EFFECT OF ENVIRONMENTAL FACTORS on specific phenological event
- Predict APPLICABLE PHENOLOGICAL EVENT at least three days ahead

According to INPUT DATA, the forecasting mathematical models can be distinguished as
- PHENOLOGICAL models: are based on the correlations beetwen defined phenophase and the phenophases of species other than that under consideration* these models are empirical* their formulation requires statistical analysis of long series data to identify the ‘marker species’
- PHENOCLIMATIC models: are based on the relationships beetwen the specific phenophase and the variousCLIMATOLOGICAL PARAMETERS

MATERIALS AND METHODS
PHENOLOGICAL and CLIMATE DATA were provided byENVIRONMENTAL AGENCY OF THE REPUBLIC OF
SLOVENIA (ARSO) for the period 1955-2000
Six different phenophases and 17 plants were chosen to represent FOUR GROUPS of phenological objects:
WILD HERBACEOUS PLANTS
FOREST TREES AND SHRUBS
GRASSES
FRUIT TREES
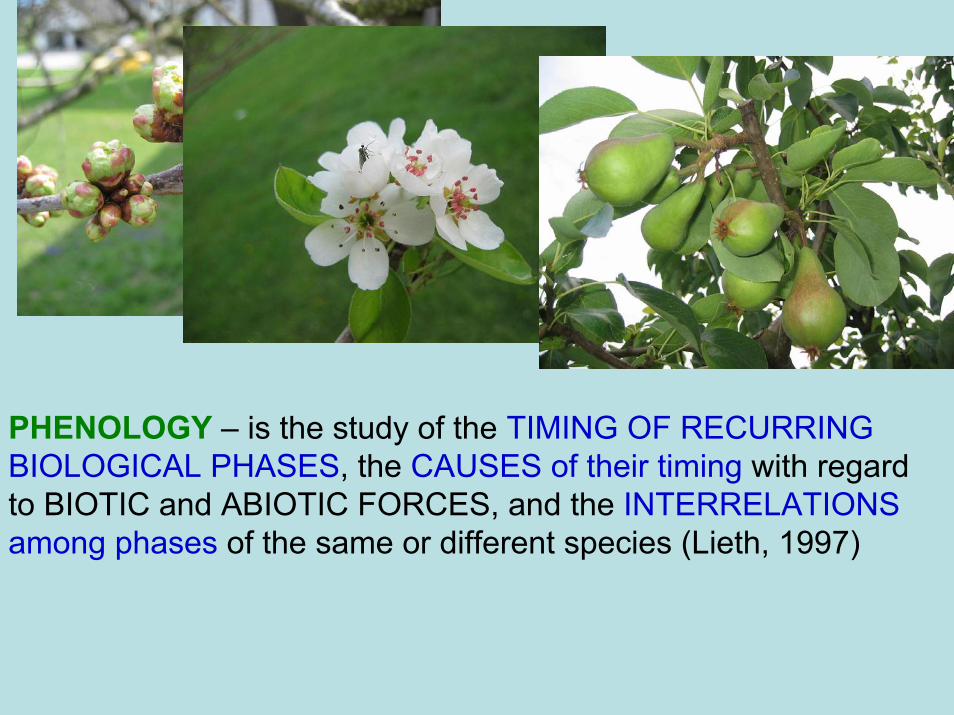
INDICATOR PLANTS
Species (Engl.) Species (Latin)- apple tree Malus domestica Borkh- beech Fagus sylvatica L.- black locust Robinia pseudacacia L.- cock’s-foot Dactylis glomerata L.- common elder Sambucus nigra L.- common lilac Syringa vulgaris L.- common silver birch Betula pendula Roth.- dandelion Taraxacum officinale Weber/Wiggers- goat willow Salix caprea L.- hazel Corylus avellana L.- horse-chestnut Aesculus hippocastanum L.- large-leaved lime Tilia platyphyllos Scop.- Norway spruce Picea abies (L.) Karsten- ox-eye daisy Leucanthemum ircutianum Turcz.- plum tree Prunus domestica L.- snowdrop Galanthus nivalis L.- spring-saffron Crocus napolitanus Mordant&Loisel.
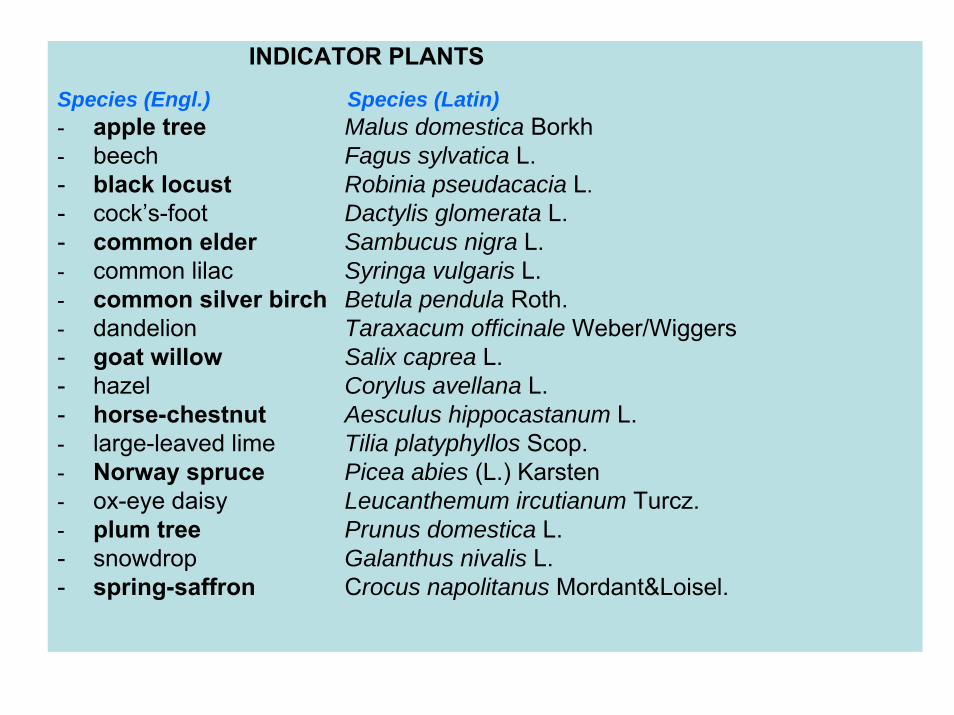
STUDIED
PHENOPHASES
LEAF UNFOLDING, NEEDLE EMERGENCE
BEGINNING OF FLOWERING, FULL FLOWERING
AUTUMNAL LEAF COLOURING
FIRST RIPE FRUITS, MATURITY
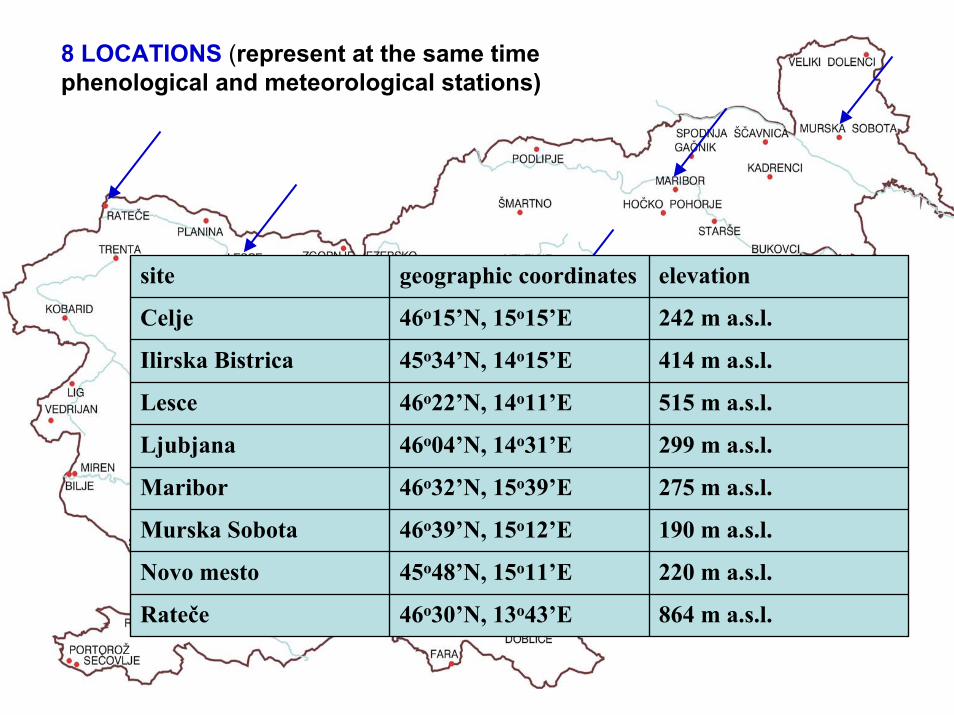
8 LOCATIONS (represent at the same time phenological and meteorological stations)
site geographic coordinates elevation
Celje 46o15’N, 15o15’E 242 m a.s.l.
Ilirska Bistrica 45o34’N, 14o15’E 414 m a.s.l.
Lesce 46o22’N, 14o11’E 515 m a.s.l.
Ljubjana 46o04’N, 14o31’E 299 m a.s.l.
Maribor 46o32’N, 15o39’E 275 m a.s.l.
Murska Sobota 46o39’N, 15o12’E 190 m a.s.l.
Novo mesto 45o48’N, 15o11’E 220 m a.s.l.
Rateče 46o30’N, 13o43’E 864 m a.s.l.

METEOROLOGICAL DATA
TEMPERATUREDaily maximumDaily minimum
Monthly minimumMonthly mean
Monthly maximum2- an 3-monthly running means
THERMAL TIMEPHOTOTHERMAL TIME
RAINFALLMonthly total amount
2- an 3-monthly running means
NAOImonthlyseasonal
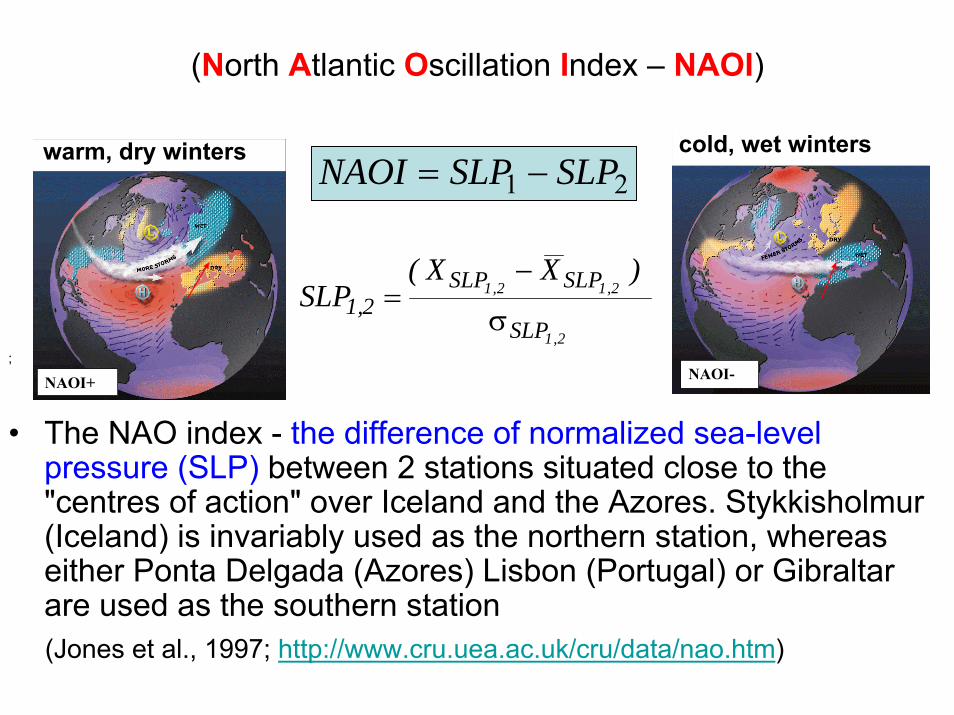
(North Atlantic Oscillation Index – NAOI)
• The NAO index - the difference of normalized sea-level pressure (SLP) between 2 stations situated close to the "centres of action" over Iceland and the Azores. Stykkisholmur(Iceland) is invariably used as the northern station, whereas either Ponta Delgada (Azores) Lisbon (Portugal) or Gibraltar are used as the southern station(Jones et al., 1997; http://www.cru.uea.ac.uk/cru/data/nao.htm)
NAOI+
NAOI-
21 SLPSLPNAOI −=
;
warm, dry winters cold, wet winters
2,1
2,12,1
SLP
SLPSLP2,1
)XX(SLP
σ
−=

PREDICTANDS were:
beginning of flowering of apple tree, plum tree, dandelion, cock’s-foot, common silver birch and large-leaved lime,
full flowering of apple tree, plum tree, hazel, black locust and common elder,
first leaf unfolding of beech, common silver birch and large-leaved lime.
- MULTIPLE LINEAR REGRESSION (Storch and Zwiers, 1999) was used to relate the occurrence dates of selected phenophases (predictand) with meteorological variables and previously observed occurrence dates of phenophases of other plants (predictors) at selected location.
- stepwise selection was used to select the relevant predictors within the entire set of available predictors
- measures of the quality of statistical models: Pearson’s correlation coefficient, Coefficient of determination, Studentized residuals (Krzanowski, 1998)
- CROSS VALIDATION METHOD, independent data set for 2000
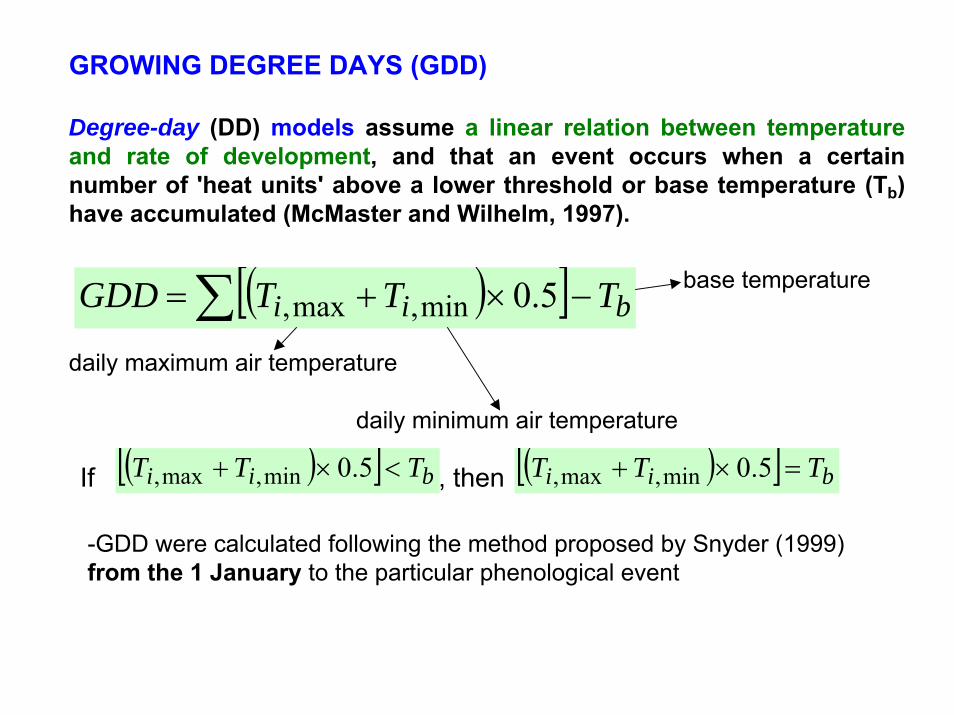
GROWING DEGREE DAYS (GDD)
Degree-day (DD) models assume a linear relation between temperature and rate of development, and that an event occurs when a certain number of 'heat units' above a lower threshold or base temperature (Tb) have accumulated (McMaster and Wilhelm, 1997).
( )[ ] bii TTTGDD −×+= ∑ 5.0min,max,
daily maximum air temperature
daily minimum air temperature
If , then ( )[ ] bii TTT <×+ 5.0min,max, ( )[ ] bii TTT =×+ 5.0min,max,
base temperature
-GDD were calculated following the method proposed by Snyder (1999) from the 1 January to the particular phenological event
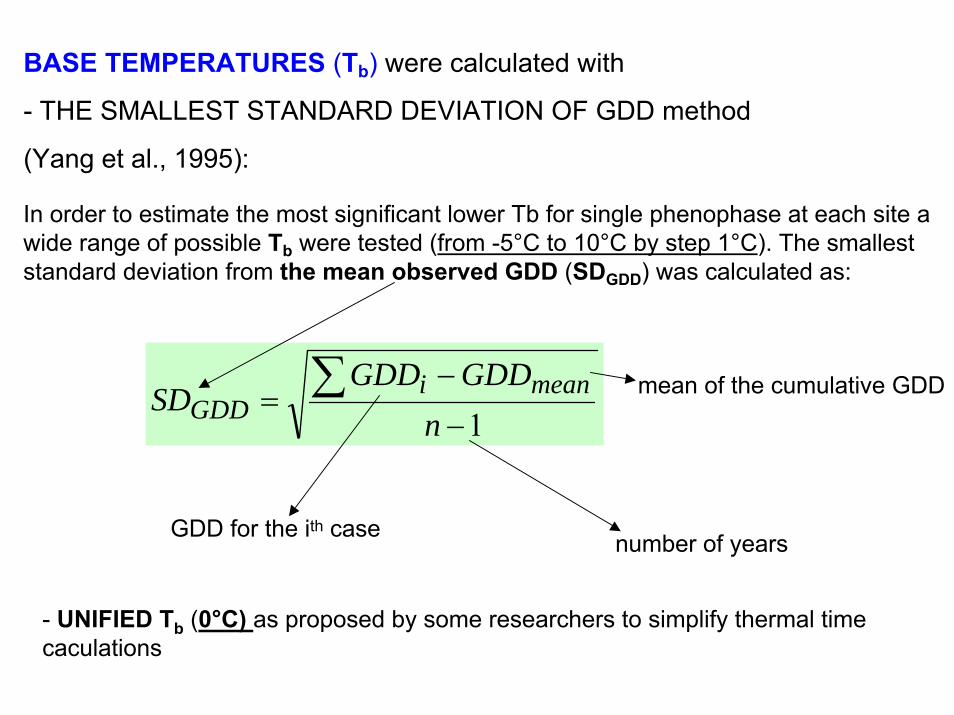
BASE TEMPERATURES (Tb) were calculated with
- THE SMALLEST STANDARD DEVIATION OF GDD method
(Yang et al., 1995):
1−−
= ∑n
GDDGDDSD meani
GDD
In order to estimate the most significant lower Tb for single phenophase at each site a wide range of possible Tb were tested (from -5°C to 10°C by step 1°C). The smallest standard deviation from the mean observed GDD (SDGDD) was calculated as:
GDD for the ith case
mean of the cumulative GDD
number of years
- UNIFIED Tb (0°C) as proposed by some researchers to simplify thermal time caculations

PHOTOTHERMAL TIME (PT) was summed according to the equation proposed by Masle et al. (1989) as:
average temperature in the light period
( )∑ −⋅= bili TTlPT ,
light period as a proportion of a day
base temperature
)( minmaxmin TTkTTl −⋅+=Tl was obtained from Tmin and Tmax using
where k was estimated empirically (Masle et al., 1989).

RESULTS• All but one of the trends of the spring records were
significant negative - earlier onset of leaf unfolding and flowering during the past decades.
• Autumnal phases of leaf colouring tented to be DELAYED
The mean linear trends (days/decade) were-1.4 for leaf unfolding-2.2 for late-spring flowering -3.1 for early-spring flowering+2 for leaf colouring
GROWING SEASON INDEX a significant negative trend of 2.2 days per decade (P<0.001), corresponding to 10 days earlier beginning of growing season over the last five decades
GROWING SEASON
EXTENDED!

- Vertical bars represent the annual early-spring flowering index (the mean of flowering dates for: Betula pendula, Taraxacum officinale, Salix caprea, Corylusavellana and Galanthus nivalis) expressed as deviations from the mean value
-30
-20
-10
0
10
20
30
1955 1960 1965 1970 1975 1980 1985 1990 1995 2000
Year
earli
er <
--- ∆
FI (d
ays)
--->
late
r
-6
-5
-4
-3
-2
-1
0
1
2
3
4
5
6
cold
er <
--- ∆
T ( °
C) -
--> w
arm
er
- The line represents the annual deviations of temperature (°C) from the spring mean temperature (February-April), 1955-2000.
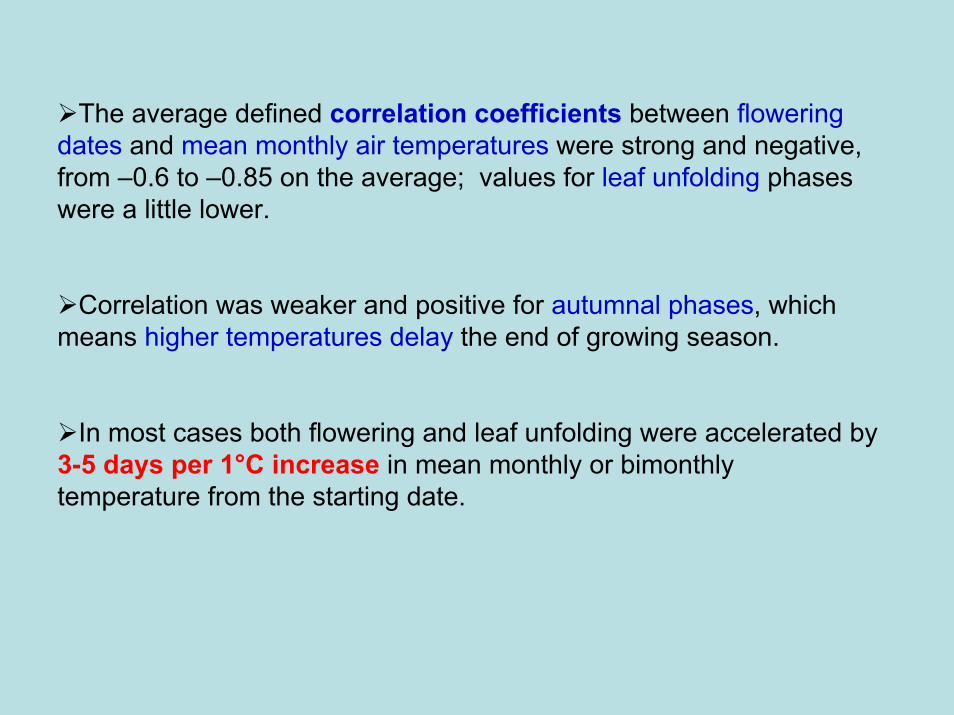
The average defined correlation coefficients between flowering dates and mean monthly air temperatures were strong and negative, from –0.6 to –0.85 on the average; values for leaf unfolding phases were a little lower.
Correlation was weaker and positive for autumnal phases, which means higher temperatures delay the end of growing season.
In most cases both flowering and leaf unfolding were accelerated by 3-5 days per 1°C increase in mean monthly or bimonthly temperature from the starting date.

Correlation between full flowering of hazel (F2–Hazel) and the average temperature from January to February in Ljubljana, 1955-2000.
The correlation coefficient of r = - 0.86 is significant with ***P<0.001.
DOY: day of the year
Flowering of hazel seemed to be most strongly accelerated by higher temperatures - nearly 8 days earlier per 1°C increment in the period January-February
F2-Hazel = 63.5 - 7.6 Tjan-febr = - 0.86
39
68
97
126
F2 -
Haz
el(D
OY
)
10-6 -4 -2 0 2 4 6
Tjan-feb (ºC)
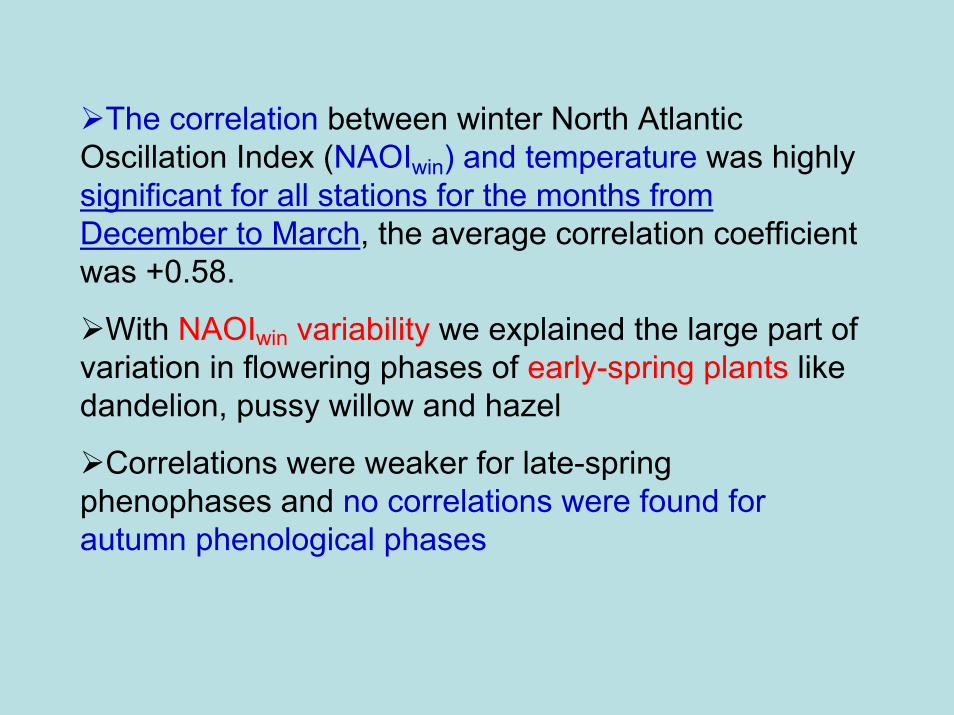
The correlation between winter North Atlantic Oscillation Index (NAOIwin) and temperature was highly significant for all stations for the months from December to March, the average correlation coefficient was +0.58.
With NAOIwin variability we explained the large part of variation in flowering phases of early-spring plants like dandelion, pussy willow and hazel
Correlations were weaker for late-spring phenophases and no correlations were found for autumn phenological phases

0
20
40
60
80
100
120
140
1955 1965 1975 1985 1995Year
F2
- H
azel
(D
OY
)
-6
-4
-2
0
2
4
6
NA
OI wi
n
NAOIwin
F2 - Hazel
Inversely-proportionality of curves of full flowering of hazel (F2 – Hazel) and winter North Atlantic Oscillation Index (NAOIwin) in Rateče, 1956-1999. The correlation coefficient of r = - 0.63 is significant with **P<0.05. DOY: day of the year.
The amount of monthly precipitation in concrete conditions was NOTsignificantly correlated to date of flowering and leaf unfolding, although it could be of importance in extremely dry years,
IN SPRING TIME THE WATER IN SLOVENIA IS USUALLY NOT LIMITATION PLANT DEVELOPMENT

Average GROWING DEGREE DAYS (GDD) above the statistical selected base temperature (Tb) for leaf unfolding of large-leaved lime and the relative coefficient of variation
Location Selected base temperature – Tb (°C)
Average growing degree days
(GDDstat in °D)
Coefficient of variation (%)
Celje 3 241 15 Ilirska Bistrica 2 321 12 Lesce 5 102 11 Ljubljana 3 258 11 Maribor 3 251 19 Murska Sobota 3 234 11 Novo mesto 3 254 21 Rateče 5 74 14
GDD were lower in Rateče and Lesce (altitude!), compared to other stations; largest sums were mostly reached in Ilirska Bistrica and Ljubljana, confirming that the same plant species needs larger amount of heat unit accumulation for its development on warm locations than in colder areas (Arnold, 1959; Perry et al., 1986).
plumF1 Predictors
(X1, X2, …Xn) (phenological phases)
Intercept (a)
Slope (b1, b2, …bn)
R2
Celje dandelionF1 -6.4 1.1 0.72
Ilirska Bistrica birchLU ; chestnuthLU . ; dandelionF1 4.5 0.37; 0.34; 0.33 0.84
Lesce lindenLU ; saffronsF .1 ; dandelionF1 34.6 0.40; 0.23; 0.16 0.72
Maribor birchLU ; dandelionF1 15.8 0.56; 0.37 0.80
Murska Sobota chestnuthLU . ; birchF1 ; hazelF2 0.66 0.50; 0.45; 0.16 0.84
Novo mesto birchLU ; hazelF2 18.0 0.77; 0.15 0.76
Rateče chestnuthF .1 ; dandelionF1 ; willowF1 -7.2 0.90; 0.35; 0.15 0.87
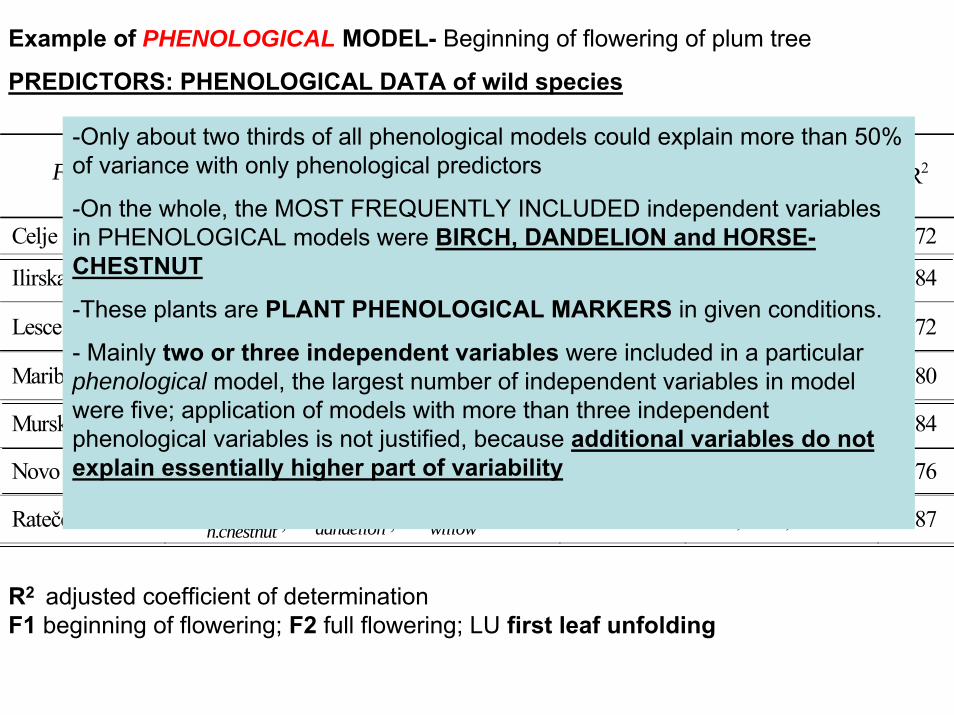
Example of PHENOLOGICAL MODEL- Beginning of flowering of plum tree
PREDICTORS: PHENOLOGICAL DATA of wild species
-Only about two thirds of all phenological models could explain more than 50% of variance with only phenological predictors
-On the whole, the MOST FREQUENTLY INCLUDED independent variablesin PHENOLOGICAL models were BIRCH, DANDELION and HORSE-CHESTNUT
-These plants are PLANT PHENOLOGICAL MARKERS in given conditions.
- Mainly two or three independent variables were included in a particular phenological model, the largest number of independent variables in model were five; application of models with more than three independent phenological variables is not justified, because additional variables do not explain essentially higher part of variability
R2 adjusted coefficient of determination F1 beginning of flowering; F2 full flowering; LU first leaf unfolding
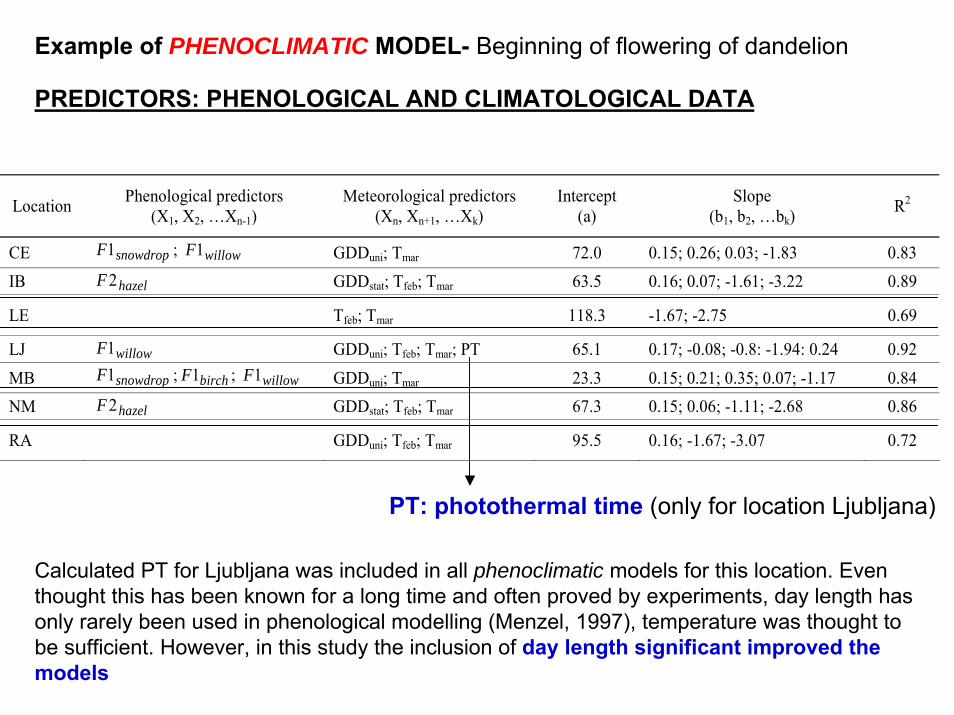
Example of PHENOCLIMATIC MODEL- Beginning of flowering of dandelion
PREDICTORS: PHENOLOGICAL AND CLIMATOLOGICAL DATA
Location Phenological predictors (X1, X2, …Xn-1)
Meteorological predictors (Xn, Xn+1, …Xk)
Intercept (a)
Slope (b1, b2, …bk)
R2
CE snowdropF1 ; willowF1 GDDuni; Tmar 72.0 0.15; 0.26; 0.03; -1.83 0.83 IB hazelF2 GDDstat; Tfeb; Tmar 63.5 0.16; 0.07; -1.61; -3.22 0.89
LE Tfeb; Tmar 118.3 -1.67; -2.75 0.69
LJ willowF1 GDDuni; Tfeb; Tmar; PT 65.1 0.17; -0.08; -0.8: -1.94: 0.24 0.92
MB snowdropF1 ; birchF1 ; willowF1 GDDuni; Tmar 23.3 0.15; 0.21; 0.35; 0.07; -1.17 0.84 NM hazelF2 GDDstat; Tfeb; Tmar 67.3 0.15; 0.06; -1.11; -2.68 0.86
RA GDDuni; Tfeb; Tmar 95.5 0.16; -1.67; -3.07 0.72
PT: photothermal time (only for location Ljubljana)
Calculated PT for Ljubljana was included in all phenoclimatic models for this location. Even thought this has been known for a long time and often proved by experiments, day length has only rarely been used in phenological modelling (Menzel, 1997), temperature was thought to be sufficient. However, in this study the inclusion of day length significant improved the models

• Precipitations and NAOI were included in smaller number of models. Comparatively small part of the whole variability can be explained by those two independent variables. This may be also a result of intercorrelations between TEMPERATURE, NAO and precipitations.
• In phenoclimatic modelling, the GDD and mean monthly temperatures appeared to be the best parameters, although the coefficient of determination increased when the other variables (precipitations, PT, NAOI) were taken into account

CONCLUSIONS- PHENOLOGY models are IMPORTANT TOOLS in a wide range of issues suchas AGRICULTURE, FORESTRY, CLIMATE CHANGES, AEROBIOLOGY...
- PHENOLOGICAL EVENTS VARIED greatly among years, this variation ishighly INFLUENCED by CLIMATE factors, particularly TEMPERATURE
- The MOST FREQUENTLY included INDEPENDENT VARIABLES in PHENOLOGICAL MODELS were: birch, dandelion and horse-chestnut, these plants may be used as PHENOLOGICAL MARKERS IN GIVEN CONDITIONS

- PHENOCLIMATIC MODELS showed TEMPERATURE and its derivatives to be THE MAJOR DRIVING FORCE for the onset of leaf unfolding and flowering
- Different thresholds temperatures have been selected for different LOCATIONS for computing GDD with the smallest SDGDD method, the SAME SPECIES in DIFFERENT LOCATIONS showed ADAPTATION to different environmental conditions
- Considering the high year-to-year variability of phenological events, the models presented provide SATISFACTORY ESTIMATIONS of the leaf unfolding and flowering dates
- Formal equations presented in this study could be powerfully EXTENDED AND APPLIED TO OTHER SITES AND PLANTS, if sufficiently LONG TIME SERIES OF PHENOLOGICAL AND METEOROLOGICAL DATA are available.