More success on severe weather - ECMWF
40
ECMWF Newsletter No. 118 – Winter 2008/09 1 Contents Editorial .......................................... 1 News ECMWF’s plan for 2009 ............................. 2 New items on the ECMWF website .................... 3 Changes to the operational forecasting system........... 3 Survey of readers of the ECMWF Newsletter ............ 4 70 th Council session on 2–3 December 2008 ............ 4 Use of high performance computing in meteorology ...... 5 Atmosphere-Ocean Interaction ........................ 5 Applying for computing resources for Special Projects ..... 7 Use of GIS/OGC standards in meteorology .............. 8 Additional ERA-Interim products available ............... 9 ECMWF workshops and scientific meetings in 2009 ..... 10 Meteorology EUROSIP: multi-model seasonal forecasting ............ 10 Using ECMWF products in global marine drift forecasting services ................ 16 Record-setting performance of the ECMWF IFS in medium-range tropical cyclone track prediction ....... 20 General Special Project computer allocations for 2009–2011 ...... 27 Member State computer allocations for 2009 ........... 33 Responsibilities of Representatives and Contact Points . . . 33 TAC Representatives, Computing Representatives and Meteorological Contact Points ....................... 34 ECMWF Council and its committees .................. 35 ECMWF Calendar 2009 ............................. 36 ECMWF publications ............................... 36 Index of past newsletter articles...................... 37 Useful names and telephone numbers within ECMWF .... 39 Publication policy The ECMWF Newsletter is published quarterly. Its purpose is to make users of ECMWF products, collaborators with ECMWF and the wider meteorological community aware of new devel- opments at ECMWF and the use that can be made of ECMWF products. Most articles are prepared by staff at ECMWF, but articles are also welcome from people working elsewhere, especially those from Member States and Co-operating States. The ECMWF Newsletter is not peer-reviewed. Editor: Bob Riddaway Typesetting and Graphics: Rob Hine Any queries about the content or distribution of the ECMWF Newsletter should be sent to [email protected] Contacting ECMWF Shinfield Park, Reading, Berkshire RG2 9AX, UK Fax: ...............................+44 118 986 9450 Telephone: National ..................0118 949 9000 International ............+44 118 949 9000 ECMWF website ..................http://www.ecmwf.int EDITORIAL More success on severe weather In the last issue of the ECMWF Newsletter, Dominique Marbouty commented on some recent successful forecasts of severe weather. Also in a previous issue, I commented on the rapid progress of the IFS physical parametrizations. New developments offer an opportunity for further comment and to link these two topics. Firstly, the article by Mike Fiorino in this issue eloquently expresses the high appreciation of forecasters at the National Hurricane Center, Miami, for the recent upgrades in resolution and physics of the IFS and their exceptional impact on the quality of the track forecasts of tropical cyclones. He calls it a “record-setting performance”. Secondly, the recent exceptional winter storm that hit Spain and South-Western France on 24 January 2009 demon- strated once again the remarkable ability of our forecasts to anticipate a severe event. How are these successes related to recent changes in our forecasting system? At ECMWF we have improved resolution, all aspects of the physics, and are using more and more satellite data. So should we say that improve- ments of severe weather forecasts are just a consequence of general improvement? Almost certainly there is some truth in such a statement. However, there are also elements indicating that some specific progress has been achieved for severe weather. We closely monitor various aspects of the forecast skill and are acutely aware of the difficulty of reaching statistic- ally significant conclusions for severe weather. But all recent studies indicate that forecasts of significant events have progressed more rapidly than ‘general forecasts’. In fact, we have implemented a number of upgrades that have had a specific impact on severe weather forecasts. The change in the convection scheme stressed by Mike Fiorino is one of them. In addition the microwave radiances acquired by a number of satellites in rainy regions over the oceans are now being assimilated. This has a maximum impact in tropical regions with high rainfall rates. We are about to implement a major change in the way we control the quality of observations, by comparing them to the background forecasts (the so-called Huber norm). This will enable the use of more observations in severe weather areas. The upcoming implementation of Ensemble Data Assimilation will also help. Finally the impact of resolution needs to be stressed once more. Severe weather events most often develop at small scale within larger-scale atmospheric features and benefit more from increasing resolution than normal forecasts. The upcoming increase in resolution, that will push the ECMWF deterministic forecasts to a 16-km grid size and the EPS to a 32-km grid size, will bring further improvements. As I am now leaving ECMWF to face new challenges, I am proud to have been able to contribute to this progress over the last six years. I wish ECMWF success in continuing on this fast track of progress. Philippe Bougeault EDITORIAL
-
Upload
khangminh22 -
Category
Documents
-
view
4 -
download
0
Transcript of More success on severe weather - ECMWF

ECMWF Newsletter No. 118 – Winter 2008/09
1
ContentsEditorial . . . . . . . . . . . . . . . . . . . . . . . . . . . . . . . . . . . . . . . . . . 1
NewsECMWF’s plan for 2009 . . . . . . . . . . . . . . . . . . . . . . . . . . . . . 2
New items on the ECMWF website . . . . . . . . . . . . . . . . . . . . 3
Changes to the operational forecasting system. . . . . . . . . . . 3
Survey of readers of the ECMWF Newsletter . . . . . . . . . . . . 4
70th Council session on 2–3 December 2008 . . . . . . . . . . . . 4
Use of high performance computing in meteorology . . . . . . 5
Atmosphere-Ocean Interaction. . . . . . . . . . . . . . . . . . . . . . . . 5
Applying for computing resources for Special Projects . . . . . 7
Use of GIS/OGC standards in meteorology . . . . . . . . . . . . . . 8
Additional ERA-Interim products available . . . . . . . . . . . . . . . 9
ECMWF workshops and scientific meetings in 2009 . . . . . 10
MeteorologyEUROSIP: multi-model seasonal forecasting . . . . . . . . . . . . 10
Using ECMWF products inglobal marine drift forecasting services . . . . . . . . . . . . . . . . 16
Record-setting performance of the ECMWF IFSin medium-range tropical cyclone track prediction . . . . . . . 20
GeneralSpecial Project computer allocations for 2009–2011 . . . . . . 27
Member State computer allocations for 2009 . . . . . . . . . . . 33
Responsibilities of Representatives and Contact Points . . . 33
TAC Representatives, Computing Representatives andMeteorological Contact Points . . . . . . . . . . . . . . . . . . . . . . . 34
ECMWF Council and its committees . . . . . . . . . . . . . . . . . . 35
ECMWF Calendar 2009 . . . . . . . . . . . . . . . . . . . . . . . . . . . . . 36
ECMWF publications. . . . . . . . . . . . . . . . . . . . . . . . . . . . . . . 36
Index of past newsletter articles. . . . . . . . . . . . . . . . . . . . . . 37
Useful names and telephone numbers within ECMWF . . . . 39
Publication policyThe ECMWF Newsletter is published quarterly. Its purpose is tomake users of ECMWF products, collaborators with ECMWFand the wider meteorological community aware of new devel-opments at ECMWF and the use that can be made of ECMWFproducts. Most articles are prepared by staff at ECMWF, butarticles are also welcome from people working elsewhere,especially those from Member States and Co-operating States.The ECMWF Newsletter is not peer-reviewed.
Editor: Bob Riddaway
Typesetting and Graphics: Rob Hine
Any queries about the content or distribution of the ECMWFNewsletter should be sent to [email protected]
Contacting ECMWFShinfield Park, Reading, Berkshire RG2 9AX, UK
Fax: . . . . . . . . . . . . . . . . . . . . . . . . . . . . . . .+44 118 986 9450
Telephone: National . . . . . . . . . . . . . . . . . .0118 949 9000
International . . . . . . . . . . . .+44 118 949 9000
ECMWF website . . . . . . . . . . . . . . . . . .http://www.ecmwf.int
EDITORIAL
More success on severe weather
In the last issue of the ECMWF Newsletter, DominiqueMarbouty commented on some recent successful forecastsof severe weather. Also in a previous issue, I commentedon the rapid progress of the IFS physical parametrizations.New developments offer an opportunity for furthercomment and to link these two topics.Firstly, the article by Mike Fiorino in this issue eloquently
expresses the high appreciation of forecasters at theNational Hurricane Center, Miami, for the recent upgradesin resolution and physics of the IFS and their exceptionalimpact on the quality of the track forecasts of tropicalcyclones. He calls it a “record-setting performance”.Secondly, the recent exceptional winter storm that hit Spainand South-Western France on 24 January 2009 demon-strated once again the remarkable ability of our forecaststo anticipate a severe event.How are these successes related to recent changes in
our forecasting system? At ECMWF we have improvedresolution, all aspects of the physics, and are using moreand more satellite data. So should we say that improve-ments of severe weather forecasts are just a consequenceof general improvement? Almost certainly there is sometruth in such a statement. However, there are also elementsindicating that some specific progress has been achievedfor severe weather.We closely monitor various aspects of the forecast skill
and are acutely aware of the difficulty of reaching statistic-ally significant conclusions for severe weather. But allrecent studies indicate that forecasts of significant eventshave progressed more rapidly than ‘general forecasts’. Infact, we have implemented a number of upgrades that havehad a specific impact on severe weather forecasts. Thechange in the convection scheme stressed by Mike Fiorinois one of them. In addition the microwave radiancesacquired by a number of satellites in rainy regions over theoceans are now being assimilated. This has a maximumimpact in tropical regions with high rainfall rates. We areabout to implement a major change in the way we controlthe quality of observations, by comparing them to thebackground forecasts (the so-called Huber norm). This willenable the use of more observations in severe weatherareas. The upcoming implementation of Ensemble DataAssimilation will also help.Finally the impact of resolution needs to be stressed
once more. Severe weather events most often develop atsmall scale within larger-scale atmospheric features andbenefit more from increasing resolution than normalforecasts. The upcoming increase in resolution, that willpush the ECMWF deterministic forecasts to a 16-km gridsize and the EPS to a 32-km grid size, will bring furtherimprovements.As I am now leaving ECMWF to face new challenges, I
am proud to have been able to contribute to this progressover the last six years. I wish ECMWF success in continuingon this fast track of progress.
Philippe Bougeault
EDITORIAL

ECMWF Newsletter No. 118 – Winter 2008/09
2
NEWS
DOMINIQUE MARBOUTY
THE PLANS for 2009 will build uponour achievements in 2008 whichincluded:� Merging of the VarEPS and monthlyforecasting systems, now designatedas the EPS.� Implementing two new cycles,including in particular several changesto the physics.� Successful early forecasting ofseveral severe weather events, particu-larly tropical cyclones (see editorial).� Installing the first cluster of thenew IBM supercomputer.� Preparing the future Atmosphericand Climate Services of GMES (GlobalMonitoring for Environment andSecurity) with our Member States andthe European Commission.
The ECMWF plans for 2009 flowdirectly from the four-year pro-gramme of activities 2009–2012,adopted by the ECMWF Council at its70th session in December 2008 (theprogramme itself is available atwww.ecmwf.int/about/programmatic). Themain drivers of this programme are:� Continuous improvement of earlywarning for severe weather.� Support to our Member States,including interoperability, relevantproducts and feedback into theobserving system.� Preparation for future challenges,in particular non-hydrostatic globalmodelling and massively parallelsupercomputer architecture.
The most visible development willbe the resolution upgrade of all fore-casting systems. The plan is to increasethe horizontal resolutions as quickly aspossible after the computer upgrade,hopefully by the end of the year.Experimentation has started withhorizontal grids of 16 km for thedeterministic and assimilation outer-loop systems and 32/50 km for theEPS. This will be followed by anincrease of the vertical grid to about150 levels in 2010. These upgrades willresult in improved forecast skill, inparticular for severe weather events.
Another important step will bethe implementation of an EnsembleData Assimilation (EnDA) system as anew component of the operationalforecasting system. It will be basedon a ten-member ensemble at 50-kmouter-loop resolution and will first beused to initialise the EPS. Improve-ments are expected especially in thetropics, where the spread will increase.The EnDA suite will then be furtherdeveloped to provide flow-dependentbackground error variances for use inthe high-resolution data assimilation.A positive impact is expected in theregions of severe weatherdevelopments.
As usual we will make specificeffort to assimilate new satellite data.This includes, in particular, data fromsounding instruments on the USsatellites NOAA-N' and DMSP-17, andfrom the Chinese satellite FY-3A.Another development in this area willbe the first assimilation of cloud-affected radiances from infraredsounders AIRS and IASI and fromSEVIRI. We will also start direct assimi-lation of rain-affected radiances in4D-Var.
In addition, many improvementsdeveloped in recent years for thedifferent parts of the forecastingsystem will be implemented in thethree new cycles expected this year.This includes:� An extended Kalman-filter soil-moisture assimilation scheme.� Coupling of ocean waves withocean currents.� New stochastic physics in the EPSand EnDA.� Several further changes in thephysics of the model concerning therepresentation of clouds, precipita-tion and snow on the ground.
A routine evaluation of the forecastsensitivity to individual observationsby adjoint methods will also be imple-mented. This will add to our currentset of tools to monitor the operationalobservation system.
Verification enhancement has beenan important subject recently. This
will continue with emphasis on severeweather and monitoring of long-termprogress, in liaison with a dedicatedsubgroup set up by the TechnicalAdvisory Committee. Also the verifi-cation suite will be extended to newareas such as waves, monthly fore-casts and the use of the TIGGEdatabase for comparison with otherEPSs. More scores will be provided onour website.
The ongoing effort in developingnew products for our Member Stateswill focus on the Extreme ForecastIndex (EFI), tropical and extra-tropicalcyclone tracks, and circulationpatterns. We will start re-engineeringour external website in order to offerhigh availability and more inter-activity.
The ERA-Interim production willreach present time early in 2009. Itwill then be continued in delayedmode. A set of new products targetedtowards monitoring current climateanomalies (e.g. surface temperatureand rainfall) will be progressivelydeveloped and made available on theERA-Interim server.
Two main actions will concern thecomputing infrastructure.� The installation of Phase 1 of thenew IBM supercomputer will becompleted and all operational suitesand tools migrated accordingly.� The procurement process for a newautomated tape library will becompleted by June and the replace-ment is expected to start by the endof the year.
In addition, the procurementprocess for the supercomputer andthe latest advances in powerconsumption management will bereviewed.
Two important long-term internalprojects will be further developed.One concerns the reorganisation ofour facilities for observation archivingand manipulation. The other dealswith preparing the IFS code structurefor future massively parallelcomputers, improved modularisation,and better interoperability with our
ECMWF’s plan for 2009

ECMWF Newsletter No. 118 – Winter 2008/09
3
NEWS
Member States’ NWP systems.Increasing the Centre’s support to
the European Union has been animportant element in ECMWF policyover the recent years, in particularwithin the GMES initiative. In 2009the pilot atmosphere service project(GEMS) will come to an end and bereplaced and expanded with the newMonitoring Atmospheric Composi-tion and Climate (MACC) project, alsoco-ordinated by ECMWF. Anotherimportant area of discussion withinGMES will be the possible contribu-
tion of ECMWF to the development ofClimate Services, specifically with thedevelopment of a new-generationreanalysis.
ECMWF will continue to improveits governance and financial manage-ment. This year’s focus will be ontesting the activity-based costingscheme developed in 2008, evaluatingthe consequences of adopting theInternational Public Sector Account-ing Standards (IPSAS), and starting anIT risk analysis.
The process of accepting the
DAVID RICHARDSON
THE FOLLOWING are new data sourcesthat have been monitored in theoperational data assimilation system:� Wind profile data from 38additional European radar stationssince 28 October 2008.� Cloud motion winds from theChinese FY-2 geostationary satellitesince 25 November 2008.
As preparation is underway totransfer the operational suite to thenew high performance computer,there have been no major changes tothe operational forecasting systemsince the last issue of the ECMWFNewsletter.
ANDY BRADY
Overview of Co-operationECMWF pursues extensive scientificand technical collaboration, inparticular with its Member States,with satellite agencies and with theEuropean Commission. It participatesin several programmes of the WorldMeteorological Organization (WMO)and contributes to climatemonitoring in co-operation with theclimate community.� www.ecmwf.int/about/cooperation/
ECMWF Calendar 2009The ECMWF Calendar has beenreleased and will be updatedthroughout the year as new events areorganised or existing events arechanged. All educational events,workshops, technical and scientificmeetings and committee meetingsare listed. The page that is on our website is the definitive version of thisinformation.� www.ecmwf.int/newsevents/calendar/
13th Workshop on the Use of HighPerformance Computing inMeteorologyThe workshop was held in Novemberand the presentations are nowavailable. Every second year ECMWFhosts a workshop on the use of highperformance computing inmeteorology. The emphasis of this
workshop was on runningmeteorological applications atsustained teraflops performance in aproduction environment. Particularemphasis was placed on the futurescalability of NWP codes and the toolsand development environments tofacilitate this. There is informationabout this workshop on page 5 of thisedition of the ECMWF Newsletter.� www.ecmwf.int/newsevents/meetings/
workshops/2008/high_performance_computing_13th/
Workshop on Atmosphere-OceanInteractionThe workshop was held in Novemberand the presentations are nowavailable. The workshop addressedthe requirements for ocean-atmosphere coupling from the veryshort time scales to the monthlytime range with focus on ocean near-surface processes.
There is information about thisworkshop on page 5 of this edition ofthe ECMWF Newsletter.� www.ecmwf.int/newsevents/meetings/
workshops/2008/ocean_atmosphere_interaction/
Workshop on the use of GIS/OGCstandards in meteorologyThe workshop on GIS/OGC was held atthe end of November and the presen-tations are now available. The work-shop was jointly organised by Météo-France, the UK Met Office and ECMWF.The aim of this workshop was toreview the use of OGC standards ingeo-sciences in Europe and worldwideand to promote collaboration betweenmeteorological services in order to
amended Convention is progressingand is expected to be completed thisyear. It will open the door for newStates (or current Co-operating States)to join ECMWF as Members. Alsonegotiation will be continued withthose States that expressed interest indeveloping co-operation with ECMWF.
Our Member States clearlyindicated that they are willing tosupport this ambitious plan and areconfident that its targets will beachieved. We will do our utmost tomeet their expectations.
New items on theECMWF website
define a set of common standards thatwill enhance interoperability. There isinformation about this workshop onpage 8 of this edition of the ECMWFNewsletter.� www.ecmwf.int/newsevents/meetings/
workshops/2008/OGC_workshop/
ERA-Interim daily and monthlyproducts now available for1989–2005Both the MARS and the public ECMWFData Server now contain daily andmonthly products for the ECMWFInterim Reanalysis for the 17-yearperiod 1989–2005.� www.ecmwf.int/research/era/
Changes to theoperationalforecasting system

ECMWF Newsletter No. 118 – Winter 2008/09
4
NEWS
BOB RIDDAWAY
THE FIRST ECMWF Newsletter waspublished in February 1980. Sincethen there have been significantchanges to the content and presenta-tion of articles. During that period,however, the purpose of the Newsletterhas remained essentially unchanged.It is intended to make users of ECMWFproducts, collaborators with ECMWFand the wider meteorological commu-nity aware of new developments atECMWF and the use that can be madeof ECMWF products. As well as about1,400 printed copies of the Newsletterbeing distributed each quarter, theNewsletter is also available fromwww.ecmwf.int/publications/newsletters/.
Every effort is made to try toensure that the Newsletter meets theneeds of readers, though it is difficultto know whether this is indeed thecase. Very occasionally there is someunsolicited feedback but that is not afirm basis for making decisions aboutthe future development of theNewsletter. Consequently it has beendecided that, after over 100 issues ofthe Newsletter having been published,this is an appropriate time to carryout a survey of readers.
It would be appreciated if readersof the Newsletter would find time tofill in a questionnaire that can beaccessed by going towww.ecmwf.int/publications/newsletters/and following the link. The question-
Survey of readers of the ECMWF Newsletter
naire has two parts which cover:� Factual information about theperson filling in the questionnaire.� Views about how various aspects ofthe Newsletter are rated.
As there are only 12 questions itshould take just a few minutes tocomplete the questionnaire. The morepeople there are that fill in thequestionnaire the better able we willbe get a true picture of the usefulnessand accessibility of the Newsletter.
The responses to the questionnairewill be carefully assessed and, ifnecessary, action will be taken todevelop the content and presentationof the Newsletter so that it continuesto meets the needs of the meteoro-logical community.
MANFRED KLÖPPEL
CHAIRED by its President, Dr AdéritoVicente Serrão from Portugal, theECMWF Council held its 70th sessionin Reading on 2–3 December 2008.
Besides several decisions made onfinancial and staff matters (e.g.adoption of Reports from the Co-ordi-nating Committee on Remunerationand amendments to the FinancialRegulations), the Council made somemilestone decisions.� Pension Scheme. The Councilunanimously decided on a long-termsolution to the funding of the Budget-ised Pension Scheme.� Budget 2009. The Councilapproved the budget for 2009including increased expenditures forthe Centre’s new High PerformanceComputer Facility.� Process regarding accession of newMember States. The Councilunanimously authorised the Directorto start negotiations on fullmembership with those States thathave already concluded a co-operation agreement for eventualaccession to the ECMWF Convention
and with EU Member States that wishto accede to the ECMWF Convention.The Council also adopted templatetexts for a Council resolution on theaccession of a State to the ECMWFConvention, and for an agreement onaccession to the ECMWF Conventionand related terms and conditions.� GMES (Global Monitoring forEnvironment and Security) Products.The Council unanimously agreed thatfree access to ECMWF data andproducts will be given to the GMESpre-operational Core Services thathave already been decided.� Products for WMO. The Councilunanimously agreed that the resolu-tion of the products made available toWMO Members be increased from the
current 2.5° to a 0.5° latitude/longitudegrid.� Four-Year Programme of Activities.The Council unanimously adoptedthe updated “Four-Year Programme ofActivities” for the period 2009–2012(for further information seewww.ecmwf.int/about/programmatic/).
Other important results of thissession were as follows.� IPSAS and INTOSAI. The Councilagreed an action plan for considera-tion of IPSAS and INTOSAI financialstandards in order to prepare a finaldecision by the end of 2009.� RMDCN. The Council agreed thatthe ECMWF funded RMDCN (RegionalMeteorological Data CommunicationNetwork) basic package for Member
70th Council session on 2–3 December 2008

ECMWF Newsletter No. 118 – Winter 2008/09
5
NEWS
States be upgraded.� EUROSIP. The Council agreed theprovision of a set of real-timeseasonal forecast data to WMO LeadCentres for Long Range ForecastMulti-Model Ensemble.� Scientific Advisory Committee.Council appointed Dr Piero Lionello,
Dr Robert Vautard, and Dr JanBarkmeijer to the Scientific AdvisoryCommittee for a first term of office.� Election of President and Vice-President. Dr Adérito Vicente Serrãofrom Portugal and Mr Wolfgang Kuschfrom Germany were re-elected asPresident and Vice-President of the
GEORGE MOZDZYNSKI
EVERY second year ECMWF hosts aworkshop on the use of high perform-ance computing in meteorology. The13th workshop in this series took placefrom 3 to 7 November 2008 and wasattended by over 100 participantsfrom Meteorological Services,research institutions and computervendors, coming from 25 differentcountries in Europe, Asia, Africa, theAmericas and Australia. The emphasisof this workshop was on runningmeteorological applications atsustained teraflops performance in aproduction environment, and inparticular on the future scalability ofNWP codes and the tools anddevelopment environments tofacilitate this.At the workshop there were 36presentations covering a wide rangeof topics including:� High performance computing atvarious forecasting centres.� Current and future products fromvendors of supercomputers.� Developments in parallel comput-ing techniques.
This is the logo for this workshop which illustrates the computational imbalance in IFS physicsfor a T799 model running with 2048 processors over a 6-hour period. See the text for moreinformation.
Council, respectively, both for a thirdterm of office of one year.
Dr Adrian Simmons (Co-ordinatorfor ECMWF activities in GMES) gave alecture to the Council on “Achieve-ments of the GEMS Project”.
The 71st Council session will takeplace on 25–26 June 2009.
Use of high performance computing in meteorology
� Tools to exploit the power of super-computers.
Presentations from this workshopcan be found at the following weblocation:� www.ecmwf.int/newsevents/meetings/
workshops/2008/high_performance_computing_13th/presentations/The figure shows the logo for this
workshop. It illustrates the computa-
tional imbalance in IFS physics for aT799 model running with 2048processors over a 6-hour period.Partitions coloured dark blue indicatethe lowest computational cost, whilethose at the other end of thespectrum (i.e. red) indicate thehighest computational cost. Suchdynamic imbalances are just one ofthe areas being investigated as part ofa project to improve IFS scalability.
ANTON BELJAARS, FREDERIC VITART,PETER JANSSEN
A WORKSHOP on ‘Atmosphere-OceanInteraction’ was held at ECMWF from10 to 12 November 2008. The objectiveof the workshop was to address therequirements for ocean-atmospherecoupling from the very short timeranges to the seasonal time range with
focus on ocean near-surface processes.Also the following questions were tobe considered.� Which processes need to be takeninto account (e.g. ocean waves,currents, diurnal cycle of SST, oceanmixed layer dynamics and horizontalresolution of SST)?� What is the impact of air-seaprocesses on atmospheric phenomena,
including extreme events (e.g. tropicalcyclones, extra-tropical explosivegenesis, monsoons and MJO)?� Which models are the mostappropriate at different time scales,and what are the implications forseamless forecasting?
This workshop attracted about 25scientists from outside ECMWF and 14scientists from France, Germany,
Atmosphere-Ocean Interaction

ECMWF Newsletter No. 118 – Winter 2008/09
6
NEWS
Sweden, UK and USA were invited togive a presentation. The talks wereorganized in two sessions – see theinformation in the box.
The presentations were followed bytwo working groups that reviewed anarea of research and made recommen-dations for further research. Consider-ation was given to three time scales:short to 10 days, monthly, and seasonal.
Working group 1: Processes ofatmosphere-ocean interactionThe discussion was organized aroundthree topics: ocean processes, forcingand technical implementation, andconsideration was given to three timescales: short to 10 days, monthly, andseasonal.
For all topics it was emphasizedthat verification through comparisonwith observations should play animportant role in any model develop-ment. Also it was recognized thatocean initialization of sea surfacetemperatures (SSTs) is key for goodforecasts at all time scales. The deeperocean needs to have compatibletemperature to avoid any shockeffects. Initialization of sea ice con-centration is similarly important.
A good representation of thediurnal cycle in SST was generallyconsidered as a high priority for alltime scales because it affects theintra-seasonal variability throughcoupling with convective systems. Itwas further argued that relativelysimple single column models of theupper ocean could be a useful way of
providing coupling with the ocean upto the monthly time scale, withouthaving the complexity of a full oceancirculation model.
Representation of the evolution ofsea ice concentration is important forthe seasonal time scale but can evenplay a non-negligible regional role inthe short range. Fluxes from openfractions within the sea ice (leads) aresubstantial and need to be represen-ted in models.
Having high-resolution oceanmodels is important for the represen-tation of, for example, the westernboundary currents, but it wasconsidered that eddy resolving modelsdo not provide sufficient benefit tojustify the costs.
New results on turbulent exchangein the atmospheric surface layer werediscussed extensively. It is generallyaccepted now that Monin-Obukhovsimilarity also applies to the marineboundary layer and that the samestability functions can be used as overland. The other good news is that aconsensus seems to exist amongobservationalists about transfercoefficients. The uncertainty is onlyabout 10% and the ECMWF scheme iswithin this range.
Wave effects are generally acceptedas an important factor in the air-seaexchange processes. With the opera-tional wave model, ECMWF is in a verygood position to explore variousmechanisms related to waves. Thetransfer coefficients are already wavedependent, but also momentum
Workshop presentationsSession 1: Atmosphere-oceaninteraction processesPresentations were given on oceanmixing models, air-sea transfer,wind/SST coupling, and the effectsof waves and currents. The role ofthe diurnal warm layer and theocean-mixing layer wereemphasized including itsinteraction with atmosphericconvection and intra-seasonalvariability.
Session 2: Impact of air-seainteraction on the atmosphereSeveral talks showed that air-seainteraction was important for theprediction of tropical cyclones,extratropical transition of tropicalcyclones, extratropical cyclones,the Indian monsoon, the MaddenJulian Oscillation and ENSO. Forexample, it was shown that a goodrepresentation of ocean processescan lead to a better prediction oftropical cyclone intensity. Othertalks discussed the importance of agood representation of sea ice formedium-range and seasonalforecasting. A final presentationdiscussed several softwaretechniques for coupling theoceanic and atmospheric models.
The workshop programme andthe presentations are available at:� www.ecmwf.int/newsevents/
meetings/workshops/2008/ocean_atmosphere_interaction/
transfer from swell to the atmosphereand directional effects on the surfacestress should be explored. Alsocurrents are seen as a non-negligibleaspect of the coupling, not in the leastbecause they affect the interpretationof scatterometer data.
The software aspects of couplingdifferent models (atmosphere model,diurnal cycle model, one-dimensionalocean mixing model, wave model andocean circulation model) can be quiteoverwhelming. Different technicalsolutions exist (ranging from universalcoupling software to models integratedin one executable), but the optimal

ECMWF Newsletter No. 118 – Winter 2008/09
7
NEWS
solution depends very much on theparticular software environment.
Working group 2: The impact ofatmosphere-ocean interaction onthe atmosphereThe discussions of this working groupwere organized around four timescales: diurnal, meso-synoptic, intra-seasonal and seasonal.
The diurnal cycle of SSTs isrecognized as having an impact onthe Madden Julian Oscillation (MJO),the Indian monsoon and possiblyENSO. For the MJO, the rectification ofthe diurnal heating of the upper-ocean warm layer on the intra-seasonal timescale helps maintain theamplitude of intra-seasonal fluctua-tions in SST associated with the MJO.High resolution in the upper ocean(e.g. one metre for the upper tenmetres) is essential to partially resolvethe diurnal cycle in SST, but mixingprocesses have to be well treated.
On meso to synoptic scales,prediction of cyclones, includingtropical cyclones (TCs), extratropicaltransitions (ETs) and extratropicalcyclones (ECs), remains a challenge. Ithas been demonstrated that ocean-atmosphere coupling and more
accurate SSTs may improve theintensity forecasts of TCs and ETs.This improvement, however, mayrequire the eye wall structure to befully resolved (1–2 km resolution). It isnot clear whether prediction of TCsand ETs by lower-resolution models(e.g. T799 or T1279) would benefitfrom ocean-atmosphere coupling.
Surface fluxes are important for thedevelopment of ETs and ECs. Thissuggests that it is crucial to havemore accurate SST gradients, even foruncoupled forecasts. The effect of air-sea coupling for ECs requires morestudies so that it can be quantified.Waves are known to play animportant role, and wave informationneeds to be included in sea sprayparametrizations. Sea-ice isrecognized to have an impact on ECs.Interactions between an EC and seaice can happen on synoptic timescales, as demonstrated in Canada. A25-km horizontal resolution and6-hourly coupling frequency isthought to be adequate for sea icemodels for 10-day forecasts.
On intra-seasonal time scales, theMJO is a main source of predictability.Improvement in MJO prediction hasbeen reported when coupling to a
one-dimensional ocean mixed layermodel, instead of forcing theatmospheric model with prescribedSSTs. The benefit of coupling theatmospheric model to a three-dimensional OGCM (Oceanic GeneralCirculation Model) with the samehigh vertical resolution as the oceanmixed-layer model needs to beinvestigated and quantified.
On seasonal time scales, thedominant source of predictability isENSO. Better representation of upper-ocean mixing and currents in thetropical oceans is likely to givepositive impacts on forecasts oftropical SST. Outside the tropics, seaice is important to seasonal forecasts,both locally and regionally. Seasonalforecasts would also benefit from amore accurate representation of finestructures of SST, as in the GulfStream.
The workshop was very successfuland the recommendations of the twoworking groups will help guideresearch and development activitiesat ECMWF.
The full report of the workshop willbe available by going to:� www.ecmwf.int/publications/and following the links.
UMBERTO MODIGLIANI
EACH YEAR users within one ofECMWF’s Member States may apply forcomputing resources as a ‘SpecialProject’. These are of a scientific ortechnical nature and are likely to be ofinterest to the general scientificcommunity. Such projects can beundertaken in co-operation betweenseveral institutions, nationally orinternationally. The decision to treat aproject request as a Special Projectapplication is made ultimately by theDirector of the National Meteorologi-cal Service of the project’s PrincipalInvestigator. Certain Europeanorganisations with which ECMWF hasconcluded Co-operation Agreementsmay apply for resources for a SpecialProject, with such a request to be
considered by the Director of ECMWF.The Special Projects that arecontinuing or starting in 2009 aregiven in the item starting on page 27 ofthis edition of the ECMWF Newsletter.
The allocation of computingresources for Special Projects isdecided by the ECMWF Council. Theguidelines for distribution currentlystate that a maximum of 10% of thecomputing resources available toMember States may be allocated toSpecial Projects. 20% of that 10% is setaside as a reserve for allocation byECMWF directly (following consulta-tion with the Chairs of the TechnicalAdvisory Committee and the Scienti-fic Advisory Committee) either to lateapplicants or to projects which haveexhausted their allocation before theend of the year.
If you wish to begin work on aSpecial Project in 2010 then anapplication form should becompleted and sent to ECMWF via theDirector of the appropriate NationalMeteorological Service. The formneeds to reach ECMWF by 30 April2009. Requests will be reviewed bythe Scientific Advisory Committeeand Technical Advisory Committee inOctober and then approved (or not)by the ECMWF Council at its meetingin December 2009. If the 30 Aprildeadline is missed, applications canstill be made as limited resources areset aside specifically for ad hocallocations. The various applicationforms are available from:� www.ecmwf.int/about/special_projects.
Due to the large oversubscriptionof computing resources available to
Applying for computing resources for Special Projects
ECMWF Newsletter No. 118 – Winter 2008/09
8
NEWS
Special Projects, a new procedure wasimplemented in 2008 for thehandling of applications forcomputing resources for SpecialProjects. The main changes are:� Each project will have a well-definedduration, up to a maximum of threeyears, agreed at the beginning of theproject.
� The amount of resources requestedby each project for each year cannotexceed more than 8% of the totalamount of resources available for thatyear. For 2009 the maximumresource that could be allocated toany project was designated as 4,960kunits of HPCF and 16,000 gigabytesof Data Storage.
� To avoid accepted Special Projectrequests needing a reduction by morethan 20%, the lowest ranking SpecialProjects requesting large amounts ofcomputing resources may not beaccepted.
More information about SpecialProjects can be found at the webaddress that has already been given.
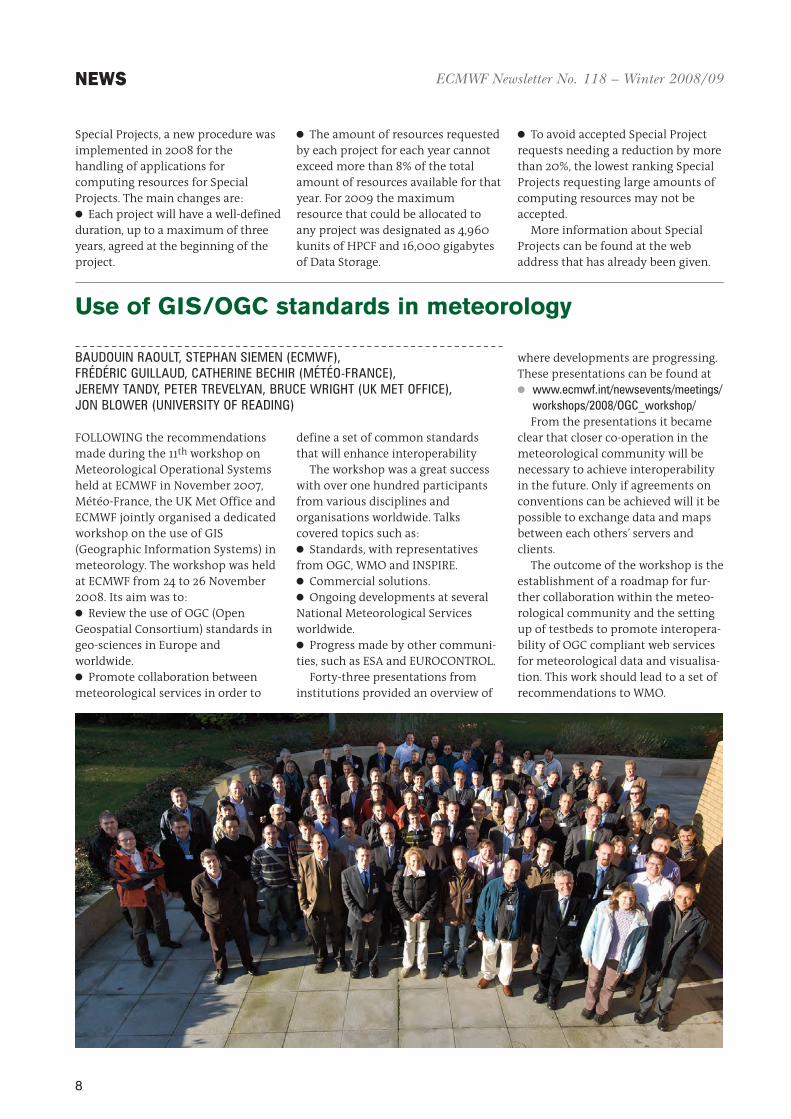
FOLLOWING the recommendationsmade during the 11th workshop onMeteorological Operational Systemsheld at ECMWF in November 2007,Météo-France, the UK Met Office andECMWF jointly organised a dedicatedworkshop on the use of GIS(Geographic Information Systems) inmeteorology. The workshop was heldat ECMWF from 24 to 26 November2008. Its aim was to:� Review the use of OGC (OpenGeospatial Consortium) standards ingeo-sciences in Europe andworldwide.� Promote collaboration betweenmeteorological services in order to
define a set of common standardsthat will enhance interoperability
The workshop was a great successwith over one hundred participantsfrom various disciplines andorganisations worldwide. Talkscovered topics such as:� Standards, with representativesfrom OGC, WMO and INSPIRE.� Commercial solutions.� Ongoing developments at severalNational Meteorological Servicesworldwide.� Progress made by other communi-ties, such as ESA and EUROCONTROL.
Forty-three presentations frominstitutions provided an overview of
where developments are progressing.These presentations can be found at� www.ecmwf.int/newsevents/meetings/
workshops/2008/OGC_workshop/From the presentations it became
clear that closer co-operation in themeteorological community will benecessary to achieve interoperabilityin the future. Only if agreements onconventions can be achieved will it bepossible to exchange data and mapsbetween each others’ servers andclients.
The outcome of the workshop is theestablishment of a roadmap for fur-ther collaboration within the meteo-rological community and the settingup of testbeds to promote interopera-bility of OGC compliant web servicesfor meteorological data and visualisa-tion. This work should lead to a set ofrecommendations to WMO.
Use of GIS/OGC standards in meteorology
BAUDOUIN RAOULT, STEPHAN SIEMEN (ECMWF),FRÉDÉRIC GUILLAUD, CATHERINE BECHIR (MÉTÉO-FRANCE),JEREMY TANDY, PETER TREVELYAN, BRUCE WRIGHT (UK MET OFFICE),JON BLOWER (UNIVERSITY OF READING)

ECMWF Newsletter No. 118 – Winter 2008/09
9
NEWS
Four working groups discussed theroadmap and technical issuessurrounding the web standards.
Roadmap for collaborationThe first working group discussed aroadmap for collaboration amongstthe meteorological community on thedevelopment of common usagepractices for existing standards andcontribution to the evolution ofstandards to ensure they meetcommunity needs.
It was agreed to form a Meteoro-logical Domain Working Group (DWG)with joint ownership from WMO andOGC. The charter (terms of reference)for the DWG will be presented forendorsement at the OGC TechnicalCommittee meeting in Athens (March2009) and communicated to WMO.The DWG will set up and moderate acollaboration website for knowledgesharing amongst communitymembers.
The main focus of the DWG will beto drive a series of ‘interoperabilityexperiments’ lasting approximatelysix months with the goal of validatingstandards and best practices based onimplementation experience. Eachiteration will focus on a particulardemonstration scenario to providecoherence to the technologicalactivities deployed within a ‘testbed’.
The first iteration will focus onthe creation of a WMS (Web MapService) profile for the meteorologicalcommunity.
It is proposed that the seconditeration may look at validating theoperational meteorology domainmodel developed within the proposedWMO inter-programme expert teamon metadata and data interoperability(WMO IPET-MDI) being considered atCBS XIV in March 2009.
Use of GML and coverage servicesThe use of the GML (GeographyMarkup Language) and coverageservices was the topic considered bythe second working group. The groupdiscussed the development andmaintenance of a small set of concep-tual models, to which mappings fromthe various implementation formscan be maintained.
The proposed approach was to startwith a real problem, develop clear,specific test cases, formalise theproblem (e.g. agreeing use case, data,query), develop the conceptual model(building on existing standards suchas Observations & Measures andCSML), and validate and refine throughimplementation. A key recommenda-tion was the establishment ofinternational governance for corepackages required by the meteoro-logical community, supported by thenecessary registry infrastructure.
Use of the OGC Web MappingServiceThe third working group discussedthe use of the OGC Web MappingService (WMS) in meteorology. WMShas seen the most implementationsand uses of all the services.
From the presentations and discus-sions it became clear that althoughthe WMS can be easily implementedto deliver maps, some further work isrequired to ensure that the WMSstandard can be used to best effectwithin the meteorological commu-nity. In particular, the meteorologicalcommunity must agree uponcommon styles for maps to ensurethat maps that are shared betweenorganizations are comprehensible.
The group identified some areas ofthe WMS standard that will requireclarification or expansion, such as thehandling of vertical and temporaldimensions. It is therefore recom-mended that the community shouldwork together, in collaboration withthe OGC, to develop a ‘meteorologicalprofile’ of WMS.
Security and access controlThe final working group discussedissues regarding security and accesscontrol within OGC web services. Thescope of the discussions was limitedto true interoperability, i.e. whenusing client and server software fromdifferent vendors or open sourceprojects.
The group first reviewed thesecurity requirements (authorization,access control, data policies, dataintegrity etc.) and the various tech-nical solutions, such as the work done
by the BADC (British AtmosphericData Centre) as part of the NERC datagrid, or the geoXACML project. It wasconcluded that none of the solutionswere yet mature and that in themeantime security could be imple-mented at a lower level (SSL, VPN, IPfiltering). The group recommendedthat security should be delegated toproxies, so that the web services(WMS, WCS, WFS) would not have todeal with it. Finally, it was recom-mended that:(a) Access control should be rolebased(b) For inter-organisation deployment,a virtual organisation should be setupby establishing trust relationshipsbetween the partners.
Météo-France has offered to hostthe next Workshop in Toulouse in2009.
AdditionalERA-Interimproductsavailable
DICK DEE
ERA-Interim daily and monthlyproducts for the period 1989–2007are now available on MARS(expver=1, class=ei) for usersfrom Member States, and on theECMWF data server� http://data.ecmwf.int/data/for all other users.
ERA-Interim is the globalatmospheric reanalysis currently inproduction at ECMWF, described inECMWF Newsletter No. 110 and No. 115.The reanalysis is expected to reachreal time during the first quarter of2009, after which it will continue tobe maintained as a climatemonitoring tool with monthlyupdates to the product archive anddata server.
Information about the status of theproduction and known data issueswill be posted on the ERA webpages at:� www.ecmwf.int/research/era.

ECMWF Newsletter No. 118 – Winter 2008/09
10
NEWS / METEOROLOGY
BOB RIDDAWAY
Workshop on ‘Assimilation of IASIin NWP’ (6 to 8 May 2009)In collaboration with the EUMETSATNWP-SAF the ECMWF will host aworkshop on the “Use of IASI in NWP”.The event comes nearly two yearsafter IASI was first declared ‘opera-tional’ by EUMETSAT. The topicscovered will include:� Detailed validation of the IASIobservations and associated radiativetransfer models.� Experience of NWP centres with theassimilation of the level-1/level-2 data.� A special session on novelapplications of IASI in the context ofenvironmental monitoring.
In addition to formal lectures byinvited speakers, the workshop willaim to formulate recommendationsto guide future research anddevelopment.� www.ecmwf.int/newsevents/
meetings/workshops/2009/IASI_data
Forecast Products – Users Meeting(11 to 13 June 2009)ECMWF organizes annually a meetingof users of its medium range andextended range products. Thepurpose of the meetings is to:� Give forecasters the opportunity todiscuss their experience with and toexchange views on the use of themedium-range and extended-rangeproducts, including the ensemble.� Review the development of theoperational system and to discussfuture developments includingforecast products.
� www.ecmwf.int/newsevents/meetings/forecast_products_user
Workshop on ‘Diagnostics of DataAssimilation System Performance’(15 to 17 June 2009)Data assimilation schemes haveevolved into complicated systemswith millions of degrees of freedomand handling massive amounts ofobservations. Effective monitoring ofthese systems is required andemerging techniques are now rapidlydeveloping at most NWP centres. Thisreview of the various methodologiesand their effectiveness in diagnosingthe impact of observations in NWP issuitably timely. Workshop attendanceis by invitation only.� www.ecmwf.int/newsevents/
meetings/workshops/2009/Diagnostics_DA_System_Performance
ECMWF 2009 Annual Seminar on‘Diagnosis of Forecasting and DataAssimilation Systems’(7 to 10 September 2009)Powerful and precise diagnostictechniques are required to maintainthe present pace of forecast systemdevelopment. This is partly due to theabundance of new observations of theEarth system and the growingcomplexity (and indeed accuracy) offorecast models.
This seminar will give a pedagogicaloverview of diagnostic techniquesused to understand the deficiencies inNWP, seasonal and climate forecastingsystems. Diagnostics targeting obser-vations, data assimilation systems,models and ensemble prediction will
be discussed. Additional lectures willfocus on identifying new sources offorecast skill.
A registration form and furtherinformation is available from:� www.ecmwf.int/newsevents/
meetings/annual_seminar/2009
12th Workshop on ‘MeteorologicalOperational Systems’(2 to 6 November 2009)The objective of the workshop is toreview the state of the art ofmeteorological operational systemsand to address future trends in:� The use and interpretation ofmedium and extended range forecastguidance.� Operational data managementsystems.� Meteorological visualisationapplications.� www.ecmwf.int/newsevents/
meetings/workshops/2009/MOS_12
Workshop on ‘Non-hydrostaticModelling’ (dates not decided)The workshop will review recentprogress made in non-hydrostaticmodelling worldwide, with someemphasis on global model develop-ments. It will consider the strengthsand weaknesses of differentapproaches taken in the developmentof non-hydrostatic dynamical coresand exchange ideas about efficientways of testing the performance ofthese models at all scales. Workshopattendance is by invitation only.� www.ecmwf.int/newsevents/
meetings/workshops/2009/Non_hydrostatic_Modelling
ECMWF workshops and scientific meetings in 2009
TIM STOCKDALE, FRANCISCO J. DOBLAS-REYES,LAURA FERRANTI
Niño related sea surface temperature (SST) anomaliesin the Pacific, which are the major source of predictableseasonal variations in the weather around the globe.However, performance in predicting actual weatheranomalies in many parts of the world is still substantiallybelow the theoretical limits of what is possible.Research has shown that combining forecasts from
EUROSIP: multi-model seasonal forecasting
ECMWF has run a seasonal forecast system for morethan 10 years, and is presently on its third generationsystem. The forecast system is good at predicting El

ECMWF Newsletter No. 118 – Winter 2008/09
11
METEOROLOGY
several different coupled ocean-atmosphere models isa robust and effective way to increase seasonal forecastskill. This is because combining models both averagesout some of the individual model forecast errors, andalso gives a better idea of the uncertainties in the fore-cast. ECMWF, the Met Office and Météo-France agreedsome time ago to work together to develop an opera-tional multi-model seasonal forecasting system, andEUROSIP was born. (Seasonal forecasting is oftenreferred to in the research community as Seasonal toInterannual (or S/I) Prediction, which is the reasonbehind the “EUROSIP” name.) The cooperation of thescientific teams at Météo-France and the Met Office indeveloping the EUROSIP project is acknowledged.Here we review the present status of EUROSIP and
the performance of the multi-model forecast system.
How does a multi-model forecast help?
Despite successful El Niño predictions and constantefforts at model development, model error is still amajor problem for seasonal forecasting. By ‘modelerror’ we mean the generic inaccuracies in the numer-ical model’s representation of the real world. Theproblem is not specific to ECMWF – all existing modelsin the world have errors that limit the accuracy ofseasonal prediction. Model error gives rise to model-induced forecast errors; these are errors in the individualforecasts that are due to the model. On a seasonaltimescale, forecasts are inherently probabilistic, andso even a hypothetical ‘perfect model’ ensemble fore-cast of a particular variable would only give a probabilitydensity function (pdf). An ensemble of forecasts froman imperfect model will also generate a pdf, but it willdiffer from the ‘true’ pdf. We will refer to the differencebetween the pdfs as the model forecast error.The most obvious model forecast error is bias – a
model may be systematically too warm or too cold atsome location, for example. Bias is estimated from a setof hindcasts (or reforecasts) made with each model, andthis estimate can easily be removed from the real-timeforecasts. However, the non-stationary component offorecast errors and non-linear effects are not accountedfor by bias removal, and empirical corrections for theseerrors cannot easily be estimated from the limitednumber of past cases. Further, the forecast ‘signal’ thatwe are trying to predict is in most cases a relativelymodest shift in the pdf from its climatology. Modelforecast errors can easily overwhelm these signals, partic-ularly away from areas of strong forcing such as theequatorial Pacific. Although model errors are beingreduced, and will continue to be so in the future, therequirements for model accuracy are so exacting thatmodel error is expected to be the dominant problemin seasonal prediction for decades to come.Somodel forecast errors are endemic, hard to reduce,
impossible to eliminate by a posteriori correction, andhave a major impact on our forecasts. What can we do?A pragmatic approach starts by noting that although all
models have errors, different models have differenterrors. Thus a multi-model combination can be useful– if we average the forecasts of several different models,some of the model forecast errors will be averaged out,while the forecast signal will remain undiminished. Inpractice, model forecast errors are likely to be partlycorrelated, and so averaging even a large number ofmodels will not eliminate the error entirely. The numberof independent models available is also limited.Nonetheless, averaging is able to reduce model forecasterror to some extent.A multi-model forecast system also helps by giving
better information on the uncertainty of the forecast.A forecast pdf derived from a multi-model combinationwill typically be broader than one derived from a singlemodel because the multi-model pdf naturally takesaccount of model uncertainty. The broader pdfs ofmulti-model forecasts increase their reliability, andallow them to gain higher verification scores whenprobabilistic measures are used. Forecast pdfs from asingle model can be relaxed towards the climatologicalpdf to increase reliability, but this comes at the expenseof ‘damping’ the forecast signal. Multi-model forecaststypically have increased reliability without loss of themean forecast signal captured by the models.A final benefit of a multi-model system is as a safe-
guard against the (hopefully small) risk of a real-timeforecast system being corrupted in some way so as toproduce misleading forecasts. For example, a real-timesystemmight be inadvertently changed so that it system-atically differs from the hindcasts; or it might fail tohandle correctly a change in an external data stream;or data might be corrupted. Diagnosis of a problem byverification of the real-time forecasts is likely to be slow,and comparison with other forecasts might help toidentify a problemmuch more quickly. Even for unrec-ognized errors, robustly constructed multi-modelproducts will be much less impacted than the singleaffected model.
The benefits of multi-model combination
The EU-funded DEMETER project coordinated atECMWF was a major step forward in establishing thepractical benefits of multi-model seasonal prediction.Seven European coupled ocean-atmosphere modelswere used to make seasonal ‘forecasts’ covering recentdecades, and the results of multi-model combinationswere examined.
Key conclusions from DEMETERFigure 1 shows a comparison of skill between multi-model combinations and single model ensembleforecasts from the DEMETER project. The ranked prob-ability skill score (RPSS), a measure of probabilisticforecast quality, is shown for forecasts of June/July/August seasonal mean 2-metre temperature at points inthe northern hemisphere extratropics as a function ofthe ensemble size.

ECMWF Newsletter No. 118 – Winter 2008/09
12
METEOROLOGY
� Single model (blue lines). These results are drawnfrom a 54 member ensemble of forecasts from theECMWF model, which for this particular forecastquantity and verification period is the best individ-ual model. Each blue horizontal tick mark shows theresult of one possible combination of members drawnfrom the total set of 54 members actually run. Thismeans that the vertical spread in the blue lines repre-sents sampling uncertainty in the generation of theensemble.
� Multi-model combination (red lines). Results are shownfor possible multi-model combinations, drawn frombetween 2 and 6 models (the number of models isshown in brackets by the side of the ensemble size).Since each model has nine ensemble members, thetotal ensemble size used is the same for the multi-model combination and the corresponding singlemodel ensemble.The vertical spread of the results from the multi-
model combination (red tick marks) is typically largerthan that of the single model (blue tick marks) sincethe skill of a multi-model combination depends onwhich models are combined.The results in the left-most column of Figure 1
(coloured tick marks) show the skill of the individual9-member model ensembles. Note that even a combi-nation of three other models is likely to be better thana similar sized ensemble using a single model. By thetime we get to four models, even the worst example ofa four model combination beats the best result possi-ble from the best single model. This general result isrobust across many different variables, regions and
seasons – for probabilistic forecasts, a multi-modelcombination is surprisingly effective when comparedagainst a single model.Key conclusions from DEMETER are that:
� Multi-model combinations are more skilful thansingle models.
� The benefit is not just from having a larger totalnumber of ensemble members.
� Adding a model with less-than-average skill to a multi-model combination is still usually of some benefit.
� A simple unweighted combination of models isusually the best approach, given the typically smallsample sizes available for estimating model skill.These very robust conclusions on the practical bene-
fit of a multi-model combination were what droveECMWF and its partners towards establishing an oper-ational multi-model seasonal forecasting system.
Quality of the multi-model forecastsThe first consideration of a seasonal forecast system isthe quality of the El Niño SST forecasts. Figure 2 showsthe root mean square (rms) error of SST forecasts forthe NINO3.4 index for the individual models of the pres-ent operational EUROSIP configuration (blue, greenand orange) and the multi-model combination (red).The rms error of a simple anomaly persistence forecastis shown in black for reference. The multi-model combi-nation is much better than the average of the models,and is fractionally better than the best single model.Also shown in Figure 2 is the standard deviation of
the ensemble forecast for a single model (dashed blue)and the multi-model combination (dashed red). Thesingle model underestimates the uncertainty in its ownforecasts, but the average spread of the multi-model fore-casts almost matches the rms error of the forecasts.
9 (1) 18 (2) 27 (3) 36 (4) 45 (5) 54 (6)Ensemble members (number of models)
-0.15
-0.1
-0.05
0
0.05
Rank
Prob
abili
tySk
illSc
ore
Figure 1 The ranked probability skill score (RPSS) for forecastsof June/July/August seasonal mean 2-metre temperature at pointsin the northern hemisphere extratropics as a function of the ensem-ble size, from the DEMETER project. The forecasts start from 1 Mayfor the years 1987–1999. Red lines show the skill of multi-model combi-nation, which is generally higher than the skill of similarly sizedensembles of the best single model shown by the blue lines. Seetext for details.
6543210Forecast time (months)
0
0.2
0.4
0.6
0.8
1
rms
erro
ro
fSST
fore
cast
s(˚
C)
Figure 2 Root mean square errors of Nino 3.4 SST index forecastsfrom the EUROSIP multi-model combination (red line), anomalypersistence forecast (black line) and individual models (blue, greenand orange lines). The multi-model combination is much better thanthe average of the models, and is fractionally better than the bestsingle model. Also shown is the ensemble spread of the multi-modelcombination (dashed red) and the best single model (dashed blue).

ECMWF Newsletter No. 118 – Winter 2008/09
13
METEOROLOGY
Despite this, the forecasts from the multi-model combi-nation are still not properly calibrated – inspection ofthe individual forecasts shows that sometimes the multi-model combination clearly overestimates the uncertaintyof a forecast, and sometimes it strongly underestimatesthe uncertainty. Preliminary results from a Bayesiancalibration of the Niño plumes developed at ECMWFshow a better scaling of the ensemble spread.A further comparison between scores of operational
ECMWF-only seasonal forecasts and those of the opera-tional EUROSIPmulti-model system is shown in Figure 3.This shows the ROC (Relative Operating Characteristic)skill scores of June/July/August seasonal mean 2-metretemperatures predicted fromMay for the years 1987–2005for (a) the ECMWFmodel alone and (b) EUROSIP. TheROC skill score is effective at measuring the signalcontained in a set of probabilistic forecasts and it doesnot punish forecasts for having poorly calibrated prob-abilities. Overall, the EUROSIPmulti-model scores morehighly, although the effect is relatively modest. The skillin summer temperature forecasts over southern Europeis apparent in both plots, and again the multi-modelcombination brings only modest gains. Note that thescores are fairly noisy and are only based on nineteenyears of data – sampling uncertainties mean that detailed
local comparisons are not appropriate. Plots of other vari-ables and other seasons tell the same story – the EUROSIPforecasts are, overall, modestly more informative than theECMWF-only forecasts.The reliability diagram in Figure 4 demonstrates the
benefit of the multi-model system for the reliability ofprobability forecasts. Figure 4a shows the reliability ofprobability forecasts from the ECMWFmodel for seasonalmean 2-metre temperature being below the lower tercilefor December/January/February for forecasts in thenorthern hemisphere extratropics. A reliable set of fore-casts would have the observed frequency of occurrencematching the forecast probability – i.e. the points wouldbe on the diagonal. Although the ECMWF forecastshave some ability to discriminate between different like-lihoods of a cold winter, they are clearly a long way frombeing reliable. Figure 4b shows the result from themulti-model forecasts. The result is still not perfectly reliable,but is a big improvement on the singlemodel result: note,for example, the change in the forecasts of a very lowprobability of a cold winter. The multi-model combina-tion makes such a prediction less often (the size of theplotted circle represents the frequency with which theforecast probability is issued), but when such a forecastis made, it is much more reliable.
-1 -0.8 -0.6 -0.4 -0.3 -0.2 -0.1 0.1 0.2 0.3 0.4 0.6 0.8 1
a ECMWF model
b EUROSIP system
Figure 3 ROC skill scores for (a) the ECMWFmodel and (b) the EUROSIP system, for theevent of the June/July/August seasonal mean2-metre temperature being above the clima-tological median, as forecast from 1 May forthe years 1987–2005. Black dots indicatevalues significantly different from zero with95% probability. Scores are locally noisy,but the overall skil l level of the EUROSIPsystem is higher.

ECMWF Newsletter No. 118 – Winter 2008/09
14
METEOROLOGY
The substantial improvement in reliability relative tothe ECMWFmodel is a general property of the EUROSIPforecasts, seen across other seasons and variables. Scoreswhich are sensitive to the reliability of the probabilisticforecasts, such as RPSS, also benefit from the multi-model combination.
The present status of EUROSIP
The EUROSIP project presently involves ECMWF, theMet Office and Météo-France as partners – each part-ner contributes forecasts from a coupled atmosphere-ocean model to the multi-model system. Other organ-izations from ECMWF Member States or Co-operatingStates who would like to contribute can request tobecome EUROSIP partners. The German weather serv-ice (DWD) in collaboration with the Max-Planck-Institute for Meteorology intends to join the EUROSIPproject in the future. Since spring 2005 graphical prod-ucts from the multi-model system have been availableto users in Member States. A formal data policy forEUROSIP was established by the ECMWF Council inDecember 2006, and in December 2007 the Councilauthorized the addition of a selection of EUROSIPmulti-model data to the commercial catalogue.Themulti-model system works by combining the data
from the operational versions of each contributingmodel.The main output of the multi-model system is a set ofgraphical forecast products that are discussed in the nextsection. Whenever one of the individual models isupgraded, the EUROSIP system will include the updatedversion. Typically, test data from a newmodel ismade avail-able for several months before the actual operationalchange, although this is not guaranteed. Each individualmodel is used to produce forecasts and also a corre-sponding set of hindcasts (or reforecasts). The hindcastdata is used to estimate both model biases and also fore-cast skill. EUROSIPmulti-model products always use thehindcast data corresponding to the real-time forecastdata, so when amodel version changes a new set of hind-cast data is used. Information on the dates of changes inthe various model components is available on the web.In addition to graphical multi-model products on
the web, certain EUROSIP products – based on thecombined output of all of the models – are made avail-able in digital form. These EUROSIP multi-modelproducts are created together with equivalent hindcastmulti-model products to allow skill estimation of theproducts.The raw data for each individual model belongs to
the contributing centre, and any commercial use ofthis data requires negotiation of terms with the owner.However, permission is granted to all Member States andCo-operating States to use the data for their officialduty, and the data is also available for non-commercialresearch and education.Full documentation of the EUROSIP system, includ-
ing details of MARS access to the various datasets, isavailable on the web at
www.ecmwf.int/products/forecasts/seasonal/documentation/eurosip/
Graphical forecast productsand issues of interpretation
The EUROSIP graphical products are similar to thoseof the ECMWF System 3 forecasts, though with some
0
0.2
0.4
0.6
0.8
1
Ob
serv
edfr
equ
ency
0
0.2
0.4
0.6
0.8
1
Ob
serv
edfr
equ
ency
0 0.2 0.4 0.6 0.8 1Forecast probability
a ECMWF model
b EUROSIP system
0 0.2 0.4 0.6 0.8 1Forecast probability
Figure 4 Reliability diagrams for (a) the ECMWF model and (b) theEUROSIP system for the event of the December/January/Februaryseasonal mean 2-metre temperature being below the lower tercileof climatology, as forecast from 1 November, for the years 1987–2005.The red dots show the observed frequency of the event binnedaccording to the probability its occurrence was predicted to have,with the blue error bars showing the effect of sampling uncertainty.The relative size of the red dots indicates the number of casesincluded in each bin. The black lines show the climatological frequencyof the event. For a reliable system, the observed frequency shouldmatch the forecast probability in each bin. The EUROSIP system hasa substantially higher reliability than the single model.

ECMWF Newsletter No. 118 – Winter 2008/09
15
METEOROLOGY
differences. Products available include SST anomaliesfor key regions of the Equatorial Pacific (Niño plumes),probability maps for a range of atmospheric parameters,and predictions of tropical storm activity. The productsare published on the web on the 15th of each month at
www.ecmwf.int/products/forecasts/d/charts/seasonal/forecast/eurosip.
Niño PlumesEl Niño predictions are an important tool to anticipatethe relative likelihood of regional climate anomalies.Niño plumes show the full set of SST anomaly plumesfrom all of the models, plotted together but without anyadjustment or calibration.
Probability mapsFigure 5 shows an example of a multi-model forecast of2-metre temperature for June/July/August 2008, andhow it compares to the corresponding ECMWF-onlyforecast. The maps represent the probability of themost likely category of the seasonal mean 2-metretemperature being either above the 67% or below the33% value of the model climate distribution. The fore-casts are reasonably consistent, and the general tendencyfor the multi-model forecast to give slightly weaker
probabilities (i.e. to be less confident) than the ECMWFforecast is visible. Sometimes the consistency betweenthe ECMWF and multi-model forecast is lower than inthis figure, reflecting the fact that the models disagree.The consistency between the forecasts is not a reli-
able guide to either accurate or inaccurate forecasts, butit can give some information additional to that of theaverage past performance. In some cases inconsisten-cies between forecasts are related to the way individualmodels represent specific physical processes.
Tropical stormsEUROSIP predictions of tropical cyclones are producedby combining the calibrated forecasts of the individualmodels using equal weights. As discussed in Vitart et al.(2007), the skill of EUROSIP forecasts is generallyhigher than that of the individual models.
Outlook for EUROSIP
The EUROSIPmulti-model forecast system will continueto be maintained, and will benefit from each new fore-cast version that the contributors provide. Any increasein the number of models will also be beneficial.There is also much scope to improve the accuracy,
robustness and optimality of the combination methods
75°S
60°S
45°S
30°S
15°S
0°
15°N
30°N
45°N
60°N
75°N
75°S
60°S
45°S
30°S
15°S
0°
15°N
30°N
45°N
60°N
75°N
150°W 120°W 90°W 60°W 30°W 0° 30°E 60°E 90°E 120°E 150°E
150°W 120°W 90°W 60°W 30°W 0° 30°E 60°E 90°E 120°E 150°E
a EUROSIP system
b ECMWF model
below lower tercile %
70 – 100 70 – 10060 – 70 60 – 7050 – 60 50 – 6040 – 50 40 – 50other
above upper tercile %
Figure 5 Forecasts for seasonal mean 2-metre temperature terci le categories forJune/July/August 2008 from (a) the EUROSIPsystem and (b) the ECMWF model issued inMay 2008. The forecasts are generally consis-tent, but EUROSIP tends to shift some of thehigher probabilities (e.g. 70–100%) down-wards towards lower values.

ECMWF Newsletter No. 118 – Winter 2008/09
16
METEOROLOGY
used, and to consider the most effective ways of repre-senting graphically the estimated signals and theiruncertainties. Indeed, the proper calibration of prob-abilistic forecasts to account for model error is an issuefor both single model and multi-model products.Collaboration with our Member States and others willbe crucial in this area.Finally, multi-model combination is not the ultimate
tool for improving seasonal forecasts - there is no substi-tute for improving the individual forecasting systemsthemselves. Better models, run at the appropriate reso-lutions, will enable the impact of SST anomalies onthe atmospheric circulation to be more accuratelycaptured. Also more careful inclusion of other time-vary-ing processes in the climate system (e.g. soil moisture,sea-ice, stratospheric dynamics, ozone, troposphericand stratospheric aerosols) may lead to additionalsources of non-negligible seasonal predictability. Theymay also give a better representation of the decade todecade changes in the Earth’s climate that form an
important part of the practical seasonal predictionproblem. A multi-model combination will remain avaluable tool for many years to come, but it is only acomplement to much other work that is needed.
FURTHER READINGAnderson, D., T. Stockdale, M. Balmaseda, L. Ferranti,F. Vitart, F. Molteni, F. Doblas-Reyes, K. Mogensen &A. Vidard, 2006: Seasonal Forecast System 3. ECMWFNewsletter No. 110, 19–25.Molteni, F., L. Ferranti, M. Balmaseda, T. Stockdale &F. Vitart, 2007: New web products for the ECMWF SeasonalForecast system 3. ECMWF Newsletter No. 111, 28–33.Palmer, T.N., F.J. Doblas-Reyes & R. Hagedorn, 2003:DEMETER: Development of a European multi-modelensemble system for seasonal to interannual prediction.ECMWF Newsletter No. 99, 8–17.Vitart, F., T. Stockdale & L. Ferranti, 2007: Seasonal fore-casting of tropical storm frequency. ECMWF NewsletterNo. 112, 16–22.
GÖRAN BROSTRÖM, ANA CARRASCO,BRUCE HACKETT, ØYVIND SÆTRA
NORWEGIAN METEOROLOGICAL INSTITUTE, OSLO, NORWAY
well as drift predictions, are important parts in thecomplex interplay governing any search and rescue oroil spill recovery action. For instance, in Norway the JointRescue Coordination Centres are the operationalauthority for search and rescue, while for oil spill recov-ery the responsibility is shared between the CoastalAdministration (a government agency) and NOFO (ajoint offshore industry enterprise charged with carry-ing out remedial action at sea). The responsibility ofNorwegian authorities covers the Norwegian economiczone, but adjacent waters, such as the Nordic Seas andArctic, are also of importance. Other countries have simi-lar interests in their national and adjacent waters.However, there is also an interest in being able to moni-tor and forecast incidents in other waters.Shipping and marine pollution are truly global and
for many areas it is not clear which authority is respon-sible for remedial action. While there are internationalagreements ensuring the provision of metocean fore-casts in maritime emergencies (MPERSS), there is stilla need for drift forecasts at the local level. For exam-ple, when a Norwegian ship is involved in an accident,it may be of interest for Norwegian authorities and forthe shipping company responsible for the ship in ques-tion to obtain monitoring and forecasting information.Therefore, it is an added value to have organizationscapable of forecasting the track of oil spills and drift-ing objects on the global scale.In many situations there are large uncertainties in the
drift forecast that reduce the value of the forecast of, forexample, an oil spill. One way to improve the accuracy of
Using ECMWF products inglobal marine drift forecasting services
AS A PART of the EU-funded project MERSEA, a globalmarine drift forecasting system has become operationalat the Norwegian Meteorological Institute, hereafterreferred to as met.no. The system relies heavily onglobal forecast products from the ECMWF wave andatmospheric models. In addition, a new wave parame-ter (the Stokes drift) was implemented for the propertreatment of the surface particle drift. Here, this fore-casting system will be presented with emphasis on theuse of global products from ECMWF. Also an exampleof an oil drift forecast will be given.
Importance of drift forecasts
It is of great societal importance to have safe shippingand oil production at sea. Unfortunately, accidentshappen so from time to time there are releases of oilin connection with shipping accidents or dischargesfrom oil rigs. Besides accidental spills, there is also ille-gal dumping of oil and pollutants for which authoritiesneed back-tracking predictions of the oil spill to findwho is responsible. In addition to the tracking of oilspills, there is a vital interest in tracking people lost atsea, drifting ships, containers and other objects.Today, most countries have one or more authorities
responsible for detecting and tracking drifting objectsand oil. Observations by satellites, aircraft and ships, as

ECMWF Newsletter No. 118 – Winter 2008/09
17
METEOROLOGY
the forecast, or for estimating the uncertainty of the fore-cast, is to use ensemble forecasts. Here it is worthemphasizing that there are two types of ensemble forecasts:� Traditional ensemble forecast using an ensemble offorcing fields (e.g. different wind forcing).
� An ensemble of different oil drift models.The latter type of ensemble requires different oil
drift models and arrangements to ensure that datafrom different models is made available. Today, thereis much pan-European focus on exchanging data ondrift forecasts from various centres through differentEU projects (MERSEA, ECOOP, MYOCEAN and a newEU call for downstream services). However, presentlythese model ensembles are probably not used to theirfull extent but it is foreseen that this matter may improveas forecasts from different centres become availableand the cooperation between European countries inten-sifies.
Modelling oil spills
In principle, the drift of various objects at sea followsthe same physical principles and are subject to thesame geophysical forces (i.e. the drift of an object canbe calculated from the forces on the object and itsmass). However, different objects (e.g. ships, contain-ers, small boats, wind surfers, icebergs and oil) have verydifferent geometries and rely on diverse parametriza-tions, and so models have been developed separately forvarious kinds of drifting objects. This means that inmany circumstances very different models are used fordifferent objects. Here, we will describe the drift of oil,but many objects will behave in a rather similar way.Drifting objects and substances at sea are influenced
by:� Atmospheric winds� Ocean currents� Wave drift and wave forces� Coriolis forceThe wind acts directly on a drifting object or oil,
forcing it to move with the wind. A classical observationis that an oil slick drifts with typically 2–4% of windspeed with a 0–20° deflection towards the right (northhemisphere). This parametrization provides a simplemodel for the upper ocean currents: it is simple and easyto implement, but does not cover situations in whichwind-drift is not the dominant current component (e.g.in cases with strong tidal currents, density-drivencurrents or strong swell conditions). Accordingly, if wedescribe the ocean currents in a better way, we may beable to improve the prediction of those currents and theresulting drift forecasts.In addition to the ocean current, waves will also
affect objects by the wave radiation stress and/or by theStokes drift. Waves have a certain momentum and whenthey interact with, for example, a solid body there is anexchange of momentum between the waves and theobject; this is called the radiation stress. The Stokesdrift is described in Box A.
Box AThe Stokes drift
The Stokes drift is the mean velocity of the fluidparticles due to the presence of a wave.If we look at a particle under a wave train, see the
figure, it will move faster under the wave crest wherethe water parcel is higher up in the water columnand thus experience stronger positive wave orbitalmotion than under wave trough where the waterparcel is lower in the water column and experiencenegative and weaker orbital motions. In addition, theparticle moves in the direction of the wave propa-gation under the crest and against it under thetrough and is therefore exposed to drift in the wavedirection longer. Drifting particles under the actionof waves will therefore move in the direction of thewave, and this is called the Stokes Drift.To further enhance the picture it should be noted
that the Stokes drift is an inherently Lagrangianprocess; particles move but if we take the meanvelocity at a fixed position (Eulerian mean) thetransport is identically zero (as can be imaginedfrom the figure). In the Eulerian description the wavetransport is located between the deepest wave troughand the highest wave crest, while in the Lagrangiandescription it is distributed as exp(–2kz), where k isthe wave number. However, the deviation betweenthe Lagrangian and the Eulerian description canbe resolved by considering the wave-induced motionin between isopycnal layers. This formulation is simi-lar to the estimate of horizontal transport in isopycnalcoordinates as is commonly used in atmosphericand oceanic science to describe the transport in aneddy field.
Motions of particles at different depths (blue lines) due to thepassage of an idealized surface wave travelling to the right(green line) for two cases separated by half a wave period. Theposition of particles during each wave period is shown with thered points indicating the beginning and end positions. The redarrows indicate horizontal velocities.
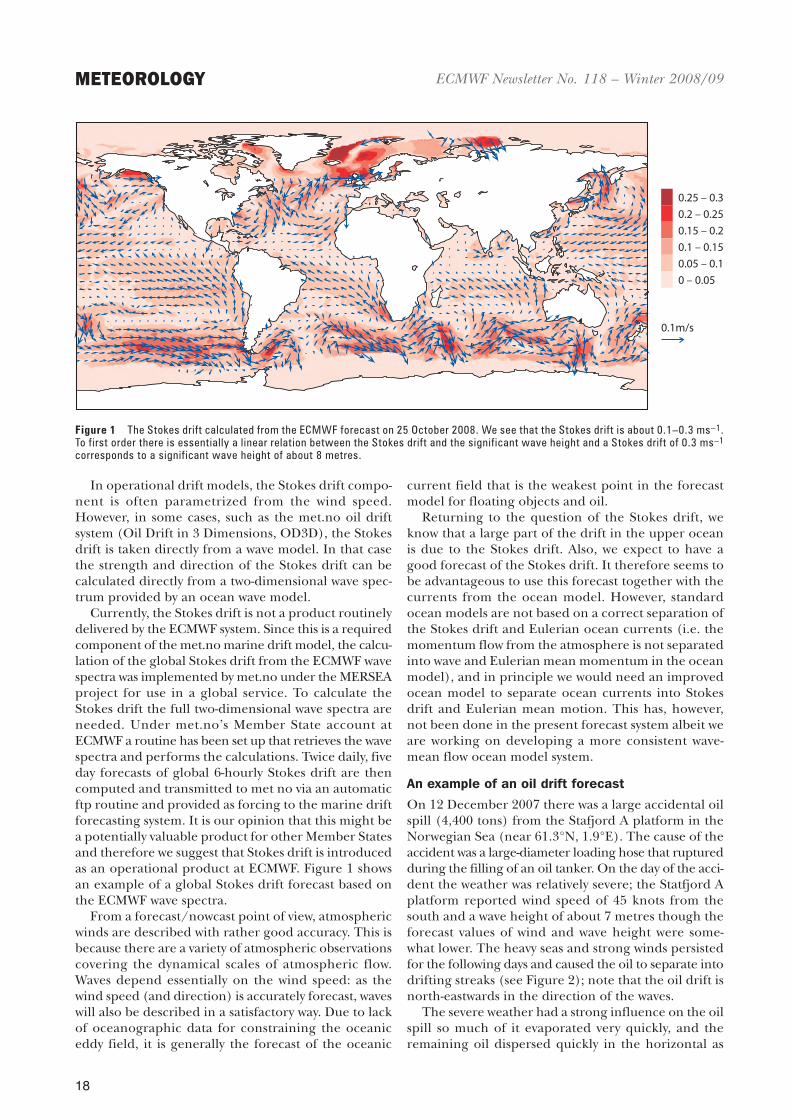
ECMWF Newsletter No. 118 – Winter 2008/09
18
METEOROLOGY
In operational drift models, the Stokes drift compo-nent is often parametrized from the wind speed.However, in some cases, such as the met.no oil driftsystem (Oil Drift in 3 Dimensions, OD3D), the Stokesdrift is taken directly from a wave model. In that casethe strength and direction of the Stokes drift can becalculated directly from a two-dimensional wave spec-trum provided by an ocean wave model.Currently, the Stokes drift is not a product routinely
delivered by the ECMWF system. Since this is a requiredcomponent of the met.no marine drift model, the calcu-lation of the global Stokes drift from the ECMWF wavespectra was implemented by met.no under the MERSEAproject for use in a global service. To calculate theStokes drift the full two-dimensional wave spectra areneeded. Under met.no’s Member State account atECMWF a routine has been set up that retrieves the wavespectra and performs the calculations. Twice daily, fiveday forecasts of global 6-hourly Stokes drift are thencomputed and transmitted to met no via an automaticftp routine and provided as forcing to the marine driftforecasting system. It is our opinion that this might bea potentially valuable product for other Member Statesand therefore we suggest that Stokes drift is introducedas an operational product at ECMWF. Figure 1 showsan example of a global Stokes drift forecast based onthe ECMWF wave spectra.From a forecast/nowcast point of view, atmospheric
winds are described with rather good accuracy. This isbecause there are a variety of atmospheric observationscovering the dynamical scales of atmospheric flow.Waves depend essentially on the wind speed: as thewind speed (and direction) is accurately forecast, waveswill also be described in a satisfactory way. Due to lackof oceanographic data for constraining the oceaniceddy field, it is generally the forecast of the oceanic
current field that is the weakest point in the forecastmodel for floating objects and oil.Returning to the question of the Stokes drift, we
know that a large part of the drift in the upper oceanis due to the Stokes drift. Also, we expect to have agood forecast of the Stokes drift. It therefore seems tobe advantageous to use this forecast together with thecurrents from the ocean model. However, standardocean models are not based on a correct separation ofthe Stokes drift and Eulerian ocean currents (i.e. themomentum flow from the atmosphere is not separatedinto wave and Eulerian mean momentum in the oceanmodel), and in principle we would need an improvedocean model to separate ocean currents into Stokesdrift and Eulerian mean motion. This has, however,not been done in the present forecast system albeit weare working on developing a more consistent wave-mean flow ocean model system.
An example of an oil drift forecast
On 12 December 2007 there was a large accidental oilspill (4,400 tons) from the Stafjord A platform in theNorwegian Sea (near 61.3°N, 1.9°E). The cause of theaccident was a large-diameter loading hose that rupturedduring the filling of an oil tanker. On the day of the acci-dent the weather was relatively severe; the Statfjord Aplatform reported wind speed of 45 knots from thesouth and a wave height of about 7 metres though theforecast values of wind and wave height were some-what lower. The heavy seas and strong winds persistedfor the following days and caused the oil to separate intodrifting streaks (see Figure 2); note that the oil drift isnorth-eastwards in the direction of the waves.The severe weather had a strong influence on the oil
spill so much of it evaporated very quickly, and theremaining oil dispersed quickly in the horizontal as
0.25 – 0.30.2 – 0.250.15 – 0.20.1 – 0.150.05 – 0.10 – 0.05
0.1m/s
Figure 1 The Stokes drift calculated from the ECMWF forecast on 25 October 2008. We see that the Stokes drift is about 0.1–0.3 ms–1.To first order there is essentially a linear relation between the Stokes drift and the significant wave height and a Stokes drift of 0.3 ms–1corresponds to a significant wave height of about 8 metres.

ECMWF Newsletter No. 118 – Winter 2008/09
19
METEOROLOGY
well as being mixed down in the upper ocean. By 14December the oil slick had been reduced so much thatall remedial action was cancelled by the authorities,and by 16 December the oil spill was no longerdetectable from ships or by flight recognisance.met.no was responsible for the initial forecast of the
oil drift, and within 30 minutes from the first call aforecast by the OD3D system was delivered to the author-ities and NOFO. Figure 3 shows some drift forecasts.� met.no Nordic4. This drift forecast used prognosticforcing data from the in-house atmospheric modelHIRLAM, ocean model MIPOM (MeteorologicalInstitute POM model), and the met.no wave modelbased on the WAM model.In addition to the standard forecast several alterna-
tive forecasts were produced as part of the MerseaIntegrated Project (www.mersea.eu.org). These simula-tions used the ECMWF global forecasts for atmosphericwind and Stokes drift and three different ocean currentdata sets.� Mercator Global. Forecast using OD3D drift modelforced by the global model run by the MERCATORocean forecast system (www.mercator-ocean.fr).
� Mercator N. Atlantic. Forecast using OD3D drift modelforced by North Atlantic model run by the MERCA-TOR ocean forecast system.
� met.no Bio4. Forecast using OD3D drift model forcedusing a second version of MIPOM.In Figure 3 we see that the net forecast drift is to the
east or north-east in all simulations. There were a fewobservations on the actual movement of the oil slick, andthese show that the main oil drift was in the eastwarddirection with a large dispersion in north-south direction.One interpretation is that the oil at the surface movesnorth-eastward (due to Stokes drift; note that the oil atthe surface moves in the direction of the waves inFigure 2) while the oil dispersed in the water columnmoved south-eastward with the ocean currents. It is clearthat the Stokes drift has a big influence since the Stokes
drift is of the same magnitude as the ocean currents atthe sea surface. As a final comment we note that the localmet.no operational model gave the best results and thisis in agreement with the main results from theMERSEAstudy. However, the ‘imported’ models provided goodforecasts and will thus complement the local model; wenow have some confidence in using thesemodels outsidethe domain of the local model.The differences between the oil drift predictions are
mainly due to the use of currents from different models.As the different forecasts give similar results, the OD3Dforecast appears to be robust. This proved to be impor-tant information for the operator responsible for theforecast, and for the authorities responsible for theaction.
Discussion
In this short communication we have described somenew developments that have taken place within theEuropean community regarding the drift of objects andoil at sea. The development focuses on (a) sharing fore-casts made at different national centres to provide anensemble forecast and (b) a widening of the forecastproduct range to include areas beyond the nationalresponsibility. One challenge is to go to the global scale;another challenge is to be able to use a variety of datafrom different forecast centres and to find the most
Figure 2 Aerial photo of the Statfjord A oil slick on 12 December2008. In the lower left corner is the loading buoy, while the StatfjordA platform is near the centre of the photo. (Photo: Kystverket/Scanpix)
MercatorN. Atlantic Mercator
Global
met.no.Nordic4
met.no.Bio4
Figure 3 Example of model ensemble forecasts for the StatfjordA incident on 0900 UTC on 12 December, 2007. met.no Nordic4 ismet.no’s drift model in standard configuration (i.e. the local Princetonocean model with 4 km resolution, a local version of the WAM modelfor the Stokes drift, and winds from the HIRLAM model); note thatthis simulation ends at 1200 UTC on 19 December. met.no Bio4 isa version of Nordic 4 that uses winds and waves from the ECMWFglobal operational forecast. Mercator Global and Mercator N. Atlanticare ¼° and 1⁄15° MERCATOR operational models that use winds andStokes drift taken from the ECMWF global forecast. Grey curves showthe mean trajectories up to 0000 UTC on 17 December (1200 UTCon December 19 for Nordic 4). Clouds of purple dots (the model isset up using many particles that are advected with currents and alsodescribes a random walk) represent the oil slicks at 1600 UTC on16 December (about 3.5 days after the spill). Red dots are the meanposition of oil particles at the same time as the purple clouds. Bluearrows are examples of surface currents from the Mercator N.Atlmodel. Red arrows are the Stokes drift from the ECMWF WAMmodel.

ECMWF Newsletter No. 118 – Winter 2008/09
20
METEOROLOGY
reliable model for a given region. It is clear that majoratmospheric centres such as the ECMWF will play acrucial role for such developments as they can provideatmospheric and wave forecast data for regions wherenational centres do not operate.We also point to the ‘new’ product for calculating the
Stokes drift provided by ECMWF. This is not routinelyincorporated into drift models, but we advocate using
the Stokes drift as it is a reliable forecast product thatwill probably enhance the forecast of drifting objects andsubstances. At present, the basic spectral data used tocalculate the Stokes drift are only available up to day 5of the forecast. Since all other the global forcing datasets applied in this study extend to at least day 10, it isthe availability of wave data that limits the forecastperiod for global marine drift forecasting to five days.
79 80 81 82 83 84 85 86 87 88 89 90 91 92 93Year
0
20
40
60
80
100
Trop
ical
cycl
ones
dete
cted
(%)
ERA-15 reanalysisOperations
MICHAEL FIORINONOAA Earth System Research Laboratory,
Boulder, Colorado, USA,formerly of the National Hurricane Center (NHC),
Miami, Florida USA
than the 100% improvement in official forecasts fromthe mid 1990s to 2008 that came from advanced globalmodels.This article reviews:
� The relationship between model physics, TC analy-sis and forecasts and the tropical general circulation.
� Dynamical medium-range TC track prediction andthe role of multi-model consensus.Some personal views about the implication of these
results for medium-range TC track prediction are givenin the conclusion, as the primary objective of the studywas to better understand the critical modelling factors.
Tropical large-scale flow, TCs and model changes
Tropical cyclones are not only the greatest high-impactweather event in the tropics, but can be an excellentindicator of general model performance.For example, one of the more remarkable results
from the first ECMWF reanalysis (ERA-15) was the strongdependence of the analysis of TCs on the model, ratherthan the observations as shown in Figure 1 taken fromSerrano (1998). The ERA-15 analysis consistently detectsabout 85% of observed TCs from 1979-1994, but theoperational ECMWFmodel only reaches that detectionrate in 1989. The primary difference between the oper-ational and ERA-15 analysis is the model and dataassimilation scheme, as the reanalysis used essentially thesame observations as in operations. The poor quality ofthe operational model analysis of TCs was not caused byinsufficient observations, but by the modelling.Next consider changes in the standard ECMWF trop-
ical wind forecast skill score for the period 1980-2008shown in Figure 2. Comparing this smoothed time series(red line) to TC detection in operations (light blueline in Figure 1), we see a strong correlation betweenTC detection and the 850 hPa tropical wind forecastscore (ECMWF, 2008). Similar correlations have beenfound in the NCEP-NCAR reanalysis and in the secondECMWF reanalysis, ERA-40 (Uppala et al., 2005).A detailed review of model changes (not given here)
suggests that the big jump in tropical forecast skill in 1989was not due to resolution increases, but more likely
Record-setting performance of the ECMWF IFSin medium-range tropical cyclone track prediction
In November 2007 a number of significant changes inmodel physics were introduced in Cycle 32r3 (Cy32r3)of the ECMWF Integrated Forecast System (IFS), mostnotably a reformulation of convective entrainment.The net result was a “beneficial increase in activity” inthe tropics (ECMWF, 2009) and such parametrizationchanges are known to have substantial impacts on fore-cast skill in the convectively-forced components of thetropical circulation and tropical cyclones (TCs) inparticular.The primary forecast aid in operational TC track
forecasting is consensus, produced from an ensemble ofquasi-independent deterministic model runs. SinceCy32r3, ECMWF’s TC track forecasts at the medium-range (72 hours or day 3) have been ~20% better thanmodel consensus globally. No individual model hasever consistently out-performed consensus by such alarge margin. If this skill gain continues, it would marka major breakthrough in TC track prediction, greater
Figure 1 Detection of tropical cyclones (maximum wind > 34 knots)in the northern hemisphere for the ECMWF ERA-15 reanalysis (darkblue line) and operations (light blue line).
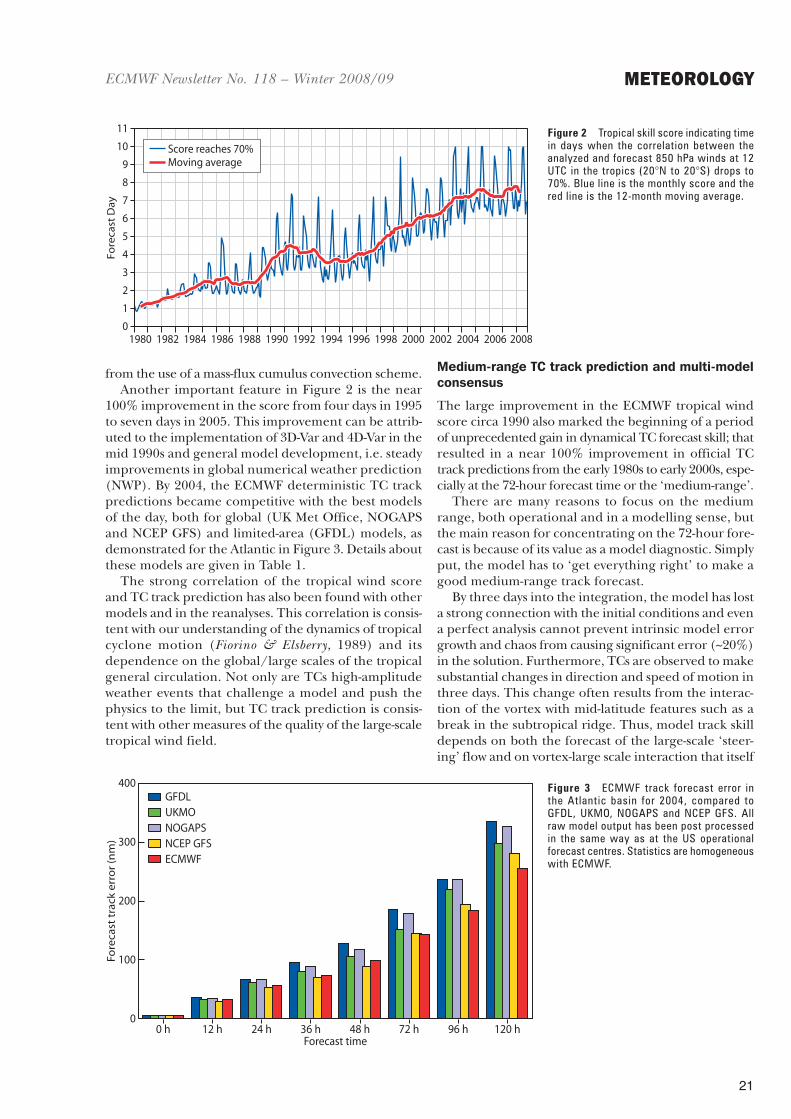
ECMWF Newsletter No. 118 – Winter 2008/09
21
METEOROLOGYFo
reca
stD
ay
1980 1982 1984 1986 1988 1990 1992 1994 1996 1998 2000 2002 2004 2006 20080
1
2
3
4
5
6
7
8
9
10
11
Score reaches 70%Moving average
00 h 12 h 24 h 36 h
Forecast time
Fore
cast
trac
ker
ror(
nm)
48 h 72 h 96 h 120 h
100
200
300
400GFDLUKMONOGAPSNCEP GFSECMWF
from the use of a mass-flux cumulus convection scheme.Another important feature in Figure 2 is the near
100% improvement in the score from four days in 1995to seven days in 2005. This improvement can be attrib-uted to the implementation of 3D-Var and 4D-Var in themid 1990s and general model development, i.e. steadyimprovements in global numerical weather prediction(NWP). By 2004, the ECMWF deterministic TC trackpredictions became competitive with the best modelsof the day, both for global (UK Met Office, NOGAPSand NCEP GFS) and limited-area (GFDL) models, asdemonstrated for the Atlantic in Figure 3. Details aboutthese models are given in Table 1.The strong correlation of the tropical wind score
and TC track prediction has also been found with othermodels and in the reanalyses. This correlation is consis-tent with our understanding of the dynamics of tropicalcyclone motion (Fiorino & Elsberry, 1989) and itsdependence on the global/large scales of the tropicalgeneral circulation. Not only are TCs high-amplitudeweather events that challenge a model and push thephysics to the limit, but TC track prediction is consis-tent with other measures of the quality of the large-scaletropical wind field.
Medium-range TC track prediction and multi-modelconsensus
The large improvement in the ECMWF tropical windscore circa 1990 also marked the beginning of a periodof unprecedented gain in dynamical TC forecast skill; thatresulted in a near 100% improvement in official TCtrack predictions from the early 1980s to early 2000s, espe-cially at the 72-hour forecast time or the ‘medium-range’.There are many reasons to focus on the medium
range, both operational and in a modelling sense, butthe main reason for concentrating on the 72-hour fore-cast is because of its value as a model diagnostic. Simplyput, the model has to ‘get everything right’ to make agood medium-range track forecast.By three days into the integration, the model has lost
a strong connection with the initial conditions and evena perfect analysis cannot prevent intrinsic model errorgrowth and chaos from causing significant error (~20%)in the solution. Furthermore, TCs are observed to makesubstantial changes in direction and speed of motion inthree days. This change often results from the interac-tion of the vortex with mid-latitude features such as abreak in the subtropical ridge. Thus, model track skilldepends on both the forecast of the large-scale ‘steer-ing’ flow and on vortex-large scale interaction that itself
Figure 2 Tropical skill score indicating timein days when the correlation between theanalyzed and forecast 850 hPa winds at 12UTC in the tropics (20°N to 20°S) drops to70%. Blue line is the monthly score and thered line is the 12-month moving average.
Figure 3 ECMWF track forecast error inthe Atlantic basin for 2004, compared toGFDL, UKMO, NOGAPS and NCEP GFS. Allraw model output has been post processedin the same way as at the US operationalforecast centres. Statistics are homogeneouswith ECMWF.
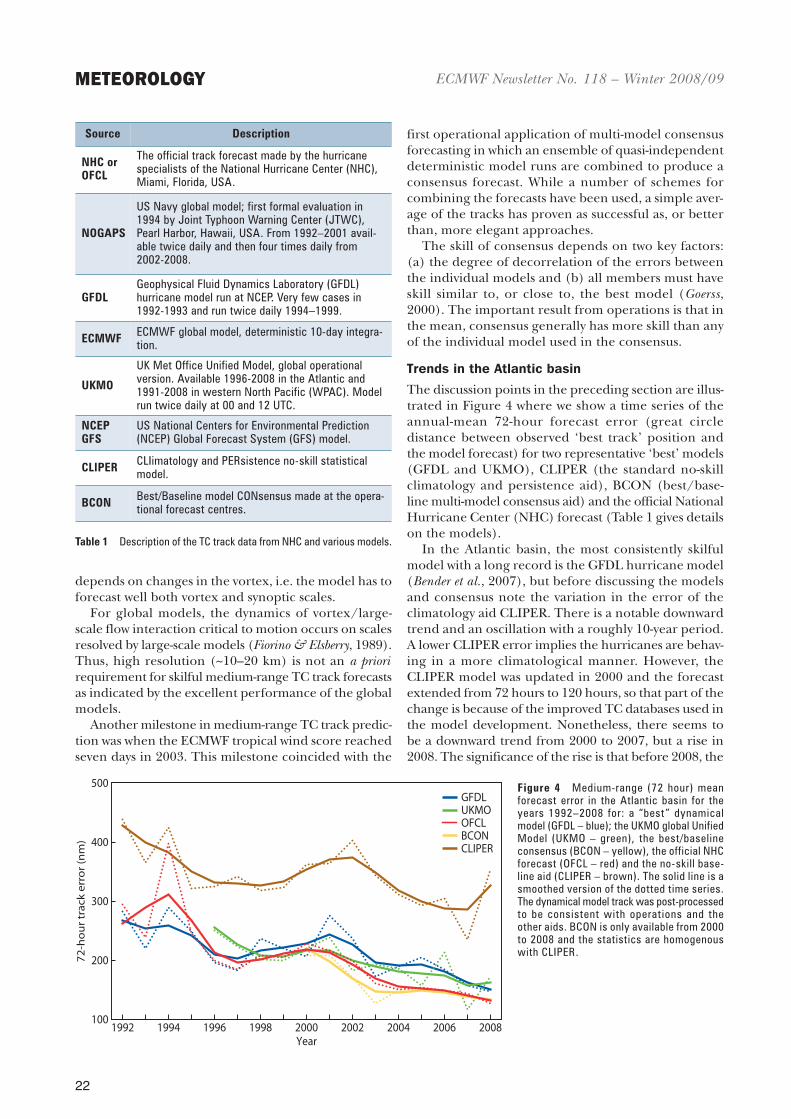
ECMWF Newsletter No. 118 – Winter 2008/09
22
METEOROLOGY
GFDL
20082006200420022000Year
199819961994
72
-ho
ur
trac
ke
rro
r(n
m)
1992100
200
300
400
500
UKMO
CLIPERBCONOFCL
depends on changes in the vortex, i.e. the model has toforecast well both vortex and synoptic scales.For global models, the dynamics of vortex/large-
scale flow interaction critical to motion occurs on scalesresolved by large-scale models (Fiorino & Elsberry, 1989).Thus, high resolution (~10–20 km) is not an a priorirequirement for skilful medium-range TC track forecastsas indicated by the excellent performance of the globalmodels.Another milestone in medium-range TC track predic-
tion was when the ECMWF tropical wind score reachedseven days in 2003. This milestone coincided with the
first operational application of multi-model consensusforecasting in which an ensemble of quasi-independentdeterministic model runs are combined to produce aconsensus forecast. While a number of schemes forcombining the forecasts have been used, a simple aver-age of the tracks has proven as successful as, or betterthan, more elegant approaches.The skill of consensus depends on two key factors:
(a) the degree of decorrelation of the errors betweenthe individual models and (b) all members must haveskill similar to, or close to, the best model (Goerss,2000). The important result from operations is that inthe mean, consensus generally has more skill than anyof the individual model used in the consensus.
Trends in the Atlantic basin
The discussion points in the preceding section are illus-trated in Figure 4 where we show a time series of theannual-mean 72-hour forecast error (great circledistance between observed ‘best track’ position andthe model forecast) for two representative ‘best’ models(GFDL and UKMO), CLIPER (the standard no-skillclimatology and persistence aid), BCON (best/base-line multi-model consensus aid) and the official NationalHurricane Center (NHC) forecast (Table 1 gives detailson the models).In the Atlantic basin, the most consistently skilful
model with a long record is the GFDL hurricane model(Bender et al., 2007), but before discussing the modelsand consensus note the variation in the error of theclimatology aid CLIPER. There is a notable downwardtrend and an oscillation with a roughly 10-year period.A lower CLIPER error implies the hurricanes are behav-ing in a more climatological manner. However, theCLIPER model was updated in 2000 and the forecastextended from 72 hours to 120 hours, so that part of thechange is because of the improved TC databases used inthe model development. Nonetheless, there seems tobe a downward trend from 2000 to 2007, but a rise in2008. The significance of the rise is that before 2008, the
Source Description
NHC orOFCL
The official track forecast made by the hurricanespecialists of the National Hurricane Center (NHC),Miami, Florida, USA.
NOGAPS
US Navy global model; first formal evaluation in1994 by Joint Typhoon Warning Center (JTWC),Pearl Harbor, Hawaii, USA. From 1992–2001 avail-able twice daily and then four times daily from2002-2008.
GFDLGeophysical Fluid Dynamics Laboratory (GFDL)hurricane model run at NCEP. Very few cases in1992-1993 and run twice daily 1994–1999.
ECMWF ECMWF global model, deterministic 10-day integra-tion.
UKMO
UK Met Office Unified Model, global operationalversion. Available 1996-2008 in the Atlantic and1991-2008 in western North Pacific (WPAC). Modelrun twice daily at 00 and 12 UTC.
NCEPGFS
US National Centers for Environmental Prediction(NCEP) Global Forecast System (GFS) model.
CLIPER CLIimatology and PERsistence no-skill statisticalmodel.
BCON Best/Baseline model CONsensus made at the opera-tional forecast centres.
Table 1 Description of the TC track data from NHC and various models.
Figure 4 Medium-range (72 hour) meanforecast error in the Atlantic basin for theyears 1992–2008 for: a “best” dynamicalmodel (GFDL – blue); the UKMO global UnifiedModel (UKMO – green), the best/baselineconsensus (BCON – yellow), the official NHCforecast (OFCL – red) and the no-skill base-line aid (CLIPER – brown). The solid line is asmoothed version of the dotted time series.The dynamical model track was post-processedto be consistent with operations and theother aids. BCON is only available from 2000to 2008 and the statistics are homogenouswith CLIPER.

ECMWF Newsletter No. 118 – Winter 2008/09
23
METEOROLOGY
model and consensus error tended to generally followCLIPER, but in 2008 model error moved downwarddespite TC motion being less climatological than inprevious years.From 1992 to 1997 the GFDLmodel had lower error
than the official NHC forecast. However, the numberof cases was very small in 1992 and 1993 since the modelwas still experimental, but by 1995 the model had highavailability to the forecasters and was run twice daily.Since 2000, the GFDL model is run at the samefrequency as the official forecasts – four times daily.The larger point is not that the GFDL model ‘beat’ theofficial human forecasts, but that the model showed skilland that the forecasters were able to successfully use theguidance.Notice how the models show more year-to-year vari-
ability until 2004 when the ECMWF tropical scorereached seven days. Skill consistency is perhaps theresult of the ‘stability’ (smaller run-to-run variability)a large observing system gives the global model. Thisstability is significant for the limited-area GFDL modelas the global model (NCEP GFS) provides both initialand lateral boundary conditions that determine thelarge-scale flow in the outer grid of the GFDL model.Another feature in Figure 4 is how both the models
and the official forecast error slowly vary in a similarmanner as CLIPER: rising in the early 2000s and thenfalling until 2007–2008. The main use of CLIPER is tomeasure forecast difficulty as high CLIPER errors implythat the TCs did not behave in a climatology mannerfor that year. If model skill did not follow CLIPERupward in 2008, then the global model analysis may havehad even higher quality than in previous years.The main point is that model and official forecast skill
is much greater than CLIPER, with a clear downwardtrend in the error of both, and that the official forecastis slightly lower than the models. Consequently, from1992 to 2008 the official forecast error has been cut inmore than half from 294 nm (nautical miles) to 127 nm– a greater than 100% improvement. The GFDLmodelimprovement over that time period was not as dramatic,but consensus (BCON) was better than the model andon par with the NHC forecast. Similarly, the track fore-casts of the UKMet Office (UKMO) global model showa similar trend.An alternative view of the error statistics is to calcu-
late a percentage gain or improvement against somebaseline as shown in Figure 5. The standard compari-son baseline is CLIPER with positive values indicatinghow much better (lower) the mean forecast error isrelative to the baseline (Franklin, 2008). The generalimprovement trend is less pronounced over the 17-yearperiod, but what is more interesting is how the modeland consensus are becoming even better vis-à-vis CLIPERfrom 2006–2008 to over 50%.To bring the comparison into sharper focus we use
the consensus aid BCON as the baseline instead ofCLIPER in Figure 6. Clearly the GFDL model is not as
skilful as BCON and is ~25% worse. The results fromthe UK Met Office model are similar to those of theGFDL model, but with much larger year-to-year swings.However, the +16% gain on BCON in 2007 is not signif-icant because of very few cases/storms in the Atlanticfor that year. Statistical significance is not addressed hereas our purpose is to examine broad trends and rela-tionships (more cases) and not to focus on year-to-yeardifferences.The degree of degradation varies with the model
and year, but what we do not find is a model that isconsistently better than consensus at 72 hours. A modelcan outperform consensus only if it has much lowererror than its peers. That is, skill does not come fromerror compensation, but from better meteorology -good results for physically more-correct reasons.The main conclusion of this review of medium-range
dynamical TC track prediction is that while themodels/consensus have steadily improved, no individ-ual model or single deterministic run has ever beenmore than 10% better than consensus in any one yearor any one basin, and on a 5–10 year time scale the indi-vidual models are typically 15–20% worse.
Dependence of ECMWF track prediction skill onmodel changes
We now consider two recent changes to the ECMWFmodel that would be expected to affect TC track predic-tion – increased horizontal resolution and improvedmodel physics, especially convection. In February 2006,model resolution increased from T511 to T799 orapproximately from 40 km to 25 km. The second changeconcerns the cumulus parametrization in November2007.We collected about one year of TC forecasts before
and after each model change to determine if there aredetectable impacts on medium-range track prediction.The period between the resolution increase to T799(February 2006) and the physics change (November2007) is 21 months and includes two northern hemi-sphere TC seasons and one for the southernhemisphere. However, the number of northern hemi-sphere cases in this longer period is not much greaterthan in the one-year periods because of unusually weakTC activity in 2007. Details of the periods and model
Period Model changesNumber ofcases at72 hours
February 2005–February 2006 T511 resolution (~ 40 km) 400
February 2006–November 2007 T799 resolution (~ 25 km) 460
November 2007–January 2009
T799 resolution plusmodified cumulus convection 432
Table 2 The three time periods considered and main characteris-tics of the ECMWF model.

ECMWF Newsletter No. 118 – Winter 2008/09
24
METEOROLOGY
changes are given in Table 2, but note that number ofverifiable model forecast at 72 hours is similar. Thus,intercomparison between the three periods is not overlybiased by differences in number of cases.The mean forecast error at the standard forecast
times for the ECMWF model versus best/baselineconsensus, BCON, for all TCs is given in Figure 7. Thelower error for the model versus consensus after thephysics change is apparent at each forecast time (i.e.compare the difference between the dark and lightgreen bars with that between the dark and light yellowbars). However, showing relative gain makes the differ-ence clearer as seen in Figure 8. The percentagegain/loss of the ECMWF model versus consensus iscalculated in the same way as in Figures 5 and 6, but here
for three versions of the ECMWF model, again for allTCs globally.First note how the T511 version of the model was
about 20–15% worse (higher mean forecast error) thanBCON at all forecast times. This relationship with consen-sus is typical or slightly better than the best models inthe Atlantic (Figure 6) that are 15–25% poorer.The resolution increase to T799 (yellow versus red
bars) shows a distinct improvement in relative skill,particularly at the medium-range, so that by 120 hoursthe model was on par, or better than consensus. Thegains at the longer forecast times likely come frommodel improvements (e.g. slower error growth).The 15–20% gain after the physics changes in Cy32r3
(green versus yellow bars) is simply unprecedented andindicates a fundamental advancement in performancefor the ECMWFmodel. The gains at the short-range areparticularly impressive and imply an improved analysisas well as a better model.An important requirement for successful data assim-
ilation is small differences between high-qualityobservations and the model forecast background (theinnovation). A model that makes a short-range forecast(typically six hours) close to these good observations willproduce smaller innovations and thereby there is ahigher probability the observations will make a positivecontribution to the model analysis and forecasts. Simplyput, the better the model, the smaller the innovationsand the better the analysis/forecast, especially in theshort-range (12–36 hours for TCs).The model changes in November 2007 resulted in a
fundamental improvement on scales/meteorology signif-icant to TC track prediction, but the tropical wind scoreshows only a modest jump in 2007 (Figure 2). While thetropical skill measure does detect fundamental quality,the TC results suggest a more comprehensive metric isneeded and that TCs measure another dimension ofmodel skill in the tropics.The percentage gain was also calculated separately
for the Atlantic and western North Pacific (WPAC)basins, though these results are not shown. The pattern
20082006200420022000199819961994Perc
enta
ge
imp
rove
men
to
ver
CLI
PER
at72
ho
urs
19920
20
40
60
80GFDLUKMOBCONOFCL
Year
2008 20102006200420022000
GFDLUKMOOFCL
Perc
enta
ge
imp
rove
men
to
ver
BC
ON
at72
ho
urs
20
10
0
–10
–20
–30
–40
–50
–60
Year
Figure 5 Gain or percentage improvementof forecast error at 72 hours of the GFDLmodel (blue), UK Met Office model (UKMO –green), concensus forecast (BCON – yellow)and the official NHC forecast (OFCL – red) rela-tive to CLIPER. The solid line is a smoothedversion of the dotted time series. Positive valuesindicate lower forecast error than CLIPER.
Figure 6 As in Figure 5 but for the percentage improvement offorecast error at 72 hours of the GFDL model (blue), UK Met Officemodel (UKMO – green) and the official NHC forecast (OFCL – red)relative to consensus (BCON). The solid line is a smoothed versionof the dotted time series. Negative values indicate the aid is poorer(higher forecast error) than the baseline.

ECMWF Newsletter No. 118 – Winter 2008/09
25
METEOROLOGY
of change is similar to the global pattern of improve-ments at the longer forecast times with increasedresolution, and the model better than consensus at alltimes with the physics change. However, the signal ismuch stronger in WPAC and even stronger in the south-ern hemisphere. The 20–30% gain in WPAC with thephysics changes is more extreme than found globallyand may be partly explained by a stronger influence ofconvection on the large scales in tropical WPAC.The more muted response in the Atlantic may be a
consequence of approaching an asymptote in skill as themean 72-hour forecast error for BCON in 2008 wasvery low at 129 nm with the greatest-ever improvementover CLIPER at 63%. Despite these high levels of skill,the ECMWF model in 2008 achieved an even lowermean forecast error of 116 nm.To put these statistics in perspective, consider the
results from predictability studies, most notably of Leslieet al. (1998) where they used nonlinear systems theoryand both a barotropic and baroclinic model to esti-mate ‘inherent’ predictability limits. At 72 hours allthree techniques produced estimates of approximately120 nm. There was some dependence on basin, but nomore than 5%, so that the 120 nmmean forecast erroris representative of a lower bound.Leslie et al. (1998) also compared the estimates to the
error of NWP models circa 1995 and found that themodels were within 35–40% of the inherent limit.Clearly, this estimate is either too high or the ECMWFmodel is approaching the ‘perfect model’ as the modelis performing below their limit. The weaker impact inthe Atlantic is consistent with approaching a limit.
Summary of the results
We have examined recent trends in dynamical medium-range TC track prediction and the relative role of modelresolution versus physics. Themedium-range (day 3) wasemphasised for two reasons: (a) any TC forecast aid mustfirst make good track predictions before second-orderproperties such as maximum surface wind speed (inten-sity) can be considered in the official forecast (i.e. allaspects of the forecast must be physically reasonable andconsistent) and (b) by 72 hours into the integration,model errors become dominant (i.e. a good analysiscannot overcome model errors).The near halving in the mean 72-hour track forecast
error for both the models and the official forecastsfrom ~300 nm in the mid 1990s to ~150 nm in the mid2000s is a testament to the major advances in globalNWP, especially in the modelling of the tropical generalcirculation.A consensus, or simple averaging of the track fore-
ECMWF T511BCON T511ECMWF T799BCON T799ECMWF T799 + ConvectionBCON T799 + Convection
00 h 12 h 24 h 36 h
Forecast time
Fore
cast
trac
ker
ror(
nm)
48 h 72 h 96 h 120 h
100
200
150
50
250
300
T511
T799
T799 + Convection
-300 h 12 h 24 h 36 h
Forecast time
Perc
enta
geim
prov
emen
tofE
CMW
Fov
erBC
ON
48 h 72 h 96 h 120 h
0
-10
-20
10
20
30
Figure 7 72-hour mean forecast error forall TCs globally for the ECMWF model and BCONfor each time period for T511 (red bars),T799 (yellow bars) and T799 plus cumulusconvection change (green bars).
Figure 8 Percentage gain or improvementin 72-hour mean forecast error of ECMWFversus BCON for all TCs globally for T511(red bars), T799 (yellow bars) and T799 pluscumulus convection change (green bars).

ECMWF Newsletter No. 118 – Winter 2008/09
26
casts from multiple, quasi-independent models, wasfound to have higher skill than any individual model andthat the model was typically 20% worse at 72 hoursthan consensus. However, recent results from theECMWF global model put this long-standing relation-ship into question.In November 2007 significant changes were made to
the ECMWF model physics, including the parame-trization of cumulus convection. By comparing TC trackforecasts before and after changes in the ECMWFmodelphysics, we found a dramatic improvement in medium-range track skill, especially in the convectively moreactive, monsoon-trough TC basins of the western NorthPacific and the southern hemisphere. The improve-ment in the Atlantic was less pronounced, possibly dueto approaching an asymptote in skill as the model andconsensus forecasts in 2008 had the lowest errors inhistory (Franklin, 2008) and were below predictabilityestimates from the 1990s. We also found that an increasein the ECMWFmodel resolution in February 2006 hada smaller impact.
Personal views about the implications formedium-range TC track prediction
The implication of these ECMWFmodel results for thefuture of TC track prediction and hurricane modelforecast improvement are many fold and in my opin-ion strongly challenge conventional wisdom. Thefollowing personal views do not fully follow from theresults presented, but represent my interpretation basedon over 30 years of experience with TC NWPmodelling.The first notion is that high spatial resolution is a
necessary or even a sufficient condition for TC predic-tion. For TC simulation, the inner core must be resolved,but in regards to motion, dynamical considerations(Fiorino & Elsberry, 1989) and the global model resultsindicate that the resolution of ECMWFmodel (~ 25 km)is adequate as this model outperformed both the higher-resolution global model (T959L60) of the JapanMeteorological Agency (JMA, 2008) and the limited-areamodels (e.g. GFDL) in 2008.My second impression is that TC motion becomes a
global problem sooner than may have been previouslythought. Consequently, by 72 hours small changes in thelarge-scale, far from the storm, have a significant effecton track, and that global-scale information must beaccurately communicated into a limited-area model.However, the lateral boundary conditions cannot bemathematically formulated to perform this communi-cation accurately (Harrison & Elsberry, 1972). Indeed,even if it were possible, there would be still be a ‘physics’barrier because of differences in the parametriza-tions/physics between the global and limited-areamodel.The most accurate approach to high-resolution TC
modelling is either a cloud-resolving global model ora two-way interactive nest inside a global model, asopposed to one-way influence of a separate global
model on a different limited-area model. The forecasttime at which global-scale errors significantly degradethe limited-area model solution could be as early as 48hours, in which case running such one-way influencemodels past 48 hours is counter-indicated.The consensus approach to deterministic forecasting
has been very successful over the last nine years and hasmotivated the application of single- and multi-modelensemble systems to improve consensus by adding solu-tions with higher skill and greater error decorrelation.However, the ECMWFmodel was 20% better than consen-sus globally in 2008 – a staggering achievement for anNWP model. Hitherto, the models were 20% worse. Mythird suggestion is that the path to better forecasts maynot lie in multi-model ensembles, and that we mustbetter understand how the ECMWF model brokethrough the 1990s predictability limits to find a wayforward.Fourthly, the reasonable assumption that skill, espe-
cially for intensity, is critically dependent on the analysisof the TC vortex is debatable. ECMWF is the only oper-ational NWP centre that makes no TC-specificadjustments to the analysis of the TC wind structure.Other modelling systems use either synthetic observa-tions or wholesale vortex replacement. One explanationwhy the ECMWF ‘less-is-more’ approach yields better TCtrack forecasts is that external vortex specification distortsthe larger-scale flow around the cyclone and thereby addserror, albeit small, on scales that vortex motion is sensi-tive. In the current era of a huge observing system andaccurate models, small errors do matter, and identifyingthe critical aspects of the TC vortex analysis problem willbe more challenging.
FURTHER READINGBender, M.A., I. Ginis, R. Tuleya, B. Thomas & T. Marchok,2007: The operational GFDL coupled hurricane-oceanprediction system and a summary of its performance.Mon. Wea. Rev., 135, 3965–3989.ECMWF, 2009: Model changes in 2007:www.ecmwf.int/products/data/operational_system/evolution/
evolution_2007.html#6November2007.ECMWF, 2008: Forecast verification web:www.ecmwf.int/products/forecasts/d/charts/medium/verification/timeseries/
z_score_monthly_mean!Tropics!run!12!pop!od!oper!w_scores!latest!/.Fiorino, M. & R.L. Elsberry, 1989: Contributions to tropicalcyclone motion by small, medium and large Scales in theInitial Vortex. Mon. Wea. Rev., 117, 721–727.Franklin, J.L., 2008: NHC Annual verification report.(www.nhc.noaa.gov/verification/).Goerss, J.S., 2000: Tropical cyclone track forecasts using anensemble of dynamical models.Mon. Wea. Rev., 128, 1187–1193.Harrison, E.J., Jr. & R.L. Elsberry, 1972: A method toincorporating nested finite grids in the solution of systemsof geophysical equations. J. Atmos. Sci., 29, 1235–1245.JMA, 2008: NWP model specifications:www.jma.go.jp/jma/en/Activities/nwp.html.
METEOROLOGY

ECMWF Newsletter No. 118 – Winter 2008/09
27
Leslie, L.M., R.F. Abbey & G.J.Holland, 1998: Tropicalcyclone track predictability.Meteorol. Atmos. Phys., 65, 223–231.Serrano, E., 1998: Tropical cyclones. ERA-15 Project ReportSeries No. 5. ECMWF available at:www.ecmwf.int/publications/library/do/references/show?id=83257.Uppala, S.M., P.W. Kållberg, A.J. Simmons, U. Andrae,V. da Costa Bechtold, M. Fiorino, J.K Gibson, J. Haseler,A. Hernandez, G.A. Kelly, X. Li, K. Onogi, S. Saarinen,N. Sokka, R.P. Allan, E. Andersson, K. Arpe,
M.A. Balmaseda, A.C.M. Beljaars, L. van de Berg, J. Bidlot,N. Bormann, S. Caires, F. Chevallier, A. Dethof,M. Dragosavac, M. Fisher, M. Fuentes, S. Hagemann,E. Hólm, B.J. Hoskins, L. Isaksen, P.A.E.M. Janssen,R. Jenne, A.P. McNally, J.-F. Mahfouf, J.-J. Morcrette,N.A Rayner, R.W. Saunders, P. Simon, A. Sterl,K.E. Trenberth, A. Untch, D. Vasiljevic, P. Viterbo &J. Woollen, 2005: The ERA-40 Reanalysis. Q. J. R. Meteorol.Soc., 131, 2961–3012.
Special Project computer allocations for 2009–2011The allocations for 2009 have been approved. The figures for 2010 and 2011 indicate what has been requested.
MemberState Institute Project title
2009 2010 2011
HPCFunits
Datastorage
HPCFunits
Datastorage
HPCFunits
Datastorage
Continuation Projects
Austria
1 Univ. Graz(Kirchengast)
Climate monitoring by advancedspaceborne sounding andatmospheric modelling
30,000 300 30,000 300 30,000 300
2
Univ. of NaturalResources and AppliedLife Sciences, Vienna(Seibert)
Modelling of Tracer Transport (MoTT) 30,000 100 30,000 100 30,000 100
3 Univ. Vienna(Steinacker)
MESOCLIM –Mesoscale alpine climatology 4,960 16 4,960 16 4,960 16
Belgium 4 MUMM (Ponsar)Data assimilation in high-resolutionhydrodynamic and ecologicalforecasts of the North Sea
120,000 700 120,000 700 120,000 700
Denmark 5 DMI (Amstrup) Data impact studies in HIRLAM 900,000 6,000 900,000 6,000 500,000 5,000
France
6CNRM/GMAP,Météo-France(Fischer)
Investigation of coupling the ALADINand AROME models to boundaryconditions from ECMWF and ERAmodel data
30,000 800 30,000 800 30,000 800
7 CERFACS (Rogel)Seasonal to inter-annualpredictability of a coupledocean-atmosphere model
10,000 150 10,000 150 10,000 150
8 CERFACS (Weaver) Variational data assimilation withthe OPA OGCM 150,000 2,000 150,000 2,000 150,000 2,000
Germany
9 MPI, Mainz(Baumgärtner)
Solar effects in an Earth-System-Model simulation for 1960–2006 1,200,000 1,500 1,200,000 1,500 1,200,000 1,500
10 MPI, Hamburg(Bengtsson)
Numerical experimentation with acoupled ocean/atmosphere model 304,000 800 350,000 850 400,000 900
11 Univ. Frankfurt(Casanova, Ahrens)
Combination of seasonal forecastsby BMA 500 200 500 200 x x
12 FU Berlin(Cubasch, Kirchner)
Investigation of systematic tendencychanges and their influence on thegeneral circulation simulated withclimate models
20,000 1,500 20,000 2,000 20,000 2,000
13 ISET (Czisch) Evaluation of the global potential ofenergy towers 100 20 100 20 100 20
14 DLR (Dörnbrack)Influence of non-hydrostatic gravitywaves on the stratospheric flow fieldabove Scandinavia
150,000 80 150,000 80 150,000 80
15 DLR (Dörnbrack) Support tool for HALO missions 50,000 80 50,000 80 50,000 80
METEOROLOGY / GENERAL

ECMWF Newsletter No. 118 – Winter 2008/09
28
GENERAL
MemberState Institute Project title
2009 2010 2011
HPCFunits
Datastorage
HPCFunits
Datastorage
HPCFunits
Datastorage
Germany
16 Univ. Munich (Egger) Landsurface-atmosphere interaction 150 10 150 10 150 10
17 Univ. Cologne (Elbern) GEMS: work package WP_RAQ_2 1,700,000 10,000 2,200,000 10,000 2,200,000 10,000
18 DLR & MPI Chemistry,Mainz (Eyring, Steil)
Impact of anthropogenic emissionson tropospheric chemistry with aspecial focus on ship emissions
400,000 4,000 400,000 4,000 400,000 4,000
19 MPI, Hamburg(Feichter)
Climate impact of specific economicsectors 350,000 1,200 X X X X
20 Univ. Köln (Fink) Interpretation and calculation ofenergy budgets 120 15 120 15 150 20
21 DLR (Gierens) Ice-supersaturation and cirrus clouds 200,000 100 200,000 100 200,000 100
22 MPI, Hamburg(Hagemann)
Regional downscaling of ERA-40data and validation of thehydrological cycle
580,000 4,600 660,000 5,400 740,000 6,200
23 DLR (Hoinka) Climatology of the global tropopause 500 10 500 10 500 10
24 MPI, Hamburg (Jacob) Regional ensemble prediction 84,000 6,500 92,000 7,500 104,000 8,500
25 Univ. Karlsruhe(Jones)
The impact of tropical cyclones onextratropical predictability 300,000 400 300,000 400 300,000 400
26 MPI, Hamburg(Jungclaus)
Community simulations of the lastmillennium (COMSIMM) 600,000 3,000 600,000 3,000 x x
27 DLR (Keil, Craig)Ensemble modelling for theimprovement of short rangequantitative precipitation forecasts
120,000 150 120,000 150 120,000 150
28 Univ. Karlsruhe(Kottmeier)
Mesoscale modelling using the DWDLokal-Modell 10,000 0 10,000 0 10,000 0
29 FU Berlin (Langematz) Chemistry-climate model simulationsfor WMO ozone assessment 830,000 4,000 10,000 1,000 10,000 1,000
30 Leibniz-Institut,Univ. Kiel (Latif)
Seasonal to decadal forecasting withcoupled ocean-atmosphere generalcirculation models
1,070,000 7,000 1,000,000 7,000 1,000,000 7,000
31 IMK-IFU (Laux)Statistical analysis of the onset ofthe rainy season in the Volta Basin(West Africa)
0 10 0 10 0 10
32 DLR (Mayer)Remote sensing of water andice clouds with Meteosat secondgeneration
20,000 20 20,000 20 20,000 20
33 Ruhr-UniversityBochum (Pahlow)
Optimisation of water managementby using ensemble forecasts 30,000 3 25,000 3 X X
34Alfred WegenerInstitute, Potsdam(Rex)
Ozone and water vapour transportwith the residual circulation 200 200 200 200 X X
35Alfred WegenerInstitute, Potsdam(Rinke)
Sensitivity of HIRLAM 100 10 100 10 100 10
36 FZ Jülich (Schultz) Global atmospheric chemistrymodelling 500,000 9,000 600,000 10,000 700,000 11,000
37 FU Berlin(Ulbrich, Leckebusch)
Investigations of storms in forecasts,hindcasts and climate modelsimulations on daily to seasonal andclimatological timescales
5,000 1,500 5,000 2,000 5,000 2,000

ECMWF Newsletter No. 118 – Winter 2008/09
29
GENERAL
MemberState Institute Project title
2009 2010 2011
HPCFunits
Datastorage
HPCFunits
Datastorage
HPCFunits
Datastorage
Germany
38 Univ. Bremen(Weber)
Chemical and dynamicalinfluences on decadal ozone change(CANDIDOZ)
20 20 20 20 20 20
39 Univ. Mainz (Wirth) Water vapour in the uppertroposphere 1,000 20 1,000 20 1,000 20
40 Univ. Hohenheim(Wulfmeyer, Bauer)
Real-time assimilation ofobservations of key prognosticvariables and the development ofaerosol operators (RAPTOR)
300,000 1,500 300,000 1,500 300,000 1,500
Ireland 41 Met Éireann (Wang) Changes in the North Atlanticclimate and impacts for Ireland 50,000 1,000 50,000 2,000 50,000 3,000
Italy
42 CNMCA(Bonavita, Torrisi) Limited area ensemble Kalman filter 1,200,000 500 1,400,000 500 1,800,000 500
44 CNMCA (Bonavita,Torrisi, Marcucci)
EUCOS observing system experiment(EUCOS-OSE) 700,000 500 700,000 500 700,000 500
44 ISMAR-CNR(Cavaleri)
Evaluation of the performance of theECMWF meteorological model athigh resolution
250,000 200 250,000 200 X X
45ARPA-SIM(Di Giuseppe,Marsigli)
Flow dependent error statistic forsatellite data assimilation inregional model (FEAR)
1,000,000 150 1,000,000 150 1,000,000 150
46
OsservatorioAstrofisico diArcetri, Firenze(Masciadri)
Forecasting of the optical turbulencefor astronomy applications with theMesoNH mesoscale model coupledwith ECMWF products
4,000 30 4,000 30 4,000 30
47 ISAC-CNR (Maurizi) GEMS: BOLCHEM 90,000 120 X X X X
48
ARPA-SMR EmiliaRomagna, &UK Met Office(Montani, Mylne)
Limited area ensemble forecasts ofwindstorms over Northern Europe 900,000 120 920,000 140 950,000 160
49
ARPA-SMR EmiliaRomagna &MeteoSwiss(Montani, Walser)
Improvements of COSMO limitedarea ensemble forecasts 720,000 450 750,000 500 800,000 550
50
ARPA-SMR EmiliaRomagna & ItalianMet. Service(Paccagnella,Montani, Ferri)
Limited area model targeted ensem-ble prediction system (LAM-TEPS) 710,000 700 800,000 800 900,000 900
51 Univ. Genova(Parodi)
High resolution numerical modellingof intense convective rain cells 50,000 200 50,000 200 50,000 200
52ARPA-SMR EmiliaRomagna & UCEA(Pavan, Esposito)
Seasonal prediction forItalian agriculture (SPIA) 10 100 10 100 10 100
53 CNMCA (Zauli,Torrisi)
Tuning COSMO-ME to H-SAFrequirements 1,200 700 1,400 800 1,600 900
Netherlands
54 KNMI (Haarsma) Storm tracks in a warmer climate 300,000 500 300,000 500 300,000 500
55 KNMI (Hazeleger) Patterns of climate change: coupledmodelling activities 400,000 500 400,000 500 1,000,000 500
56 KNMI (Hazeleger)EC-Earth: developing a Europeanearth system model based onECMWF modelling systems
5,000,000 15,000 5,000,000 20,000 5,000,000 25,000

ECMWF Newsletter No. 118 – Winter 2008/09
30
GENERAL
MemberState Institute Project title
2009 2010 2011
HPCFunits
Datastorage
HPCFunits
Datastorage
HPCFunits
Datastorage
Netherlands
57 KNMI (Onvlee) The Hirlam-A project 1,000,000 8,500 1,250,000 8,500 1,500,000 8,500
58 KNMI (Selten) Climate change studies using theIFS system 225,000 500 225,000 500 X X
59 KNMI (Siebesma) Rain in cumulus 250,000 250 275,000 250 300,000 250
60 KNMI(van Meijgaard)
Multi-annual integrations withthe KNMI regional climate modelRACMO2
500,000 2,500 X X X X
61 KNM(van Meijgaard)
Regional modelling of the Greenlandsurface mass balance for keyepisodes in the past and the future
500,000 1,500 500,000 1,500 X X
62 KNMI(John de Vries)
Data assimilation over the NorthAtlantic (DANA) 65,000 1,000 65,000 1,000 X X
63 KNMI (van Weele)Global chemistry-transportmodelling of natural reactivegreenhouse gases
100,000 100 100,000 100 100,000 100
64 KNMI (van den Hurk) Participation in GLACE-2 100,000 580 50,000 580 50,000 580
Norway
65 DNMI (Benestad)Seasonal predictability over theArtic region – exploring the role ofboundary conditions
160,000 1,000 215,000 1,000 X X
66 Univ. Oslo (Isaksen) Ozone as a climate gas 50,000 5 50,000 5 50,000 5
67 DNMI (Iversen) GLAMEPS – Grand limited areamodel ensemble prediction system 1,500,000 10,000 2,000,000 10,000 2,000,000 10,000
68 DNMI (Iversen,Kristiansen)
REGCLIM: optimal forcingperturbations for the atmosphere 400,000 1,000 600,000 1,000 X X
Portugal 69 Univ. Lisbon(Soares) HIPOCAS-SPEC 0 10 0 10 0 10
Spain
70 Univ. Illes Balears(Cuxart)
Study of the stably stratifiedatmospheric boundary layer throughlarge-eddy simulations and highresolution mesoscale modelling
96,000 200 96,000 200 96,000 200
71 Univ. de Castilla-LaMancha (Gärtner)
Analysis of land surface-atmosphereinteractions through mesoscalesimulations
700,000 1,000 700,000 1,000 700,000 1,000
72 Univ. BasqueCountry (Saenz)
Mesoscale meteorological reanaly-sis over the Iberian Peninsula 50,000 2,000 50,000 2,000 X X
Sweden 73 SMHI (Robertson)GEMS/MACC – Global and regionalearth-system monitor usingsatellite and in situ data
145,000 6 145,000 6 145,000 6
Switzerland 74
Institute forAtmospheric andClimate Science,ETH Zurich(Lohmann)
Cloud aerosol interactions 250,000 200 300,000 200 300,000 200
UnitedKingdom
75 ESSC, Univ. Reading(Bengtsson)
Predictability studies with emphasison extra-tropical and tropical storm-tracks and their dependence on theglobal observing systems
300,000 300 300,000 300 300,000 300
76 Univ. Reading(Ehrendorfer)
The TIGGE Data Base: atmosphericpredictability and Bayesian decisionmaking
9,000 30 9,000 30 X X
77 Univ. Reading(Haines)
Using data assimilation in a high-resolution ocean model to determinethe thermohaline circulation
1,000,000 7,000 460,000 7,000 X X

ECMWF Newsletter No. 118 – Winter 2008/09
31
GENERAL
MemberState Institute Project title
2009 2010 2011
HPCFunits
Datastorage
HPCFunits
Datastorage
HPCFunits
Datastorage
UnitedKingdom
78 Univ. Oxford(Hanlon)
Attribution of changes in extremeweather risk using large ensemblesof climate model simulations
25,000 150 X X X X
79 Univ. Reading(Hoskins)
Moist singular vectors and Africaneasterly waves 75,000 150 X X X X
80ManchesterMetropolitan Univ.(Lee)
Determining the relative roles ofNOx and CO2 emissions from avia-tion in climate change
80,000 500 45,000 400 X X
81 DARC, Univ.Reading (Migliorini)
Assimilation of geostationary ozonemeasurements for global ozonemonitoring
150,000 1,000 X X X X
82 DARC, Univ.Reading (Migliorini) GlobModel 150,000 1,000 150,000 1,000 X X
83 Univ. Reading(O’Neill)
Assimilation of retrieved productsfrom EOS MLS 900,000 3,000 900,000 3,000 300,000 3,000
84 DARC, Univ.Reading (O’Neill)
How good are simulated watervapour distributions in the UTLSregion?
70,000 250 X X X X
85 Keele Univ. (Shrira) Direct numerical simulations of 2-Dfreak waves 100,000 100 X X X X
86 BAS, Cambridge(Turner)
Assessment of ECMWF forecastsover the high latitude areas of thesouthern hemisphere
0 1 0 1 0 1
ICTP
87 ICTP (Kucharski)Dynamical downscaling of seasonalpredictions with a regional climatemodel
500,000 2,000 500,000 2,000 500,000 2,000
88 ICTP (Kucharski)
Decadal interactions between thetropical Indo-Pacific Ocean andextratropical modes of variability inan intermediate coupled model
100,000 600 100,000 600 100,000 600
JRC
89 JRC-IES (Dentener)The linkage of climate and airpollution: simulations with theglobal 2-way nested model TM5
120,000 160 150,000 180 200,000 200
90 JRC-IES (Dosio)
Coupling a regional climate modelto a biogeochemical land-surfacemodel in the study of climatechange impacts on the Europeanecosystem
200,000 100 200,000 100 X X
New Projects
Austria 1 Univ. Vienna(Haimberger)
Bias estimation of historic in situupper air data 5,000 200 5,000 500 10,000 1,000
Denmark
2 DMI (May)Numerical experimentation with theEC-Earth system with special focuson the Mediterranean region
600,000 5,000 300,000 2,500 X X
3 DMI (Yang)Decadal climate changeexperiments of EC-Earth at highresolution and with top atmosphere
200,000 1,000 200,000 2,000 X X
Netherlands 4 KNMI (Huijnen)
Global reactive gases modelling inGEMS and MACC: towards an oper-ational assimilation and forecastingsystem for tropospheric reactivegases
100,000 250 100,000 250 100,000 250

ECMWF Newsletter No. 118 – Winter 2008/09
32
GENERAL
Special Projects finishing in 2008
MemberState Institute Project title
Austria
1 Univ. Vienna(Haimberger) Homogenization of the global radiosonde temperature and wind dataset
2 Univ. Vienna (Hantel) Convective fluxes diagnosed from gridscale ECMWF analyses
3 Univ. Vienna(Steinacker)
4D OMEGA FORM – 4 dimensional objective mesogamma analysis of Föhn in the RhineValley during MAP
Ireland 4 Met Éireann(McGrath) Community Climate Change Consortium for Ireland (C4I)
Italy 5 INGV, Bologna(Manzini) Middle atmosphere modelling
Netherlands 6 KNMI (van Velthoven) Chemical reanalyses and sensitivity studies with the chemistry-transport model TM4
Norway7 DNMI (Frogner) NORLAMEPS: Limited Area Ensemble Prediction System for Norway
8 DNMI (Tveter) Optimisation of operational NWP at met.no
MemberState Institute Project title
2009 2010 2011
HPCF units Datastorage HPCF units Data
storage HPCF units Datastorage
New Projects
Netherlands
5 KNMI (van Noije)
Global atmospheric chem-istry modelling withEC-Earth: understandingpast and predicting futuretropospheric ozone in achanging climate
300,000 500 300,000 500 300,000 500
6 KNMI (Weber)
Modelling past greenhouseworlds with EC-Earth:understanding past andpredicting future responseto high greenhouse gaslevels
400,000 200 400,000 200 400,000 200
Norway
7 NILU (Eckhardt)
FLEXPART transportsimulations for theInternational Polar Year andfurther model development
150,000 150 150,000 150 150,000 150
8 DNMI (Frogner) TEPS – Targeted EPS forEurope 500,000 500 500,000 500 500,000 500
9 DNMI(Randriamampianina)
Tuning of HARMONIEassimilation and forecastsystems
500,000 2,000 500,000 2,000 X X
Sweden 10 Stockholm University(Magnusson)
New methods for anensemble prediction system 200,000 1,020 X X X X
Switzerland 11
Institute forAtmospheric andClimate Science, ETHZurich (Storelvmo)
Aerosol influence onclouds, precipitation andclimate in EC-Earth
250,000 200 250,000 200 250,000 200
Total requested 34,550,860 146,000 33,355,060 145,346 29,712,590 128,358

ECMWF Newsletter No. 118 – Winter 2008/09
33
GENERAL
Member State computer allocations for 2009Member State HPCF (kunits) Data Storage (Gbytes)
Belgium 22,682 67,202
Denmark 19,344 57,314
Germany 92,283 273,420
Spain 43,538 128,998
France 73,412 217,509
Greece 18,817 55,753
Ireland 16,783 49,726
Italy 62,292 184,561
Luxembourg 12,805 37,939
Netherlands 30,245 89,610
Norway 20,388 60,406
Member State HPCF (kunits) Data Storage (Gbytes)
Austria 20,506 60,755
Portugal 17,050 50,517
Switzerland 23,410 69,360
Finland 17,554 52,008
Sweden 22,483 66,615
Turkey 21,384 63,358
United Kingdom 77,273 228,949
Allocated toSpecial Projects 34,551 146,000
Reserved forSpecial Projects 13,200 40,000
Total 660,000 2,000,000
THERE are a variety of Representatives and ContactPoints within ECMWF’s Member States and Co-oper-ating States who liaise with staff at ECMWF. The role ofthese Representatives and Contact Points is given below.Note that:� The purpose of the Technical Advisory Committee(TAC) is covered on page 36 in the item about“ECMWF Council and its committees”.
� A list of TAC Representatives, Computing Represent-atives and Meteorological Contact Points is given inthe table on page 34.
Computing Representatives
Computing Representatives co-ordinate the registrationof users of ECMWF computing services, and representtheir organisation in matters relating to the use ofECMWF computing facilities and the attendance to theComputer User Training Course. They play a very impor-tant role in improving the information flow andfacilitating various administrative transactions betweenECMWF and countries that have access to ECMWF’scomputing services. They liaise with the Head of Comp-uter Division and User Support at ECMWF. Meetings ofthe Computing Representatives are held at ECMWFannually. For more information on these meetings see:
www.ecmwf.int/newsevents/meetings/computing_representatives/
Meteorological Contact Points
Meteorological Contact Points receive information fromECMWF about the meteorological aspects of the opera-tional forecasting system, including the high-resolutiondeterministic model, ensemble forecast system, seasonalforecasts and the “Boundary Conditions for LimitedArea Modelling” optional project. They are encouraged
to provide feedback concerning the performance of theforecasting system to ECMWF. In addition theymay referto the Head ofMeteorological Operations Section or anyof the Meteorological Analysts at ECMWF if they wish todiscuss aspects of the daily model output.
Security Representatives
Security Representatives represent their organisationin matters relating to computer and network security,and receive information about ECMWF’s securityarrangements. They liaise with the Security Officer atECMWF. Meetings of the Security Representatives areheld at ECMWF annually. For more information onthese meetings see:
www.ecmwf.int/newsevents/meetings/security_representatives/
Telecommunication Technical Contacts
Telecommunication Technical Contacts deal with day-to-day matters concerning the Regional MeteorologicalData Communication Network (RMDCN). They liaisewith the Head of the Networking and Computer SecuritySection and Computer Operators at ECMWF. A list ofcontacts is available at:
rmdcn.ecmwf.int/About_RMDCN/Contact_Names/
Catalogue Contact Points
Catalogue Contact Points are the primary contact forexternal organisations wishing to receive real-timeECMWF products via one of the ECMWFMember Statesor Co-operating States. A list of contacts is available at:
www.ecmwf.int/products/catalogue/delivery.htmlThe Catalogue of ECMWF real-time products is availableat:
www.ecmwf.int/products/catalogue/
Responsibilities of Representatives and Contact Points

ECMWF Newsletter No. 118 – Winter 2008/09
34
GENERAL
TAC Representatives, Computing Representativesand Meteorological Contact Points
Member States TAC Representatives Computing Representatives Meteorological Contact Points
Belgium Dr D. Gellens Mrs L. Frappez Dr J. Nemeghaire
Denmark Mr L. Laursen Mr T. Lorenzen Mr G. Larsen
Germany Dr D. Schröder Dr E. Krenzien Mr T. Schumann
Greece Lt Col A. Anthis Mr A. EmmanouilMr D Ziakopoulos,
Mr M. Manoussakis,Mr P. Fragkouli
Spain Mr E. Monreal Mr R. Corredor Mr A. Alcazar
France Mr B. Strauss Mrs M. Pithon Mr J. Clochard
Ireland Mr P. Halton Mr P. Halton Mr M. Walsh
Italy Dr S. Pasquini Dr C. Gambuzza Dr T. La Rocca
Luxembourg Mr C. Alesch Mr C. Alesch Mr C. Alesch
Netherlands Mr T. Moene Mr H. de Vries Mr J. Diepeveen
Norway Mr J. Sunde Ms R. Rudsar Mr P. Evensen
Austria Dr G. Kaindl Dr G. Kaindl Dr H. Gmoser
Portugal Mrs T. Abrantes Mr C. Fernandes Mr N. M. Moreira
Switzerland Dr S. Sandmeier Mr P. Roth Mr E. Müller
Finland Dr Juhani Damski Mr K. Niemelä Mr P. Nurmi
Sweden Mr M. Hellgren Mr R. Urrutia Mr M. Hellgren
Turkey Mr M. Fatih Büyükkasabbasi Mr F. Kocaman Mr M. Kayhan
United Kingdom Dr A. Dickinson Mr R. Sharp Mr A. Radford
Co-operating States
Croatia Mr I. Cacic Mr V. Malovic Mr C. Brankovic
Czech Republic Ms A. Trojakova Mr K. Ostatnický Mr F. Sopko
Estonia Mr T. Kaldma Mr T. Kaldma Mrs M. Merilain,Mrs T. Paljak
Hungary Dr L. Bozó Mr I. Ihász Mr I. Ihász
Iceland Mr H. Björnsson Mr V. Gislason Mrs S. Karlsdottir
Latvia Mr A. Bukšs Mr A. Bukšs Mr A. Bukšs
Lithuania Mrs V Auguliene Mr M. Kazlauskas Mrs. V. Raliene
Montenegro Mr A. Berber Mr A. Marcev Ms M. Ivanov
Morocco Mr H. Haddouch Mr M. Jidane Mr K. Lahlal
Romania Dr I. Pescaru Mr R. Cotariu Mrs T. Cumpanasu
Serbia Ms L. Dekic Mr V. Dimitrijevic Mr B. Bijelic
Slovakia Mr J. Vivoda Mr O. Španiel Dr M. Benko
Slovenia Mr J. Jerman Mr P. Hitij Mr B. Gregorcic
Observers
EUMETSAT Mr M. Rattenborg Dr S. Elliott
WMO Mr M. Jarraud

ECMWF Newsletter No. 118 – Winter 2008/09
35
GENERAL
The following provides some information about theresponsibilities of the ECMWF Council and its commit-tees. More detail can be found at:
http://www.ecmwf.int/about/committees
Chair: Prof Gerhard Adrian (Deutscher Wetterdienst)
Vice Chair: Dr Heikki Järvinen(Finnish Meteorological Institute)
ECMWF Council and its committees
President: Dr Adérito Vicente Serrão (Portugal)
Vice President: Mr Wolfgang Kusch (Germany)
Policy Advisory Committee (PAC)
The PAC provides the Council with opinions and recom-mendations on any matters concerning ECMWF policysubmitted to it by the Council, especially those arisingout of the Four-Year Programme of Activities and theLong-term Strategy.
Chair: Dr Fritz Neuwirth (Austria)
Vice Chair: Ms Maria Ågren (Sweden)
Finance Committee (FC)
The FC provides the Council with opinions and recom-mendations on all administrative and financial matterssubmitted to the Council and shall exercise the finan-cial powers delegated to it by the Council.
Chair: Ms Monika Köhler (Austria)
Vice Chair: Mr Sergio Pasquini (Italy)
Scientific Advisory Committee (SAC)
The SAC provides the Council with opinions and recom-mendations on the draft programme of activities of theCentre drawn up by the Director and on any othermatters submitted to it by the Council. The 12 membersof the SAC are appointed in their personal capacity andare selected from among the scientists of the MemberStates.
Technical Advisory Committee (TAC)
The TAC provides the Council with advice on the tech-nical and operational aspects of the Centre including thecommunications network, computer system, operationalactivities directly affecting Member States, and techni-cal aspects of the four-year programme of activities.
Chair: Dr Alan Dickinson (United Kingdom)
Vice Chair: Mr Bernard Strauss (France)
Advisory Committee for Data Policy (ACDP)
The ACDP provides the Council with opinions andrecommendations on matters concerning ECMWF DataPolicy and its implementation.
Chair: Mr Colin Cuthbert (United Kingdom)
Vice Chair: Mr Klaus Haderlein (Germany)
Advisory Committee of Co-operating States (ACCS)
The ACCS provides the Council with opinions and recom-mendations on the programme of activities of the Centre,and on any matter submitted to it by the Council.
Chair: Mr Ivan Cac ic (Croatia)
Vice Chair: Mr Laszlo Bozo (Hungary)
Council
The Council adopts measures to implement the ECMWFConvention; the responsibilities include admission ofnew members, authorising the Director to negotiateand conclude co-operation agreements, and adoptingthe annual budget, the scale of financial contributionsof the Member States, the Financial Regulations and theStaff Regulations, the long-term strategy and theprogramme of activities of the Centre.

ECMWF Newsletter No. 118 – Winter 2008/09
36
GENERAL
ECMWF Calendar 2009
Mar 9–13 Training Course –Use and interpretation of ECMWF products
Mar 16–May 21 Training Course –Numerical Weather Prediction
Mar 16–25 Predictability, diagnostics and seasonalforecasting
Mar 30–Apr 3 Numerical methods and adiabatic formulationof models
Apr 20–29 Data assimilation and use of satellite data
May 11–21 Parametrization of diabatic processes
Apr 27–28 Advisory Committee on Data Policy(10th Session)
Apr 28–29 Finance Committee (82nd Session)
Apr 29–30 Policy Advisory Committee (27th Session)
May 6–8 Workshop on “Assimilation of IASI in NWP”
May 11–12 Security Representatives’ Meeting
May 12–14 Computer Representatives’ Meeting
Jun 1–5 Training Course –Use and interpretation of ECMWF products
Jun 10–12 Forecast Products – Users’ Meeting
Jun 15–17Workshop on“Diagnostics of Data Assimilation SystemPerformance”
Jun 25–26 Council (71st Session)
Sep 7–10Seminar on“Diagnosis of Forecasting and DataAssimilation Systems”
Sep 30–Oct 2 Scientific Advisory Committee (38th Session)
Oct 5–7 Technical Advisory Committee (40th Session)
Oct 12–16Training Course –Use and interpretation of ECMWF productsfor WMO Members
Oct 12–13 Finance Committee (83rd Session)
Oct 13–14 Policy Advisory Committee (28th Session)
Oct 19 Advisory Committee of Co-operating States(15th Session)
Nov 2–6 12th Workshop on“Meteorological Operational Systems”
To be decided Workshop on“Non-hydrostatic Modelling”
Nov 23–26 MACC Scientific and Technical TrainingWorkshop
Dec 8–9 Council (72nd Session)
Technical Memoranda
579 Janssen, P.A.E.M.: On some consequences of thecanonical transformation in the Hamiltoniantheory of water waves. November 2008
578 Richardson, D.S., J. Bidlot, L. Ferranti, A.Ghelli,M. Janousek, M. Leutbecher, F. Prates, F. Vitart& E. Zsoter: Verification statistics and evaluationsof ECMWF forecasts in 2007-2008. October 2008
577 Morcrette, J.-J., A. Beljaars, A. Benedetti, L. Jones& O. Boucher: Gustiness as predictor for liftingsea-salt and dust aerosols in the ECMWF IFS.October 2008
576 Drusch,M., K. Scipal, P. de Rosnay, G. Balsamo,E. Andersson, P. Bougeault & P. Viterbo: Exploit-ation of satellite data in the surface analysis.October 2008
575 Dee, D. & S. Uppala: Variational bias correctionin ERA-Interim. October 2008
574 Cloke,H.L. & F. Pappenberger: Operational flood
forecasting: a review of ensemble techniques.October 2008
567 Rodwell, M.J. and T. Jung: Understanding thelocal and global impacts of model physics changes:an aerosol example. December 2008 (publishedin Q. J. R. Meteorol. Soc., 2008, 134, 1479–1497).
560 Doblas-Reyes, F.J., A. Weisheimer, M. Déqué,N. Keenlyside,M.McVean, J.M.Murphy, P. Rogel,D. Smith& T.N. Palmer: Addressing model uncer-tainty in seasonal and annual dynamical ensembleforecasts. November 2008
558 Pappenberger, F. &R.Buizza: The skill of ECMWFprecipitation and temperature predictions in theDanube basin as forcings of hydrological models.December 2008 (submitted toWeather and Forecasting)
Proceedings
GRAS SAF Workshop on Applications of GPS RadioOccultation Measurements, 16–18 June 2008
ECMWF publications(see http://www.ecmwf.int/publications/)

ECMWF Newsletter No. 118 – Winter 2008/09
37
GENERAL
Index of past newsletter articlesThis is a selection of articles published in the ECMWF Newsletter series during the last five years.Articles are arranged in date order within each subject category. Articles can be accessed on the
ECMWF public website – www.ecmwf.int/publications/newsletter/index.html
No. Date Page
NEWS
ECMWF’s plans for 2009 118 Winter 2008/09 2
Survey of readers of the ECMWF Newsletter 118 Winter 2008/09 4
70th Council session on 2–3 December 2008 118 Winter 2008/09 4
Use of high performance computing in meteorology 118 Winter 2008/09 5
Atmosphere-Ocean Interaction 118 Winter 2008/09 6
Applying for computing resources for Special Projects 118 Winter 2008/09 7
Use of GIS/OGS standards in meteorology 118 Winter 2008/09 8
Additional ERA-Interim products available 118 Winter 2008/09 9
ECMWF workshops and scientific meetings in 2009 118 Winter 2008/09 10
ECMWF Education and Training Programme 2009 117 Autumn 2008 2
Forecast Products Users’ Meeting, June 2008 117 Autumn 2008 3
GRAS SAF Workshop on applications ofGPS radio occultation measurements 117 Autumn 2008 4
PREVIEW Data Targeting System (DTS) 117 Autumn 2008 5
Verification of severe weather forecasts 117 Autumn 2008 6
GMES Forum, 16-17 September 2008 117 Autumn 2008 7
69th Council session on 9–10 June 2008 116 Summer 2008 3
Exploratory analysis and verification of seasonalforecasts with the KNMI Climate Explorer 116 Summer 2008 4
Optimisation and improvements to scalability of4D-Var for Cy33r2 116 Summer 2008 6
World Modelling Summit for Climate Prediction 116 Summer 2008 6
Operational assimilation of GRAS measurementsat ECMWF 116 Summer 2008 7
ECMWF Annual Report for 2007 116 Summer 2008 8
First meeting of the TAC Subgroup on the RMDCN 115 Spring 2008 2
Third WCRP International Conference on Reanalysis 115 Spring 2008 3
Signing of the Co-operation Agreement betweenECMWF and Latvia 115 Spring 2008 4
ECMWF’s contribution to the SMOS project 115 Spring 2008 5
Celebration of Tony Hollingsworth’s life 114 Winter 2007/08 4
Two new Co-operation Agreements 114 Winter 2007/08 4
Signing of the Co-operation Agreement betweenECMWF and Montenegro 114 Winter 2007/08 7
New High Performance Computing Facility 114 Winter 2007/08 13
Fifteenth anniversary of EPS 114 Winter 2007/08 14
ENSEMBLES public data dissemination 113 Autumn 2007 4
Replacement of the Automated Tape Library forthe Disaster Recovery System 113 Autumn 2007 6
Co-operation Agreement signed with Morocco 110 Winter 2006/07 9
Co-operation Agreement with Estonia 106 Winter 2005/06 8
Long-term co-operation established with ESA 104 Summer 2005 3
Collaboration with the Executive Body of theConvention on Long-Range Transboundary Air Pollution 103 Spring 2005 24
Co-operation Agreement with Lithuania 103 Spring 2005 24
25 years since the first operational forecast 102 Winter 2004/05 36
No. Date Page
COMPUTING
ARCHIVING, DATA PROVISION AND VISUALISATIONNew Automated Tape Library for theDisaster Recovery System 113 Autumn 2007 34
The next generation of ECMWF’s meteorologicalgraphics library – Magics++ 110 Winter 2006/07 36
COMPUTERS, NETWORKS, PROGRAMMING,SYSTEMS FACILITIES AND WEBThe EU-funded BRIDGE project 117 Autumn 2008 29
ECMWF’s Replacement High PerformanceComputing Facility 2009-2013 115 Spring 2008 44
Improving the Regional MeteorologicalData Communications Network (RMDCN) 113 Autumn 2007 36
New features of the Phase 4 HPC facility 109 Autumn 2006 32
Developing and validating Grid Technology for thesolution of complex meteorological problems 104 Summer 2005 22
Migration of ECFS data from TSM to HPSS(“Back-archive”) 103 Spring 2005 22
METEOROLOGY
OBSERVATIONS AND ASSIMILATION
Towards the assimilation of ground-based radarprecipitation data in the ECMWF 4D-Var 117 Autumn 2008 13
Progress in ozone monitoring and assimilation 116 Summer 2008 35
Improving the radiative transfer modelling forthe assimilation of radiances from SSU andAMSU-A stratospheric channels 116 Summer 2008 43
ECMWF’s 4D-Var data assimilation system –the genesis and ten years in operations 115 Spring 2008 8
Towards a climate data assimilation system:status update of ERA-Interim 115 Spring 2008 12
Operational assimilation of surface wind data fromthe Metop ASCAT scatterometer at ECMWF 113 Autumn 2007 6
Evaluation of the impact of the space componentof the Global Observing System throughObserving System Experiments 113 Autumn 2007 16
Data assimilation in the polar regions 112 Summer 2007 10
Operational assimilation of GPS radio occultationmeasurements at ECMWF 111 Spring 2007 6
The value of targeted observations 111 Spring 2007 11
Assimilation of cloud and rain observations from space 110 Winter 2006/07 12
ERA-Interim: New ECMWF reanalysis productsfrom 1989 onwards 110 Winter 2006/07 25
Analysis and forecast impact of humidity observations 109 Autumn 2006 11
Surface pressure bias correction in data assimilation 108 Summer 2006 20
A variational approach to satellite bias correction 107 Spring 2006 18
“Wavelet” Jb – A new way to model the statisticsof background errors 106 Winter 2005/06 23
New observations in the ECMWF assimilationsystem: satellite limb measurements 105 Autumn 2005 13

ECMWF Newsletter No. 118 – Winter 2008/09
38
GENERAL
No. Date PageOBSERVATIONS AND ASSIMILATION
CO2 from space: estimating atmospheric CO2within the ECMWF data assimilation system 104 Summer 2005 14
Sea ice analyses for the Baltic Sea 103 Spring 2005 6
The ADM-Aeolus satellite to measure windprofiles from space 103 Spring 2005 11
An atlas describing the ERA-40 climateduring 1979–2001 103 Spring 2005 20
Planning of adaptive observations during theAtlantic THORPEX Regional Campaign 2003 102 Winter 2004/05 16
FORECAST MODEL
Towards a forecast of aerosols with theECMWF Integrated Forecast System 114 Winter 2007/08 15
A new partitioning approach for ECMWF’sIntegrated Forecast System 114 Winter 2007/08 17
Advances in simulating atmospheric variabilitywith IFS cycle 32r3 114 Winter 2007/08 29
A new radiation package: McRad 112 Summer 2007 22
Ice supersaturation inECMWF’s Integrated Forecast System 109 Autumn 2006 26
Towards a global meso-scale model: The high-resolution system T799L91 and T399L62 EPS 108 Summer 2006 6
The local and global impact of the recentchange in model aerosol climatology 105 Autumn 2005 17
Improved prediction of boundary layer clouds 104 Summer 2005 18
Two new cycles of the IFS: 26r3 and 28r1 102 Winter 2004/05 15
Early delivery suite 101 Sum/Aut 2004 21
Systematic errors in the ECMWF forecasting system 100 Spring 2004 14
ENSEMBLE PREDICTION AND SEASONAL FORECASTINGEUROSIP: multi-model seasonal forecasting 118 Winter 2008/09 10
Using the ECMWF reforecast dataset tocalibrate EPS forecasts 117 Autumn 2008 8
The THORPEX Interactive Grand GlobalEnsemble (TIGGE): concept and objectives 116 Summer 2008 9
Implementation of TIGGE Phase 1 116 Summer 2008 10
Predictability studies using TIGGE data 116 Summer 2008 16
Merging VarEPS with the monthly forecastingsystem: a first step towards seamless prediction 115 Spring 2008 35
Seasonal forecasting of tropical storm frequency 112 Summer 2007 16
New web products for theECMWF Seasonal Forecast System-3 111 Spring 2007 28
Seasonal Forecast System 3 110 Winter 2006/07 19
The ECMWF Variable Resolution EnsemblePrediction System (VAREPS) 108 Summer 2006 14
Limited area ensemble forecasting in Norwayusing targeted EPS 107 Spring 2006 23
Ensemble prediction: A pedagogical perspective 106 Winter 2005/06 10
Comparing and combining deterministic and ensembleforecasts: How to predict rainfall occurrence better 106 Winter 2005/06 17
EPS skill improvements between 1994 and 2005 104 Summer 2005 10
Ensembles-based predictions of climate changeand their impacts (ENSEMBLES Project) 103 Spring 2005 16
Monthly forecasting 100 Spring 2004 3
No. Date Page
OCEAN AND WAVE MODELLING
Climate variability from the new System 3ocean reanalysis 113 Autumn 2007 8
Progress in wave forecasts at ECMWF 106 Winter 2005/06 28
Ocean analysis at ECMWF: From real-time oceaninitial conditions to historical ocean analysis 105 Autumn 2005 24
High-precision gravimetry and ECMWF forcingfor ocean tide models 105 Autumn 2005 6
Towards freak-wave prediction over the global oceans 100 Spring 2004 24
ENVIRONMENTAL MONITORING
GEMS aerosol analyses with the ECMWFIntegrated Forecast System 116 Summer 2008 20
Progress with the GEMS project 107 Spring 2006 5
A preliminary survey of ERA-40 usersdeveloping applications of relevance to GEO(Group on Earth Observations) 104 Summer 2005 5
The GEMS project – making a contribution to theenvironmental monitoring mission of ECMWF 103 Spring 2005 17
METEOROLOGICAL APPLICATIONS AND STUDIES
Using ECMWF products inglobal marine drift forecasting services 118 Winter 2008/09 16
Record-setting performance of the ECMWF IFSin medium-range tropical cyclone track prediction 118 Winter 2008/09 20
The ECMWF ‘Diagnostic Explorer’:A web tool to aid forecast system assessmentand development 117 Autumn 2008 21
Diagnosing forecast error usingrelaxation experiments 116 Summer 2008 24
ECMWF’s contribution to AMMA 115 Spring 2008 19
Coupled ocean-atmosphere medium-range forecasts:the MERSEA experience 115 Spring 2008 27
Probability forecasts for water levels in The Netherlands 114 Winter 2007/08 23
Impact of airborne Doppler lidar observationson ECMWF forecasts 113 Autumn 2007 28
Ensemble streamflow forecasts over France 111 Spring 2007 21
Hindcasts of historic storms with the DWD modelsGME, LMQ and LMK using ERA-40 reanalyses 109 Autumn 2006 16
Hurricane Jim over New Caledonia: a remarkablenumerical prediction of its genesis and track 109 Autumn 2006 21
Recent developments in extreme weather forecasting 107 Spring 2006 8
MERSEA – a project to develop ocean andmarine applications 103 Spring 2005 21
Starting-up medium-range forecasting for NewCaledonia in the South-West Pacific Ocean –a not so boring tropical climate 102 Winter 2004/05 2
A snowstorm in North-Western Turkey 12–13February 2004 – Forecasts, public warningsand lessons learned 102 Winter 2004/05 15
Early medium-range forecasts of tropical cyclones 102 Winter 2004/05 7

ECMWF Newsletter No. 118 – Winter 2008/09
39
ExtDirectorDominique Marbouty 001
Deputy Director & Head of Research DepartmentPhilippe Bougeault 005
Head of Operations DepartmentWalter Zwieflhofer 003
Head of Administration DepartmentUte Dahremöller 007
SwitchboardECMWF switchboard 000
AdvisoryInternet mail addressed to [email protected] (+44 118 986 9450, marked User Support)
Computer DivisionDivision HeadIsabella Weger 050Computer Operations Section HeadSylvia Baylis 301Networking and Computer Security Section HeadRémy Giraud 356Servers and Desktops Section HeadRichard Fisker 355Systems Software Section HeadNeil Storer 353User Support Section HeadUmberto Modigliani 382User Support StaffPaul Dando 381Dominique Lucas 386Carsten Maaß 389Pam Prior 384
Computer OperationsCall Desk 303Call Desk email: [email protected]
Console – Shift Leaders 803Console fax number +44 118 949 9840Console email: [email protected]
Fault reporting – Call Desk 303Registration – Call Desk 303Service queries – Call Desk 303Tape Requests – Tape Librarian 315
ExtMeteorological DivisionDivision HeadErik Andersson 060Meteorological Applications Section HeadAlfred Hofstadler 400Data and Services Section HeadBaudouin Raoult 404Graphics Section HeadStephan Siemen 375Meteorological Operations Section HeadDavid Richardson 420Meteorological AnalystsAntonio Garcia-Mendez 424Anna Ghelli 425Claude Gibert (web products) 111Fernando Prates 421
Meteorological Operations Room 426
Data DivisionDivision HeadJean-Noël Thépaut 030Data Assimilation Section HeadLars Isaksen 852Satellite Data Section HeadPeter Bauer 080Re-Analysis Section HeadDick Dee 352
Probabilistic Forecasting & Diagnostics DivisionDivision HeadTim Palmer 600Seasonal Forecasting Section HeadFranco Molteni 108
Model DivisionDivision HeadMartin Miller 070Numerical Aspects Section HeadAgathe Untch 704Physical Aspects Section HeadAnton Beljaars 035Ocean Waves Section HeadPeter Janssen 116
GMES CoordinatorAdrian Simmons 700
Education & TrainingRenate Hagedorn 257
ECMWF library & documentation distributionEls Kooij-Connally 751
Useful names and telephone numbers within ECMWFTelephoneTelephone number of an individual at the Centre is:International: +44 118 949 9 + three digit extensionUK: (0118) 949 9 + three digit extensionInternal: 2 + three digit extensione.g. the Director’s number is:+44 118 949 9001 (international),(0118) 949 9001 (UK) and 2001 (internal).
E-mailThe e-mail address of an individual at the Centre is:[email protected]. the Director’s address is: [email protected]
For double-barrelled names use a hyphene.g. [email protected]
Internet web siteECMWF’s public web site is: http://www.ecmwf.int
GENERAL

© Copyright 2009
European Centre for Medium-Range Weather Forecasts, Shinfield Park, Reading, RG2 9AX, England
Literary and scientific copyright belong to ECMWF and are reserved in all countries. This publication is not to be reprinted or translat-ed in whole or in part without the written permission of the Director. Appropriate non-commercial use will normally be granted undercondition that reference is made to ECMWF.
The information within this publication is given in good faith and considered to be true, but ECMWF accepts no liability for error,omission and for loss or damage arising from its use.
Survey of readers
To complete the short questionnaire about the ECMWF Newsletterplease go to:
www.ecmwf.int/publications/newsletters/
and follow the links. See the article on page 4 for more details aboutthe questionnaire.