Modelling of Surface Crack Growth under Lubricated Rolling–Sliding Contact Loading
23
DOI 10.1007/s10704-005-8546-8 International Journal of Fracture (2005) 134:127–149 © Springer 2005 Modelling of surface crack growth under lubricated rolling–sliding contact loading BO ˇ STJAN ZAFO ˇ SNIK 1, *, ZORAN REN 1 , JO ˇ ZE FLA ˇ SKER 1 and GENNADY MISHURIS 2 1 Faculty of Mechanical Engineering, University of Maribor, Smetanova ulica 17, 2000 Maribor, Slovenia 2 Department of Mathematics, Rzeszow University of Technology, W. Pola 2, 35–959 Rzeszow, Poland *Author for correspondence (E-mail: [email protected]) Received 30 November 2004; accepted in revised form 31 May 2005 Abstract. The paper describes modelling approach to computational simulation of surface crack growth subjected to lubricated rolling–sliding contact conditions. The model considers the size and orientation of the initial crack, normal and tangential loading due to rolling–sliding contact and the influence of fluid trapped inside the crack by a hydraulic pressure mechanism. The motion of the contact sliding load is simulated with different load cases. The strain energy density (SED) and max- imum tangential stress (MTS) crack propagation criteria are modified to account for the influence of internal pressure along the crack surfaces due to trapped fluid. The developed model is used to simulate surface crack growth on a gear tooth flank, which has been also experimentally tested. It is shown that the crack growth path, determined with modified crack propagation criteria, is more accurately predicted than by using the criteria in its classical form. Key words: Contact loading, finite element analysis, internal pressure, maximum tangential stress, strain energy density, surface crack growth. 1. Introduction Mechanical elements under cyclic rolling–sliding contact loads can fail due to fatigue and wear damage even at resulting stresses that are well below the static safety lev- els. Rolling contact fatigue, that leads to surface cracking and consequently pitting, is one of the most common causes of failure in gears, bearings and railway tracks. The pitting phenomenon is strongly dependent on loading conditions, material of contact- ing parts, type of lubrication, surface roughness, etc., which all influence the appear- ance of initial surface cracks and later their propagation or arrest. The surface cracks could be initiated by the near-surface plastic deformation in the region of the maxi- mum cyclic shear stress caused by repeated rolling–sliding contact, or alternatively at defects such as dents or scratches on the surface. It has been observed that the ini- tial small cracks in gears appear at a characteristic shallow angle 20 ◦ to the surface and their orientation depends on the contact friction direction (Schedl, 1998). When they reach some critical length or depth, the cracks usually branch up towards the free surface, which results in separation of small patches of surface material, leaving behind a clear surface pit, as it is shown in Figure 1 (Weck, 1992).
-
Upload
independent -
Category
Documents
-
view
0 -
download
0
Transcript of Modelling of Surface Crack Growth under Lubricated Rolling–Sliding Contact Loading
DOI 10.1007/s10704-005-8546-8International Journal of Fracture (2005) 134:127–149
© Springer 2005
Modelling of surface crack growth under lubricated rolling–slidingcontact loading
BOSTJAN ZAFOSNIK1,*, ZORAN REN1, JOZE FLASKER1 and GENNADYMISHURIS2
1Faculty of Mechanical Engineering, University of Maribor, Smetanova ulica 17, 2000 Maribor,Slovenia2Department of Mathematics, Rzeszow University of Technology, W. Pola 2, 35–959 Rzeszow, Poland*Author for correspondence (E-mail: [email protected])
Received 30 November 2004; accepted in revised form 31 May 2005
Abstract. The paper describes modelling approach to computational simulation of surface crackgrowth subjected to lubricated rolling–sliding contact conditions. The model considers the size andorientation of the initial crack, normal and tangential loading due to rolling–sliding contact and theinfluence of fluid trapped inside the crack by a hydraulic pressure mechanism. The motion of thecontact sliding load is simulated with different load cases. The strain energy density (SED) and max-imum tangential stress (MTS) crack propagation criteria are modified to account for the influenceof internal pressure along the crack surfaces due to trapped fluid. The developed model is used tosimulate surface crack growth on a gear tooth flank, which has been also experimentally tested. Itis shown that the crack growth path, determined with modified crack propagation criteria, is moreaccurately predicted than by using the criteria in its classical form.
Key words: Contact loading, finite element analysis, internal pressure, maximum tangential stress,strain energy density, surface crack growth.
1. Introduction
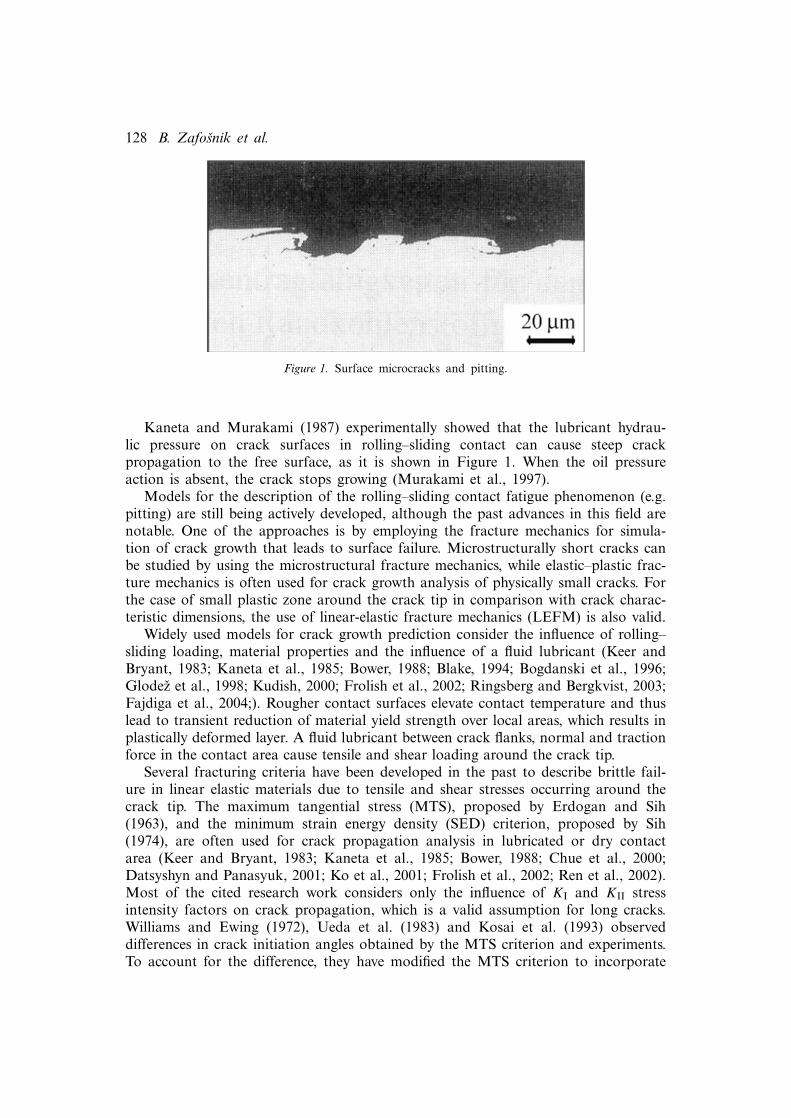
Mechanical elements under cyclic rolling–sliding contact loads can fail due to fatigueand wear damage even at resulting stresses that are well below the static safety lev-els. Rolling contact fatigue, that leads to surface cracking and consequently pitting, isone of the most common causes of failure in gears, bearings and railway tracks. Thepitting phenomenon is strongly dependent on loading conditions, material of contact-ing parts, type of lubrication, surface roughness, etc., which all influence the appear-ance of initial surface cracks and later their propagation or arrest. The surface crackscould be initiated by the near-surface plastic deformation in the region of the maxi-mum cyclic shear stress caused by repeated rolling–sliding contact, or alternatively atdefects such as dents or scratches on the surface. It has been observed that the ini-tial small cracks in gears appear at a characteristic shallow angle 20◦ to the surfaceand their orientation depends on the contact friction direction (Schedl, 1998). Whenthey reach some critical length or depth, the cracks usually branch up towards thefree surface, which results in separation of small patches of surface material, leavingbehind a clear surface pit, as it is shown in Figure 1 (Weck, 1992).
128 B. Zafosnik et al.
Figure 1. Surface microcracks and pitting.
Kaneta and Murakami (1987) experimentally showed that the lubricant hydrau-lic pressure on crack surfaces in rolling–sliding contact can cause steep crackpropagation to the free surface, as it is shown in Figure 1. When the oil pressureaction is absent, the crack stops growing (Murakami et al., 1997).
Models for the description of the rolling–sliding contact fatigue phenomenon (e.g.pitting) are still being actively developed, although the past advances in this field arenotable. One of the approaches is by employing the fracture mechanics for simula-tion of crack growth that leads to surface failure. Microstructurally short cracks canbe studied by using the microstructural fracture mechanics, while elastic–plastic frac-ture mechanics is often used for crack growth analysis of physically small cracks. Forthe case of small plastic zone around the crack tip in comparison with crack charac-teristic dimensions, the use of linear-elastic fracture mechanics (LEFM) is also valid.
Widely used models for crack growth prediction consider the influence of rolling–sliding loading, material properties and the influence of a fluid lubricant (Keer andBryant, 1983; Kaneta et al., 1985; Bower, 1988; Blake, 1994; Bogdanski et al., 1996;Glodez et al., 1998; Kudish, 2000; Frolish et al., 2002; Ringsberg and Bergkvist, 2003;Fajdiga et al., 2004;). Rougher contact surfaces elevate contact temperature and thuslead to transient reduction of material yield strength over local areas, which results inplastically deformed layer. A fluid lubricant between crack flanks, normal and tractionforce in the contact area cause tensile and shear loading around the crack tip.
Several fracturing criteria have been developed in the past to describe brittle fail-ure in linear elastic materials due to tensile and shear stresses occurring around thecrack tip. The maximum tangential stress (MTS), proposed by Erdogan and Sih(1963), and the minimum strain energy density (SED) criterion, proposed by Sih(1974), are often used for crack propagation analysis in lubricated or dry contactarea (Keer and Bryant, 1983; Kaneta et al., 1985; Bower, 1988; Chue et al., 2000;Datsyshyn and Panasyuk, 2001; Ko et al., 2001; Frolish et al., 2002; Ren et al., 2002).Most of the cited research work considers only the influence of KI and KII stressintensity factors on crack propagation, which is a valid assumption for long cracks.Williams and Ewing (1972), Ueda et al. (1983) and Kosai et al. (1993) observeddifferences in crack initiation angles obtained by the MTS criterion and experiments.To account for the difference, they have modified the MTS criterion to incorporate
Modelling of surface crack growth 129
constant term in the asymptotic stress field approximation series expansion aroundthe crack tip, i.e. the T-stress. For linear elastic brittle materials, this modified orgeneralized criterion comprises the stress intensity factors KI, KII, the T-stress andthe fracture process zone size rc. Positive T-stress increases crack propagation angleand decreases the apparent fracture toughness, while negative T-stress decreases crackpropagation angle and increases the apparent fracture toughness (Seweryn, 1998;Smith et al., 2001; Ayatollahi et al., 2002; Kim and Paulino, 2003). Keer and Bryant(1983) correctly proposed that for short angled cracks, growing in the contact influ-enced stress field, it is also necessary to consider the influence of the T-stress oncrack propagation. Internal pressure inside the crack causes additional pressure insidethe crack causing additional compressive stress, which can be captured with the stressintensity factors KI, KII and the T-stress (Parteymuller, 1999).
This paper investigates the influence of KI and KII stress intensity factors, T-stressand tractions due to contact conditions on the crack propagation angle relative tothe pre-existing initial crack with use of the SED and MTS fracturing criterions. Themodel also considers the influence of lubricant fluid trapped in a crack on its prop-agation path. Due to change of the stress intensity factors KI, KII and T-stress dur-ing motion of the contact-sliding loading it is assumed that the maximum values ofKI, KII and T, which occur when the crack mouth just enters the contact zone inevery loading cycle, have the most significant influence on the crack propagation path(Bower, 1998; Kudish and Burrish, 2004). The influence of contact temperature ispresumed to be negligible in this investigation. The stated features are studied for thecase of crack propagation on gear tooth flank by means of a two-dimensional com-putational model under plane strain conditions.
2. Fracturing criteria
The description of stress field around the crack tip using only the singular term ofasymptotic expansion is justified for a distance much smaller than the length of thelast rectilinear crack segment. This approximation is usually not sufficient, if it isapplied to short or kinked cracks (Seweryn, 1998). The elastic stress field can bedescribed with a series (e.g. Williams, 1957; Seweryn, 1998), where the number ofterms depends on the required accuracy of the solution. For the first and secondorder terms of asymptotic expansion of elastic stress fields near the crack tip, thestress components are given by:
σxx
σyy
σxy
= KI cos θ
2√2πr
1− sin θ2 sin 3θ
2
1+ sin θ2 sin 3θ
2sin θ
2 cos 3θ2
+ KII sin θ
2√2πr
−(
2+ cos θ2 cos 3θ
2
)
cos θ2 cos 3θ
2cot θ
2 − cos θ2 sin 3θ
2
+
T
00
,
(1)
where KI,II are the stress intensity factors and represent geometry and loading depen-dent quantity. T is referred to as T-stress and is a non-singular stress. It acts parallelto the crack plane, is independent of r and proportional to the applied stresses. Stressintensity factors and T are for θ =0◦ defined as:
130 B. Zafosnik et al.
KI = limr→0
σyy
√2πr,
KII = limr→0
σxy
√2πr, (2)
T = limr→0
(σxx −σyy
).
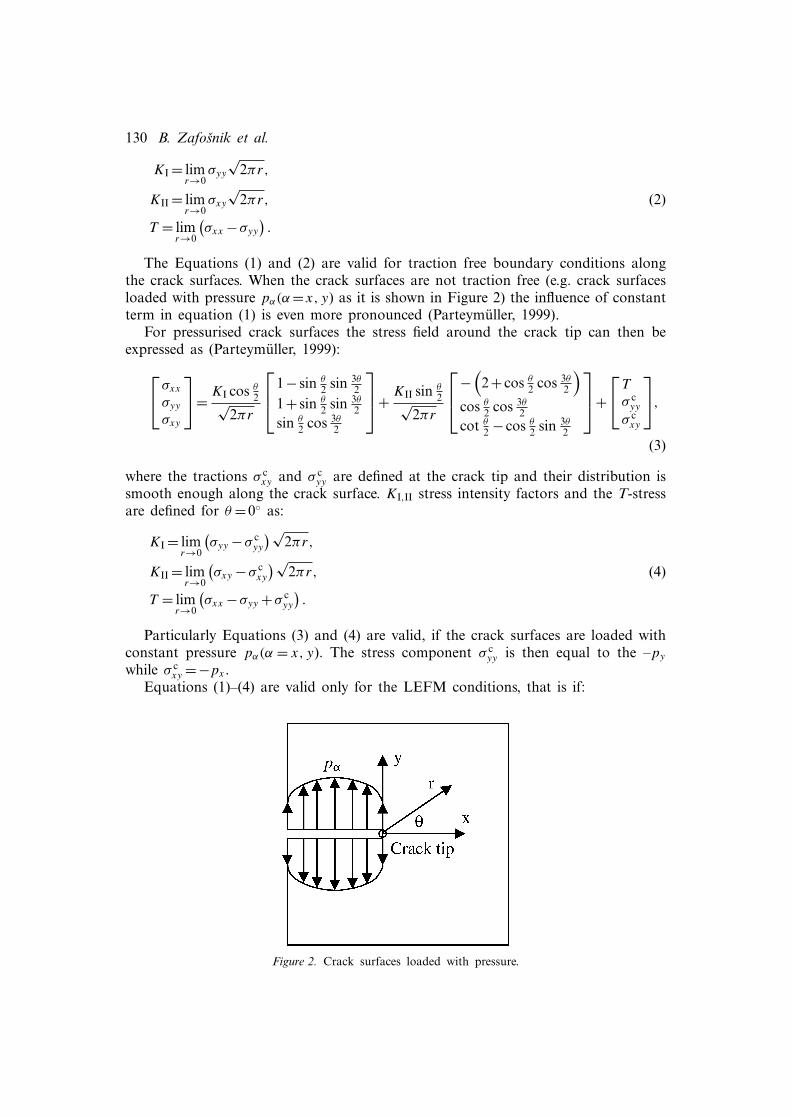
The Equations (1) and (2) are valid for traction free boundary conditions alongthe crack surfaces. When the crack surfaces are not traction free (e.g. crack surfacesloaded with pressure pα(α=x, y) as it is shown in Figure 2) the influence of constantterm in equation (1) is even more pronounced (Parteymuller, 1999).
For pressurised crack surfaces the stress field around the crack tip can then beexpressed as (Parteymuller, 1999):
σxx
σyy
σxy
= KI cos θ
2√2πr
1− sin θ2 sin 3θ
2
1+ sin θ2 sin 3θ
2sin θ
2 cos 3θ2
+ KII sin θ
2√2πr
−(
2+ cos θ2 cos 3θ
2
)
cos θ2 cos 3θ
2cot θ
2 − cos θ2 sin 3θ
2
+
T
σ cyy
σ cxy
,
(3)
where the tractions σ cxy and σ c
yy are defined at the crack tip and their distribution issmooth enough along the crack surface. KI,II stress intensity factors and the T-stressare defined for θ =0◦ as:
KI = limr→0
(σyy −σ c
yy
)√2πr,
KII = limr→0
(σxy −σ c
xy
)√2πr, (4)
T = limr→0
(σxx −σyy +σ c
yy
).
Particularly Equations (3) and (4) are valid, if the crack surfaces are loaded withconstant pressure pα(α = x, y). The stress component σ c
yy is then equal to the –py
while σ cxy =−px .
Equations (1)–(4) are valid only for the LEFM conditions, that is if:
Figure 2. Crack surfaces loaded with pressure.

Modelling of surface crack growth 131
• the crack length at which the threshold for mode I crack propagation is reachedis such that the main microstructural barriers to fatigue crack growth are breachedand the crack is assumed to propagate in a continuum;
• the plastic zone ahead of the crack tip is small when compared with the distanceof the crack tip to any boundary member.Dowling (1989) suggested that the second assumption is valid if the ratio between
the crack tip distance from the boundary and the plastic zone diameter 2rcyc isgreater than 4, where the cyclic plastic zone size rcyc under plane strain conditionsis defined as (Frolish et al., 2002)
2rcyc =C
(Kmax (1−R)
2σ ′y
)2
. (5)
Here, Kmax is the maximum mode I stress intensity factor, R is the load ratio, σ ′y is
the cyclic yield stress and C is 1/(3π ) for plane strain conditions.
2.1. Modified MTS criterion
According to Erdogan and Sih (1963), the crack extension starts along the radialdirection in the plane perpendicular to the direction of the maximum tangential ten-sion stress σθθ , where the shear stress σrθ =0.
The tangential stress can be written in polar co-ordinates as:
σθθ (θ)=σxx sin2θ +σyy cos2 θ −σxy sin 2θ. (6)
Substituting stress terms in Equation (6) with expansion (3), which also considersthe influence of trapped fluid pressure on crack faces, gives:
σθθ (θ, r)= 1√2πr
cosθ
2
[KI cos2 θ
2− 3
2KII sin θ
]+T sin2
θ −σ cxy sin 2θ +σ c
yy cos2 θ.
(7)
The crack propagation angle θ0 can be determined from the maximum condition
∂σθθ
∂θ
∣∣∣∣r=rc
=0⇒ θ = θ0, (8)
where rc is the critical length parameter, which is explained later.By solving Equation (7) according to (8) gives after rearrangement the following
expression:
[KI sin θ0 +KII (3 · cos θ0 −1)]−γ sinθ0
2cos θ0 + δ
1
cos θ02
cos 2θ0 =0, (9)
where
γ =16((
T −σ cyy
)√2πrc
)/3 and δ =16
(σ c
xy
√2πrc
)/6. (10)
Equation (9) represents a modified MTS criterion that can be used fordetermination of crack propagation angle θ0 when the crack surfaces are loaded withconstant pressure or sufficiently smooth traction distribution.
132 B. Zafosnik et al.
When the element containing a crack is subjected to non-proportional loading, thecritical load case could be determined by using the expression (Kaneta et al., 1985):
Kσ (θ, r)=σθθ
√2πr, (11)
where Kσ(θ, r) is a specific circumferential stress intensity factor which represents theintensity of the circumferential stress σθθ field near the crack tip.
Substituting Equation (7) into Equation (11) for θ = θ0 and r = rc leads to themodified formulation of the stress intensity factor Kσ(θ, r):
Kσ (θ0, rc)= cosθ0
2
[KI cos2 θ0
2− 3
2KII sin θ0
]+T
√2πrc sin2
θ0 −σ cxy
√2πrc sin 2θ0
+σ cyy
√2πrc cos2 θ0. (12)
Physical length scale rc presents the distance ahead of the crack tip where the fractur-ing process is actually initiated. The distance rc is a material parameter, which is verydifficult to determine. Several models have been proposed for its determination. Wanget. al. (2002) experimentally and numerically determined characteristic distance forcleavage fracture in steel for long cracks. It was shown that cleavage fracture aheadof a crack tip can be initiated only in some active zone at a certain distance interval,which is subjected to critical plastic strain, critical stress triaxiality and a critical ten-sile stress. Since it is very difficult to determine the critical distance rc for short cracksanalysed in this paper, stresses were considered in the region of constrained yielding(Larsson and Carlsson, 1973). The region was determined by maximum stress inten-sity factor KI and plain strain fracture toughness KIc. For the plane strain the criticaldistance rc can then be determined as:
rc = 16π
(KIα
σy
)2
, (13)
where σy is the yield stress and KIα is KI, KIc, respectively.
2.2. Modified SED criterion
The SED criterion, proposed by Sih (1974), assumes that crack extension occurs inthe direction θ0 at which strain energy density dW /dV is minimum at a small distancerc from the crack tip.
For the plane elastic material behaviour, the strain energy density function dW /dV
can be written as:
dW
dV= 1
4µ
[κ +1
4
(σxx +σyy
)2 −2(σxxσyy −σ 2
xy
)], (14)
where κ = 3 − 4ν for plane strain and κ = (3 − ν)/(1 + ν) for generalized plane stress.At a radial distance r measured from the crack tip, dW /dV may be expressed interms of a strain energy density factor S:
dW
dV= S
r. (15)

Modelling of surface crack growth 133
The relative local minimum of dW /dV corresponds to large volume change andis identified with the region dominated by macrodilatation leading to fracture. Forcrack growth in a two-dimensional stress field this can be expressed mathematicallyby the following relationship:
δS
δθ
∣∣∣∣r=rc
=0 andδ2S
δθ2
∣∣∣∣r=rc
>0, at θ = θ0, (16)
where θ is a polar angle.Again by substituting Equation (3) into Equation (14), and considering Equation
(15), the following form for the SED factor S(θ, r) is obtained:
S (θ, r)= 132µπ
K2I ((2κ −1)+2 (κ −1) cos θ − cos 2θ)
+K2II ((3+2κ)+2 (1−κ) cos θ +3 cos 2θ)
+4KIKII ((1−κ) sin θ + sin 2θ)+2√
2πr(T −σ c
yy
)
×((
KI +2KIIσcxy
)cos 5θ
2 −(KII +2KIσ
cxy
)sin 5θ
2
)
+2(KI +6KIIσ
cxy
)√2πr cos θ
2
((2κ −1) σ c
yy + (2κ −3) T)
−2(KII +2KIσ
cxy
)√2πr sin θ
2
((2κ −5) σ c
yy + (2κ +1) T)
+2πr(
8σ c2
xy + (1+κ)σ c2
yy +2 (κ −3) σ cyyT + (1+κ)T 2
)
. (17)
Equation (17) represents a modified SED criterion that accounts also for the influ-ence of crack surfaces loaded with constant internal pressure. The crack propagatesin the direction of minimum SED factor Smin(θ0, rc).
3. Computational determination of the stress intensity factors and the T-stress
There are several efficient methods available for the determination of the stress inten-sity factors and only few for determination of the T-stress. Due to complexity ofstrain and stress field around the crack tip of surface breaking cracks subjectedto lubricated contact, computational methods are appropriate for determination ofdisplacements and stresses. Over the last decade, the finite element method (FEM)has become firmly established as a standard procedure for the solution of prac-tical fracture problems. A number of methods have been suggested for evaluatingstress intensity factors within the framework of FEM. Methods can be basicallydivided into substitution methods [crack opening displacement method (Aliabadi andRooke, 1991), extrapolation methods based on stress field (Parteymuller, 1999) or dis-placement field around the crack tip (Owen and Faweks, 1983), one-point or two-point displacement method (Lim et al., 1992)] and energy methods [virtual crackclosure method (Buchholz et al., 1987), virtual crack extension method (Hellen andBlackburn, 1975), J-integral (Aliabadi and Rooke, 1991), etc.].
Due to their robustness and accuracy the displacement methods are most oftenused to determine the fracture parameters for the problems of cracks propagationsimulation under contact conditions (Chue and Chung, 2000; Ko et al., 2001; Renet al., 2002; Ringsberg and Bergkvist, 2003). The quarter point displacement (QPD)method was used in this paper, where the stress intensity factors are determined fromdisplacements on opposite crack surfaces by the following relationships (Lim et al.,1992):
134 B. Zafosnik et al.
Crackx, u, r
y, v
Crack tip
A
B
C…..Z
Quater point nodes
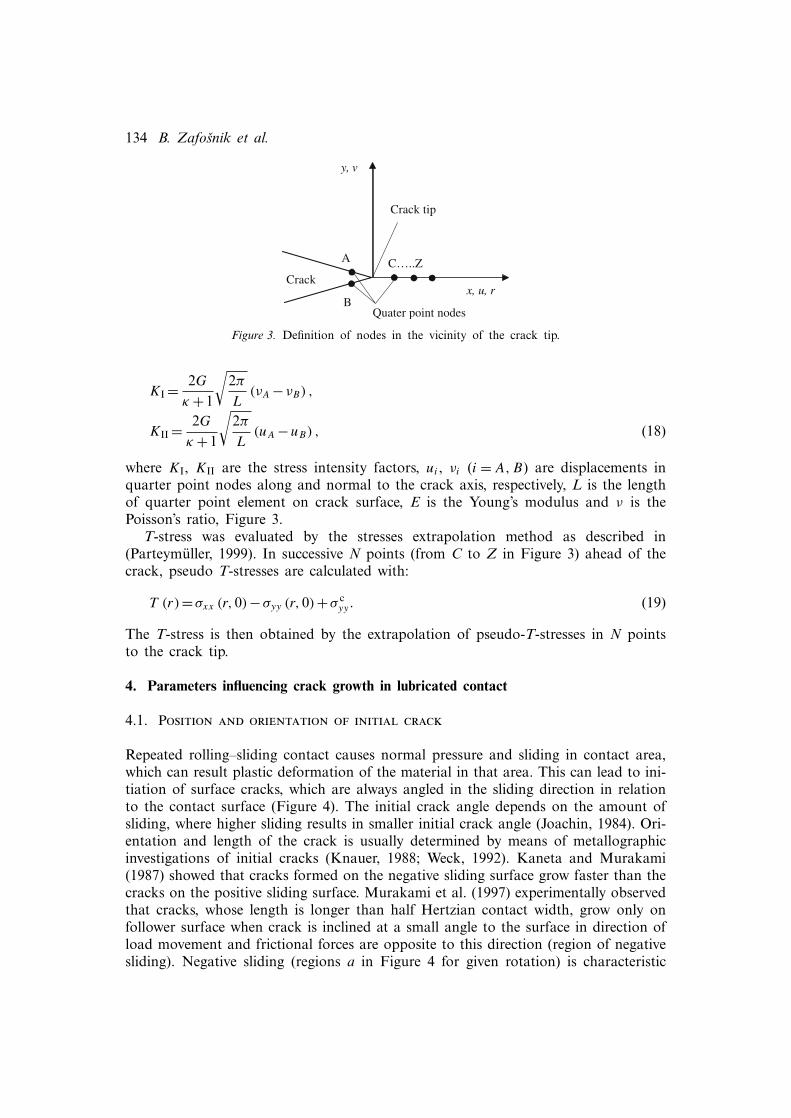
Figure 3. Definition of nodes in the vicinity of the crack tip.
KI = 2G
κ +1
√2π
L(νA −νB) ,
KII = 2G
κ +1
√2π
L(uA −uB) , (18)
where KI, KII are the stress intensity factors, ui , νi (i = A,B) are displacements inquarter point nodes along and normal to the crack axis, respectively, L is the lengthof quarter point element on crack surface, E is the Young’s modulus and ν is thePoisson’s ratio, Figure 3.
T-stress was evaluated by the stresses extrapolation method as described in(Parteymuller, 1999). In successive N points (from C to Z in Figure 3) ahead of thecrack, pseudo T-stresses are calculated with:
T (r)=σxx (r,0)−σyy (r,0)+σ cyy. (19)
The T-stress is then obtained by the extrapolation of pseudo-T-stresses in N pointsto the crack tip.
4. Parameters influencing crack growth in lubricated contact
4.1. Position and orientation of initial crack
Repeated rolling–sliding contact causes normal pressure and sliding in contact area,which can result plastic deformation of the material in that area. This can lead to ini-tiation of surface cracks, which are always angled in the sliding direction in relationto the contact surface (Figure 4). The initial crack angle depends on the amount ofsliding, where higher sliding results in smaller initial crack angle (Joachin, 1984). Ori-entation and length of the crack is usually determined by means of metallographicinvestigations of initial cracks (Knauer, 1988; Weck, 1992). Kaneta and Murakami(1987) showed that cracks formed on the negative sliding surface grow faster than thecracks on the positive sliding surface. Murakami et al. (1997) experimentally observedthat cracks, whose length is longer than half Hertzian contact width, grow only onfollower surface when crack is inclined at a small angle to the surface in direction ofload movement and frictional forces are opposite to this direction (region of negativesliding). Negative sliding (regions a in Figure 4 for given rotation) is characteristic
Modelling of surface crack growth 135
driving pinion kinematic circles
sliding rolling
driven gear
a
a
b
b
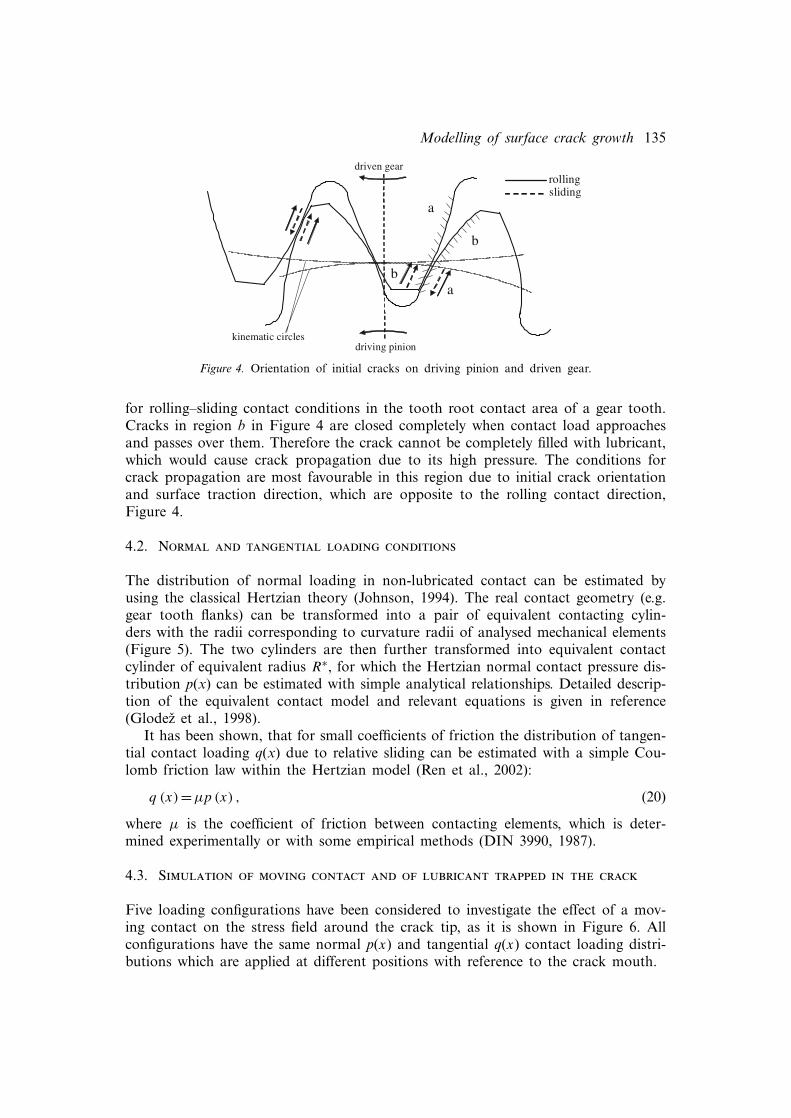
Figure 4. Orientation of initial cracks on driving pinion and driven gear.
for rolling–sliding contact conditions in the tooth root contact area of a gear tooth.Cracks in region b in Figure 4 are closed completely when contact load approachesand passes over them. Therefore the crack cannot be completely filled with lubricant,which would cause crack propagation due to its high pressure. The conditions forcrack propagation are most favourable in this region due to initial crack orientationand surface traction direction, which are opposite to the rolling contact direction,Figure 4.
4.2. Normal and tangential loading conditions
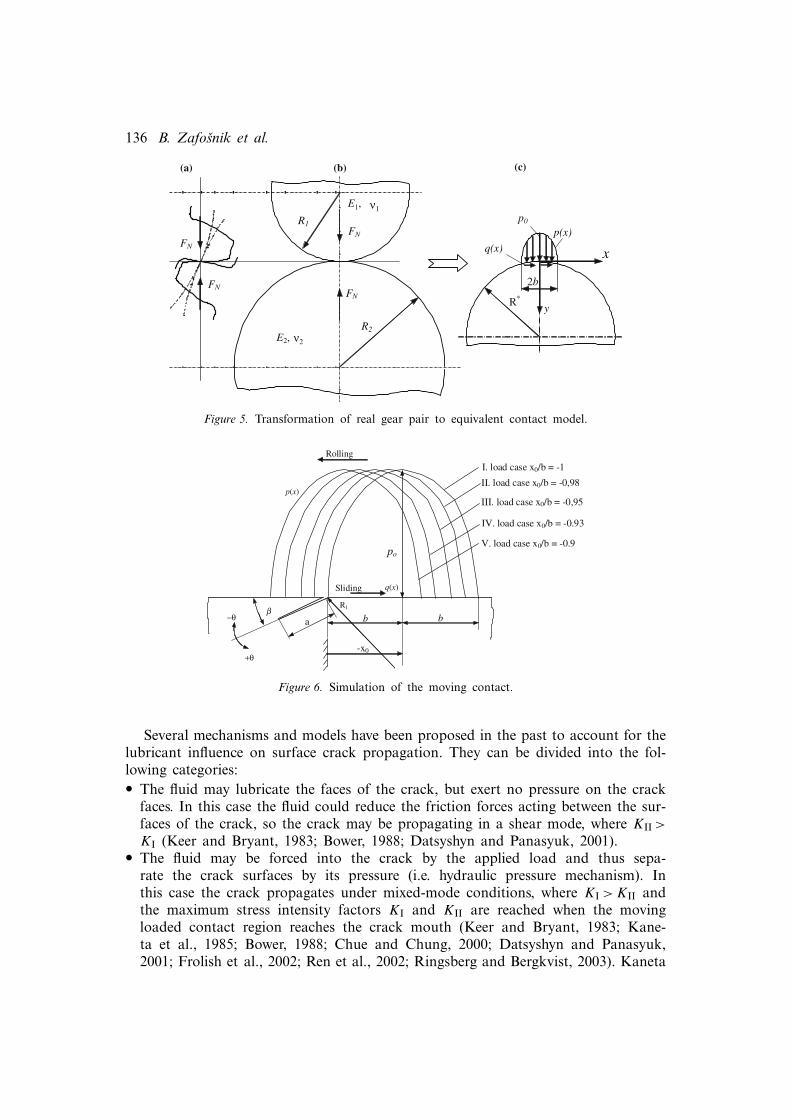
The distribution of normal loading in non-lubricated contact can be estimated byusing the classical Hertzian theory (Johnson, 1994). The real contact geometry (e.g.gear tooth flanks) can be transformed into a pair of equivalent contacting cylin-ders with the radii corresponding to curvature radii of analysed mechanical elements(Figure 5). The two cylinders are then further transformed into equivalent contactcylinder of equivalent radius R∗, for which the Hertzian normal contact pressure dis-tribution p(x) can be estimated with simple analytical relationships. Detailed descrip-tion of the equivalent contact model and relevant equations is given in reference(Glodez et al., 1998).
It has been shown, that for small coefficients of friction the distribution of tangen-tial contact loading q(x) due to relative sliding can be estimated with a simple Cou-lomb friction law within the Hertzian model (Ren et al., 2002):
q (x)=µp (x) , (20)
where µ is the coefficient of friction between contacting elements, which is deter-mined experimentally or with some empirical methods (DIN 3990, 1987).
4.3. Simulation of moving contact and of lubricant trapped in the crack
Five loading configurations have been considered to investigate the effect of a mov-ing contact on the stress field around the crack tip, as it is shown in Figure 6. Allconfigurations have the same normal p(x) and tangential q(x) contact loading distri-butions which are applied at different positions with reference to the crack mouth.
136 B. Zafosnik et al.
R2
R1
FN
p(x)
R*
q(x)
2b
p0
FN
FN
FN
E1, ν1
ν2E2,
y
x
(a) (b) (c)
Figure 5. Transformation of real gear pair to equivalent contact model.
b b
Rolling
I. load case x0/b = -1
po
-x0
Sliding
p(x)
a R1
II. load case x0/b = -0,98
III. load case x0/b = -0,95
IV. load case x0/b = -0.93
V. load case x0/b = -0.9
q(x)
−θ
+θ
b
Figure 6. Simulation of the moving contact.
Several mechanisms and models have been proposed in the past to account for thelubricant influence on surface crack propagation. They can be divided into the fol-lowing categories:• The fluid may lubricate the faces of the crack, but exert no pressure on the crack
faces. In this case the fluid could reduce the friction forces acting between the sur-faces of the crack, so the crack may be propagating in a shear mode, where KII >
KI (Keer and Bryant, 1983; Bower, 1988; Datsyshyn and Panasyuk, 2001).• The fluid may be forced into the crack by the applied load and thus sepa-
rate the crack surfaces by its pressure (i.e. hydraulic pressure mechanism). Inthis case the crack propagates under mixed-mode conditions, where KI > KII andthe maximum stress intensity factors KI and KII are reached when the movingloaded contact region reaches the crack mouth (Keer and Bryant, 1983; Kane-ta et al., 1985; Bower, 1988; Chue and Chung, 2000; Datsyshyn and Panasyuk,2001; Frolish et al., 2002; Ren et al., 2002; Ringsberg and Bergkvist, 2003). Kaneta
Modelling of surface crack growth 137
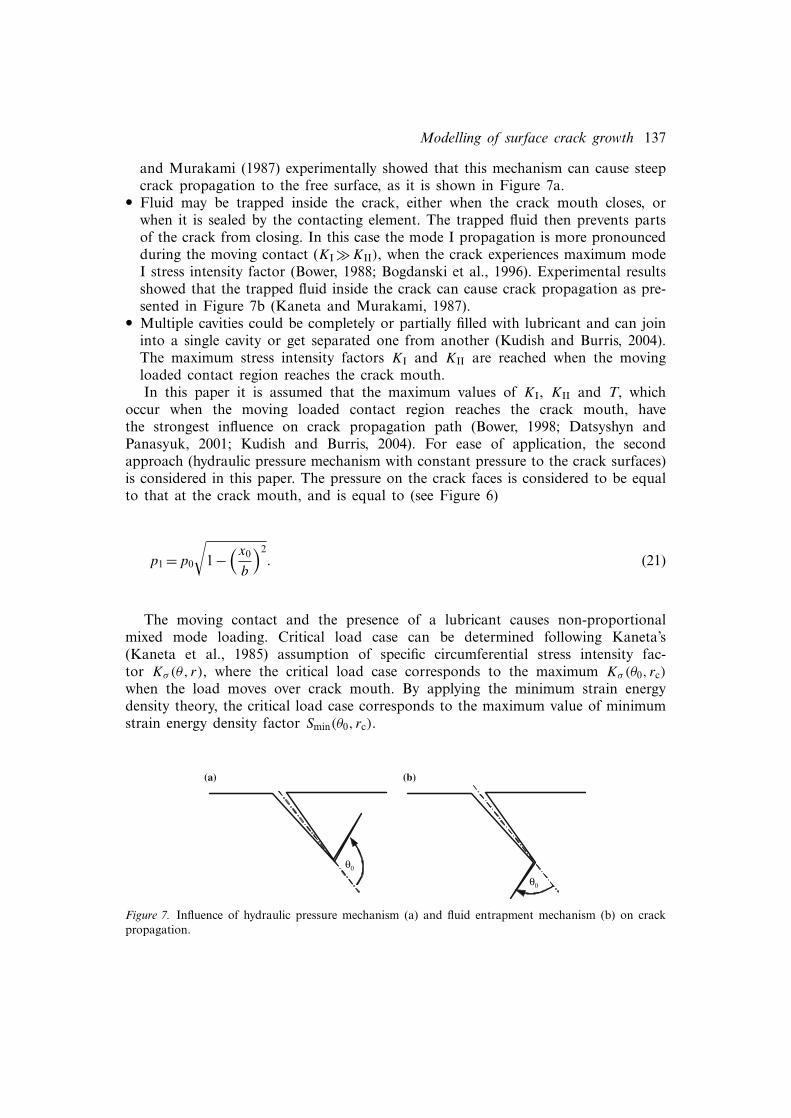
and Murakami (1987) experimentally showed that this mechanism can cause steepcrack propagation to the free surface, as it is shown in Figure 7a.
• Fluid may be trapped inside the crack, either when the crack mouth closes, orwhen it is sealed by the contacting element. The trapped fluid then prevents partsof the crack from closing. In this case the mode I propagation is more pronouncedduring the moving contact (KI �KII), when the crack experiences maximum modeI stress intensity factor (Bower, 1988; Bogdanski et al., 1996). Experimental resultsshowed that the trapped fluid inside the crack can cause crack propagation as pre-sented in Figure 7b (Kaneta and Murakami, 1987).
• Multiple cavities could be completely or partially filled with lubricant and can joininto a single cavity or get separated one from another (Kudish and Burris, 2004).The maximum stress intensity factors KI and KII are reached when the movingloaded contact region reaches the crack mouth.In this paper it is assumed that the maximum values of KI, KII and T, which
occur when the moving loaded contact region reaches the crack mouth, havethe strongest influence on crack propagation path (Bower, 1998; Datsyshyn andPanasyuk, 2001; Kudish and Burris, 2004). For ease of application, the secondapproach (hydraulic pressure mechanism with constant pressure to the crack surfaces)is considered in this paper. The pressure on the crack faces is considered to be equalto that at the crack mouth, and is equal to (see Figure 6)
p1 =p0
√1−
(x0
b
)2. (21)
The moving contact and the presence of a lubricant causes non-proportionalmixed mode loading. Critical load case can be determined following Kaneta’s(Kaneta et al., 1985) assumption of specific circumferential stress intensity fac-tor Kσ(θ, r), where the critical load case corresponds to the maximum Kσ(θ0, rc)
when the load moves over crack mouth. By applying the minimum strain energydensity theory, the critical load case corresponds to the maximum value of minimumstrain energy density factor Smin(θ0, rc).
(a) (b)
θ0
θ0
Figure 7. Influence of hydraulic pressure mechanism (a) and fluid entrapment mechanism (b) on crackpropagation.

138 B. Zafosnik et al.
5. Practical application of modified fracturing criteria to simulate surface crackgrowth on gear tooth flank
The classical and modified fracturing criteria have been applied to simulation of sur-face crack propagation on a gear tooth flank under lubricated contact loading con-ditions, with the objective to evaluate the modified criteria.
5.1. Computational model data
The derived equivalent contact model (Figure 5b) has the following geometrical data:the upper cylinder of radius R1 = 10.285 mm corresponds to the radius of pinion atthe inner point of single teeth pair engagement [so called point B (DIN 3990, 1987)]with number of teeth z1/2 = 16/24, gear module m = 4.5 mm, centre distance a =91.5 mm, addendum modification coefficients x1/2 =0.18/0.17 and standard gear pro-file angle αn =20◦. The pinion is made of carburized steel 16MnCr5 (according to theISO standard) with Young’s modulus E = 206 GPa and Poisson’s ratio ν = 0.3. TheHertzian contact pressure distribution p(x) with maximum value of p0 = 1779 MPa,and the half-length of the contact area b=0.228 mm (Figure 6) have been estimatedusing the Hertzian contact theory as described in Section 4.2.
The influence of different contact sliding was simulated with three different coeffi-cients of friction (µ = 0.04, 0.065 and 0.1). These values are representative for realgear meshing, depending on the roughness of the surface, lubricant viscosity, rela-tive sliding, etc. (Michaelis, 1987). The tangential loading q(x) has been determinedusing Equation (20). The value of µ = 0.1 is in valid range of applicability of theequivalent contact model (Ren et al., 2002). Some other authors have even investi-gated influences of higher values of this parameter (Kaneta et al., 1985; Datsyshynand Panasyuk, 2001; Ringsberg and Bergkvist, 2003).
Initial length of the crack was equal to a0 = 20 µm, with the initial inclinationangle towards the contact surface equal to β = 20◦. Orientation and length of theinitial crack follows from the metallographic examination of initial cracks appearingin gears made of the same material (Knauer, 1988; Weck, 1992). The constant pres-sure distribution along the crack surfaces was determined according to Equation (21),while the moving contact was simulated with five different loading configurations I–V(see Figure 6).
The equivalent contact model was discretized with standard quadratic quadrilat-eral isoparametric elements, while eight collapsed quadrilateral quarter point finiteelements were used around the crack tip to simulate r−1/2 stress singularity and r1/2
displacement variation at the crack tip.Stress intensity factors KI and KII have been computed from crack face displace-
ments by using the QPD method and the T-stress was obtained by the extrapolationtechnique from the computed stresses ahead of the crack tip, as it is indicated in Sec-tion 3.
There is no clear consensus on how to determine the critical distance rc forcracks as small as 20 µm in a brittle material (e.g. cracks in hardened and carburizedgear tooth flank layer). Due to available data for plane strain fracture toughness of521 MPamm1/2 and estimated yield stress of 2200 MPa (assuming no cyclic harden-ing or softening), which follow from experimentally investigation for a hardened and
Modelling of surface crack growth 139
carburized gear tooth flank layer (Pehan, 1994), the active region of critical distance0.7814 µm < rc <2.97 µm was determined from Equation (13) with assumption thatit is equal to the plastic zone size determined by maximum stress intensity factor KI
and plane strain fracture toughness KIc.For crack size of 20 µm, angled 20◦ in relation to the free surface, the use of
LEFM is valid when modified specific circumferential stress intensity factor Kσ(θ0, rc)
is lower than 558 MPamm1/2, which follows from equating Kσ(θ0, rc) or rc =2.97 µmto Kmax in Equation (5) for R =0.
5.2. Computational results and discussion
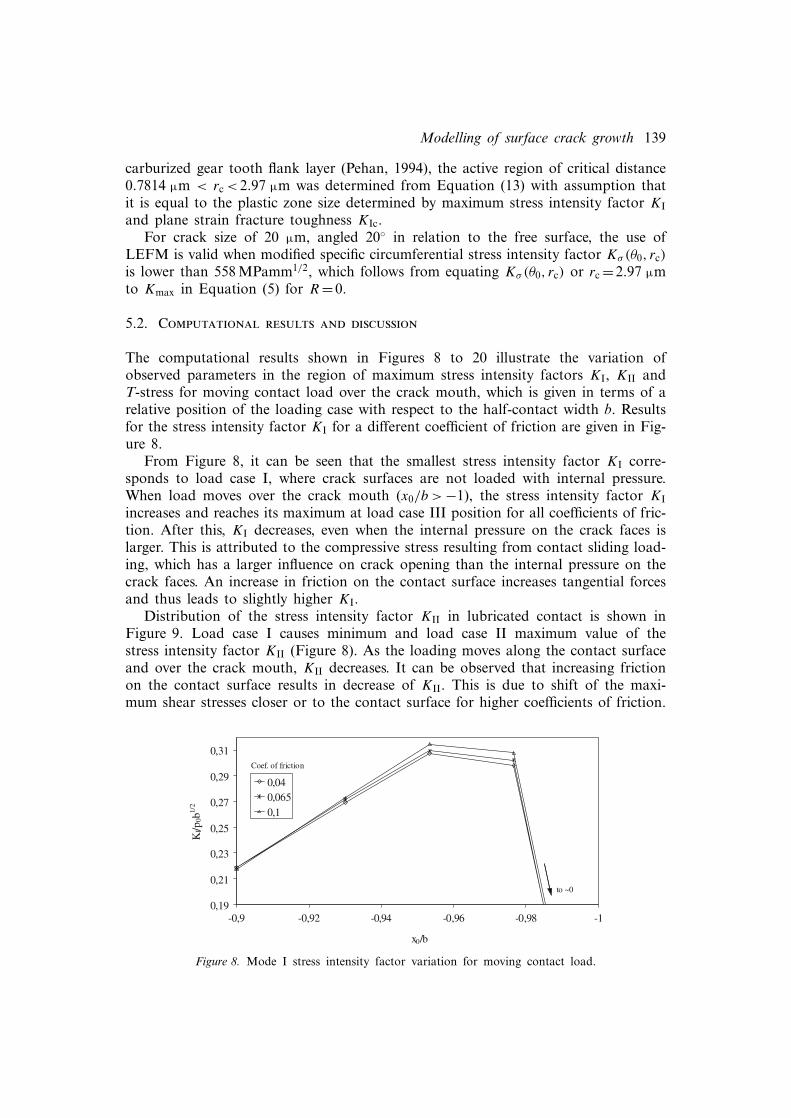
The computational results shown in Figures 8 to 20 illustrate the variation ofobserved parameters in the region of maximum stress intensity factors KI, KII andT-stress for moving contact load over the crack mouth, which is given in terms of arelative position of the loading case with respect to the half-contact width b. Resultsfor the stress intensity factor KI for a different coefficient of friction are given in Fig-ure 8.
From Figure 8, it can be seen that the smallest stress intensity factor KI corre-sponds to load case I, where crack surfaces are not loaded with internal pressure.When load moves over the crack mouth (x0/b > −1), the stress intensity factor KI
increases and reaches its maximum at load case III position for all coefficients of fric-tion. After this, KI decreases, even when the internal pressure on the crack faces islarger. This is attributed to the compressive stress resulting from contact sliding load-ing, which has a larger influence on crack opening than the internal pressure on thecrack faces. An increase in friction on the contact surface increases tangential forcesand thus leads to slightly higher KI.
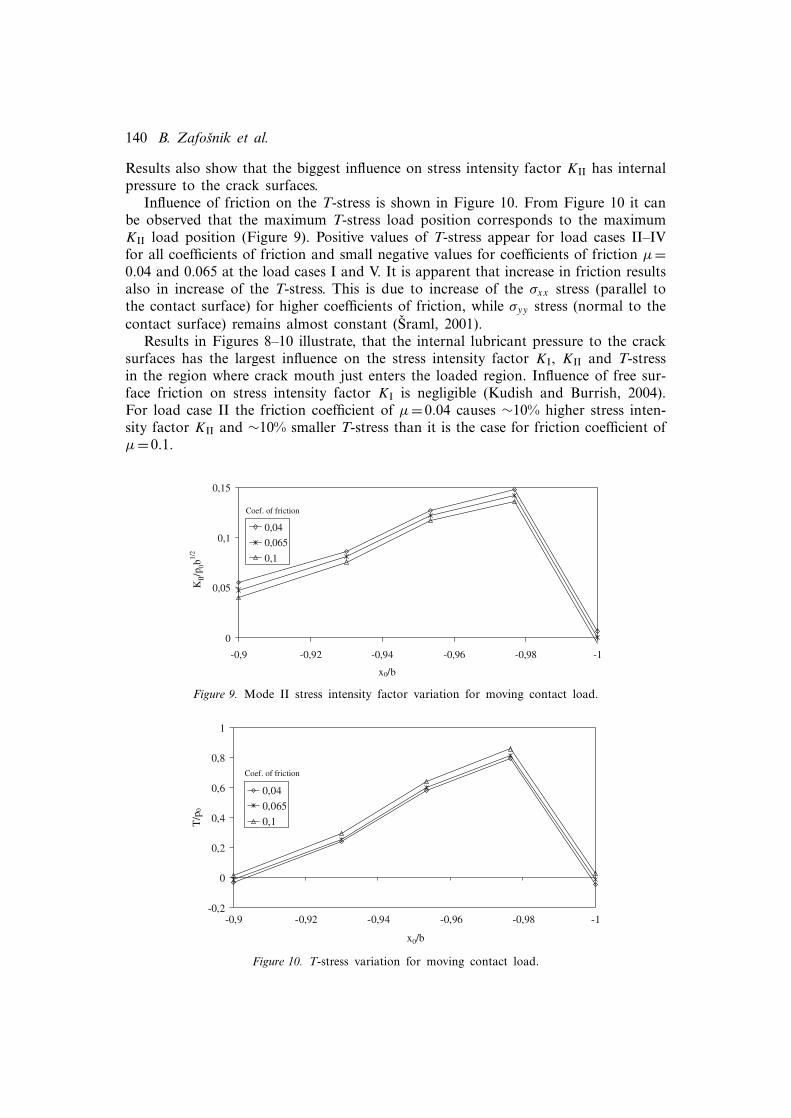
Distribution of the stress intensity factor KII in lubricated contact is shown inFigure 9. Load case I causes minimum and load case II maximum value of thestress intensity factor KII (Figure 8). As the loading moves along the contact surfaceand over the crack mouth, KII decreases. It can be observed that increasing frictionon the contact surface results in decrease of KII. This is due to shift of the maxi-mum shear stresses closer or to the contact surface for higher coefficients of friction.
0,19
0,21
0,23
0,25
0,27
0,29
0,31
-1-0,98-0,96-0,94-0,92-0,9
x0/b
KI/p
0b1/
2
0,040,0650,1
Coef. of friction
to ~0
Figure 8. Mode I stress intensity factor variation for moving contact load.
140 B. Zafosnik et al.
Results also show that the biggest influence on stress intensity factor KII has internalpressure to the crack surfaces.
Influence of friction on the T-stress is shown in Figure 10. From Figure 10 it canbe observed that the maximum T-stress load position corresponds to the maximumKII load position (Figure 9). Positive values of T-stress appear for load cases II–IVfor all coefficients of friction and small negative values for coefficients of friction µ=0.04 and 0.065 at the load cases I and V. It is apparent that increase in friction resultsalso in increase of the T-stress. This is due to increase of the σxx stress (parallel tothe contact surface) for higher coefficients of friction, while σyy stress (normal to thecontact surface) remains almost constant (Sraml, 2001).
Results in Figures 8–10 illustrate, that the internal lubricant pressure to the cracksurfaces has the largest influence on the stress intensity factor KI, KII and T-stressin the region where crack mouth just enters the loaded region. Influence of free sur-face friction on stress intensity factor KI is negligible (Kudish and Burrish, 2004).For load case II the friction coefficient of µ=0.04 causes ∼10% higher stress inten-sity factor KII and ∼10% smaller T-stress than it is the case for friction coefficient ofµ=0.1.
0
0,05
0,1
0,15
-1-0,98-0,96-0,94-0,92-0,9
x0/b
KII/p
0b1/
2
0,04
0,065
0,1
Coef. of friction
Figure 9. Mode II stress intensity factor variation for moving contact load.
-0,2
0
0,2
0,4
0,6
0,8
1
-1-0,98-0,96-0,94-0,92-0,9
x0/b
T/p
0
0,04
0,065
0,1
Coef. of friction
Figure 10. T-stress variation for moving contact load.
Modelling of surface crack growth 141
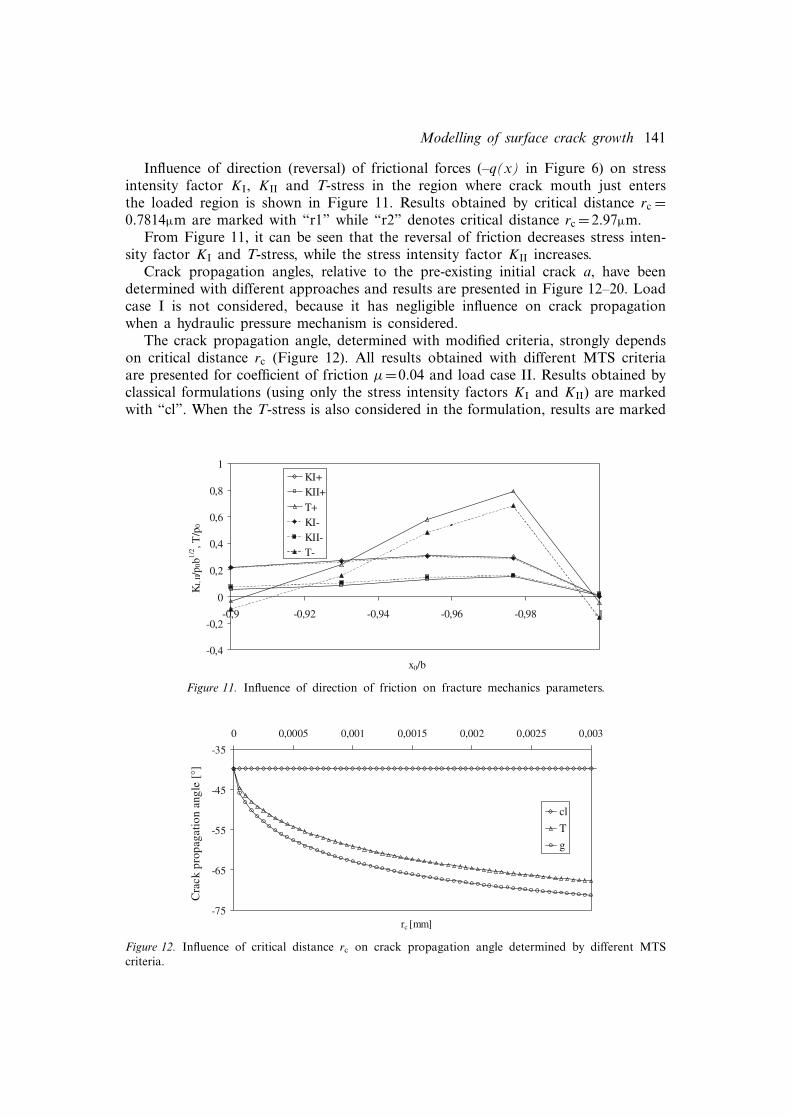
Influence of direction (reversal) of frictional forces (–q(x) in Figure 6) on stressintensity factor KI, KII and T-stress in the region where crack mouth just entersthe loaded region is shown in Figure 11. Results obtained by critical distance rc =0.7814µm are marked with “r1” while “r2” denotes critical distance rc =2.97µm.
From Figure 11, it can be seen that the reversal of friction decreases stress inten-sity factor KI and T-stress, while the stress intensity factor KII increases.
Crack propagation angles, relative to the pre-existing initial crack a, have beendetermined with different approaches and results are presented in Figure 12–20. Loadcase I is not considered, because it has negligible influence on crack propagationwhen a hydraulic pressure mechanism is considered.
The crack propagation angle, determined with modified criteria, strongly dependson critical distance rc (Figure 12). All results obtained with different MTS criteriaare presented for coefficient of friction µ=0.04 and load case II. Results obtained byclassical formulations (using only the stress intensity factors KI and KII) are markedwith “cl”. When the T-stress is also considered in the formulation, results are marked
-0,4
-0,2
0
0,2
0,4
0,6
0,8
1
-1-0,98-0,96-0,94-0,92-0,9
x0/b
KI,
II/p
0b1/
2 , T/p
0
KI+KII+T+KI-KII-T-
Figure 11. Influence of direction of friction on fracture mechanics parameters.
-75
-65
-55
-45
-35
0 0,0005 0,001 0,0015 0,002 0,0025 0,003
rc [mm]
Cra
ck p
ropa
gatio
n an
gle
[°]
cl
T
g
Figure 12. Influence of critical distance rc on crack propagation angle determined by different MTScriteria.

142 B. Zafosnik et al.
Figure 13. Crack propagation angle determined with the MTS criterion based on KI and KII stressintensity factors.
Figure 14. Crack propagation angle determined with the generalized MTS criterion based on KI andKII stress intensity factors, T-stress and rc =0.7814 µm.
with “T”, while “g” denotes the use of modified criterion, which also considers theinfluence of fluid lubricant pressure to the crack surfaces.
Results in Figure 12 show that for rc →0 the influence of T-stress on crack prop-agation angle is naturally neglected, while positive T-stress causes larger crack prop-agation angle for rc >0 in comparison with propagation angle determined only fromthe stress intensity factors KI and KII.
Figure 13 shows the influence of friction on crack propagation angle determinedby the classical MTS criterion with consideration of only KI and KII stress intensityfactors [rc =0 and T =σ c
xy =σ cyy =0 in Equation (9)].
Results in Figure 13 show that lower friction in contact area causes larger crackpropagation angles for all load cases. This is due to lower friction causing largershear stresses around the crack tip (larger KII), which influences the increase of crackpropagation angle (see Figure 9). Maximum crack propagation angle occurs at loadcase II, where KII attains a maximum value. Negative crack propagation angle indi-cates that the crack propagates towards the free surface (Figure 6).
Modelling of surface crack growth 143
The crack propagation angles, determined with the generalized MTS criterion byconsidering also the T-stress and rc =0.7814 µm (σ c
xy =σ cyy =0 in Equation (19)), are
shown in Figure 14.From Figure 14 it can be observed that for rc =0.7814 µm the influence of contact
surface friction has negligible effect on crack propagation angle for load cases II andIII when the T-stress is considered in generalized MTS criterion.
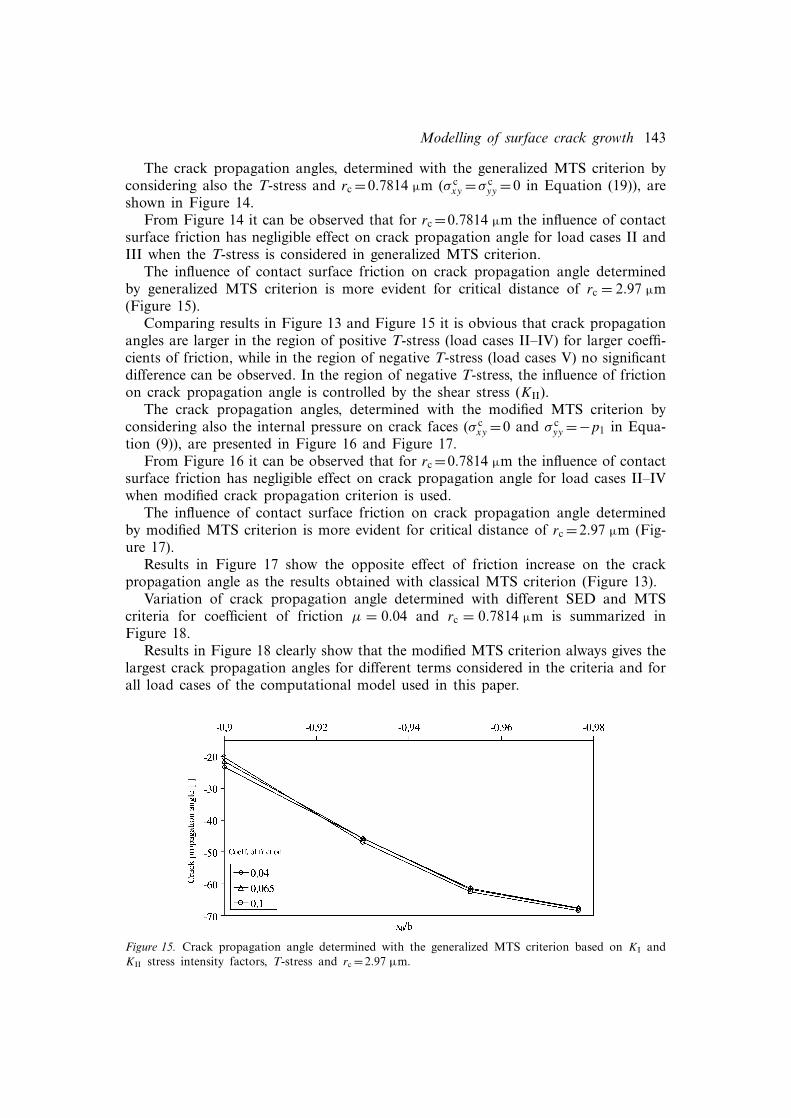
The influence of contact surface friction on crack propagation angle determinedby generalized MTS criterion is more evident for critical distance of rc = 2.97 µm(Figure 15).
Comparing results in Figure 13 and Figure 15 it is obvious that crack propagationangles are larger in the region of positive T-stress (load cases II–IV) for larger coeffi-cients of friction, while in the region of negative T-stress (load cases V) no significantdifference can be observed. In the region of negative T-stress, the influence of frictionon crack propagation angle is controlled by the shear stress (KII).
The crack propagation angles, determined with the modified MTS criterion byconsidering also the internal pressure on crack faces (σ c
xy =0 and σ cyy =−p1 in Equa-
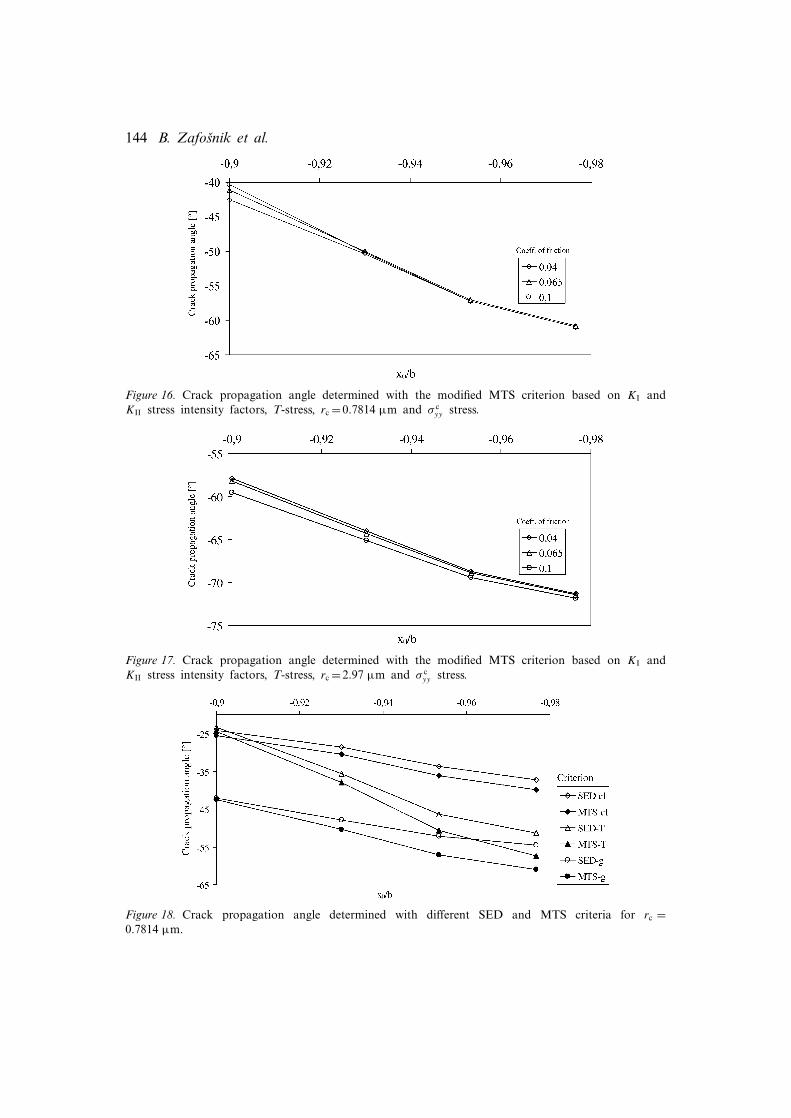
tion (9)), are presented in Figure 16 and Figure 17.From Figure 16 it can be observed that for rc =0.7814 µm the influence of contact
surface friction has negligible effect on crack propagation angle for load cases II–IVwhen modified crack propagation criterion is used.
The influence of contact surface friction on crack propagation angle determinedby modified MTS criterion is more evident for critical distance of rc =2.97 µm (Fig-ure 17).
Results in Figure 17 show the opposite effect of friction increase on the crackpropagation angle as the results obtained with classical MTS criterion (Figure 13).
Variation of crack propagation angle determined with different SED and MTScriteria for coefficient of friction µ = 0.04 and rc = 0.7814 µm is summarized inFigure 18.
Results in Figure 18 clearly show that the modified MTS criterion always gives thelargest crack propagation angles for different terms considered in the criteria and forall load cases of the computational model used in this paper.
Figure 15. Crack propagation angle determined with the generalized MTS criterion based on KI andKII stress intensity factors, T-stress and rc =2.97 µm.
144 B. Zafosnik et al.
Figure 16. Crack propagation angle determined with the modified MTS criterion based on KI andKII stress intensity factors, T-stress, rc =0.7814 µm and σ c
yy stress.
Figure 17. Crack propagation angle determined with the modified MTS criterion based on KI andKII stress intensity factors, T-stress, rc =2.97 µm and σ c
yy stress.
Figure 18. Crack propagation angle determined with different SED and MTS criteria for rc =0.7814 µm.
Modelling of surface crack growth 145
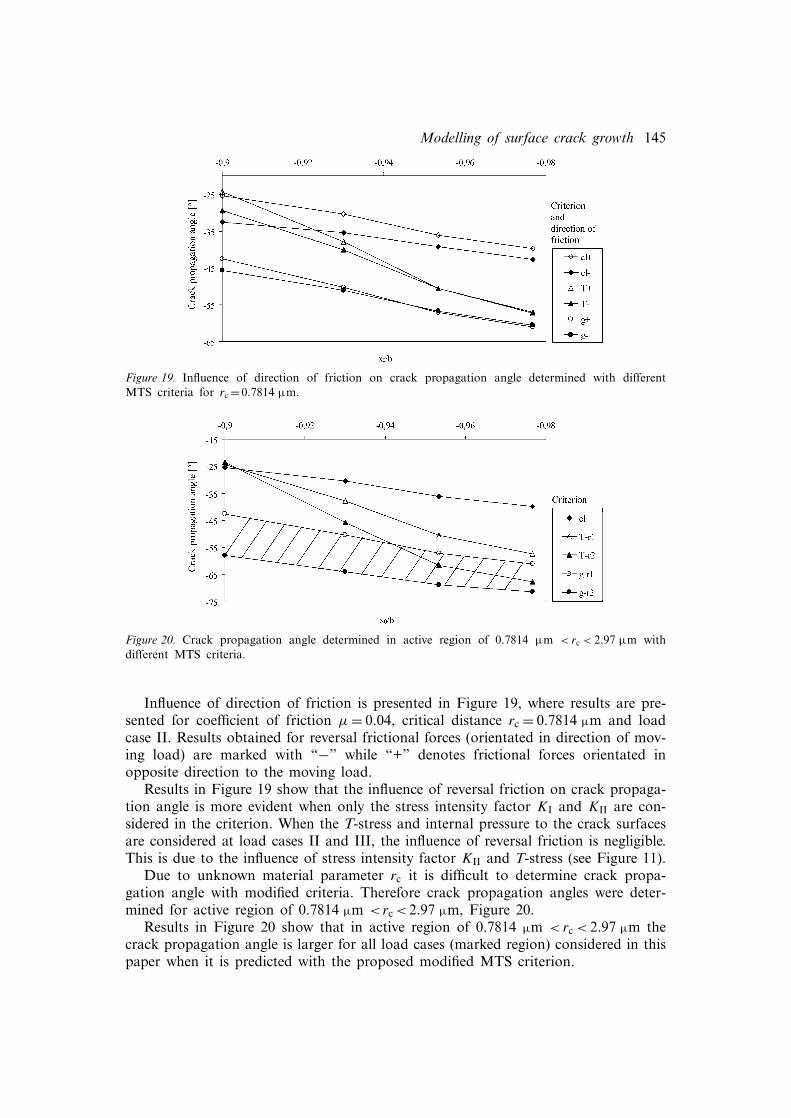
Figure 19. Influence of direction of friction on crack propagation angle determined with differentMTS criteria for rc =0.7814 µm.
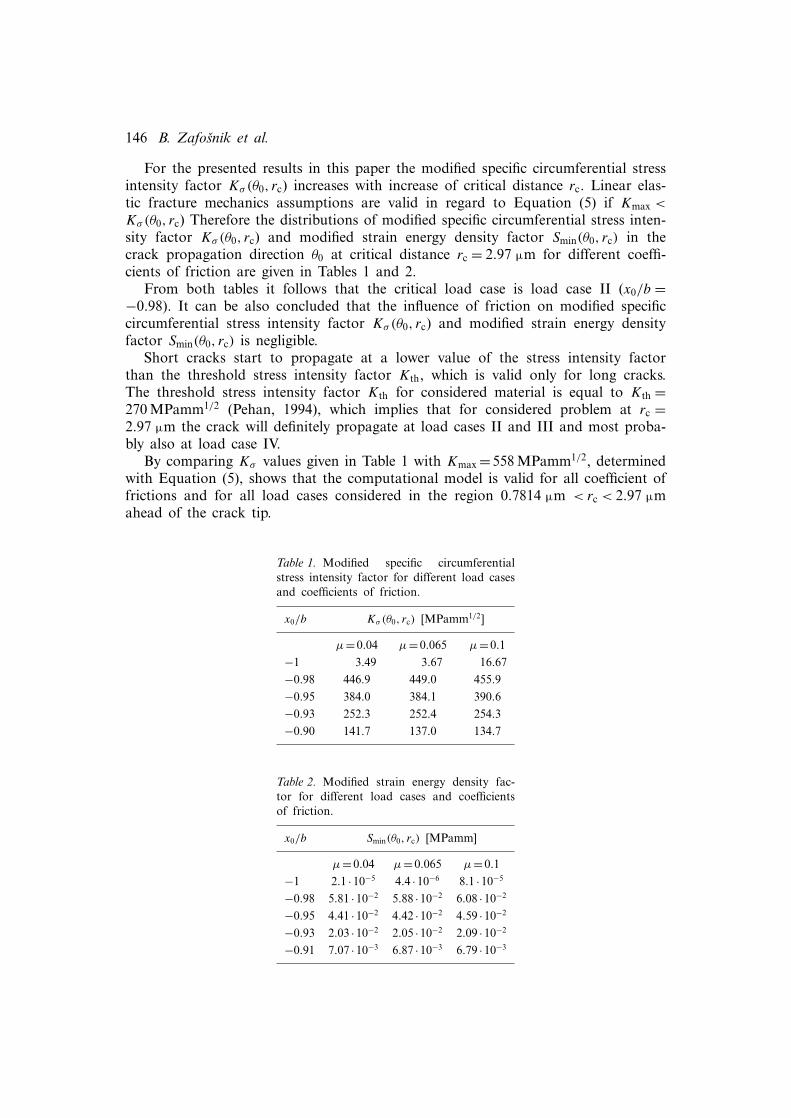
Figure 20. Crack propagation angle determined in active region of 0.7814 µm < rc < 2.97 µm withdifferent MTS criteria.
Influence of direction of friction is presented in Figure 19, where results are pre-sented for coefficient of friction µ = 0.04, critical distance rc = 0.7814 µm and loadcase II. Results obtained for reversal frictional forces (orientated in direction of mov-ing load) are marked with “−” while “+” denotes frictional forces orientated inopposite direction to the moving load.
Results in Figure 19 show that the influence of reversal friction on crack propaga-tion angle is more evident when only the stress intensity factor KI and KII are con-sidered in the criterion. When the T-stress and internal pressure to the crack surfacesare considered at load cases II and III, the influence of reversal friction is negligible.This is due to the influence of stress intensity factor KII and T-stress (see Figure 11).
Due to unknown material parameter rc it is difficult to determine crack propa-gation angle with modified criteria. Therefore crack propagation angles were deter-mined for active region of 0.7814 µm <rc <2.97 µm, Figure 20.
Results in Figure 20 show that in active region of 0.7814 µm <rc < 2.97 µm thecrack propagation angle is larger for all load cases (marked region) considered in thispaper when it is predicted with the proposed modified MTS criterion.
146 B. Zafosnik et al.
For the presented results in this paper the modified specific circumferential stressintensity factor Kσ(θ0, rc) increases with increase of critical distance rc. Linear elas-tic fracture mechanics assumptions are valid in regard to Equation (5) if Kmax <
Kσ(θ0, rc) Therefore the distributions of modified specific circumferential stress inten-sity factor Kσ(θ0, rc) and modified strain energy density factor Smin(θ0, rc) in thecrack propagation direction θ0 at critical distance rc = 2.97 µm for different coeffi-cients of friction are given in Tables 1 and 2.
From both tables it follows that the critical load case is load case II (x0/b =−0.98). It can be also concluded that the influence of friction on modified specificcircumferential stress intensity factor Kσ(θ0, rc) and modified strain energy densityfactor Smin(θ0, rc) is negligible.
Short cracks start to propagate at a lower value of the stress intensity factorthan the threshold stress intensity factor Kth, which is valid only for long cracks.The threshold stress intensity factor Kth for considered material is equal to Kth =270 MPamm1/2 (Pehan, 1994), which implies that for considered problem at rc =2.97 µm the crack will definitely propagate at load cases II and III and most proba-bly also at load case IV.
By comparing Kσ values given in Table 1 with Kmax =558 MPamm1/2, determinedwith Equation (5), shows that the computational model is valid for all coefficient offrictions and for all load cases considered in the region 0.7814 µm < rc < 2.97 µmahead of the crack tip.
Table 1. Modified specific circumferentialstress intensity factor for different load casesand coefficients of friction.
x0/b Kσ (θ0, rc) [MPamm1/2]
µ=0.04 µ=0.065 µ=0.1−1 3.49 3.67 16.67−0.98 446.9 449.0 455.9−0.95 384.0 384.1 390.6−0.93 252.3 252.4 254.3−0.90 141.7 137.0 134.7
Table 2. Modified strain energy density fac-tor for different load cases and coefficientsof friction.
x0/b Smin(θ0, rc) [MPamm]
µ=0.04 µ=0.065 µ=0.1−1 2.1 ·10−5 4.4 ·10−6 8.1 ·10−5
−0.98 5.81 ·10−2 5.88 ·10−2 6.08 ·10−2
−0.95 4.41 ·10−2 4.42 ·10−2 4.59 ·10−2
−0.93 2.03 ·10−2 2.05 ·10−2 2.09 ·10−2
−0.91 7.07 ·10−3 6.87 ·10−3 6.79 ·10−3
Modelling of surface crack growth 147
6. Conclusions
The paper is concerned with the influence of different terms in asymptotic stress fieldaround the crack tip on crack propagation angle relative to the pre-existing initialsurface breaking crack subjected to lubricated rolling–sliding contact conditions. For-mulation of modified SED and MTS criteria is based on asymptotic stress field thatcomprises the stress intensity factors KI, KII, the T-stress, tractions on crack sur-faces caused by pressure trapped inside the crack and critical distance rc. The devel-oped criteria are valid only for crack faces loaded with constant pressure due to fluidtrapped in the crack.
The criteria are applied to a problem of short, surface breaking crack propaga-tion on gear teeth contact surface of a real gear pair. The equivalent Hertzian con-tact model was used for determination of normal contact pressure distribution in thecontact area. Tangential contact forces were simulated with frictional forces, whileinfluence of the fluid trapped inside the crack was modelled with constant pressuredistribution along the crack faces. The moving contact loading was simulated withfive different load cases. Stress intensity factors KI and KII were computed with thequarter point displacement method, while the T-stress was extrapolated from succes-sive pseudo T-stresses ahead of the crack tip. Displacements and stresses were com-puted with the finite element method.
For the model, which consider that the surface traction is opposite to that ofmovement of contact pressure, the comparative computational analyses have shownthat the internal pressure to the crack surfaces has the largest influence on the stressintensity factor KI, KII and T-stress in region where the crack mouth just entersthe loaded region. Free surface friction has negligible influence on the stress inten-sity factor KI (Kudish and Burris, 2004). Increasing the contact friction results inincrease of the T-stress, while the stress intensity factor KII decreases for the casewhere the moving loaded contact region reaches the crack mouth. This leads to alarger crack propagation angle at lower contact friction, when only singular terms areconsidered in SED or MTS criterion. Due to difficulties of determining the propervalue of material parameter rc, the crack propagation angles were calculated in theactive region of constrained yielding determined by maximum stress intensity factorKI and plane strain fracture toughness KIc. When the T-stress and rc are also consid-ered, higher friction causes larger crack propagation angles in the presence of positiveT-stress and smaller angles for negative T-stress. The largest crack propagation anglesare estimated with modified MTS criterion, which better corresponds with availableexperimental data (Kaneta and Murakami, 1987; Knauer, 1988; Schedl, 1998; Weck,1992).
The fracture criteria developed in the paper depend on critical distance rc, whichis a material parameter and presents the size of the fracture process zone. Critical dis-tance rc has a significant effect on the crack initiation angle (Smith et al., 2001). Foraccurate determination of the crack propagation angle in metallic gears, appropri-ate value of parameter rc should be evaluated from experimental investigation (Kosaiet al., 1993).
148 B. Zafosnik et al.
References
Aliabadi, M.H. and Rooke, D.P. (1991). Numerical Fracture Mechanics. Kluwer Academic Publishers.Ayatollahi, M.R., Pavier M.J. and Smith, D.J. (2002). Mode I cracks subjected to large T-stresses. Inter-
national Journal of Fracture 117, 159–174.Blake, J.W. (1994). Further development of a predictive pitting model for gears: improvements in the life
prediction analysis. STLE Tribology Transactions 37(2), 237–244.Bogdanski, S., Olzak, M. and Stupnicki, J. (1996). Numerical stress analysis of rail rolling contact fatigue
cracks. Wear 191, 14–24.Bower, A.F. (1988). The influence of crack face friction and trapped fluid on surface initiated rolling
contact fatigue cracks. Journal of Tribology 110, 704–711.Buchholz, F.G., Pirro, P.J.M., Richard, H.A. and Dreyer, K.H. (1987). Numerical and experimen-
tal mixed-mode analysis of a compact tension-shear-specimen. In: Numerical methods in FractureMechanics, Proceedings of the Fourth International Conference, San Antonio, Texas, USA, 641–656.
Chue, C.H. and Chung, H.H. (2000). Pitting formation under rolling contact. Theoretical and AppliedFracture Mechanics 34, 1–9.
Datsyshyn, O.P. and Panasyuk, V.V. (2001). Pitting of the rolling bodies contact surface. Wear 251, 1347–1355.
DIN 3990 (1987). Tragfahtigkeitsberechnungen von Stirnradern. Beuth Verlag GMBH.Dowling, N.E. (1989). Mechanical Behaviour of Materials. Prentice Hall Inc., New Jersey.Erdogan, F. and Sih, G.C. (1963). On the crack extension in plates under plane loading and transverse
shear. ASME Journal of Basic Engineering 85, 525–527.Fajdiga, G., Flasker, J. and Glodez, S. (2004). The influence of different parameters on surface pitting
of contacting mechanical elements. Engineering Fracture Mechanics 71, 747–758.Frolish, M.F., Fletcher, D.I. and Beynon, J.H. (2002). A quantitative model for predicting the morphol-
ogy of surface initiated rolling contact fatigue cracks in back-up roll steels. Fatigue & Fracture ofEngineering Materials & Structures 25, 1037–1086.
Glodez, S., Ren, Z. and Flasker, J. (1998). Simulation of surface pitting due to contact loading. Inter-national Journal for Numerical Methods in Engineering 43, 33–50
Hellen, T.K., Blackburn, W.S. (1975). The calculation of stress intensity factors for combined tensile andshear loading. International Journal of Fracture 11(4), 605–617.
Joachin, J.F. (1984). Untersuchungen zur Grußchenbildung an Verguteten und Normalisierten Zahnradern.Dissertation, TU Munchen, Fakultat fur Maschinenwesen, Munchen.
Johnson, K.L. (1994). Contact Mechanics. Cambridge University Press.Kaneta, M., Yatsuzuka, H. and Murakami, Y. (1985). Mechanism of crack growth in lubricated roll-
ing/sliding contact. ASLE Transactions 28(3), 407–414.Kaneta, M. and Murakami, Y. (1987). Effect of oil hydraulic pressure on surface crack growth in roll-
ing/sliding contact. Tribology International 20(4), 210–217.Keer, L.M. and Bryant, M.D. (1983). A pitting model for rolling contact fatigue. ASME Journal of lubri-
cation technology 105, 198–205.Kim, J.H. and Paulino, G.H. (2003). T -stress, mixed-mode stress intensity factors, and crack initiation
angles in functionally graded materials: a unified approach using the interaction integral method.Computer Methods in Applied Mechanics and Engineering 192(11–14), 1463–1494.
Knauer, G. (1988). Zur Grubchentragfahigkeit einsatzgeharteter Zahnrader. Dissertation, TU Munchen,Fakultat fur Maschinenwesen, Munchen.
Ko, P.L., Iyer, S.S., Vaughan, H. and Gadala, M. (2001). Finite element modelling of crack growth andwear particle formation in sliding contact. Wear 251, 1265–1278.
Kosai, M., Kobayashi, A.S. and Ramulu, M. (1993). Tear straps in airplane fuselage, In: Durability ofMetal Aircraft Structures (edited by Atluri, S.N., Harris, C.E., Hoggard, A., Miller, N. and Sampath,S.G. Atlanta Technology, Atlanta, GA, 443–457.
Kudish, I.I. (2000). New statistical model of contact fatigue. Tribology Transaction 43(4), 711–721.Kudish, I.I., Burris, K.W. (2004). Modeling of surface and subsurface crack behavior under contact load
in the presence of lubricant. International Journal of Fracture 125(1–2), 125–147.
Modelling of surface crack growth 149
Larsson, S.G. and Carlsson, A.J. (1973). Influence of non-singular stress terms and specimen geometryon small-scale yielding at crack tip in elastic-plastic solids. Journal of Mechanics and Physics of Solids21, 263–277.
Lim, I.L., Johnston, I.W. and Choi, S.K. (1992). Comparison between various displacement-based stressintensity factor computation techniques. International Journal of Fracture 58, 193–210.
Michaelis, K. (1987). Die Integraltemperatur zur Beurteilung der Freßtragfahigkeit von Stirnradgetrieben.Dissertation, TU Munchen, Fakultat fur Maschinenwesen, Munchen.
Murakami, Y., Sakae, C., Ichimaru, K. and Morita, T. (1997). Experimental and fracture mechanismstudy of the pit formation mechanism under repeated lubricated rolling–sliding contact: Effects ofreversal of rotation and change of the driving roller. Journal of Tribology 119, 788–796.
Owen, D.R. and Fawkes, A.J. (1983). Engineering Fracture Mechanics: Numerical Methods and Applica-tions. Pineridge Press Ltd., Swansea, U.K.
Partheymuller, P. (1999). Numerische simulation der 3D-Rißausbreitung mit der Randelementmethode.Fortschritt-Berichte VDI 18 (242), VDI Verlag, Dusseldorf.
Pehan, S., (1994). The Influence of Different Load Distribution on the Crack Propagation in Tooth Root(in Slovene). University of Maribor, Faculty of Mechanical Engineering, Maribor, Slovenia
Ren, Z., Glodez, S., Fajdiga, G. and Ulbin, M. (2002). Surface initiated crack growth simulation in mov-ing lubricated contact. Theoretical and Applied Fracture Mechanics 38, 141–149.
Ringsberg, J.W. and Bergkvist, A. (2003). On propagation of short rolling contact fatigue cracks. Fatigue& Fracture of Engineering Materials & Structures 26, 969–983.
Schedl, U. (1998). Einfluß des Schmierstoffs auf die Grubchenlebensdauer einsatzgeharteter Zahnrader. Dis-sertation, TU Munchen, Fakultat fur Maschinenwessen, Munchen.
Seweryn, A. (1998). A non-local stress and strain energy release rate mixed mode fracture initiation andpropagation criteria. Engineering Fracture Mechanics 59(6), 737–760.
Sih, G.C. (1974). Strain energy density factor applied to mixed mode problems. International Journal ofFracture 10, 305–321.
Sih, G.C. (1980). Prediction of crack growth under mixed mode conditions. Proceedings of First USA-Greece symposium on Mixed Mode Propagation, Athens, Greece.
Smith, D.J., Ayatollahi, M.R. and Pavier, M.J. (2001). The role of T-stress in brittle fracture for linearelastic materials under mixed-mode loading. Fatigue & Fracture of Engineering Materials & Structures24, 137–150.
Sraml, M. (2001). Modelling of Contact Fatigue of Mechanical Elements (in Slovene). Dissertation, Uni-versity of Maribor, Faculty of Mechanical Engineering, Maribor, Slovenia.
Ueda, Y., Ikeda, K., Yao, T. and Aoki, M. (1983). Characteristics of brittle failure under general com-bined modes including those under bi-axial tensile loads. Engineering Fracture Mechanics 18(6), 1131–1158.
Wang, G.Z., Chen, J.H. and Liu, G.H. (2002). On the characteristic distance and minimum fracturetoughness for cleavage fracture in a C–Mn steel. International Journal of Fracture 118, 57–76.
Weck, M., (1992) Moderne Leistungsgetriebe. Springer Verlag.Williams, M. L. (1957). On the stress distribution at the base of a stationary crack. Journal of Applied
Mechanics 24, 109–114.Williams, J.G. and Ewing, P.D. (1972). Fracture under complex stress–the angled crack problem. Inter-
national Journal of Fracture 8(4), 416–441.