Bangladesh Steel Re-rolling Mills Limited - BSRM
131
Bangladesh Steel Re-rolling Mills Limited EXPERIMENTAL STUDY ON FLEXURAL STRENGTH AND DUCTILITY CHARECTERISTICS OF CONCRETE BEAM REINFORCED WITH 80 GRADE STEEL DR. ISHTIAQUE AHMED DR. TANVIR MANZUR MD. IFTEKHARUL ISLAM November 2015 Department of Civil Engineering Bangladesh University of Engineering & Technology (BUET) Dhaka-1000, Bangladesh
-
Upload
khangminh22 -
Category
Documents
-
view
1 -
download
0
Transcript of Bangladesh Steel Re-rolling Mills Limited - BSRM

Bangladesh Steel Re-rolling Mills Limited
EXPERIMENTAL STUDY ON FLEXURAL STRENGTH AND
DUCTILITY CHARECTERISTICS OF CONCRETE BEAM
REINFORCED WITH 80 GRADE STEEL
DR. ISHTIAQUE AHMED
DR. TANVIR MANZUR
MD. IFTEKHARUL ISLAM
November 2015
Department of Civil Engineering
Bangladesh University of Engineering & Technology (BUET)
Dhaka-1000, Bangladesh
DISCLAIMER
This report was prepared based on the experimental study conducted at the laboratory of
Bangladesh University of Engineering and Technology, Dhaka under sponsorship from
Bangladesh Steel Re-rolling Mills Limited (BSRM). The contents of this publication do not
necessarily reflect the views and policies of the university or BSRM.
This report was prepared under the supervision of faculty members whose name appears in
the cover page. While endeavoring to provide practical and accurate information, BSRM,
BUET and the authors, assume no liability for, nor express or imply any warranty with regard
to the information contained herein. Information contained in this report shall be used in
compliance with the established engineering practice under guidance of the relevant code.

ACKNOWLEDGEMENTS
The authors express their sincere gratitude to BSRM for funding the project and supplying
the reinforcing bars regarding this research project.
The technical advice given by Dr. Mohammad Al Amin Siddique, Md. Ruhul Amin,
Md. Abul Bashar Emon during the experimental work is also greatly appreciated. Special
thanks go to Md. Maydul Islam, Fahim Ahmed and Muhammad Rakibul Islam for their
assistance during the experimental procedure.
ABSTRACT
An experimental investigation on behavior of reinforced concrete beams with Grade 80 and
Grade 60 rebars has been conducted at BUET. The program involved testing of 30 half scale
beams having dimensions of 6'' × 9.5'' × 8' (150 mm × 237.5 mm × 2400 mm). The behavior
of beams reinforced with Grade 80 rebar is presented in this report. A comparison between
the behavior of beams reinforced with Grade 80 rebar and Grade 60 rebar is also made. ACI-
318-14 has allowed the use of Grade 80 steel with certain restriction. The purpose of this
research is to make sure that Grade 80 rebars are compatible with the concrete made with
local materials and following local construction practice. The results of the experiment
showed that beams with Grade 80 reinforcement have similar failure pattern and ductility
characteristics as that of beams with Grade 60 reinforcements. Moreover, the observed
strength closely matched with the predicted strength. The deflection and crack width at
service load were found to be marginally higher for Grade 80 steel than those of Grade 60
steel.

v
TABLE OF CONTENTS
CHAPTER 1: INTRODUCTION 1
1.1 GENERAL 1
1.2 OBJECTIVE 1
1.3 RESEARCH SIGNIFICANCE 2
1.4 REPORT OUTLINE 2
1.4.1 Chapter 1 2
1.4.2 Chapter 2 2
1.4.3 Chapter 3 2
1.4.4 Chapter 4 2
1.4.5 Chapter 5 2
1.4.6 Chapter 6
CHAPTER 2: LITERATURE REVIEW 3
2.1 GENERAL. 3
2.2 EVOLUTIONOF GRADE 80 REINFORCEMENT 3
2.3 HIGH STRENGTH STEEL MATERIAL 4
2.4 RECOGNIZED DUCTILE GRADES OF STEEL 6
2.5 ASTM A706 GRADE 80 REINFORCEMENT IN CODE DOCUMENTS 7
2.5.1 ODOT Bridge Design and Drafting Manual 8
2.5.2 AASHTO Design Specifications 8
2.5.4 ACI Code (ACI 318-14) 8
2.5.5 ICC ES Evaluation Report ESR 2107 (2013) 11
2.6 SUMMARY 11
CHAPTER 3: EXPERIMENTAL PROGRAM 12
3.1 GENERAL 12
3.2 TEST SPECIMENS 12
3.2.1 Design of the Specimens 12
3.2.2 Flexural Reinforcement 13
3.2.3 Shear Reinforcement 13
3.3 MATERIAL PROPERTIES 13
3.3.1 Concrete 13
3.3.2 Steel 13
3.4 FABRICATION OF THE SPECIMENS 14
3.5 INSTRUMENTATION 14
3.6 TESTING PROCEDURE 14
3.6.1 Test Setup 14
3.6.2 Preparation for Testing 14
3.6.3 Testing 14

vi
CHAPTER 4: EXPERIMENTAL RESULTS 19
4.1 GENERAL 19
4.2 MATERIAL PROPERTIES 19
4.2.1 Concrete 19
4.2.2 Steel 20
4.3 BEHAVIOR OF BEAM T-1, T-2 AND T-3 20
4.3.1 Flexural Behavior 20
4.3.2 Crack Pattern 20
4.3.3 Crack Width 21
4.3.4 Deflection 21
4.3.5 Ultimate Flexural Capacity and Failure Mode 21
4.3.6 Moment Curvature relationship 21
4.4 BEHAVIOR OF BEAM T-4, T-5 AND T-6 21
4.4.1 Flexural Behavior 22
4.4.2 Crack Pattern 22
4.4.3 Crack Width 22
4.4.4 Deflection 23
4.4.5 Ultimate Flexural Capacity and Failure Mode 23
4.5 BEHAVIOR OF BEAM XT-1, XT-2 AND XT-3 23
4.5.1 Flexural Behavior 23
4.5.2 Crack Pattern 24
4.5.3 Crack Width 24
4.5.4 Deflection 24
4.5.5 Ultimate Flexural Capacity and Failure Mode 24
4.6 BEHAVIOR OF BEAM XT-4, XT-5 AND XT-6 25
4.6.1 Flexural Behavior 25
4.6.2 Crack Pattern 25
4.6.3 Crack Width 26
4.6.4 Deflection 26
4.6.5 Ultimate Flexural Capacity and Failure Mode 26
4.7 BEHAVIOR OF BEAM T-7, T-8 AND T-9 26
4.7.1 Flexural Behavior 26
4.7.2 Crack Pattern 27
4.7.3 Crack Width 27
4.7.4 Deflection 27
4.7.5 Ultimate Flexural Capacity and Failure Mode 28
4.8 BEHAVIOR OF BEAM T-10, T-11 AND T-12 28
4.8.1 Flexural Behavior 28
4.8.2 Crack Pattern 28
4.8.3 Crack Width 29
4.8.4 Deflection 29
4.8.5 Ultimate Flexural Capacity and Failure Mode 29
4.9 BEHAVIOR OF BEAM XT-7, XT-8 AND XT-9 29
4.9.1 Flexural Behavior 30

vii
4.9.2 Crack Pattern 30
4.9.3 Crack Width 30
4.9.4 Deflection 31
4.9.5 Ultimate Flexural Capacity and Failure Mode 31
4.10 BEHAVIOR OF BEAM XT-10, XT-11 AND XT-12 31
4.10.1 Flexural Behavior 31
4.10.2 Crack Pattern 32
4.10.3 Crack Width 32
4.10.4 Deflection 32
4.10.5 Ultimate Flexural Capacity and Failure Mode 32
4.11 BEHAVIOR OF BEAM T-13, T-14 AND T-15 33
4.11.1 Flexural Behavior 33
4.11.2 Crack Pattern 33
4.11.3 Crack Width 34
4.11.4 Deflection 34
4.11.5 Ultimate Flexural Capacity and Failure Mode 34
4.12 BEHAVIOR OF BEAM T-16, T-17 AND T-18 34
4.12.1 Flexural Behavior 34
4.12.2 Crack Pattern 35
4.12.3 Crack Width 35
4.12.4 Deflection 35
4.12.5 Ultimate Flexural Capacity and Failure Mode 36
CHAPTER 5: DISCUSSION AND ANALYSIS OF EXPERIMENTAL RESULTS 83
5.1 GENERAL 83
5.2 FLEXURAL BEHAVIOR AND CRACK ISSUE 83
5.2.1 Behavior of Beam T-3 and Beam T-6 83
5.2.2 Behavior of Beam T-13 and Beam T-18 84
5.2.3 Behavior of Beam XT-3 and Beam XT-6 85
5.2.4 Behavior of Beam XT-8 and Beam XT-11 86
5.2.5 Behavior of Beam T-11 and Beam T-18 87
5.2.6 Behavior of Beam T-6 and Beam T-18 87
5.2.7 Behavior of Beam XT-6 and Beam XT-12 88
5.2.8 Behavior of Beam XT-6 and Beam T-11 89
5.2.9 Behavior of Beam XT-6 and Beam T-6 90
5.2.10 Behavior of Beam XT-3 and Beam T-8 91
5.2.11 Behavior of Beam XT-6 and Beam T-18 92
5.2.12 Behavior of Beam XT-12 and Beam T-18 92
CHAPTER 6: SUMMARY AND CONCLUSION 107
6.1 SUMMARY 107
6.2 CONCLUSIONS 107
6.3 RECOMMENDATIONS FOR FUTURE STUDY 108
REFERENCES 109
Appendix – A: Moment – Curvature Relationship 111

viii
LIST OF TABLES
Table 2.1: Strength Requirements of ASTM 7
Table 2.2 Minimum Required Elongation in 8 inch (200 mm) Across Fracture 7
Table 2.3 Nonprestressed Deformed Reinforcement 10
Table 2.4 Minimum depth of nonprestressed beams [ACI 318-14] 9
Table 2.5(A1): Specified Yield Strengths for Design of Members Using ASTM A 1035/A 1035M
Grade 100 Reinforcement 11
Table 3.1 Details of Beam Specimens Prepared for Testing 15
Table 3.2 Summary of location, and function of each device 15
Table 4.1 Compressive strength of the concrete 36
Table 5.1 Details of Test Results 94
LIST OF FIGURES
Fig. 2.1: Strain distribution and net tensile strain in a nonprestressed member 9
Fig. 2.2: Variation of with net tensile strain in extreme tension reinforcement 11
Fig. 3.1: Typical reinforcement of Beams 16
Fig. 3.2: Stirrup and hook details 16
Fig. 3.3: Typical distribution of shear reinforcements 16
Fig. 3.4: Type of failure on the tested rebar 17
Fig. 3.5: Steel cage and form 17
Fig. 3.6: Casting and finishing of the specimen 17
Fig. 3.7: Experimental setup 18
Fig. 3.8: Typical Beam setup 18
Fig. 4.1: Crack comparator 36
Fig. 4.2.1: Mechanical properties of reinforcing Grade 80 steel (#4 ; 12mm dia) 37
Fig. 4.2.2: Mechanical properties of reinforcing Grade 80 steel (#5 ; 16mm dia) 38
Fig. 4.3.1: Crack pattern at failure of beam T-1 to T-3 39
Fig. 4.3.2: Load vs Crack width of beam T-1 to T-3 40
Fig. 4.3.3: Load-deflection response of beam T-1 to T-3 41
Fig. 4.3.3: Load-deflection response of beam T-1 to T-3 42
Fig. 4.3.4: Load-Steel strain relationship of beam T-1 to T-3 43
Fig. 4.3.5: Deflected shape of beam T-1 to T-3 44
Fig. 4.4.1: Crack pattern at failure of beam T-4 to T-6 45
Fig. 4.4.2: Load vs Crack width of beam T-4 to T-6 46
Fig. 4.4.3: Load-deflection response of beam T-4 to T-6 47
Fig. 4.4.4: Load-Steel strain relationship of beam T-4 to T-6 48
Fig. 4.4.5: Deflected shape of beam T-4 to T-6 49
Fig. 4.5.1: Crack pattern at failure of beam XT-1 to XT-3 50
Fig. 4.5.2: Load vs Crack width of beam XT-1 to XT-3 51
Fig. 4.5.3: Load-deflection response of beam XT-1 to XT-3 52
Fig. 4.5.4: Load-Steel strain relationship of beam XT-1 to XT-3 53
Fig.4.5.5: Deflected shape of beam XT-1 to XT-3 54
Fig. 4.6.1: Crack pattern at failure of beam XT-4 to XT-6 55
Fig. 4.6.2: Load vs Crack width of beam XT-4 to XT-6 56

ix
Fig. 4.6.3: Load-deflection response of beam XT-4 to XT-6 57
Fig. 4.6.4: Load-Steel strain relationship of beam XT-4 to XT-6 58
Fig. 4.6.5: Deflected shape of beam XT-1 to XT-3 59
Fig. 4.7.1: Crack pattern at failure of beam T-7 to T-9 60
Fig. 4.7.2: Load vs Crack width of beam T-7 to T-9 61
Fig. 4.7.3: Load-deflection response of beam T-7 to T-9 62
Fig. 4.7.4: Load-Steel strain relationship of beam T-6 to T-8 63
Fig. 4.8.1: Crack pattern at failure of beam T-10 to T-12 64
Fig. 4.8.2: Load vs Crack width of beam T-10 to T-12 65
Fig. 4.8.3: Load-deflection response of beam T-10 to T-12 66
Fig. 4.8.4: Load-Steel strain relationship of beam T-10 to T-12 67
Fig. 4.9.1: Crack pattern at failure of beam XT-7 to XT-9 68
Fig. 4.9.2: Load vs Crack width of beam XT-7 to XT-9 69
Fig. 4.9.3: Load-deflection response of beam XT-7 to XT-9 70
Fig. 4.9.4: Load-Steel strain relationship of beam XT-7 to XT-9 71
Fig. 4.10.1: Crack pattern at failure of beam XT-10 to T-12 72
Fig. 4.10.2: Load vs Crack width of beam XT-10 to XT-12 73
Fig. 4.10.3: Load-deflection response of beam XT-10 to XT-12 74
Fig. 4.10.4: Load-Steel strain relationship of beam XT-10 to XT-12 75
Fig. 4.11.1: Crack pattern at failure of beam T-13 to T-15 76
Fig. 4.11.2: Load vs Crack width of beam XT-13 to XT-15 77
Fig. 4.11.3: Load-deflection response of beam T-13 to T-15 78
Fig. 4.11.4: Load-Steel strain relationship of beam T-13 to T-15 79
Fig. 4.12.1: Crack pattern at failure of beam T-16 to T-18 80
Fig. 4.12.2: Load vs Crack width of beam T-16 to T-18 81
Fig. 4.12.3: Load-deflection response of beam T-16 to T-18 82
Fig. 4.12.4: Load-Steel strain relationship of beam T-16 to T-18 83
Fig. 5.2.1: Comparison of behavior of T-3 and T-6 95
Fig. 5.2.2: Comparison of behavior T-13 and T-18 96
Fig. 5.2.3: Comparison of behavior of XT-3 and XT-6 97
Fig. 5.2.4: Comparison of behavior of XT-8 and XT-11 98
Fig. 5.2.5: Comparison of behavior of T-11 and T-18 99
Fig. 5.2.6: Comparison of behavior of T-6 and T-18 100
Fig. 5.2.7: Comparison of behavior of XT-6 and XT-12 101
Fig. 5.2.8: Comparison of behavior of XT-6 and T-11 102
Fig. 5.2.9: Comparison of behavior of XT-6 and T-6 103
Fig. 5.2.10: Comparison of behavior of XT-3 and T-8 104
Fig. 5.2.11: Comparison of behavior of XT-6 and T-18 105
Fig. 5.2.12: Comparison of behavior of XT-12 and T-18 106
1
CHAPTER 1
INTRODUCTION
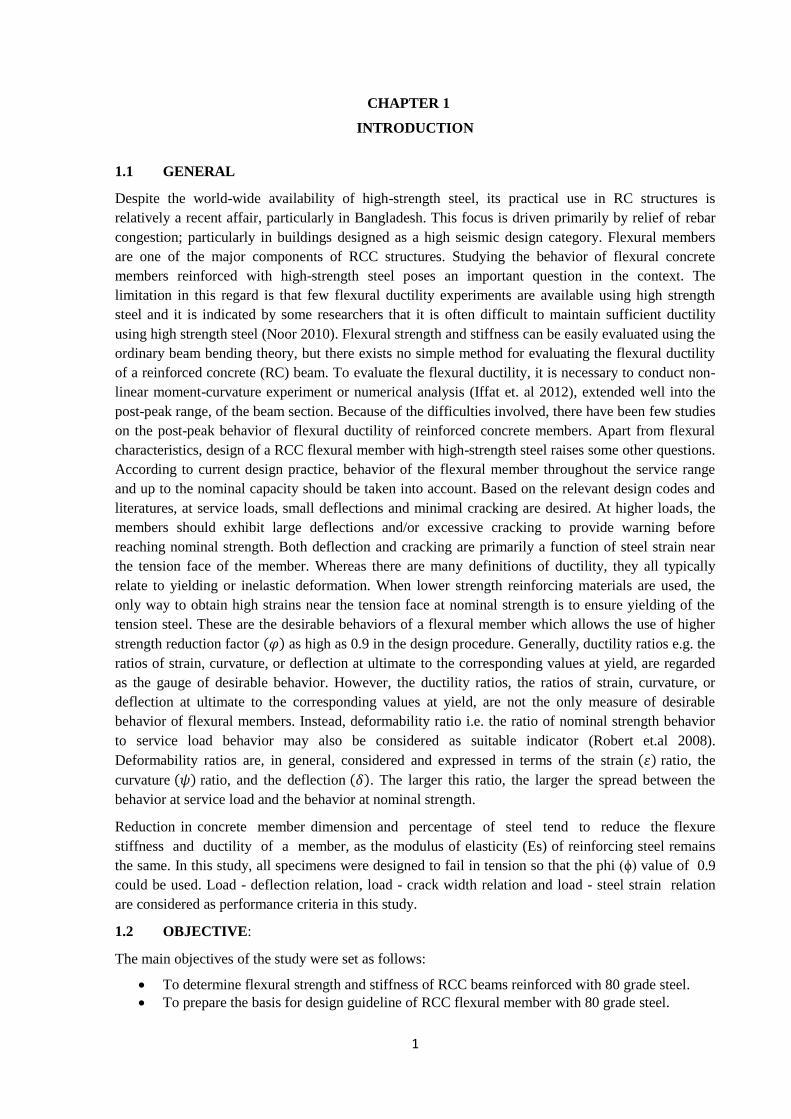
1.1 GENERAL
Despite the world-wide availability of high-strength steel, its practical use in RC structures is
relatively a recent affair, particularly in Bangladesh. This focus is driven primarily by relief of rebar
congestion; particularly in buildings designed as a high seismic design category. Flexural members
are one of the major components of RCC structures. Studying the behavior of flexural concrete
members reinforced with high-strength steel poses an important question in the context. The
limitation in this regard is that few flexural ductility experiments are available using high strength
steel and it is indicated by some researchers that it is often difficult to maintain sufficient ductility
using high strength steel (Noor 2010). Flexural strength and stiffness can be easily evaluated using the
ordinary beam bending theory, but there exists no simple method for evaluating the flexural ductility
of a reinforced concrete (RC) beam. To evaluate the flexural ductility, it is necessary to conduct non-
linear moment-curvature experiment or numerical analysis (Iffat et. al 2012), extended well into the
post-peak range, of the beam section. Because of the difficulties involved, there have been few studies
on the post-peak behavior of flexural ductility of reinforced concrete members. Apart from flexural
characteristics, design of a RCC flexural member with high-strength steel raises some other questions.
According to current design practice, behavior of the flexural member throughout the service range
and up to the nominal capacity should be taken into account. Based on the relevant design codes and
literatures, at service loads, small deflections and minimal cracking are desired. At higher loads, the
members should exhibit large deflections and/or excessive cracking to provide warning before
reaching nominal strength. Both deflection and cracking are primarily a function of steel strain near
the tension face of the member. Whereas there are many definitions of ductility, they all typically
relate to yielding or inelastic deformation. When lower strength reinforcing materials are used, the
only way to obtain high strains near the tension face at nominal strength is to ensure yielding of the
tension steel. These are the desirable behaviors of a flexural member which allows the use of higher
strength reduction factor as high as 0.9 in the design procedure. Generally, ductility ratios e.g. the
ratios of strain, curvature, or deflection at ultimate to the corresponding values at yield, are regarded
as the gauge of desirable behavior. However, the ductility ratios, the ratios of strain, curvature, or
deflection at ultimate to the corresponding values at yield, are not the only measure of desirable
behavior of flexural members. Instead, deformability ratio i.e. the ratio of nominal strength behavior
to service load behavior may also be considered as suitable indicator (Robert et.al 2008).
Deformability ratios are, in general, considered and expressed in terms of the strain ratio, the
curvature ratio, and the deflection . The larger this ratio, the larger the spread between the
behavior at service load and the behavior at nominal strength.
Reduction in concrete member dimension and percentage of steel tend to reduce the flexure
stiffness and ductility of a member, as the modulus of elasticity (Es) of reinforcing steel remains
the same. In this study, all specimens were designed to fail in tension so that the phi (ϕ) value of 0.9
could be used. Load - deflection relation, load - crack width relation and load - steel strain relation
are considered as performance criteria in this study.
1.2 OBJECTIVE:
The main objectives of the study were set as follows:
To determine flexural strength and stiffness of RCC beams reinforced with 80 grade steel.
To prepare the basis for design guideline of RCC flexural member with 80 grade steel.

2
To compare the performance of beams reinforced with Grade 80 rebars to that of beams
reinforced with Grade 60 rebars.
To evaluate ductility ratios of test specimens.
1.3 RESEARCH SIGNIFICANCE
The outcome of the research will assist concerned professionals to understand the flexural
behavior of RCC member reinforced with high strength 80 Grade steel. The ACI Code allows using
conventional tension controlled strain limit for steel up to 80 ksi of yield strength. Such tension
controlled strain limits ensure acceptable strain, curvature, deflection and deformability ratios
of a RCC member under flexure. The proposed study will investigate both the ductility
behavior of RCC member having newly introduced 80 Grade steel of BSRM as reinforcement
and aptness of the Code specified tension controlled strain limits for such RCC member under
flexure. In addition, this research will shed light on the spread between behavior at service
and nominal condition as well as between yield and ultimate condition. Consequently, it will
assist local designers to take advantage of using high strength steel bars as reinforcement for concrete
structures.
1.4 REPORT OUTLINE
This report includes 6 chapters. A brief description of the chapters follows.
1.4.1 Chapter 1
This chapter provides a general introduction , objectives, and significance of the project.
1.4.2 Chapter 2
This chapter provides a brief literature review on the use of high strength rebar in RCC members. The
literature review covers the history of Grade 80 reinforcement, a summary of the provisions on the use
of Grade 80 reinforcement reported in code documents.
1.4.3 Chapter 3
Chapter 3 provides details on the experimental program and the particular specimens tested . In
addition, this chapter contains details of the instrumentation of the specimens. This chapter also
includes specifics of the test set-up and testing procedures.
1.4.4 Chapter 4
This chapter has two portions. First portion provides details on the materials used in the construction
of the test specimens. The first portion is separated into two main sections: steel and concrete. The
steel section provides mill sheet data for the reinforcement as well as material testing results from the
materials testing program in this research. The section on concrete materials provides details on the
concrete mix proportions and material testing results from the materials testing program in this
research. The second portion presents the behavior of the specimens.
1.4.5 Chapter 5
This chapter presents the analysis of the experimental data presented in Chapters 4. The objective of
this chapter is to examine the effect of reinforcement grade, longitudinal reinforcement ratio, concrete
compressive strength etc. The items presented in Chapters 4 are further discussed in this chapter.
Comparisons are made among the specimens to describe the function of different parameters.
1.4.6 Chapter 6
This chapter provides a summary of the research program and states the pertinent conclusions
obtained from the experiments. It also provides recommendations for future study.

3
CHAPTER 2
LITERATURE REVIEW
2.1 GENERAL
This chapter presents the literature related to the use and performance of high strength rebar in RCC
structures. Research on the potential of using high strength steel in RCC is a recent phenomenon and
has been going on for some time. A number of researchers (Ansley 2002, Malhas 2002, Yotakhong
2003) have investigated the flexural behavior of RCC beams reinforced with high strength steel
experimentally. .The history of Grade 80 reinforcement is primarily presented in this chapter along
with a brief review of high strength steel materials. In addition, pertinent information relating to
Grade 80 reinforcement in different relevant Codes is provided. Finally, a concise summary of the
literature review is presented.
2.2 EVOLUTION OF GRADE 80 REINFORCEMENT
American Association of Steel Manufacturers developed specifications for reinforcing bars in 1910
(Concrete Reinforcing Steel Institute [CRSI] 2001) for the first time. In the following year, American
Society for Testing and Materials (ASTM) adopted the standard specification A15 for billet steel
reinforcement (for structural grade reinforcement)which, required minimum yield strength of 33,000
psi (228 MPa) (CRSI 2001). Later in 1959, the American Society for Testing and Materials (ASTM)
developed specifications for reinforcing bars with yield strengths of 60 ksi (414 MPa) and 75 ksi (520
MPa) (Gustafson 2010). After few years, Hognested emphasized that Grade 80 reinforcement needed
to be produced and that it would soon be in demand in 1967 (Gustafson 2010).However, it took
several decades for the Grade 80 reinforcement to make its way into the standards. Gustafson
(Gustafson 2010) reported that the allowable compressive stress in vertical reinforcement was limited
to , and could not exceed 30 ksi (207 MPa). This translated to maximum allowable yield
strength of 75 ksi (520 MPa) .Recent ACI-318-14 has made some further conclusions which will be
discussed later. In Bangladesh, BNBC (Bangladesh National Building Code) adopted some of the
ASTM standards for structural steel(). At that time, allowable yield strength for reinforcing bars was
limited to 60 ksi (415 MPa).
For several decades, the design of RC structures was restricted to using steel reinforcement with yield
strength of 40 ksi (276 MPa). Grade 60 reinforcement with yield strength of 60 ksi (415 MPa) was in
use since early sixties. Grade 60 steel dominated in the construction of high-rise buildings and bridges
and it is still the choice of most of the designers across the globe. But, because of many valid reasons,
structural engineers started to look for the use of higher grade of steel as reinforcing bars. As a result,
Rice and Gustafson (Rice and Gustafson 1976) assessed the effects of Grade 80 reinforcement in
structural members for buildings using code provisions available at that time. Neither ASTM
specification for Grade 80 steel reinforcement existed during their testing, nor Grade 80 reinforcement
was produced (Rice and Gustafson 1976). Using moment interaction diagrams Rice and Gustafson
(Rice and Gustafson 1976) showed that columns reinforced with Grade 80 reinforcing bars had a
significant rise in moment capacity compared to columns reinforced with Grade 60 reinforcing bars
when loaded primarily in flexure. The study also covered an economic analysis which stated that the
use of Grade 80 reinforcement could result in a considerable reduction in cost if manufactured in large
quantities. Due to the support from structural engineers, contractors, bar producers and fabricators,
ASTM developed a specification for reinforcement with minimum yield strength of 80 ksi (550 MPa)
in ASTM A706/706M–13 (Standard Specification for Low-Alloy Steel Deformed and Plain Bars for

4
Concrete Reinforcement) in December 2009 (Gustafson 2010). Besides, study from researchers
showed that higher strength reinforcement could improve constructability by reducing the congestion
of reinforcement particularly in earthquake-resistant structures (Gustafson 2010, Trejo et. al 2014).A
study form Trejo concluded that Grade 80 reinforcement should be considered for use in all types of
members of RC structure (Trejo et. al 2014).
2.3 HIGH STRENGTH STEEL MATERIAL
ASTM A706/A706M provides standard specifications for reinforcement with minimum yield strength
of 80 ksi (550 MPa) (ASTM 2014). The requirements for chemical composition are similar to
requirements specified for A706 Grade 60 reinforcement. However, besides strength requirements,
Grade 80 reinforcement requires a 2 percent lower minimum elongation for bar sizes 3, 4, 5, and 6
and requires a little larger pin diameter for the bend test requirements. It is known that, yield strength
and ductility are the two most vital parameters for RCC design. Several methods are available for
measuring the yield strength of reinforcing bars. Paulson (Paulson 2013) reported three chief methods
for measuring yield strength. These methods are as followed:
1. Observed Yield Point (YP), which defines the yield stress as the perfect-plastic horizontal portion
of the stress-strain curve. However, this method is only satisfactory for reinforcement that exhibits
sharp yielding, where the stress-strain curve is elastic, perfectly-plastic. ASTM A-15 Grade 40 (40 ksi
[280 MPa]) reinforcement exhibited such behavior.
2. Offset Method (OM), which specifies an offset of the elastic region of the stress-strain curve. The
offset was initially specified as 0.1 percent but was later increased to 0.2 percent. In general, this
method was developed for more rounded stress-strain curves for which the YP method is not
applicable.
3. Extension Under Load (EUL), which has a specified strain value under load. In this method, the
stress equivalent to a specified strain value is defined as the yield stress. This method was primarily
recommended in 1967 by an ad-hoc group to replace the 0.1 percent offset method with a series of
EUL strains. This method was implemented due to the lack of specialty instrumentation to make
offset strain measurements of the reinforcement at the rolling mills.
A study by Paulson et al. (Paulson et al. 2013) found that the offset method (OM), using an offset of
0.2 percent, provides for a reasonable estimate of the strength of reinforced concrete structures. The
research considered reinforcement manufactured between 2008 and 2012. ASTM A706 also
adopted the use of the OM with a 0.2 percent strain offset and this is defined in ASTM A370-12a
Standard Test Methods and Definitions for Mechanical Testing of Steel Products. This method
applied to reinforcement not showing a “sharp-kneed or well defined yield point.” ASTM A706 also
requires a minimum yield strength determined by the EUL method. The standard states “the stress
corresponding to a tensile strain of 0.0035 shall be a minimum of 60,000 psi [420 MPa] for Grade 60
and a minimum of 80,000 psi [550 MPa] for Grade 80.”
The general process for production of reinforcement starts by processing scrap steel. This scrap steel
along with added alloys is melted in a large vat and later shaped into billets. Billets are normally
cooled and stored. Later, these billets are reheated and then pulled through dies, forming the preferred
reinforcing bar size.
Two properties of reinforcing bars, strength and ductility, are directly related, by definition.
Generally, an increase in the steel yield strength reduces the ductility and softens the strain hardening
region of the stress-strain curve. Therefore, most steel grades are a compromise between the required
strength and ductility (Selzer 2013).
Micro-alloying is known as the addition of specific alloys in small percentages It can be used to
persuade grain refinement and amplify the strength of reinforcement. This process can include

5
niobium, vanadium, titanium, molybdenum and other rare earth metals. During processing, steel
develops grains that grow as the steel solidifies and cools. Micro-alloys that result in a larger number
of smaller grains will enhance the strength of the steel (Selzer 2013). However, micro-alloying
decreases ductility of the steel, but not as much as usual alloys (Selzer 2013). Vanadium is a regularly
used micro-alloy (Selzer 2013). Vanadium carbide particles form and “pin” the grain boundaries,
ensuing in smaller grains (Nissen 2013). This “chemical grain refinement” makes the stress-strain
curve rounder compared to conventional alloys. Through this process the trade-off between ductility
and strength is reduced (Selzer 2013) However, grain refinement can also be accomplished with the
rolling/forming process. This process breaks down grains and allows them to regrow as smaller grains
as the steel cools (Selzer 2013). Grain refinement is also affected by thermal conditions—high
reheating temperatures results in grain growth and eventually produces larger grains (Selzer 2013).
Micro-alloying requires a controlled cooling after rolling. Selzer (Selzer 2013) reported an ideal
cooling rate of around 300 oF/min (149 oC/min) for maximizing strength gains. If the cooling rate is
excessively slow, newly formed grains grow after forming, coarsening the grain structure and as a
result lower strength steel is formed. On the other hand, too rapid cooling rate reduces the
effectiveness of the micro-alloy (Selzer 2013). In the mill production of reinforcing bars, smaller bar
sizes are rolled more times than larger bar sizes to induce additional grain refinement. Increased
rolling results in more rounded stress-strain curves in smaller bars sizes compared to larger bar sizes
(Selzer 2013). Heat-treating bars usually tends to increase the yield strength at higher ratios than the
tensile strength, resulting in a lower tension to yield ratio (T/Y) values (Selzer 2013). ASTM A706
reinforcement requires a T/Y ratio of 1.25. Grade 80 reinforcement strengths are also produced by
using existing processes for producing Grade 60 reinforcement but it needs addition of micro-alloys
(Nissen 2013).Producers of reinforcement have to think about requirements for both minimum and
maximum yield strengths, ultimate tensile strengths, and elongations. Hence, the reinforcement
producers normally produce an average strength larger than three standard deviations to make sure
that the produced bars meet minimum specified standards. The goal is to produce reinforcement with
higher strengths, while still having the required ductility levels and low-cycle fatigue behavior.
Mander et al. (Mander et al. 1994b) reported in a study on the low-cycle fatigue performance of
conventional ASTM A615 Grade 40 ([40 ksi] 280 MPa) reinforcing bars and ASTM A722 Grade 157
(157 ksi [1080 MPa]) high-strength prestressing threaded bars. All bars were tested to simulate their
seismic performance in structural concrete members. The researchers concluded that a stress greater
than yield can be sustained over the entire compression range if the lateral support spacing is less than
or equal to six longitudinal bar diameters in confined structural concrete members (Mander et al.
1994). If the spacing is larger than this, the reinforcement yields (Mander et al. 1994). The six
longitudinal bar diameter spacing may therefore can be considered as an ultimate limit controlling
spacing of HSS reinforcement when used as transverse reinforcement, but further research is needed.
Mander et al. (Mander et al. 1994) also reported that the peak cycle stress dropped quickly in the first
few cycles (softening occurs) for the high-strength prestressing bars, while on the other hand, the
Grade 40 showed hardening over the first few cycles. This result may provide insight on the use of
HSS reinforcing bars. The test results indicated that the displacement ductility (ratio of the ultimate
strain to the yield strain) of the HSS threaded bar was no more than 17 percent of the deformed mild-
steel bar. This appears to be a large contribution to the specification limits on the strength of
reinforcement. However, the researchers noted that the prestressing threaded bar (i.e., HSS) are
designed for ultimate tensile strengths and not yield properties. This indicates that HSS deformed bars
designed for both ultimate and yield strengths have prospective for use as reinforcement for concrete
members if the required displacement ductility can be achieved. Moreover, the test results also
indicated that HSS exhibited greater energy dissipation capacity when compared to the conventional
strength steel (Mander et al. 1994). Although promising, but the point to be noted that the energy
dissipation is also a function of the number of reinforcing bars. One objective of using HSS

6
reinforcement could be to reduce the amount of reinforcing bars needed—reducing reinforcing bars
could result in reduced energy dissipation..A study was conducted by Link on columns which showed
that the columns constructed with Grade 60 reinforcement exhibited larger hysteretic energy
dissipation than the columns constructed with Grade 80 reinforcement (Link 2014). However, he
also concluded that this occurred as the energy dissipation is primarily a function of the amount
of longitudinal reinforcement and column stiffness rather than a function of the reinforcement
grade (Link 2014).
Dodd and Restrepo-Posada (1995) reported that the tension and compression cyclic stress-strain
performance of reinforcement is symmetric up to necking (point of plastic instability). The modulus
of elasticity of mill produced steel reinforcement is reduced after the steel has been strained further
than the elastic limit—this is recognized as the Bauschinger effect (Bauschinger 1887). Dodd and
Restrepo-Posada (1995) concluded that the shape of the Bauschinger effect is not reliant on the
monotonic stress-strain curve. However the researchers did conclude that the shape of the
Bauschinger effect is reliant on carbon content—an increase in carbon content softens (less bilinear)
the Bauschinger curve. This is undoubtedly an important finding when assessing the effect of HSS.
Historically, a common method to increase the strength of the steel was to add more carbon.
Rodriguez et al. (Rodriguez et al. 1999) conducted a study expanding on the work of Dodd and
Restrepo-Posada. The researchers further investigated the effects of buckling in the reverse cyclic
loading of steel reinforcement. Longitudinal reinforcement in RC structural elements may experience
large tension and compression strain reversals during massive earthquakes (Rodriguez et al. 1999). If
inadequate tie spacing exists and is combined with large tension and compression strain reversals in
the inelastic range, buckling of longitudinal reinforcement can take place (Rodriguez et al. 1999). The
researchers concluded that the onset of buckling of a reinforcing bar subjected to cyclic loading may
occur after a reversal from tension and is dependent of the maximum value of the tensile strain prior
to the reversal. When this occurs, buckling of the reinforcement is supposed to occur on the tension
side of the hysteresis cycle (Rodriguez et al. 1999). A significant finding of the research was that the
maximum obtainable curvature could be overestimated when buckling is not included in the
compression stress-strain steel model for a reinforced concrete element (Rodriguez at al. 1999). This
indicates that the increased tensile capacity of the reinforcing bar may not be fully utilized due to
effect of buckling, which determines the fracture strain under reversed cyclic loading.
2.4 RECOGNIZED DUCTILE GRADES OF STEEL
The Geneva based International Standards Organization (ISO) under the guidance of the World Trade
Organization (WTO) played a crucial role in the internationalization of material standards. Today the
European Community nations follow general material specifications for thousands of items.
Therefore, reinforcing steel is no exception (Firoze 2010). The international standard for reinforcing
bar specification is ISO 6935. Within the umbrella of the ISO 6935 standard, a new generation of high
strength reinforcing steels has been developed which is now being used in all high grade construction
where safety and performance under unfavorable conditions are of prime concern (Firoze 2010). The
unique feature of these steels is that the yield strength and ultimate strength not only have a minimum
lower limit, but also have a maximum upper limit. In contrast the ASTM 615 bars had only minimum
yield and ultimate strength requirements but no specified upper limits.
Firoze (Firoze 2010) has made a list of some of the more internationally recognized ‘Ductile’ also
literally known as earthquake grades of steel are shown below :
7
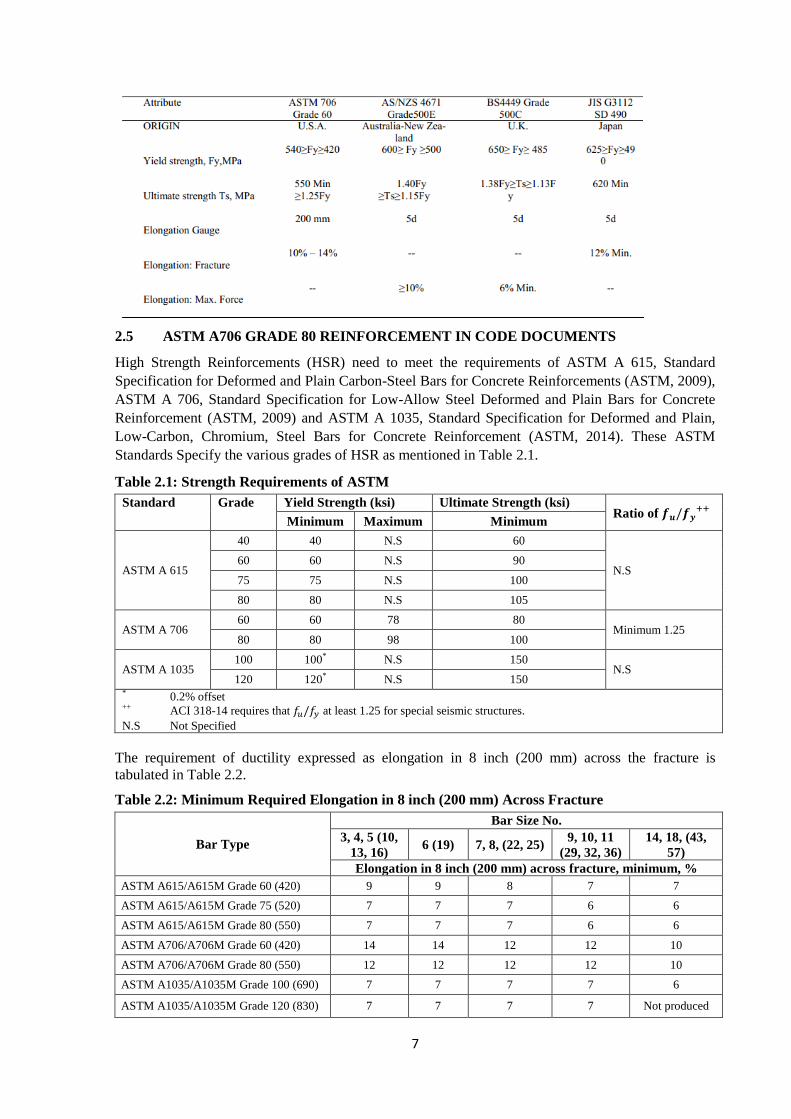
2.5 ASTM A706 GRADE 80 REINFORCEMENT IN CODE DOCUMENTS
High Strength Reinforcements (HSR) need to meet the requirements of ASTM A 615, Standard
Specification for Deformed and Plain Carbon-Steel Bars for Concrete Reinforcements (ASTM, 2009),
ASTM A 706, Standard Specification for Low-Allow Steel Deformed and Plain Bars for Concrete
Reinforcement (ASTM, 2009) and ASTM A 1035, Standard Specification for Deformed and Plain,
Low-Carbon, Chromium, Steel Bars for Concrete Reinforcement (ASTM, 2014). These ASTM
Standards Specify the various grades of HSR as mentioned in Table 2.1.
Table 2.1: Strength Requirements of ASTM
Standard Grade Yield Strength (ksi) Ultimate Strength (ksi) Ratio of
Minimum Maximum Minimum
ASTM A 615
40 40 N.S 60
N.S 60 60 N.S 90
75 75 N.S 100
80 80 N.S 105
ASTM A 706 60 60 78 80
Minimum 1.25 80 80 98 100
ASTM A 1035 100 100* N.S 150
N.S 120 120* N.S 150
* 0.2% offset ++ ACI 318-14 requires that at least 1.25 for special seismic structures.
N.S Not Specified
The requirement of ductility expressed as elongation in 8 inch (200 mm) across the fracture is
tabulated in Table 2.2.
Table 2.2: Minimum Required Elongation in 8 inch (200 mm) Across Fracture
Bar Type
Bar Size No.
3, 4, 5 (10,
13, 16) 6 (19) 7, 8, (22, 25)
9, 10, 11
(29, 32, 36)
14, 18, (43,
57)
Elongation in 8 inch (200 mm) across fracture, minimum, %
ASTM A615/A615M Grade 60 (420) 9 9 8 7 7
ASTM A615/A615M Grade 75 (520) 7 7 7 6 6
ASTM A615/A615M Grade 80 (550) 7 7 7 6 6
ASTM A706/A706M Grade 60 (420) 14 14 12 12 10
ASTM A706/A706M Grade 80 (550) 12 12 12 12 10
ASTM A1035/A1035M Grade 100 (690) 7 7 7 7 6
ASTM A1035/A1035M Grade 120 (830) 7 7 7 7 Not produced
8
2.5.1 ODOT Bridge Design Manual
The Oregon Department of Transportation’s (ODOT’s) Bridge Design and Drafting Manual (BDDM)
permits the use of A706 Grade 80 in bridge decks, drilled shafts, crossbeams and end beams, but
explicitly restricts use of A706 Grade 80 reinforcement in members which are designed for plastic
seismic performance (such as bridge columns)” (ODOT 2012). However, in this document ODOT
acknowledges that A706 Grade 80 reinforcement has similar ductility characteristics compared to
Grade 60 reinforcement. It is reported that ODOT restricts the use of A706 Grade 80 in members
designed for plastic seismic performance caused by a lack of testing of reinforcing bars and of full-
scale structural elements (ODOT 2012). ODOT also limits the maximum yield strength of spirals to
60 ksi (420 MPa) for determining the spiral pitch (ODOT 2012). This is because allowing yield
strength of spirals equal to 80 ksi (550 MPa) could potentially raise the spiral pitch resulting in a
longer unbraced length of reinforcing bar following the column concrete cover spalls. Because
reinforcing bar buckling may govern, the increase in strength may not balance for the increase in the
braced length. Design alterations may be necessary.
2.5.2 AASHTO Design Specifications
2.5.2.1 Load and Resistance Factor Design (LRFD)
The American Association of State Highway and Transportation Officials LRFD Bridge Design
Specifications (AASHTO LRFD BDS) (ASSHTO 2012) limits the yield strength exercised for design
purposes to 75.0 ksi (520 MPa). AASHTO limits the design strength of transverse reinforcement to
the stress corresponding to a strain of 0.0035 and not to go beyond 75 ksi (AASHTO 2012). This
restriction could be owing to lack of research data on the performance of members designed with
higher grade of steel.
2.5.2.2 LRFD Seismic Bridge Design
AASHTO Guide Specifications for LRFD Seismic Bridge Design (AASHTO LRFD SBD) states that
reinforcing steel used for Seismic Design Categories (SDC) B, C, and D can have an ultimate tensile
strength of up to 250 ksi (1,720 MPa) as long as it can be confirmed through testing that the low-cycle
fatigue properties are equal to or superior than usual grade reinforcement allowed by the code
(AASHTO 2011). AASHTO (ASSHTO 2012) also requires A706 reinforcement to be used in any
member where plastic hinging is anticipated for SDC D. This would avoid the use of all high strength
steels except for ASTM A706 Grade 80 in elements for example bridge columns where plastic hinges
are expected to form. However, it is confirmed that Grade 80 reinforcement exceeds the maximum
yield stress for members designed to form a plastic hinge.
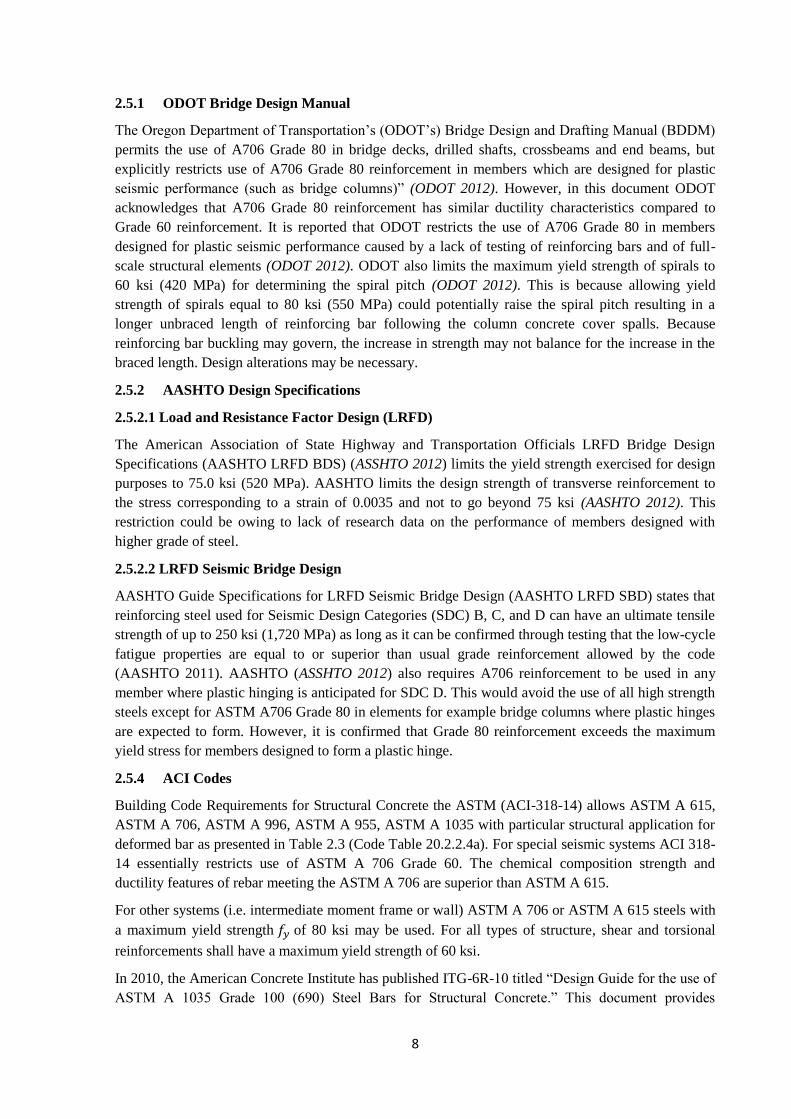
2.5.4 ACI Codes
Building Code Requirements for Structural Concrete the ASTM (ACI-318-14) allows ASTM A 615,
ASTM A 706, ASTM A 996, ASTM A 955, ASTM A 1035 with particular structural application for
deformed bar as presented in Table 2.3 (Code Table 20.2.2.4a). For special seismic systems ACI 318-
14 essentially restricts use of ASTM A 706 Grade 60. The chemical composition strength and
ductility features of rebar meeting the ASTM A 706 are superior than ASTM A 615.
For other systems (i.e. intermediate moment frame or wall) ASTM A 706 or ASTM A 615 steels with
a maximum yield strength of 80 ksi may be used. For all types of structure, shear and torsional
reinforcements shall have a maximum yield strength of 60 ksi.
In 2010, the American Concrete Institute has published ITG-6R-10 titled “Design Guide for the use of
ASTM A 1035 Grade 100 (690) Steel Bars for Structural Concrete.” This document provides

9
guideline to the engineers to design Various Structural Components like beams, columns, slab,
systems, walls, footings pile caps and mat foundations using steel of (690 MPa).
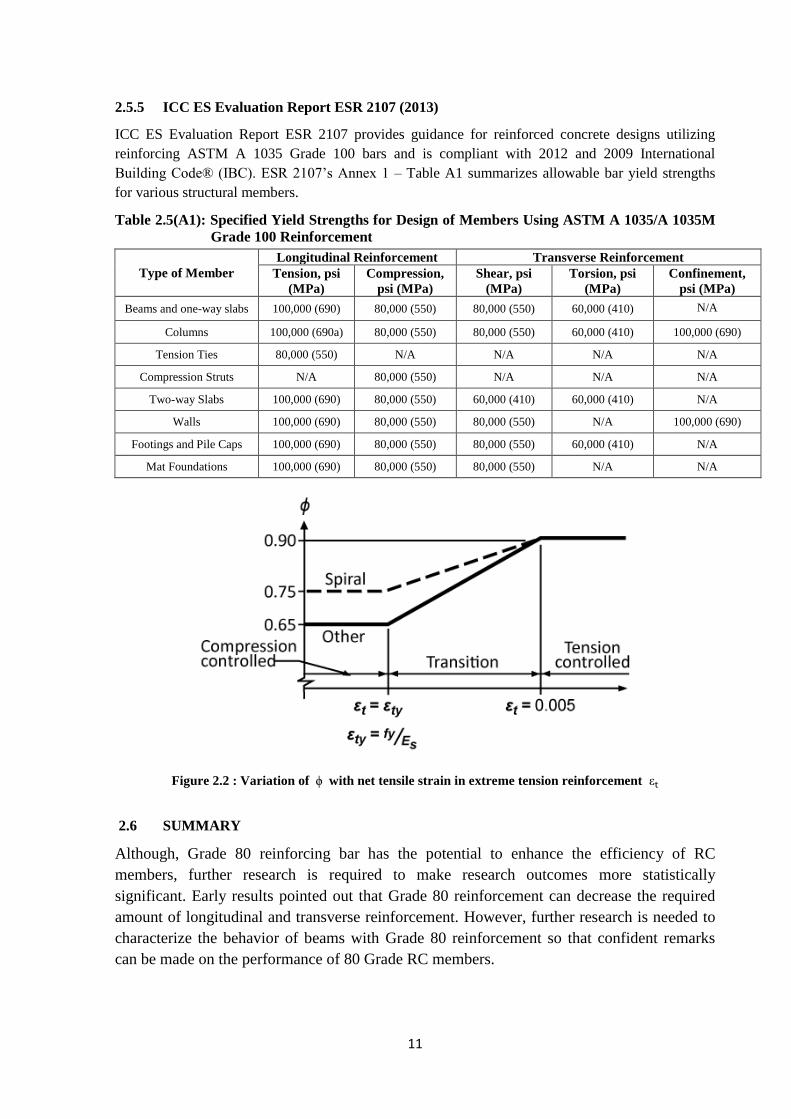
Following the same methodology as that of members reinforced with conventional steel bars with use
of strength reduction factor . The factor is to be based on appropriate strain limits of 0.004 and
0.009 for compression controlled and tension controlled criteria (Figure 2.1).
Figure 2.1: Strain distribution and net tensile strain in a nonprestressed member
To ensure strain compatibility with concrete, design strength for rebars in compression is limited to 80
ksi (550 MPa). Based on research outcomes [ref], it is shown that development and splice lengths can
be curtailed following ACI 318-08 provisions for confined splices. However, the modified equation in
ACI 408 R-03 Bond and Development of Straight Reinforcing Bars in tension are satisfactory for use
of grade 100 steel in both confined and unconfined splices.
From full scale beam tests, Munikrishna (2008) and Sumpter et. at. (2009) supports the use of Grade
100 (690) bars as shear reinforcement using 1350 hook and considering . For such case,
crack widths have been found to be higher than those for shear reinforcement designed with
(415 MPa) but at service load, crack widths were less than the commonly acceptable limit of
0.016 in (0.41 mm). ITG-6R-10 allows use of (550 MPa) for design of shear
reinforcement when shear cracking (within acceptable limit) is not critical. It also recognizes that for
minimizing shear cracking should be limited to 60 ksi (410 MPa) (as is the current limit in ACI-
318-14).
As the current study is on flexural behavior of beams, the relevant section of ACI-318-14 (chapter 9)
needs to be followed. In Chapter 9 (Beams) of ACI-318-14, a limit for overall beam depth h is
provided (Table 2.4 .)These limits are applicable for nonprestressed beams, with yield strength (fy) of
reinforcing bar equal or less than 60,000 psi and not supporting or attached to partitions or other
construction likely to be damaged by large deflections. For fy other than 60,000 psi, the expressions in
Table 2.4 shall be multiplied by (0.4 + fy/100,000). The modification for fy is approximate, but should
provide conservative results for typical reinforcement ratios and for values of fy between 40,000 and
80,000 psi.
Table2.4: Minimum depth of nonprestressed beams [ACI 318-14]
Support condition Minimum h[1]
Simply supported ℓ/16
One end continuous ℓ/18.5
Both ends continuous ℓ/21
Cantilever ℓ/8
10
Table 2.3: Nonprestressed Deformed Reinforcement
Usage Application Maximum Value of
or Permitted for
Design Calculations, psi
Applicable ASTM Specification
Deformed Bars Deformed Wires Welded Wire
Reinforcement
Welded Deformed
Bar Mats
Flexure, axial force; and
shrinkage and temperature
Special seismic systems 60,000 Refer to 20.2.2.5 Not Permitted Not Permitted Not Permitted
Other 80,000 A615, A706, A955, A996 A1064, A1022 A1064, A1022 A 184[1]
Lateral support of
longitudinal bars; or
concrete confinement
Special seismic systems 100,000 A615, A706, A955, A996,
A1035
A1064, A1022 A1064[2], A1022[2] Not Permitted
Spirals 100,000 A615, A706, A955, A996,
A1035
A1064, A1022 Not Permitted Not Permitted
Other 80,000 A615, A706, A955, A996 A1064, A1022 A1064, A1022 Not Permitted
Shear
Special seismic systems 60,000 A615, A706, A955, A996 A1064, A1022 A1064[2], A1022[2] Not Permitted
Spirals 60,000 A615, A706, A955, A996 A1064, A1022 Not Permitted Not Permitted
Shear friction 60,000 A615, A706, A955, A996 A1064, A1022 A1064, A1022 Not Permitted
Stirrups, ties, hoops 60,000 A615, A706, A955, A996 A1064, A1022 A1064 and A1022
welded plain wire
Not Permitted
80,000 Not Permitted Not Permitted A1064 and A1022
welded deformed wire
Not Permitted
Torsion Longitudinal and transverse 60,000 A615, A706, A955, A996 A1064, A1022 A1064, A1022 Not Permitted
[1] Welded deformed bar mats shall be permitted to be assembled using A615 or A706 deformed bars. [2] ASTM A1064 and A1022 are not permitted in special seismic where the weld is required to resist stresses in response to confinement, lateral support of longitudinal bars, shear, or other actions.
11
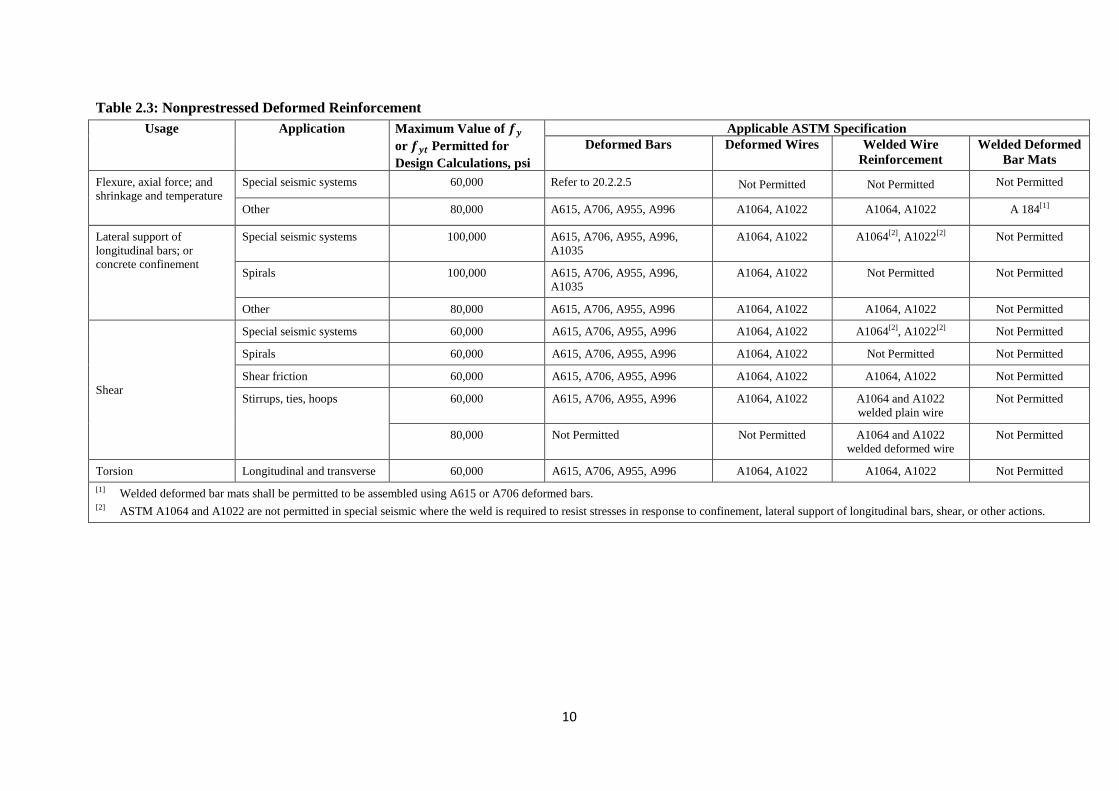
2.5.5 ICC ES Evaluation Report ESR 2107 (2013)
ICC ES Evaluation Report ESR 2107 provides guidance for reinforced concrete designs utilizing
reinforcing ASTM A 1035 Grade 100 bars and is compliant with 2012 and 2009 International
Building Code® (IBC). ESR 2107’s Annex 1 – Table A1 summarizes allowable bar yield strengths
for various structural members.
Table 2.5(A1): Specified Yield Strengths for Design of Members Using ASTM A 1035/A 1035M
Grade 100 Reinforcement
Type of Member
Longitudinal Reinforcement Transverse Reinforcement
Tension, psi
(MPa)
Compression,
psi (MPa)
Shear, psi
(MPa)
Torsion, psi
(MPa)
Confinement,
psi (MPa)
Beams and one-way slabs 100,000 (690) 80,000 (550) 80,000 (550) 60,000 (410) N/A
Columns 100,000 (690a) 80,000 (550) 80,000 (550) 60,000 (410) 100,000 (690)
Tension Ties 80,000 (550) N/A N/A N/A N/A
Compression Struts N/A 80,000 (550) N/A N/A N/A
Two-way Slabs 100,000 (690) 80,000 (550) 60,000 (410) 60,000 (410) N/A
Walls 100,000 (690) 80,000 (550) 80,000 (550) N/A 100,000 (690)
Footings and Pile Caps 100,000 (690) 80,000 (550) 80,000 (550) 60,000 (410) N/A
Mat Foundations 100,000 (690) 80,000 (550) 80,000 (550) N/A N/A
Figure 2.2 : Variation of ϕ with net tensile strain in extreme tension reinforcement
2.6 SUMMARY
Although, Grade 80 reinforcing bar has the potential to enhance the efficiency of RC
members, further research is required to make research outcomes more statistically
significant. Early results pointed out that Grade 80 reinforcement can decrease the required
amount of longitudinal and transverse reinforcement. However, further research is needed to
characterize the behavior of beams with Grade 80 reinforcement so that confident remarks
can be made on the performance of 80 Grade RC members.

12
CHAPTER 3
EXPERIMENTAL PROGRAM
3.1 GENERAL
The main objective of this experimental program is to investigate the flexural behaviors of Grade 80
steel as reinforcement for concrete structures. A total of thirty half-scale rectangular concrete beams
were tested. Eighteen of them were reinforced with Grade 80 steel and twelve of them were reinforced
with Grade 60 steel. For both reinforcement types, the steel ratio and concrete strength have been
varied for each category of specimen three identical samples were prepared and tested. A total of three
batches of concrete were used for Grade 80 samples, design compressive strength for first and second
batch was 4000 psi and 6000 psi for the third batch. On the other hand, two batches of concrete were
used for Grade 60 samples with design compressive strength of 4000 and 6000 psi respectively. For
each concrete batch, two different types of reinforcement ratios were selected, one type is slightly
over 75% of the maximum reinforcement ratio and the other type is slightly less than 60% of the
maximum reinforcement ratio. All specimens were loaded up to failure using a two point flexural test
under monotonic loading condition. The main variables are the reinforcement ratio and compressive
strength of concrete. The overall performance of the tested specimens was evaluated based on the
overall flexural behavior. The parameters used to evaluate flexural performance were:
(a) Flexural cracking load
(b) Crack pattern and crack width
(c) Deflection under load
(d) Ultimate flexural strength
(e) Failure mode
3.2 TEST SPECIMENS
In this section, design of the specimens, flexural reinforcement, and shear reinforcement are
discussed.
3.2.1 Design of the Specimens
All specimens were designed to have a half-scale dimension to simulate typical field behavior of
concrete beam applications. The selected dimensions were 6 inches (150 mm) wide, 9.5 inches (241
mm) deep and 8.5 feet (2590 mm) long. All beams were designed to achieve the minimum strain in
the steel of 0.005 in/in at nominal load capacity. The reinforcement ratios for all beams satisfied the
minimum and maximum value recommended by ACI 318-14 [1].All beams were designed to comply
with ACI-318-14 code requirement for under reinforced beams (ϵs= 0.005 in/in). Table 3.1
summarizes the test matrix.
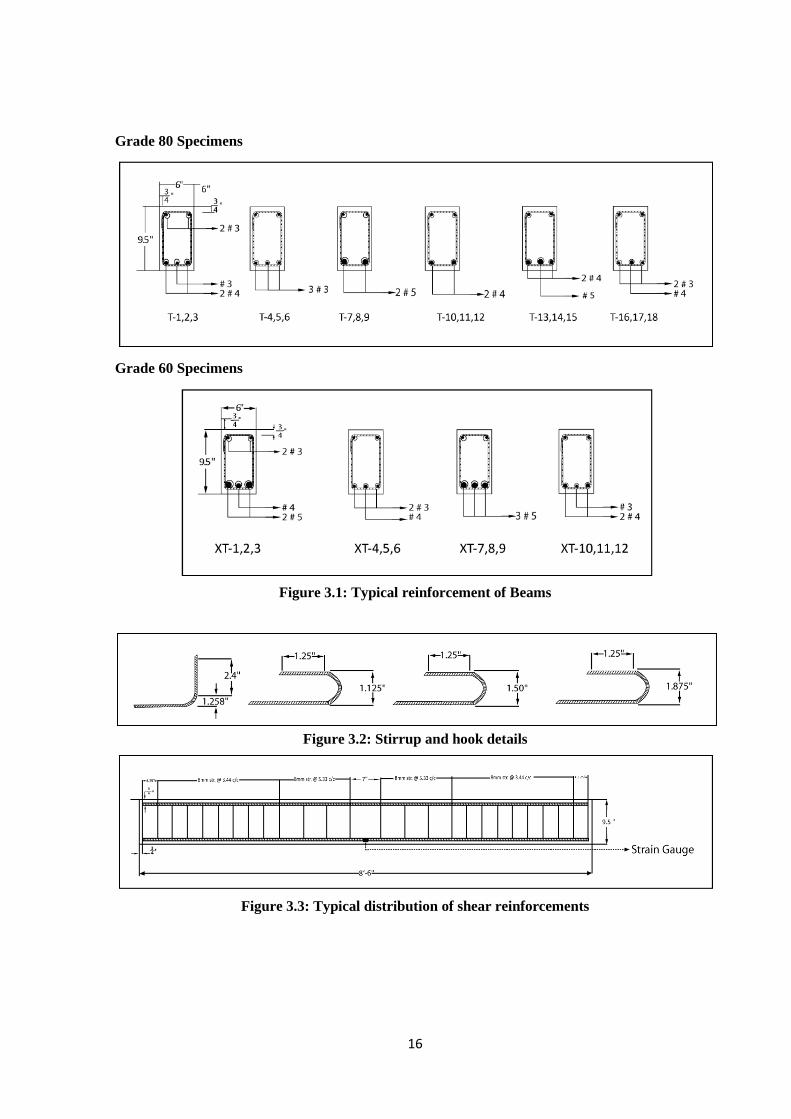
3.2.2 Flexural Reinforcement
All beams were reinforced as singly reinforced beam as summarized in Table 3.1. Two types of
longitudinal steel were used as flexural reinforcement conforming to ASTM A706 Grade 60 and
ASTM A706 Grade 80.
Two #3 longitudinal rebars were used as compression reinforcement for all beams to simplify the
construction of the steel cage. Figure 3.1 illustrates the typical reinforcement for beams.
13
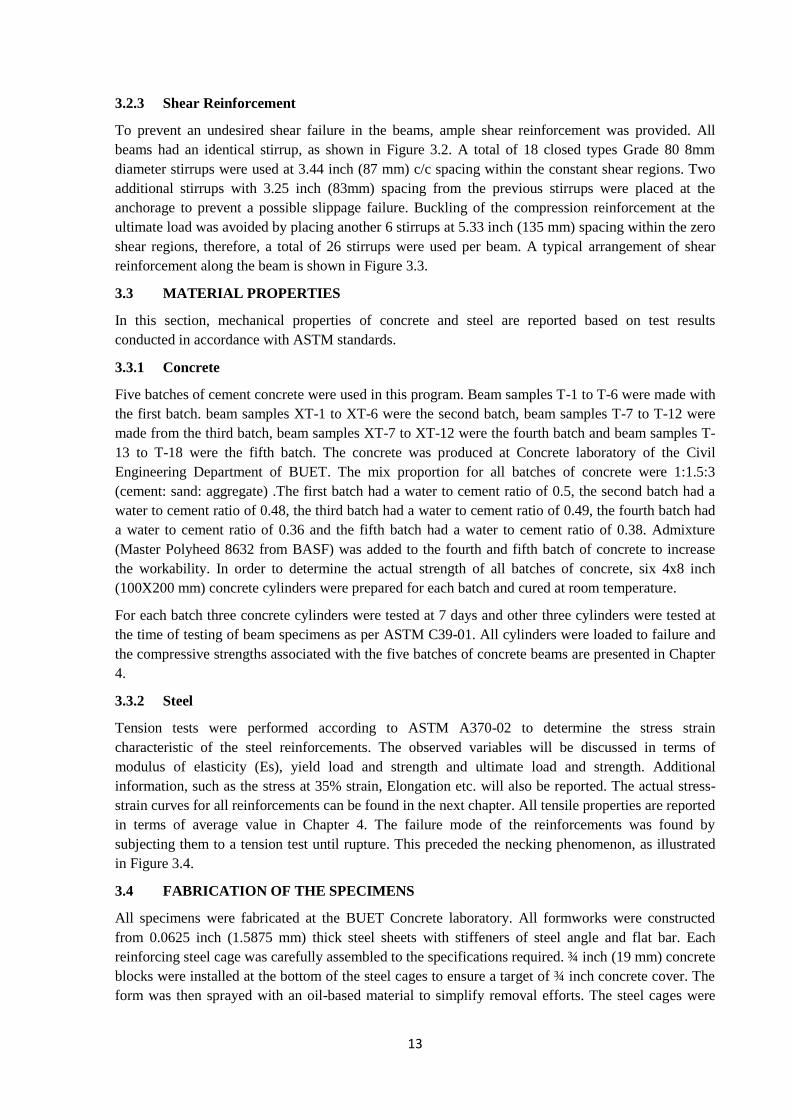
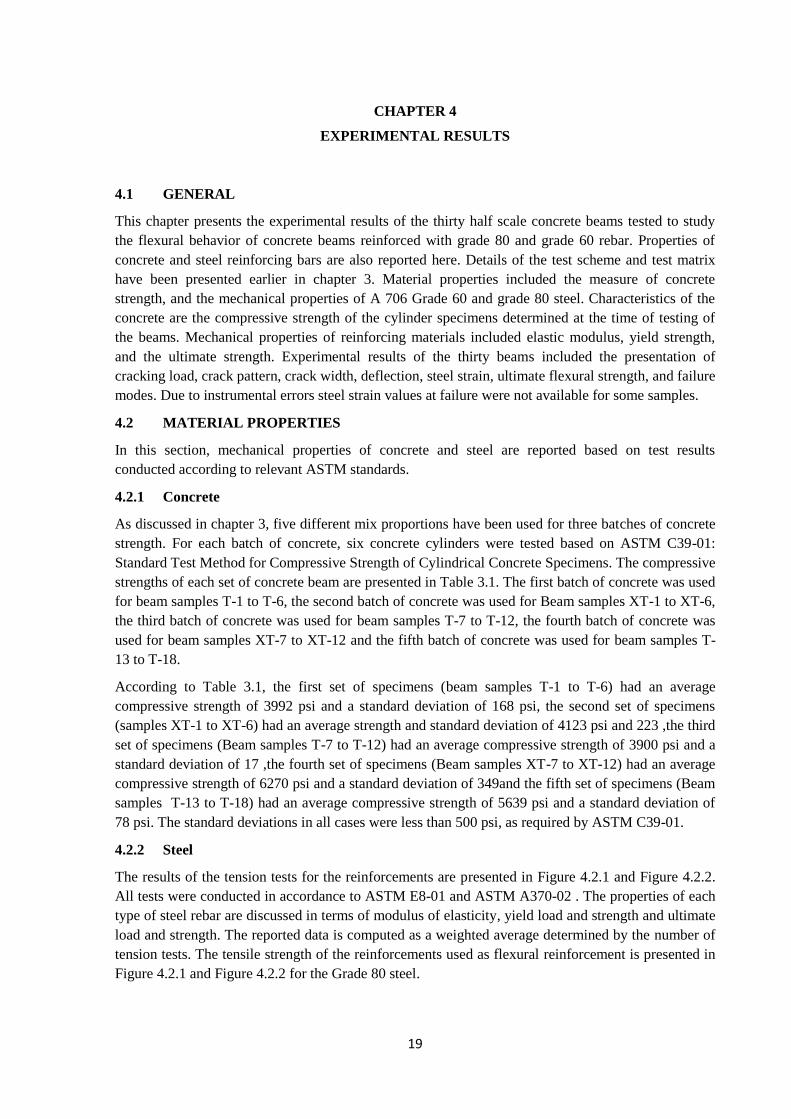
3.2.3 Shear Reinforcement
To prevent an undesired shear failure in the beams, ample shear reinforcement was provided. All
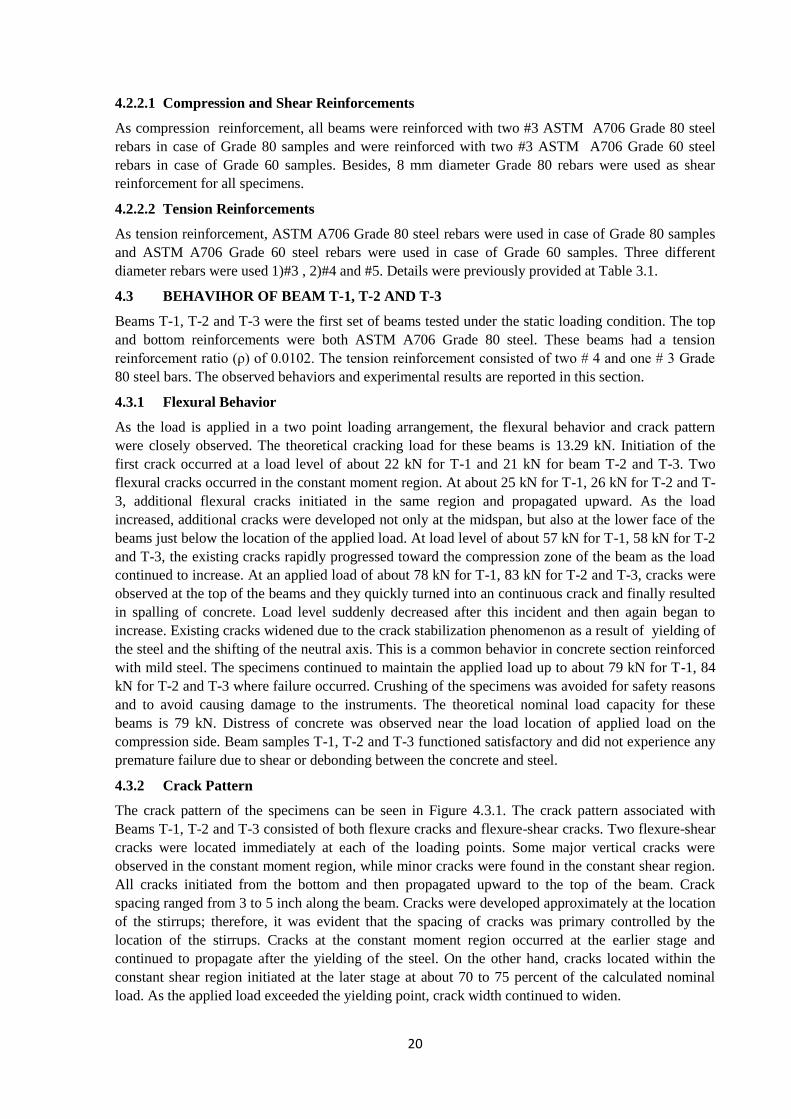
beams had an identical stirrup, as shown in Figure 3.2. A total of 18 closed types Grade 80 8mm
diameter stirrups were used at 3.44 inch (87 mm) c/c spacing within the constant shear regions. Two
additional stirrups with 3.25 inch (83mm) spacing from the previous stirrups were placed at the
anchorage to prevent a possible slippage failure. Buckling of the compression reinforcement at the
ultimate load was avoided by placing another 6 stirrups at 5.33 inch (135 mm) spacing within the zero
shear regions, therefore, a total of 26 stirrups were used per beam. A typical arrangement of shear
reinforcement along the beam is shown in Figure 3.3.
3.3 MATERIAL PROPERTIES
In this section, mechanical properties of concrete and steel are reported based on test results
conducted in accordance with ASTM standards.
3.3.1 Concrete
Five batches of cement concrete were used in this program. Beam samples T-1 to T-6 were made with
the first batch. beam samples XT-1 to XT-6 were the second batch, beam samples T-7 to T-12 were
made from the third batch, beam samples XT-7 to XT-12 were the fourth batch and beam samples T-
13 to T-18 were the fifth batch. The concrete was produced at Concrete laboratory of the Civil
Engineering Department of BUET. The mix proportion for all batches of concrete were 1:1.5:3
(cement: sand: aggregate) .The first batch had a water to cement ratio of 0.5, the second batch had a
water to cement ratio of 0.48, the third batch had a water to cement ratio of 0.49, the fourth batch had
a water to cement ratio of 0.36 and the fifth batch had a water to cement ratio of 0.38. Admixture
(Master Polyheed 8632 from BASF) was added to the fourth and fifth batch of concrete to increase
the workability. In order to determine the actual strength of all batches of concrete, six 4x8 inch
(100X200 mm) concrete cylinders were prepared for each batch and cured at room temperature.
For each batch three concrete cylinders were tested at 7 days and other three cylinders were tested at
the time of testing of beam specimens as per ASTM C39-01. All cylinders were loaded to failure and
the compressive strengths associated with the five batches of concrete beams are presented in Chapter
4.
3.3.2 Steel
Tension tests were performed according to ASTM A370-02 to determine the stress strain
characteristic of the steel reinforcements. The observed variables will be discussed in terms of
modulus of elasticity (Es), yield load and strength and ultimate load and strength. Additional
information, such as the stress at 35% strain, Elongation etc. will also be reported. The actual stress-
strain curves for all reinforcements can be found in the next chapter. All tensile properties are reported
in terms of average value in Chapter 4. The failure mode of the reinforcements was found by
subjecting them to a tension test until rupture. This preceded the necking phenomenon, as illustrated
in Figure 3.4.
3.4 FABRICATION OF THE SPECIMENS
All specimens were fabricated at the BUET Concrete laboratory. All formworks were constructed
from 0.0625 inch (1.5875 mm) thick steel sheets with stiffeners of steel angle and flat bar. Each
reinforcing steel cage was carefully assembled to the specifications required. ¾ inch (19 mm) concrete
blocks were installed at the bottom of the steel cages to ensure a target of ¾ inch concrete cover. The
form was then sprayed with an oil-based material to simplify removal efforts. The steel cages were

14
then placed in the form. All the reinforcement cages were placed bottom side upwards and top side
downwards to ensure safety of the strain gages during the casting of concrete. A series of bracing was
installed at the top of the form. The bracings were located at 34 inches (863.6 mm) spacing to ensure
proper dimensions of the beam, as shown in Figure 3.5. The form was moved to the pouring site.
Concrete was prepared using mixing machine at BUET concrete laboratory. Slump tests were
performed within 2.5 minutes after obtaining the sample as stated in ASTM C143-00 . This process
was crucial for determining the workability of the concrete.
The casting of the specimens began soon after the slump test. The finishing process followed shortly.
At the same time, six 4x8 inch (100X200 mm) cylinders were prepared to obtain the strength
parameters for each batch of concrete. Figure 3.10 illustrates the casting process of the concrete
specimen. The beams and cylinders were left to cure in the same condition by wrapping with moist
hessian cloth. The beams were stripped at the time of testing.
3.5 INSTRUMENTATION
All beams were fully instrumented to measure the applied loads on the beams, deflections associated
with loading, and strains in steel, as illustrated in Figure 3.7. Loading data associated with time was
recorded in the loading machine. An electrical resistance strain gage was installed at the location of
the maximum stress on two of the bottom steel reinforcements to measure strain in the tension steel.
This location was calculated to be at the midspan of the reinforcing bar. A mechanical deflectometer
was placed just below the midpoint of the beam .The whole procedure was recorded in a video
camera. Table 3.2 gives the precise location and function of each device.
3.6 TESTING PROCEDURE
3.6.1 Test Setup
After curing period, all beams were moved to perform of a two point flexural test. Each beam was
tested to failure by a Universal Testing Machine (UTM). A tested specimen was placed on two steel
members placed on the hydraulic platform of the machine. A steel pin support was carefully set
between the specimen and the steel member at a distance of 3 inches (75 mm) from the right end of
the beam, while a steel roller support was positioned at the same distance but at the left end of the
beam. The details of the support are presented in Fig 3.7.The hydraulic platform was raised during
testing. The setup was carefully leveled and aligned to prevent any source of errors due to the lateral
eccentricity. The loading rollers were installed on the top of the concrete beam at 32 inches (812.8
mm) from each support. Geotextile sheets were provided below each roller to ensure an even
distribution of the concentrated load.
3.6.2 Preparation for Testing
After the specimen was properly positioned, strain gages were connected to the data acquisition
system. Prior to testing, deflectometer was manually checked to verify the operational condition. The
data acquisition system was thoroughly checked. Figure 3.8 illustrates beam prior to loading.
3.6.3 Testing
All beams were monotonically tested to failure by the Universal Testing Machine (UTM). The
specimens were subjected to a two-point static loading at a constant rate. Loading rates were selected
to meet the requirements of ASTM C 293-02. At the time of testing, load and strain information was
displayed on the screen of the data acquisition system and was carefully monitored. Crack
propagation and crack width were visually observed and measured manually via crack comparator
during the tests.

15
Table 3.1: Details of Beam Specimens Prepared for Testing
Grade 80 specimens:
Specimen
name
(For 80
Grade)
(psi)
Bottom
Reinforcement
Top
Reinforcement ρ
ρmax
ρ/ρmax
ρmin φ ϵt
Nominal
Moment
Mu( kft)
T-1 3990 One #3,Two #4 Two #3 0.0102 0.0135 0.76 0.0025 0.9 0.0050 23.72
T-2 3990 One #3,Two #4 Two #3 0.0102 0.0135 0.76 0.0025 0.9 0.0050 23.72
T-3 3990 One #3,Two #4 Two #3 0.0102 0.0135 0.76 0.0025 0.9 0.0050 23.72
T-4 3990 Three #3 Two #3 0.0067 0.0135 0.50 0.0025 0.9 0.0050 16.29
T-5 3990 Three #3 Two #3 0.0067 0.0135 0.50 0.0025 0.9 0.0050 16.29
T-6 3990 Three #3 Two #3 0.0067 0.0135 0.50 0.0025 0.9 0.0050 16.29
T-7 3900 Two #5 Two #3 0.0126 0.0132 0.96 0.0025 0.9 0.0050 27.68
T-8 3900 Two #5 Two #3 0.0126 0.0132 0.96 0.0025 0.9 0.0050 27.68
T-9 3900 Two #5 Two #3 0.0126 0.0132 0.96 0.0025 0.9 0.0050 27.68
T-10 3900 Two #4 Two #3 0.0080 0.0132 0.59 0.0025 0.9 0.0050 18.87
T-11 3900 Two #4 Two #3 0.0080 0.0132 0.59 0.0025 0.9 0.0050 18.87
T-12 3900 Two #4 Two #3 0.0080 0.0132 0.59 0.0025 0.9 0.0050 18.87
T-13 5640 One #5,Two #5 Two #3 0.0143 0.0173 0.83 0.00282 0.9 0.0050 33.04
T-14 5640 One #5,Two #5 Two #3 0.0143 0.0173 0.83 0.00282 0.9 0.0050 33.04
T-15 5640 One #5,Two #5 Two #3 0.0143 0.0173 0.83 0.00282 0.9 0.0050 33.04
T-16 5640 One #4,Two #3 Two #3 0.0085 0.0173 0.49 0.00282 0.9 0.0050 20.78
T-17 5640 One #4,Two #3 Two #3 0.0085 0.0173 0.49 0.00282 0.9 0.0050 20.78
T-18 5640 One #4,Two #3 Two #3 0.0085 0.0173 0.49 0.00282 0.9 0.0050 20.78
Grade 60 specimens:
Specimen
name
(For 60
Grade)
(psi)
Bottom
Reinforcement
Top
Reinforcement
Nominal
Moment
Mu( kft)
XT-1 4120 One #4,Two #5 Two #3 0.0166 0.0185 0.0033 0.90 0.9 0.0050 27.8
XT-2 4120 One #4,Two #5 Two #3 0.0166 0.0185 0.0033 0.90 0.9 0.0050 27.8
XT-3 4120 One #4,Two #5 Two #3 0.0166 0.0185 0.0033 0.90 0.9 0.0050 27.8
XT-4 4120 One #4,Two #3 Two #3 0.0085 0.0185 0.0033 0.46 0.9 0.0050 15.44
XT-5 4120 One #4,Two #3 Two #3 0.0085 0.0185 0.0033 0.46 0.9 0.0050 15.44
XT-6 4120 One #4,Two #3 Two #3 0.0085 0.0185 0.0033 0.46 0.9 0.0050 15.44
XT-7 6270 Three #5 Two #3 0.0189 0.0243 0.00398 0.77 0.9 0.0050 32.96
XT-8 6270 Three #5 Two #3 0.0189 0.0243 0.00398 0.77 0.9 0.0050 32.96
XT-9 6270 Three #5 Two #3 0.0189 0.0243 0.00398 0.77 0.9 0.0050 32.96
XT-10 6270 One #3,Two #4 Two #3 0.0102 0.0243 0.00398 0.42 0.9 0.0050 18.98
XT-11 6270 One #3,Two #4 Two #3 0.0102 0.0243 0.00398 0.42 0.9 0.0050 18.98
XT-12 6270 One #3,Two #4 Two #3 0.0102 0.0243 0.00398 0.42 0.9 0.0050 18.98
Table 3.2: Summary of Location, and Function of Each Device
Device Location Function
Deflectometer At the middle of the beam Measure deflection
Strain Gage Left Bottom rebar Measure steel strain
Strain Gage Right Bottom rebar Measure steel strain
16
Grade 80 Specimens
Grade 60 Specimens
Figure 3.1: Typical reinforcement of Beams
Figure 3.2: Stirrup and hook details
Figure 3.3: Typical distribution of shear reinforcements

17
Figure 3.4: Type of failure on the tested rebar
Figure 3.5: Steel cage and form
Figure 3.6: Casting and finishing of the specimen

18
Figure 3.7: Experimental setup
Figure 3.8: Typical Beam setup
19
CHAPTER 4
EXPERIMENTAL RESULTS
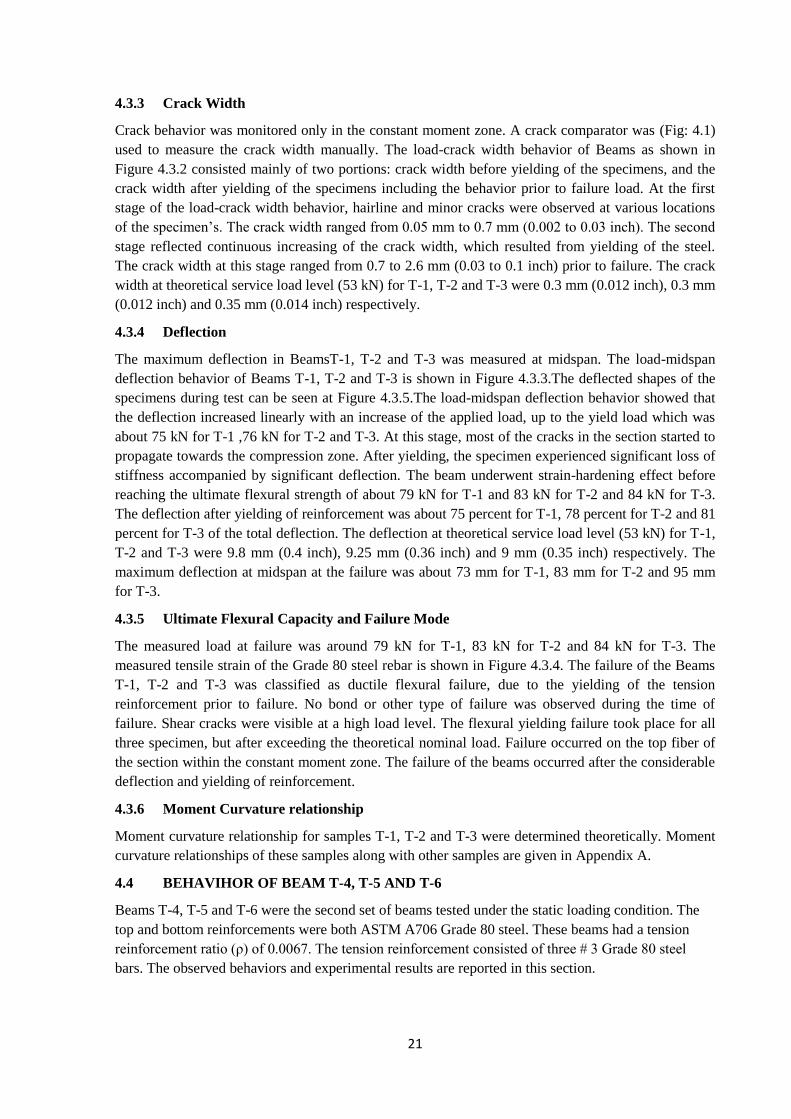
4.1 GENERAL
This chapter presents the experimental results of the thirty half scale concrete beams tested to study
the flexural behavior of concrete beams reinforced with grade 80 and grade 60 rebar. Properties of
concrete and steel reinforcing bars are also reported here. Details of the test scheme and test matrix
have been presented earlier in chapter 3. Material properties included the measure of concrete
strength, and the mechanical properties of A 706 Grade 60 and grade 80 steel. Characteristics of the
concrete are the compressive strength of the cylinder specimens determined at the time of testing of
the beams. Mechanical properties of reinforcing materials included elastic modulus, yield strength,
and the ultimate strength. Experimental results of the thirty beams included the presentation of
cracking load, crack pattern, crack width, deflection, steel strain, ultimate flexural strength, and failure
modes. Due to instrumental errors steel strain values at failure were not available for some samples.
4.2 MATERIAL PROPERTIES
In this section, mechanical properties of concrete and steel are reported based on test results
conducted according to relevant ASTM standards.
4.2.1 Concrete
As discussed in chapter 3, five different mix proportions have been used for three batches of concrete
strength. For each batch of concrete, six concrete cylinders were tested based on ASTM C39-01:
Standard Test Method for Compressive Strength of Cylindrical Concrete Specimens. The compressive
strengths of each set of concrete beam are presented in Table 3.1. The first batch of concrete was used
for beam samples T-1 to T-6, the second batch of concrete was used for Beam samples XT-1 to XT-6,
the third batch of concrete was used for beam samples T-7 to T-12, the fourth batch of concrete was
used for beam samples XT-7 to XT-12 and the fifth batch of concrete was used for beam samples T-
13 to T-18.
According to Table 3.1, the first set of specimens (beam samples T-1 to T-6) had an average
compressive strength of 3992 psi and a standard deviation of 168 psi, the second set of specimens
(samples XT-1 to XT-6) had an average strength and standard deviation of 4123 psi and 223 ,the third
set of specimens (Beam samples T-7 to T-12) had an average compressive strength of 3900 psi and a
standard deviation of 17 ,the fourth set of specimens (Beam samples XT-7 to XT-12) had an average
compressive strength of 6270 psi and a standard deviation of 349and the fifth set of specimens (Beam
samples T-13 to T-18) had an average compressive strength of 5639 psi and a standard deviation of
78 psi. The standard deviations in all cases were less than 500 psi, as required by ASTM C39-01.
4.2.2 Steel
The results of the tension tests for the reinforcements are presented in Figure 4.2.1 and Figure 4.2.2.
All tests were conducted in accordance to ASTM E8-01 and ASTM A370-02 . The properties of each
type of steel rebar are discussed in terms of modulus of elasticity, yield load and strength and ultimate
load and strength. The reported data is computed as a weighted average determined by the number of
tension tests. The tensile strength of the reinforcements used as flexural reinforcement is presented in
Figure 4.2.1 and Figure 4.2.2 for the Grade 80 steel.
20
4.2.2.1 Compression and Shear Reinforcements
As compression reinforcement, all beams were reinforced with two #3 ASTM A706 Grade 80 steel
rebars in case of Grade 80 samples and were reinforced with two #3 ASTM A706 Grade 60 steel
rebars in case of Grade 60 samples. Besides, 8 mm diameter Grade 80 rebars were used as shear
reinforcement for all specimens.
4.2.2.2 Tension Reinforcements
As tension reinforcement, ASTM A706 Grade 80 steel rebars were used in case of Grade 80 samples
and ASTM A706 Grade 60 steel rebars were used in case of Grade 60 samples. Three different
diameter rebars were used 1)#3 , 2)#4 and #5. Details were previously provided at Table 3.1.
4.3 BEHAVIHOR OF BEAM T-1, T-2 AND T-3
Beams T-1, T-2 and T-3 were the first set of beams tested under the static loading condition. The top
and bottom reinforcements were both ASTM A706 Grade 80 steel. These beams had a tension
reinforcement ratio (ρ) of 0.0102. The tension reinforcement consisted of two # 4 and one # 3 Grade
80 steel bars. The observed behaviors and experimental results are reported in this section.
4.3.1 Flexural Behavior
As the load is applied in a two point loading arrangement, the flexural behavior and crack pattern
were closely observed. The theoretical cracking load for these beams is 13.29 kN. Initiation of the
first crack occurred at a load level of about 22 kN for T-1 and 21 kN for beam T-2 and T-3. Two
flexural cracks occurred in the constant moment region. At about 25 kN for T-1, 26 kN for T-2 and T-
3, additional flexural cracks initiated in the same region and propagated upward. As the load
increased, additional cracks were developed not only at the midspan, but also at the lower face of the
beams just below the location of the applied load. At load level of about 57 kN for T-1, 58 kN for T-2
and T-3, the existing cracks rapidly progressed toward the compression zone of the beam as the load
continued to increase. At an applied load of about 78 kN for T-1, 83 kN for T-2 and T-3, cracks were
observed at the top of the beams and they quickly turned into an continuous crack and finally resulted
in spalling of concrete. Load level suddenly decreased after this incident and then again began to
increase. Existing cracks widened due to the crack stabilization phenomenon as a result of yielding of
the steel and the shifting of the neutral axis. This is a common behavior in concrete section reinforced
with mild steel. The specimens continued to maintain the applied load up to about 79 kN for T-1, 84
kN for T-2 and T-3 where failure occurred. Crushing of the specimens was avoided for safety reasons
and to avoid causing damage to the instruments. The theoretical nominal load capacity for these
beams is 79 kN. Distress of concrete was observed near the load location of applied load on the
compression side. Beam samples T-1, T-2 and T-3 functioned satisfactory and did not experience any
premature failure due to shear or debonding between the concrete and steel.
4.3.2 Crack Pattern
The crack pattern of the specimens can be seen in Figure 4.3.1. The crack pattern associated with
Beams T-1, T-2 and T-3 consisted of both flexure cracks and flexure-shear cracks. Two flexure-shear
cracks were located immediately at each of the loading points. Some major vertical cracks were
observed in the constant moment region, while minor cracks were found in the constant shear region.
All cracks initiated from the bottom and then propagated upward to the top of the beam. Crack
spacing ranged from 3 to 5 inch along the beam. Cracks were developed approximately at the location
of the stirrups; therefore, it was evident that the spacing of cracks was primary controlled by the
location of the stirrups. Cracks at the constant moment region occurred at the earlier stage and
continued to propagate after the yielding of the steel. On the other hand, cracks located within the
constant shear region initiated at the later stage at about 70 to 75 percent of the calculated nominal
load. As the applied load exceeded the yielding point, crack width continued to widen.
21
4.3.3 Crack Width
Crack behavior was monitored only in the constant moment zone. A crack comparator was (Fig: 4.1)
used to measure the crack width manually. The load-crack width behavior of Beams as shown in
Figure 4.3.2 consisted mainly of two portions: crack width before yielding of the specimens, and the
crack width after yielding of the specimens including the behavior prior to failure load. At the first
stage of the load-crack width behavior, hairline and minor cracks were observed at various locations
of the specimen’s. The crack width ranged from 0.05 mm to 0.7 mm (0.002 to 0.03 inch). The second
stage reflected continuous increasing of the crack width, which resulted from yielding of the steel.
The crack width at this stage ranged from 0.7 to 2.6 mm (0.03 to 0.1 inch) prior to failure. The crack
width at theoretical service load level (53 kN) for T-1, T-2 and T-3 were 0.3 mm (0.012 inch), 0.3 mm
(0.012 inch) and 0.35 mm (0.014 inch) respectively.
4.3.4 Deflection
The maximum deflection in BeamsT-1, T-2 and T-3 was measured at midspan. The load-midspan
deflection behavior of Beams T-1, T-2 and T-3 is shown in Figure 4.3.3.The deflected shapes of the
specimens during test can be seen at Figure 4.3.5.The load-midspan deflection behavior showed that
the deflection increased linearly with an increase of the applied load, up to the yield load which was
about 75 kN for T-1 ,76 kN for T-2 and T-3. At this stage, most of the cracks in the section started to
propagate towards the compression zone. After yielding, the specimen experienced significant loss of
stiffness accompanied by significant deflection. The beam underwent strain-hardening effect before
reaching the ultimate flexural strength of about 79 kN for T-1 and 83 kN for T-2 and 84 kN for T-3.
The deflection after yielding of reinforcement was about 75 percent for T-1, 78 percent for T-2 and 81
percent for T-3 of the total deflection. The deflection at theoretical service load level (53 kN) for T-1,
T-2 and T-3 were 9.8 mm (0.4 inch), 9.25 mm (0.36 inch) and 9 mm (0.35 inch) respectively. The
maximum deflection at midspan at the failure was about 73 mm for T-1, 83 mm for T-2 and 95 mm
for T-3.
4.3.5 Ultimate Flexural Capacity and Failure Mode
The measured load at failure was around 79 kN for T-1, 83 kN for T-2 and 84 kN for T-3. The
measured tensile strain of the Grade 80 steel rebar is shown in Figure 4.3.4. The failure of the Beams
T-1, T-2 and T-3 was classified as ductile flexural failure, due to the yielding of the tension
reinforcement prior to failure. No bond or other type of failure was observed during the time of
failure. Shear cracks were visible at a high load level. The flexural yielding failure took place for all
three specimen, but after exceeding the theoretical nominal load. Failure occurred on the top fiber of
the section within the constant moment zone. The failure of the beams occurred after the considerable
deflection and yielding of reinforcement.
4.3.6 Moment Curvature relationship
Moment curvature relationship for samples T-1, T-2 and T-3 were determined theoretically. Moment
curvature relationships of these samples along with other samples are given in Appendix A.
4.4 BEHAVIHOR OF BEAM T-4, T-5 AND T-6
Beams T-4, T-5 and T-6 were the second set of beams tested under the static loading condition. The
top and bottom reinforcements were both ASTM A706 Grade 80 steel. These beams had a tension
reinforcement ratio (ρ) of 0.0067. The tension reinforcement consisted of three # 3 Grade 80 steel
bars. The observed behaviors and experimental results are reported in this section.

22
4.4.1 Flexural Behavior
As the load is applied in a two point loading arrangement, the flexural behavior and crack pattern was
closely observed. The theoretical cracking load for these beams is 13.29 kN. Initiation of the first
crack occurred at a load level of about 19 kN for T-4, 12 kN for T-5 and 17 kN for T-6. Two flexural
cracks occurred in the constant moment region. At around 24 kN for T-4, 17 kN for T-5 and 22 kN for
T-6, additional flexural cracks initiated in the same region and propagated upward. As the load
increased, additional cracks were developed not only at the midspan, but also at the lower face of the
beams just below the location of the applied load. At load level of about 54 kN for T-4, 44 kN for T-5
and 56 kN for T-6 the existing cracks rapidly progressed toward the compression zone of the beam as
the load continued to increase. At an applied load of about 66 kN for T-4, 65 kN for T-5 and 64 kN
for T-6 cracks were observed at the top of the beams and they quickly turned into a continuous crack
and finally resulted in spalling of concrete. Load level suddenly decreased after this incident and then
again began to increase. Existing cracks widened due to the crack stabilization phenomenon due to
yielding of the steel and the shifting of the neutral axis. This is a common behavior in concrete section
reinforced with mild steel. The specimen continued to maintain the applied load up to about 65 kN for
T-4 and T-6, 66 kN for T-5 where failure occurred. Crushing of the specimens was avoided for safety
reasons and to avoid causing damage to the instruments. The theoretical unfactored nominal load
capacity for these beams is 54.4 kN. Distress of concrete was observed near the location of applied
load on the compression side. Beam samples T-4, T-5 and T-6 functioned satisfactory and did not
experience any premature failure due to shear or debonding between the concrete and steel.
4.4.2 Crack Pattern
The crack pattern of the specimens can be seen in Figure 4.4.1. The crack pattern associated with
Beams T-4, T-5 and T-6 consisted of both flexure cracks and flexure-shear cracks. Two flexure-shear
cracks were located immediately at each of the loading points. Some major vertical cracks were
observed in the constant moment region, while minor cracks were found in the constant shear region.
All cracks initiated from the bottom and then propagated upward to the top of the beam. Crack
spacing ranged from 3 to 5 inch along the beam. Cracks were developed approximately at the location
of the stirrups; therefore, it was evident that the spacing of cracks was primary controlled by the
location of the stirrups. Cracks at the constant moment region occurred at the earlier stage and
continued to propagate after the yielding of the steel. On the other hand, cracks located within the
constant shear region initiated at the later stage at about 70 to 75 percent of the calculated nominal
load. As the applied load exceeded the yielding point, crack width continued to widen.
4.4.3 Crack Width
Crack behavior was monitored only in the constant moment zone. A crack comparator (Fig: 4.1) was
used to measure the crack width manually. The load-crack width behavior of Beams T-4, T-5 and T-6
as shown in Figure 4.4.2 consisted mainly of two portions: crack width before yielding of the
specimens, and the crack width after yielding of the specimens including the behavior prior to failure
load. At the first stage of the load-crack width behavior, hairline and minor cracks were observed
throughout the specimen. The crack width ranged from 0.05mm to 0.5 mm (0.002 to 0.02 inch). The
second stage reflected continuous increasing of the crack width, which resulted from yielding of the
steel. The crack width at this stage ranged from 0.5 to 4.1 mm (0.02 to 0.16 inch) prior to failure. The
crack width at theoretical service load level (36 kN) for T-4, T-5 and T-6 were 0.2 mm (0.008 inch),
0.25 mm (0.01 inch) and 0.2 mm (0.008 inch) respectively.

23
4.4.4 Deflection
The maximum deflection in Beams T-4, T-5 and T-6 was measured at midspan. The load-midspan
deflection behavior of Beams T-4, T-5 and T-6 is shown in Figure 4.4.3. The deflected shapes of the
specimens during test can be seen at Figure 4.4.5.The load-midspan deflection behavior showed that
the deflection increased linearly with an increase of the applied load, up to the yield load which was
about 59 kN for T-4, 62 kN for T-5 and T-6. At this stage, most of the cracks in the section started to
propagate towards the compression zone. After yielding, the specimen experienced significant loss of
stiffness accompanied by significant deflection. The beams underwent strain-hardening effect before
reaching the ultimate flexural strength of about 65 kN for T-4 and T-6, 66 kN for T-5. The total
deflection after yielding of reinforcement was about 80 percent of the total deflection for T-4, 85
percent for T-5 and 88 percent for T-6 of the total deflection. The deflection at theoretical service load
level (36 kN) for T-4, T-5 and T-6 were 6.8 mm (0.27 inch), 6.4 mm (0.25 inch) and 6.5mm (0.26
inch) respectively. The maximum deflection at midspan at the failure was about 91 mm for T-4, 121
mm for T-5 and 143 mm for T-6.
4.4.5 Ultimate Flexural Capacity and Failure Mode
The measured load at failure was about 65 kN for T-4 and T-6, 66 kN for T-5. The measured tensile
strain of the Grade 80 steel rebar is shown in Figure 4.4.4. The failure of the Beams T-4, T-5 and T-6
was classified as ductile flexural failure, due to the yielding of the tension reinforcement prior to
failure. No bond or other type of failure was observed during the time of failure. Shear cracks were
visible at a high load level. The flexural yielding failure took place for all three specimen, but after
exceeding the theoretical nominal load. Failure occurred on the top fiber of the section within the
constant moment zone. The failure of the beams occurred after the considerable deflection and
yielding of reinforcement.
4.5 BEHAVIHOR OF BEAM XT-1, XT-2 AND XT-3
Beams XT-1, XT-2 and XT-3were the first set of beam Specimens reinforced with Grade 60 rebars
and third set of beams tested under the static loading condition. The top and bottom reinforcements
were both ASTM A706 Grade 60 steel. These beams had a tension reinforcement ratio (ρ) of 0.0166.
The tension reinforcement consisted of two # 5 and one #4 Grade60 steel bars. The observed
behaviors and experimental results are reported in this section.
4.5.1 Flexural Behavior
As the load is applied in a two point loading arrangement, the flexural behavior and crack pattern was
closely observed. The theoretical cracking load for this beam is 13.5 kN. Initiation of the first crack
occurred at a load level of about24kN for XT-1 and XT-3, 26 kN for beam XT-2. Two flexural cracks
occurred in the constant moment region. At about 34 kN for XT-1 and XT-3, 36 kN for beam XT-2,
additional flexural cracks initiated in the same region and propagated upward. As the load increased,
additional cracks were developed not only at the midspan, but also at the lower face of the beams just
below the location of the applied load. At load level of about 79kN for XT-1, 77kN for XT-2 and 75
kN for XT-3, the existing cracks rapidly progressed toward the compression zone of the beam as the
load continued to increase. At an applied load of about 96 kN for XT-1, 86 kN for XT-2 and 92 kN
for XT-3, cracks were observed at the top of the beams and they quickly turned into an continuous
crack and finally resulted in spalling of concrete. Load level suddenly decreased after this incident and
then again began to increase. Existing cracks widened due to the crack stabilization phenomenon due
to yielding of the steel and the shifting of the neutral axis. This is a common behavior in concrete
section reinforced with mild steel. The specimens continued to maintain the applied load up to about
97 kN for XT-1, 93 kN for XT-2 and XT-3 where failure occurred. Crushing of the specimens was

24
avoided for safety reasons and to avoid causing damage to the instruments. The theoretical unfactored
nominal load capacity for these beams is 92.8kN.Distress of concrete was observed near the location
of applied load on the compression side. Beam samples XT-1, XT-2 and XT-3 functioned satisfactory
and did not experience any premature failure due to shear or debonding between the concrete and
steel.
4.5.2 Crack Pattern
The crack pattern of the specimens can be seen in Figure 4.5.1. The crack pattern associated with
Beams XT-1, XT-2 and XT-3 consisted of both flexure cracks and flexure-shear cracks. Two flexure-
shear cracks were located immediately at each of the loading points. Some major vertical cracks were
observed in the constant moment region, while minor cracks were found in the constant shear region.
All cracks initiated from the bottom and then propagated upward to the top of the beam. Crack
spacing ranged from 3 to 5 inch along the beam. Cracks were developed approximately at the location
of the stirrups; therefore, it was evident that the spacing of cracks was primary controlled by the
location of the stirrups. Cracks at the constant moment region occurred at the earlier stage and
continued to propagate after the yielding of the steel. On the other hand, cracks located within the
constant shear region initiated at the later stage at about 80 to 85 percent of the calculated nominal
load. As the applied load exceeded the yielding point, crack width continued to widen.
4.5.3 Crack Width
Crack behavior was monitored only in the constant moment zone. A crack comparator was used to
measure the crack width manually. The load-crack width behavior of Beams as shown in Figure 4.5.2
consisted mainly of two portions: crack width before yielding of the specimens, and the crack width
after yielding of the specimens including the behavior prior to failure load. At the first stage of the
load-crack width behavior, hairline and minor cracks were observed at various locations of the
specimens. The crack width ranged from 0.05mm to 0.5 mm (0.002 to 0.02 inch). The second stage
reflected continuous increasing of the crack width, which resulted from yielding of the steel. The
crack width at this stage ranged from 0.5 to 2.5 mm (0.02 to 0.1 inch) prior to failure. The crack width
at theoretical service load level (62 kN) for XT-1, XT-2 and XT-3 were 0.25 mm (0.01 inch), 0.3 mm
(0.012 inch) and 0.3 mm (0.012 inch) respectively.
4.5.4 Deflection
The maximum deflection in Beams XT-1, XT-2 and XT-3 was measured at midspan. The load-
midspan deflection behavior of Beams XT-1, XT-2 and XT-3 is shown in Figure 4.5.3. The deflected
shapes of the specimens during test can be seen at Figure 4.5.5.The load-midspan deflection behavior
showed that the deflection increased linearly with an increase of the applied load, up to the yield load
which was about 88 kN for XT-1 ,84 kN for XT-2 and XT-3,. At this stage, most of the cracks in the
section started to propagate towards the compression zone. After yielding, the specimen experienced
significant loss of stiffness accompanied by significant deflection. The beam underwent strain-
hardening effect before reaching the ultimate flexural strength of about 92 kN for XT-1, 90 kN for
XT-2 and 88 kN for XT-3. The total deflection after yielding of reinforcement was about 54 percent
for XT-1, 51 percent for XT-2 and 63 percent for XT-3 of the total deflection. The deflection at
theoretical service load level (62 kN) for XT-1, XT-2 and XT-3 were 8.2 mm (0.32 inch), 8.5 mm
(0.335 inch) and 8.3 mm (0.334 inch) respectively. The maximum deflection at midspan at the failure
was about 33 mm for XT-1 and XT-2, 43 mm for XT-3.
4.5.5 Ultimate Flexural Capacity and Failure Mode
The measured load at failure was around 97 kN for XT-1, 93 kN for XT-2 and 94 kN for XT-3. The
measured tensile strain of the Grade 60 steel rebar is shown in Figure 4.5.4. The failure of the Beams

25
XT-1, XT-2 and XT-3 was classified as ductile flexural failure, due to the yielding of the tension
reinforcement prior to failure. No bond or other type of failure was observed during the time of
failure. Shear cracks were visible at a high load level. . The flexural yielding failure took place for all
three specimen, but after exceeding the theoretical nominal load. Failure occurred on the top fiber of
the section within the constant moment zone. The failure of the beams occurred after the considerable
deflection and yielding of reinforcement.
4.6 BEHAVIHOR OF BEAM XT-4, XT-5 AND XT-6
Beams XT-4, XT-5 and XT-6 were the second set of beam Specimens reinforced with Grade 60
rebars and fourth set of beams tested under the static loading condition. The top and bottom
reinforcements were both ASTM A706 Grade 60 steel. These beams had a tension reinforcement ratio
(ρ) of 0.0085. The tension reinforcement consisted of two # 3 and one # 4 Grade 60 steel bars. The
observed behaviors and experimental results are reported in this section.
4.6.1 Flexural Behavior
As the load is applied in a two point loading arrangement, the flexural behavior and crack pattern was
closely observed. The theoretical cracking load for these beams is 13.5kN. Initiation of the first crack
occurred at a load level of about 17 kN for XT-4 and XT-6, 16 kN for beam XT-5. Two flexural
cracks occurred in the constant moment region. At about 27 kN for XT-4 and XT-6, 25 kN for beam
XT-5, additional flexural cracks initiated in the same region and propagated upward. As the load
increased, additional cracks were developed not only at the midspan, but also at the lower face of the
beams just below the location of the applied load. At load level of about 53 kN for XT-4, 48 kN for
XT-5 and 56 kN for XT-6, the existing cracks rapidly progressed toward the compression zone of the
beam as the load continued to increase. At an applied load of about 54 kN for XT-4, 57 kN for XT-5
and 58 kN for XT-6, cracks were observed at the top of the beams and they quickly turned into a
continuous crack and finally resulted in spalling of concrete. Load level suddenly decreased after this
incident and then again began to increase. Existing cracks widened due to the crack stabilization
phenomenon due to yielding of the steel and the shifting of the neutral axis. This is a common
behavior in concrete section reinforced with mild steel. The specimens continued to maintain the
applied load up to about 55 kN for XT-4, 58 kN for XT-2 and 59 kN for XT-3 where failure occurred.
Crushing of the specimens was avoided for safety reasons and to avoid causing damage to the
instrumentation. The theoretical unfactored nominal load capacity for these beams is 51.5 kN.
Distress of concrete was observed near the location of applied load on the compression side. Beam
samples XT-4, XT-5 and XT-6 functioned satisfactory and did not experience any premature failure
due to shear or debonding between the concrete and steel.
4.6.2 Crack Pattern
The crack pattern of the specimens can be seen in Figure 4.6.1. The crack pattern associated with
Beams XT-4, XT-5 and XT-6 consisted of both flexure cracks and flexure-shear cracks. Two flexure-
shear cracks were located immediately at each of the loading points. Some major vertical cracks were
observed in the constant moment region, while minor cracks were found in the constant shear region.
All cracks initiated from the bottom and then propagated upward to the top of the beam. Crack
spacing ranged from 3 to 5 inch along the beam. Cracks were developed approximately at the location
of the stirrups; therefore, it was evident that the spacing of cracks was primary controlled by the
location of the stirrups. Cracks at the constant moment region occurred at the earlier stage and
continued to propagate after the yielding of the steel. On the other hand, cracks located within the
constant shear region initiated at the later stage at about 85 to 90 percent of the calculated nominal
load. As the applied load exceeded the yielding point, crack width continued to widen.
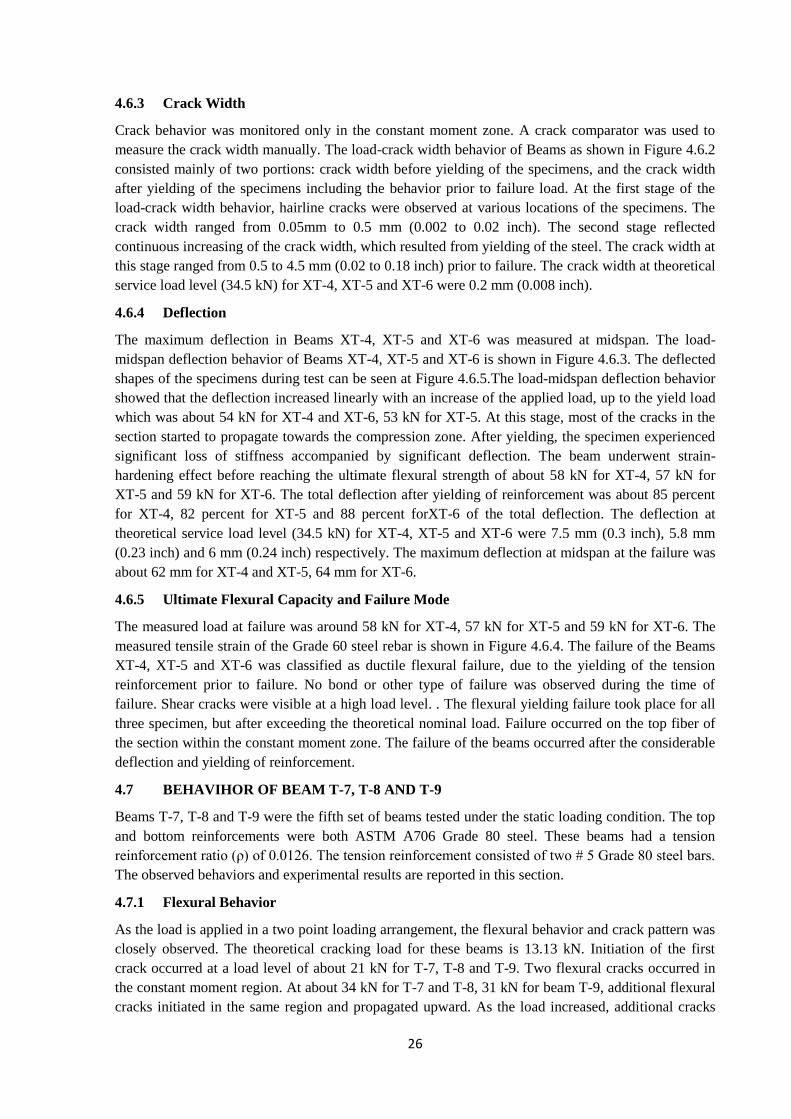
26
4.6.3 Crack Width
Crack behavior was monitored only in the constant moment zone. A crack comparator was used to
measure the crack width manually. The load-crack width behavior of Beams as shown in Figure 4.6.2
consisted mainly of two portions: crack width before yielding of the specimens, and the crack width
after yielding of the specimens including the behavior prior to failure load. At the first stage of the
load-crack width behavior, hairline cracks were observed at various locations of the specimens. The
crack width ranged from 0.05mm to 0.5 mm (0.002 to 0.02 inch). The second stage reflected
continuous increasing of the crack width, which resulted from yielding of the steel. The crack width at
this stage ranged from 0.5 to 4.5 mm (0.02 to 0.18 inch) prior to failure. The crack width at theoretical
service load level (34.5 kN) for XT-4, XT-5 and XT-6 were 0.2 mm (0.008 inch).
4.6.4 Deflection
The maximum deflection in Beams XT-4, XT-5 and XT-6 was measured at midspan. The load-
midspan deflection behavior of Beams XT-4, XT-5 and XT-6 is shown in Figure 4.6.3. The deflected
shapes of the specimens during test can be seen at Figure 4.6.5.The load-midspan deflection behavior
showed that the deflection increased linearly with an increase of the applied load, up to the yield load
which was about 54 kN for XT-4 and XT-6, 53 kN for XT-5. At this stage, most of the cracks in the
section started to propagate towards the compression zone. After yielding, the specimen experienced
significant loss of stiffness accompanied by significant deflection. The beam underwent strain-
hardening effect before reaching the ultimate flexural strength of about 58 kN for XT-4, 57 kN for
XT-5 and 59 kN for XT-6. The total deflection after yielding of reinforcement was about 85 percent
for XT-4, 82 percent for XT-5 and 88 percent forXT-6 of the total deflection. The deflection at
theoretical service load level (34.5 kN) for XT-4, XT-5 and XT-6 were 7.5 mm (0.3 inch), 5.8 mm
(0.23 inch) and 6 mm (0.24 inch) respectively. The maximum deflection at midspan at the failure was
about 62 mm for XT-4 and XT-5, 64 mm for XT-6.
4.6.5 Ultimate Flexural Capacity and Failure Mode
The measured load at failure was around 58 kN for XT-4, 57 kN for XT-5 and 59 kN for XT-6. The
measured tensile strain of the Grade 60 steel rebar is shown in Figure 4.6.4. The failure of the Beams
XT-4, XT-5 and XT-6 was classified as ductile flexural failure, due to the yielding of the tension
reinforcement prior to failure. No bond or other type of failure was observed during the time of
failure. Shear cracks were visible at a high load level. . The flexural yielding failure took place for all
three specimen, but after exceeding the theoretical nominal load. Failure occurred on the top fiber of
the section within the constant moment zone. The failure of the beams occurred after the considerable
deflection and yielding of reinforcement.
4.7 BEHAVIHOR OF BEAM T-7, T-8 AND T-9
Beams T-7, T-8 and T-9 were the fifth set of beams tested under the static loading condition. The top
and bottom reinforcements were both ASTM A706 Grade 80 steel. These beams had a tension
reinforcement ratio (ρ) of 0.0126. The tension reinforcement consisted of two # 5 Grade 80 steel bars.
The observed behaviors and experimental results are reported in this section.
4.7.1 Flexural Behavior
As the load is applied in a two point loading arrangement, the flexural behavior and crack pattern was
closely observed. The theoretical cracking load for these beams is 13.13 kN. Initiation of the first
crack occurred at a load level of about 21 kN for T-7, T-8 and T-9. Two flexural cracks occurred in
the constant moment region. At about 34 kN for T-7 and T-8, 31 kN for beam T-9, additional flexural
cracks initiated in the same region and propagated upward. As the load increased, additional cracks

27
were developed not only at the midspan, but also at the lower face of the beams just below the
location of the applied load. At load level of about 76 kN for T-7and T-9, 80 kN for T-8, the existing
cracks rapidly progressed toward the compression zone of the beam as the load continued to increase.
At an applied load of about 54 kN for T-7, 57 kN for T-8 and 58 kN for T-9, cracks were observed at
the top of the beams and they quickly turned into an continuous crack and finally resulted in spalling
of concrete. Load level suddenly decreased after this incident and then again began to increase.
Existing cracks widened due to the crack stabilization phenomenon due to yielding of the steel and the
shifting of the neutral axis. This is a common behavior in concrete section reinforced with mild steel.
The specimens continued to maintain the applied load up to about 94 kN for T-7 and T-9, 95 kN for
T-8 where failure occurred. Crushing of the specimens was avoided for safety reasons and to avoid
causing damage to the instrumentation. The theoretical unfactored nominal load capacity for these
beams is 92.4 kN. Distress of concrete was observed near the location of applied load on the
compression side. Beam samples T-7, T-8 and T-9 functioned satisfactory and did not experience any
premature failure due to shear or debonding between the concrete and steel.
4.7.2 Crack Pattern
The crack pattern of the specimens can be seen in Figure 4.7.1. The crack pattern associated with
Beams T-7, T-8 and T-9 consisted of both flexure cracks and flexure-shear cracks. Two flexure-shear
cracks were located immediately at each of the loading points. Some major vertical cracks were
observed in the constant moment region, while minor cracks were found in the constant shear region.
All cracks initiated from the bottom and then propagated upward to the top of the beam. Crack
spacing ranged from 3 to 5 inch along the beam. Cracks were developed approximately at the location
of the stirrups; therefore, it was evident that the spacing of cracks was primary controlled by the
location of the stirrups. Cracks at the constant moment region occurred at the earlier stage and
continued to propagate after the yielding of the steel. On the other hand, cracks located within the
constant shear region initiated at the later stage at about 80 to 85 percent of the calculated nominal
load. As the applied load exceeded the yielding point, crack width continued to widen.
4.7.3 Crack Width
Crack behavior was monitored only in the constant moment zone. A crack comparator was used to
measure the crack width manually. The load-crack width behavior of Beams as shown in Figure 4.7.2
consisted mainly of two portions: crack width before yielding of the specimens, and the crack width
after yielding of the specimen’s l including the behavior prior to failure load. At the first stage of the
load-crack width behavior, hairline cracks were observed at various locations of the specimens. The
crack width ranged from 0.05mm to 0.6 mm (0.002 to 0.024 inch). The second stage reflected
continuous increasing of the crack width, which resulted from yielding of the steel. The crack width at
this stage ranged from 0.6 to 3.2 mm (0.024 to 0.13 inch) prior to failure. The crack width at
theoretical service load level (62 kN) for T-7, T-8 and T-9 were 0.25 mm (0.01 inch), 0.3 mm (0.012
inch) and 0.3 mm (0.012 inch) respectively.
4.7.4 Deflection
The maximum deflection in Beams T-7, T-8 and T-9 was measured at midspan. The load-midspan
deflection behavior of Beams T-7, T-8 and T-9 is shown in Figure 4.7.3. The load-midspan deflection
behavior showed that the deflection increased linearly with an increase of the applied load, up to the
yield load which was about 89 kN for T-7, 93 kN for T-8 and T-9. At this stage, most of the cracks in
the section started to propagate towards the compression zone. After yielding, the specimen
experienced significant loss of stiffness accompanied by significant deflection. The beam underwent
strain-hardening effect before reaching the ultimate flexural strength of about 95 kN for T-7 and T-9,

28
96 kN for T-8. The total deflection after yielding of reinforcement was about 78 percent for T-7, 65
percent for T-8 and 68 percent for T- 9 of the total deflection. The deflection at theoretical service
load level (62 kN) for T-7, T-8 and T-9 were 9.2 mm (0.36 inch), 9.3 mm (0.36 inch) and 9 mm (0.35
inch) respectively. The maximum deflection at midspan at the failure was about 68 mm for T-7, 68
mm for T-8 and 58 mm for T-9.
4.7.5 Ultimate Flexural Capacity and Failure Mode
The measured load at failure was around 95 kN for T-7 and T-9, 96 kN for T-8.The measured tensile
strain of the Grade 80 steel rebar is shown in Figure 4.7.4. Due to instrumental error, steel strain data
of T-9 could not be obtained. The failure of the Beams T-7, T-8 and T-9 was classified as ductile
flexural failure, due to the yielding of the tension reinforcement prior to failure. No bond or other type
of failure was observed during the time of failure. Shear cracks were visible at a high load level. . The
flexural yielding failure took place for all three specimen , but after exceeding the theoretical nominal
load. Failure occurred on the top fiber of the section within the constant moment zone. The failure of
the beams occurred after the considerable deflection and yielding of reinforcement.
4.8 BEHAVIHOR OF BEAM T-10, T-11 AND T-12
Beams T-10, T-11 and T-12 were the sixth set of beams tested under the static loading condition. The
top and bottom reinforcements were both ASTM A706 Grade 80 steel. These beams had a tension
reinforcement ratio (ρ) of 0.0080. The tension reinforcement consisted of two # 4 Grade 80 steel bars.
The observed behaviors and experimental results are reported in this section.
4.8.1 Flexural Behavior
As the load is applied in a two point loading arrangement, the flexural behavior and crack pattern was
closely observed. The theoretical cracking load for these beams is 13.13 kN. Initiation of the first
crack occurred at a load level of about 17 kN for T-10, 16 kN for T-11 and T-12. Two flexural cracks
occurred in the constant moment region. At about 26 kN for T-10, 25 kN for beam T-11 and T-12,
additional flexural cracks initiated in the same region and propagated upward. As the load increased,
additional cracks were developed not only at the midspan, but also at the lower face of the beams just
below the location of the applied load. At load level of about 49 kN for T-10, 48 kN for beam T-11
and T-12, the existing cracks rapidly progressed toward the compression zone of the beam as the load
continued to increase. At an applied load of about 64 kN for T-10 and T-11, 65 kN for T-12, cracks
were observed at the top of the beams and they quickly turned into an continuous crack and finally
resulted in spalling of concrete. Load level suddenly decreased after this incident and then again
began to increase. Existing cracks widened due to the crack stabilization phenomenon due to yielding
of the steel and the shifting of the neutral axis. This is a common behavior in concrete section
reinforced with mild steel. The specimens continued to maintain the applied load up to about 64 kN
for T-10,65 kN for T-11and 66 kN for T-12 where failure occurred. Crushing of the specimens was
avoided for safety reasons and to avoid causing damage to the instrumentation. The theoretical
unfactored nominal load capacity for these beams is 63 kN. Distress of concrete was observed near
the location of applied load on the compression side. Beam samples T-10, T-11 and T-12 functioned
satisfactory and did not experience any premature failure due to shear or debonding between the
concrete and steel.
4.8.2 Crack Pattern
The crack pattern of the specimens can be seen in Figure 4.8.1. The crack pattern associated with
Beams T-10, T-11 and T-12 consisted of both flexure cracks and flexure-shear cracks. Two flexure-
shear cracks were located immediately at each of the loading points. Some major vertical cracks were
observed in the constant moment region, while minor cracks were found in the constant shear region.
All cracks initiated from the bottom and then propagated upward to the top of the beam. Crack
spacing ranged from 3 to 5 inch along the beam. Cracks were developed approximately at the location
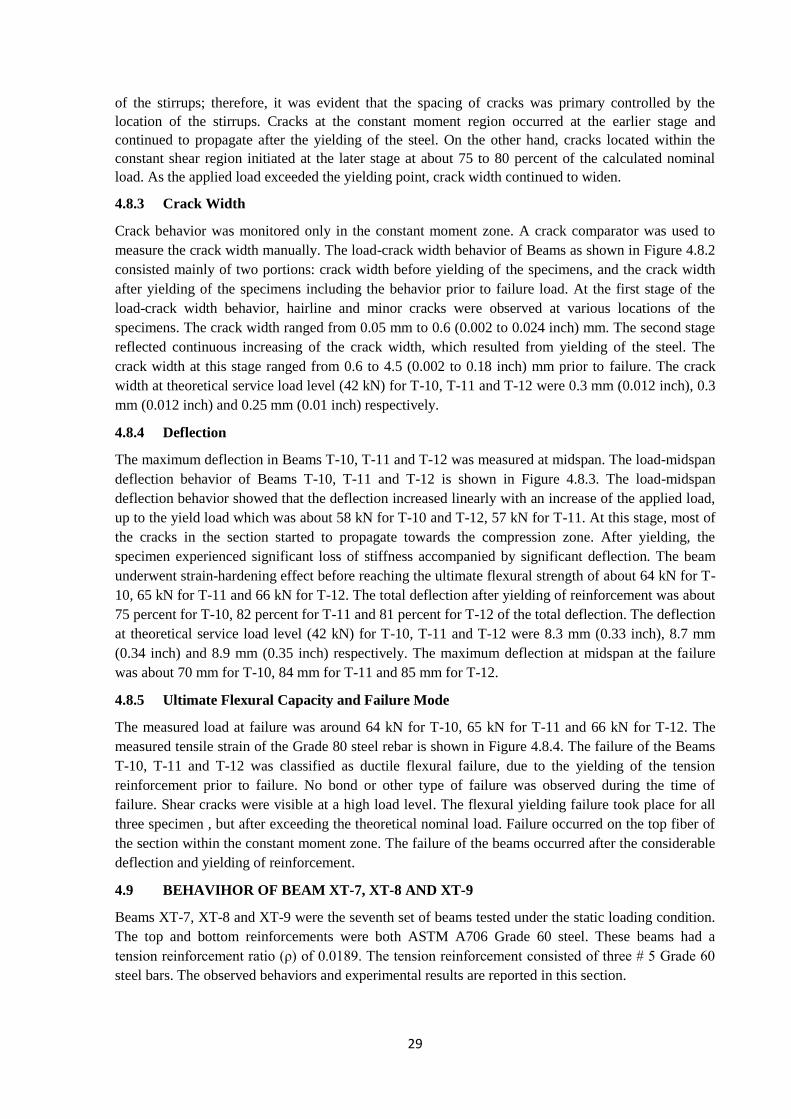
29
of the stirrups; therefore, it was evident that the spacing of cracks was primary controlled by the
location of the stirrups. Cracks at the constant moment region occurred at the earlier stage and
continued to propagate after the yielding of the steel. On the other hand, cracks located within the
constant shear region initiated at the later stage at about 75 to 80 percent of the calculated nominal
load. As the applied load exceeded the yielding point, crack width continued to widen.
4.8.3 Crack Width
Crack behavior was monitored only in the constant moment zone. A crack comparator was used to
measure the crack width manually. The load-crack width behavior of Beams as shown in Figure 4.8.2
consisted mainly of two portions: crack width before yielding of the specimens, and the crack width
after yielding of the specimens including the behavior prior to failure load. At the first stage of the
load-crack width behavior, hairline and minor cracks were observed at various locations of the
specimens. The crack width ranged from 0.05 mm to 0.6 (0.002 to 0.024 inch) mm. The second stage
reflected continuous increasing of the crack width, which resulted from yielding of the steel. The
crack width at this stage ranged from 0.6 to 4.5 (0.002 to 0.18 inch) mm prior to failure. The crack
width at theoretical service load level (42 kN) for T-10, T-11 and T-12 were 0.3 mm (0.012 inch), 0.3
mm (0.012 inch) and 0.25 mm (0.01 inch) respectively.
4.8.4 Deflection
The maximum deflection in Beams T-10, T-11 and T-12 was measured at midspan. The load-midspan
deflection behavior of Beams T-10, T-11 and T-12 is shown in Figure 4.8.3. The load-midspan
deflection behavior showed that the deflection increased linearly with an increase of the applied load,
up to the yield load which was about 58 kN for T-10 and T-12, 57 kN for T-11. At this stage, most of
the cracks in the section started to propagate towards the compression zone. After yielding, the
specimen experienced significant loss of stiffness accompanied by significant deflection. The beam
underwent strain-hardening effect before reaching the ultimate flexural strength of about 64 kN for T-
10, 65 kN for T-11 and 66 kN for T-12. The total deflection after yielding of reinforcement was about
75 percent for T-10, 82 percent for T-11 and 81 percent for T-12 of the total deflection. The deflection
at theoretical service load level (42 kN) for T-10, T-11 and T-12 were 8.3 mm (0.33 inch), 8.7 mm
(0.34 inch) and 8.9 mm (0.35 inch) respectively. The maximum deflection at midspan at the failure
was about 70 mm for T-10, 84 mm for T-11 and 85 mm for T-12.
4.8.5 Ultimate Flexural Capacity and Failure Mode
The measured load at failure was around 64 kN for T-10, 65 kN for T-11 and 66 kN for T-12. The
measured tensile strain of the Grade 80 steel rebar is shown in Figure 4.8.4. The failure of the Beams
T-10, T-11 and T-12 was classified as ductile flexural failure, due to the yielding of the tension
reinforcement prior to failure. No bond or other type of failure was observed during the time of
failure. Shear cracks were visible at a high load level. The flexural yielding failure took place for all
three specimen , but after exceeding the theoretical nominal load. Failure occurred on the top fiber of
the section within the constant moment zone. The failure of the beams occurred after the considerable
deflection and yielding of reinforcement.
4.9 BEHAVIHOR OF BEAM XT-7, XT-8 AND XT-9
Beams XT-7, XT-8 and XT-9 were the seventh set of beams tested under the static loading condition.
The top and bottom reinforcements were both ASTM A706 Grade 60 steel. These beams had a
tension reinforcement ratio (ρ) of 0.0189. The tension reinforcement consisted of three # 5 Grade 60
steel bars. The observed behaviors and experimental results are reported in this section.

30
4.9.1 Flexural Behavior
As the load is applied in a two point loading arrangement, the flexural behavior and crack pattern was
closely observed. The theoretical cracking load for these beams is 16.65 kN. Initiation of the first
crack occurred at a load level of about 30 kN for XT-7 and XT-9, 26 kN for beam XT-8. Two flexural
cracks occurred in the constant moment region. At about 53 kN for XT-7, 45 kN for XT-8 and XT-9,
additional flexural cracks initiated in the same region and propagated upward. As the load increased,
additional cracks were developed not only at the midspan, but also at the lower face of the beams just
below the location of the applied load. At load level of about 111 kN for XT-7 and XT-9, 107 kN for
XT-8, the existing cracks rapidly progressed toward the compression zone of the beam as the load
continued to increase. At an applied load of about 112 kN for XT-7, 108 kN for XT-8 and 113 kN for
XT-9, cracks were observed at the top of the beams and they quickly turned into an continuous crack
and finally resulted in spalling of concrete. Load level suddenly decreased after this incident and then
again began to increase. Existing cracks widened due to the crack stabilization phenomenon due to
yielding of the steel and the shifting of the neutral axis. This is a common behavior in concrete section
reinforced with mild steel. The specimens continued to maintain the applied load up to about 112 kN
for XT-7, 109 kN for XT-8 and 114 kN for XT-9 where failure occurred. Crushing of the specimens
was avoided for safety reasons and to avoid causing damage to the instrumentation. The theoretical
unfactored nominal load capacity for these beams is 109 kN. Distress of concrete was observed near
the location of applied load on the compression side. Beam samples XT-7, XT-8 and XT-9 functioned
satisfactory and did not experience any premature failure due to shear or debonding between the
concrete and steel.
4.9.2 Crack Pattern
The crack pattern of the specimens can be seen in Figure 4.9.1. The crack pattern associated with
Beams XT-7, XT-8 and XT-9 consisted of both flexure cracks and flexure-shear cracks. Two flexure-
shear cracks were located immediately at each of the loading points. Some major vertical cracks were
observed in the constant moment region, while minor cracks were found in the constant shear region.
All cracks initiated from the bottom and then propagated upward to the top of the beam. Crack
spacing ranged from 3 to 5 inch along the beam. Cracks were developed approximately at the location
of the stirrups; therefore, it was evident that the spacing of cracks was primary controlled by the
location of the stirrups. Cracks at the constant moment region occurred at the earlier stage and
continued to propagate after the yielding of the steel. On the other hand, cracks located within the
constant shear region initiated at the later stage at about 90 to 95 percent of the calculated nominal
load. As the applied load exceeded the yielding point, crack width continued to widen.
4.9.3 Crack Width
Crack behavior was monitored only in the constant moment zone. A crack comparator was used to
measure the crack width manually. The load-crack width behavior of Beams as shown in Figure 4.9.2
consisted mainly of two portions: crack width before yielding of the specimens, and the crack width
after yielding of the specimens including the behavior prior to failure load. At the first stage of the
load-crack width behavior, hairline cracks were observed at various locations of the specimens. The
crack width ranged from 0.05 mm to 0.4 mm (0.002 to 0.016 inch). The second stage reflected
continuous increasing of the crack width, which resulted from yielding of the steel. The crack width at
this stage ranged from 0.4 to 3 mm (0.016 to 0.12 inch) prior to failure. The crack width at theoretical
service load level (73.6 kN) for XT-7, XT-8 and XT-9 were 0.15 mm (0.006 inch), 0.2 mm (0.008
inch) and 0.2 mm (0.008 inch) respectively.

31
4.9.4 Deflection
The maximum deflection in Beams XT-7, XT-8 and XT-9 was measured at midspan. The load-
midspan deflection behavior of Beams XT-7, XT-8 and XT-9 is shown in Figure 4.9.3. The load-
midspan deflection behavior showed that the deflection increased linearly with an increase of the
applied load, up to the yield load which was about 108 kN for XT-7, 107 kN for XT-8 and XT-9. At
this stage, most of the cracks in the section started to propagate towards the compression zone. After
yielding, the specimen experienced significant loss of stiffness accompanied by significant deflection.
The beam underwent strain-hardening effect before reaching the ultimate flexural strength of about
112 kN for XT-7, 109 kN for XT-8 and 114 kN for XT-9. The total deflection after yielding of
reinforcement was about 68 percent for XT-7, 65 percent for XT-8 and 64 percent for XT-9 of the
total deflection. The deflection at theoretical service load level (73.6 kN) for XT-7, XT-8 and XT-9
were 9.5 mm (0.37 inch), 8.2 mm (0.32 inch) and 7.5 mm (0.3 inch) respectively. The maximum
deflection at midspan at the failure was about 53 mm for XT-7, 45 mm for XT-8 and 41 mm for XT-
9.
4.9.5 Ultimate Flexural Capacity and Failure Mode
The measured load at failure was about 112 kN for XT-7, 109 kN for XT-8 and 114 kN for XT-9. The
measured tensile strain of the Grade 60 steel rebar is shown in Figure 4.9.4. The failure of the Beams
XT-7, XT-8 and XT-9 was classified as ductile flexural failure, due to the yielding of the tension
reinforcement prior to failure. No bond or other type of failure was observed during the time of
failure. Shear cracks were visible at a high load level. . The flexural yielding failure took place for all
three specimen, but after exceeding the theoretical nominal load. Failure occurred on the top fiber of
the section within the constant moment zone. The failure of the beams occurred after the considerable
deflection and yielding of reinforcement.
4.10 BEHAVIHOR OF BEAM XT-10, XT-11 AND XT-12
Beams XT-10, XT-11 and XT-12 were the eighth set of beams tested under the static loading
condition. The top and bottom reinforcements were both ASTM A 706 Grade 60 steel. These beams
had a tension reinforcement ratio (ρ) of 0.0102. The tension reinforcement consisted of two # 4 and
one # 3 Grade 60 steel bars. The observed behaviors and experimental results are reported in this
section.
4.10.1 Flexural Behavior
As the load is applied in a two point loading arrangement, the flexural behavior and crack pattern was
closely observed. The theoretical cracking load for these beams is 16.65 kN. Initiation of the first
crack occurred at a load level of about 20 kN for XT-10 and XT-12, 16 kN for beam XT-11. Two
flexural cracks occurred in the constant moment region. At about 30 kN for XT-10 and XT-1134 kN
for XT-12, additional flexural cracks initiated in the same region and propagated upward. As the load
increased, additional cracks were developed not only at the midspan, but also at the lower face of the
beams just below the location of the applied load. At load level of about 58 kN for XT-10,61 kN XT-
11 and 62 kN for XT-12, the existing cracks rapidly progressed toward the compression zone of the
beam as the load continued to increase. At an applied load of about 64 kN for XT-10, 65 kN for XT-
11 and XT-12, cracks were observed at the top of the beams and they quickly turned into an
continuous crack and finally resulted in spalling of concrete. Load level suddenly decreased after this
incident and then again began to increase. Existing cracks widened due to the crack stabilization
phenomenon due to yielding of the steel and the shifting of the neutral axis. This is a common
behavior in concrete section reinforced with mild steel. The specimens continued to maintain the
applied load up to about 66 kN for XT-10 and XT-12, 65 kN for XT-11 where failure occurred.
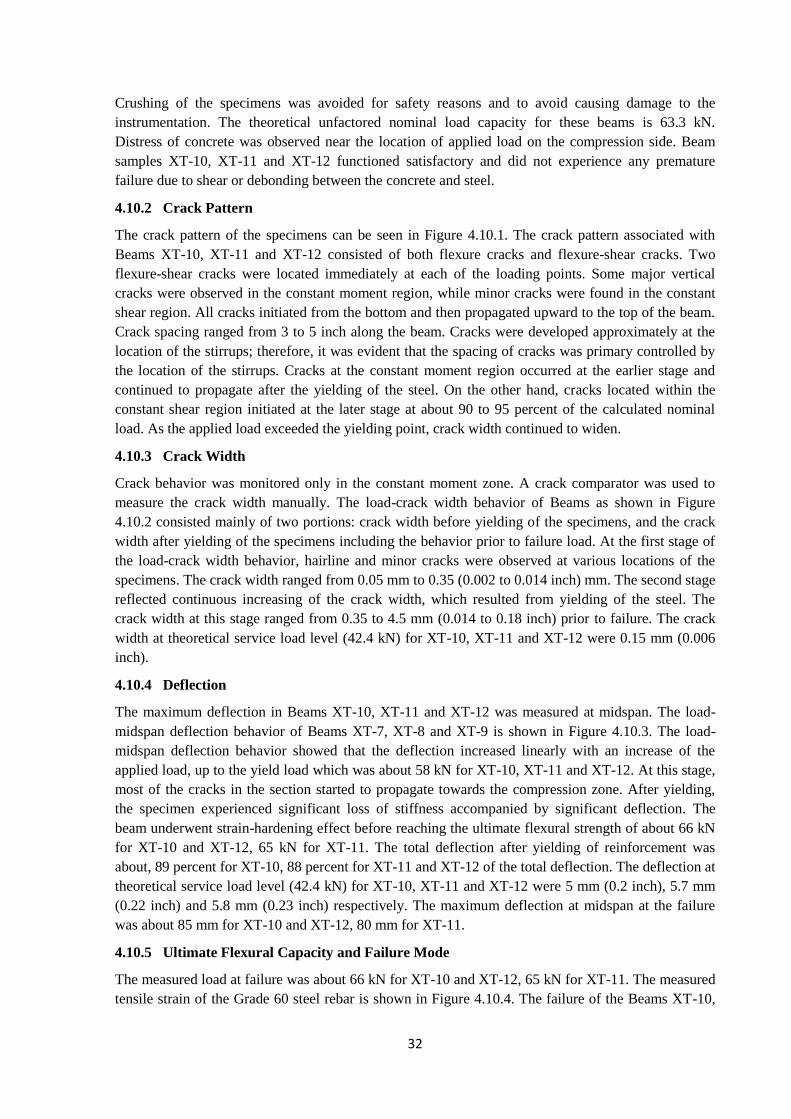
32
Crushing of the specimens was avoided for safety reasons and to avoid causing damage to the
instrumentation. The theoretical unfactored nominal load capacity for these beams is 63.3 kN.
Distress of concrete was observed near the location of applied load on the compression side. Beam
samples XT-10, XT-11 and XT-12 functioned satisfactory and did not experience any premature
failure due to shear or debonding between the concrete and steel.
4.10.2 Crack Pattern
The crack pattern of the specimens can be seen in Figure 4.10.1. The crack pattern associated with
Beams XT-10, XT-11 and XT-12 consisted of both flexure cracks and flexure-shear cracks. Two
flexure-shear cracks were located immediately at each of the loading points. Some major vertical
cracks were observed in the constant moment region, while minor cracks were found in the constant
shear region. All cracks initiated from the bottom and then propagated upward to the top of the beam.
Crack spacing ranged from 3 to 5 inch along the beam. Cracks were developed approximately at the
location of the stirrups; therefore, it was evident that the spacing of cracks was primary controlled by
the location of the stirrups. Cracks at the constant moment region occurred at the earlier stage and
continued to propagate after the yielding of the steel. On the other hand, cracks located within the
constant shear region initiated at the later stage at about 90 to 95 percent of the calculated nominal
load. As the applied load exceeded the yielding point, crack width continued to widen.
4.10.3 Crack Width
Crack behavior was monitored only in the constant moment zone. A crack comparator was used to
measure the crack width manually. The load-crack width behavior of Beams as shown in Figure
4.10.2 consisted mainly of two portions: crack width before yielding of the specimens, and the crack
width after yielding of the specimens including the behavior prior to failure load. At the first stage of
the load-crack width behavior, hairline and minor cracks were observed at various locations of the
specimens. The crack width ranged from 0.05 mm to 0.35 (0.002 to 0.014 inch) mm. The second stage
reflected continuous increasing of the crack width, which resulted from yielding of the steel. The
crack width at this stage ranged from 0.35 to 4.5 mm (0.014 to 0.18 inch) prior to failure. The crack
width at theoretical service load level (42.4 kN) for XT-10, XT-11 and XT-12 were 0.15 mm (0.006
inch).
4.10.4 Deflection
The maximum deflection in Beams XT-10, XT-11 and XT-12 was measured at midspan. The load-
midspan deflection behavior of Beams XT-7, XT-8 and XT-9 is shown in Figure 4.10.3. The load-
midspan deflection behavior showed that the deflection increased linearly with an increase of the
applied load, up to the yield load which was about 58 kN for XT-10, XT-11 and XT-12. At this stage,
most of the cracks in the section started to propagate towards the compression zone. After yielding,
the specimen experienced significant loss of stiffness accompanied by significant deflection. The
beam underwent strain-hardening effect before reaching the ultimate flexural strength of about 66 kN
for XT-10 and XT-12, 65 kN for XT-11. The total deflection after yielding of reinforcement was
about, 89 percent for XT-10, 88 percent for XT-11 and XT-12 of the total deflection. The deflection at
theoretical service load level (42.4 kN) for XT-10, XT-11 and XT-12 were 5 mm (0.2 inch), 5.7 mm
(0.22 inch) and 5.8 mm (0.23 inch) respectively. The maximum deflection at midspan at the failure
was about 85 mm for XT-10 and XT-12, 80 mm for XT-11.
4.10.5 Ultimate Flexural Capacity and Failure Mode
The measured load at failure was about 66 kN for XT-10 and XT-12, 65 kN for XT-11. The measured
tensile strain of the Grade 60 steel rebar is shown in Figure 4.10.4. The failure of the Beams XT-10,

33
XT-11 and XT-12 was classified as ductile flexural failure, due to the yielding of the tension
reinforcement prior to failure. No bond or other type of failure was observed during the time of
failure. Shear cracks were visible at a high load level. The flexural yielding failure took place for all
three specimen, but after exceeding the theoretical nominal load. Failure occurred on the top fiber of
the section within the constant moment zone. The failure of the beams occurred after the considerable
deflection and yielding of reinforcement.
4.11 BEHAVIOR OF BEAM T-13, T-14 AND T-15
Beams T-13, T-14 and T-15 were the ninth set of beams tested under the static loading condition. The
top and bottom reinforcements were both ASTM A706 Grade 80 steel. These beams had a tension
reinforcement ratio (ρ) of 0.0143. The tension reinforcement consisted of two # 4 and one # 3 Grade
80 steel bars. The observed behaviors and experimental results are reported in this section.
4.11.1 Flexural Behavior
As the load is applied in a two point loading arrangement, the flexural behavior and crack pattern was
closely observed. The theoretical cracking load for these beams is 15.8 kN. Initiation of the first crack
occurred at a load level of about 26 kN for T-13 and T-14, 25 kN for T-15. Two flexural cracks
occurred in the constant moment region. At about 40 kN for T-13, 44 kN for beam T-14 and 39 kN
for T-15, additional flexural cracks initiated in the same region and propagated upward. As the load
increased, additional cracks were developed not only at the midspan, but also at the lower face of the
beams just below the location of the applied load. At load level of about 98kN for T-13, 102kN for
beam T-14 and 97 kN for T-15, the existing cracks rapidly progressed toward the compression zone of
the beam as the load continued to increase. At an applied load of about 107kN for T-13 and T-14, 106
kN for T-15, cracks were observed at the top of the beams and they quickly turned into an continuous
crack and finally resulted in spalling of concrete. Load level suddenly decreased after this incident and
then again began to increase. Existing cracks widened due to the crack stabilization phenomenon due
to yielding of the steel and the shifting of the neutral axis. This is a common behavior in concrete
section reinforced with mild steel. The specimens continued to maintain the applied load up to about
111 kN for T-13, 110 kN for T-14 and T-15 where failure occurred. Crushing of the specimens was
avoided for safety reasons and to avoid causing damage to the instrumentation. The theoretical
unfactored nominal load capacity for these beams is 110kN.Distress of concrete was observed near
the load location on the compression side. Beam samples T-13, T-14 and T-15 functioned satisfactory
and did not experience any premature failure due to shear or debonding between the concrete and
steel.
4.11.2 Crack Pattern
The crack pattern of the specimens can be seen in Figure 4.11.1. The crack pattern associated with
Beams T-13, T-14 and T-15 consisted of both flexure cracks and flexure-shear cracks. Two flexure-
shear cracks were located immediately at each of the loading points. Some major vertical cracks were
observed in the constant moment region, while minor cracks were found in the constant shear region.
All cracks initiated from the bottom and then propagated upward to the top of the beam. Crack
spacing ranged from 3 to 5 inch along the beam. Cracks were developed approximately at the location
of the stirrups; therefore, it was evident that the spacing of cracks was primary controlled by the
location of the stirrups. Cracks at the constant moment region occurred at the earlier stage and
continued to propagate after the yielding of the steel. On the other hand, cracks located within the
constant shear region initiated at the later stage at about 85 to 90 percent of the calculated nominal
load. As the applied load exceeded the yielding point, crack width continued to widen.

34
4.11.3 Crack Width
Crack behavior was monitored only in the constant moment zone. A crack comparator was used to
measure the crack width manually. The load-crack width behavior of Beams as shown in Figure
4.11.2 consisted mainly of two portions: crack width before yielding of the specimens, and the crack
width after yielding of the specimens including the behavior prior to failure load. At the first stage of
the load-crack width behavior, hairline and minor cracks were observed at various locations of the
specimens. The crack width ranged from 0.05mm to 0.45 mm (0.002 to 0.02 inch). The second stage
reflected continuous increasing of the crack width, which resulted from yielding of the steel. The
crack width at this stage ranged from 0.45 to 3.8(0.02 to 0.15 inch) mm prior to failure. The crack
width at theoretical service load level (74kN) for T-13, T-14 and T-15 were 0.25mm (0.01 inch), 0.2
mm (0.008 inch) and 0.25 mm (0.01 inch) respectively.
4.11.4 Deflection
The maximum deflection in Beams T-13, T-14 and T-15was measured at midspan. The load-midspan
deflection behavior of Beams T-13, T-14 and T-15 is shown in Figure 4.11.3.The load-midspan
deflection behavior showed that the deflection increased linearly with an increase of the applied load,
up to the yield load which was about 101 kN for T-13, 102 kN forT-14 and T-15. At this stage, most
of the cracks in the section started to propagate towards the compression zone. After yielding, the
specimen experienced significant loss of stiffness accompanied by significant deflection. The beam
underwent strain-hardening effect before reaching the ultimate flexural strength of about 111 kN for
T-13,110 kN for T-14 and T-15. The total deflection after yielding of reinforcement was about 65
percent for T-13, 70 percent for T-14 and 71 percent for T-15 of the total deflection. The deflection at
theoretical service load level (74 kN) for T-13, T-14 and T-15 were 10 mm (0.4 inch), 10.3 mm (0.41
inch) and 9.3 mm (0.37 inch) respectively. The maximum deflection at midspan at the failure was
about 52 mm for T-13, 63 mm for T-14 and 65 mm for T-15.
4.11.5 Ultimate Flexural Capacity and Failure Mode
The measured load at failure was about 111 kN for T-13, 110 kN for T-14 and 110 kN for T-15. The
measured tensile strain of the Grade 80 steel rebar is shown in Figure 4.11.4. The failure of the Beams
T-13, T-14 and T-15 was classified as ductile flexural failure, due to the yielding of the tension
reinforcement prior to crushing of the failure. No bond or other type of failure was observed during
the time of failure. Shear cracks were visible at a high load level. The flexural yielding failure took
place for all three specimen , but after exceeding the theoretical nominal load. Failure occurred on the
top fiber of the section within the constant moment zone. The failure of the beams occurred after the
considerable deflection and yielding of reinforcement.
4.12 BEHAVIOR OF BEAM T-16, T-17 AND T-18
Beams T-16, T-17 and T-18 were the ninth set of beams tested under the static loading condition. The
top and bottom reinforcements were both ASTM A706 Grade 80 steel. These beams had a tension
reinforcement ratio (ρ) of 0.0085. The tension reinforcement consisted of two # 3 and one # 4 Grade
80 steel bars. The observed behaviors and experimental results are reported in this section.
4.12.1 Flexural Behavior
As the load is applied in a two point loading arrangement, the flexural behavior and crack pattern was
closely observed. The theoretical cracking load for these beams is 15.8 kN. Initiation of the first crack
occurred at a load level of about 21 kN for T-16, T-17 and T-18. Two flexural cracks occurred in the
constant moment region. At about 35 kN for T-16 and T-17, 31 kN for beam T-18, additional flexural
cracks initiated in the same region and propagated upward. As the load increased, additional cracks

35
were developed not only at the midspan, but also at the lower face of the beams just below the
location of the applied load. At load level of about 62 kN for T-16, 63 kN for beam T-17 and 65 kN
for T-18, the existing cracks rapidly progressed toward the compression zone of the beam as the load
continued to increase. At an applied load of about 74 kN for T-16, 71 kN for T-18 and 70 kN for T-
17, cracks were observed at the top of the beams and they quickly turned into an continuous crack and
finally resulted in spalling of concrete. Load level suddenly decreased after this incident and then
again began to increase. Existing cracks widened due to the crack stabilization phenomenon due to
yielding of the steel and the shifting of the neutral axis. This is a common behavior in concrete section
reinforced with mild steel. The specimens continued to maintain the applied load up to about 75 kN
for T-16, 72 kN for T-17 and 71 kN for T-18 where failure occurred. Crushing of the specimens was
avoided for safety reasons and to avoid causing damage to the instrumentation. The theoretical
unfactored nominal load capacity for these beams is 69.4 kN. Distress of concrete was observed near
the location of applied load on the compression side. Beam samples T-16, T-17 and T-18 functioned
satisfactory and did not experience any premature failure due to shear or debonding between the
concrete and steel.
4.12.2 Crack Pattern
The crack pattern of the specimens can be seen in Figure 4.12.1. The crack pattern associated with
Beams T-16, T-17 and T-18 consisted of both flexure cracks and flexure-shear cracks. Two flexure-
shear cracks were located immediately at each of the loading points. Some major vertical cracks were
observed in the constant moment region, while minor cracks were found in the constant shear region.
All cracks initiated from the bottom and then propagated upward to the top of the beam. Crack
spacing ranged from 3 to 5 inch along the beam. Cracks were developed approximately at the location
of the stirrups; therefore, it was evident that the spacing of cracks was primary controlled by the
location of the stirrups. Cracks at the constant moment region occurred at the earlier stage and
continued to propagate after the yielding of the steel. On the other hand, cracks located within the
constant shear region initiated at the later stage at about 80 to 85 percent of the calculated nominal
load. As the applied load exceeded the yielding point, crack width continued to widen.
4.12.3 Crack Width
Crack behavior was monitored only in the constant moment zone. A crack comparator was used to
measure the crack width manually. The load-crack width behavior of Beams as shown in Figure
4.12.2 consisted mainly of two portions: crack width before yielding of the specimens, and the crack
width after yielding of the specimens including the behavior prior to failure load. At the first stage of
the load-crack width behavior, hairline and minor cracks were observed at various locations of the
specimens. The crack width ranged from 0.05 mm to 0.45 mm (0.002 to 0.018 inch). The second stage
reflected continuous increasing of the crack width, which resulted from yielding of the steel. The
crack width at this stage ranged from 0.45 to 4.6 mm (0.018 to 0.18 inch) prior to failure. The crack
width at theoretical service load level (46.5 kN) for T-16, T-17 and T-18 were 0.2 mm (0.008 inch),
0.2 mm (0.008 inch) and 0.15 mm (0.006 inch) respectively.
4.12.4 Deflection
The maximum deflection in Beams T-16, T-17 and T-18 was measured at midspan. The load-midspan
deflection behavior of Beams T-13, T-14 and T-15 is shown in Figure 4.12.3. The load-midspan
deflection behavior showed that the deflection increased linearly with an increase of the applied load,
up to the yield load which was about 66 kN for T-16, 67 kN for T-17 and T-18. At this stage, most of
the cracks in the section started to propagate towards the compression zone. After yielding, the
specimen experienced significant loss of stiffness accompanied by significant deflection. The beam
underwent strain-hardening effect before reaching the ultimate flexural strength of 75 kN for T-16, 72

36
kN for T-17 and 71 kN for T-18. The total deflection after yielding of reinforcement was about 82
percent for T-16, 80 percent for T-17 and 84 percent for T-18 of the total deflection. The deflection at
theoretical service load level (46.5 kN) for T-16, T-17 and T-18 were 6.6 mm (0.26 inch), 8 mm (0.31
inch) and 8.3 mm (0.33 inch) respectively. The maximum deflection at midspan at the failure was
about 80 mm for T-16, 75 mm for T-17 and 110 mm for T-18.
4.12.5 Ultimate Flexural Capacity And Failure Mode
The measured load at failure was around 75 kN for T-16, 72 kN for T-17 and 71 kN for T-18. The
measured tensile strain of the Grade 80 steel rebar is shown in Figure 4.12.4. The failure of the Beams
T-16, T-17 and T-18 was classified as ductile flexural failure, due to the yielding of the tension
reinforcement prior to failure. No bond or other type of failure was observed during the time of
failure. Shear cracks were visible at a high load level. The flexural yielding failure took place for all
three specimen , but after exceeding the theoretical nominal load. Failure occurred on the top fiber of
the section within the constant moment zone. The failure of the beams occurred after the considerable
deflection and yielding of reinforcement.
Table 4.1: Compressive Strength of Concrete
Compressive Strength Remarks
Batch Serial 7 days (psi) Testing day (psi)
First 2644 3763 Average=3990
First 3005 4052 S.D=167.59
First 3041 4160
Second 2969 4088 Average=4120
Second 2608 3871 S.D=222.51
Second 3113 4413
Third 2860 3907 Average=3900
Third 2897 3907 S.D=17.01
Third 2824 3871
Fourth 4990 6001 Average=6270
Fourth 5171 6037 S.D=349.13
Fourth 5712 6759
Fifth 5171 5712 Average=5640
Fifth 5080 5676 S.D=78.1
Fifth 4990 5532
Figure 4.1: Crack comparator

37
Figure 4.2.1: Mechanical properties of reinforcing Grade 80 steel (#4 ; 12mm dia)

38
Figure 4.2.2: Mechanical properties of reinforcing Grade 80 steel (#5 ; 16mm dia)
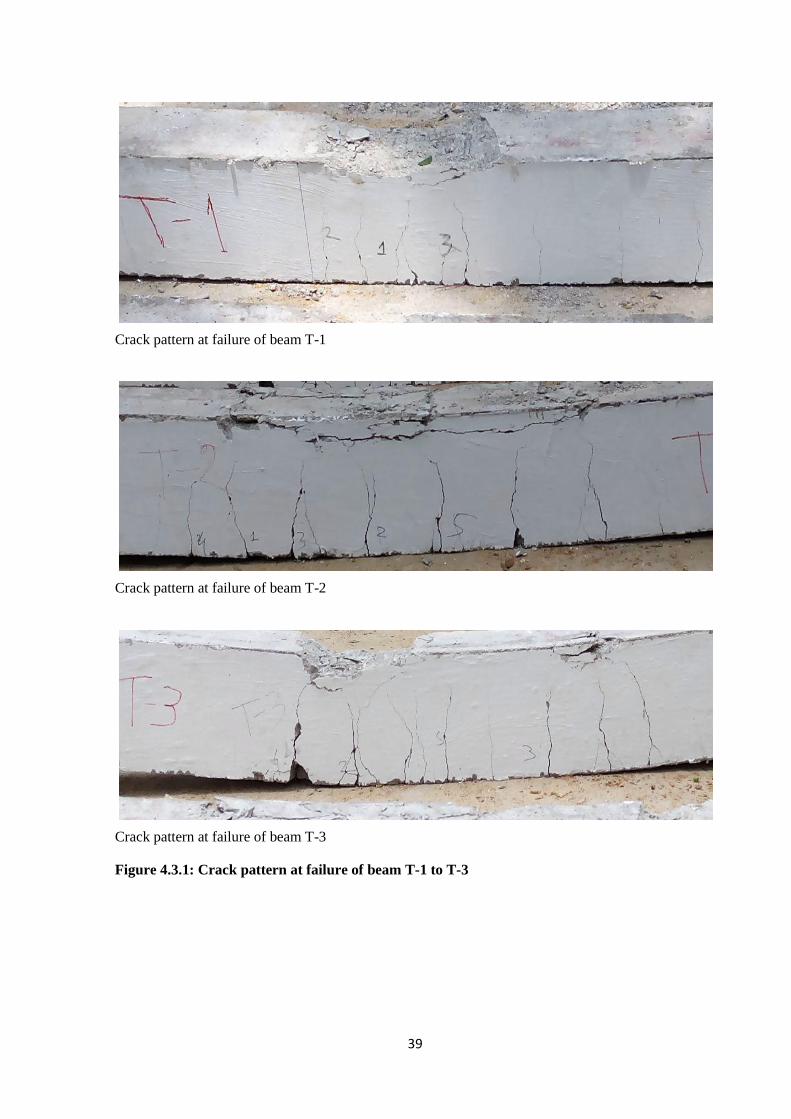
39
Crack pattern at failure of beam T-1
Crack pattern at failure of beam T-2
Crack pattern at failure of beam T-3
Figure 4.3.1: Crack pattern at failure of beam T-1 to T-3
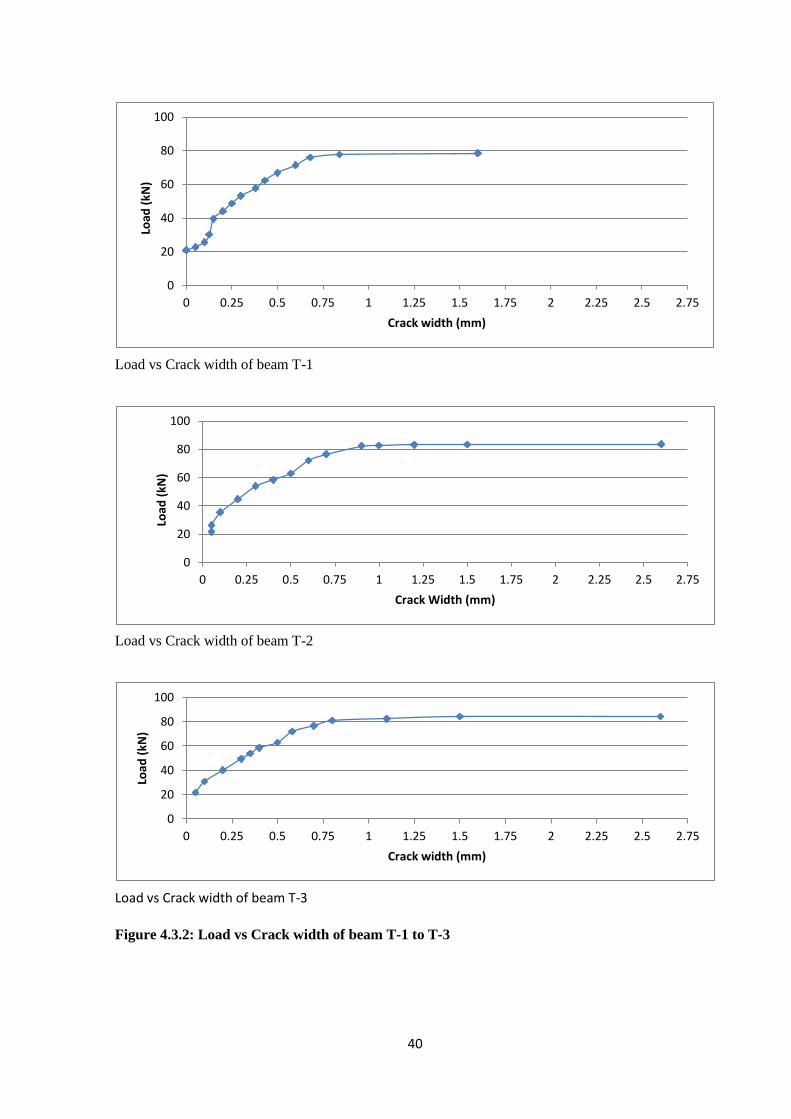
40
Load vs Crack width of beam T-1
Load vs Crack width of beam T-2
Load vs Crack width of beam T-3
Figure 4.3.2: Load vs Crack width of beam T-1 to T-3
0
20
40
60
80
100
0 0.25 0.5 0.75 1 1.25 1.5 1.75 2 2.25 2.5 2.75
Load
(kN
)
Crack width (mm)
0
20
40
60
80
100
0 0.25 0.5 0.75 1 1.25 1.5 1.75 2 2.25 2.5 2.75
Load
(kN
)
Crack Width (mm)
0
20
40
60
80
100
0 0.25 0.5 0.75 1 1.25 1.5 1.75 2 2.25 2.5 2.75
Load
(kN
)
Crack width (mm)

41
Load-deflection response of beam T-1
Load-deflection response of beam T-2
Load-deflection response of beam T-3
Figure 4.3.3: Load-deflection response of beam T-1 to T-3
0
20
40
60
80
100
0 20 40 60 80 100 120
Load
(kN
)
deflection (mm)
0
20
40
60
80
100
0 20 40 60 80 100 120
Load
(kN
)
deflection (mm)
0
20
40
60
80
100
0 20 40 60 80 100 120
Load
(kN
)
deflection (mm)

42
Load-Steel strain relationship of beam T-1
Load-Steel strain relationship of beam T-2
Load-Steel strain relationship of beam T-3
Figure 4.3.4: Load-Steel strain relationship of beam T-1 to T-3
0
20
40
60
80
100
0 0.002 0.004 0.006 0.008 0.01 0.012 0.014 0.016 0.018
Load
(kN
)
Steel Strain (in/in)
0
20
40
60
80
100
0 0.002 0.004 0.006 0.008 0.01 0.012 0.014 0.016 0.018
Load
(kN
)
Steel strain (in/in)
0
20
40
60
80
100
-2.43E-17 0.002 0.004 0.006 0.008 0.01 0.012 0.014 0.016 0.018
Load
(kN
)
Steel strain (in/in)
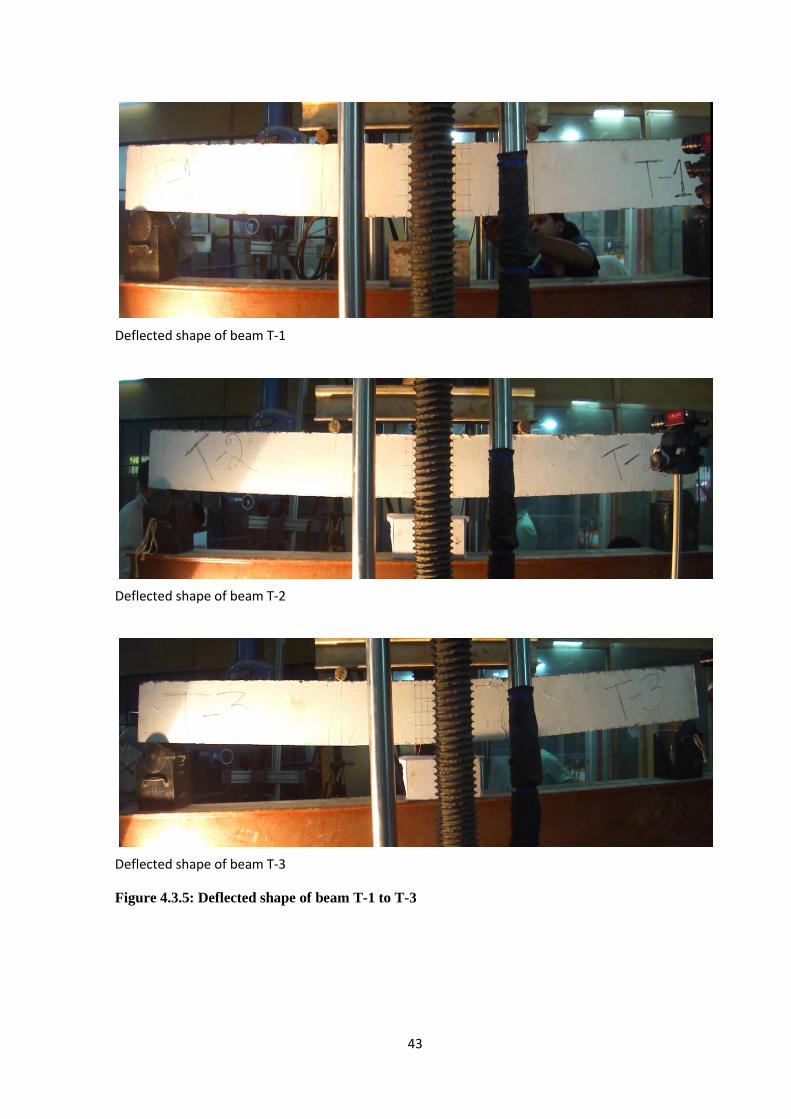
43
Deflected shape of beam T-1
Deflected shape of beam T-2
Deflected shape of beam T-3
Figure 4.3.5: Deflected shape of beam T-1 to T-3

44
Crack pattern of T-4
Crack pattern of T-5
Crack pattern of T-6
Figure 4.4.1: Crack pattern at failure of beam T-4 to T-6

45
Load-Crack width of T-4
Load-Crack width of T-5
Load-Crack width of T-6
Figure 4.4.2: Load vs Crack width of beam T-4 to T-6
0
10
20
30
40
50
60
70
0 0.5 1 1.5 2 2.5 3 3.5 4 4.5
Load
(kN
)
Crack width (mm)
0
10
20
30
40
50
60
70
0 0.5 1 1.5 2 2.5 3 3.5 4 4.5
Load
(kN
)
Crack width (mm)
0
10
20
30
40
50
60
70
0 0.5 1 1.5 2 2.5 3 3.5 4 4.5
Load
(kN
)
Crack width (mm)

46
Load-deflection of T-4
Load-deflection of T-5
Load-deflection of T-6
Figure 4.4.3: Load-deflection response of beam T-4 to T-6
0
10
20
30
40
50
60
70
0 20 40 60 80 100 120 140 160
Load
(kN
)
deflection (mm)
0
10
20
30
40
50
60
70
0 20 40 60 80 100 120 140 160
Load
(kN
)
deflection (mm)
0
10
20
30
40
50
60
70
0 20 40 60 80 100 120 140 160
Load
(kN
)
deflection (mm)
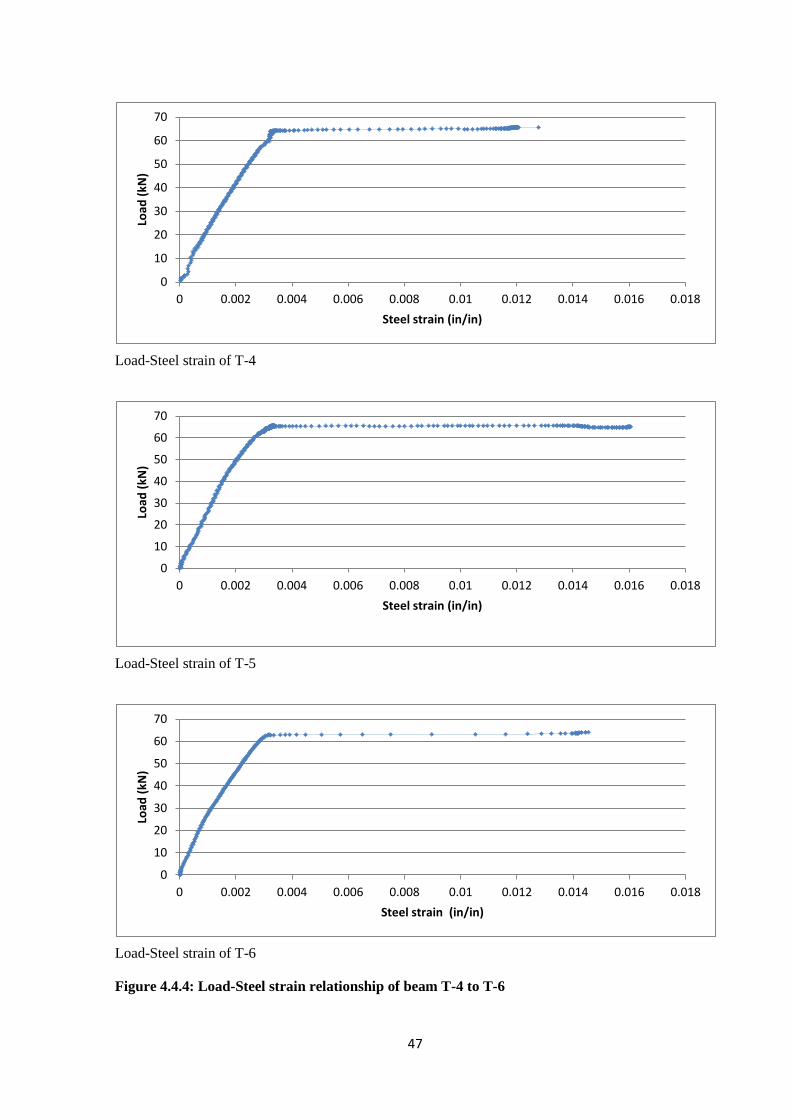
47
Load-Steel strain of T-4
Load-Steel strain of T-5
Load-Steel strain of T-6
Figure 4.4.4: Load-Steel strain relationship of beam T-4 to T-6
0
10
20
30
40
50
60
70
0 0.002 0.004 0.006 0.008 0.01 0.012 0.014 0.016 0.018
Load
(kN
)
Steel strain (in/in)
0
10
20
30
40
50
60
70
0 0.002 0.004 0.006 0.008 0.01 0.012 0.014 0.016 0.018
Load
(kN
)
Steel strain (in/in)
0
10
20
30
40
50
60
70
0 0.002 0.004 0.006 0.008 0.01 0.012 0.014 0.016 0.018
Load
(kN
)
Steel strain (in/in)
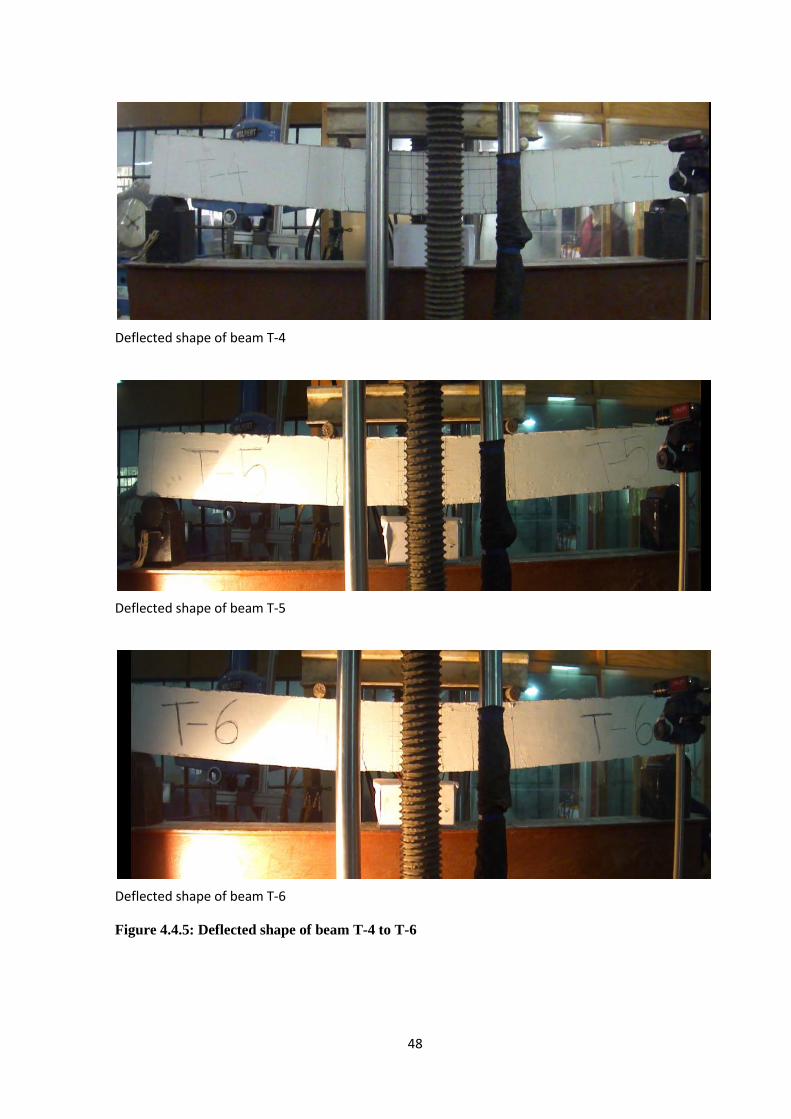
48
Deflected shape of beam T-4
Deflected shape of beam T-5
Deflected shape of beam T-6
Figure 4.4.5: Deflected shape of beam T-4 to T-6

49
Crack pattern of XT-1
Crack pattern of XT-2
Crack pattern of XT-3
Figure 4.5.1: Crack pattern at failure of beam XT-1 to XT-3

50
Load-Crack width of XT-1
Load-Crack width of XT-2
Load-Crack width of XT-3
Figure 4.5.2: Load vs Crack width of beam XT-1 to XT-3
0
10
20
30
40
50
60
70
80
90
100
0 0.25 0.5 0.75 1 1.25 1.5 1.75 2 2.25 2.5 2.75
Load
(kN
)
Crack width (mm)
0
20
40
60
80
100
0 0.25 0.5 0.75 1 1.25 1.5 1.75 2 2.25 2.5 2.75
Load
(kN
)
Crack width (mm)
0
20
40
60
80
100
0 0.25 0.5 0.75 1 1.25 1.5 1.75 2 2.25 2.5 2.75
Load
(kN
)
Crack width (mm)

51
Load-deflection of XT-1
Load-deflection of XT-2
Load-deflection of XT-3
Figure 4.5.3: Load-deflection response of beam XT-1 to XT-3
0
10
20
30
40
50
60
70
80
90
100
0 5 10 15 20 25 30 35 40 45 50
Load
(kN
)
deflection (mm)
0
10
20
30
40
50
60
70
80
90
100
0 5 10 15 20 25 30 35 40 45 50
Load
(kN
)
deflection (mm)
0
20
40
60
80
100
0 5 10 15 20 25 30 35 40 45 50
Load
(kN
)
deflection (mm)

52
Load-Steel strain of XT-1
Load-Steel strain of XT-2
Load-Steel strain of XT-3
Figure 4.5.4: Load-Steel strain relationship of beam XT-1 to XT-3
0
20
40
60
80
100
0 0.002 0.004 0.006 0.008 0.01 0.012 0.014 0.016 0.018 0.02
Load
(kN
)
Steel strain (in/in)
0
20
40
60
80
100
-4.16E-17 0.002 0.004 0.006 0.008 0.01 0.012 0.014 0.016 0.018 0.02
Load
(kN
)
Steel strain (in/in)
0
20
40
60
80
100
0 0.002 0.004 0.006 0.008 0.01 0.012 0.014 0.016 0.018 0.02
Load
(kN
)
Steel strain (in/in)

53
Deflected shape of beam XT-1
Deflected shape of beam XT-2
Deflected shape of beam XT-3
Figure 4.5.5: Deflected shape of beam XT-1 to XT-3

54
Crack pattern of XT-4
Crack pattern of XT-5
Crack pattern of XT-6
Figure 4.6.1: Crack pattern at failure of beam XT-4 to XT-6
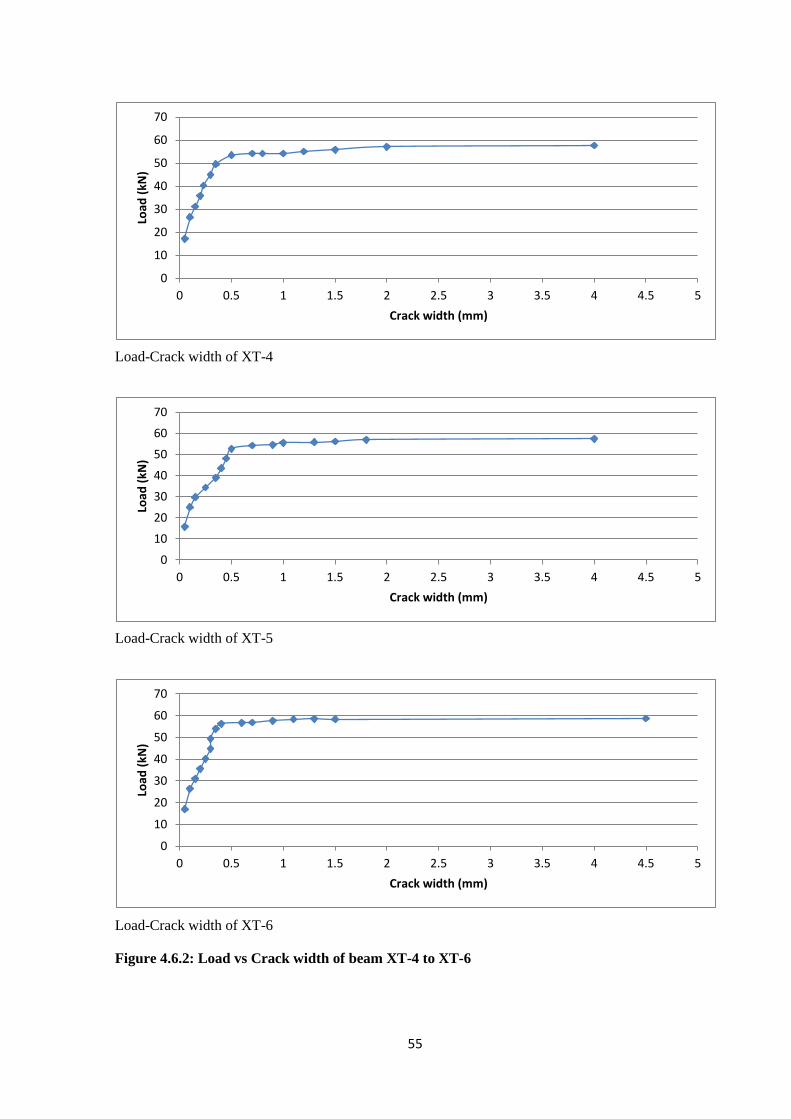
55
Load-Crack width of XT-4
Load-Crack width of XT-5
Load-Crack width of XT-6
Figure 4.6.2: Load vs Crack width of beam XT-4 to XT-6
0
10
20
30
40
50
60
70
0 0.5 1 1.5 2 2.5 3 3.5 4 4.5 5
Load
(kN
)
Crack width (mm)
0
10
20
30
40
50
60
70
0 0.5 1 1.5 2 2.5 3 3.5 4 4.5 5
Load
(kN
)
Crack width (mm)
0
10
20
30
40
50
60
70
0 0.5 1 1.5 2 2.5 3 3.5 4 4.5 5
Load
(kN
)
Crack width (mm)

56
Load-deflection of XT-4
Load-deflection of XT-5
Load-deflection of XT-6
Figure 4.6.3: Load-deflection response of beam XT-4 to XT-6
0
10
20
30
40
50
60
70
0 20 40 60 80 100 120
Load
(kN
)
deflection (mm)
0
10
20
30
40
50
60
70
0 20 40 60 80 100 120
Load
(kN
)
deflection (mm)
0
10
20
30
40
50
60
70
0 20 40 60 80 100 120
Load
(kN
)
deflection (mm)
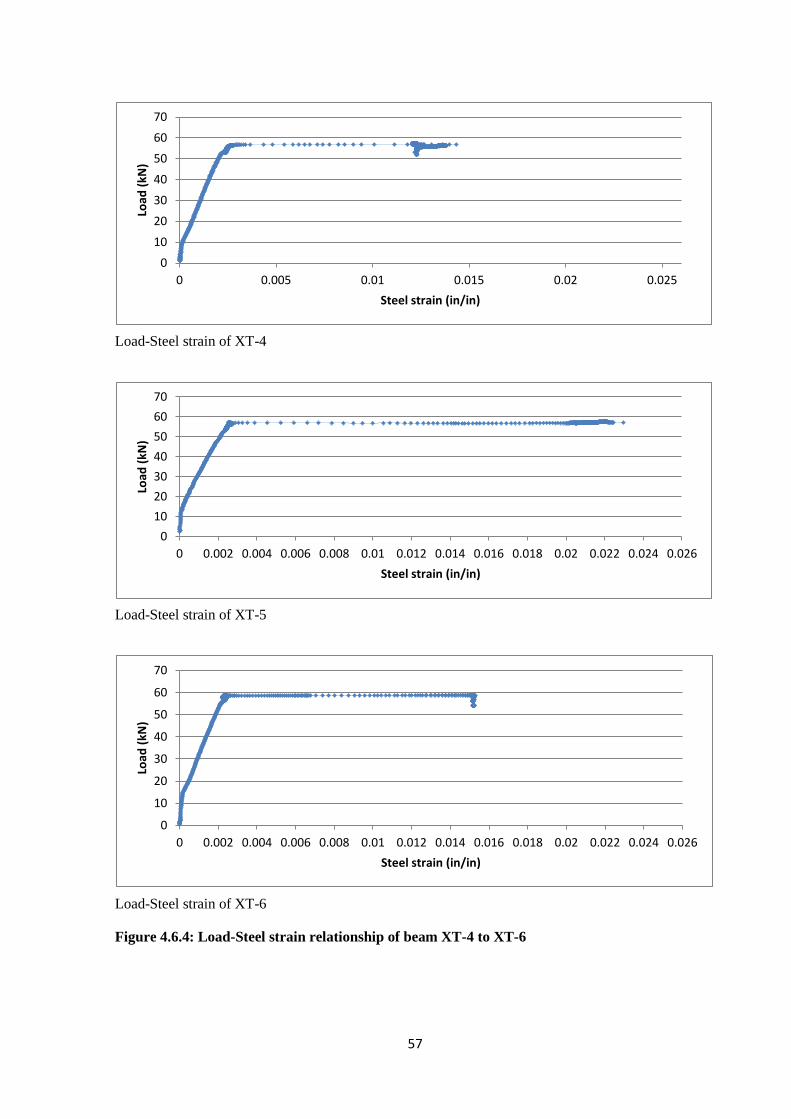
57
Load-Steel strain of XT-4
Load-Steel strain of XT-5
Load-Steel strain of XT-6
Figure 4.6.4: Load-Steel strain relationship of beam XT-4 to XT-6
0
10
20
30
40
50
60
70
0 0.005 0.01 0.015 0.02 0.025
Load
(kN
)
Steel strain (in/in)
0
10
20
30
40
50
60
70
0 0.002 0.004 0.006 0.008 0.01 0.012 0.014 0.016 0.018 0.02 0.022 0.024 0.026
Load
(kN
)
Steel strain (in/in)
0
10
20
30
40
50
60
70
0 0.002 0.004 0.006 0.008 0.01 0.012 0.014 0.016 0.018 0.02 0.022 0.024 0.026
Load
(kN
)
Steel strain (in/in)

58
Deflected shape of beam XT-4
Deflected shape of beam XT-5
Deflected shape of beam XT-6
Figure 4.6.5: Deflected shape of beam XT-4 to XT-6
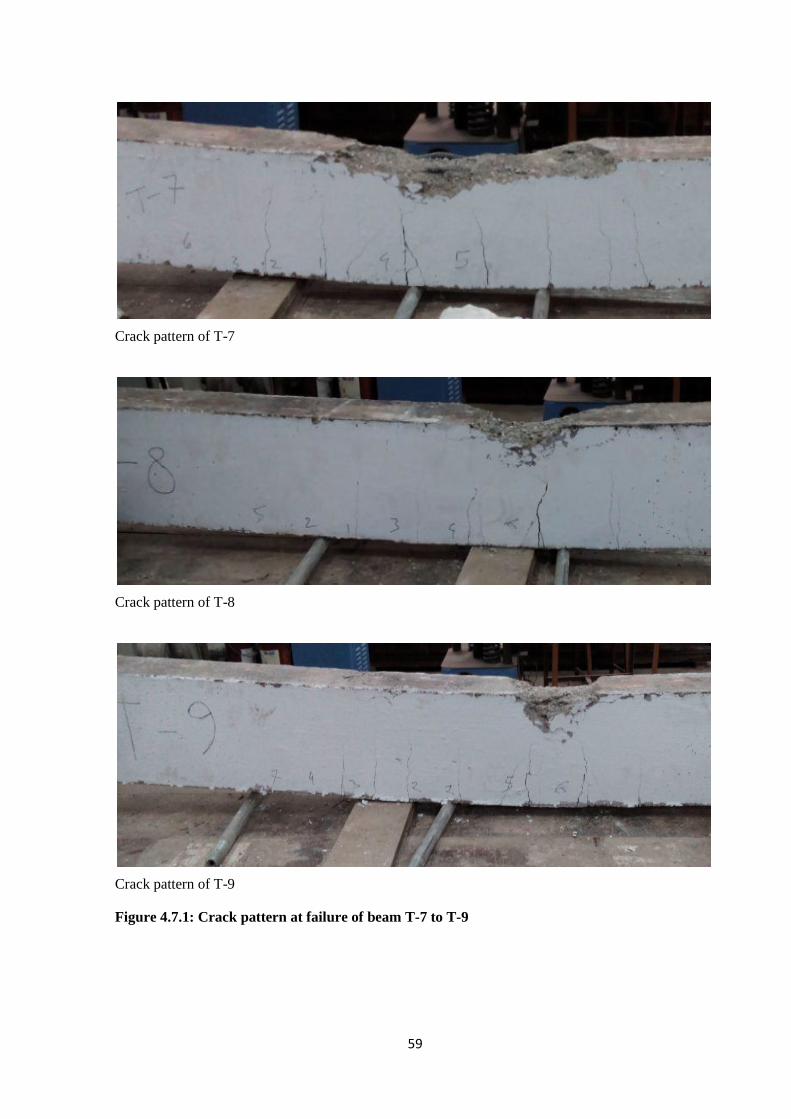
59
Crack pattern of T-7
Crack pattern of T-8
Crack pattern of T-9
Figure 4.7.1: Crack pattern at failure of beam T-7 to T-9

60
Load-Crack width of T-7
Load-Crack width of T-8
Load-Crack width of T-9
Figure 4.7.2: Load vs Crack width of beam T-7 to T-9
0
20
40
60
80
100
120
0 0.5 1 1.5 2 2.5 3 3.5
Load
(kN
)
Crack width (mm)
0
20
40
60
80
100
120
0 0.5 1 1.5 2 2.5 3 3.5
Load
(kN
)
Crack width (mm)
0
20
40
60
80
100
120
0 0.5 1 1.5 2 2.5 3 3.5
Load
(kN
)
Crack width (mm)

61
Load-deflection of T-7
Load-deflection of T-8
Load-deflection of T-9
Figure 4.7.3: Load-deflection response of beam T-7 to T-9
0
20
40
60
80
100
120
0 10 20 30 40 50 60 70 80
Load
(kN
)
deflection (mm)
0
20
40
60
80
100
120
0 10 20 30 40 50 60 70 80
Load
(kN
)
deflection (mm)
0
20
40
60
80
100
120
0 10 20 30 40 50 60 70 80
Load
(kN
)
deflection (mm)

62
Load-Steel strain of T-7
Load-Steel strain of T-8
Figure 4.7.4: Load-Steel strain relationship of beam T-6 to T-8
0
20
40
60
80
100
120
0 0.002 0.004 0.006 0.008 0.01 0.012 0.014 0.016 0.018 0.02 0.022 0.024 0.026 0.028
Load
(kN
)
Steel strain (in/in)
0
20
40
60
80
100
120
0 0.002 0.004 0.006 0.008 0.01 0.012 0.014 0.016 0.018 0.02 0.022 0.024 0.026 0.028
Load
(kN
)
Steel strain (in/in)

63
Crack pattern of T-10
Crack pattern of T-11
Crack pattern of T-12
Figure 4.8.1: Crack pattern at failure of beam T-10 to T-12

64
Load-Crack width of T-10
Load-Crack width of T-11
Load-Crack width of T-12
Figure 4.8.2: Load vs Crack width of beam T-10 to T-12
0
10
20
30
40
50
60
70
0 0.5 1 1.5 2 2.5 3 3.5 4 4.5 5
Load
(kN
)
Crack width (mm)
0
10
20
30
40
50
60
70
0 0.5 1 1.5 2 2.5 3 3.5 4 4.5 5
Load
(kN
)
Crack width (mm)
0
10
20
30
40
50
60
70
0 0.5 1 1.5 2 2.5 3 3.5 4 4.5 5
Load
(kN
)
Crack width (mm)

65
Load-deflection of T-10
Load-deflection of T-11
Load-deflection of T-12
Figure 4.8.3: Load-deflection response of beam T-10 to T-12
0
10
20
30
40
50
60
70
0 10 20 30 40 50 60 70 80 90
Load
(kN
)
deflection (mm)
0
10
20
30
40
50
60
70
0 10 20 30 40 50 60 70 80 90
Load
(kN
)
deflection (mm)
0
10
20
30
40
50
60
70
0 10 20 30 40 50 60 70 80 90
Load
(kN
)
deflection (mm)

66
Load-Steel strain of T-10
Load-Steel strain of T-11
Load-Steel strain of T-12
Figure 4.8.4: Load-Steel strain relationship of beam T-10 to T-12
0
10
20
30
40
50
60
70
0 0.002 0.004 0.006 0.008 0.01 0.012 0.014 0.016 0.018 0.02 0.022
Load
(kN
)
Steel strain (in/in)
0
10
20
30
40
50
60
70
0 0.002 0.004 0.006 0.008 0.01 0.012 0.014 0.016 0.018 0.02 0.022
Load
(kN
)
Steel strain (in/in)
0
10
20
30
40
50
60
70
0 0.002 0.004 0.006 0.008 0.01 0.012 0.014 0.016 0.018 0.02 0.022
Load
(kN
)
Steel strain (in/in)

67
Crack pattern of XT-7
Crack pattern of XT-8
Crack pattern of XT-9
Figure 4.9.1: Crack pattern at failure of beam XT-7 to XT-9

68
Load-Crack width of XT-7
Load-Crack width of XT-8
Load-Crack width of XT-9
Figure 4.9.2: Load vs Crack width of beam XT-7 to XT-9
0
20
40
60
80
100
120
0 0.5 1 1.5 2 2.5 3 3.5
Load
(kN
)
Crack width (mm)
0
20
40
60
80
100
120
0 0.5 1 1.5 2 2.5 3 3.5
Load
(kN
)
Crack width (mm)
0
20
40
60
80
100
120
0 0.5 1 1.5 2 2.5 3 3.5
Load
(kN
)
Crack width (mm)

69
Load-deflection of XT-7
Load-deflection of XT-8
Load-deflection of XT-9
Figure 4.9.3: Load-deflection response of beam XT-7 to XT-9
0
20
40
60
80
100
120
0 10 20 30 40 50 60
Load
(kN
)
deflection (mm)
0
20
40
60
80
100
120
0 10 20 30 40 50 60
Load
(kN
)
deflection (mm)
0
20
40
60
80
100
120
0 10 20 30 40 50 60
Load
(kN
)
deflection (mm)
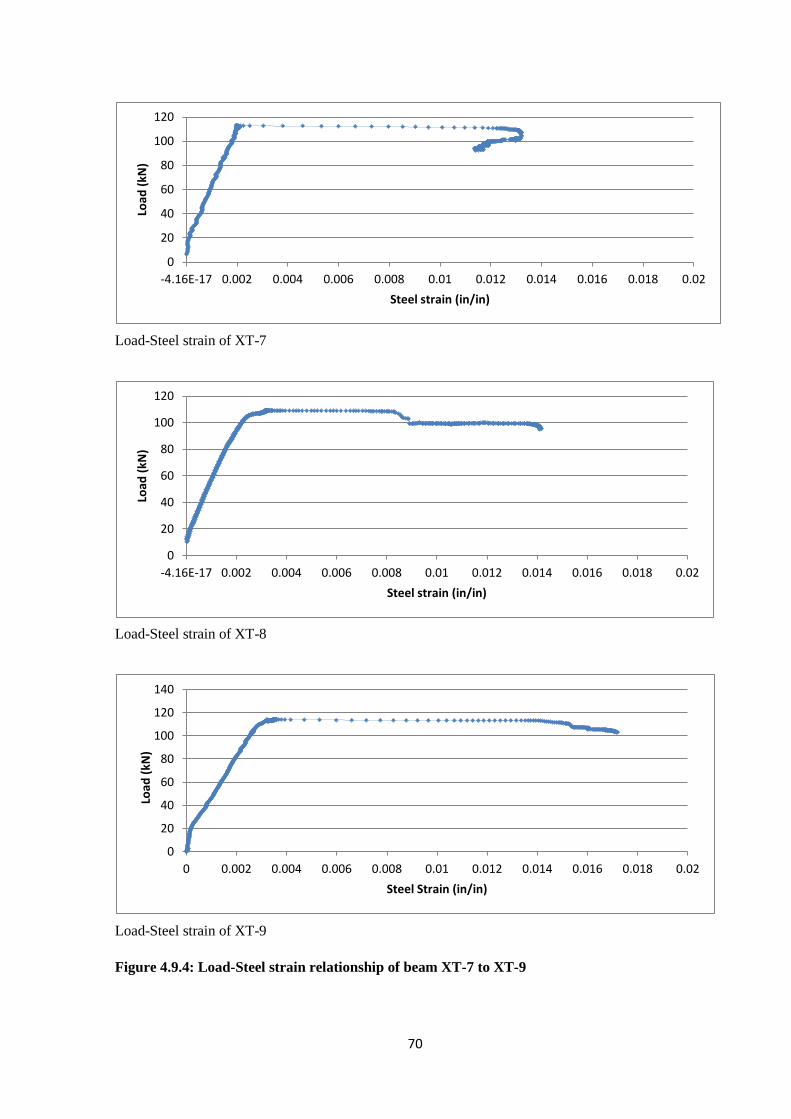
70
Load-Steel strain of XT-7
Load-Steel strain of XT-8
Load-Steel strain of XT-9
Figure 4.9.4: Load-Steel strain relationship of beam XT-7 to XT-9
0
20
40
60
80
100
120
-4.16E-17 0.002 0.004 0.006 0.008 0.01 0.012 0.014 0.016 0.018 0.02
Load
(kN
)
Steel strain (in/in)
0
20
40
60
80
100
120
-4.16E-17 0.002 0.004 0.006 0.008 0.01 0.012 0.014 0.016 0.018 0.02
Load
(kN
)
Steel strain (in/in)
0
20
40
60
80
100
120
140
0 0.002 0.004 0.006 0.008 0.01 0.012 0.014 0.016 0.018 0.02
Load
(kN
)
Steel Strain (in/in)
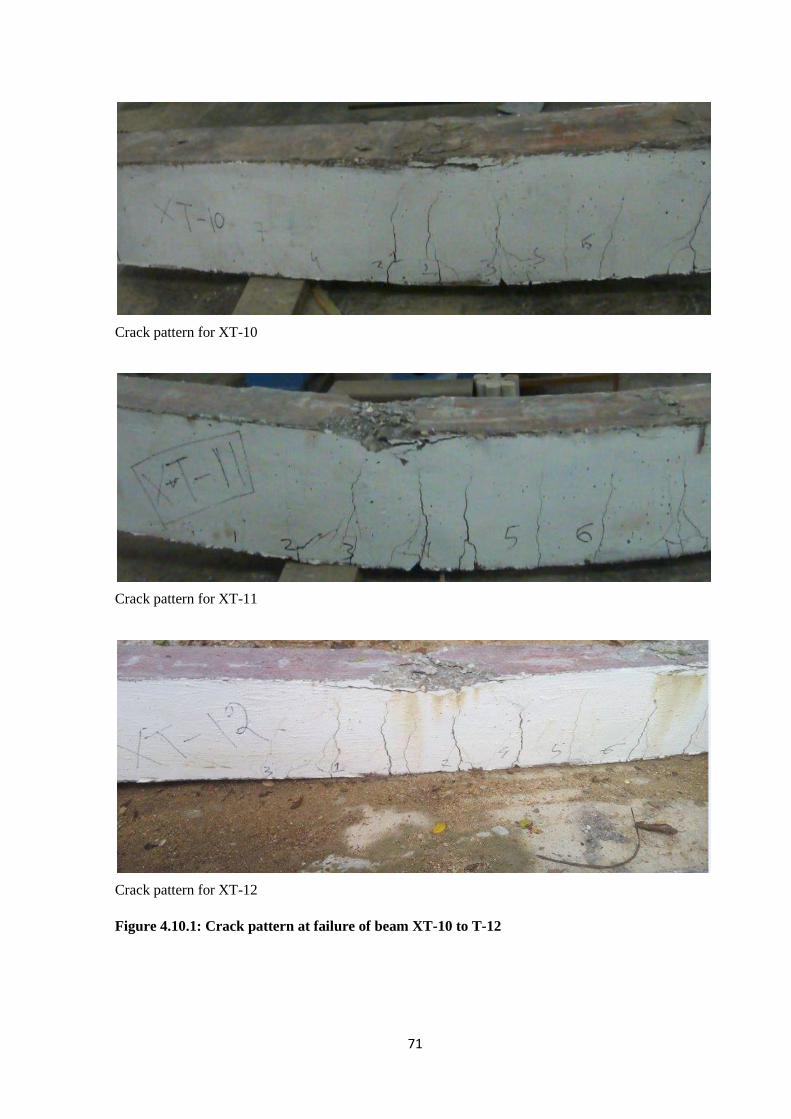
71
Crack pattern for XT-10
Crack pattern for XT-11
Crack pattern for XT-12
Figure 4.10.1: Crack pattern at failure of beam XT-10 to T-12
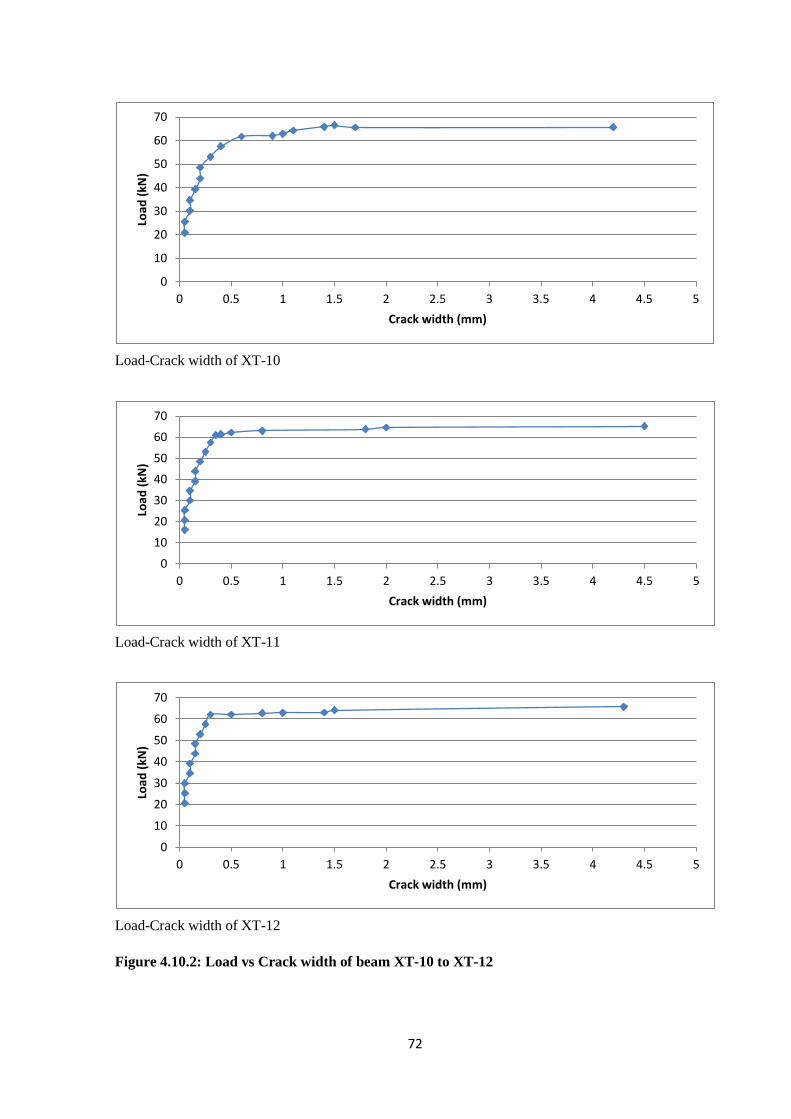
72
Load-Crack width of XT-10
Load-Crack width of XT-11
Load-Crack width of XT-12
Figure 4.10.2: Load vs Crack width of beam XT-10 to XT-12
0
10
20
30
40
50
60
70
0 0.5 1 1.5 2 2.5 3 3.5 4 4.5 5
Load
(kN
)
Crack width (mm)
0
10
20
30
40
50
60
70
0 0.5 1 1.5 2 2.5 3 3.5 4 4.5 5
Load
(kN
)
Crack width (mm)
0
10
20
30
40
50
60
70
0 0.5 1 1.5 2 2.5 3 3.5 4 4.5 5
Load
(kN
)
Crack width (mm)

73
Load-deflection of XT-10
Load-deflection of XT-11
Load-deflection of XT-12
Figure 4.10.3: Load-deflection response of beam XT-10 to XT-12
0
10
20
30
40
50
60
70
0 10 20 30 40 50 60 70 80 90
Load
(kN
)
deflection (mm)
0
10
20
30
40
50
60
70
0 10 20 30 40 50 60 70 80 90
Load
(kN
)
deflecion (mm)
0
10
20
30
40
50
60
70
0 10 20 30 40 50 60 70 80 90
Load
(kN
)
deflection (mm)

74
Load-Steel strain of XT-10
Load-Steel strain of XT-11
Load-Steel strain of XT-12
Figure 4.10.4: Load-Steel strain relationship of beam XT-10 to XT-12
0
10
20
30
40
50
60
70
80
0 0.002 0.004 0.006 0.008 0.01 0.012 0.014 0.016
Load
(kN
)
Steel strain (in/in)
0
10
20
30
40
50
60
70
-2.08E-17 0.002 0.004 0.006 0.008 0.01 0.012 0.014 0.016
Load
(kN
)
Steel strain (in/in)
0
10
20
30
40
50
60
70
0 0.002 0.004 0.006 0.008 0.01 0.012 0.014 0.016
Load
(kN
)
Steel strain (in/in)

75
Crack pattern for T-13
Crack pattern for T-14
Crack pattern for T-15
Figure 4.11.1: Crack pattern at failure of beam T-13 to T-15
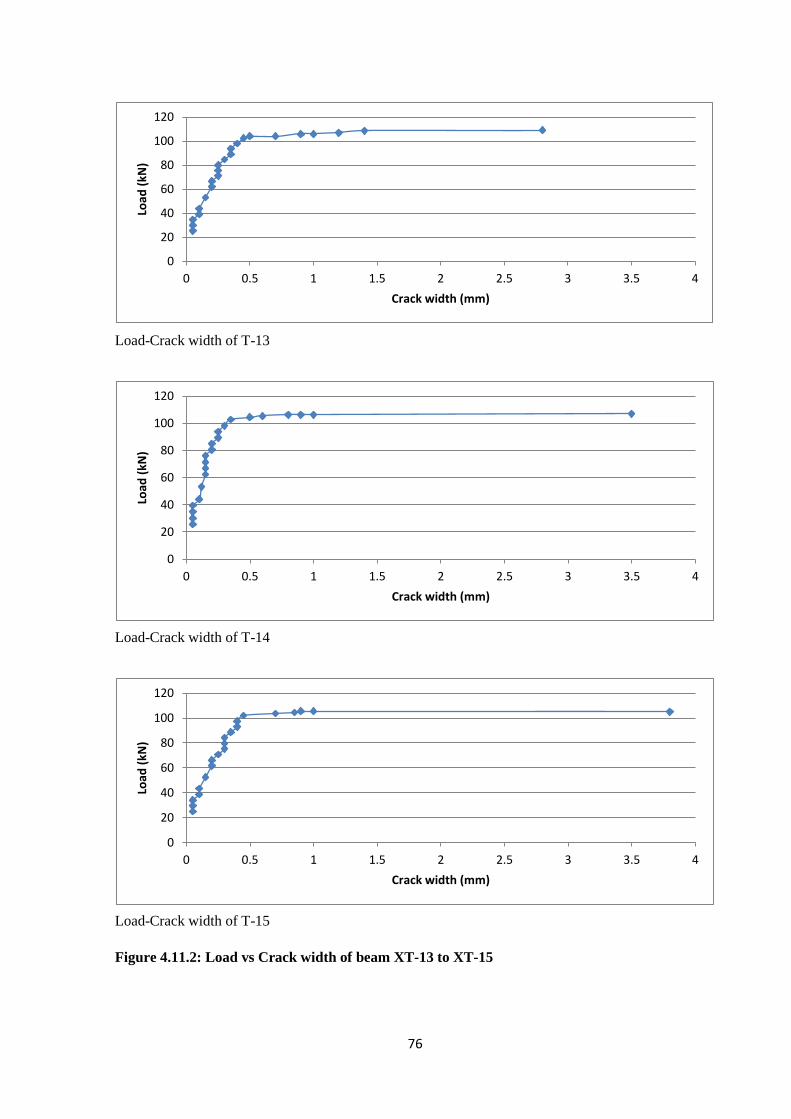
76
Load-Crack width of T-13
Load-Crack width of T-14
Load-Crack width of T-15
Figure 4.11.2: Load vs Crack width of beam XT-13 to XT-15
0
20
40
60
80
100
120
0 0.5 1 1.5 2 2.5 3 3.5 4
Load
(kN
)
Crack width (mm)
0
20
40
60
80
100
120
0 0.5 1 1.5 2 2.5 3 3.5 4
Load
(kN
)
Crack width (mm)
0
20
40
60
80
100
120
0 0.5 1 1.5 2 2.5 3 3.5 4
Load
(kN
)
Crack width (mm)

77
Load-deflection of T-13
Load-deflection of T-14
Load-deflection of T-15
Figure 4.11.3: Load-deflection response of beam T-13 to T-15
0
20
40
60
80
100
120
0 10 20 30 40 50 60 70
Load
(kN
)
deflection (mm)
0
20
40
60
80
100
120
0 10 20 30 40 50 60 70
Load
(kN
)
deflection (mm)
0
20
40
60
80
100
120
0 10 20 30 40 50 60 70
Load
(kN
)
deflection (mm)
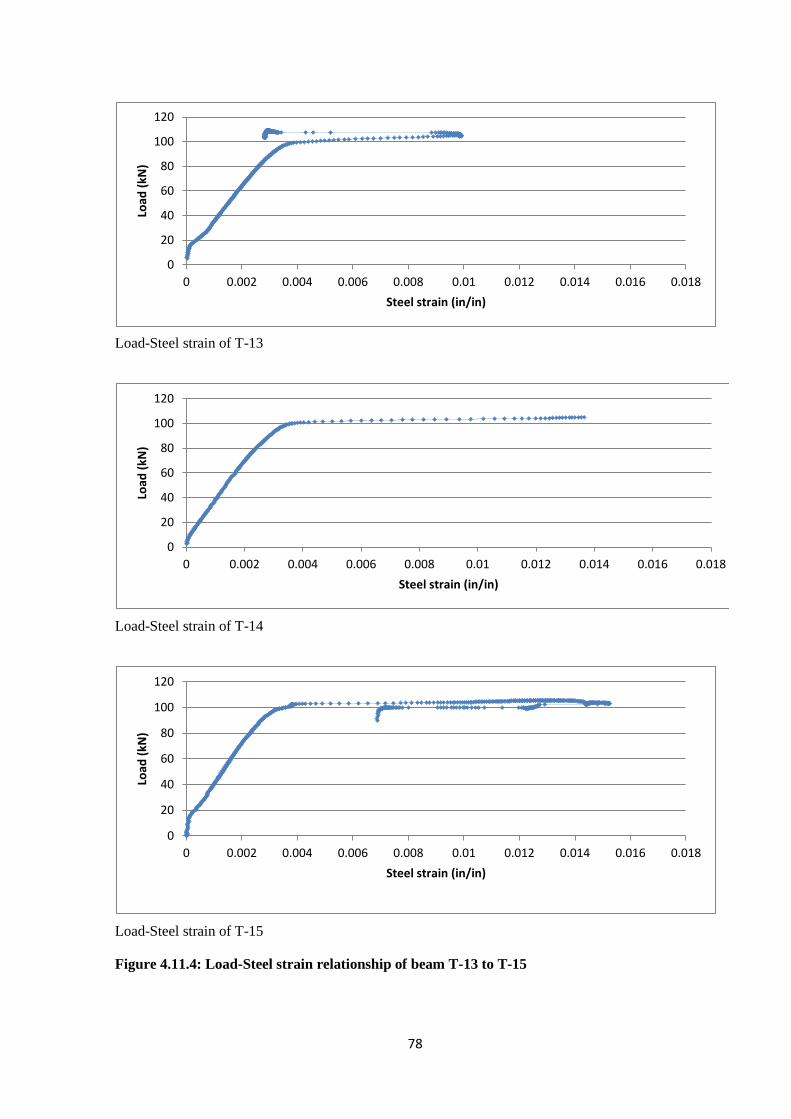
78
Load-Steel strain of T-13
Load-Steel strain of T-14
Load-Steel strain of T-15
Figure 4.11.4: Load-Steel strain relationship of beam T-13 to T-15
0
20
40
60
80
100
120
0 0.002 0.004 0.006 0.008 0.01 0.012 0.014 0.016 0.018
Load
(kN
)
Steel strain (in/in)
0
20
40
60
80
100
120
0 0.002 0.004 0.006 0.008 0.01 0.012 0.014 0.016 0.018
Load
(kN
)
Steel strain (in/in)
0
20
40
60
80
100
120
0 0.002 0.004 0.006 0.008 0.01 0.012 0.014 0.016 0.018
Load
(kN
)
Steel strain (in/in)
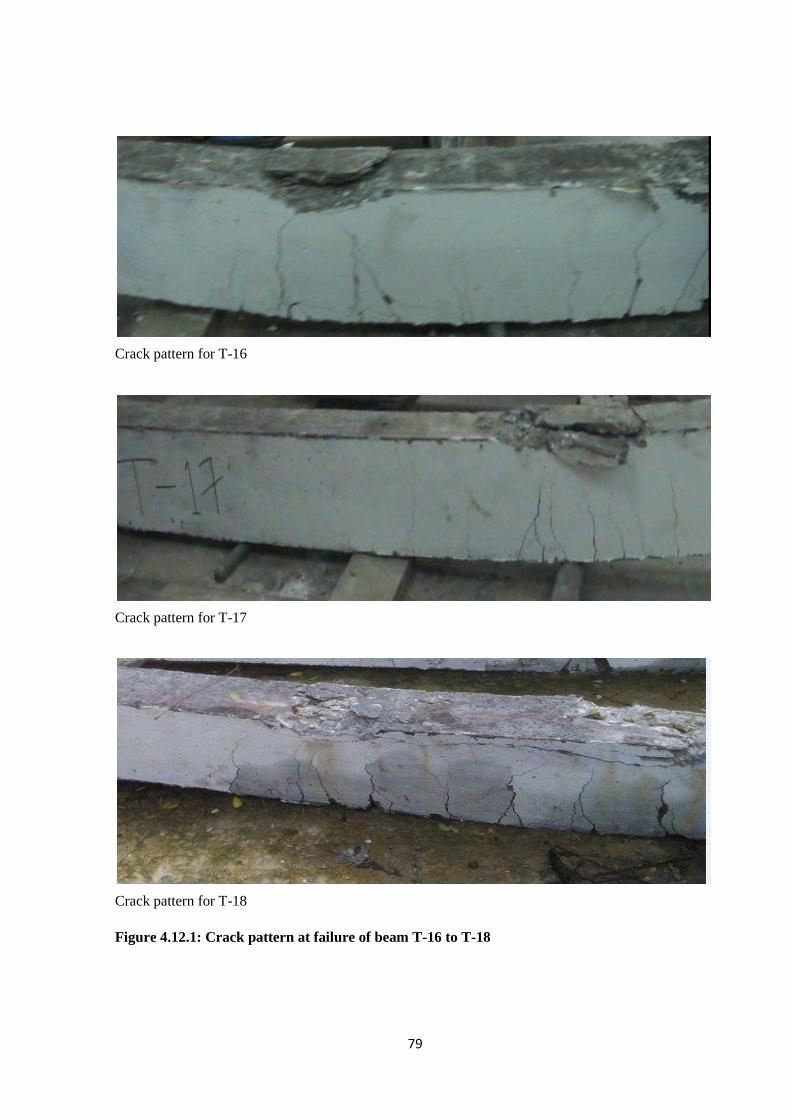
79
Crack pattern for T-16
Crack pattern for T-17
Crack pattern for T-18
Figure 4.12.1: Crack pattern at failure of beam T-16 to T-18
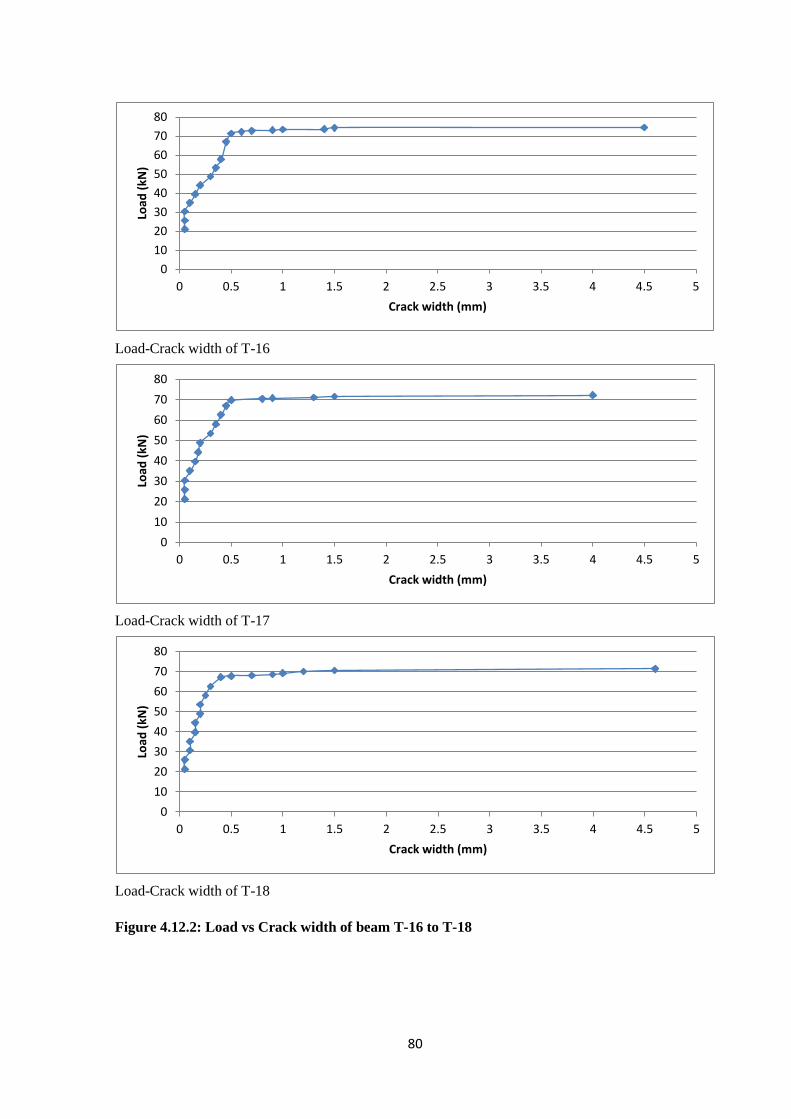
80
Load-Crack width of T-16
Load-Crack width of T-17
Load-Crack width of T-18
Figure 4.12.2: Load vs Crack width of beam T-16 to T-18
0
10
20
30
40
50
60
70
80
0 0.5 1 1.5 2 2.5 3 3.5 4 4.5 5
Load
(kN
)
Crack width (mm)
0
10
20
30
40
50
60
70
80
0 0.5 1 1.5 2 2.5 3 3.5 4 4.5 5
Load
(kN
)
Crack width (mm)
0
10
20
30
40
50
60
70
80
0 0.5 1 1.5 2 2.5 3 3.5 4 4.5 5
Load
(kN
)
Crack width (mm)

81
Load-deflection of T-16
Load-deflection of T-17
Load-deflection of T-18
Figure 4.12.3: Load-deflection response of beam T-16 to T-18
0
10
20
30
40
50
60
70
80
0 20 40 60 80 100 120
Load
(kN
)
deflection (mm)
0
10
20
30
40
50
60
70
80
0 20 40 60 80 100 120
Load
(kN
)
deflection (mm)
0
10
20
30
40
50
60
70
80
0 20 40 60 80 100 120
Load
(kN
)
deflection (mm)
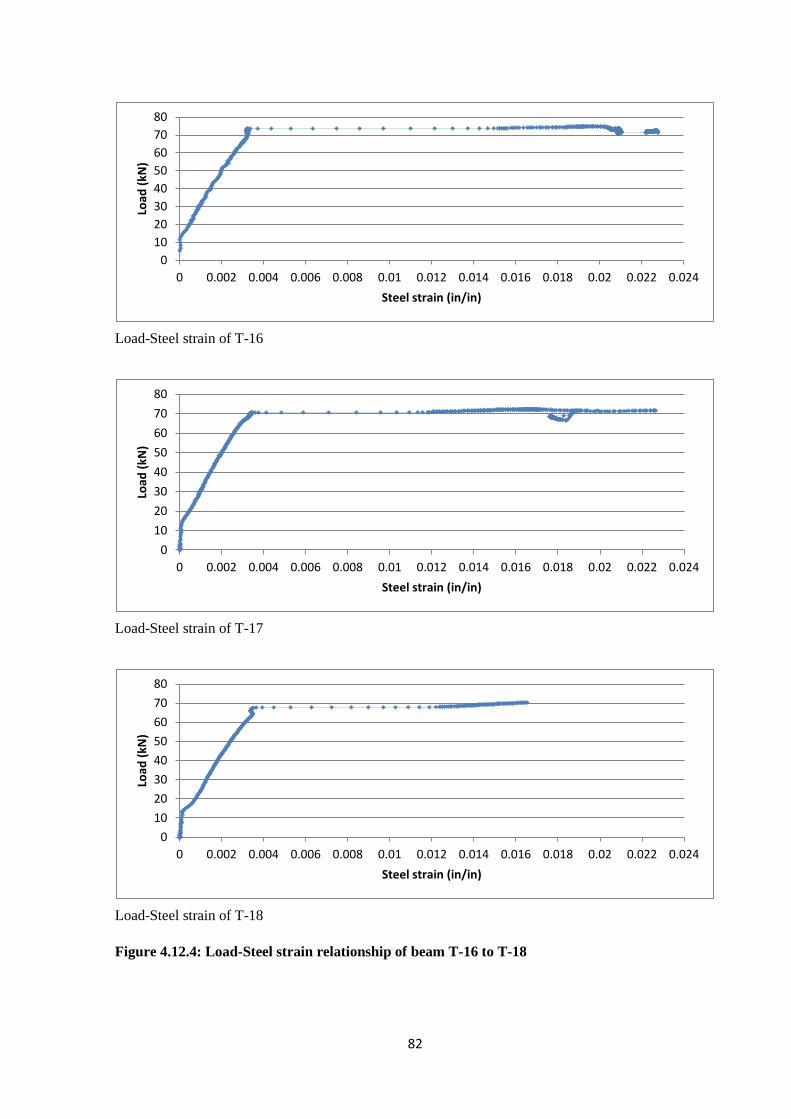
82
Load-Steel strain of T-16
Load-Steel strain of T-17
Load-Steel strain of T-18
Figure 4.12.4: Load-Steel strain relationship of beam T-16 to T-18
0
10
20
30
40
50
60
70
80
0 0.002 0.004 0.006 0.008 0.01 0.012 0.014 0.016 0.018 0.02 0.022 0.024
Load
(kN
)
Steel strain (in/in)
0
10
20
30
40
50
60
70
80
0 0.002 0.004 0.006 0.008 0.01 0.012 0.014 0.016 0.018 0.02 0.022 0.024
Load
(kN
)
Steel strain (in/in)
0
10
20
30
40
50
60
70
80
0 0.002 0.004 0.006 0.008 0.01 0.012 0.014 0.016 0.018 0.02 0.022 0.024
Load
(kN
)
Steel strain (in/in)

83
CHAPTER 5
DISCUSSION AND ANALYSIS OF EXPERIMENTAL RESULTS
5.1 GENERAL
Discussions on experimental results are presented in this chapter. A comparison between the obtained
results and the corresponding theoretical values is also presented. In addition, this chapter presents the
effects of various parameters, including the effect of the reinforcement ratio and Grade of steel on the
behavior of beam. This discussion eventually forms the basis to develop the general design
recommendations for the use of Grade 80 rebars as reinforcement for concrete flexural members.
5.2 FLEXURAL BEHAVIOR AND CRACK ISSUE
The performance of the tested beams has been evaluated through detail discussion on load-midspan
deflection, load-steel strain, and load-crack width behavior of each beam in Chapter 4. In this chapter,
a comparative study on the effect of tension reinforcement ratio (ρ), concrete compressive strength
(fc'), Grade of steel and steel ratio to maximum reinforcement ratio on the behavior of
beam is provided.
In general, all tested beams exhibited an ample ductility through large deformation, which is evident
by large straining in both the Grade 80 and Grade 60 steel rebar before failure as beams were designed
to behave as tension controlled memebr. All beams functioned satisfactorily according to the
minimum ductility required by ACI 318-14.The ACI allowable limits used in this study are 0.016 inch
(0.41 mm) for maximum crack width, and 0.283 inch (7.2 mm) for maximum mid-span deflection at
service load condition . The summaries of the experimental value for all of the tested
beams are reported in Table 5.1. From the table it can be seen that all the samples fulfilled this criteria
at service load level. However, in some cases, deflection values for Grade 80 samples were marginally
higher. As previously mentioned, beam behaviors are compared in this section, with a view to study
the effect of tension reinforcement ratio and concrete compressive strength on 80 Grade beam sample.
Later, these results are compared for investigating the effect of using Grade 80 rebars instead of
Grade 60 bars.
5.2.1 Behavior of Beam T-3 and Beam T-6
To utilize the high strength characteristics of the Grade 80 steel in Reinforced concrete beams, the
flexural performance of a lower reinforcement ratio (ρ=0.0067) was used for Beam T-6 and compared
with the higher reinforcement ratio (ρ=0.0102) used for Beam T-3. Variation of tension reinforcement
ratio (ρ) is about 52 percent. In both cases, concrete compressive strength was same; 3991 psi. For
both beams, minimum tension reinforcement ratio (ρmin) was 0.0025 and maximum reinforcement
ratio (ρmax) was 0.0135. The steel ratio to maximum reinforcement ratio was 0.76 for T-3
and 0.50 for T-6. Calculated Nominal moment capacities were 32.16 kN-m and 22.06 kN-m for T-3
and T-6, respectively. Both specimens were reinforced in the tension side using ASTM A706 Grade
80 steel rebars. The load-midspan deflection curves for both beams T-3 and T-6 are shown in Figure
5.2.1. For both beams, the behavior is almost linear up to the yielding point. The cracking load for
Beam T-6 was observed at 17 kN, while the cracking load for Beam T-3 was at a higher load of 21
kN. As the load increased, Beam T-6 exhibited higher stiffness reduction when compared to Beam T-
3. Higher reduction in the stiffness was primarily influenced by the lower reinforcement ratio used in
Beam T-6.

84
After yielding both beams exhibited stiffness reduction, but yielding load was higher for T-3 than T-6.
This behavior suggests that the increase in the reinforcement ratio of Grade 80 rebar resulted in an
increase of the overall stiffness of the beam. This relationship follows the classical theory of
reinforced concrete with mild steel as reinforcement. Upper face cracking load of Beam T-6 occurred
at a load level of 64.7 kN with a corresponding deflection of 58 mm, while for Beam T-3, it occurred
at 83.7 kN and at a corresponding deflection of 53 mm. Beam T-6 continued to carry load until 65 kN
with corresponding deflection of 143 mm while Beam T-3 continued to carry load until 84.2 kN with
corresponding deflection of 95 mm. Calculated nominal load capacity for T-3 was 79.15 kN and for
T-6, it was 54.4 kN. Thus, for both cases failure loads were higher than estimated nominal capacity.
For T-3, it was 7 percent higher than estimated, but for T-6, it was nearly 21 percent higher than the
calculated nominal capacity. These results indicate that a beam with a lower reinforcement ratio has
lower strength and higher ductility than a beam with a higher reinforcement ratio. In both cases, steel
strain exceeded a minimum requirement ( in/in) for tension controlled case of ACI 318-
14. Both beams provided ample warning by showing a large deflection and a series of extensive
cracks and no brittle type failure took place. Rather a gradual increase in deflection was noticed with
ductility factor (ductility factor is determined by dividing the deflection at failure by deflection at
yield; Ru= df/du) of 9.5 for T-6 and 5.6 for T-3.These values are regarded as satisfactory against the
required.
From the Load-Crack width relation of T-3 and T-6, it can be said that up to yielding, crack width of
beam T-6 (having lower tension reinforcement ratio) was slightly higher than beam T-3 (having
higher reinforcement ratio) for same load as expected. But in the non-linear portion, it suddenly varied
to a significant amount. It was also observed that T-6 underwent grater deflection than T-3 as well as
the maximum crack width value was higher for T-6 than T-3 as anticipated.
5.2.2 Behavior of Beam T-13 and Beam T-18
To utilize the high strength characteristics of the Grade 80 steel in reinforced concrete beams , the
flexural performance of a lower reinforcement ratio (ρ=0.0085) was used for Beam T-18 and
compared with the higher reinforcement ratio (ρ=0.0143) used for Beam T-13. Variation of tension
reinforcement ratio (ρ) between T-18 and T-13 was about 70 percent. In both cases, concrete
compressive strength was same; 5640 psi. For both beams, minimum tension reinforcement ratio
(ρmin) was 0.00282 and maximum reinforcement ratio (ρmax) was 0.0173. The steel ratio to maximum
reinforcement ratio was 0.83 for T-13 and 0.49 for T-18. Calculated Nominal moment
capacities were 44.79kN-m and 28.17 kN-m for T-13 and T-18, respectively. Both specimens were
reinforced in the tension side using ASTM A706 Grade 80 steel rebars. The load-midspan deflection
curves for both beams are shown in Figure 5.2.2. For both beams, the behavior is almost linear up to
the yielding point. The cracking load for Beam T-18 was observed as 21 kN, while the cracking load
for Beam T-13 was higher which was equal to 26 kN. As the load increased, Beam T-18 exhibited
higher stiffness reduction as compared to T-13. Higher reduction in the stiffness was primarily
influenced by the lower reinforcement ratio of T-18.
After yielding both beams exhibited stiffness reduction, but yielding load was higher for T-13 than T-
18.This behavior suggests that the increase in the reinforcement ratio of Grade 80 rebar resulted in an
increase in overall stiffness of the beam. This relationship also follows the classical theory of
reinforced concrete with mild steel as reinforcement. Upper face cracking load of Beam T-13
occurred at a load level of 106.9 kN with a corresponding deflection of 42 mm, while for Beam T-18,
it occurred at 70.7 kN and the corresponding deflection was 49 mm. Beam T-18 continued to carry
load until 71.41 kN with corresponding deflection of 110 mm while Beam T-13 continued to carry
load until 111.1 kN with corresponding deflection of 52 mm. Calculated nominal load capacity for T-
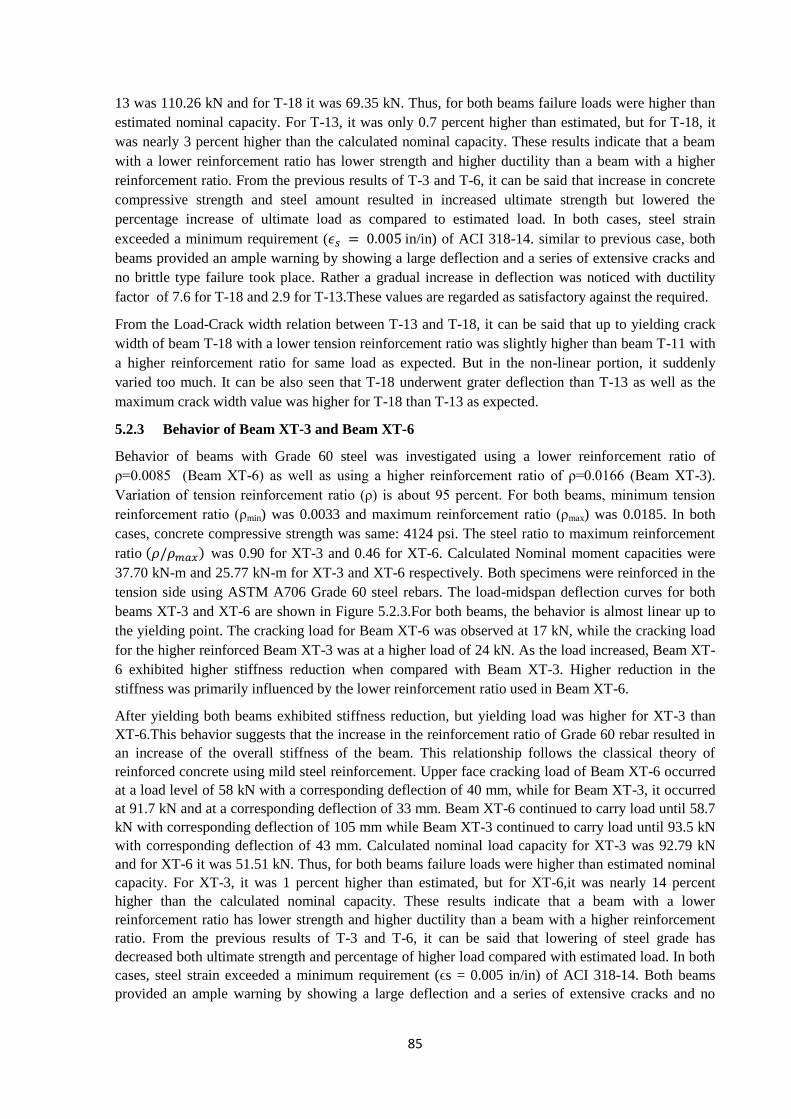
85
13 was 110.26 kN and for T-18 it was 69.35 kN. Thus, for both beams failure loads were higher than
estimated nominal capacity. For T-13, it was only 0.7 percent higher than estimated, but for T-18, it
was nearly 3 percent higher than the calculated nominal capacity. These results indicate that a beam
with a lower reinforcement ratio has lower strength and higher ductility than a beam with a higher
reinforcement ratio. From the previous results of T-3 and T-6, it can be said that increase in concrete
compressive strength and steel amount resulted in increased ultimate strength but lowered the
percentage increase of ultimate load as compared to estimated load. In both cases, steel strain
exceeded a minimum requirement ( in/in) of ACI 318-14. similar to previous case, both
beams provided an ample warning by showing a large deflection and a series of extensive cracks and
no brittle type failure took place. Rather a gradual increase in deflection was noticed with ductility
factor of 7.6 for T-18 and 2.9 for T-13.These values are regarded as satisfactory against the required.
From the Load-Crack width relation between T-13 and T-18, it can be said that up to yielding crack
width of beam T-18 with a lower tension reinforcement ratio was slightly higher than beam T-11 with
a higher reinforcement ratio for same load as expected. But in the non-linear portion, it suddenly
varied too much. It can be also seen that T-18 underwent grater deflection than T-13 as well as the
maximum crack width value was higher for T-18 than T-13 as expected.
5.2.3 Behavior of Beam XT-3 and Beam XT-6
Behavior of beams with Grade 60 steel was investigated using a lower reinforcement ratio of
ρ=0.0085 (Beam XT-6) as well as using a higher reinforcement ratio of ρ=0.0166 (Beam XT-3).
Variation of tension reinforcement ratio (ρ) is about 95 percent. For both beams, minimum tension
reinforcement ratio (ρmin) was 0.0033 and maximum reinforcement ratio (ρmax) was 0.0185. In both
cases, concrete compressive strength was same: 4124 psi. The steel ratio to maximum reinforcement
ratio was 0.90 for XT-3 and 0.46 for XT-6. Calculated Nominal moment capacities were
37.70 kN-m and 25.77 kN-m for XT-3 and XT-6 respectively. Both specimens were reinforced in the
tension side using ASTM A706 Grade 60 steel rebars. The load-midspan deflection curves for both
beams XT-3 and XT-6 are shown in Figure 5.2.3.For both beams, the behavior is almost linear up to
the yielding point. The cracking load for Beam XT-6 was observed at 17 kN, while the cracking load
for the higher reinforced Beam XT-3 was at a higher load of 24 kN. As the load increased, Beam XT-
6 exhibited higher stiffness reduction when compared with Beam XT-3. Higher reduction in the
stiffness was primarily influenced by the lower reinforcement ratio used in Beam XT-6.
After yielding both beams exhibited stiffness reduction, but yielding load was higher for XT-3 than
XT-6.This behavior suggests that the increase in the reinforcement ratio of Grade 60 rebar resulted in
an increase of the overall stiffness of the beam. This relationship follows the classical theory of
reinforced concrete using mild steel reinforcement. Upper face cracking load of Beam XT-6 occurred
at a load level of 58 kN with a corresponding deflection of 40 mm, while for Beam XT-3, it occurred
at 91.7 kN and at a corresponding deflection of 33 mm. Beam XT-6 continued to carry load until 58.7
kN with corresponding deflection of 105 mm while Beam XT-3 continued to carry load until 93.5 kN
with corresponding deflection of 43 mm. Calculated nominal load capacity for XT-3 was 92.79 kN
and for XT-6 it was 51.51 kN. Thus, for both beams failure loads were higher than estimated nominal
capacity. For XT-3, it was 1 percent higher than estimated, but for XT-6,it was nearly 14 percent
higher than the calculated nominal capacity. These results indicate that a beam with a lower
reinforcement ratio has lower strength and higher ductility than a beam with a higher reinforcement
ratio. From the previous results of T-3 and T-6, it can be said that lowering of steel grade has
decreased both ultimate strength and percentage of higher load compared with estimated load. In both
cases, steel strain exceeded a minimum requirement (ϵs = 0.005 in/in) of ACI 318-14. Both beams
provided an ample warning by showing a large deflection and a series of extensive cracks and no
86
brittle type failure took place. Rather a gradual increase in deflection was noticed with ductility factor
of 9.3 for XT-6 and 2.8 for XT-3.These values are regarded as satisfactory against the required.
From the Load-Crack width relation between XT-3 and XT-6, it can be said that up to yielding crack
width of beam XT-6 with a lower tension reinforcement ratio was slightly higher than beam XT-3
with a higher reinforcement ratio as expected. But in the non-linear portion, it suddenly varied too
much. It can be also seen that XT-6 underwent grater deflection than XT-3 as well as the maximum
crack width value was higher for XT-6 than XT-3 as expected.
5.2.4 Behavior of Beam XT-8 and Beam XT-11
To utilize the characteristics of the Grade 60 steel in Reinforced concrete beams, the flexural
performance of a lower reinforcement ratio(ρ=0.0102) was used for Beam XT-11 and compared with
the higher reinforcement ratio(ρ=0.0189) used for Beam XT-8. Variation of tension reinforcement
ratio (ρ) is about 85 percent. In both cases, concrete compressive strength was same: 4120 psi. For
both beams, minimum tension reinforcement ratio (ρmin) was 0.004 and maximum reinforcement
ratio (ρmax) was 0.0245.The steel ratio to maximum reinforcement ratio was 0.77 for XT-
8 and 0.42 for XT-11. Calculated Nominal moment capacities were 44.68 kN-m and 25.77 kN-m for
XT-8 and XT-11 respectively. Both specimens were reinforced in the tension side using ASTM A706
Grade 60 steel rebars. The load-midspan deflection curves for both beams XT-3 and XT-6 are shown
in Figure 5.2.4.For both beams, the behavior is almost linear up to the yielding point. The cracking
load for Beam XT-8 was observed at 16 kN, while the cracking load for the higher reinforced beam,
Beam XT-3, occurred at a higher load of 26 kN. As the load increased, Beam XT-11 exhibited higher
stiffness reduction when compared with Beam XT-8. Higher reduction in the stiffness was primarily
influenced by the lower reinforcement ratio used in Beam XT-11.
After yielding both beams exhibited stiffness reduction, but yielding load was higher for XT-8 than
XT-11.This behavior suggests that the increase in the reinforcement ratio of Grade 60 rebar resulted
in an increase of the overall stiffness of the beam. This relationship follows the classical theory of
reinforced concrete using mild steel reinforcement. Upper face cracking load of Beam XT-11
occurred at a load level of 65 kN with a corresponding deflection of 47.7 mm, while for Beam XT-8,
it occurred at 107 kN and at a corresponding deflection of 28.7 mm. Beam XT-11 continued to carry
load until 65 kN with corresponding deflection of 80 mm while Beam XT-8 continued to carry load
until 109 kN with corresponding deflection of 45 mm. Calculated nominal load capacity for XT-8 was
108.9 kN and for XT-6 it was 63.3 kN. Thus, for both beams failure loads were higher than estimated
nominal capacity. For XT-8, it was 0.1 percent higher than estimated, but for XT-11, it was nearly 4
percent higher than the calculated nominal capacity. These results indicate that a beam with a lower
reinforcement ratio has lower strength and higher ductility than a beam with a higher reinforcement
ratio. From the previous results of XT-3 and XT-6, it can be said that increase of concrete
compressive strength and amount of steel has increased ultimate strength but lowered percentage of
higher load compared with estimated load. From the previous results of T-13 and T-18, it can be said
that lowering of steel grade has decreased both ultimate strength and percentage of higher load
compared with estimated load. In both cases, steel strain exceeded a minimum requirement (ϵs =
0.005 in/in) of ACI 318-14. Both beams provided an ample warning by showing a large deflection
and a series of extensive cracks and no brittle type failure took place. Rather a gradual increase in
deflection was noticed with ductility factor of 8 for XT-11 and 2.9 for XT-8.These values are regarded
as satisfactory against the required.
From the Load-Crack width relation between XT-8 and XT-11, it can be said that up to yielding crack
width of beam XT-11 with a lower tension reinforcement ratio was slightly higher than beam XT-8
with a higher reinforcement ratio for same load as expected. But in the non-linear portion, it suddenly
varied too much. It can be also seen that XT-11 underwent grater deflection than XT-8 as well as the
maximum crack width value was higher for X T-11 than XT-8 as expected.
87
5.2.5 Behavior of Beam T-11 and Beam T-18
To utilize the effect of concrete compressive strength (fc'), the flexural performance of a lower
concrete compressive strength (fc'=3900 psi) was used for Beam T-11 and compared with the higher
concrete compressive strength (fc'=5640 psi), used for Beam T-18 .The tension reinforcement ratio (ρ)
used for Beam T-11 was 0.0080, while 0.0085 was used for Beam T-18, which were very close.
Variation of tension reinforcement ratio was 6 percent and variation of concrete compressive strength
was 45 percent. Calculated Nominal moment capacities were 25.66 kN-m and 28.17 kN-m for T-11
and T-18 respectively. Both specimens were reinforced in the tension side using ASTM A706 Grade
80 steel rebars. The load-midspan deflection curves for both beams T-11 and T-18 are shown in
Figure 5.2.5. The behavior is almost linear up to the yielding point. The cracking load for Beam T-11
was observed at 16 kN, while the cracking load for the higher concrete compressive strength, Beam
T-18 was at a higher load of 21 kN. As the load increased, Beam T-11 exhibited higher stiffness
reduction when compared to beam T-18. Higher reduction in the stiffness was primarily influenced by
the lower concrete compressive strength used in Beam T-11.
After yielding both beams exhibited stiffness reduction, but yielding load was higher for T-18 than T-
11.This behavior suggests that the increase in the concrete compressive strength resulted in an
increase of the overall stiffness of the beam. This relationship follows the classical theory of
reinforced concrete. Upper face cracking load of Beam T-11 occurred at a load level of 64 kN with a
corresponding deflection of 47.7 mm, while for Beam T-18 it occurred at 71 kN and at a
corresponding deflection of 49 mm. Beam T-11 continued to carry load until 65 kN with
corresponding deflection of 80 mm while Beam T-18 continued to carry load until 71 kN with
corresponding deflection of 110 mm. Calculated nominal load capacity for T-11 was 63 kN and for T-
18 it was 69.4 kN. Thus, for both cases failure loads were higher than estimated nominal capacity. For
T-11, it was 4 percent higher than estimated, but for T-18, it was nearly 3 percent higher than the
calculated nominal capacity. These results indicate that a beam with a lower concrete compressive
strength has lower strength than a beam with a higher concrete compressive strength as expected.
From the previous results, it can be said that influence of reinforcement ratio is much significant than
concrete compressive strength on the strength of the beam. In both cases, steel strain exceeded a
minimum requirement ( in/in) of ACI 318-14. Both beams provided an ample warning by
showing a large deflection and a series of extensive cracks and no brittle type failure took place.
Rather a gradual increase in deflection was noticed with ductility factor of 5.5 for T-11 and 7.6 for T-
18.These values are regarded as satisfactory against the required.
From the Load-Crack width relation between T-11 and T-18, it can be said that crack width of beam
T-11 with a lower concrete compressive strength ratio was slightly higher than beam T-18 with a
higher concrete compressive strength for same load as expected. From the previous results, it can be
said that compared to tension reinforcement ratio, concrete compressive strength plays a minor role in
case of change of stiffness and ultimate strength. Effect of tension reinforcement ratio is much more
visible.
5.2.6 Behavior of Beam T-6 and Beam T-18
To utilize the effect of steel ratio to maximum reinforcement ratio of the Grade 80 steel in
Reinforced concrete beams, the flexural performance of Beam T-6 was compared with Beam T-
18.For T-6, concrete compressive strength (fc') was 3990 psi and for T-18 concrete compressive
strength (fc') was 5640 psi. The tension reinforcement ratio ( ) used for Beam T-6 was 0.0067, while
0.0085 was used for Beam T-18. Variation of tension reinforcement ratio ( ) is about 27 percent and
variation of concrete compressive strength (fc') was about 41 percent. The steel ratio to maximum

88
reinforcement ratio was 0.50 for T-6 and 0.49 for T-18, which were very close. Calculated
Nominal moment capacities were 22.06 kN-m and 28.17 kN-m for T-6 and T-18 respectively. Both
specimens were reinforced in the tension side using ASTM A706 Grade 80 steel rebars. The load-
midspan deflection curves for both beams T-6 and T-18 are shown in Figure 5.2.6.For both cases, the
behavior is almost linear up to the yielding point. The cracking load for Beam T-6was observed at 17
kN, while the cracking load for Beam T-18 was at a higher load of 21 kN. Both T-6 and T-18
exhibited similar stiffness reduction until yielding.
Both yielding and ultimate load was higher for T-18 than T-6.This behavior suggests that the increase
in the reinforcement ratio of Grade 80 rebar and increase of concrete compressive strength resulted in
an increase of overall stiffness of the beam. This relationship follows the classical theory of reinforced
concrete using mild steel reinforcement. Upper face cracking load of Beam T-6 occurred at a load
level of 64.7 kN with a corresponding deflection of 58 mm, while for Beam T-18, it occurred at 71 kN
and at a corresponding deflection of 49 mm. Beam T-6 continued to carry load until 65.7 kN with
corresponding deflection of 143 mm while Beam T-18 continued to carry load until 71 kN with
corresponding deflection of 110 mm. Calculated nominal load capacity for T-18 was 69.4 kN and for
T-6 it was 54.4 kN. Thus, failure loads were higher than estimated nominal capacity. For T-18, it was
3 percent higher than estimated, but for T-6, it was nearly 21 percent higher than the calculated
nominal capacity. These results indicate that beams with similar steel ratio to maximum reinforcement
ratio value behaves similar. In both cases, steel strain exceeded a minimum requirement
( in/in) of ACI 318-14. Both beams provided an ample warning by showing a large
deflection and a series of extensive cracks and no brittle type failure took place. Rather a gradual
increase in deflection was noticed with ductility factor of for 9.5 T-6 and 7.6 for T-18.These values
are regarded as satisfactory against the required.
From the Load-Crack width relation between T-6 and T-18, it can be said that up to yielding crack
width of beam T-6 with a lower tension reinforcement ratio and concrete compressive strength was
slightly higher than beam T-18 with a higher reinforcement ratio and concrete compressive strength
for same load as expected. It can be also seen that T-6 underwent grater deflection than T-18.
5.2.7 Behavior of Beam XT-6 and Beam XT-12
To utilize the effect of maximum reinforcement ratio to reinforcement ratio of the Grade 60
steel in Reinforced concrete beams, the flexural performance of Beam XT-6 was compared with
Beam XT-12.For XT-6, concrete compressive strength was (fc') 4120 psi and for XT-12 concrete
compressive strength (fc') was 6270 psi. The tension reinforcement ratio ( ) used for Beam XT-6 was
0.0085 while 0.0102 was used for Beam XT-12. Variation of tension reinforcement ratio (ρ) is about
20 percent and variation of concrete compressive strength (fc') was 52 percent. The ratio of maximum
reinforcement ratio to reinforcement ratio was 0.46 for XT-6 and 0.42 for XT-12, which
were close. Calculated Nominal moment capacities were 20.93 kN-m and 25.77 kN-m for XT-6 and
XT-12 respectively. Both specimens were reinforced in the tension side using ASTM A706 Grade 60
steel rebars. The load-midspan deflection curves for both beams XT-6 and XT-12 are shown in Figure
5.2.7. For both beams, the behavior is almost linear up to the yielding point. The cracking load for
Beam XT-6 was observed at 17 kN, while the cracking load for Beam XT-12 was at a higher load of
20 kN. Both XT-6 and XT-12 exhibited similar stiffness reduction until yielding.
Both yielding and ultimate load was higher for XT-12 than XT-6. This behavior suggests that the
increase in the reinforcement ratio of Grade 60 rebar and increase of concrete compressive strength
resulted in an increase of overall stiffness of the beam. This relationship follows the classical theory
of reinforced concrete using mild steel reinforcement. Upper face cracking load of Beam XT-6

89
occurred at a load level of 58 kN with a corresponding deflection of 40 mm, while for Beam XT-12, it
occurred at 64 kN and at a corresponding deflection of 45 mm. Beam XT-6 continued to carry load
until 58.7 kN with corresponding deflection of 105 mm while Beam XT-12 continued to carry load
until 66 kN with corresponding deflection of 85 mm. Calculated nominal load capacity for XT-12 was
63.3 kN and for XT-6 it was 51.5 kN. Thus, for both beams failure loads were higher than estimated
nominal capacity. For XT-12, it was 5 percent higher but for XT-6, it was nearly 15 percent higher
than the calculated nominal capacity. These results indicate that beams with similar steel ratio to
maximum reinforcement ratio value behaves similar. In both cases, steel strain exceeded a
minimum requirement ( in/in) of ACI 318-14. Both beams provided an ample warning by
showing a large deflection and a series of extensive cracks and no brittle type failure took place.
Rather a gradual increase in deflection was noticed with ductility factor of 9.3 for XT-6 and for 8.1
XT-12.These values are regarded as satisfactory against the required.
From the Load-Crack width relation between XT-6 and XT-12, it can be said that up to yielding crack
width of beam XT-6 with a lower tension reinforcement ratio and concrete compressive strength was
slightly higher than beam XT-12 with a higher reinforcement ratio and concrete compressive strength
for same load as expected. It can be also seen that XT-6 underwent grater deflection than XT-12.
5.2.8 Behavior of Beam XT-6 and Beam T-11
To evaluate the flexural response of concrete beams reinforced with ASTM A706 Grade 80 rebars,
load-midspan deflection in Beam T-11 was compared to the behavior of the beam reinforced with
ASTM A706 Grade 60 steel, Beam XT-6, which was reinforced with the similar tension
reinforcement ratio ( ) and concrete compressive strength (fc') as T-11 .The tension reinforcement
ratio( ) was 0.0085 for XT-6 and 0.0080 for T-6, while the concrete compressive strengths (fc') were
4120 psi and 3900 psi respectively. Variation of tension reinforcement ratio ( ) is about 6 percent and
variation of concrete compressive strength (fc') was also about 6 percent. The steel ratio to maximum
reinforcement ratio value was 0.46 for XT-6 and 0.61 for T-11. Calculated Nominal
moment capacities were 20.93 kN-m and 25.66 kN-m for XT-6 and T-11 respectively.
As evident in Figure 5.2.8, the load-midspan deflection behaviors of the two beams show that
deflection increases linearly with an increase in the applied load prior to yielding.
After the initiation of the first crack, which occurred at the load level of 16 kN for T-11 and 17 kN for
XT-6, both Beams experience almost similar magnitude of stiffness reduction. Stiffness reduction was
little higher for T-11 as tension reinforcement ratio ( ) and concrete compressive strength was lower
than XT-6. This behavior is attributed to the similar elastic modulus value for the two reinforcing
materials and the similar reinforcement ratio. As the load continued to increase, the both beams
behaved as expected by showing signs of yielding of the reinforcement. For XT-6, yielding occurred
at the load of 54 kN and at the midspan deflection of 11.5 mm followed by significant deformation
with the slight increase in the applied load. For T-11, yielding occurred at the load of 57 kN and at the
midspan deflection of 15 mm followed by significant deformation with the slight increase in the
applied load. Cracking load was slightly higher for Grade 60 reinforced beam XT-6 because of greater
stiffness, but yielding load was higher in case of Grade 80 reinforced beam T-11.This is because
yielding strain is higher for Grade 80 rebars while Modulus of Elasticity remains the same.
Failure of Beam XT-6 occurred at 58.7 kN .The deflection at ultimate load was measured at 105 mm,
as shown in Figure 5.2.8. The ultimate load of Beam T-11 was 64.6 kN, which occurred at a 84 mm
deflection. ..In comparison to the beam reinforced with Grade 60 steel, the maximum load of the
almost equally reinforced Grade 80 beam was 10 percent higher. Calculated nominal load capacity for
XT-6 was 51.51 kN and for T-11 it was 62.98 kN. Thus, for both beams failure loads were higher than

90
estimated nominal capacity. For XT-6, it was 14 percent higher than estimated, but for T-11, it was
nearly 3 percent higher than the calculated nominal load. In both cases, steel strain exceeded a
minimum ductility requirement ( in/in) ACI 318-14. Beam T-11 and Beam XT-6 provide
an ample warning by showing a large deflection and a series of extensive cracks and no brittle type
failure took place. Rather a gradual increase in deflection was noticed with ductility factor of for 9.3
XT-6 and 5.5 for T-11.These values are regarded as satisfactory against the required.
From the Load-Crack width and Load deflection relations between XT-6 and T-11, it can be said that
up to yielding both beams behave almost similar. But in the non-linear portion, Grade 80 sample
requires higher load for similar deflection and crack width as expected.
5.2.9 Behavior of Beam XT-6 and Beam T-6
To evaluate the flexural response of concrete beams reinforced with ASTM A706 Grade 80 rebars,
load-midspan deflection in Beam T-6 was compared to the behavior of the beam reinforced with
ASTM A706 Grade 60 steel, Beam XT-6, which was reinforced with the different tension
reinforcement ratio (ρ) and similar concrete compressive strength (fc') compared to T-6 .The tension
reinforcement ratio (ρ) was 0.0085 for XT-6 and 0.0067 for T-6, while the concrete compressive
strengths (fc') were 4120 psi and 3990 psi respectively. Variation of tension reinforcement ratio (ρ) is
about 27 percent and variation of concrete compressive strength was only 3 percent. The steel ratio to
maximum reinforcement ratio t value was 0.46 for XT-6 and 0.50 for T-6, which were
close. Calculated Nominal moment capacities were 20.93 kN-m and 22.06 kN-m for XT-6 and T-6
respectively.
As evident in Figure 5.2.9, the load-midspan deflection behaviors of the two beams show that
deflection increases linearly with an increase in the applied load prior to yielding.
After the initiation of the first crack, which occurred at the load level of 17 kN for both T-6 and XT-6,
both Beams experience almost similar magnitude of stiffness reduction although for T-6 tension
reinforcement ratio(ρ)and concrete compressive strength was lower than XT-6. As the load continued
to increase, the both beams behaved as expected by showing signs of yielding of the reinforcement.
For XT-6, yielding occurred at the load of 54 kN and at the midspan deflection of 11.5 mm followed
by significant deformation with the slight increase in the applied load. For T-6, yielding occurred at
the load of 63 kN and at the midspan deflection of 15 mm followed by significant deformation with
the slight increase in the applied load. Both deflection and yielding load was higher for T-6 compared
to XT-6 .This is because yielding strain is higher for Grade 80 rebars while Modulus of Elasticity
remains the same.
Failure of Beam XT-6 occurred at 58.7 kN. The deflection at ultimate load was measured at 105 mm,
as shown in Figure 5.2.9. The ultimate load of Beam T-6 was 65 kN, which occurred at a 143 mm
deflection. In comparison to the beam reinforced with Grade 60 steel, calculated nominal load
capacity for XT-6 was 51.51 kN and for T-6 it was 54.4 kN. Thus, for both beams failure loads were
higher than estimated nominal capacity. For XT-6, it was 14 percent higher than estimated, but for T-
6, it was nearly 21 percent higher than the calculated nominal capacity. From the previous results of
XT-6 and T-11 it can be said that although variation of reinforcement ratio was different in this case,
but behaviors were not. Similarity was steel ratio to maximum reinforcement ratio value.
Thus, steel ratio to maximum reinforcement ratio value played an important role in
behaviors of the beams. In both cases, steel strain exceeded a minimum requirement (
in/in) of ACI 318-14. Beam T-11 and Beam XT-6 provide an ample warning by showing a large
deflection and a series of extensive cracks and no brittle type failure took place. Rather a gradual
91
increase in deflection was noticed with ductility factor of 9.3 for XT-6 and 9.5 for T-6.These values
are regarded as satisfactory against the required.
From the Load-Crack width and Load deflection relations between XT-6 and T-6, it can be said that
up to yielding both beams behave almost similar. But in the non-linear portion, Grade 80 sample
requires higher load for similar deflection and crack width as expected.
5.2.10 Behavior of Beam XT-3 and Beam T-8
To evaluate the flexural response of concrete beams reinforced with ASTM A706 Grade 80 rebars,
load-midspan deflection in Beam T-8 was compared to the behavior of the beam reinforced with
ASTM A706 Grade 60 steel, Beam XT-3, which was reinforced with the different tension
reinforcement ratio (ρ) and similar concrete compressive strength (fc') compared to T-8.The tension
reinforcement ratio (ρ) was 0.0166 for XT-3 and 0.0126 for T-8, while the concrete compressive
strengths (fc') were 4120 psi and 3900 psi respectively. Variation of tension reinforcement ratio ( ) is
about 32 percent and variation of concrete compressive strength (fc') was only 6 percent. The steel
ratio to maximum reinforcement ratio value was 0.90 for XT-3 and 0.96 for T-8, which
were close. Calculated Nominal moment capacities were 37.70 kN-m and 37.70 kN-m for XT-3 and
T-8 respectively, which were same.
As evident in Figure 5.2.10, the load-midspan deflection behaviors of the two beams show that
deflection increases linearly with an increase in the applied load prior to yielding.
After the initiation of the first crack, which occurred at the load level of 21 kN for T-8 and 24 kN for
XT-3, both Beams experience almost similar magnitude of stiffness reduction. Stiffness reduction was
marginally higher for T-8 as tension reinforcement ratio ( ) and concrete compressive strength was
lower than XT-3. As the load continued to increase, the both beams behaved as expected by showing
signs of yielding of the reinforcement. For XT-3, yielding occurred at the load of 88 kN and at the
midspan deflection of 15.5 mm followed by significant deformation with the slight increase in the
applied load. For T-11, yielding occurred at the load of 93 kN and at the midspan deflection of 19 mm
followed by significant deformation with the slight increase in the applied load. Cracking load was
slightly higher for Grade 60 reinforced beam XT-3, but yielding load was higher in case of Grade 80
reinforced beam T-8.This is because yielding strain is higher for Grade 80 rebars while Modulus of
Elasticity remains the same.
Failure of Beam XT-3 occurred at 93 kN .The deflection at ultimate load was measured at 43 mm, as
shown in Figure 5.2.10. The ultimate load of Beam T-8 was 95 kN, which occurred at a 55 mm
deflection. Calculated nominal load capacity for XT-3 was 92.8 kN and for T-8 it was 92.3 kN. Thus,
for both beams failure loads were higher than estimated nominal capacity. For XT-3, it was 1 percent
higher than estimated, but for T-8, it was nearly 4 percent higher than the calculated nominal capacity
.From the previous results of XT-6 and T-6, it can be said that beside steel ratio to maximum
reinforcement ratio value, if the moment capacities of the beams are same, they behave in a
similar manner. We can see from Figure 5.2.10 that load-midspan deflection and load-crack width
behaviors were almost same. In both cases, steel strain exceeded a minimum requirement (
in/in) of ACI 318-14. Beam T-8 and Beam XT-3, provide an ample warning by showing a
large deflection and a series of extensive cracks and no brittle type failure took place. Rather a gradual
increase in deflection was noticed with ductility factor of 2.8 for XT-3 and 3.2 for T-8.These values
are regarded as satisfactory against the required.
From the Load-Crack width and Load deflection relations between XT-3 and T-8, it can be said that
up to yielding both beams behave almost similar. But in the non-linear portion, Grade 80 sample
requires marginally higher load for similar deflection and crack width as expected.

92
5.2.11 Behavior of Beam XT-6 and Beam T-18
To evaluate the flexural response of concrete beams reinforced with ASTM A706 Grade 80 rebars,
load-midspan deflection in Beam T-18 was compared to the behavior of the beam reinforced with
ASTM A706 Grade 60 steel, Beam XT-6 which was reinforced with the same tension reinforcement
ratio (ρ) and different concrete compressive strength (fc').The tension reinforcement ratio (ρ) was
0.0085 for both XT-6 and T-8, while the concrete compressive strengths were 4120 psi and 5640 psi
respectively. The steel ratio to maximum reinforcement ratio value was 0.46 for XT-6 and
0.49 for T-18, which were close. Variation of concrete compressive strength (fc') was 37 percent.
Calculated Nominal moment capacities were 20.93 kN-m and 28.17 kN-m for XT-3 and T-18
respectively.
As evident in Figure 5.2.11, the load-midspan deflection behaviors of the two beams show that
deflection increases linearly with an increase in the applied load prior to yielding.
After the initiation of the first crack, which occurred at the load level of 21 kN for T-18 and 17 kN for
XT-3, both Beams experience almost similar magnitude of stiffness reduction up to yielding. As the
load continued to increase, the both beams behaved as expected by showing signs of yielding of the
reinforcement. For XT-6, yielding occurred at the load of 54 kN and at the midspan deflection of 11
mm followed by significant deformation with the slight increase in the applied load. For T-18,
yielding occurred at the load of 67 kN and at the midspan deflection of 17 mm followed by significant
deformation with the slight increase in the applied load. Both Cracking load and yielding load was
higher in case of Grade 80 reinforced beam T-18.
Failure of Beam XT-6 occurred at 59 kN .The deflection at ultimate load was measured at 105 mm, as
shown in Figure 5.2.11. The ultimate load of Beam T-18 was 71.4 kN, which occurred at a 110 mm
deflection. Calculated nominal load capacity for XT-6 was 51.5 kN and for T-18 it was 69.4 kN.
Thus, for both beams failure loads were higher than estimated nominal capacity. For XT-6, it was 15
percent higher than estimated, but for T-18, it was nearly 3 percent higher than the calculated nominal
capacity .Comparing with the previous results of XT-3 and T-8 or XT-6 and T-6 or XT-6 and T-11,it
can be said that , the steel ratio to maximum reinforcement ratio value determines the initial flexural
(load-deflection and load-crack width ) behavior of beams .If the moment capacities are same this
continues until failure. But if there is difference, the beam with higher tension reinforcement ratio (ρ)
or higher concrete compressive strength (fc') will show higher yield and ultimate load which refers to
difference in non linear portion. In both cases, steel strain exceeded a minimum requirement (ϵs =
0.005 in/in) of ACI 318-14. Beam T-18 and Beam XT-6 provide an ample warning by showing a
large deflection and a series of extensive cracks and no brittle type failure took place. Rather a gradual
increase in deflection was noticed with ductility factor of 9.3 for XT-6 and 7.6 for T-18.These values
are regarded as satisfactory against the required.
From the Load-Crack width and Load deflection relations between XT-6 and T-18, it can be said that
up to yielding both beams behave almost similar. But in the non-linear portion, Grade 80 sample
requires higher load for similar deflection and crack width as expected.
5.2.12 Behavior of Beam XT-12 and Beam T-18
To evaluate the flexural response of concrete beams reinforced with ASTM A706 Grade 80 rebars,
load-midspan deflection in Beam T-18 was compared to the behavior of the beam reinforced with
ASTM A706 Grade 60 steel, Beam XT-12.The tension reinforcement ratio ( ) was 0.0102 for XT-12
and 0.0085 for T-18, while the concrete compressive strengths were 6270 psi and 5640 psi
respectively. Variation of tension reinforcement ratio ( ) is about 20 percent and variation of concrete
compressive strength was 11 percent. The ratio of maximum reinforcement ratio to reinforcement
93
ratio was 0.42 for XT-12 and 0.49 for T-18. Calculated Nominal moment capacities were
32.16 kN-m and 22.06 kN-m for XT-6 and T-18 respectively.
As evident in Figure 5.2.11, the load-midspan deflection behaviors of the two beams show that
deflection increases linearly with an increase in the applied load prior to yielding.
After the initiation of the first crack, which occurred at the load level of 21 kN for T-18 and 20 kN for
XT-12, both Beams experience similar magnitude of stiffness reduction. Stiffness reduction was
higher for T-18 as both tension reinforcement ratio ( ) and concrete compressive strength was lower
than XT-12. As the load continued to increase, the both beams behaved as expected by showing signs
of yielding of the reinforcement. For XT-12, yielding occurred at the load of 62 kN and at the
midspan deflection of 13 mm followed by significant deformation with the slight increase in the
applied load. For T-18, yielding occurred at the load of 67 kN and at the midspan deflection of 17 mm
followed by significant deformation with the slight increase in the applied load. Both cracking load
and yielding load was slightly was higher in case of Grade 80 reinforced beam T-18.This is because
yielding strain is higher for Grade 80 rebars while Modulus of Elasticity remains the same.
Failure of Beam XT-12 occurred at 65 kN .The deflection at ultimate load was measured at 85 mm, as
shown in Figure 5.2.12. The ultimate load of Beam T-18 was 71.4 kN, which occurred at a 110 mm
deflection. Calculated nominal load capacity for XT-12 was 63.3 kN and for T-18 it was 69.4 kN.
Thus, failure loads were higher than estimated. For XT-12, it was 3 percent higher than estimated, but
for T-18, it was nearly 2 percent higher .In both cases, steel strain exceeded a minimum ductility
requirement ( in/in) ACI 318-14. Beam T-18 and Beam XT-12; provide an ample
warning by showing a large deflection and a series of extensive cracks cracks and no brittle type
failure took place. Rather a gradual increase in deflection was noticed with ductility factor of 8.1 for
XT-12 and 7.6 for T-18.These values are regarded as satisfactory against the required..
From the Load-Crack width and Load deflection relations between XT-12 and T-18, it can be said that
up to yielding both beams behave almost similar. But in the non-linear portion, Grade 80 sample
requires higher load for similar deflection and crack width as expected.
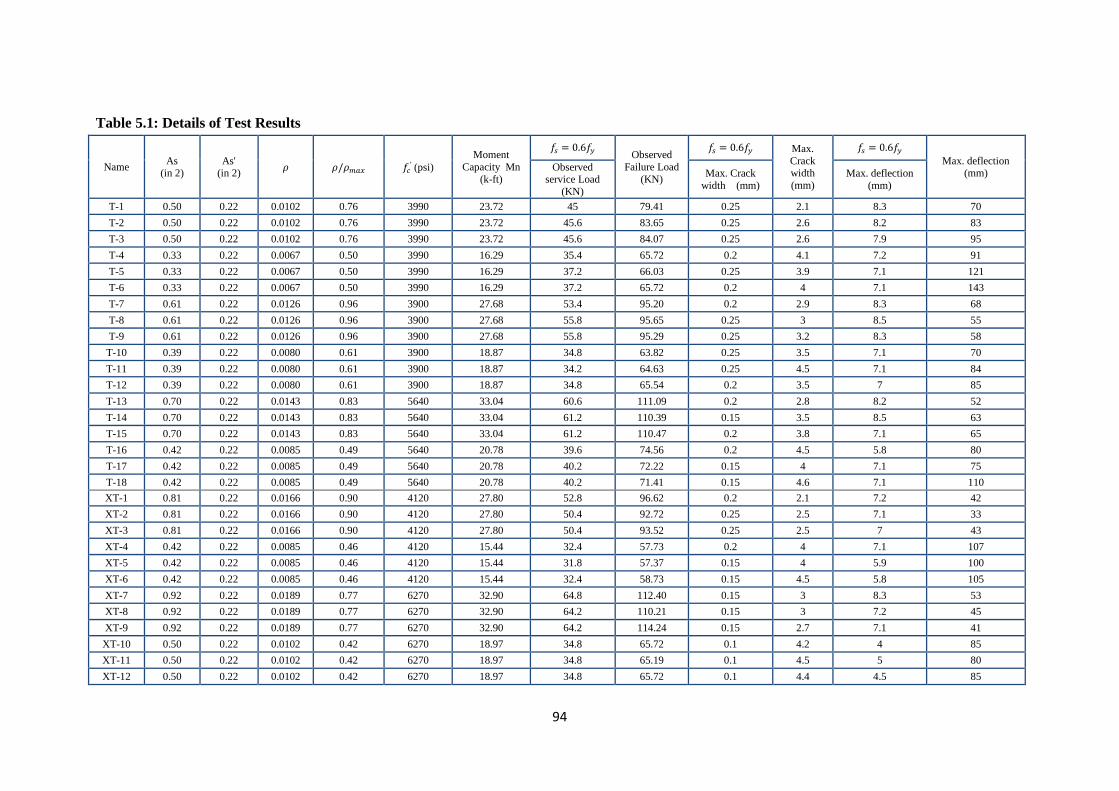
94
Table 5.1: Details of Test Results
Name As
(in 2) As'
(in 2)
(psi)
Moment
Capacity Mn
(k-ft)
Observed
Failure Load
(KN)
Max.
Crack width
(mm)
Max. deflection (mm)
Observed service Load
(KN)
Max. Crack
width (mm)
Max. deflection
(mm)
T-1 0.50 0.22 0.0102 0.76 3990 23.72 45 79.41 0.25 2.1 8.3 70
T-2 0.50 0.22 0.0102 0.76 3990 23.72 45.6 83.65 0.25 2.6 8.2 83
T-3 0.50 0.22 0.0102 0.76 3990 23.72 45.6 84.07 0.25 2.6 7.9 95
T-4 0.33 0.22 0.0067 0.50 3990 16.29 35.4 65.72 0.2 4.1 7.2 91
T-5 0.33 0.22 0.0067 0.50 3990 16.29 37.2 66.03 0.25 3.9 7.1 121
T-6 0.33 0.22 0.0067 0.50 3990 16.29 37.2 65.72 0.2 4 7.1 143
T-7 0.61 0.22 0.0126 0.96 3900 27.68 53.4 95.20 0.2 2.9 8.3 68
T-8 0.61 0.22 0.0126 0.96 3900 27.68 55.8 95.65 0.25 3 8.5 55
T-9 0.61 0.22 0.0126 0.96 3900 27.68 55.8 95.29 0.25 3.2 8.3 58
T-10 0.39 0.22 0.0080 0.61 3900 18.87 34.8 63.82 0.25 3.5 7.1 70
T-11 0.39 0.22 0.0080 0.61 3900 18.87 34.2 64.63 0.25 4.5 7.1 84
T-12 0.39 0.22 0.0080 0.61 3900 18.87 34.8 65.54 0.2 3.5 7 85
T-13 0.70 0.22 0.0143 0.83 5640 33.04 60.6 111.09 0.2 2.8 8.2 52
T-14 0.70 0.22 0.0143 0.83 5640 33.04 61.2 110.39 0.15 3.5 8.5 63
T-15 0.70 0.22 0.0143 0.83 5640 33.04 61.2 110.47 0.2 3.8 7.1 65
T-16 0.42 0.22 0.0085 0.49 5640 20.78 39.6 74.56 0.2 4.5 5.8 80
T-17 0.42 0.22 0.0085 0.49 5640 20.78 40.2 72.22 0.15 4 7.1 75
T-18 0.42 0.22 0.0085 0.49 5640 20.78 40.2 71.41 0.15 4.6 7.1 110
XT-1 0.81 0.22 0.0166 0.90 4120 27.80 52.8 96.62 0.2 2.1 7.2 42
XT-2 0.81 0.22 0.0166 0.90 4120 27.80 50.4 92.72 0.25 2.5 7.1 33
XT-3 0.81 0.22 0.0166 0.90 4120 27.80 50.4 93.52 0.25 2.5 7 43
XT-4 0.42 0.22 0.0085 0.46 4120 15.44 32.4 57.73 0.2 4 7.1 107
XT-5 0.42 0.22 0.0085 0.46 4120 15.44 31.8 57.37 0.15 4 5.9 100
XT-6 0.42 0.22 0.0085 0.46 4120 15.44 32.4 58.73 0.15 4.5 5.8 105
XT-7 0.92 0.22 0.0189 0.77 6270 32.90 64.8 112.40 0.15 3 8.3 53
XT-8 0.92 0.22 0.0189 0.77 6270 32.90 64.2 110.21 0.15 3 7.2 45
XT-9 0.92 0.22 0.0189 0.77 6270 32.90 64.2 114.24 0.15 2.7 7.1 41
XT-10 0.50 0.22 0.0102 0.42 6270 18.97 34.8 65.72 0.1 4.2 4 85
XT-11 0.50 0.22 0.0102 0.42 6270 18.97 34.8 65.19 0.1 4.5 5 80
XT-12 0.50 0.22 0.0102 0.42 6270 18.97 34.8 65.72 0.1 4.4 4.5 85
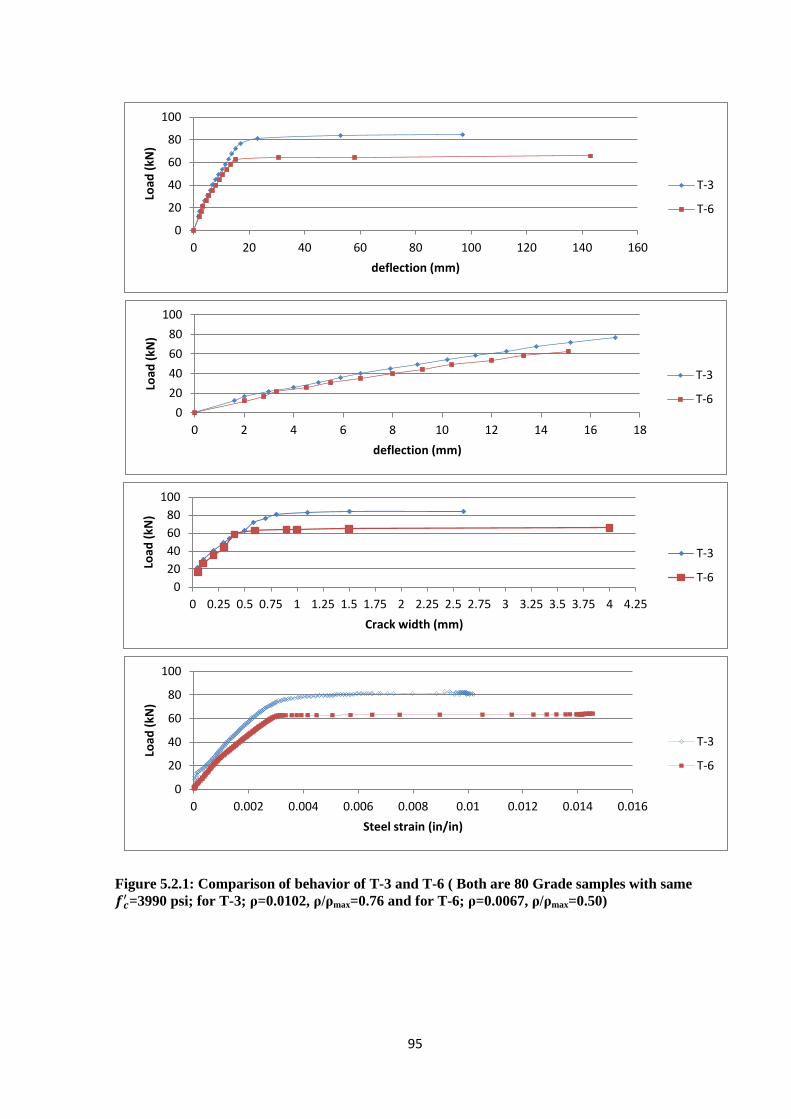
95
Figure 5.2.1: Comparison of behavior of T-3 and T-6 ( Both are 80 Grade samples with same
=3990 psi; for T-3; ρ=0.0102, ρ/ρmax=0.76 and for T-6; ρ=0.0067, ρ/ρmax=0.50)
0
20
40
60
80
100
0 20 40 60 80 100 120 140 160
Load
(kN
)
deflection (mm)
T-3
T-6
0
20
40
60
80
100
0 2 4 6 8 10 12 14 16 18
Load
(kN
)
deflection (mm)
T-3
T-6
0
20
40
60
80
100
0 0.25 0.5 0.75 1 1.25 1.5 1.75 2 2.25 2.5 2.75 3 3.25 3.5 3.75 4 4.25
Load
(kN
)
Crack width (mm)
T-3
T-6
0
20
40
60
80
100
0 0.002 0.004 0.006 0.008 0.01 0.012 0.014 0.016
Load
(kN
)
Steel strain (in/in)
T-3
T-6

96
Figure 5.2.2: Comparison of behavior T-13 and T-18 (Both are 80 Grade samples with same
=5640 psi; for T-13; ρ=0.0143, ρ/ρmax=0.83 and for T-18; ρ=0.0085, ρ/ρmax=0.49)
0
20
40
60
80
100
120
0 20 40 60 80 100 120
Load
(kN
)
deflection (mm)
T-13
T-18
0
20
40
60
80
100
120
0 5 10 15 20
Load
(kN
)
deflection (mm)
T-13
T-18
0
20
40
60
80
100
120
0 0.5 1 1.5 2 2.5 3 3.5 4 4.5 5
Load
(kN
)
Crack width (mm)
T-13
T-18
0
20
40
60
80
100
120
0 0.002 0.004 0.006 0.008 0.01 0.012 0.014 0.016 0.018
Load
(kN
)
Steel strain (in/in)
T-13
T-18
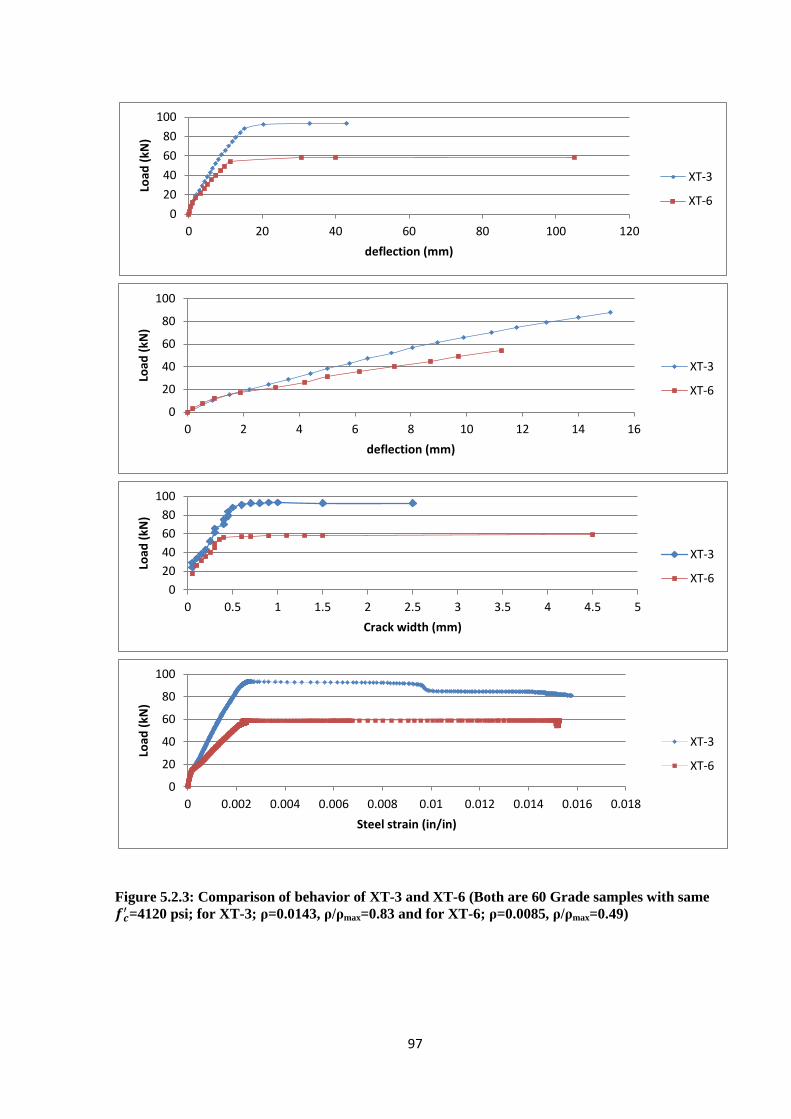
97
Figure 5.2.3: Comparison of behavior of XT-3 and XT-6 (Both are 60 Grade samples with same
=4120 psi; for XT-3; ρ=0.0143, ρ/ρmax=0.83 and for XT-6; ρ=0.0085, ρ/ρmax=0.49)
0
20
40
60
80
100
0 20 40 60 80 100 120
Load
(kN
)
deflection (mm)
XT-3
XT-6
0
20
40
60
80
100
0 2 4 6 8 10 12 14 16
Load
(kN
)
deflection (mm)
XT-3
XT-6
0
20
40
60
80
100
0 0.5 1 1.5 2 2.5 3 3.5 4 4.5 5
Load
(kN
)
Crack width (mm)
XT-3
XT-6
0
20
40
60
80
100
0 0.002 0.004 0.006 0.008 0.01 0.012 0.014 0.016 0.018
Load
(kN
)
Steel strain (in/in)
XT-3
XT-6

98
Figure 5.2.4: Comparison of behavior of XT-8 and XT-11 (Both are 60 Grade samples with same
=6270 psi; for XT-8; ρ=0.0189, ρ/ρmax=0.76 and for XT-11; ρ=0.0102, ρ/ρmax=0.41)
0
20
40
60
80
100
120
0 10 20 30 40 50 60 70 80 90
Load
(kN
)
deflection (mm)
XT-8
XT-11
0
20
40
60
80
100
120
0 5 10 15 20
Load
(kN
)
deflection (mm)
XT-8
XT-11
0
20
40
60
80
100
120
0 1 2 3 4 5
Load
(kN
)
Crack width (mm)
XT-8
XT-11
0
50
100
150
0 0.002 0.004 0.006 0.008 0.01 0.012 0.014 0.016
Load
(kN
)
Steel strain (in/in)
XT-8
XT-11
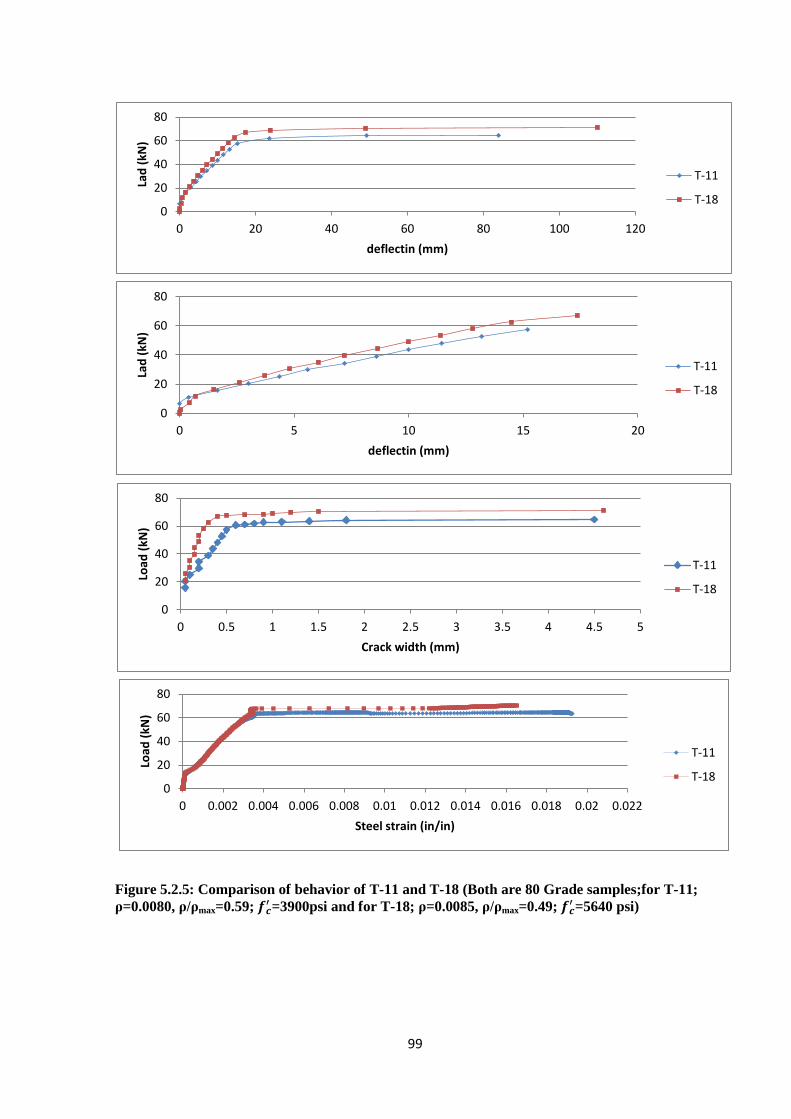
99
Figure 5.2.5: Comparison of behavior of T-11 and T-18 (Both are 80 Grade samples;for T-11;
ρ=0.0080, ρ/ρmax=0.59; =3900psi and for T-18; ρ=0.0085, ρ/ρmax=0.49;
=5640 psi)
0
20
40
60
80
0 20 40 60 80 100 120
Lad
(kN
)
deflectin (mm)
T-11
T-18
0
20
40
60
80
0 5 10 15 20
Lad
(kN
)
deflectin (mm)
T-11
T-18
0
20
40
60
80
0 0.5 1 1.5 2 2.5 3 3.5 4 4.5 5
Load
(kN
)
Crack width (mm)
T-11
T-18
0
20
40
60
80
0 0.002 0.004 0.006 0.008 0.01 0.012 0.014 0.016 0.018 0.02 0.022
Load
(kN
)
Steel strain (in/in)
T-11
T-18

100
Figure 5.2.6: Comparison of behavior of T-6 and T-18 (Both are 80 Grade samples;for T-6;
ρ=0.0067, ρ/ρmax=0.50; =3990 psi and for T-18; ρ=0.0085, ρ/ρmax=0.49;
=5640 psi)
0
20
40
60
80
0 20 40 60 80 100 120 140 160
Load
(kN
)
deflection (mm)
T-6
T-18
0
20
40
60
80
0 5 10 15 20
Load
(kN
)
deflection (mm)
T-6
T-18
0
20
40
60
80
0 0.5 1 1.5 2 2.5 3 3.5 4 4.5 5
Load
(kN
)
Crack width (mm)
T-6
T-18
0
20
40
60
80
0 0.002 0.004 0.006 0.008 0.01 0.012 0.014 0.016 0.018
Load
(kN
)
Steel strain (in/in)
T-6
T-18

101
Figure 5.2.7: Comparison of behavior of XT-6 and XT-12 (Both are 60 Grade samples; for XT-6;
ρ=0.0085, ρ/ρmax=0.46; =4120 psi and for XT-12; ρ=0.0102, ρ/ρmax=0.41;
=6270 psi)
0
20
40
60
80
100
120
0 20 40 60 80 100 120
Load
(kN
)
deflection (mm)
XT-6
XT-12
0
20
40
60
80
100
0 2 4 6 8 10 12 14 16
Load
(kN
)
deflection (mm)
XT-6
XT-12
0
20
40
60
80
0 0.5 1 1.5 2 2.5 3 3.5 4 4.5 5
Load
(kN
)
Crack width (mm)
XT-6
XT-12
0
20
40
60
80
0 0.002 0.004 0.006 0.008 0.01 0.012 0.014 0.016 0.018
Load
(kN
)
Steel strain (in/in)
XT-6
XT-12

102
Figure 5.2.8: Comparison of behavior of XT-6 and T-11 (For XT-6; 60 Grade sample; ρ=0.0085,
ρ/ρmax=0.46; =4120 psi and for T-11; 80 Grade sample; ρ=0.0080, ρ/ρmax=0.59;
=3990 psi)
0
20
40
60
80
0 20 40 60 80 100 120
Load
(kN
)
deflection (mm)
XT-6
T-11
0
20
40
60
80
0 2 4 6 8 10 12 14 16
Load
(kN
)
deflection (mm)
XT-6
T-11
0
20
40
60
80
0 0.5 1 1.5 2 2.5 3 3.5 4 4.5 5
Load
(kN
)
Crack width (mm)
XT-6
T-11
0
20
40
60
80
0 0.002 0.004 0.006 0.008 0.01 0.012 0.014 0.016 0.018 0.02 0.022
Load
(kN
)
Steel strain (in/in)
XT-6
T-11

103
Figure 5.2.9: Comparison of behavior of XT-6 and T-6 (For XT-6; 60 Grade sample; ρ=0.0085,
ρ/ρmax=0.46; =4120 psi and for T-6; 80 Grade sample; ρ=0.0067, ρ/ρmax=0.50;
=3990 psi)
0
10
20
30
40
50
60
70
0 20 40 60 80 100 120 140 160
Load
(kN
)
deflection (mm)
T-6
XT-6
0
20
40
60
80
0 2 4 6 8 10 12 14 16
Load
(kN
)
deflection (mm)
T-6
XT-6
0
20
40
60
80
0 0.5 1 1.5 2 2.5 3 3.5 4 4.5 5
Load
(kN
)
Crack width (mm)
T-6
XT-6
0
10
20
30
40
50
60
70
0 0.002 0.004 0.006 0.008 0.01 0.012 0.014 0.016 0.018
Load
(kN
)
Steel strain (in/in)
T-6
XT-6

104
Figure 5.2.10: Comparison of behavior of XT-3 and T-8 (For XT-3; 60 Grade sample; ρ=0.0166,
ρ/ρmax=0.90; =4120 psi and for T-8; 80 Grade sample; ρ=0.0080, ρ/ρmax=0.59;
=3900 psi)
0
50
100
150
0 10 20 30 40 50 60
Load
(kN
)
deflection (mm)
XT-3
T-8
0
20
40
60
80
100
0 5 10 15 20
Load
(kN
)
deflection (mm)
XT-3
T-8
0 20 40 60 80
100 120
0 0.25 0.5 0.75 1 1.25 1.5 1.75 2 2.25 2.5 2.75 3 3.25
Load
(kN
)
Crack width (mm)
XT-3
T-8
0
20
40
60
80
100
120
0 0.002 0.004 0.006 0.008 0.01 0.012 0.014 0.016 0.018 0.02 0.022 0.024 0.026 0.028
Load
(kN
)
Steel strain (in/in)
XT-3
T-8

105
Figure 5.2.11: Comparison of behavior of XT-6 and T-18 (For XT-6; 60 Grade sample; ρ=0.0085,
ρ/ρmax=0.46; =4120 psi and for T-18; 80 Grade sample; ρ=0.0085, ρ/ρmax=0.49;
=5640 psi)
0
20
40
60
80
0 20 40 60 80 100 120
Load
(kN
)
deflection (mm)
XT-6
T-18
0
20
40
60
80
0 5 10 15 20
Load
(kN
)
deflection (mm)
XT-6
T-18
0
20
40
60
80
0 0.5 1 1.5 2 2.5 3 3.5 4 4.5 5
Load
(kN
)
Crack width (mm)
XT-6
T-18
0
10
20
30
40
50
60
70
80
0 0.002 0.004 0.006 0.008 0.01 0.012 0.014 0.016 0.018
Load
(kN
)
Steel strain (in/in)
XT-6
T-18

106
Figure 5.2.12: Comparison of behavior of XT-12 and T-18 (For XT-12; 60 Grade sample; ρ=0.0102,
ρ/ρmax=0.41; =6270 psi and for T-18; 80 Grade sample; ρ=0.0085, ρ/ρmax=0.49;
=5640 psi)
0
20
40
60
80
0 20 40 60 80 100 120
Load
(kN
)
deflection (mm)
XT-12
T-18
0
20
40
60
80
0 5 10 15 20
Load
(kN
)
deflection (mm)
XT-12
T-18
0
20
40
60
80
0 0.5 1 1.5 2 2.5 3 3.5 4 4.5 5
Load
(kN
)
Crack width (mm)
XT-12
T-18
0
10
20
30
40
50
60
70
80
0 0.002 0.004 0.006 0.008 0.01 0.012 0.014 0.016 0.018
Load
(kN
)
Steel strain (in/in)
XT-12
T-18

107
CHAPTER 6
SUMMARY AND CONCLUSIONS
6.1 SUMMARY
In this experimental study, thirty rectangular concrete beams with dimension of 6"×9.5"×8' were
tested to failure. Eighteen beams were reinforced with high-strength Grade 80 rebars and twelve
beams were reinforced with conventional Grade 60 steel rebars. Three samples were tested for each of
the reinforcement type, steel ratio and concrete strength. A total of three batches of concrete were
used for Grade 80 samples. Design compressive strength for first and second batch was selected as
4000 psi and for the third batch was 6000 psi. On the other hand, two batches of concrete were used
for Grade 60 samples with design compressive strength of 4000 and 6000 psi, respectively. For each
concrete batch, two reinforcement ratios were used, one was greater than 75% of the maximum
reinforcement ratio and the other was less than 60% of the maximum reinforcement ratio. To ensure a
tension controlled failure, all beams were designed to achieve the minimum strain of 0.005 in/in in the
steel at nominal load capacity. Sampleswere tested under static loading conditions. All beams were
sufficiently instrumented to monitor midspan deflection, steel strain, and crack information with a
view to study the flexural behavior of each beam from the beginning to failure. The experimental
results and analysis conducted in this research are steered toward the development of design
recommendation, which addresses the use of Grade 80 rebars as reinforcements for structural concrete
applications. Only flexural behavior is studied in the scheme and hence, the shear reinforcement was
amply provided to ensure flexural failure.
6.2 CONCLUSIONS
Based on observed behavior, experimental results, theoretical prediction, and additional analysis, the
following conclusions can be made about the flexural behavior of the beams tested under this
scheme:
(1) All beams reinforced with Grade 80 rebars behaved almost linearly up to yielding and after
that the behavior was nonlinear up to failure. Failure type and pattern of these beams were
similar to beams reinforced with conventional Grade 60 rebars.
(2) All beams reinforced with Grade 80 rebars exhibited satisfactory performance up to failure.
No premature failure from bond or shear was observed in any beam. The failure mode was
tension controlled failure as confirmed from steel strain exceeding 0.005.
(3) All beams reinforced with Grade 80 rebars exhibited adequate ductile flexural failure, which
is common in a beam with tension-controlled behavior. Therefore, the mode of failure of all
beams can be classified as the ductile flexural failure..Such behavior was also evident from
the significant straining of reinforcement. No sudden/brittle failure took place in any of the
eighteen beams with Grade 80 rebars.
(4) Grade 80 beams exhibited similar stiffness values before and after the initiation of the first
crack in comparison to a similar beam reinforced with Grade 60 steel. In addition, Grade 80
beams have much higher ultimate strength and a comparable ductility in comparison to beams
reinforced Grade 60 steel having similar reinforcement ratio. A separate exercise by the
present investigators revealed that the deflection of beams reinforced with Grade 80 rebars
compare well with the ACI 318-14 as well as with other available equations for prediction of
deflection of beams.
(5) A lightly reinforced Grade 80 beam experienced relatively more stiffness reduction, crack
growth, and deformation at the same load level as compared to a highly reinforced Grade 80
beam. However, a lightly reinforced beam ensured a more ductile flexural failure.

108
(6) All Grade 80 beams behaved in a satisfactory manner under service load. In most cases,
deflections and crack widths determined at service stress level were below the ACI allowable
limits. Few specimens with higher reinforcement ratios showed marginally higher deflection
than allowable limit. It should be noted that the serviceability at a higher stress level might
exceed the permissible values.
(7) Flexural behavior of the Grade 80 beams can be modeled accurately by using current
available reinforced concrete theories for conventional Grade 60 steel.
(8) The review of the test results suggest that Grade 80 rebar can be used more efficiently with
higher strength concrete.
(9) With the increase of applied load, more cracks were observed rather than widening of existing
cracks. Therefore, it appears that the use of Grade 80 rebars provides better crack control after
the yielding of reinforcement in comparison to Grade 60 steel.
(10) The results from comparison of test results suggest that beams with similar tension
reinforcement ratio to maximum reinforcement ratio or similar moment capacity
behaves in a similar manner, although crack width is marginally higher for Grade 80 beams
compared to Grade 60 beams.
6.3 RECOMMENDATIONS FOR FUTURE STUDY
In order to achieve an overall understanding of reinforced concrete beam flexural behavior with Grade
80 rebars, future research needs to be continued in the following areas:
(1) Future testing can be conducted on larger sample size to generate statistically significant data.
(2) The behavior of Grade 80 steel in column and joints under both static and dynamic loading
needs to be tested in future studies.
(3) Future testing on beams having different reinforcement ratios like over-reinforced, under-
reinforced with Grade 80 reinforcement needs to be conducted.
(4) Behavior of Grade 80 reinforcement with high performance concrete needs to be investigated.

109
REFERENCES
ACI, 2014, Building Code Requirements for Structural Concrete and Commentary, ACI 318-14,
American Concrete Institute, Farmington Hills, Michigan
Ansley, M. H., “Investigation into the Structural Performance of MMFX Reinforcing,” 2002,
http://ww w.mmfxsteel.com/technical_resources/Default.asp.
ASTM A370-97-02: Standard Test Method and Definitions for Mechanical Testing of Steel Products
ASTM C-143-00: Standard Test Method for Slump of Hydraulic Concrete
ASTM C39-01: Standard Test Method for Compressive Strength of Cylindrical Concrete Specimens
ASTM C496-96: Standard Test Method for Splitting Tensile Strength of Cylinder Specimens
ASTM E8-01: Standard Method of Tension Testing of Metallic Materials
ASTM 2014. “A706/A706M-09b Standard Specification for Low-Alloy Deformed and Plain Bars for
Concrete Reinforcement.”
AASHTO AASHTO Guide Specifications for LRFD Seismic Bridge Design. 2nd ed. American
Association of State Highway and Transportation Officials, Washington, D.C., 2011.
AASHTO. AASHTO LRFD BRIDGE DESIGN SPECIFICATIONS, Customary U.S. Units. American
Association of State Highway and Transportation Officials, Washington, D.C., 2012.
Bangladesh National Building Code (BNBC), 1993.
Bauschinger, J. "Variations in the Elastic Limit of Iron and Steel". The Journal of the Iron and Steel
Institute, Vol. 12, No. 1, 1887, pp. 442–44.
CALTRANS. Caltrans Seismic Design Criteria. Version 1.6. California Department of
Transportation. 2012.
Dodd, L. L. and J. I. Restrepo-Posada. “Model for Predicting Cyclic Behavior of Reinforcing Steel.”
ASCE Journal of Structural Engineering, Vol. 121 No. 3, 1995, pp. 433- 445.
Dawood M., Sami H.R., and Zia P., (2008), “Flexural Strength Design of Concrete Beams Reinforced
with High Strength Steel”, ACI Structural Journal, Vol. 105.
Firoze, M.; “Attributes of ductile reinforcing steel”, IABSE-JSCE Joint Conference on Advances in
Bridge Engineering-II, August 8-10, 2010 , Dhaka, Bangladesh.
Gustafson, D.P. 2010. Raising the Grade. Concrete International, Vol. 32, No. 04, 2010, pp. 59–62.
Iffat, S., Maina, K. and Noor, M.A. (2012), “Beam Ductility Using Grade 500 Steel”, International
Journal of Science and Engineering Investigations, Volume 1, Issue 1, February 2012.45. Robert,
F.M.,
Link, Tim; “Seismic Performance of Reinforced Concrete Bridge Columns Constructed with Grade
80 Reinforcement”, Masters Thesis, Oregon State University, June, 2014.
Malhas, F. A., “Preliminary Experimental Investigation of the Flexural Behavior of Reinforced
Concrete Beams Using MMFX Steel,” University of North Florida, Jacksonville, FL, 2002,
http://www.mmfxsteel.com/technical_resources/Default.asp.

110
Mander, J. B., M.J.N. Priestley, and R. Park. “Theoretical Stress‐ Strain Model for Confined
Concrete.” Journal of Structural Engineering, Vol. 114,No. 8, 1988, pp. 1804–1826.
doi:10.1061/(ASCE)0733 - 9445(1988)114:8(1804). .
Mander, J., F. Panthaki, and A. Kasalanati. “Low Cycle Fatigue Behavior of Reinforcing Steel.”
Journal of Materials in Civil Engineering, Vol. 6. No.4,1994,pp.453–468. doi:10.1061/(ASCE)0899-
1561(1994)6:4(453).
Munikrishna, A., 2008, “Shear Behavior of Concrete Beams Reinforced with High Performance Steel
Shear Reinforcement,” MSCE Thesis, Department of Civil, Construction, and Environmental
Engineering, North Carolina State University, Raleigh, North Carolina.
Nissen, E.,” Mill Issues Related to Making High-Strength Reinforcement.” Power Point presented at
the ACI Hot Topic Session: High-Strength Reinforcing Bars - Balancing Design Requirements with
Achievable Material Properties, Phoenix, Arizona. 2013.
Noor, M. A. (2010), “Designing with Grade 500 Steel”m The University Press Limited (UPL).
ODOT. 2012. ODOT Bridge Design and Drafting Manual. rev. August 2012. Oregon Department of
Transportation. 2012.
Paulson, C.; Graham, S. K.; and Rautenberg, J. M., 2013, “Determination of Yield Strength for
Nonprestressed Steel Reinforcement,” Charles Pankow Foundation RGA #04-13, WJE No.
2013.4171, Wiss, Janney, Elstner Associates, Inc., Pasadena, CA, Dec. 31, 100 pp
Paulson, C., “Brief Historical Overview of Yield Strength in ACI 318.” Power Point presented at the
ACI Hot Topic Session: High-Strength Reinforcing Bars - Balancing Design Requirements with
Achievable Material Properties, Phoenix, Arizona. 2012.
Rice, P., and D.Gustafson. “Grade 80 Reinforcing Bars and ACI 318-71.” Journal Proceedings, Vol.
73, No. 4, 1976, pp. 199–206 .
Rodriguez, M., J. Botero, and J. Villa. "Cyclic Stress-Strain Behavior of Reinforcing Steel Including
Effect of Buckling." Journal of Structural Engineering, Vol. 125, No. 6, 1999, pp. 605–612.
doi:10.1061/(ASCE)0733 - 9445(1999)125:6(605)..
Selzer, J. Reinforcing Bar Metallurgy - 101. Power Point presented at the ACI Hot Topic Session:
High-Strength Reinforcing Bars - Balancing Design Requirements with Achievable Material
Properties, Phoenix, Arizona. 2013.
Sumpter, M.S., Rizkalla, S.H., and Zia, P., 2009, “Behavior of High Performance Steel as Shear
Reinforcement for Concrete Beams,” ACI Structural Journal, V. 106, No. 2, Mar-Apr, pp. 171-177,
Farmington Hills, Michigan.
Trejo ,David., Barbosa ,André R., and Link,Tim., " Seismic performance of circular reinforced
concrete bridge columns constructed with Grade 80 reinforcement.", 2014.
WSDOT. WSDOT Bridge Design Manual (LRFD). M 23-50.12. Washington State Department of
Transportation, 2012.
Yotakhong, Purk,"Flexural Performance of MMFX Reinforcing Rebars in Concrete Structures." M.Sc
Thesis, North Carolina University, 2003.

A - 1
APPENDIX-A
Moment- Curvature Relationship
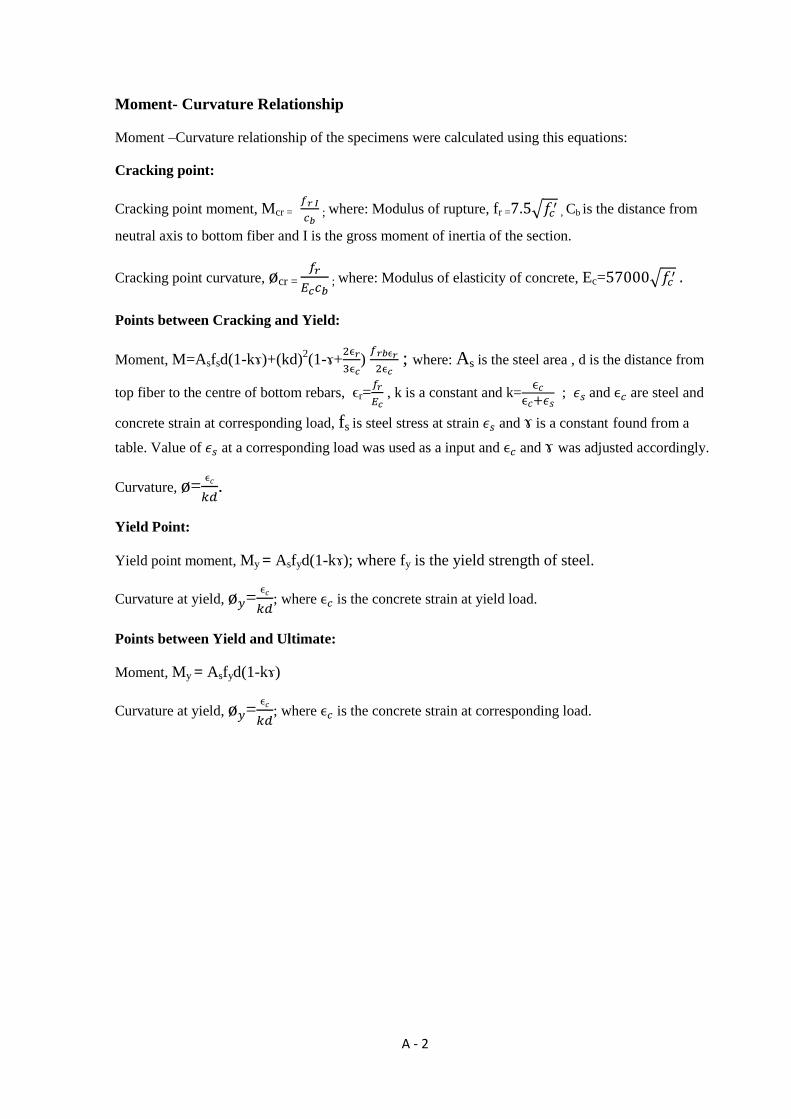
A - 2
Moment- Curvature Relationship
Moment –Curvature relationship of the specimens were calculated using this equations:
Cracking point:
Cracking point moment, Mcr =
; where: Modulus of rupture, fr = , Cb is the distance from
neutral axis to bottom fiber and I is the gross moment of inertia of the section.
Cracking point curvature, cr =
; where: Modulus of elasticity of concrete, Ec=
Points between Cracking and Yield:
Moment, M=Asfsd(1-kɤ)+(kd)2(1-ɤ+
)
; where: As is the steel area , d is the distance from
top fiber to the centre of bottom rebars, ϵr=
, k is a constant and k=
; and are steel and
concrete strain at corresponding load, fs is steel stress at strain and ɤ is a constant found from a
table. Value of at a corresponding load was used as a input and and ɤ was adjusted accordingly.
Curvature, =
.
Yield Point:
Yield point moment, My = Asfyd(1-kɤ); where fy is the yield strength of steel.
Curvature at yield, =
; where is the concrete strain at yield load.
Points between Yield and Ultimate:
Moment, My = Asfyd(1-kɤ)
Curvature at yield, =
; where is the concrete strain at corresponding load.

A - 3
Moment Curvature of T-1
Moment Curvature of T-2
Moment Curvature of T-3
0
5
10
15
20
25
30
35
0 0.01 0.02 0.03 0.04 0.05 0.06 0.07 0.08
Mo
me
nt
(K
N-m
)
Curvature
0
5
10
15
20
25
30
35
0 0.01 0.02 0.03 0.04 0.05 0.06 0.07 0.08
Mo
me
nt
(K
N-m
)
Curvature
0
5
10
15
20
25
30
35
0 0.01 0.02 0.03 0.04 0.05 0.06 0.07 0.08
Mo
me
nt
(K
N-m
)
Curvature

A - 4
Moment Curvature of T-4
Moment Curvature of T-5
Moment Curvature of T-6
0
5
10
15
20
25
0 0.02 0.04 0.06 0.08 0.1 0.12 0.14
Mo
me
nt
(K
N-m
)
Curvature
0
5
10
15
20
25
0 0.02 0.04 0.06 0.08 0.1 0.12 0.14
Mo
me
nt
(K
N-m
)
Curvature
0
5
10
15
20
25
0 0.02 0.04 0.06 0.08 0.1 0.12 0.14
Mo
me
nt
(K
N-m
)
Curvature

A - 5
Moment Curvature of XT-1
Moment Curvature of XT-2
Moment Curvature of XT-3
0
5
10
15
20
25
30
35
40
45
0 0.02 0.04 0.06 0.08 0.1 0.12
Mo
me
nt
(K
N-m
)
Curvature
0
5
10
15
20
25
30
35
40
45
0 0.02 0.04 0.06 0.08 0.1 0.12
Mo
me
nt
(K
N-m
)
Curvature
0
5
10
15
20
25
30
35
40
45
0 0.02 0.04 0.06 0.08 0.1 0.12
Mo
me
nt
(K
N-m
)
Curvature

A - 6
Moment Curvature of XT-4
Moment Curvature of XT-5
Moment Curvature of XT-6
0
5
10
15
20
25
0 0.01 0.02 0.03 0.04 0.05 0.06 0.07 0.08 0.09 0.1
Mo
me
nt
(K
N-m
)
Curvature
0
5
10
15
20
25
0 0.01 0.02 0.03 0.04 0.05 0.06 0.07 0.08 0.09 0.1
Mo
me
nt
(K
N-m
)
Curvature
0
5
10
15
20
25
0 0.01 0.02 0.03 0.04 0.05 0.06 0.07 0.08 0.09 0.1
Mo
me
nt
(K
N-m
)
Curvature

A - 7
Moment Curvature of T-7
Moment Curvature of T-8
0
5
10
15
20
25
30
35
40
45
0 0.02 0.04 0.06 0.08 0.1 0.12 0.14
Mo
me
nt
(K
N-m
)
Curvature
0
5
10
15
20
25
30
35
40
45
0 0.02 0.04 0.06 0.08 0.1 0.12 0.14
Mo
me
nt
(K
N-m
)
Curvature
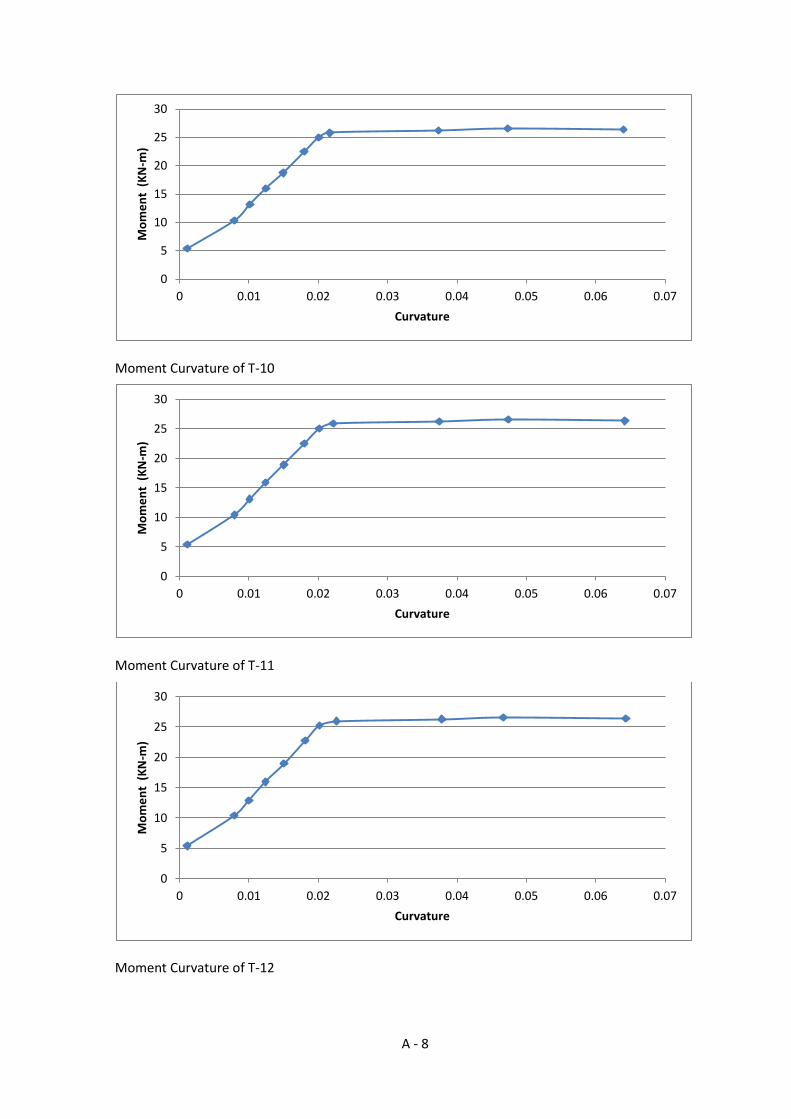
A - 8
Moment Curvature of T-10
Moment Curvature of T-11
Moment Curvature of T-12
0
5
10
15
20
25
30
0 0.01 0.02 0.03 0.04 0.05 0.06 0.07
Mo
me
nt
(K
N-m
)
Curvature
0
5
10
15
20
25
30
0 0.01 0.02 0.03 0.04 0.05 0.06 0.07
Mo
me
nt
(K
N-m
)
Curvature
0
5
10
15
20
25
30
0 0.01 0.02 0.03 0.04 0.05 0.06 0.07
Mo
me
nt
(K
N-m
)
Curvature
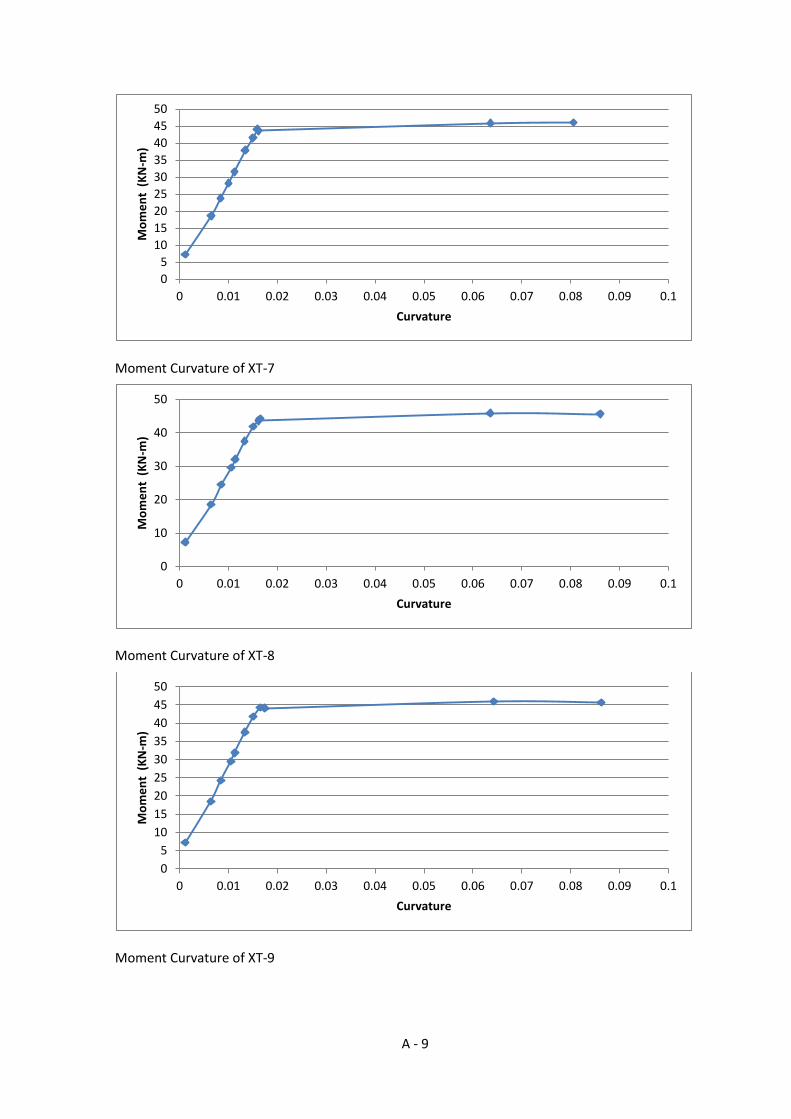
A - 9
Moment Curvature of XT-7
Moment Curvature of XT-8
Moment Curvature of XT-9
0
5
10
15
20
25
30
35
40
45
50
0 0.01 0.02 0.03 0.04 0.05 0.06 0.07 0.08 0.09 0.1
Mo
me
nt
(K
N-m
)
Curvature
0
10
20
30
40
50
0 0.01 0.02 0.03 0.04 0.05 0.06 0.07 0.08 0.09 0.1
Mo
me
nt
(K
N-m
)
Curvature
0
5
10
15
20
25
30
35
40
45
50
0 0.01 0.02 0.03 0.04 0.05 0.06 0.07 0.08 0.09 0.1
Mo
me
nt
(K
N-m
)
Curvature

A - 10
Moment Curvature of XT-10
Moment Curvature of XT-11
Moment Curvature of XT-12
0
5
10
15
20
25
30
0 0.01 0.02 0.03 0.04 0.05 0.06 0.07 0.08
Mo
me
nt
(K
N-m
)
Curvature
0
5
10
15
20
25
30
0 0.01 0.02 0.03 0.04 0.05 0.06 0.07 0.08
Mo
me
nt
(K
N-m
)
Curvature
0
5
10
15
20
25
30
0 0.01 0.02 0.03 0.04 0.05 0.06 0.07 0.08
Mo
me
nt
(K
N-m
)
Curvature

A - 11
Moment Curvature of T-13
Moment Curvature of T-14
Moment Curvature of T-15
0
10
20
30
40
50
0 0.01 0.02 0.03 0.04 0.05 0.06 0.07 0.08 0.09 0.1
Mo
me
nt
(K
N-m
)
Curvature
0
10
20
30
40
50
0 0.01 0.02 0.03 0.04 0.05 0.06 0.07 0.08 0.09 0.1
Mo
me
nt
(K
N-m
)
Curvature
0
10
20
30
40
50
0 0.01 0.02 0.03 0.04 0.05 0.06 0.07 0.08 0.09 0.1
Mo
me
nt
(K
N-m
)
Curvature

A - 12
Moment Curvature of T-16
Moment Curvature of T-17
Moment Curvature of T-18
0
5
10
15
20
25
30
35
0 0.02 0.04 0.06 0.08 0.1 0.12 0.14
Mo
me
nt
(K
N-m
)
Curvature
0
5
10
15
20
25
30
35
0 0.02 0.04 0.06 0.08 0.1 0.12 0.14
Mo
me
nt
(K
N-m
)
Curvature
0
5
10
15
20
25
30
35
0 0.02 0.04 0.06 0.08 0.1 0.12 0.14
Mo
me
nt
(K
N-m
)
Curvature