Modelling above-ground herbage mass for a wide range of grassland community types
17
Please cite this article in press as: Duru, M., et al., Modelling above-ground herbage mass for a wide range of grassland community types. Ecol. Model. (2008), doi:10.1016/j.ecolmodel.2008.09.015 ARTICLE IN PRESS ECOMOD-5294; No. of Pages 17 ecological modelling xxx ( 2 0 0 8 ) xxx–xxx available at www.sciencedirect.com journal homepage: www.elsevier.com/locate/ecolmodel Modelling above-ground herbage mass for a wide range of grassland community types M. Duru a,∗ , M. Adam b , P. Cruz a , G. Martin a , P. Ansquer a , C. Ducourtieux a , C. Jouany a , J.P. Theau a , J. Viegas c a INRA, UMR 1248 AGIR, F-31326 Castanet Tolosan, France b PPS Haarweg 333, P.O. Box 430, 6700 AK Wageningen, The Netherlands c UFSM, Santa Maria, RS, Brazil article info Article history: Received 27 June 2008 Received in revised form 9 September 2008 Accepted 18 September 2008 Keywords: Permanent grassland Plant functional type Model Management Grasses abstract Whereas it is recognized that management of plant diversity can be the key to reconcil- ing production and environmental aims, most grassland models are tailored for high-value grass species. We proposed to adapt a mono-specific grass model to take into account spe- cific features of species-rich permanent grasslands, especially over the reproductive phase. To this end, we used the concept of plant functional type (PFT), i.e. the grouping of plant species according to plant traits determined by the response of plant species to different management practices (land use and fertilization) and characterizing of agronomic prop- erties of the corresponding species. In the model, weather and nutrient availability act upon rates of biophysical processes (radiation capture and use, plant senescence). These rates are modified over times due to PFT-specific parameters determined experimentally which represent the different strategies of plant species regarding growth. The integration of these parameters into the model made it possible to predict herbage biomass accumu- lation rate under different management practices for a wide range of plant communities differing in their PFT composition. The model was evaluated in two steps, first by ana- lyzing separately the effects of PFT and an indicator of nutrient availability on herbage accumulation and then by conducting a sensitivity analysis. It was validated using two inde- pendent datasets; a cutting experiment running over the whole growing season to examine the consistency of the model outputs under different cutting regimes, and a monitoring of meadows and pastures in spring over a whole growth cycle to assess the model’s abil- ity to reproduce growth curves. Although a good fit was observed between the simulated and observed data, the few discrepancies noticed between field data and predicted values were attributed mainly to the potential presence of non-grass species. More specifically, we noticed that nutrient (mainly nitrogen) availability is the main driver of plant growth rate, and that PFT determines the times at which this rate changes in relation to the phenologi- cal characteristics of species present. We concluded that integration of the PFT concept into the initial mono-specific growth model is especially suited to evaluating the consequences of management practices on species-rich permanent grasslands to meet feed production targets. © 2008 Elsevier B.V. All rights reserved. ∗ Corresponding author. Tel.: +33 5 61 28 50 32; fax: +33 5 61 73 55 37. E-mail address: [email protected] (M. Duru). 0304-3800/$ – see front matter © 2008 Elsevier B.V. All rights reserved. doi:10.1016/j.ecolmodel.2008.09.015
-
Upload
independent -
Category
Documents
-
view
0 -
download
0
Transcript of Modelling above-ground herbage mass for a wide range of grassland community types
E
Mg
MJa
b
c
a
A
R
R
9
A
K
P
P
M
M
G
0d
ARTICLE IN PRESSCOMOD-5294; No. of Pages 17
e c o l o g i c a l m o d e l l i n g x x x ( 2 0 0 8 ) xxx–xxx
avai lab le at www.sc iencedi rec t .com
journa l homepage: www.e lsev ier .com/ locate /eco lmodel
odelling above-ground herbage mass for a wide range ofrassland community types
. Durua,∗, M. Adamb, P. Cruza, G. Martina, P. Ansquera, C. Ducourtieuxa, C. Jouanya,.P. Theaua, J. Viegasc
INRA, UMR 1248 AGIR, F-31326 Castanet Tolosan, FrancePPS Haarweg 333, P.O. Box 430, 6700 AK Wageningen, The NetherlandsUFSM, Santa Maria, RS, Brazil
r t i c l e i n f o
rticle history:
eceived 27 June 2008
eceived in revised form
September 2008
ccepted 18 September 2008
eywords:
ermanent grassland
lant functional type
odel
anagement
rasses
a b s t r a c t
Whereas it is recognized that management of plant diversity can be the key to reconcil-
ing production and environmental aims, most grassland models are tailored for high-value
grass species. We proposed to adapt a mono-specific grass model to take into account spe-
cific features of species-rich permanent grasslands, especially over the reproductive phase.
To this end, we used the concept of plant functional type (PFT), i.e. the grouping of plant
species according to plant traits determined by the response of plant species to different
management practices (land use and fertilization) and characterizing of agronomic prop-
erties of the corresponding species. In the model, weather and nutrient availability act
upon rates of biophysical processes (radiation capture and use, plant senescence). These
rates are modified over times due to PFT-specific parameters determined experimentally
which represent the different strategies of plant species regarding growth. The integration
of these parameters into the model made it possible to predict herbage biomass accumu-
lation rate under different management practices for a wide range of plant communities
differing in their PFT composition. The model was evaluated in two steps, first by ana-
lyzing separately the effects of PFT and an indicator of nutrient availability on herbage
accumulation and then by conducting a sensitivity analysis. It was validated using two inde-
pendent datasets; a cutting experiment running over the whole growing season to examine
the consistency of the model outputs under different cutting regimes, and a monitoring
of meadows and pastures in spring over a whole growth cycle to assess the model’s abil-
ity to reproduce growth curves. Although a good fit was observed between the simulated
and observed data, the few discrepancies noticed between field data and predicted values
were attributed mainly to the potential presence of non-grass species. More specifically, we
noticed that nutrient (mainly nitrogen) availability is the main driver of plant growth rate,
and that PFT determines the times at which this rate changes in relation to the phenologi-
cal characteristics of species present. We concluded that integration of the PFT concept into
the initial mono-specific growth model is especially suited to evaluating the consequences
of management practices on species-rich permanent grasslands to meet feed production
Please cite this article in press as: Duru, M., et al., Modelling above-groundModel. (2008), doi:10.1016/j.ecolmodel.2008.09.015
targets.
∗ Corresponding author. Tel.: +33 5 61 28 50 32; fax: +33 5 61 73 55 37.E-mail address: [email protected] (M. Duru).
304-3800/$ – see front matter © 2008 Elsevier B.V. All rights reserved.oi:10.1016/j.ecolmodel.2008.09.015
herbage mass for a wide range of grassland community types. Ecol.
© 2008 Elsevier B.V. All rights reserved.
INECOMOD-5294; No. of Pages 17
i n g
ARTICLE2 e c o l o g i c a l m o d e l l
1. Introduction
The sustainability of temperate grasslands is increasinglyseen as encompassing plant diversity on several scales (Bignaland McCracken, 2000). Whereas it is recognized that man-agement of plant diversity at field, farm and landscape levelscan be the key to reconciling production and environmentalaims (White et al., 2004), most grassland models are tailoredfor high-value grass species (mono-specific swards). It is onlyrecently that specific features of species-rich grasslands (nat-ural grasslands or old sown grasslands) have begun to betaken into account in herbage growth models (McCall andBishop-Hurley, 2003; Corson et al., 2006; Jouven et al., 2006).However, these models suffer from several omissions and mis-representations. A major advance in the model of McCall andBishop-Hurley (2003) was the introduction of a function tomodel the reproductive phase for different sward composi-tions so as to simulate herbage accumulation for yield beforeor after flowering stages, or after topping in spring as fre-quently observed in extensive livestock systems (Coléno etal., 2005). However, their model is not suited to easily take intoaccount in a generic manner a range of plant communities dif-fering in their composition. The model of Jouven et al. (2006)constituted an interesting first step in this direction by con-sidering the functional composition of the plant community.However, there are three limitations: it did not evaluate therespective roles of nutrient availability and plant functionalcomposition of the plant community such as are frequentlyobserved (Duru et al., 2005); it did not evaluate whether thereis a real gain in precision from taking into account the latterrather than just nutrient availability, particularly for simulatedherbage accumulation rate over a short time scale during thereproductive period; it does not take account of phosphorusdeficiency, although this is frequently observed in low-inputgrasslands (Janssens et al., 1998). Finally, the model of Corsonet al. (2006) is very complex and data demanding, requiringhigh investments for calibration outside the region of initialapplication. These models have only partially succeeded intaking into account, in a simple manner, a wide range ofplant community compositions and management practices(from early to late cutting, combination of grazing and cutting).Thus, it is necessary to have a sound and integrative model forevaluating the effect of management practices upon produc-tion of such grasslands. In this paper, we adapt an existingmono-specific grass model (Cros et al., 2003; Duru et al., 2007)for species-rich grasslands by introducing new features aimedat simulating the productivity of species-rich grasslands fora wide range of management practices, especially over thespring period. It raised one main challenge and a number ofkey modelling choices.
As such grasslands are generally made up of more thanten species; a major challenge is to simplify the expression ofwithin-field plant diversity. The principle of parsimony (usingno more complex a model or representation of reality than
Please cite this article in press as: Duru, M., et al., Modelling above-groundModel. (2008), doi:10.1016/j.ecolmodel.2008.09.015
absolutely necessary), leads us to use the plant functionaltype (PFT) concept that “bridges the gap between plant phys-iology and community and ecosystem processes” (Diaz andCabido, 1997). PFT groups species according to their responses
PRESSx x x ( 2 0 0 8 ) xxx–xxx
to the environment (response group) and/or their effects onecosystem processes (effect group) (Lavorel and Garnier, 2002).In reference to the response group concept, we included thePFT concept in our model through the definition of a limitednumber of parameters applicable to a diversity of species-richgrasslands and management situations. A grassland commu-nity is composed of one or several PFTs (Duru et al., 2005). Byrelying on response plant traits, we assumed that the man-agement practices lead to a stable functional composition ofthe plant community, keeping it in a dynamic equilibrium(Huston, 1994) over the years. A first step towards the integra-tion of this concept into herbage growth and/or digestibilitymodels of permanent grasslands can be found in the recentliterature (Andrieu, 2004; Viegas et al., 2005; Jouven et al., 2006).To overcome the limitations identified, we used predefinedgrass plant functional types (PFT) established on a leaf drymatter content basis (Ansquer et al., 2004). We assumed thatthis plant trait encompasses all relevant variables and theirspecific PFT parameters needed for modelling resource cap-ture, use and biomass allocation.
Key choices consisted in determining the level of detailsuitable for the simulation of resource acquisition and use.This granularity choice results from a compromise betweenthe target use of the model, the complexity of the modellingprocess and the available data, especially for each PFT.Morphogenesis processes are very different between species(Craine et al., 2002) and they remain poorly understood(Calvière and Duru, 1995) except for well-known species (e.g.Lolium perenne L.) (Barrett et al., 2005). For this reason, buildinga source- and sink-driven model would have been verydifficult. In such models, daily crop growth rate is determinedas the lower of the daily rate of either the sink or sourceactivity (e.g. Schapendonk et al., 1998). Instead, we decidedto build a source-driven model in which the interceptionof solar radiation is transformed into biomass and furtherpartitioned (e.g. Brisson et al., 1998). Usually, dry matterpartitioning is a function of the development stage of the crop(Van Ittersum and Rabbinge, 1997) such as in LINGRA to defineleaf and tiller dynamics (Schapendonk et al., 1998). In thiscase, dry matter is being mostly allocated to storage organswhen flowering is reached. For the purpose of our model,we chose to adopt a simpler empirical approach: associatedwith the appearance of leaves and sward growth, there is anincrease of dry matter allocation to stems at the expanse ofleaves (Lemaire et al., 1989). A relationship was establishedbetween the leaf dry matter percentage in the above-groundherbage mass and the standing herbage mass from the stemelongation phase until the flowering stage for a wide rangeof plant communities (Calvière and Duru, 1999). Most often,the expansion of leaf area, which is a necessary variable inthe mechanistic modelling of herbage growth, is linked to theincrease in leaf dry matter through the specific leaf area. For asingle species observed at a given development stage, specificleaf area displays wide variations according to environmentalconditions (Al Haj Khaled et al., 2005). Thus, considering itsparameterization as hardly possible given the data available,we considered expansion of leaf area and leaf dry matter as
herbage mass for a wide range of grassland community types. Ecol.
uncoupled processes.In a first part, we summarized the principles used in this
model, and we further described new developments intro-
INECOMOD-5294; No. of Pages 17
n g x
druauysgt
2v
2
2Taiu(tthtbGtteftpi
2tGcit(c
P
R1
w
aiet(pt
ARTICLEe c o l o g i c a l m o d e l l i
uced, i.e. mainly the PFT concept and the modelling of theeproductive phase. In the second part, the model was eval-ated analyzing the respective effects of PFTs and nutrientvailability on herbage accumulation. It was then validatedsing two independent datasets to validate herbage massield for different cutting regimes over a whole growingeason, and herbage accumulation rate over a reproductiverowth cycle. Finally, we discussed the relevance of the adap-ations to the initial mono-specific model.
. Model description, calibration andalidation
.1. Summary of general principles
.1.1. From potential production to attainable productiono take into account “growth-limiting factors” (Van Ittersumnd Rabbinge, 1997), we included water and nutrient stressndices as a function of the ratio between the actual plantptake and the potential plant demand. The water index
WI(t)), that is time (t)-dependent, has been defined as a func-ion of the ratio of actual to potential transpiration accordingo soil characteristics (Merot et al., 2008). We used an index oferbage nutrient status (NNI) as an input variable of the modelo accurately compare the different treatments. This index cane calculated using experimental data. Following Lemaire andastal (1997), NNI is the ratio between the measured N concen-
ration (Nm) of the standing shoot biomass (W in t ha−1) andhe optimum N concentration: NNI = Nm/(4.8(W−0.32)). Oth-rwise, NNI can be determined for different soil types andertilizer management practices at regional level. We assumedhat water and nutrient stress intervened in two differentrocesses involved in the modelling of grass growth: light
nterception (Eq. (4)) and radiation use efficiency (Eq. (10)).
.1.2. Light interception and radiation use efficiency overhe vegetative phaserass cannot grow unless there is enough leaf area to inter-ept sufficient solar energy to support photosynthesis. Thiss expressed through the cumulative interception of the pho-osynthetically active radiation (PAR in MJ m−2, Eqs. (1) and2)) which directly depends on the radiation interception effi-iency (ε) which in turn depends on the leaf area index (LAI):
AR = 0.48ε∗i RGI (1)
GI: incident radiant in MJ m−2 day−1 (Varlet-Grancher et al.,989):
ith εi = 0.95(1 − e−kLAI) k depends on the leaf angle (2)
The green leaf area index net growth (LAI(t)) is simulateds the result of the daily increase in LAI (GLAI(t)), from whichs subtracted the LAI daily senescence (SLAI(t)), Eq. (3), bothxpressed in m2 m−2. GLAI depends mainly on average daily
Please cite this article in press as: Duru, M., et al., Modelling above-groundModel. (2008), doi:10.1016/j.ecolmodel.2008.09.015
(t)
emperature (T) as well as water and nutrient availabilityWI and NI) (Bélanger et al., 1992a) and a constant speciesarameter (LAI rate) (Cros et al., 2003) (Eq. (4)). The effect ofemperature on the LAI increase is parabolic for average daily
PRESSx x ( 2 0 0 8 ) xxx–xxx 3
temperatures ranging from 0 to 18 ◦C (Peacock, 1976). SLAI (Eq.(5)) depends mainly on the residual LAI (LAIres) i.e. the remain-ing LAI after a defoliation which is related to the defoliationpractices, leaf life span (LLS) and average daily temperature,as used in a previous model (Cros et al., 2003). Indeed, SLAI isthe product of the LAIres and the ratio of daily average tem-perature to the temperature sum corresponding to the greenleaf life period (LLSmin) i.e. a constant species parameter rep-resenting the time when leaves start to senesce:
LAI(t) = GLAI(t) − SLAI(t) (3)
GLAI(t)
= LAI rate (1.71 × 10⁻³) [max(T(t), 0); min(T(t), 18))]2 NI WI(t)
(4)
SLAI(t) = LAIres × max(T(t), 0); min(T(t), 18)
LLSmin(5)
The radiation use efficiency (RUE) during grass growth isdefined as the ratio between the accumulated above-grounddry matter and the accumulated absorbed radiation follow-ing defoliation. The potential radiation use efficiency over thespring vegetative phase (RUEveg rate) for grass swards can reach1.8 g of dry matter per MJ for pure grass stands (Bélanger et al.,1992a; Duru et al., 2002). The attainable production decreasesaccording to WI and NI. Further, there is an effect of tem-perature, phenology and season on radiation use efficiency(Bélanger et al., 1992b). The former corresponds to the tem-perature effect on photosynthesis (f(T)) assuming that 0 and18 ◦C are the minimal and maximal temperatures for herbagegrowth. A daily mean temperature below 0 ◦C has the sameeffect on the RUE as 0 ◦C. Similarly, a daily mean temperatureabove 18 ◦C has the same effect as one of 18 ◦C. The phenol-ogy and season effect represents the change in the allocationof assimilates from the above-ground biomass to the root orto the shoot (f (d)) from February to the October. Eqs. (6) and (7)(Cros et al., 2003); d being the Julian day of the year:
f (T) = 0.037 + 0.09 × [max(T(t), 0); min(T(t), 18)]
− 0.0022 × [max(T(t), 0); min(T(t), 18)]2 (6)
f (d) = −0.00085d + 1.026 (7)
The effect of WI and NI on RUE was calculated by Cros etal. (2003) as
f (NI) = 0.8NNI + 0.2 (8)
f (WI) = WI (9)
RUE = RUE × f (T) × f (d) × f (NI) × f (WI) (10)
herbage mass for a wide range of grassland community types. Ecol.
veg rate
2.1.3. Leaf senescence and dry matter accumulationDuring vegetative growth the model simulates leaf senescence(Eq. (11) and (12)) based on leaf life span (LLSmin) in degree-days

INECOMOD-5294; No. of Pages 17
i n g
alcu
Smin
ate
ARTICLE4 e c o l o g i c a l m o d e l l
(Duru et al., 1993), the residual biomass at the beginning ofthe growth cycle (Wt0) (Parsons, 1988) or the standing herbagemass once the first leaf cohort is senescent when consider-ing long periods of re-growth (Cros et al., 2003), and finallya coefficient of remobilization (�) assumed constant whateverthe species (Cruz, personal communication), representative ofthe proportion of dry matter of senescent leaves that is real-located to green leaves. To determine litter accumulation, thesame formalism is adopted using the LLSmax, representing thetemperature sum (�T) at which the whole leaf is dead andtherefore becomes litter. This computation makes it possibleto quantify the standing biomass, an observable variable, asthe total biomass minus litter:
Condition
Until the first leaf cohort (�T < LLSmin), senescent material is cusing the initial residual biomass: W(t0)
From the first to the second cohort of leaves (LLSmin < �T < 2LLherbage mass considered in the estimate of the senescent mone at time �T: W(�T)
The net herbage accumulation (Eq. (14), representative ofgreen biomass) is calculated as the difference between growth(Wgrowth, Eq. (13)) and senescence (Wsen, Eqs. (11) and (12)),in g m2, with:
Wgrowth = RUEveg rate PAR (13)
and
Wnet = Wgrowth − Wsen (14)
2.2. New developments to the initial model
2.2.1. A plant functional type approach to determine plantcommunity input parametersIn the field of plant ecology, the recent development of func-tional ecology has provided powerful tools to simplify thecharacterization of species-rich grassland communities. Sev-eral plant response traits, i.e. stature traits such as height andlateral spread or leaf traits such as leaf dry matter content(LDMC in g kg−1) (e.g. Gross et al., 2007), were identified aspowerful functional markers (Garnier et al., 2004) to be used asdescriptors of these communities. In particular, LDMC rank-ing discriminates species according to their strategy as regardsnutrient capture and use (Gross et al., 2007) and their toler-ance to defoliation (Cruz et al., 2002). Further studies haveshown that LDMC is well correlated with plant characteristicsrelevant for herbage growth modelling such as leaf lifespan,phenological stages and relative growth rate (Al Haj Khaledet al., 2005; Pontes et al., 2007a). Slow-growing species withlong LLS are indicative of a slow turnover of plant parts, whilefast-growing species with short LLS have a fast turnover oftheir different organs (Cruz et al., 2002). To simplify the pro-
Please cite this article in press as: Duru, M., et al., Modelling above-groundModel. (2008), doi:10.1016/j.ecolmodel.2008.09.015
cedures to provide model inputs representing a species-richgrassland community, Ansquer et al. (2004) identified fourdistinct PFTs of grass species based on species’ individualLDMC values. Considering similarity in behaviour of grasses
PRESSx x x ( 2 0 0 8 ) xxx–xxx
Equation
lated Wsen = (1 − �)W(t0)(T(t)/LLSmin) (11)
), therial is the
Wsen = (1 − �)W(˙T)(T(t)/LLSmin) (12)
and dicotyledons regarding LDMC, the plant trait used fordefining the PFTs (r = 0.84, p < 0.001; Ansquer et al., 2004), aswell the related variables: the dates of phonological stages (AlHaj Khaled, 2005) and the leaf stem ratio (Calvière and Duru,1999), we assumed that it is possible to represent the wholegrassland community with four PFTs accounting for all grassspecies.
2.2.2. A function to account for phosphorus deficiencySpecies-rich grasslands are characterized by N as well as P defi-ciencies (Janssens et al., 1998). In a previous study (Duru andDucrocq, 1997), a P index was defined in the following manner
(with Pc and Nc being the nutrient concentration respectivelyof P and N in g 100 g−1):
NPI = 0.65 Pc0.015 + 0.65 Nc
(15)
Considering that phosphorus influences biomass produc-tion to a lesser extent than N (Duru and Calvière, 1996), wepropose an empirical-weighted plant nutrient index (NI), giv-ing more weight to the nitrogen index (NNI) than to thephosphorus index (NPI):
NI = NNI(0.5 NPI + 0.5) (16)
2.2.3. Modelling of the reproductive phase and biomassallocation in leavesHigher above-ground biomass growth rate during the repro-ductive phase is attributed to a higher photosynthesis rate(Woledge, 1979) and to an increase in assimilate partition-ing in favour of above-ground growth (Bélanger et al., 1992b;Ryser and Lambers, 1995). Indeed, a reproductive tiller has agreater assimilate demands than a vegetative tiller (Donaghyand Fulkerson, 1999), leading to higher mass (Barrett et al.,2005). These changes were taken into account through a newvariable, the ratio of RUE between the reproductive and thevegetative phases (RUErepro/RUEveg). Duru et al. (2000) com-pleted this statement showing that this feature is linked tothe proportion of reproductive tillers that depends mainly onnitrogen supply for pure stands (Duru et al., 2002). Thus theratio RUErepro/RUEveg was introduced into the model to assessthe intensity of the reproductive phase according to nutrientavailability (Duru et al., 2002):
herbage mass for a wide range of grassland community types. Ecol.
RUErepro
RUEveg= aNI + b (17)
Following McCall and Bishop-Hurley (2003), we consideredthe timing of the reproductive phase as being bounded by the

INECOMOD-5294; No. of Pages 17
n g x
bfeafta(tseRd
e
wt
spWrtlewioi
ntcara(uw
L
s
ARTICLEe c o l o g i c a l m o d e l l i
eginning of stem elongation and flowering. We included thiseature through the timing of the reproductive phase for differ-nt PFTs. Assuming the occurrence of the reproductive phases progressive, we represented this occurrence by a parabolicunction parameterized for each PFT that takes into accounthe temperature sum (�T) calculated from mean daily temper-tures ranging from 0 to 18 ◦C starting from the 1st of FebruaryCros et al., 2003). Thus this function requires three parame-ers: two temperature sums (degree-days) i.e. the beginning oftem elongation (10 cm stem height when there is no nutri-nt limitation: Tc) and the flowering time (Tflo), and the ratioUErepro/RUEveg (Eq. (17)). Until flowering, the function can beivided into two phases as follows:
RUErepro
RUEveg= 1 when ˙T < Tc (vegetative phase),
plants do not exhibit reproductive features;
.g. during early grazing in spring (18)
RUErepro
RUEveg= a˙T2 + b˙T + c when Tc < ˙T < Tflo (19)
ith a, b and c dependent on plant phenology (Tc and Tflo) andhe nutrient index NI (Eq. (17)).
The greater the percentage of reproductive tillers in a grassward, the lower is the percentage of vegetative tillers able toroduce new leaves after the flowering of reproductive tillers.e assumed that the ratio RUErepro/RUEveg is 1 if there are no
eproductive tillers (defined as optimal conversion for vegeta-ive phase) and tends to 1.65 (Woledge, 1978) when there is aarge proportion of reproductive tillers, i.e. around 35% of veg-tative tillers (Duru et al., 2002). Based on unpublished data,e empirically chose a constant of 2 for mimic the increase
n standing herbage mass latter than the flowering stage; i.e.btaining RUErepro/RUEveg (after flowering) = 0.35 when there
s higher proportion of reproductive tillers:
RUErepro
RUEveg(after flowering) = 2 − RUErepro
RUEveg(before flowering)
when ˙T > Tflo (20)
To model biomass allocation, we assumed that there waso stem decay over the range of defoliation managementested and yield dates considered. Consequently, the senes-ence rate should be applied to leaf mass and not to the wholebove-ground herbage mass. As stated in the introduction, theelationship between the leaf dry matter percentage (L) in thebove-ground herbage mass and the standing herbage massWnet, g m−2) from the beginning of the stem elongation phasentil the flowering stage (Eq. (17)) (Calvière and Duru, 1999)as
( )−0.42
Please cite this article in press as: Duru, M., et al., Modelling above-groundModel. (2008), doi:10.1016/j.ecolmodel.2008.09.015
= 0.824Wnet
100(21)
Consequently, when a new cohort of leaves begins toenesce during the reproductive phase, we calculated the
PRESSx x ( 2 0 0 8 ) xxx–xxx 5
senescent rate taking the leaf mass instead the above-groundherbage mass as done over the vegetative phase (see Eq. (11)and (12)):
Wsen = (1 − �)Wleaf
(T(t)
LLSmin
)(22)
2.3. Parameter estimation
2.3.1. Databases used for model parameterizationThree datasets were used to parameterize the model (Table 1).One is a plant database (exp. 1) comparing 12 grass nativespecies growing in pure stands with and without N limitation(Al Haj Khaled, 2005). The two others are a set of mown andgrazed grassland communities differing in their main PFT, Nand P availability surveyed in 1988 (exp. 2: Duru et al., 1994) and1991–1992 (exp. 3: Duru and Calvière, 1996; Calvière and Duru,1999), respectively. There was only three PFT in these exper-iments. For exp. 2 and 3, herbage was harvested six or seventimes in spring, allowing net herbage accumulation rate to becalculated. The PFT composition of the grassland communi-ties was determined from the botanical survey data. ANOVAwas performed to analyze if there was a significant differ-ence between PFTs in coefficients for LAI rate, RUE rate, andphenological plant features (see Section 2.3.2).
2.3.2. Characteristics of PFTs over the vegetative phaseFrom the initial mono-culture model (Cros et al., 2003), param-eters were adapted to take into account differences betweenPFTs regarding leaf angle (k, Eq. (2)), leaf senescence (LLS,Eq. (5)), leaf growth (LAI, Eq. (4)) and potential radiation useefficiency over the spring vegetative phase (RUEveg, Eq. (10))without changing the formalisms presented in Section 2.1.
Permanent grasslands usually exhibit a more horizontalleaf inclination compared to pure grass stands resulting inhigh light extinction. Thus following the recommendationsof Cruz and Shemoul (1991), we chose a higher value for theleaf angle (Eq. (2)): k = 0.73 compared to k = 0.6 in the initialmodel of Cros et al. (2003). The leaf lifespan values of thedifferent PFTs were determined in exp. 1 (Table 2). Throughlack of well-established data for the coefficient of assimilateremobilization (�), we have considered a unique value (0.33)irrespective of the PFT.
Comparisons of LAI rate and RUEveg rate coefficientsbetween PFTs showed similar results in pure stands and innatural grassland communities. In pure stands, significant dif-ferences have been found between PFTs’ strategies for theexpansion of LAI, i.e. a 150 degree-days difference betweenPFTs A–B and C to reach a LAI of 4, and for radiation use effi-ciency, i.e. a 12% difference between PFTs A–B and C (exp. 1,Al Haj Khaled, 2005). In natural conditions with non-limitingnutrient supply, Duru and Calvière (1996, exp. 2) found a30% difference in total biomass production between grasslandcommunities mainly composed of species with capture strate-gies (PFTs A–B) and species with conservation strategies (PFT
herbage mass for a wide range of grassland community types. Ecol.
C). To include these differences in the model, we regarded PFTA features as the baseline (LAI rate and RUEveg rate equal to 1)and using the data of exp.1, we estimated the values for theother PFTs (Table 2).

Pleasecite
this
articlein
press
as:Du
ru,M
.,etal.,M
odellin
gabove-grou
nd
herbage
mass
fora
wid
eran
geof
grassland
comm
un
itytyp
es.Ecol.M
odel.(2008),d
oi:10.1016/j.ecolmod
el.2008.09.015
AR
TIC
LE
IN P
RE
SS
ECO
MO
D-5294;
No.of
Pages17
6e
co
lo
gic
al
mo
de
ll
ing
xx
x(2
00
8)
xx
x–x
xx
Table 1 – Data bases used for model calibration and validation.
Experiment Location Use Year Number offields
Main grassfunctional type
Cuttingexperiment/growing
cycle studied
Number of measurementsper growing cycle
References
1 Auzeville (150 m absl)43◦5′N, 1◦43′E
Calibration(LAI; RUEveg)
2003 1 A, B, C: 12 native grassspecies
No/first 6–8 (from beginningof February up tobeginning of July)
Al Haj Khaled (2005)
2 Portet(1250 mabsl)42◦30′N,2◦E)
calibration(RUErepro)calibration
1986–1988 3 B and C No/First (no springgrazing)
6–8 (from beginningof April up tobeginning of July)
3 1991–1992 4 Duru et al. (1994)4 Validation 1981–1982–1983 2 A for one field, C for
the other6 grazing and cuttingtreatments on eachfielda/First (with ornot winter and springgrazing) and 2sd or3sd
1 (from end of June upto end of Octoberaccording to yielddate)
Duru (1987)
5a Ercé(600 mabsl)42◦30′N,1◦17′E
Validation 2002 8 4 B and 4 C No/First (no springgrazing)
4–6 (from beginningof April up tobeginning of July)
5b Validation 2004 18 12 B and 6 C No/First (no springgrazing)
6–8 (from beginningof April up tobeginning of July)
Ansquer (2006)
a Half of the experimental area was heavily grazed by ewes from 1st November up to 5th May. On each grazing treatment, there was three cutting regime differing in the date of the first cut (end of June, beginningof July and beginning of August) and the number of cuts (from 1 to 2) after the first cut.
Table 2 – Parameters attributed to leaf expansion rate and radiation use efficiency, leaf life span, beginning of stem elongation and flowering time according the grassesPFTs.
Group of speciesa PFT Coefficients Phenology (degree-days)b
Leaf expansion rate(no unit)c
Radiation use efficiency(g DM MJ−1)c
Leaf life spanc Beginning ofreproductive phasec
Flowering timec
LAI PFT RUE PFT LLSmin LLSmax Tc2 Tflo
Lolium perenne L. Holcuslanatus L.
A 1 1 500 750 500 1200
Dactylis glomerata L. Festucaarundinacea Shreb.
B 0.9 0.94 600 900 700 1400
Festuca rubra L. Agrostiscapillaris L.
C 0.8 0.89 800 1200 900 1600
Significance between PFTs * * ** ** ** **
a Example of species (Ansquer et al., 2004; Al Haj Khaled, 2005).b Round-off values of Tsum that are calculated from the 1st February.c Type of vegetation.∗ p ≤ 0.05.∗∗ p ≤ 0.001.

ARTICLE IN PRESSECOMOD-5294; No. of Pages 17
e c o l o g i c a l m o d e l l i n g x x x ( 2 0 0 8 ) xxx–xxx 7
Table 3 – Coefficients (˛, a, b, c) for radiation use efficiency over the reproductive period for frequently observed plantnutrient status (Ni) per plant functional type.
Main grass communitytype
Ni Coefficients for calculating RUE before flowering RUE after flowering
˛ a b c (2 − ˛)
A 0.75 1.48 −3.9E−06 0.00666 −1.35 0.5206170489
2Ifi
ac(fitttB
2
TcahltdcbcfA(
si(sndspw(aih2w
B 0.65 1.36 −2.9E−06 0.0C 0.55 1.24 −2.0E−06 0.0
.3.3. Parameters for reproductive phasendependently of the PFT, the ratio RUErepro/RUEveg variedrom 1.1 to 1.8 in exps. 2 and 3 (data not shown), being signif-cantly dependent on NI (r2 = 0.73; n = 22; p < 0.001; S.E. = 0.16):
RUErepro
RUEveg= 1.19 NI + 0.59 (23)
We calculated the ratio RUErepro/RUEveg for each PFT usingNI value representative of the conditions in which each PFT
onstitutes the major component of the grassland communityTable 3) (Duru et al., 2005). Then we determined the coef-cients a, b and c of the parabolic curve (Eq. (19)) using theime threshold given in Table 2. Over the reproductive phase,he increases in RUE computed (from +12% to +48% accordinghe PFT) were consistent with those established by McCall andishop-Hurley (2003): +23 to +41%.
.4. Model validation
wo additional datasets independent of those used for modelalibration were used for the model validation (see exps. 4nd 5 in Table 1). Exp. 4 enabled observed and simulatederbage mass to be compared for different agricultural defo-
iation practices, from two to four cuts per year (three cuttingreatments). The experimental design was split into two partsepending on whether the first defoliation had been pre-eded by a severe winter-spring grazing by ewes ending at theeginning of May (topping). In all cases, the first defoliationonsidered corresponded to a cut that could occur at three dif-erent dates (end of June, beginning of July and beginning ofugust). All subsequent defoliations were mowing or grazing
Duru, 1987).Exp. 5 provided the necessary data to compare with the
imulated herbage accumulation rates in spring at 10-dayntervals. For this experiment, datasets were built upon eightin 2002) and sixteen (in 2004) permanent grasslands withpecies numbers varying from 15 to 41 and the grass compo-ent constituting 28–88% of the total biomass (see Table 7 foretailed survey data). Such surveyed grasslands were repre-entative of various nutrient status and defoliation regimes asracticed by the local farmers (Coléno et al., 2005). Fig. 1 showseather conditions for the 2 years of survey. A part of each plot
around 35 m2) was protected from grazing or mowing. Thisllowed us to assess biomass accumulation from April to July
Please cite this article in press as: Duru, M., et al., Modelling above-groundModel. (2008), doi:10.1016/j.ecolmodel.2008.09.015
n the absence of disturbance. Green and senescent standingerbage mass was recorded by cutting the sward at aroundcm above the ground level. At the beginning of simulationse assumed that the residual biomass and LAI were 50 g m−2
−1.88 0.64−1.82 0.76
and 0.5, respectively, for all plots. Then we assumed that theremaining herbage mass at each cutting event was equal tothe residual biomass.
The validity of the model can be evaluated according to itsability to simulate herbage growth accumulation, especiallyfor plant communities differing in their PFT composition. Foreach grassland, we compared observed and simulated data ofthe complete PFT composition by weighing herbage growthaccumulation of each PFT according to its contribution to thegrassland community. We conducted the same analysis witheach single PFT, especially the one representing the small-est component of the grassland community (e.g. PFT A whenthe largest PFT was C and vice-versa). This second procedureenabled us to evaluate whether considering the actual PFTcomposition by weighing each PFT improved the accuracy ofthe output and in particular led to significant differences com-pared to the herbage accumulation of the least abundant PFT.
Sensitivity analysis for determining normalized sensitivitycoefficients (NSC) of the different PFT-specific parameters wasdefined as the variation in standing herbage mass (percent)when a parameter varied by ±10%. The same range of vari-ation (we arbitrarily chose 10% above or below the nominalvalue) was taken for all factors, which provided us the nec-essary data to assess the relative importance of these factors(Salte et al., 2001).
As proposed by Gauch et al. (2003), we calculated four sta-tistical criteria to validate the model: the root mean squaredeviation (RMSD), and the breakdown of the MSD into thethree additive components: the squared bias (SB) which mea-sures deviation of observed (O) and predicted (P) values fromthe 1:1 line, the non-unity slope (NU) which measures the rota-tion from the 1:1 line, and the lack of correlation (LC) whichmeasures dispersion:
RMSD =√
˙N1 (Pn − On)2
N
where N is the number of observations.
SB = (P − O)2
where P and O are the means of the predicted and observedvalues.
NU = (1 − b)2 × ˙(Pn − P)2
N
where b is the slope of the regression O = a + b × P.
herbage mass for a wide range of grassland community types. Ecol.
LC = (1 − r2) × ˙(On − O)2
N
where r2 is the correlation coefficient of O = a + b × P.

ARTICLE IN PRESSECOMOD-5294; No. of Pages 17
8 e c o l o g i c a l m o d e l l i n g x x x ( 2 0 0 8 ) xxx–xxx
2 an
PFT-specific parameters, the radiation use efficiency (RUE PFT,Table 2) displayed the largest potential effect on the model out-puts through the highest value for NSC (Table 5). We attributeda 10% difference for this parameter between PFT A and PFT C
Table 4 – Detailed normalized sensitivity coefficient(NSC) for phenological parameters (Tc: beginning ofreproductive phase, Tflo flowering time) of the model asa function of sum of temperature.
Sum of temperature (dd) Tc = 500 Tflo = 1200
500 0.06a 0.00750 0.44 −0.181000 0.26 −0.011500 0.12 1.49
Fig. 1 – Climatic conditions in the French Pyrenees in (a) 200maximum daily temperature is put an upper limit at 18 ◦C).
The model was run with input variables such as the mete-orological data of the specific year of each dataset and thenutrient sward status (NI) of the plots.
3. Model evaluation and validation
3.1. Model evaluation
3.1.1. Effects of plant nutrient status and of the PFTcompositionTo evaluate the ability of the model to respond accuratelyto nutrient status and to the PFT of the plant community,we ran it with standard weather patterns (spring weatherconditions, constant temperature 8 ◦C and constant radiation12 MJ m−2 day−1). The aim was to prevent any noise due toparticular weather conditions (e.g. variations in temperature,radiation, water, etc.). Under stress-free conditions (WI = 1 andNI = 1), biomass accumulation varied from 1000 g m−2 (PFT C)to 830 g m−2 (PFT A) (Fig. 2b). It was considerably reduced bya shortage of nutrients (NI = 0.6, Fig. 2a), dry matter accumu-lation falling to 3.5 t ha−1 for PFT A and 5.2 t ha−1 for PFT C.These results indicate (1) that the sward nutrient status seemsto influence the herbage growth accumulation to a greaterextent than the plant functional type i.e. in the order of 20%when varying the PFT and up to 50% when changing the nutri-ent status, and (2) that the differences in phenology betweenPFTs are the key factor to explain the differences in biomassproduction per PFT over a growth cycle (Fig. 2a and b). Indeed,PFT C reaches the reproductive phase later than PFT A; thusthe growth period lasts longer for PFT C than for PFT A and
Please cite this article in press as: Duru, M., et al., Modelling above-groundModel. (2008), doi:10.1016/j.ecolmodel.2008.09.015
this results over a whole growth cycle in higher yields for PFTC. However, this is not true if one considers herbage yields ofboth PFTs at similar dates. When considering Fig. 2a and b, itis important to keep in mind that in natural conditions, PFT C
d (b) 2004: temperature, precipitation and water stress (the
is unlikely to be found at a high fertility level as parameterizedfor this first set of evaluation. Fig. 2c relies on this statementas it represents the biomass accumulation of the PFTs in theirlikely natural conditions as regards nutrient status. NI is 40%lower for PFT C as compared to PFT A.
3.1.2. Sensitivity analysisAs stated in the previous section, phenology appears to beof primary importance in the estimation of dry matter accu-mulation. Hence, the sensitivity analysis consisted of varyingthe thermal times for the beginning of the reproductive phaseand flowering. The model was sensitive to both parameters(NSC > 0.1) (Table 4). For the other PFT-specific parameters, themodel was sensitive to all of them (Table 5), justifying thechoices made for model parameterization. Among these other
herbage mass for a wide range of grassland community types. Ecol.
1680 − 1.51
Average 0.22 0.56
a Parameters values altered by ±10%. PFT A taken as a reference.

ARTICLE IN PRESSECOMOD-5294; No. of Pages 17
e c o l o g i c a l m o d e l l i n g x x x ( 2 0 0 8 ) xxx–xxx 9
Fig. 2 – Green biomass accumulation under average spring condifunctional effect and (c) represent each PFT in natural conditions
Table 5 – Normalized sensitivity coefficient (NSC) fordifferent parameters of the model.
Parameters Green biomass Standing biomass Average
RUE PFT 1.00a 0.96 0.98LAI PFT 0.20 0.20 0.20LLS 0.29 0.15 0.22Tc 0.26 0.18 0.22Tflo 0.57 0.55 0.56� 0.13 0.13 0.13
PFT A taken as a reference, NSC averaged on biomass output at500, 750, 1000 and 1500 degree-days; see Table 1 for abbreviation ofparameters; � is representative of the proportion of dry matter ofsenescent leaves that is remobilized. RUE PFT: radiation use effi-ciency dependent on plant functional type. LAI PFT: leaf area indexdependent on plant functional type. LLS: leaf life span. Tc: beginning
wtapttt
3
3Bntd
vegetation type C.Based on the data from exp. 5, we obtained a good overall fit
between predicted and observed values for herbage accumu-
Fig. 3 – Measured standing biomass in plots from exp. 4
of stem elongation. Tflo; temperature sum at flowering. �: coefficientof remobilization.a Parameters values altered by ±10%.
hich actually corresponds to the range of variation tested inhe sensitivity analysis. Thus it was expected to obtain such
large effect on the model output. The second PFT-specificarameter that appeared to be of particular importance washe timing of flowering (Tflo), followed by the leaf lifespan (LLS),he time at which reproductive growth begins (Tc), and lastlyhe leaf area expansion rate (LAI PFT).
.2. Model validation
.2.1. Overall analysis of the simulation
Please cite this article in press as: Duru, M., et al., Modelling above-groundModel. (2008), doi:10.1016/j.ecolmodel.2008.09.015
ased on the data of exp. 4 that involved cutting events at phe-ological stages similar to farmers’ practices, Fig. 3 showedhat there was a good fit between measured and simulatedata (r2 = 0.87, n = 99, RMSD = 54.4 g m−2). However, there was
tions to demonstrate (a) nutrient stress effect, (b) plant.
a trend to underestimate the yield at the first cut for plotswhich were not grazed in winter, and to overestimate the low-est yields that corresponded to regrowth. The model clearlydistinguished between biomass accumulation of PFT B and C,and the first cut from the following one. Nevertheless, therewas a tendency to underestimate herbage yield for vegeta-tion type B in the first cycle and to overestimate regrowth for
herbage mass for a wide range of grassland community types. Ecol.
against simulated results, considering the actualproportion of the different plant functional types: B (filledsymbols) and C (open symbols) for the first yield (squares)and the others (circles).
ARTICLE INECOMOD-5294; No. of Pages 17
10 e c o l o g i c a l m o d e l l i n g
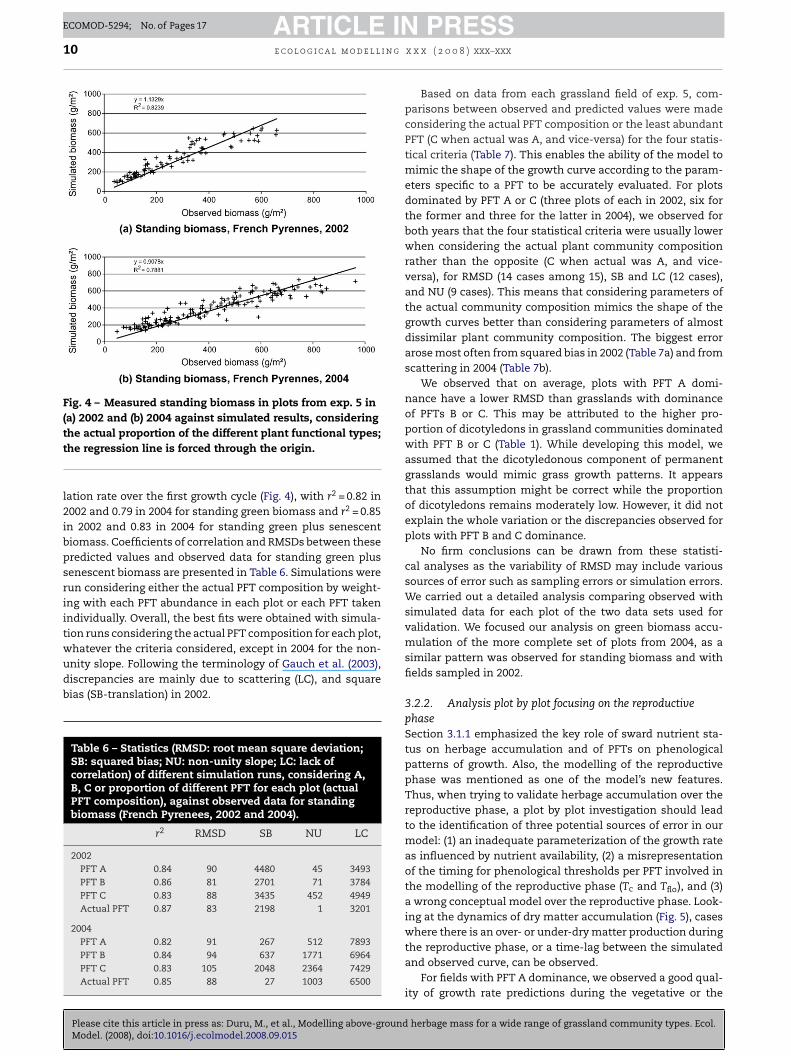
Fig. 4 – Measured standing biomass in plots from exp. 5 in(a) 2002 and (b) 2004 against simulated results, considering
the actual proportion of the different plant functional types;the regression line is forced through the origin.lation rate over the first growth cycle (Fig. 4), with r2 = 0.82 in2002 and 0.79 in 2004 for standing green biomass and r2 = 0.85in 2002 and 0.83 in 2004 for standing green plus senescentbiomass. Coefficients of correlation and RMSDs between thesepredicted values and observed data for standing green plussenescent biomass are presented in Table 6. Simulations wererun considering either the actual PFT composition by weight-ing with each PFT abundance in each plot or each PFT takenindividually. Overall, the best fits were obtained with simula-tion runs considering the actual PFT composition for each plot,
Please cite this article in press as: Duru, M., et al., Modelling above-groundModel. (2008), doi:10.1016/j.ecolmodel.2008.09.015
whatever the criteria considered, except in 2004 for the non-unity slope. Following the terminology of Gauch et al. (2003),discrepancies are mainly due to scattering (LC), and squarebias (SB-translation) in 2002.
Table 6 – Statistics (RMSD: root mean square deviation;SB: squared bias; NU: non-unity slope; LC: lack ofcorrelation) of different simulation runs, considering A,B, C or proportion of different PFT for each plot (actualPFT composition), against observed data for standingbiomass (French Pyrenees, 2002 and 2004).
r2 RMSD SB NU LC
2002PFT A 0.84 90 4480 45 3493PFT B 0.86 81 2701 71 3784PFT C 0.83 88 3435 452 4949Actual PFT 0.87 83 2198 1 3201
2004PFT A 0.82 91 267 512 7893PFT B 0.84 94 637 1771 6964PFT C 0.83 105 2048 2364 7429Actual PFT 0.85 88 27 1003 6500
PRESSx x x ( 2 0 0 8 ) xxx–xxx
Based on data from each grassland field of exp. 5, com-parisons between observed and predicted values were madeconsidering the actual PFT composition or the least abundantPFT (C when actual was A, and vice-versa) for the four statis-tical criteria (Table 7). This enables the ability of the model tomimic the shape of the growth curve according to the param-eters specific to a PFT to be accurately evaluated. For plotsdominated by PFT A or C (three plots of each in 2002, six forthe former and three for the latter in 2004), we observed forboth years that the four statistical criteria were usually lowerwhen considering the actual plant community compositionrather than the opposite (C when actual was A, and vice-versa), for RMSD (14 cases among 15), SB and LC (12 cases),and NU (9 cases). This means that considering parameters ofthe actual community composition mimics the shape of thegrowth curves better than considering parameters of almostdissimilar plant community composition. The biggest errorarose most often from squared bias in 2002 (Table 7a) and fromscattering in 2004 (Table 7b).
We observed that on average, plots with PFT A domi-nance have a lower RMSD than grasslands with dominanceof PFTs B or C. This may be attributed to the higher pro-portion of dicotyledons in grassland communities dominatedwith PFT B or C (Table 1). While developing this model, weassumed that the dicotyledonous component of permanentgrasslands would mimic grass growth patterns. It appearsthat this assumption might be correct while the proportionof dicotyledons remains moderately low. However, it did notexplain the whole variation or the discrepancies observed forplots with PFT B and C dominance.
No firm conclusions can be drawn from these statisti-cal analyses as the variability of RMSD may include varioussources of error such as sampling errors or simulation errors.We carried out a detailed analysis comparing observed withsimulated data for each plot of the two data sets used forvalidation. We focused our analysis on green biomass accu-mulation of the more complete set of plots from 2004, as asimilar pattern was observed for standing biomass and withfields sampled in 2002.
3.2.2. Analysis plot by plot focusing on the reproductivephaseSection 3.1.1 emphasized the key role of sward nutrient sta-tus on herbage accumulation and of PFTs on phenologicalpatterns of growth. Also, the modelling of the reproductivephase was mentioned as one of the model’s new features.Thus, when trying to validate herbage accumulation over thereproductive phase, a plot by plot investigation should leadto the identification of three potential sources of error in ourmodel: (1) an inadequate parameterization of the growth rateas influenced by nutrient availability, (2) a misrepresentationof the timing for phenological thresholds per PFT involved inthe modelling of the reproductive phase (Tc and Tflo), and (3)a wrong conceptual model over the reproductive phase. Look-ing at the dynamics of dry matter accumulation (Fig. 5), caseswhere there is an over- or under-dry matter production during
herbage mass for a wide range of grassland community types. Ecol.
the reproductive phase, or a time-lag between the simulatedand observed curve, can be observed.
For fields with PFT A dominance, we observed a good qual-ity of growth rate predictions during the vegetative or the

Pleasecite
this
articlein
press
as:Du
ru,M
.,etal.,M
odellin
gabove-grou
nd
herbage
mass
fora
wid
eran
geof
grassland
comm
un
itytyp
es.Ecol.M
odel.(2008),d
oi:10.1016/j.ecolmod
el.2008.09.015
AR
TIC
LE
IN P
RE
SS
ECO
MO
D-5294;
No.of
Pages17
ec
ol
og
ica
lm
od
el
lin
gx
xx
(20
08
)x
xx
–xx
x11
Table 7 – Statistics (RMSD: root mean square deviation; SB: squared bias; NU: non-unity slope; LC: lack of correlation) considering the actual or the opposite plantfunctional type for each plot in French Pyrenees (2002: a and 2004: b) and variables of interest for explaining potential discrepancies.
Plot name RMSD SB NU LC Variables of interest
Actual Oppositea Actual Opposite Actual Opposite Actual Opposite (%) PFT dominant % of graminea NI PI
a (2002)Le Carre 54 58 606b 8 960 1084 1332 2331 A (60) 51 1 0.81Rives Terras 33 52 23 901 905 963 132 658 A (63) 58 0.63 0.73Camplong 1 50 76 1707 387 14 1216 668 4341 A (62) 41 0.86 0.84Routies 73 3647 250 1437 B (57) 38 0.70 0.68Samouchet 1 84 6300 215 585 B (40) 51 0.76 0.68Samouchet 2 126 129 11,854 13,153 3539 1937 718 1436 C (92) 30 0.49 0.59Gironsas 1 88 117 4671 5787 216 734 2945 7153 C (62) 58 0.69 0.73Gironsas 2 112 121 10,747 11,318 2232 798 886 469 C (65) 37 0.44 0.55
Plot name RMSD SB NU LC Variables of interest
Actual Oppositea Actual Opposite Actual Opposite Actual Opposite (%) PFTdominant
% ofgraminea
Number ofspecies (grasses)
NI PI sumT 1
b (2004)Ajas 1 60 64 309 26 1792 1884 1515 1732 A (41) 56 18 (7) 0.71 1 792Moulaque 68 53 1632 6534 78 633 2993 4116 A (49) 87 17 (9) 0.78 1 605Rives Terrasse 67 70 142 598 7320 4285 1047 120 A (56) 67 25 (9) 0.75 1 613Camplong 1 52 108 405 5741 273 889 2083 5208 A (56) 73 15 (6) 0.88 1 582Peyche Petit 1 105 145 2189 11,303 2318 6405 6421 3210 A (72) 88 19 (6) 0.85 1 594Coste Bas1 99 142 3600 10,320 2772 3186 3407 6815 A (72) 66 22 (8) 0.73 0.89 684Coste Bas 2 37 300 2 1026 B (38) 30 34 (10) 0.60 0.77 826Camplong 2 86 837 1298 5300 B (58) 68 27 (8) 0.64 0.94 776Routies 113 1691 5643 5500 B (68) 43 31 (8) 0.73 0.80 776Ajas 2 128 11,490 736 10,455 B (70) 79 29 (10) 0.60 0.62 694Campagne b 52 405 273 2083 B (73) 64 20 (7) 0.73 1 668Le Carre 63 595 3814 503 B (87) 63 20 (6) 0.65 1 760Angladure 82 3481 409 2971 B (82) 28 17 (4) 0.81 1 605Peyche Petit 2 118 136 2272 6871 647 1 11,501 12,062 C (60) 44 35 (8) 0.61 0.81 808Lassus 2 53 65 29 474 302 60 2467 3813 C (61) 63 41 (10) 0.70 0.63 791Gironsas 1 85 102 4205 6209 18 6 3679 4139 C (61) 63 38 (9) 0.70 0.63 791
SumT 1: Sum of temperature at which DM stem reaches 1 t/ha.a Parameters of vegetation type C for A dominated plant vegetation type and reciprocally.b Numbers in italic means that actual value is greater than opposite value.

ARTICLE IN PRESSECOMOD-5294; No. of Pages 17
12 e c o l o g i c a l m o d e l l i n g x x x ( 2 0 0 8 ) xxx–xxx
Fig. 5 – Green biomass accumulation for two plots of each PFT dominance, observed and simulated data plotted forunderstanding of potential discrepancies: observed (diamond), simulated (full line); F+ and F− corresponds to two faces of asame field, each of them having large difference in fertilization and/or grazing-cutting management from many years; the
regression line is forced through the origin.reproductive phase. The phenology of PFT A was in agree-ment with the observed data. The only discrepancy noticedwas the disagreement between a few measured and predicteddata values at the peak of biomass accumulation (e.g. Pey-che Petit F+, Fig. 5a). Interestingly, the same measurementerrors appeared in the observed data for standing biomass.We may attribute this discrepancy to a sampling bias. Resultsfrom 2002 tend to confirm this hypothesis, displaying a goodfit between observed and simulated data for fields with PFT Adominance, with RMSD varying from 33 to 54 (Table 7).
Plots with PFT B dominance demonstrated an overall goodfit between observed and simulated data for growth rate. How-ever, we noticed a slight delay in reaching the biomass peakfor field Le Carré, Routies and Camplong F− (not shown).Also, an overestimation of biomass can be observed duringthe reproductive phase in the field Ajas F+ (Fig. 5b). Thus,this divergence between observed and simulated data mayarise from an inadequate parameterization of the phenologi-cal thresholds for PFT B. There might be a need to re-evaluatesuch thresholds with higher values for Tc and most probablyfor Tflo, considering that the model is more sensitive to thelatter (Table 5).
Finally, concerning fields with a dominance of PFT C
Please cite this article in press as: Duru, M., et al., Modelling above-groundModel. (2008), doi:10.1016/j.ecolmodel.2008.09.015
(Fig. 5c), we observed the same growth rate and the sameorder of magnitude of biomass accumulation for predictedand observed data. However, we detected a constant over-estimation of biomass by the model during spring for three
of the four plots sampled. The same results were observedfrom the field sampled in 2002. Thus, it seems that the dis-crepancies between observed and simulated data should beattributed to an unsatisfactory parameterization, as appearsto be the case for PFT B. However, unlike PFT B where theparameters of phenology appear to be uncertain, for PFT Cthe phenology of simulated and observed data is in phase.We attributed the observed difference to a misrepresentationof growth rate during spring. Therefore, the radiation use effi-ciency (RUE PFT) and leaf area expansion (LAI PFT) parametersshould be reassessed.
3.3. Applicability of the model for a range ofmanagement practices
One of the final objectives of the model being to simulate theeffect of early spring grazing on the type of regrowth (repro-ductive or vegetative depending on whether the apices areremoved), we considered the date (expressed as a tempera-ture sum) at which the stem dry matter reached a thresholdvalue of 1 t/ha as a critical sward state. Defoliation before thisstage is assumed not to remove apices (the regrowth is repro-ductive), the opposite occurring after this stage (the regrowth
herbage mass for a wide range of grassland community types. Ecol.
being vegetative). In our model, this stage depends on the sim-ulation of dry matter partitioning between stems and leaves.Results given on Table 7b (last column) show the range oftemperature sum over which this stage occurred. There were

INECOMOD-5294; No. of Pages 17
g x
sdCpmwso
4
Tw(Sgwmewvm
4p
TotamtofHLsoowgW(iagi
hbawapddN
c
ARTICLEe c o l o g i c a l m o d e l l i n
ignificant differences (p < 0.05) between the three classes ofominant PFTs; 638, 729 and 892 degree-days for PFTs A, B and, respectively. These results support the appropriateness ofarameterization of our model with PFTs in order to apply it foranagement practices. It appears that the model reproducesell the timing of the reproductive phase that is important for
imulating the effect of early grazing on the dry matter yieldf the regrowth and its quality.
. Discussion
his model stems from a previous mono-specific model,hich was validated for several regions and years in France
Brittany: Cros et al., 2003; Centre of France: Andrieu, 2004;outh West France: Duru et al., 2007), and used mainly forrazing management (Cros et al., 2003). Thus in this paper,e emphasized the effect of vegetation types (PFTs) and theiranagement (defoliation time and intensity) rather than the
ffect of climate (location and years). In the light of the results,e discuss the relevance of using a functional approach of the
egetation to frame and to parameterize an herbage growthodel in order to design management practices.
.1. Ability of PFT to encapsulate relevant plantarameters for modelling above-ground herbage mass
he originality of the model lies in the use of a functional ecol-gy approach allowing reducing the large number of specieso a small number of plant functional types established on
plant trait, the leaf dry matter content which is related toain growth and development plant parameters. LDMC was
he plant functional parameter which is best correlated, albeitnly roughly, with the two plant features of agronomic valueor modelling herbage growth pattern (McCall and Bishop-urley, 2003). It is well known that LDMC is correlated withLS, a leaf functional parameter that is an indicator of planttrategy for resource capture and use (Garnier et al., 2004). Lessbvious was the relationship between LDMC and the datesn which species reach their phenological stages. Indeed, itas shown that these plant characteristics are related to plant
rowth rates and capture and use of nutrients (Sosebee andeibe, 1973). This was confirmed by results obtained in exp. 1
Al Haj Khaled, 2005; Al Haj Khaled et al., 2005). However, theres a risk that such simplification does not allow to embraceccurately all the relevant processes for modelling herbagerowth. Below, we evaluate them considering plants growingn similar nutrient conditions.
Simplifications made for biomass allocation and carbo-ydrates did not distort the model performance. Whereasased on a statistical relationship between leaf proportionnd standing herbage mass (Eq. (21)), our model reproducesell the fact that species growing on nutrient-poor habitatsllocate a smaller proportion of assimilates to the stem orseudo-stem (Van Der Werf et al., 1993). However, the effect inifferences of proportion of assimilates for laminae regrowth
Please cite this article in press as: Duru, M., et al., Modelling above-groundModel. (2008), doi:10.1016/j.ecolmodel.2008.09.015
erived from remobilization according to species strategy andsupply (Thorton et al., 1994).Some discrepancies observed during the validation phase
an be attributed to a possible inappropriate parameteriza-
PRESSx x ( 2 0 0 8 ) xxx–xxx 13
tion of the model for PFT B and especially PFT C. The sourceof divergences appears to be different according to the PFTconsidered. For PFT B, it seems that parameters representa-tive of the phenology should be reassessed while for PFT C,the parameters influencing the source-driven model are indoubt. As proven by the sensitivity analysis, good estimationof these parameters is a necessary preliminary to the adequaterepresentation of herbage growth accumulation of permanentgrasslands. We suggest increasing values for parameters of thephenology of PFT B and decreasing the values of radiation useefficiency (RUE PFT) and leaf area expansion (LAI PFT) for PFTC. For the latter processes, analysis done at PFT level show thatthe difference in standing biomass between grasses of PFT Aand PFT C growing in similar nutrient condition was around25% when the peak was reach for PFT A (Fig. 2b). These resultsagree with previous ones comparing grass species growing inpure stand (Frame, 1989; Pontes et al., 2007a). Our frameworkis too in agreement with short-term pot experiments show-ing that species found in nutrient-rich habitats (Arrhenatherumelatius L., Dactylis glomerata L.: PFT B) have a higher relativegrowth rate than grasses which grow in nutrient-poor habi-tats (Festuca rubra L., Briza media L.: PFT C) even if the nutrientavailability, nitrogen in particular, is low (Berendse et al., 1992;Van Der Werf et al., 1993). For instance Ryser and Lambers(1995) found a difference in relative growth rate of 50% com-paring Dactylis glomerata L. (PFT B) and Brachypodium pinnatumL. (PFT D), and Schippers et al. (1999) found a difference in rel-ative growth rate of less than 20% comparing Holcus lanatus L.(PFT A) and Festuca rubra L. (PFT C). However, such comparisonsbetween adult plant growing in community and juvenile grow-ing in pot should be done with caution; RGR for the latter beingcalculated at similar plant mass. Furthermore, growth char-acteristics of non-grass species, which are the most abundantwithin the plant communities having the greater proportionof C PFT, are bad-known. However, we think having limitingthe risk of great error, combining experiment results based onspecies growing in pure stands and in plant community fordetermining likely parameters for light capture and conver-sion (Table 2).
All these remarks suggest the importance of includingplant functional type-specific parameters in our model to beable to measure more appropriately the herbage growth accu-mulation of permanent grassland. However, further researchis needed to better quantify the effect of PFT on the differentgrowth and development processes.
4.2. Relevance of the PFT approach to adapt a grassgrowth model and define management strategies
The model evaluation demonstrated the importance of theintegration of PFT-specific parameters in addition of an indica-tor of nutrient availability to simulate the herbage productionat whole growing season level as well as the herbage accumu-lation rate at growing cycle level. We verified that formalismsused for mono-specific swards performed well for species-richgrasslands. This current model version adapted to species-
herbage mass for a wide range of grassland community types. Ecol.
rich grassland mimics in a consistent way both growth anddevelopment stages, meaning that key processes were fairlywell taken into account. Phenological plant characteristicsand leaf lifespan are key characteristics that determine the

INECOMOD-5294; No. of Pages 17
i n g
which lead to a given vegetation composition in PFTs. Such
ARTICLE14 e c o l o g i c a l m o d e l l
herbage growth pattern, whereas mainly nutrient availabilityand secondarily PFT drive the herbage growth rate (Pontes etal., 2007b). In other words, the simplifications we have madeto adapt a mono-specific sward model which is only source-driven (with expansion of leaf area not coupled with increasein leaf dry matter, and resource allocation towards leaf depen-dent entirely on standing herbage mass) kept the simulatedresults in a consistent range for species-rich grasslands. Onemain advance has been to show that there is a gain in precisionby taking into account the PFT composition as well as nutri-ents availability, to evaluate their respective roles because theyare not strictly correlated in managed grasslands due to differ-ences in defoliation regimes (Lavorel and Garnier, 2002; Duruet al., 2005).
The importance of nutrient for grass growth has beenfrequently demonstrated in the literature (Bélanger et al.,1992a,b), but until now, only a few grassland models con-sidered N, and particularly P, as limiting factors in herbagegrowth (Bonesmo and Bélanger, 2005). They assumed thatnitrogen deficiency would reduce grass yield by limiting leafarea expansion and the photosynthetic capacity of the plant.The conclusions drawn from the sensitivity analysis of ourmodel reinforce these considerations and demonstrate theimportance of including N-limiting conditions to improve theestimate of the attainable yield. Furthermore, we have pro-posed a simple way for taking account of P limitation which isfrequently associated with species-rich grasslands (Janssenset al., 1998) while this resource is most often ignored whenmodelling herbage growth. We use the plant nutrient index asan input variable as we have no soil N module in the presentversion of the model. It is important to bear in mind that nitro-gen supply in particular can vary greatly according to weather,soil type and past use of the grassland (Jarvis, 1998).
The good fit observed between simulated and observeddata from most of the grassland fields or experimental cut-ting treatments confirms the importance of accounting forthe reproductive phase as shown for mono-specific swards(Barrett et al., 2005). In this way, parameters found in equa-tion 23 (increase in RUE over the reproductive phase) weresimilar to those calculated for a Dactylis glomerata L. sward,where a wide range of N fertilizer amounts was applied(RUErepro/RUEveg = 1.10NI + 0.55; Duru et al., 2002), and findingsfrom Woledge (1978) for NI = 1 (RUErepro/RUEveg = 1.65). Thismeans that there is a generic behaviour at least for grasses forthe intensity of the reproductive response to nutrient avail-ability (Garnier, 1992; Duru et al., 2004).
Another main advance has been to show that there is again in precision by taking into account the PFT composition inaddition to an indicator of nutrient availability, particularly forsimulating herbage accumulation rate for a short period dur-ing the reproductive phase (exp. 5). This allowed us to simulatethe shape of the growth curve especially over the reproductivephase. This is a novel result comparing to previous models(e.g. Jouven et al., 2006). Statistical analysis for the model val-idation usually displayed better fits between observed andpredicted values when considering the actual PFT composi-
Please cite this article in press as: Duru, M., et al., Modelling above-groundModel. (2008), doi:10.1016/j.ecolmodel.2008.09.015
tion than the least abundant PFT. This means that the timingfor phenological thresholds per PFT involved in the modellingof the reproductive phase were consistently represented bythe model. The examination of statistics shows that the RMSD
PRESSx x x ( 2 0 0 8 ) xxx–xxx
were lower for PFT A than for PFT C in 2002 and in 2004. How-ever, the analysis of the MSD components did not reveal thesame pattern for the source of error between years for PFTC (Table 7). In 2002, the greatest source of error came fromthe standard biais (translation) whereas it was due to scat-tering in 2004. Apart from errors due to the model, we cannotexclude those due sampling; i.e. variation in the cutting heightfrom one date to another, even though the herbage was cutby the same person throughout the experiment. Consideringthat a 1 cm difference in the cutting height can correspond to25 g m−2 (Duru, 2003), this may be the reason for the differentvalues of the three components of the MSD depending on thecutting date. In other word, a variation of 50% in the residualbiomass led to a change of 12.5% in the simulated biomass andgenerated a NU error. In our study, we assume the same resid-ual biomass and LAI for every plot. This may explain some ofthe reported NU error.
4.3. Relevance of a PFT-based model for designingmanagement strategies
Knowing the PFTs should be of great help to determine moreappropriate management practices and more specifically toaccurately time grazing. They should help managers to bettermanage their grasslands, as they could provide informationto determine more precisely the beginning of stem elonga-tion (Robson et al., 1988) a sign of decreasing grass quality forgrazing (Hacker and Minson, 1981). The model is able to repro-duce the delay in stem elongation between grasslands havingdifferent dominant PFTs, explaining why a particular grazingdate leads to vegetative or reproductive growth according tothe dominant PFT (Duru et al., 2000). Including PFT-specificparameters to determine the critical cutting time at which thereproductive phase occurred (e.g. when the stem dry matterreached a threshold value of 1 t/ha) allows to enlarge and gen-eralize the results of McCall and Bishop-Hurley (2003) passingfrom a limited number of species to a limited number of PFTdefined on an ecological basis. Furthermore, the model repro-duces well the ability of some PFT to be subjected to late ordeferred grazing practices (Wilkins, 1995). In this way, it givessound basis for favouring grassland of type C (species having aconservative resource strategy) as found empirically (Girard etal., 2001), while grasslands dominated by PFT A (species hav-ing an acquisitive resource strategy) should be used for earlygrazing or silage production.
Finally, as suggested for mono-specific stands (Sheath andClark, 1996), the results presented in this paper reinforce theimportance of considering PFTs to optimize cutting (mead-ows) and grazing (pastures) management at field and farmlevels for a larger range of management practices (intensity,timing) and at shorter time-scale that previous model (e.g.Jouven et al., 2006). In order to use the model for realistic sit-uations, we need to identify the range of ecological gradients,in terms of nutrient availabilities and defoliation regimes,
herbage mass for a wide range of grassland community types. Ecol.
information is available for gradients of grazing intensity (e.g.Pakeman, 2004) or of soil fertility (e.g. Lavorel and Garnier,2002). However, more research should be done to ensure theirgenerality.

INECOMOD-5294; No. of Pages 17
g x
5
Wfflpdte
osthpmt(
fcTetu(ctm
lowOstaf
A
FPat(
r
A
A
ARTICLEe c o l o g i c a l m o d e l l i n
. Conclusion
e successfully adapt an existing mono-specific grass modelor species-rich grasslands by introducing new features: (i) theunctional composition of the plant community based on aeaf trait (the leaf dry matter content) that encapsulates keylant features having a role in plant growth, senescence andevelopment processes; (ii) the reproductive phase, that oftenakes place entirely in spring for low input grasslands; (iii) theffect of nutrient availability, especially phosphorus.
We show that the model should enable the simulationf the dynamics of above-ground biomass on different timecales: herbage accumulation rate during regrowth, especiallyhe shape of the growth curve for the reproductive period, anderbage yield for a wide range of management regimes. Oncelant functional groups are known, the model inputs are basiceteorological data (daily temperature, radiation, precipita-
ion, potential evapo-transpiration), and site characteristicsplant nutrient index, soil water capacity).
The level of detail we chose for the simulation resultedrom a compromise between the target use of the model, theomplexity of the modelling process and the available data.his led us to choose a source-driven model and a simplermpirical approach for modelling allocation of assimilateso leaf and stem. We believe that the model is suitable forse with stakeholders to support farming system innovation
Woodward et al., 2008), albeit with some provisos, espe-ially regarding the range of management strategies that allowhe plant functional type composition of the grassland to be
aintained.Nevertheless, further research is needed to overcome some
imitations we have pointed out. First, we chose a single valuef the coefficient of assimilate remobilization, whereas someork shows that it depends on plant strategy and N supply.n the other hand, knowing the importance of dicotyledonpecies in high-diversity grasslands, and taking into accountheir potential effect on model parameters, we intend tossess the potential for including them through specific plantunctional types in future model development.
cknowledgements
inancial support was provided by the SEAMLESS Integratedroject, UE 6th Framework Programme, Contract no. 010036-2nd the EU project VISTA (Vulnerability of Ecosystem Serviceso Land Use Change in Traditional Agricultural Landscapes)Contract no. EVK2-2001-15 000356).
e f e r e n c e s
l Haj Khaled, R., 2005. L’évaluation des caractéristiquesagronomiques d’espèces par leurs traits de vie comme étapepréalable au diagnostic des communautés à flore complexe.
Please cite this article in press as: Duru, M., et al., Modelling above-groundModel. (2008), doi:10.1016/j.ecolmodel.2008.09.015
Ph.D. Thesis. INPL, Nancy, France, 260 pp. + annexes.l Haj Khaled, R., Duru, M., Theau, J.P., Plantureux, S., Cruz, P.,
2005. Variation in leaf traits through seasons andN-availability levels and its consequences for rankinggrassland species. J. Veg. Sci. 16, 391–398.
PRESSx x ( 2 0 0 8 ) xxx–xxx 15
Andrieu, N., 2004. Diversité du territoire de l’exploitation etsensibilité du système fourrager aux aléas climatiques, étudeempirique et modélisation. Thesis. Institut AgronomiqueParis-Grignon, 258 pp.
Ansquer, P., 2006. Caractérisation agro-écologique desvégétations prairiales naturelles en réponses au pratiquesagricoles. Apports pour la construction d’outils de diagnostic.Thèse INP Toulouse 280 pp + annexes.
Ansquer, P., Theau, J.P., Cruz, P., Viegas, J., Al Haj Khaled, R., Duru,M., 2004. Caractérisation de la diversité fonctionnelle desprairies à flore complexe, vers la construction d’outils degestion (Characterizing the functional diversity of grasslandswith a complex flora, towards the creation of tools formanagement). Fourrages 179, 353–368.
Barrett, P.D., Laidlaw, A.S., Mayne, C.S., 2005. GrazeGro, aEuropean herbage growth model to predict pastureproduction in perennial ryegrass swards for decision support.Eur. J. Agron. 23, 37–56.
Bélanger, G., Gastal, F., Lemaire, G., 1992a. Growth analysis of atall fescue sward fertilized with different rates of nitrogen.Crop. Sci. 32, 1371–1376.
Bélanger, G., Gastal, F., Warembourg, F.R., 1992b. The effects ofnitrogen fertilization and the growing season on carbonpartitioning in a sward of tall fescue (Festuca arundinaceaSchreb). Ann. Bot. 70, 239–244.
Berendse, F., Elberse, W.T., Geerts, R.H., 1992. Competition andnitrogen loss from plants in grassland ecosystems. Ecology 73,46–53.
Bignal, E.M., McCracken, D.I., 2000. The nature conservation valueof European traditional farming systems. Environ. Rev. 8,149–171.
Bonesmo, H., Bélanger, G., 2005. Timothy yield and nutritivevalue by the CATIMO model, I. Growth and nitrogen. Agron. J.94, 337–345.
Brisson, N., et al., 1998. STICS, a generic model for the simulationof crops and their water and nitrogen balances. I. Theory andparameterization applied to wheat and corn. Agronomie 18,311–346.
Calvière, I., Duru, M., 1995. Leaf appearance and senescencepatterns of some pasture species. Grass Forage Sci. 50,447–451.
Calvière, I., Duru, M., 1999. The effect of N and P fertilizerapplication and botanical composition on the leaf/stem ratiopatterns in spring in Pyrenean meadows. Grass Forage Sci. 54,255–266.
Coléno, F.C., Duru, M., Theau, J.P., 2005. A method to analysedecision-making processes for land use management inlivestock farming. Int. J. Agric. Sustain. 3, 69–77.
Corson, M.S., Skinner, R.H., Rotz, C.A., 2006. Modification of theSPUR rangeland model to simulate species composition andpasture productivity in humid temperate regions. Agric. Syst.87, 169–191.
Craine, J.M., Tilman, D., Wedin, D., Reich, P., Tjoelker, M., Knops, J.,2002. Functional traits, productivity and effects on nitrogencycling of 33 grassland species. Funct. Ecol. 16, 563–574.
Cros, M.J., Duru, M., Garcia, F., Martin-Clouaire, R., 2003. Abiophysical dairy farm model to evaluate rotational grazingmanagement strategies. Agronomie 23, 105–122.
Cruz, P., Shemoul, E., 1991. Effet de l’azote sur l’expression dupotentiel de croissance d’une prairie naturelle à base deDichanthium aristatum en Guadeloupe (Antilles francaises). In:Proceedings of the IV International Rangeland Congress,Montpellier, France, pp. 360–363.
Cruz, P., Duru, M., Therond, O., Theau, J.P., Ducourtieux, C.,Jouany, C., Al Haj Khaled, R., Ansquer, P., 2002. Une nouvelle
herbage mass for a wide range of grassland community types. Ecol.
approche pour caractériser les prairies naturelles et leurvaleur d’usage (A new approach to the characterization ofpermanent grasslands and their use value). Fourrages 172,335–354.

INECOMOD-5294; No. of Pages 17
i n g
ARTICLE16 e c o l o g i c a l m o d e l l
Diaz, S., Cabido, M., 1997. Plant functional types and ecosystemfunctions in relation to global change. J. Veg. Sci. 8, 463–474.
Donaghy, D.J., Fulkerson, W.J., 1999. Priority for allocation ofwater-soluble carbohydrate reserves during regrowth ofLolium perenne. Grass Forage Sci. 53, 211–218.
Duru, M., 1987. Climat et croissance de l’herbe pour la récolte enfourrage sec dans les Pyrénées Centrales. In SéminaireAgrométéorologie des régions de moyenne montagne.Colloques INRA 39, 317–333.
Duru, M., 2003. Effect of nitrogen fertiliser rates and defoliationregimes on the vertical structure and composition (crudeprotein content and digestibility) of a grass sward. J. Sci. FoodAgric. 83, 1469–1479.
Duru, M., Calvière, I., 1996. Effet des niveaux de nutrition enphosphore et en azote et de la composition botanique decommunautés prairiales sur l’accumulation de biomasse auprintemps. Agronomie 16, 217–229.
Duru, M., Ducrocq, H., 1997. A nitrogen and phosphorus herbagenutrient index as a tool for assessing the effect of N and Psupply on the dry matter yield of permanent pastures. Nutr.Cycl. Agroecosyst. 47, 59–69.
Duru, M., Balent, G., Langlet, A., 1994. Mineral nutrition statusand botanical composition of pastures. I. Effect on herbageaccumulation. Eur. J. Agron. 3, 43–51.
Duru, M., Cruz, P., Magda, D., 2004. Using traits to compare swardstructure and composition of grass species acrossenvironmental gradients. Appl. Veg. Sci. 7, 11–18.
Duru, M., Tallowin, J., Cruz, P., 2005. Functional diversity inlow-input grassland farming systems, characterisation, effectand management. In: Lillak, R., Viiralt, R., Linke, A.,Geherman, V. (Eds.), Integrating Efficient Grassland Farmingand Biodiversity, Grassland Science in Europe, vol. 10. Tartu,Estonia, August 29–31, pp. 199–210.
Duru, M., Justes, E., Langlet, A., Tirilly, V., 1993. Comparaison desdynamiques d’apparition et de mortalité des organes defétuque élevée, dactyle et luzerne (feuilles, talles et tiges).Agronomie 13, 237–252.
Duru, M., Delprat, V., Fabre, C., Feuillerac, E., 2000. Effect ofnitrogen fertiliser supply and winter cutting on morphologicalcomposition and herbage digestibility of a Dactylis glomerata L.sward in spring. J. Sci. Food Agric. 80, 33–42.
Duru, M., Ducrocq, H., Fabre, C., Feuillerac, E., 2002. Modelling netherbage accumulation of an orchardgrass sward. Agron. J. 94,1244–1256.
Duru, M., Bergez, J.E., Delaby, L., Justes, E., Theau, J.P., Viegas, J.,2007. A spreadsheet model for developing field indicators andgrazing management tools to meet environmental andproduction targets for dairy farms. J. Environ. Manage. 82,207–220.
Frame, J., 1989. Herbage productivity of a range of grass speciesunder a silage cutting regime with high fertilizer nitrogenapplication. Grass Forage Sci. 44, 267–276.
Garnier, E., 1992. Growth analysis of congeneric annual andperennial grass species. J. Ecol. 80, 665–675.
Garnier, E., Cortez, J., Billès, G., Navas, M.L., Roumet, C.,Debussche, M., Laurent, G., Blanchard, A., Aubry, D., Bellmann,A., Neill, C., Toussaint, J.P., 2004. Plant functional markerscapture ecosystem properties during secondary succession.Ecology 85, 2630–2637.
Gauch, H.G., Hwang, G.J.T., Fick, G.W., 2003. Model evaluation bycomparison of model-based predictions and measured values.Agron. J. 95, 1442–1446.
Girard, N., Bellon, S., Hubert, B., Lardon, S., Moulin, C.H., Osty, P.L.,2001. Categorising combinations of farmer’s land usepractices: an approach based on examples of sheep farms in
Please cite this article in press as: Duru, M., et al., Modelling above-groundModel. (2008), doi:10.1016/j.ecolmodel.2008.09.015
the south of France. Agronomie 21, 435–459.Gross, N., Suding, K.N., Lavorel, S., 2007. Leaf dry matter content
and lateral spread predict response to land use change for sixsubalpine grassland species. J. Veg. Sci. 18, 289–300.
PRESSx x x ( 2 0 0 8 ) xxx–xxx
Hacker, J.B., Minson, D.J., 1981. The digestibility of plant parts.Herbage Abstr. 51, 459–482.
Huston, M.A., 1994. Biological Diversity. The Coexistence ofSpecies on Changing Landscapes. Cambridge University Press.
Janssens, F., Peeters, A., Tallowin, J.R.B., Bakker, J.P., Bekker, R.M.,Fillat, F., Oomes, M.J.M., 1998. Relationship between soilchemical factors, and grassland diversity. Plant Soil 202,69–78.
Jarvis, S.C., 1998. Nitrogen management and sustainability. In:Cherney, J.H., Cherney, D.J.D. (Eds.), Grass for Dairy Cattle.CABI Publishing, Wallingford, Oxon, UK, pp. 161–192.
Jouven, M., Carrère, P., Baumont, R., 2006. Model predictingdynamics of biomass, structure and digestibility of herbage inmanaged permanent pastures. 1. Model description. GrassForage Sci. 61, 112–124.
Lavorel, S., Garnier, E., 2002. Predicting changes in communitycomposition and ecosystem functioning from plant traits,revisiting the Holy Grail. Funct. Ecol. 16, 545–556.
Lemaire, G., Gastal, F., 1997. N Uptake and distribution in plantcanopies. In: Lemaire, G. (Ed.), Diagnosis of the NitrogenStatus in the Crops. Springer Verlag, pp. 3–44.
Lemaire, G., Durand, J.L., Lila, M., 1989. Effet de la sécheresse surla digestibilité in vitro, la teneur en ADF et la teneur en azotede la luzerne. Agronomie 9, 841–848.
McCall, D.G., Bishop-Hurley, G.J., 2003. A pasture growth modelfor use in a whole-farm dairy production model. Agric. Syst.76, 1183–1205.
Merot, A., Wery, J., Isberie, C., Charron, F., 2008. Response of aplurispecific permanent grassland to border irrigationregulated by tensiometers. Eur. J. Agron. 29, 163–174.
Pakeman, R.J., 2004. Consistency of plant species and traitresponses to grazing along a productivity gradient, amulti-site analysis. J. Ecol. 92, 893–905.
Parsons, A.J., 1988. The effect of season and management on thegrass growth of grass sward. In: Jones, M.B., Lazenby, A. (Eds.),The Grass Crop. Chapman et Hall, pp. 129–178.
Peacock, J.M., 1976. Temperature and leaf growth in four grassspecies. J. Appl. Ecol. 13, 225–232.
Pontes, L.S., Carrere, P., Andueza, D., Louault, F., Soussana, J.F.,2007a. Seasonal productivity and nutritive value of temperategrasses found in semi-natural pastures in Europe, responsesto cutting frequency and N supply. Grass Forage Sci. 62,485–496.
Pontes, L.S., Soussana, J.F., Louault, F., Andueza, D., Carrere, P.,2007b. Leaf traits affect the above-ground productivity andquality of pasture grasses. Funct. Ecol. 21, 844–853.
Robson, M.J., Ryle, G.J.A., Woledge, J., 1988. The grass plant—itsform and function. In: Jones, M.B., Lazenby, A. (Eds.), TheGrass Crops. Chapmann et Hall, pp. 25–84.
Ryser, P., Lambers, H., 1995. Root and leaf attributes accountingfor the performance of fast- and slow-growing grasses atdifferent nutrient supply. Plant Soil 170, 251–265.
Salte, A., Chan, K., Scott, E.M., 2001. Sensitivity Analysis. Wiley,New York, p. 11.
Schapendonk, A.H.C.M., Stol, W., Kraalingen van, D.W.G.,Bouman, B.A.M., 1998. LINGRA, a sink/source model tosimulate grassland productivity in Europe. Eur. J. Agron. 9,87–100.
Sheath, G.W., Clark, D.A., 1996. Management of grazing systems,temperate pastures. In: Hodgson, J., Illius, A.W. (Eds.), TheEcology and Management of Grazing Systems. CABInternational, pp. 301–324.
Schippers, P., Snoeijing, I., Kropff, M.J., 1999. Competition underhigh and low nutrient levels among three grassland speciesoccupying different positions in a successional sequence.
herbage mass for a wide range of grassland community types. Ecol.
New Phytol. 143, 547–559.Sosebee, R.E., Weibe, W., 1973. Effect of phenological
development on radio phosphorus translocations from leavesin created wheat grass. Oecologia 13, 103–112.

INECOMOD-5294; No. of Pages 17
g x
T
V
V
V
V
ARTICLEe c o l o g i c a l m o d e l l i n
horton, B., Millard, P., Duff, E.I., 1994. Effects of nitrogen supplyon the source of nitrogen used for regrowth of laminae afterdefoliation of 4 grass species. New Phytol. 128, 615–620.
an Der Werf, A., Visser, A.J., Schieving, F., Lambers, H., 1993.Evidence for optimal partitioning of biomass and nitrogen at arange of nitrogen availabilities for a fast-growing andslow-growing species. Funct. Ecol. 7, 63–74.
an Ittersum, M.K., Rabbinge, R., 1997. Concepts in productionecology for analysis and quantification of agriculturalinput-output combinations. Field Crops Res. 52, 197–208.
arlet-Grancher, C., Gosse, G., Chartier, M., Sinoquet, H.,Bonhomme, R., Allirand, J., 1989. Mise au point, rayonnementsolaire absorbé ou intercepté par un couvert végétal.
Please cite this article in press as: Duru, M., et al., Modelling above-groundModel. (2008), doi:10.1016/j.ecolmodel.2008.09.015
Agronomie 9, 419–439.iegas, J., Duru, M., Cruz, P., Theau, J.P., Ansquer, P., Ducourtieux,
C., 2005. A herbage growth model for different types ofpermanent grassland. In: O’Mara, F.P., Wilkins, R.J.,’tMannetge, L., Lovett, D.K., Rogers, P.A.M., Boland, T.M. (Eds.),
PRESSx x ( 2 0 0 8 ) xxx–xxx 17
Proceedings of the XX International Grassland Congress.Wageningen Academic Publishers, Dublin, Ireland, p. 865.
Wilkins, R.J., 1995. In: Journet, M., Grenet, E., Farce, M.H., Thériez,M., Demarquilly, C. (Eds.), Recent Developments in theNutrition of Herbivores. INRA, pp. 363–380.
White, T.A., Barker, D.J., Moore, K.J., 2004. Vegetation diversity,growth, quality and decomposition in managed grasslands.Agric. Ecosyst. Environ. 101, 73–84.
Woledge, J., 1978. The effect of shading during vegetative andreproductive growth on the photosynthetic capacity of leavesin a grass sward. Ann. Bot. 42, 1085–1089.
Woledge, J., 1979. Effect of flowering on the photosyntheticcapacity of rye-grass leaves grown with and without natural
herbage mass for a wide range of grassland community types. Ecol.
shading. Ann. Bot. 44, 197–207.Woodward, S.R.J., Romera, A.J., Beskow, W.B., Lovatt, S.J., 2008.
Better simulation modeling to support farming systemsinnovation: review and synthesis. N. Z. J. Agric. Res. 51,235–252.