Modeling the acceptance of clinical information systems among hospital medical staff: An extended...
12
Modeling the acceptance of clinical information systems among hospital medical staff: An extended TAM model Christos D. Melas a,⇑ , Leonidas A. Zampetakis b , Anastasia Dimopoulou c , Vassilis Moustakis d a Technological Educational Institute of Crete, School of Technological Applications, Department of Sciences, Division of Computer Science, Heraklion, Crete, Greece b Technical University of Crete, Department of Production Engineering and Management, Management Systems Laboratory, Chania, Greece c Ippokratio, Department of Surgery, General Hospital of Athens, Greece d Technical University of Crete, Department of Production Engineering and Management, Management Systems Laboratory, Chania, Greece and Foundation for Research and Technology – Hellas (FORTH), Institute of Computer Science, Bioinformatics Laboratory, Heraklion, Greece article info Article history: Received 1 May 2010 Available online xxxx Keywords: Greece Hospital Computer use Technology Acceptance Model Structural equation modeling abstract Recent empirical research has utilized the Technology Acceptance Model (TAM) to advance the under- standing of doctors’ and nurses’ technology acceptance in the workplace. However, the majority of the reported studies are either qualitative in nature or use small convenience samples of medical staff. Addi- tionally, in very few studies moderators are either used or assessed despite their importance in TAM based research. The present study focuses on the application of TAM in order to explain the intention to use clinical information systems, in a random sample of 604 medical staff (534 physicians) working in 14 hospitals in Greece. We introduce physicians’ specialty as a moderator in TAM and test medical staff’s information and communication technology (ICT) knowledge and ICT feature demands, as external variables. The results show that TAM predicts a substantial proportion of the intention to use clinical information systems. Findings make a contribution to the literature by replicating, explaining and advancing the TAM, whereas theory is benefited by the addition of external variables and medical spe- cialty as a moderator. Recommendations for further research are discussed. Ó 2011 Elsevier Inc. All rights reserved. 1. Introduction During the last 20 years, several theoretical models have been proposed to assess and explain end – users’ acceptance behavior towards information and communication technology (ICT for short). The Technology Acceptance Model (TAM) [1] which is ap- plied and empirically tested over a wide spectrum of applications of ICT, is one of the most well recognized theoretical modes among them [2,3]. Recent studies provide evidence that TAM is a good predictor of behavioral intent to accept technology in the health sector [4–6]. In TAM, technology acceptance and use is determined by behav- ioral intention (BI). BI in turn, is affected by attitude towards use (ATT), as well as the direct and indirect effects of perceived ease of use (PEoU) and perceived usefulness (PU). Both PEoU and PU jointly affect ATT, whilst PEoU has a direct impact on PU [4,6,7] (see also Fig. 1 for a graphical sketch of direct and indirect relation- ships of the TAM). The TAM model is an analytical simplification of how functionality and interface characteristics relate to adoption decisions; understanding why clinicians hold certain beliefs about CIS is valuable because beliefs influence subsequent behavior and they are amenable to manipulations through appropriate interven- tions [8]. Although TAM is considered as a well-recognized model in the field of information systems, little systematic research has been conducted in the health care context indicating a significant gap in knowledge. Therefore, there is a strong current need to develop and gain empirical support for the TAM within health organiza- tions; more replication studies are needed so that confidence is gained in whether TAM is a good fitting theory in health care. This may be achieved by using larger size samples, by investigating and exploring new theoretically motivated variables and relationships, by testing external variables, as well as by applying TAM on differ- ent profession-specific groups of personnel (e.g. different physician specialties) etc. Yarbrough and Smith [4] and Holden and Karsh [6], in their meta-analytic reviews concerning the application of TAM in health care, reported significant heterogeneity among the studies in terms of sample characteristics and technologies studied. Furthermore, several inconsistencies were found concerning the relationships among TAM variables. Specifically, both reviews have demon- strated that the majority of existing TAM studies in health care: (1) have used small convenience samples of medical staff, (2) have 1532-0464/$ - see front matter Ó 2011 Elsevier Inc. All rights reserved. doi:10.1016/j.jbi.2011.01.009 ⇑ Corresponding author. Fax: +30 2810251357. E-mail addresses: [email protected] (C.D. Melas), [email protected] (L.A. Zampetakis), [email protected] (A. Dimopoulou), moustaki@dpem. tuc.gr (V. Moustakis). Journal of Biomedical Informatics xxx (2011) xxx–xxx Contents lists available at ScienceDirect Journal of Biomedical Informatics journal homepage: www.elsevier.com/locate/yjbin Please cite this article in press as: Melas CD et al. Modeling the acceptance of clinical information systems among hospital medical staff: An extended TAM model. J Biomed Inform (2011), doi:10.1016/j.jbi.2011.01.009
-
Upload
independent -
Category
Documents
-
view
1 -
download
0
Transcript of Modeling the acceptance of clinical information systems among hospital medical staff: An extended...
Journal of Biomedical Informatics xxx (2011) xxx–xxx
Contents lists available at ScienceDirect
Journal of Biomedical Informatics
journal homepage: www.elsevier .com/locate /y jb in
Modeling the acceptance of clinical information systems among hospitalmedical staff: An extended TAM model
Christos D. Melas a,⇑, Leonidas A. Zampetakis b, Anastasia Dimopoulou c, Vassilis Moustakis d
a Technological Educational Institute of Crete, School of Technological Applications, Department of Sciences, Division of Computer Science, Heraklion, Crete, Greeceb Technical University of Crete, Department of Production Engineering and Management, Management Systems Laboratory, Chania, Greecec Ippokratio, Department of Surgery, General Hospital of Athens, Greeced Technical University of Crete, Department of Production Engineering and Management, Management Systems Laboratory, Chania,Greece and Foundation for Research and Technology – Hellas (FORTH), Institute of Computer Science, Bioinformatics Laboratory, Heraklion, Greece
a r t i c l e i n f o a b s t r a c t
Article history:Received 1 May 2010Available online xxxx
Keywords:GreeceHospitalComputer useTechnology Acceptance ModelStructural equation modeling
1532-0464/$ - see front matter � 2011 Elsevier Inc. Adoi:10.1016/j.jbi.2011.01.009
⇑ Corresponding author. Fax: +30 2810251357.E-mail addresses: [email protected] (C.D. M
(L.A. Zampetakis), [email protected] (A. Dimtuc.gr (V. Moustakis).
Please cite this article in press as: Melas CD et almodel. J Biomed Inform (2011), doi:10.1016/j.jb
Recent empirical research has utilized the Technology Acceptance Model (TAM) to advance the under-standing of doctors’ and nurses’ technology acceptance in the workplace. However, the majority of thereported studies are either qualitative in nature or use small convenience samples of medical staff. Addi-tionally, in very few studies moderators are either used or assessed despite their importance in TAMbased research. The present study focuses on the application of TAM in order to explain the intentionto use clinical information systems, in a random sample of 604 medical staff (534 physicians) workingin 14 hospitals in Greece. We introduce physicians’ specialty as a moderator in TAM and test medicalstaff’s information and communication technology (ICT) knowledge and ICT feature demands, as externalvariables. The results show that TAM predicts a substantial proportion of the intention to use clinicalinformation systems. Findings make a contribution to the literature by replicating, explaining andadvancing the TAM, whereas theory is benefited by the addition of external variables and medical spe-cialty as a moderator. Recommendations for further research are discussed.
� 2011 Elsevier Inc. All rights reserved.
1. Introduction
During the last 20 years, several theoretical models have beenproposed to assess and explain end – users’ acceptance behaviortowards information and communication technology (ICT forshort). The Technology Acceptance Model (TAM) [1] which is ap-plied and empirically tested over a wide spectrum of applicationsof ICT, is one of the most well recognized theoretical modes amongthem [2,3]. Recent studies provide evidence that TAM is a goodpredictor of behavioral intent to accept technology in the healthsector [4–6].
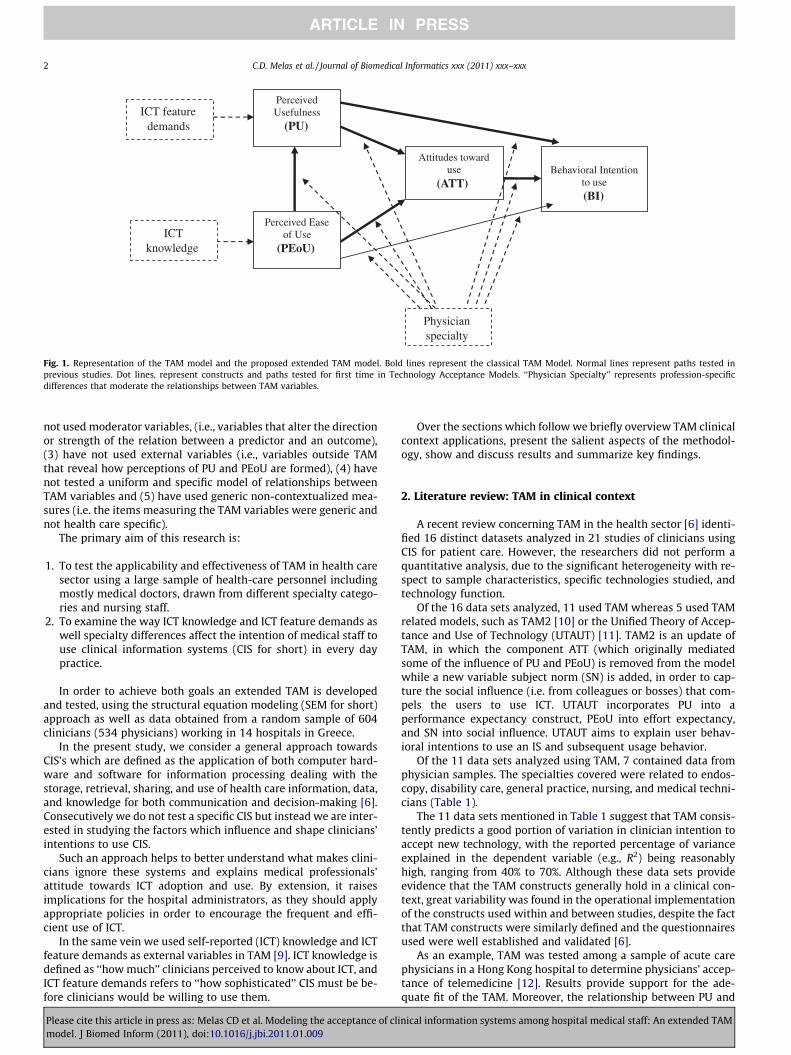
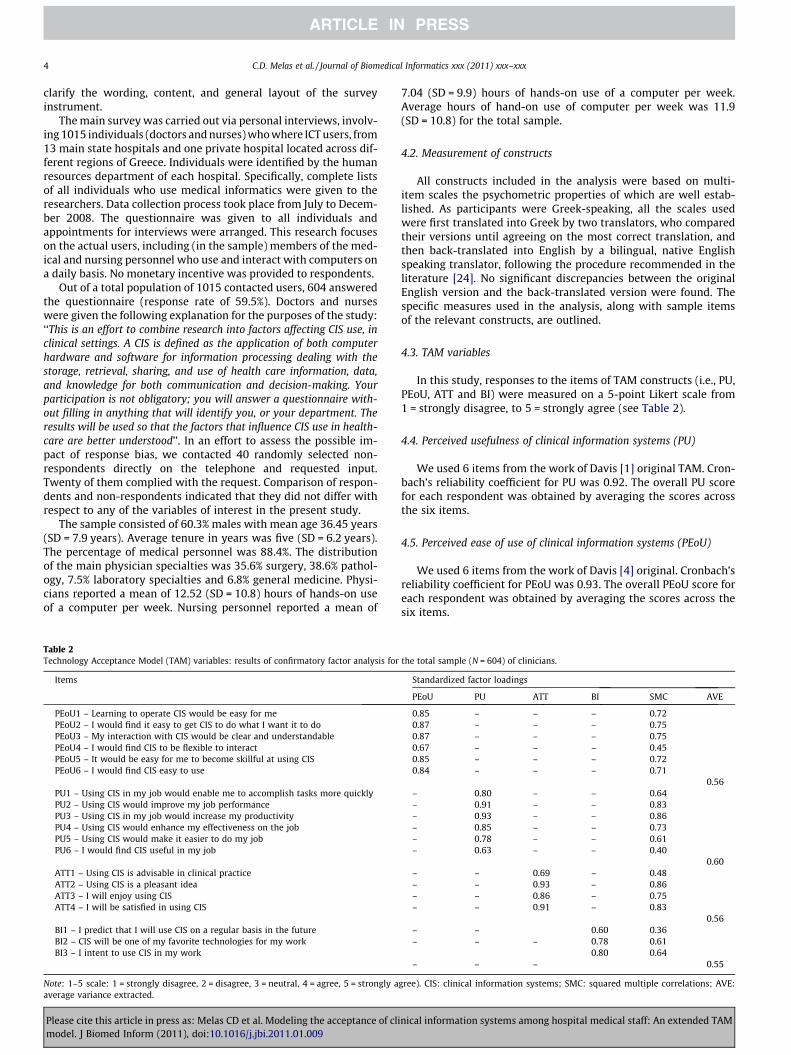
In TAM, technology acceptance and use is determined by behav-ioral intention (BI). BI in turn, is affected by attitude towards use(ATT), as well as the direct and indirect effects of perceived easeof use (PEoU) and perceived usefulness (PU). Both PEoU and PUjointly affect ATT, whilst PEoU has a direct impact on PU [4,6,7](see also Fig. 1 for a graphical sketch of direct and indirect relation-ships of the TAM). The TAM model is an analytical simplification ofhow functionality and interface characteristics relate to adoption
ll rights reserved.
elas), [email protected]), moustaki@dpem.
. Modeling the acceptance of clii.2011.01.009
decisions; understanding why clinicians hold certain beliefs aboutCIS is valuable because beliefs influence subsequent behavior andthey are amenable to manipulations through appropriate interven-tions [8].
Although TAM is considered as a well-recognized model in thefield of information systems, little systematic research has beenconducted in the health care context indicating a significant gapin knowledge. Therefore, there is a strong current need to developand gain empirical support for the TAM within health organiza-tions; more replication studies are needed so that confidence isgained in whether TAM is a good fitting theory in health care. Thismay be achieved by using larger size samples, by investigating andexploring new theoretically motivated variables and relationships,by testing external variables, as well as by applying TAM on differ-ent profession-specific groups of personnel (e.g. different physicianspecialties) etc.
Yarbrough and Smith [4] and Holden and Karsh [6], in theirmeta-analytic reviews concerning the application of TAM in healthcare, reported significant heterogeneity among the studies in termsof sample characteristics and technologies studied. Furthermore,several inconsistencies were found concerning the relationshipsamong TAM variables. Specifically, both reviews have demon-strated that the majority of existing TAM studies in health care:(1) have used small convenience samples of medical staff, (2) have
nical information systems among hospital medical staff: An extended TAM
Perceived Usefulness
(PU)
Attitudes toward use
(ATT) Behavioral Intention
to use (BI)
ICT feature demands
Physician specialty
Perceived Ease of Use
(PEoU) ICT
knowledge
Fig. 1. Representation of the TAM model and the proposed extended TAM model. Bold lines represent the classical TAM Model. Normal lines represent paths tested inprevious studies. Dot lines, represent constructs and paths tested for first time in Technology Acceptance Models. ‘‘Physician Specialty’’ represents profession-specificdifferences that moderate the relationships between TAM variables.
2 C.D. Melas et al. / Journal of Biomedical Informatics xxx (2011) xxx–xxx
not used moderator variables, (i.e., variables that alter the directionor strength of the relation between a predictor and an outcome),(3) have not used external variables (i.e., variables outside TAMthat reveal how perceptions of PU and PEoU are formed), (4) havenot tested a uniform and specific model of relationships betweenTAM variables and (5) have used generic non-contextualized mea-sures (i.e. the items measuring the TAM variables were generic andnot health care specific).
The primary aim of this research is:
1. To test the applicability and effectiveness of TAM in health caresector using a large sample of health-care personnel includingmostly medical doctors, drawn from different specialty catego-ries and nursing staff.
2. To examine the way ICT knowledge and ICT feature demands aswell specialty differences affect the intention of medical staff touse clinical information systems (CIS for short) in every daypractice.
In order to achieve both goals an extended TAM is developedand tested, using the structural equation modeling (SEM for short)approach as well as data obtained from a random sample of 604clinicians (534 physicians) working in 14 hospitals in Greece.
In the present study, we consider a general approach towardsCIS’s which are defined as the application of both computer hard-ware and software for information processing dealing with thestorage, retrieval, sharing, and use of health care information, data,and knowledge for both communication and decision-making [6].Consecutively we do not test a specific CIS but instead we are inter-ested in studying the factors which influence and shape clinicians’intentions to use CIS.
Such an approach helps to better understand what makes clini-cians ignore these systems and explains medical professionals’attitude towards ICT adoption and use. By extension, it raisesimplications for the hospital administrators, as they should applyappropriate policies in order to encourage the frequent and effi-cient use of ICT.
In the same vein we used self-reported (ICT) knowledge and ICTfeature demands as external variables in TAM [9]. ICT knowledge isdefined as ‘‘how much’’ clinicians perceived to know about ICT, andICT feature demands refers to ‘‘how sophisticated’’ CIS must be be-fore clinicians would be willing to use them.
Please cite this article in press as: Melas CD et al. Modeling the acceptance of climodel. J Biomed Inform (2011), doi:10.1016/j.jbi.2011.01.009
Over the sections which follow we briefly overview TAM clinicalcontext applications, present the salient aspects of the methodol-ogy, show and discuss results and summarize key findings.
2. Literature review: TAM in clinical context
A recent review concerning TAM in the health sector [6] identi-fied 16 distinct datasets analyzed in 21 studies of clinicians usingCIS for patient care. However, the researchers did not perform aquantitative analysis, due to the significant heterogeneity with re-spect to sample characteristics, specific technologies studied, andtechnology function.
Of the 16 data sets analyzed, 11 used TAM whereas 5 used TAMrelated models, such as TAM2 [10] or the Unified Theory of Accep-tance and Use of Technology (UTAUT) [11]. TAM2 is an update ofTAM, in which the component ATT (which originally mediatedsome of the influence of PU and PEoU) is removed from the modelwhile a new variable subject norm (SN) is added, in order to cap-ture the social influence (i.e. from colleagues or bosses) that com-pels the users to use ICT. UTAUT incorporates PU into aperformance expectancy construct, PEoU into effort expectancy,and SN into social influence. UTAUT aims to explain user behav-ioral intentions to use an IS and subsequent usage behavior.
Of the 11 data sets analyzed using TAM, 7 contained data fromphysician samples. The specialties covered were related to endos-copy, disability care, general practice, nursing, and medical techni-cians (Table 1).
The 11 data sets mentioned in Table 1 suggest that TAM consis-tently predicts a good portion of variation in clinician intention toaccept new technology, with the reported percentage of varianceexplained in the dependent variable (e.g., R2) being reasonablyhigh, ranging from 40% to 70%. Although these data sets provideevidence that the TAM constructs generally hold in a clinical con-text, great variability was found in the operational implementationof the constructs used within and between studies, despite the factthat TAM constructs were similarly defined and the questionnairesused were well established and validated [6].
As an example, TAM was tested among a sample of acute carephysicians in a Hong Kong hospital to determine physicians’ accep-tance of telemedicine [12]. Results provide support for the ade-quate fit of the TAM. Moreover, the relationship between PU and
nical information systems among hospital medical staff: An extended TAM
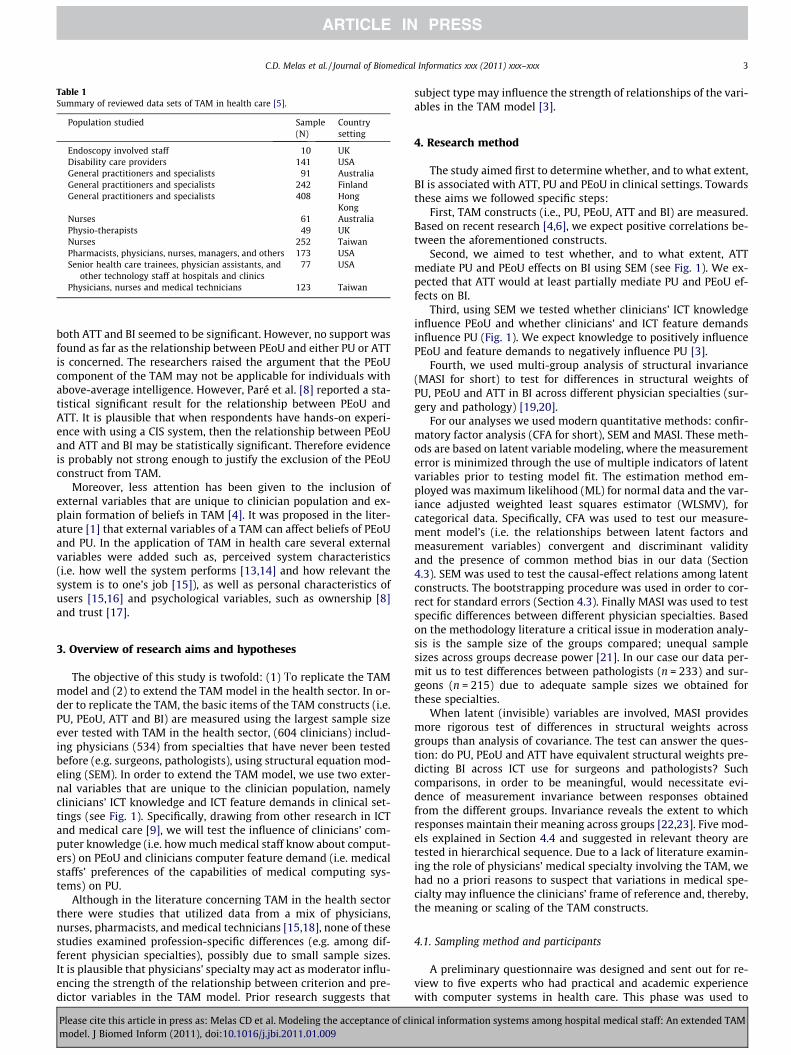
Table 1Summary of reviewed data sets of TAM in health care [5].
Population studied Sample(N)
Countrysetting
Endoscopy involved staff 10 UKDisability care providers 141 USAGeneral practitioners and specialists 91 AustraliaGeneral practitioners and specialists 242 FinlandGeneral practitioners and specialists 408 Hong
KongNurses 61 AustraliaPhysio-therapists 49 UKNurses 252 TaiwanPharmacists, physicians, nurses, managers, and others 173 USASenior health care trainees, physician assistants, and
other technology staff at hospitals and clinics77 USA
Physicians, nurses and medical technicians 123 Taiwan
C.D. Melas et al. / Journal of Biomedical Informatics xxx (2011) xxx–xxx 3
both ATT and BI seemed to be significant. However, no support wasfound as far as the relationship between PEoU and either PU or ATTis concerned. The researchers raised the argument that the PEoUcomponent of the TAM may not be applicable for individuals withabove-average intelligence. However, Paré et al. [8] reported a sta-tistical significant result for the relationship between PEoU andATT. It is plausible that when respondents have hands-on experi-ence with using a CIS system, then the relationship between PEoUand ATT and BI may be statistically significant. Therefore evidenceis probably not strong enough to justify the exclusion of the PEoUconstruct from TAM.
Moreover, less attention has been given to the inclusion ofexternal variables that are unique to clinician population and ex-plain formation of beliefs in TAM [4]. It was proposed in the liter-ature [1] that external variables of a TAM can affect beliefs of PEoUand PU. In the application of TAM in health care several externalvariables were added such as, perceived system characteristics(i.e. how well the system performs [13,14] and how relevant thesystem is to one’s job [15]), as well as personal characteristics ofusers [15,16] and psychological variables, such as ownership [8]and trust [17].
3. Overview of research aims and hypotheses
The objective of this study is twofold: (1) No replicate the TAMmodel and (2) to extend the TAM model in the health sector. In or-der to replicate the TAM, the basic items of the TAM constructs (i.e.PU, PEoU, ATT and BI) are measured using the largest sample sizeever tested with TAM in the health sector, (604 clinicians) includ-ing physicians (534) from specialties that have never been testedbefore (e.g. surgeons, pathologists), using structural equation mod-eling (SEM). In order to extend the TAM model, we use two exter-nal variables that are unique to the clinician population, namelyclinicians’ ICT knowledge and ICT feature demands in clinical set-tings (see Fig. 1). Specifically, drawing from other research in ICTand medical care [9], we will test the influence of clinicians’ com-puter knowledge (i.e. how much medical staff know about comput-ers) on PEoU and clinicians computer feature demand (i.e. medicalstaffs’ preferences of the capabilities of medical computing sys-tems) on PU.
Although in the literature concerning TAM in the health sectorthere were studies that utilized data from a mix of physicians,nurses, pharmacists, and medical technicians [15,18], none of thesestudies examined profession-specific differences (e.g. among dif-ferent physician specialties), possibly due to small sample sizes.It is plausible that physicians’ specialty may act as moderator influ-encing the strength of the relationship between criterion and pre-dictor variables in the TAM model. Prior research suggests that
Please cite this article in press as: Melas CD et al. Modeling the acceptance of climodel. J Biomed Inform (2011), doi:10.1016/j.jbi.2011.01.009
subject type may influence the strength of relationships of the vari-ables in the TAM model [3].
4. Research method
The study aimed first to determine whether, and to what extent,BI is associated with ATT, PU and PEoU in clinical settings. Towardsthese aims we followed specific steps:
First, TAM constructs (i.e., PU, PEoU, ATT and BI) are measured.Based on recent research [4,6], we expect positive correlations be-tween the aforementioned constructs.
Second, we aimed to test whether, and to what extent, ATTmediate PU and PEoU effects on BI using SEM (see Fig. 1). We ex-pected that ATT would at least partially mediate PU and PEoU ef-fects on BI.
Third, using SEM we tested whether clinicians’ ICT knowledgeinfluence PEoU and whether clinicians’ and ICT feature demandsinfluence PU (Fig. 1). We expect knowledge to positively influencePEoU and feature demands to negatively influence PU [3].
Fourth, we used multi-group analysis of structural invariance(MASI for short) to test for differences in structural weights ofPU, PEoU and ATT in BI across different physician specialties (sur-gery and pathology) [19,20].
For our analyses we used modern quantitative methods: confir-matory factor analysis (CFA for short), SEM and MASI. These meth-ods are based on latent variable modeling, where the measurementerror is minimized through the use of multiple indicators of latentvariables prior to testing model fit. The estimation method em-ployed was maximum likelihood (ML) for normal data and the var-iance adjusted weighted least squares estimator (WLSMV), forcategorical data. Specifically, CFA was used to test our measure-ment model’s (i.e. the relationships between latent factors andmeasurement variables) convergent and discriminant validityand the presence of common method bias in our data (Section4.3). SEM was used to test the causal-effect relations among latentconstructs. The bootstrapping procedure was used in order to cor-rect for standard errors (Section 4.3). Finally MASI was used to testspecific differences between different physician specialties. Basedon the methodology literature a critical issue in moderation analy-sis is the sample size of the groups compared; unequal samplesizes across groups decrease power [21]. In our case our data per-mit us to test differences between pathologists (n = 233) and sur-geons (n = 215) due to adequate sample sizes we obtained forthese specialties.
When latent (invisible) variables are involved, MASI providesmore rigorous test of differences in structural weights acrossgroups than analysis of covariance. The test can answer the ques-tion: do PU, PEoU and ATT have equivalent structural weights pre-dicting BI across ICT use for surgeons and pathologists? Suchcomparisons, in order to be meaningful, would necessitate evi-dence of measurement invariance between responses obtainedfrom the different groups. Invariance reveals the extent to whichresponses maintain their meaning across groups [22,23]. Five mod-els explained in Section 4.4 and suggested in relevant theory aretested in hierarchical sequence. Due to a lack of literature examin-ing the role of physicians’ medical specialty involving the TAM, wehad no a priori reasons to suspect that variations in medical spe-cialty may influence the clinicians’ frame of reference and, thereby,the meaning or scaling of the TAM constructs.
4.1. Sampling method and participants
A preliminary questionnaire was designed and sent out for re-view to five experts who had practical and academic experiencewith computer systems in health care. This phase was used to
nical information systems among hospital medical staff: An extended TAM
4 C.D. Melas et al. / Journal of Biomedical Informatics xxx (2011) xxx–xxx
clarify the wording, content, and general layout of the surveyinstrument.
The main survey was carried out via personal interviews, involv-ing 1015 individuals (doctors and nurses) who where ICT users, from13 main state hospitals and one private hospital located across dif-ferent regions of Greece. Individuals were identified by the humanresources department of each hospital. Specifically, complete listsof all individuals who use medical informatics were given to theresearchers. Data collection process took place from July to Decem-ber 2008. The questionnaire was given to all individuals andappointments for interviews were arranged. This research focuseson the actual users, including (in the sample) members of the med-ical and nursing personnel who use and interact with computers ona daily basis. No monetary incentive was provided to respondents.
Out of a total population of 1015 contacted users, 604 answeredthe questionnaire (response rate of 59.5%). Doctors and nurseswere given the following explanation for the purposes of the study:‘‘This is an effort to combine research into factors affecting CIS use, inclinical settings. A CIS is defined as the application of both computerhardware and software for information processing dealing with thestorage, retrieval, sharing, and use of health care information, data,and knowledge for both communication and decision-making. Yourparticipation is not obligatory; you will answer a questionnaire with-out filling in anything that will identify you, or your department. Theresults will be used so that the factors that influence CIS use in health-care are better understood’’. In an effort to assess the possible im-pact of response bias, we contacted 40 randomly selected non-respondents directly on the telephone and requested input.Twenty of them complied with the request. Comparison of respon-dents and non-respondents indicated that they did not differ withrespect to any of the variables of interest in the present study.
The sample consisted of 60.3% males with mean age 36.45 years(SD = 7.9 years). Average tenure in years was five (SD = 6.2 years).The percentage of medical personnel was 88.4%. The distributionof the main physician specialties was 35.6% surgery, 38.6% pathol-ogy, 7.5% laboratory specialties and 6.8% general medicine. Physi-cians reported a mean of 12.52 (SD = 10.8) hours of hands-on useof a computer per week. Nursing personnel reported a mean of
Table 2Technology Acceptance Model (TAM) variables: results of confirmatory factor analysis for
Items
PEoU1 – Learning to operate CIS would be easy for mePEoU2 – I would find it easy to get CIS to do what I want it to doPEoU3 – My interaction with CIS would be clear and understandablePEoU4 – I would find CIS to be flexible to interactPEoU5 – It would be easy for me to become skillful at using CISPEoU6 – I would find CIS easy to use
PU1 – Using CIS in my job would enable me to accomplish tasks more quicklyPU2 – Using CIS would improve my job performancePU3 – Using CIS in my job would increase my productivityPU4 – Using CIS would enhance my effectiveness on the jobPU5 – Using CIS would make it easier to do my jobPU6 – I would find CIS useful in my job
ATT1 – Using CIS is advisable in clinical practiceATT2 – Using CIS is a pleasant ideaATT3 – I will enjoy using CISATT4 – I will be satisfied in using CIS
BI1 – I predict that I will use CIS on a regular basis in the futureBI2 – CIS will be one of my favorite technologies for my workBI3 – I intent to use CIS in my work
Note: 1–5 scale: 1 = strongly disagree, 2 = disagree, 3 = neutral, 4 = agree, 5 = strongly aaverage variance extracted.
Please cite this article in press as: Melas CD et al. Modeling the acceptance of climodel. J Biomed Inform (2011), doi:10.1016/j.jbi.2011.01.009
7.04 (SD = 9.9) hours of hands-on use of a computer per week.Average hours of hand-on use of computer per week was 11.9(SD = 10.8) for the total sample.
4.2. Measurement of constructs
All constructs included in the analysis were based on multi-item scales the psychometric properties of which are well estab-lished. As participants were Greek-speaking, all the scales usedwere first translated into Greek by two translators, who comparedtheir versions until agreeing on the most correct translation, andthen back-translated into English by a bilingual, native Englishspeaking translator, following the procedure recommended in theliterature [24]. No significant discrepancies between the originalEnglish version and the back-translated version were found. Thespecific measures used in the analysis, along with sample itemsof the relevant constructs, are outlined.
4.3. TAM variables
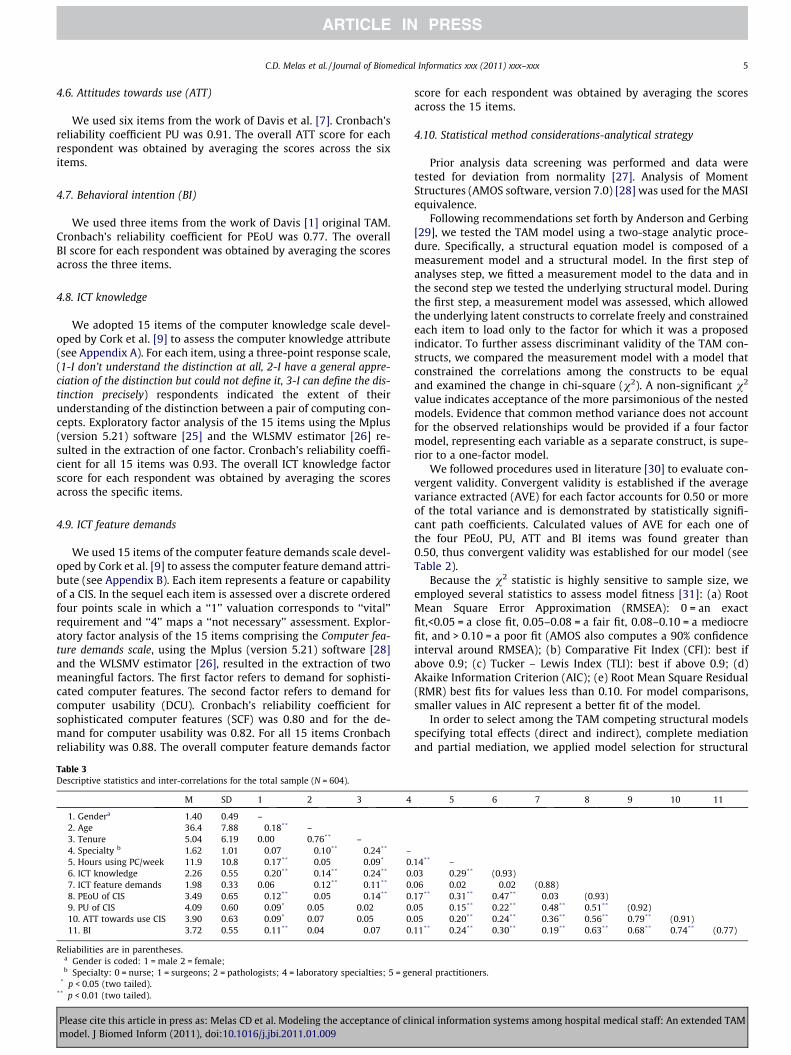
In this study, responses to the items of TAM constructs (i.e., PU,PEoU, ATT and BI) were measured on a 5-point Likert scale from1 = strongly disagree, to 5 = strongly agree (see Table 2).
4.4. Perceived usefulness of clinical information systems (PU)
We used 6 items from the work of Davis [1] original TAM. Cron-bach’s reliability coefficient for PU was 0.92. The overall PU scorefor each respondent was obtained by averaging the scores acrossthe six items.
4.5. Perceived ease of use of clinical information systems (PEoU)
We used 6 items from the work of Davis [4] original. Cronbach’sreliability coefficient for PEoU was 0.93. The overall PEoU score foreach respondent was obtained by averaging the scores across thesix items.
the total sample (N = 604) of clinicians.
Standardized factor loadings
PEoU PU ATT BI SMC AVE
0.85 – – – 0.720.87 – – – 0.750.87 – – – 0.750.67 – – – 0.450.85 – – – 0.720.84 – – – 0.71
0.56– 0.80 – – 0.64– 0.91 – – 0.83– 0.93 – – 0.86– 0.85 – – 0.73– 0.78 – – 0.61– 0.63 – – 0.40
0.60– – 0.69 – 0.48– – 0.93 – 0.86– – 0.86 – 0.75– – 0.91 – 0.83
0.56– – 0.60 0.36– – – 0.78 0.61
0.80 0.64– – – 0.55
gree). CIS: clinical information systems; SMC: squared multiple correlations; AVE:
nical information systems among hospital medical staff: An extended TAM
C.D. Melas et al. / Journal of Biomedical Informatics xxx (2011) xxx–xxx 5
4.6. Attitudes towards use (ATT)
We used six items from the work of Davis et al. [7]. Cronbach’sreliability coefficient PU was 0.91. The overall ATT score for eachrespondent was obtained by averaging the scores across the sixitems.
4.7. Behavioral intention (BI)
We used three items from the work of Davis [1] original TAM.Cronbach’s reliability coefficient for PEoU was 0.77. The overallBI score for each respondent was obtained by averaging the scoresacross the three items.
4.8. ICT knowledge
We adopted 15 items of the computer knowledge scale devel-oped by Cork et al. [9] to assess the computer knowledge attribute(see Appendix A). For each item, using a three-point response scale,(1-I don’t understand the distinction at all, 2-I have a general appre-ciation of the distinction but could not define it, 3-I can define the dis-tinction precisely) respondents indicated the extent of theirunderstanding of the distinction between a pair of computing con-cepts. Exploratory factor analysis of the 15 items using the Mplus(version 5.21) software [25] and the WLSMV estimator [26] re-sulted in the extraction of one factor. Cronbach’s reliability coeffi-cient for all 15 items was 0.93. The overall ICT knowledge factorscore for each respondent was obtained by averaging the scoresacross the specific items.
4.9. ICT feature demands
We used 15 items of the computer feature demands scale devel-oped by Cork et al. [9] to assess the computer feature demand attri-bute (see Appendix B). Each item represents a feature or capabilityof a CIS. In the sequel each item is assessed over a discrete orderedfour points scale in which a ‘‘1’’ valuation corresponds to ‘‘vital’’requirement and ‘‘4’’ maps a ‘‘not necessary’’ assessment. Explor-atory factor analysis of the 15 items comprising the Computer fea-ture demands scale, using the Mplus (version 5.21) software [28]and the WLSMV estimator [26], resulted in the extraction of twomeaningful factors. The first factor refers to demand for sophisti-cated computer features. The second factor refers to demand forcomputer usability (DCU). Cronbach’s reliability coefficient forsophisticated computer features (SCF) was 0.80 and for the de-mand for computer usability was 0.82. For all 15 items Cronbachreliability was 0.88. The overall computer feature demands factor
Table 3Descriptive statistics and inter-correlations for the total sample (N = 604).
M SD 1 2 3 4
1. Gendera 1.40 0.49 –2. Age 36.4 7.88 �0.18** –3. Tenure 5.04 6.19 0.00 0.76** –4. Specialty b 1.62 1.01 �0.07 �0.10** �0.24** –5. Hours using PC/week 11.9 10.8 �0.17** �0.05 �0.09* 06. ICT knowledge 2.26 0.55 �0.20** �0.14** �0.24** 07. ICT feature demands 1.98 0.33 0.06 �0.12** �0.11** 08. PEoU of CIS 3.49 0.65 �0.12** �0.05 �0.14** 09. PU of CIS 4.09 0.60 �0.09* 0.05 0.02 010. ATT towards use CIS 3.90 0.63 �0.09* 0.07 0.05 011. BI 3.72 0.55 �0.11** 0.04 �0.07 0
Reliabilities are in parentheses.a Gender is coded: 1 = male 2 = female;b Specialty: 0 = nurse; 1 = surgeons; 2 = pathologists; 4 = laboratory specialties; 5 = ge
* p < 0.05 (two tailed).** p < 0.01 (two tailed).
Please cite this article in press as: Melas CD et al. Modeling the acceptance of climodel. J Biomed Inform (2011), doi:10.1016/j.jbi.2011.01.009
score for each respondent was obtained by averaging the scoresacross the 15 items.
4.10. Statistical method considerations-analytical strategy
Prior analysis data screening was performed and data weretested for deviation from normality [27]. Analysis of MomentStructures (AMOS software, version 7.0) [28] was used for the MASIequivalence.
Following recommendations set forth by Anderson and Gerbing[29], we tested the TAM model using a two-stage analytic proce-dure. Specifically, a structural equation model is composed of ameasurement model and a structural model. In the first step ofanalyses step, we fitted a measurement model to the data and inthe second step we tested the underlying structural model. Duringthe first step, a measurement model was assessed, which allowedthe underlying latent constructs to correlate freely and constrainedeach item to load only to the factor for which it was a proposedindicator. To further assess discriminant validity of the TAM con-structs, we compared the measurement model with a model thatconstrained the correlations among the constructs to be equaland examined the change in chi-square (v2). A non-significant v2
value indicates acceptance of the more parsimonious of the nestedmodels. Evidence that common method variance does not accountfor the observed relationships would be provided if a four factormodel, representing each variable as a separate construct, is supe-rior to a one-factor model.
We followed procedures used in literature [30] to evaluate con-vergent validity. Convergent validity is established if the averagevariance extracted (AVE) for each factor accounts for 0.50 or moreof the total variance and is demonstrated by statistically signifi-cant path coefficients. Calculated values of AVE for each one ofthe four PEoU, PU, ATT and BI items was found greater than0.50, thus convergent validity was established for our model (seeTable 2).
Because the v2 statistic is highly sensitive to sample size, weemployed several statistics to assess model fitness [31]: (a) RootMean Square Error Approximation (RMSEA): 0 = an exactfit,<0.05 = a close fit, 0.05–0.08 = a fair fit, 0.08–0.10 = a mediocrefit, and > 0.10 = a poor fit (AMOS also computes a 90% confidenceinterval around RMSEA); (b) Comparative Fit Index (CFI): best ifabove 0.9; (c) Tucker – Lewis Index (TLI): best if above 0.9; (d)Akaike Information Criterion (AIC); (e) Root Mean Square Residual(RMR) best fits for values less than 0.10. For model comparisons,smaller values in AIC represent a better fit of the model.
In order to select among the TAM competing structural modelsspecifying total effects (direct and indirect), complete mediationand partial mediation, we applied model selection for structural
5 6 7 8 9 10 11
.14** –
.03 0.29** (0.93)
.06 0.02 �0.02 (0.88)
.17** 0.31** 0.47** �0.03 (0.93)
.05 0.15** 0.22** �0.48** 0.51** (0.92)
.05 0.20** 0.24** �0.36** 0.56** 0.79** (0.91)
.11** 0.24** 0.30** �0.19** 0.63** 0.68** 0.74** (0.77)
neral practitioners.
nical information systems among hospital medical staff: An extended TAM
6 C.D. Melas et al. / Journal of Biomedical Informatics xxx (2011) xxx–xxx
equation models [28,32]. Specifically, AMOS 7.0 permits specifica-tion searches for the best theoretical model given an initial modelusing Akaike Information Criterion (FIC). AIC, represents an infor-mation theoretic approach to model selection; smaller AIC valuesindicate better fit. AIC is assessed from the data for each fittedmodel and it is possible to be used for the computation of modelweights in order to quantify the uncertainty that each model isthe best model [33]. Specifically, one can search through the vastset of possible models for the best ones and compare individualnested models through the employment of heuristic specificationresearch strategies. In the present research, we employed a step-wise strategy in model selection, which included both forwardselection and backward elimination features. Furthermore, underthis framework, it is meaningful to speak of the probability of amodel. Raw AIC values can be easily transformed to the so-calledAkaike weights, which can be directly interpreted as conditionalprobabilities for each model [34].
In addition, we used bootstrapping procedures to test signifi-cance of mediation [35]. Bootstrapping is a nonparametric ap-proach to hypothesis testing whereby one estimates the standarderrors empirically using the available data. Operationally, in boot-strapping, multiple samples are drawn, with replacement, from theoriginal data set, and the model is re-estimated on each sample,which results in a number of path estimates that is equal to thenumber of samples drawn from the original data set. Followingcurrent recommendations, we re-sampled 1000 times and usedthe percentile method to create 95% confidence intervals [35].
In order to avoid problems associated with common methodvariance often found in cross sectional survey research, severalsteps described in the literature [36] were taken. First, all partici-pants were informed that their participation was completely vol-untary and confidential. Second, items referring to the sameconstruct were positioned in different locations throughout thequestionnaire and several items were reverse phrased. Third, weadopted Harman’s one-factor test (see Table 4).
4.11. Invariance analysis method
To examine whether medical specialty has an effect on themodel with the best fit to the data, we followed the sequence ofMASI [19,20]. Tests of factorial invariance across multiple groupsinvolve a hierarchical ordering of nested models. Any two modelsare nested, as long as the set of parameters estimated in the morerestrictive model is a subset of the parameters in the less restric-tive model. When a model is a subset of a larger model, the differ-ence between them can be tested by subtracting the two chi-square values and testing this value against the critical value asso-ciated with the difference in degrees of freedom. According to rel-ative theory, chi-square test is very powerful and, where thehypothesis of equal factor loadings or structural weights is not re-jected, it provides strong support that observed differences acrosssubgroups in parameters may be expressed by chance [19]. Factorloadings and model-data fit were assessed for each group (pathol-ogists and surgeons). Low item-factor loadings indicate that thefactors did not have the same meaning in the subgroup, thus com-parison is meaningless and subgroup should be rejected, whereas
Table 4TAM measurement model fit statistics for the total sample of the study (N = 604).
Model v2 df D
Hypothesized four factor measurement model 909.79** 146
One factor measurement model 1041.46** 151 1
Note: v2:chi-square statistic.** p < 0.001.
Please cite this article in press as: Melas CD et al. Modeling the acceptance of climodel. J Biomed Inform (2011), doi:10.1016/j.jbi.2011.01.009
factor loadings grater than 0.60 are acceptable. The following fivemodels were tested in a hierarchical sequence:
Model 1 (configural invariance model) represents the totallynon-invariant model with no between-group equality constraintson any of the model parameters. This is the least restrictive model,but it has great importance as, if the model cannot fit the data,none of the more restrictive models will do so.
In Model 2 (the metric invariance model), equality constraintswere imposed on the factor loadings across the groups. This mod-el reveals whether the constructs are manifested differently be-tween groups and it is a prerequisite for meaningful cross-group comparisons [19]. Group comparisons can still be per-formed even in the case of few non-invariant items because fewitems will not heavily influence such comparisons (partial metricinvariance, [22]).
Model 3 (the measurement error invariance model), constrainsuniqueness of the items with invariant factor loadings assessedequal across groups from Model 2.
Model 4 (scalar invariance model) imposes an equality con-straint on the intercepts of the items found to have invariant factorloadings in Model 2.
Finally, in Model 5 (the structural weights invariance model)equality constraints were imposed on the structural weightsamong the latent variables across the groups [19].
To assess adequacy of nested models, the difference betweenthem can be tested by subtracting the two chi-square values andtesting this value against the critical value associated with the dif-ference in degrees of freedom. Furthermore, for MASI model com-parison the CFI index can also be used, because it is not influencedby sample size and model complexity and does not correlate withoverall measures of fit [37]. A change in the CFI value less than orequal to �0.01 indicates that the null hypothesis of invarianceshould not be rejected [37].
5. Results
5.1. Data screening and descriptive summary for the total sample
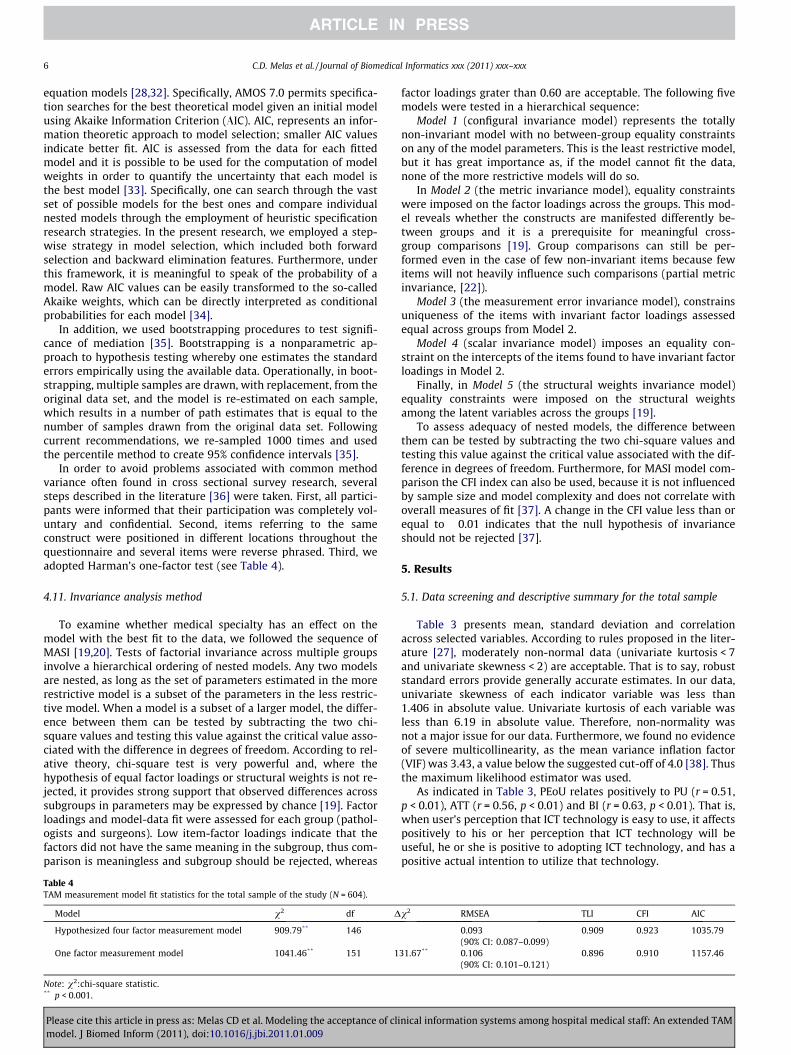
Table 3 presents mean, standard deviation and correlationacross selected variables. According to rules proposed in the liter-ature [27], moderately non-normal data (univariate kurtosis < 7and univariate skewness < 2) are acceptable. That is to say, robuststandard errors provide generally accurate estimates. In our data,univariate skewness of each indicator variable was less than1.406 in absolute value. Univariate kurtosis of each variable wasless than 6.19 in absolute value. Therefore, non-normality wasnot a major issue for our data. Furthermore, we found no evidenceof severe multicollinearity, as the mean variance inflation factor(VIF) was 3.43, a value below the suggested cut-off of 4.0 [38]. Thusthe maximum likelihood estimator was used.
As indicated in Table 3, PEoU relates positively to PU (r = 0.51,p < 0.01), ATT (r = 0.56, p < 0.01) and BI (r = 0.63, p < 0.01). That is,when user’s perception that ICT technology is easy to use, it affectspositively to his or her perception that ICT technology will beuseful, he or she is positive to adopting ICT technology, and has apositive actual intention to utilize that technology.
v2 RMSEA TLI CFI AIC
0.093 0.909 0.923 1035.79(90% CI: 0.087–0.099)
31.67** 0.106 0.896 0.910 1157.46(90% CI: 0.101–0.121)
nical information systems among hospital medical staff: An extended TAM
C.D. Melas et al. / Journal of Biomedical Informatics xxx (2011) xxx–xxx 7
Furthermore, PU was positively related to ATT (r = 0.79, p < 0.01)and BI (r = 0.68, p < 0.01), indicating that when users perceptionthat ICT technology will be useful, the user tends strongly to adoptIT technology, and has a positive intention to utilize thattechnology.
Finally ATT was positively related to BI (r = 0.74, p < 0.01) indi-cating that the user’s positive attitude towards ICT technologyencourages actually the user to utilize that technology.
Results provide support for the positive relationships found inprevious research [8,18,14,10]. Furthermore, positive correlationswere found between ICT knowledge and the TAM variables withthe correlation being higher for PEoU (r = 0.47, p < 0.01). Finally,negative correlations were found between ICT feature demandsand the TAM variables with the correlation being higher for PUof CIS (r = �0.48, p < 0.01).
5.2. Confirmatory factor analysis for the whole sample
Table 2 displays the results of the confirmatory factor analysisof the TAM variables for the total sample of clinicians (N = 604).All factor loadings for the items in the measurement model weregreater than 0.6. The entire squared multiple correlations (SMCs)were greater than 0.60, except 3 (items PEoU4, PU6, BI1). The aver-age variance extracted for all measures exceeded the recom-mended 0.5 level (0.62 for PU; 0.60 for PEoU; 0.56 for ATT and0.55 for BI) [19].
Table 4 displays the fit statistics for the TAM measurementmodel. Overall, the hypothesized measurement model fits the dataquite well when evaluated in terms of the recommended cut offs orthe combination cut off approach [31]. In addition, the hypothe-sized measurement model fits the data better than a single factormodel, both in terms of the fit statistics and when directly con-trasted with a change in chi-square test and AIC (smaller AIC valueindicate better fit of the model).
5.3. Assessment of common method bias
The basic assumption of Harman’s one-factor test is that if asubstantial amount of common method variance exists in the data,either a single factor will emerge or one general factor will accountfor the majority of the covariance among the variables. Specifically,we entered all the self-reported variables in an exploratory factoranalysis with principal axis factoring and varimax rotation. Tenfactors emerged with eigenvalues greater than 1 and 64.58% ofthe variance explained. No single factor was dominant with thefirst factor accounting for 12.13% of the variance. Thus, it seemsthat method variance is not problem for the present study.
In summary, the results suggest that the proposed factor struc-ture presents a statistically adequate and sufficient fit to the data,all constructs in the model exhibited adequate reliability and con-vergent validity and no indications of severe common method var-iance were found.
Table 5Standardized direct and indirect effects and associated 95% confidence intervals in paparentheses) were based on the findings from a bootstrapping analysis using the percenti
Predictor Perceived usefulness (PU) Attitude (A
Direct effect Indirect effect Direct effec
OutcomePEoU 0.53* – 0.23*
(0.45–0.62) (0.14–0.32)PU – – 0.69*
(0.60–0.78)ATT – – –
* p < 0.01.
Please cite this article in press as: Melas CD et al. Modeling the acceptance of climodel. J Biomed Inform (2011), doi:10.1016/j.jbi.2011.01.009
5.4. Assessment of the structural model for the whole sample
The next step in our analysis was to consider comparative mod-els specifying total effects (direct and indirect), complete media-tion and partial mediation. The results of the specificationprocedure indicated that there was 84.8% probability (in terms ofAkaike weights) that the best model is the one with both directand indirect effects among TAM variables. This model revealed agood fit to the data: v2 (146, N = 604) = 909.80, p = 0.000;RMSEA = 0.093 (90% CI: 0.087–0.099); CFI = 0.923; TLI = 0.909;AIC = 1035.80. The second best model with probability 15.6% isthe one without the path from PU to BI.
Examining the findings for direct and indirect relationships (Ta-ble 5) the model postulated that the effect of PU on BI was partiallymediated by ATT. Moreover, the effects of PEoU on BI were par-tially mediated by both PU and ATT. Standardized direct effect ofPEoU on PU was 0.53 (p < 0.01, two tailed). Furthermore, PEoU re-vealed positive direct effects on ATT (0.23, p < 0.01, two tailed) andBI (0.38, p < 0.01, two tailed) along with indirect effects on ATT(0.29, p < 0.01, two tailed) and BI (0.31, p < 0.01, two tailed). Thestandardized total effect (direct and indirect) of PEoU on ATT andBI was 0.60 (95% percentile confidence interval: 0.51–0.69,p < 0.01, two tailed) and 0.76 (95% percentile confidence interval:0.69–0.82, p < 0.01, two tailed), respectively.
PU had statistically significant direct effects on ATT (0.69,p < 0.01) and BI (0.13, p < 0.01, two tailed). The standardized totaleffect of PU on BI was 0.49 (95% percentile confidence interval:0.39–0.60, p < 0.01, two tailed). Finally, the direct effect of ATT onBI was 0.53, (95% percentile confidence interval: 0.36–0.67,p < 0.01, two tailed).
In summary, the proportion of variance (squared multiple cor-relations) in PU, ATT and BI that was explained by the collectiveset of predictors was 29% (95% CI: 0.20–0.39), 70% (95% CI: 0.63–0.78), 83% (95% CI: 0.76–0.91) respectively.
5.5. Inclusion of external variables in the model
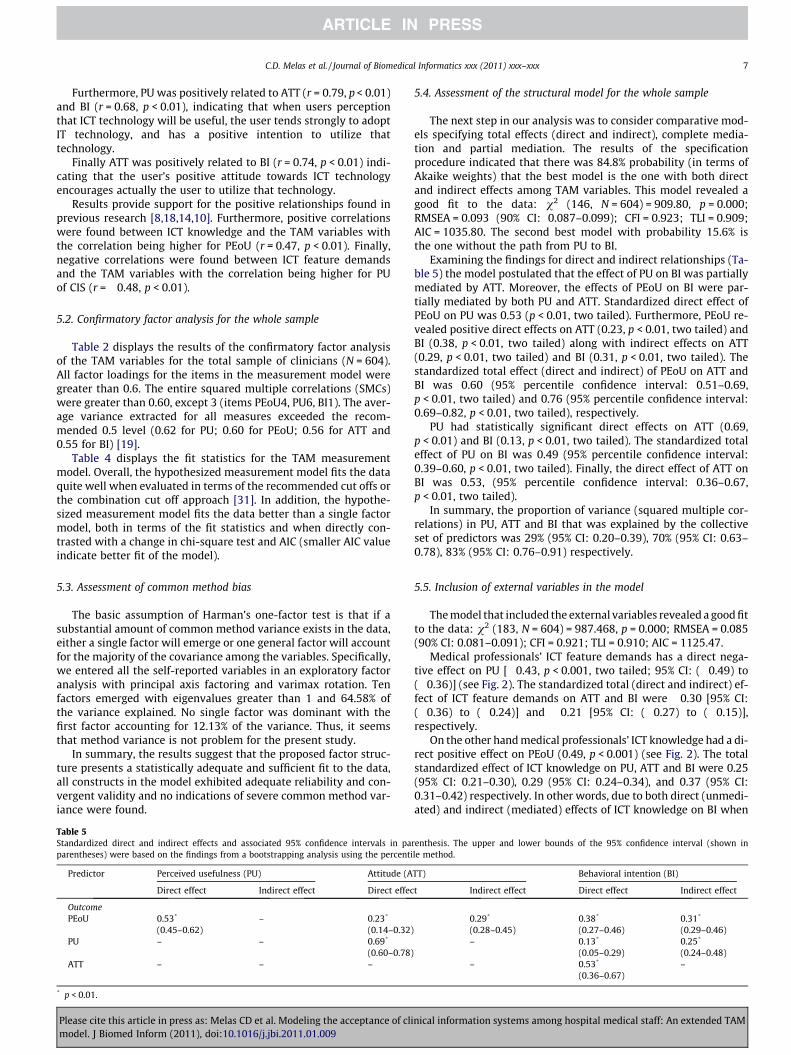
The model that included the external variables revealed a good fitto the data: v2 (183, N = 604) = 987.468, p = 0.000; RMSEA = 0.085(90% CI: 0.081–0.091); CFI = 0.921; TLI = 0.910; AIC = 1125.47.
Medical professionals’ ICT feature demands has a direct nega-tive effect on PU [�0.43, p < 0.001, two tailed; 95% CI: (�0.49) to(�0.36)] (see Fig. 2). The standardized total (direct and indirect) ef-fect of ICT feature demands on ATT and BI were �0.30 [95% CI:(�0.36) to (�0.24)] and �0.21 [95% CI: (�0.27) to (�0.15)],respectively.
On the other hand medical professionals’ ICT knowledge had a di-rect positive effect on PEoU (0.49, p < 0.001) (see Fig. 2). The totalstandardized effect of ICT knowledge on PU, ATT and BI were 0.25(95% CI: 0.21–0.30), 0.29 (95% CI: 0.24–0.34), and 0.37 (95% CI:0.31–0.42) respectively. In other words, due to both direct (unmedi-ated) and indirect (mediated) effects of ICT knowledge on BI when
renthesis. The upper and lower bounds of the 95% confidence interval (shown inle method.
TT) Behavioral intention (BI)
t Indirect effect Direct effect Indirect effect
0.29* 0.38* 0.31*
(0.28–0.45) (0.27–0.46) (0.29–0.46)– 0.13* 0.25*
(0.05–0.29) (0.24–0.48)– 0.53* –
(0.36–0.67)
nical information systems among hospital medical staff: An extended TAM

chi-square = 987.468df =183p =.000TLI =.910CFI =.921RMSEA =.085AIC=1125.468
.45
PerceivedUsefulness
(PU)
.63
PU1
.80
.83
PU2
.86
PU3
.93
.72
PU4
.85
.24
PerceivedEase of Use
(PEoU)
.71
PEoU6
.73
PEoU5
.45
PEoU4
.75
PEoU3
.75
PEoU2
.72
PEoU1
.84
.85
.67
.86
.87
.85
.70
Attitudestoward use
(ATT)
.48
Att1
.86
Att2
.74
Att3
.83
Att4
.69 .92 .86 .91
.83
BehavioralIntention
to use(BI)
.36
BI1
.60
BI2
.64
BI3
.60
.78
.80
.61
PU5
.78
.40
PU6
.63
.52
.69
.53
.38
.23
.12
.91
ICT featuredemands
ICT knowledge
-.43
.49
Fig. 2. Structural model (standardized results). Circles represent latent factors; boxes represent indicators. Casual effects are given by arrows connecting circles. Boldnumbers over circles represent variance explained. Disturbance and measurement error effects are omitted for clarity.
8 C.D. Melas et al. / Journal of Biomedical Informatics xxx (2011) xxx–xxx
ICT knowledge goes up by 1 standard deviation, BI goes up by 0.37standard deviations. Medical professionals’ ICT feature demands ex-plain an additional 16% of the PU variance, while ICT knowledge ex-plains 24% of the variance in PEoU. Furthermore all paths among theTAM variables remained statistically significant at the 0.001 level.
5.6. Multi-group analysis of structural invariance (MASI)
When performing multi-group analysis, the sample size of thegroups being compared should be roughly equal [21]. In our samplewe could test for specialty group differences only between surgeons(n = 215) and pathologists (n = 233), as these groups provide ade-quate sample size. The mean age in years was 37.6 for surgeons and36.2 for pathologists. No statistical significant differences betweensurgeons and pathologists were found in terms of age [t(419) = 1.75,p = 0.81], ICT knowledge[t(446) =�0.335, p = 0.738], ICT feature de-mands [t(446) =�1.389, p = 0.165] and hours using a PC per week[t(446) =�1.07, p = 0.292]. However, surgeons reported moretenure (M = 5.27 years, SD = 6.5 years) compared to pathologists(M = 3.99 years, SD = 4.92 years) [t(446) = 1.99, p = 0.047]. Finally,the chi-square test showed that there are differences between the 2groups in terms of gender (v2 = 17.327, p = 0.000). In the surgeonsgroup there were 162 male and 53 female participants while in thepathologist group there were 132 males and 101 females.
Before conducting MASI, we examined model-data fit andparameter estimates for the entire sample (n = 448). The hypothe-sized structural model revealed a good fit to the data: v2 (146,N = 448) = 705.03, p = 0.000; RMSEA = 0.093 (90% CI: 0.086–
Please cite this article in press as: Melas CD et al. Modeling the acceptance of climodel. J Biomed Inform (2011), doi:10.1016/j.jbi.2011.01.009
0.099); CFI = 0.923; TLI = 0.910; AIC = 831.03. These results suggestthat the structural model was appropriately specified, a propersolution was obtained and the solution fit the entire sample ade-quately. The completely standardized item-factor loadings for PU,PEoU, and BI measurements were high (from 0.57 to 0.92) and sta-tistically significant. All items had reliability scores (R2) rangingfrom 0.51 to 0.87, indicating good item reliability. Thus, all mea-surement items for the structural model were valid and reliablemeasures of their theoretical construct.
To test the structural invariance across medical specialty, weconducted a multi-group analysis of structural invariance. Firstwe tested Model 1 (the configural invariance model) with noequality constrains for both groups. This model revealed an ade-quate fit to the data: v2 (292, N = 448) = 1088.23, p = 0.000;RMSEA = 0.078 (90% CI: 0.073–0.083); CFI = 0.901; TLI = 0.903;AIC = 1340.23 (Table 6), thus supporting the configural invariance.
Model 2 (the metric invariance model) also displayed an adequatefit to the data (Table 6). Examination of the probability level associ-ated with the chi-square test for each item loading constraint sepa-rately, showed that the three item loadings associated with theitems PU2, PU3, PU4, were not invariant across surgeons and pathol-ogists, indicating the condition of partial metric invariance.
In Model 3 (measurement error invariance) equality constraintswere added on the 16 item loadings that were found invariant inModel 2 and on their respective error terms. Model 3 displayedan adequate fit to the data (Table 6). The chi-square difference testresults showed that 2 out of the 16 equality constraints imposedon the error terms were non-invariant. The non-invariant error
nical information systems among hospital medical staff: An extended TAM
Table 6Goodness of fit for the physician specialty (surgeons vs. pathologists) invariance models (N = 448). Numbers in parentheses indicated the models compared.
Structural model v2 df Dv2 RMSEA TLI CFI AIC
1. Configural invariance model 1088.23, ns 292 – 0.078 (90% CI: 0.073–0.083) 0.903 0.901 1340.232. Metric invariance model 1098.01, ns 304 9.781* (1–2) 0.077 (90% CI: 0.072–0.081) 0.888 0.901 1326.013. Measurement error invariance model 1117,37, ns 318 29.136* (1–3) 19.355* (2–3) 0.075 (90% CI: 0.070–0.080) 0.902 0.900 1317.374. Scalar invariance model 1138.03, ns 331 49.799* (1–4) 40.017* (2–4) 20.663* (3–4) 0.074 (90% CI: 0.069–0.079) 0.896 0.899 1312.035. Structural weights invariance model 1146.22, ns 337 8.39* (4–5) 0.073 (90% CI: 0.069–0.078) 0.897 0.899 1308.42
* p > 0.1.
C.D. Melas et al. / Journal of Biomedical Informatics xxx (2011) xxx–xxx 9
terms were associated with items PU1 and PEoU1. Thus, partialmeasurement error invariance was demonstrated.
Model 4 (scalar invariance model) also displayed an adequate fitto the data (Table 6). The chi-square test revealed the tenability ofall of the item intercept constraints imposed on the model, exceptfor the constraints associated with items PEoU1 PEoU2 and PEoU3.Hence, partial scalar invariance was supported.
With respect to model differences, the chi-square differencetests showed that Model 2 was significantly better than Model 1and that Models 3 and 4 were significantly better than Model 2.Furthermore, Model 4 was significantly better than Model 3 (Table6). Since Model 4 (the scalar invariance model) had the best fit, itwas used for testing the structural weights.
Model 5 (the structural weights invariance model) also dis-played an adequate fit to the data (Table 6). Examination of theprobability level associated with the chi-square test for each struc-tural weight among the latent variables constraint separately,showed that the structural weight between PEoU and PU was notinvariant across surgeons and pathologists, indicating the condi-tion of partial structural invariance. In Table 7 we present the stan-dardized structural weight for both groups.
For surgeons, the proportion of variance (squared multiple cor-relations) in PU, ATT and BI that was explained by the collective setof predictors was 51% (95% CI: 0.34–0.66), 71% (95% CI: 0.52–0.86),and 93% (95% CI: 0.82–0.98), respectively. For pathologists, theproportion of variance in PU, ATT and BI that was explained bythe collective set of predictors was 21% (95% CI: 0.10–0.37), 72%(95% CI: 0.61–0.81), and 81% (95% CI: 0.68–0.94), respectively.
Including the ICT feature demands variable to Model 5 (thestructural weights invariance model) explained an additional 11%and 29% of the variance in PU for surgeons and pathologists respec-tively. The percentage of variance explained for PEoU when ICTknowledge was included in Model 5, was 21% and 19% for surgeonsand pathologists respectively. While the regression weight from ICTknowledge to PEoU was invariant across specialties, the regressionweight from ICT feature demands to PU was not invariant (Table 7).
6. Discussion
In the present study the largest sample size ever tested wasused in order to explore empirically the application of the TAMin the health sector. Structural equation modeling (SEM) and
Table 7Structural paths for physician specialty (standardized estimates). The upper and lower boufrom a bootstrapping analysis using the percentile method.
Structural path Specialty
Surgeons (n = 215)
PEoU ? PU 0.72* (0.59–0.81)PEoU ? ATT 0.28* (0.15–0.41)PEoU ? BI 0.33* (0.21–0.47)PU ? ATT 0.62* (0.45–0.78)PU ? BI 0.23* (0.10–0.43)ATT ? BI 0.48* (0.26–0.69)ICT feature demands ? PU �0.45* [(�0.56)–(�0.33)]ICT knowledge ? PU 0.46* (0.36–0.56)
* p < 0.001.
Please cite this article in press as: Melas CD et al. Modeling the acceptance of climodel. J Biomed Inform (2011), doi:10.1016/j.jbi.2011.01.009
multi-group analysis of structural invariance (MASI) analyses wereconducted with a sample of 604 clinicians, including 534 physi-cians from 13 main state hospitals and one private hospital inGreece. Both SEM and MASI were used in parallel for the first timein order to test TAM in the health sector. Measurement error isminimized in these methods, through the use of multiple indica-tors of latent variables prior to testing model fit. Furthermore,the use of SEM in this study allowed both the direct and indirecteffects to be analyzed, hence allowing the possibility of achievinga more accurate model.
In our analyses we initially tested the standard TAM, in order tofacilitate the comparison for future studies and then we tested anextended TAM model. We need to stress however, that we assessedattitudes and beliefs regarding the use of clinical information sys-tems (CIS) rather than attitudes and beliefs directed towards CIS it-self, since clinicians might hold a positive view about CIS, withoutbeing favorably disposed towards its use. Our results support pre-vious studies in TAM, which suggest that clinicians’ attitudes to-wards the use of CIS are related to their intention to use suchsystems. In addition, attitudes towards CIS are influenced by: (a)clinicians’ belief that using CIS will increase their job performance(perceived usefulness-PU) and (b) clinicians’ belief that a CIS is freeof effort (Perceived Ease of Use-PEoU). Furthermore, PU of CIS isinfluenced by PEoU (see Fig. 2).
We successfully extended the TAM (in terms of model fit)by including two external factors relevant to clinicians, namelyself-reported information and communication technology (ICT)knowledge and self-reported ICT feature demands as antecedentsof PEoU and PU respectively. Finally, we found evidence for themoderating effect of physicians’ specialty.
Although recent empirical research suggests that TAM is a goodpredictor of clinician behavioral intent to accept technology[6,12,20], more research is needed to establish confidence in therelationships among TAM variables, when the theory is imple-mented in the health care. For example, Holden and Karsh [6], intheir recent meta-analytic review concerning the application ofTAM in health care, found that in studies with physician samplesthe PEoU-BI relationship was non-significant. However, the major-ity of these studies had sample sizes less than 90 individuals rais-ing concerns about the statistical power of the model’s parameterestimates. Our results clearly point to a direct effect of PEoU on BI.The standardized direct effect of PEoU on BI was b = 0.37.
nds of the 95% confidence interval (shown in parentheses) were based on the findings
Pathologists (n = 233) Dv2
0.46* (0.28–0.61) 4.10, (p = 0.03)0.27* (0.16–0.40) 4.098, (p = 0.535)0.32* (0.19–0.43) 3.091, (p = 0.543)0.69* (0.57–0.79) 0.153, (p = 0.696)0.25* (0.08–0.45) 7.975, (p = 0.241)0.46* (0.27–0.64) 3.046, (p = 0.385)�0.49* [(�0.62)–(�0.34)] 13.17, (p = 0.04)0.44* (0.35–0.52) 8.86, (p = 0.354)
nical information systems among hospital medical staff: An extended TAM
10 C.D. Melas et al. / Journal of Biomedical Informatics xxx (2011) xxx–xxx
We found that the standardized total effect (direct and indirect)of PEoU on BI was b = 0.76, which is higher than the standardizedtotal effect of PU on BI (b = 0.49). Clearly, clinicians place moreimportance to the intrinsic aspects of CIS (captured by PEoU) com-pared to its extrinsic aspects (captured by PU). In other words, PEoUwill affect the use of CIS when the intrinsic character of the technol-ogy contributes to the actual outcome of its application. This is inline with studies proposing that the effect of PEoU on intentionsis stronger in the early stages of learning and behavior [1]. ‘‘Easyto use’’ attributes of a clinical information system are developedby IT technicians and among other attributes are related to inter-face characteristics such as user friendliness, operational simplicity,effective data retrieval, manipulation and presentation etc. as wellas operational characteristics such as data organization and shar-ing, fast access, data combination and querying etc. An ‘‘easy touse’’ system is considered to be less time-consuming and this isone of the factors influencing clinician’s intention to use ICT [4].On the other hand attributes related to the ‘‘usefulness’’ are workedon mostly by clinicians and refer to the medical knowledge which isembedded in the system and being continuously updated. Hence‘‘usefulness’’ is related to data sufficiency and availability in termsof quantity and quality, clarity, accuracy etc. Clinical data may besupplied in the system by clinicians for global use.
Hospital and IT managers could turn this into advantage, in or-der to encourage the frequent use of a new ICT system. Not onlyduring the first stages of systems installation and implementationbut also during training, emphasizing tactfully more in the systems‘‘easy of use’’ rather than its ‘‘usefulness’’ could be the key, in orderto achieve better personnel involvement. In addition, an ‘‘easy touse’’ system is considered as less time-consuming and this is oneof the factors influencing clinician’s intention to use ICT [4].
Furthermore, our research was conducted in settings where CISare not individually financed by clinicians. This finding implies thatalthough PU is an important determinant of the acceptance of aCIS, when clinicians are not paying for the cost of the technology,or if the decision to pay for the technology has already been made,PEoU may be a strong catalyst fostering the acceptance of CIS.
Results showed that extending the TAM by including medicalprofessionals’ perceived ICT knowledge and perceived ICT featuredemands as antecedents of PEoU and PU respectively, revealed agood fit to the data. Both factors are relevant to clinicians and per-tain to user personal characteristics. We found that medical profes-sionals’ ICT knowledge, that is, how much knowledge cliniciansperceive to have about ICT, had a direct positive effect on PEoU(b = 0.49). Medical professionals’ ICT feature demands that is,how sophisticated ICT must be before clinicians would be willingto use them, had a direct negative effect on PU (b = �0.43).
We found no significant direct effects of the two external factorson BI; stated differently, the TAM constructs fully mediate the ef-fects of the external factors on BI. The implication of these findingsis that our research contributes to a better understanding of theantecedents of PU and PEoU in health care contexts, thus providinguseful information to practitioners in terms of which levers to pullin order to affect these beliefs and through them the use of CIS.
Although the current generation of trainees and young clini-cians has never lived in a world without pervasive technology,ICT knowledge is different from simply using ICT. For example inour sample clinicians have on average a rather general apprecia-tion of the distinction between pairs of ICT concepts (mean ofICT knowledge = 2.26) but could not define it. This implies a lowconfidence in understanding basic ICT concepts, which in turn re-flects insufficient training. Our results suggest that enchasing clini-cians’ confidence on ICT knowledge through appropriate training,will result in higher beliefs that using CIS will be rather free ofadditional efforts. Stated differently, general ICT knowledge mayhelp clinicians’ transition into using more sophisticated CIS by
Please cite this article in press as: Melas CD et al. Modeling the acceptance of climodel. J Biomed Inform (2011), doi:10.1016/j.jbi.2011.01.009
improving their ease of use or comfort with learning and usingCIS systems.
In the same vein, our results suggest that clinicians’ beliefs thatusing CIS will increase their job performance (i.e. PU) are nega-tively related to clinicians’ ICT features demand. This findingconfirms previous studies suggesting that medical health profes-sionals are more likely to adopt CIS that are perceived as compat-ible with clinicians’ current work processes [5,39]. What is more,this finding is in line with growing interest in the ‘‘Fit betweenIndividuals, Task and Technology’’ (FITT) framework, as a criticalneed for successful CIS design [6]. Under the FITT framework, ITadoption in a clinical environment depends on the fit betweenthe attributes of the individual users, attributes of the technology,and attributes of the clinical tasks and processes.
In addition, the FITT framework clearly implies potential differ-ences in the strength of the relationships between criterion and pre-dictor variables in the TAM model, when different medicalspecialties are considered. Medical diagnosis and treatment is acomplex work process and existing evidence point to physicians’specialty differences in the implementation of medical practice. Inthe present research, we tested for differences between surgeons(n = 215) and pathologists (n = 233) using MASI analysis. Our resultsprovide initial evidence for the moderating effect of physician’s spe-cialty in PEoU–PU and ICT feature demands-PU relationships. Spe-cifically, we have found that for surgeons it is more important theCIS to be easy to use in order to be considered as useful comparedto pathologists (see Table 7, the PEoU ? PU path).
Furthermore, surgeons seem to be less demanding in ICT fea-tures in order to perceive CIS as useful compared to pathologists(see Table 7, the ICT feature demands ? PU path). These findingsindicate that design and training sessions should explicitly considermedical specialty as an important factor in the adoption of CIS.
This study raises implications for the hospital administrators.The predictive power of attitude towards usage indicates the needto develop positive attitudes among health care professionals, toensure professionals’ acceptance and continued use of CIS applica-tions. Finally, although PU and PEoU have been found to predictbehavioral intent, they do not remain static. Healthcare profession-als who perceive CIS to be useful and easy to use may soon expe-rience limitations if they do not participate in continuousprofessional development to keep abreast with more advancedskills and knowledge on the use of CIS. For example, in our studywe have found that older clinicians have lower levels of perceivedICT knowledge (r = �0.14, see Table 2), and that the longer the ten-ure of clinicians the lower the levels of perceived ICT knowledge(r = �0.24, see Table 2). This suggests the importance of clinician’sprofessional development towards increasing the perceived ICTknowledge; ICT knowledge has an indirect effect on behavioralintention to use CIS. In addition, it is plausible that the scheduledrotation of clinicians among different hospitals could develop fur-ther clinicians’ perceived ICT knowledge.
6.1. Study limitations
Although care has been taken to ensure that the methodology inthis study is sound, there are several limitations that warrant fur-ther research. First, this is a survey, not an audit of actual practice,and thus data are self-reported. Furthermore, our cross-sectionaldesign prevents us from studying causal relationships among ourvariables. Future studies should use longitudinal data to rigorouslyassess the stability of the identified relationships over time.
Second, our study concentrated on Greek hospitals, where thedecision to pay for the technology has already been made. Cautionshould therefore be exercised in generalizing these findings to non-comparable populations. Consequently, future studies might wantto consider the implications of our work for different populations.
nical information systems among hospital medical staff: An extended TAM
C.D. Melas et al. / Journal of Biomedical Informatics xxx (2011) xxx–xxx 11
A third limitation arises from the analysis of healthcare profes-sional’s technology acceptance decisions, regarding clinical infor-mation systems in general, and not a specific health informationsystem. Thus, our readers should be cautious in extrapolating theresults to other groups of health information systems.
A forth limitation is the fact that the proportion of variance(squared multiple correlations) in PU, ATT and BI that was explainedin this study by the collective set of predictors was 29%, 70% and 83%respectively, leaving room for further improvement, especially forthe PU construct. In the pursuit of parsimony, it is possible that thisstudy has excluded other variables that may impact significantly ontechnology acceptance in health care. Furthermore, the measure-ment of the external variables (ICT knowledge and feature de-mands) were based on Cork’s instrument [9], developed in 1998.Considering the all the changes in IT over the past 12 years, futureresearch should consider using more up-dated scales.
A final limitation concerns the use of behavioral intention as ameasure for actual use, as this may have weakened and contrib-uted to the loss of explanatory power of the model in this study.Although intention to use technology as a construct has been re-ported to be a suitable proxy for actual technology, still there is aquestion as to whether the TAM can act as an accurate predictorof actual usage rather than behavioral intention to use.
These limitations represent, in any case, opportunities to advancein our efforts to better understand CIS adoption in the health care.
7. Conclusions
TAM is a well known theory of technology acceptance and exist-ing evidence suggests that the theory generally holds in clinicalcontexts. However, opportunities still exist for researchers to en-hance TAM capabilities as a useful theoretical tool in the healthcare. In this article TAM was replicated. The largest sample sizeever tested with TAM in the health sector (604 clinicians) wasused, including 534 physicians from 13 main state hospitals andone private hospital in Greece. Results of structural equation mod-eling analysis, confirm the predictive power of TAM, providing sup-port for the positive relationships found in previous researchprojects in health care. Specifically, in the present study, positiverelationships were found between ATT and BI and between PEoUand PU. Both PEoU and PU were positively related to ATT. Further-more, PU was positively related to BI. Finally, our results point to apositive relationship between PEoU and BI, a relationship that hasbeen found to be inconsistent in some of the previous TAM studiesconducted in the health care [6]. Overall, the percentage of vari-ance explained in BI accounted for by the predictors in the modelwas 83% and it is among the largest ever found in health care [6].
In addition, medical staffs’ ICT knowledge and ICT feature de-mands were tested as external variables and physicians’ specialtyspecific differences in TAM were introduced (i.e. pathologists andsurgeons). We have found that both ICT knowledge and ICT featuredemands explain an additional variance in PEoU and PU respec-tively. However, their effects on BI are fully mediated by the TAMvariables. Finally, we have found that physicians’ specialty moder-ates the PEoU–PU and ICT feature demands-PU relationships.
In conclusion, our findings make a contribution to the literatureby replicating, explaining and advancing the TAM, whereas theoryis benefited by the addition of external variables.
Acknowledgments
The authors would like to express special thanks to the medicaland nursing staff of all the hospitals who wholeheartedly contrib-uted in the TAM survey. Unfortunately, they will remain nameless
Please cite this article in press as: Melas CD et al. Modeling the acceptance of climodel. J Biomed Inform (2011), doi:10.1016/j.jbi.2011.01.009
to preserve anonymity. The authors of the article hold full respon-sibility for results and opinions expressed herein.
Appendix A
ICT knowledge: items and results of factor analysis with geominrotation (N = 604).
ni
cal information systems among hospital medical staff: An exten1
CW 1 – Client–server
0.795 CW 2 – Field–record 0.758 CW 3 – Electronic mail–electronic bulletin board 0.750 CW 4 – Free text–coded data 0.804 CW 5 – Database–knowledge base 0.809 CW 6 – Data in memory – data on disk 0.873 CW7 – Digital–analog 0.845 CW8 – Relational database–flat-file database 0.729 CW9 – Full-text database–bibliographic database 0.841 CW10 – Mainframe computer–Personal computer 0.810 CW11 – Images–graphics 0.893 CW12 – CD-ROM – floppy disk–hard disk 0.950 CW13 – Hardware–software 0.959 CW14 – Forward chaining–backward chaining 0.682 CW15 – Sensitivity–positive predictive value 0.762Note: 1–3 scale: 1 = I do not understand the distinction at all, 2 = I have a generalappreciation of the distinction but could not define it, 3 = I can define the distinctionprecisely). The WLSMV estimator in Mplus v.5.21 was used to estimate factorloadings.
Appendix B
ICT feature demand: results of factor analysis with geomin rota-tion (N = 604).
1
2SCF1 – Explain rationale for patient care advice
0.744 – SCF2 – Provide accurate treatmentrecommendations
0.799 –SCF3 – Make accurate diagnoses
0.413 – SCF4 – Quantify the uncertainty ofrecommendations
0.456 –SCF5 – Provide multiple alternative patientcare recommendations
0.375
0.329SCF6 – Allow browsing of information as wellas providing specific advice
0.580
0.386DCU1 – Take patient preferences into accountwhen giving advice
–
0.436DCU2 – Display images in less than 30 s
– 0.765 DCU3 – Respond to queries in less than 5 s – 0.822 DCU4 – Allow access at any place in clinicalsetting
0.381 0.544DCU5 – Allow implementation without anychange in existing clinical routines
0.327
0.606DCU6 – Function without any down-time
0.354 0.593 DCU7 – Allow interaction without use ofkeyboard
– 0.617DCU8 – Be learnable in less than 2 h
– 0.671 DCU9 – Allow data entry in user’s own wordswithout requiring special codes
– 0.596Note: 1–4 scale: 1-‘‘Vitally necessary’’ to 4-‘‘not necessary’’. Loadings below 0.30 arenot shown. The WLSMV estimator in Mplus v.5.2 was used to estimate factorloadings. SCF = sophisticated computer features; DCU = demand for computerusability.
ded TAM
12 C.D. Melas et al. / Journal of Biomedical Informatics xxx (2011) xxx–xxx
References
[1] Davis FD. Perceived usefulness, perceived ease of use, and user acceptance ofinformation technology. MIS Q 1989;3(3):319–40.
[2] Schepers J, Wetzels M. A meta-analysis of the technology acceptance model:investigating subjective norm and moderation effects. Info Manage2007;44:90–103.
[3] Yousafzai SY, Foxall GR, Pallister JG. Technology acceptance: a meta-analysis ofthe TAM: part 1. J Model Manage 2007;2(3):251–80.
[4] Yarbrough AK, Smith TB. Technology acceptance among physicians: a new takeon TAM. Med Care Res Rev 2007;64(6):650–72.
[5] Bhattacherjee A, Hikmet N. Physicians’ resistance toward health careinformation technology: a theoretical model and empirical test. Eur J InfoSyst 2007;16:725–37.
[6] Holden RJ, Karsh BT. The technology acceptance model: its past and its futurein health care. J Biomed Inform 2010;43(1):159–72.
[7] Davis FD, Bagozzi RP, Warshaw PR. Extrinsic and intrinsic motivation to usecomputers in the workplace. J Appl Soc Psychol 1992;22(1):1111–32.
[8] Paré G, Sicotte C, Jacques H. The effects of creating psychological ownership onphysicians’ acceptance of clinical information systems. J Am Med Inform Assoc2006;13:197–205.
[9] Cork RD, Detmer WM, Friedman CP. Development and initial validation of aninstrument to measure physicians’ use of, knowledge about, and attitudestoward computers. J Am Med Inform Assoc 1998;5(2):164–76.
[10] Venkatesh V, Davis FD. A theoretical extension of the technology acceptancemodel: four longitudinal field studies. Manage Sci 2000;46:186–204.
[11] Venkatesh V, Morris MG, Davis GB, Davis FD. User acceptance of informationtechnology: toward a unified view. MIS Q 2003;27:425–78.
[12] Hu P, Chau P, Sheng O, Tam K. Examining the technology acceptance modelusing physician acceptance of telemedicine technology. J Manage Info Syst1999;16(2):91–113.
[13] Barker DJ, van Schaik P, Simpson DS, Corbett WA. Evaluating a spoken dialoguesystem for recording clinical observations during an endoscopic examination.Med Inform Internet Med 2003;28:85–97.
[14] Liu L, Ma Q. Perceived system performance: a test of an extended technologyacceptance model. Database Adv Inform Syst 2006;37:51–9.
[15] Liang H, Xue Y, Byrd TA. PDA usage in health care professionals:testing an extended technology acceptance model. Int J Mobile Commun2003;1:372–89.
[16] Horan TA, Tulu B, Hilton B, Burton J. Use of online systems in clinical medicalassessments: an analysis of physician acceptance of online disabilityevaluation systems. Paper presented at the Proceedings of the 37th Hawaiiinternational conference on system sciences; 2004.
[17] Tung FC, Chang SC, Chou CM. An extension of trust and TAM model with IDT inthe adoption of the electronic logistics information system in HIS in themedical industry. Int J Med Inform 2008;77:324–35.
[18] Wu JH, Wang SC, Lin LM. Mobile computing acceptance factors in the healthcare industry: a structural equation model. Int J Med Inform 2007;76:66–77.
[19] Deng X, Doll WJ, Hendrickson A, Scazzero JA. A multi-group analysis ofstructural invariance: an illustration using the technology acceptance model.Info Manage 2005;42:745–59.
Please cite this article in press as: Melas CD et al. Modeling the acceptance of climodel. J Biomed Inform (2011), doi:10.1016/j.jbi.2011.01.009
[20] Doll WJ, Hendrickson A, Deng X. Using Davis’s perceived usefulness and ease-of-use instruments for decision making: a confirmatory and multigroupinvariance analysis. Decis Sci 1998;29(4):839–69.
[21] Frazier PA, Tix AP, Barron KE. Testing moderator and mediator effects incounselling psychology research. J Couns Psychol 2004;51(1):115–34.
[22] Byrne BM. Testing for multigroup invariance using AMOS graphics: a road lesstraveled. Struct Equation Model: A Multidiscip J 2004;11(2):272–300.
[23] Little TD. Mean and covariance structures (MACS) analyses of cross-culturaldata: practical and theoretical issues. Multivar Behav Res 1997;32:53–76.
[24] Brislin RW. Translation and content analysis of oral and written material. In:Triandis HC, Berry JW, editors. Handbook of cross cultural psycho-logy. Boston: Allyn & Bacon; 1981. p. 398–444.
[25] Muthén LK, Muthén BO. Mplus user’s guide. 4th ed. Los Angeles (CA): Muthén& Muthén; 2007.
[26] Flora DB, Curran PJ. An empirical evaluation of alternative methods ofestimation for confirmatory factor analysis with ordinal data. PsycholMethods 2004;9(4):466–91.
[27] West SG, Finch JF, Curran PJ. Structural equation models with non normal datavariables: problems and remedies. In: Hoyle RH, editor. Structural equationmodeling: concepts, issues, and applications. London: Sage; 1995. p. 56–75.
[28] Arbuckle JL. AMOS 7.0. User guide. Chicago: SmallWaters Corporation; 2006.[29] Anderson JC, Gerbing DW. Structural equation modeling in practice: a review
and recommended two-step approach. Psychol Bull 1988;103:411–23.[30] Fornell C, Larcker DF. Evaluating structural equation models with
unobservable variables and measurement error. J Mark Res 1981;18(2):39–50.[31] Shook CL, Ketchen DJ, Hult GTM, Kacmar KM. An assessment of the use of
structural equation models in strategic management research. Strateg ManageJ 2004;25:397–404.
[32] Raftery AE. Bayesian model selection in structural equation models. In: BollenKA, Long JS, editors. Testing structural equation models. Newbury Park(CA): Sage Publications; 1993. p. 163–80.
[33] Zampetakis LA, Moustakis V. Quantifying uncertainty in ranking problemswith composite indicators: a Bayesian approach. J Model Manage 2010;5(1):63–80.
[34] Burnham KP, Anderson DR. Multimodel inference: understanding AIC and BICin model selection. Sociol Methods Res 2004;33(2):261–304.
[35] Shrout PE, Bolger N. Mediation in experimental and non-experimental studies:new procedures and recommendations. Psychol Methods 2002;4:422–45.
[36] Podsakoff PM, MacKenzie SB, Lee JY, Podsakoff NP. Common method biases inbehavioral research: a critical review of the literature and recommendedremedies. J Appl Psychol 2003;88(5):879–903.
[37] Cheung GW, Rensvold RB. Evaluating goodness-of-fit indices for testingmeasurement invariance. Struct Equation Model: A Multidiscip J 2002;9:233–255.
[38] Grewal R, Cote JA, Baumgartner H. Multicollinearity and measurement error instructural equation models: implications for theory testing. Mark Sci2004;23(4):519–29.
[39] Chau PK, Hu PJ. Examining a model of information technology acceptance byindividual professionals: and exploratory study. J Manage Info Syst 2002;18(4):191–229.
nical information systems among hospital medical staff: An extended TAM