Modeling study of non-line-narrowed hole-burned spectra in weakly coupled dimers and...
9
Modeling study of non-line-narrowed hole-burned spectra in weakly coupled dimers and multi-chromophoric molecular assemblies Mike Reppert a,b , Virginia Naibo b , Ryszard Jankowiak a, * a Department of Chemistry, Kansas State University, Manhattan, KS 66506, USA b Department of Mathematics, Kansas State University, Manhattan, KS 66506, USA article info Article history: Received 9 June 2009 In final form 8 October 2009 Available online 27 October 2009 Keywords: Hole burning Excitonic interactions Excitation energy transfer abstract Several different models have been proposed to explain the origin of the complex anti-hole features observed in hole-burned (HB) spectra of excitonically coupled systems such as photosynthetic com- plexes. This lack of consensus presents a serious constraint on the interpretation of HB spectra and the underlying electronic structures of these systems. To resolve this problem we present results of modeling studies of non-resonant HB spectra taking uncorrelated excitation energy transfer and excitonic interac- tions into account. Simplified analytical results are compared with Monte Carlo simulations in which excitonic interactions are explicitly taken into account in order to disentangle a number of distinct effects. It is shown that these effects can accurately account for both hole shapes and the broad anti-hole structure observed in excitonically coupled systems. We argue that these models will provide a necessary framework for probing the electronic structure of these systems via HB spectroscopy. Ó 2009 Elsevier B.V. All rights reserved. 1. Introduction Hole burning (HB) spectroscopy is a low-temperature spectro- scopic technique which has been employed over the years in prob- ing the electronic structure and dynamics of a wide variety of systems [1–4]. Although much early HB work was performed on isolated chromophore systems (e.g. dye molecules dispersed in glassy matrices [1,2]), the technique has found numerous applica- tions in multi-chromophore systems as well, including both photo- synthetic complexes [2,3,5,6] and molecular aggregates [7–10]. The basic methodology of persistent HB spectroscopy involves the measurement of a low-temperature ‘‘pre-burn” absorption spectrum of a sample, followed by (typically laser-based) irradia- tion (the ‘‘burn”) and measurement of a final ‘‘post-burn” absorp- tion spectrum. The HB spectrum is obtained as the difference between the pre-burn and post-burn absorption spectra; its fea- tures are defined by light-induced changes in the electronic prop- erties of the sample. These changes are typically attributed to one of two mechanisms: in photochemical hole burning, the probed chromophores of the sample are chemically altered, for example, through an excited state tautomerization [1]; in non-photochemi- cal hole burning (NPHB), the changes in the absorption spectrum are most likely triggered by excited state tunneling between alter- nate physical configurations of the chromophore and its immediate environment, a situation commonly described in terms of a guest– host two-level system (TLS) [11,12]. Another NPHB mechanism involving TLS was proposed by Bogner and Schwarz [13]; in this mechanism hopping over the barrier occurs in the electronic ground state, using the thermal energy provided by radiation less decay of the electronic excited state. Although TLS have traditionally been used to describe a wide variety of features in NPHB spectra, it has been suggested that a more complete picture involving multiple accessible guest-chro- mophore configurations or multi-level systems (MLS) is required to explain many features of the NPHB process [4,11,12]. In both models, NPHB results from tunneling of the system from one min- imum of the potential energy surface to the other (or to one of sev- eral other minima in the case of MLS). After relaxation back to the ground state, the system is locked in the new post-burn configura- tion so long as the temperature is kept sufficiently low as to pre- vent thermal equilibration between the two minima (thermal hole filling). One of the defining features of NPHB is that absorption intensity is conserved [11]. That is, the integrated intensity of the anti-hole should be equal that of the hole (or, alternatively, the total integral of the hole spectrum should be zero). However, the shape and width of the anti-hole (photoproduct) distribution, especially in proteins, remains a subject of debate [14–16]. It is well known that the origin of such anti-holes is associated with the hierarchy of low 0301-0104/$ - see front matter Ó 2009 Elsevier B.V. All rights reserved. doi:10.1016/j.chemphys.2009.10.013 Abbreviations: EET, excitation energy transfer; FWHM, full-width at half maximum; MLS, multi-level system; HB, hole burning; NLN, non-line-narrowing; NPHB, non-photochemical hole burning; SDF, site distribution function; TLS, two- level system; ZPH, zero-phonon hole. * Corresponding author. Tel.: +1 785 532 6785; fax: +1 785 532 6666. E-mail address: [email protected] (R. Jankowiak). Chemical Physics 367 (2010) 27–35 Contents lists available at ScienceDirect Chemical Physics journal homepage: www.elsevier.com/locate/chemphys
Transcript of Modeling study of non-line-narrowed hole-burned spectra in weakly coupled dimers and...

Chemical Physics 367 (2010) 27–35
Contents lists available at ScienceDirect
Chemical Physics
journal homepage: www.elsevier .com/locate /chemphys
Modeling study of non-line-narrowed hole-burned spectra in weakly coupleddimers and multi-chromophoric molecular assemblies
Mike Reppert a,b, Virginia Naibo b, Ryszard Jankowiak a,*
a Department of Chemistry, Kansas State University, Manhattan, KS 66506, USAb Department of Mathematics, Kansas State University, Manhattan, KS 66506, USA
a r t i c l e i n f o
Article history:Received 9 June 2009In final form 8 October 2009Available online 27 October 2009
Keywords:Hole burningExcitonic interactionsExcitation energy transfer
0301-0104/$ - see front matter � 2009 Elsevier B.V. Adoi:10.1016/j.chemphys.2009.10.013
Abbreviations: EET, excitation energy transfer;maximum; MLS, multi-level system; HB, hole burninNPHB, non-photochemical hole burning; SDF, site dislevel system; ZPH, zero-phonon hole.
* Corresponding author. Tel.: +1 785 532 6785; faxE-mail address: [email protected] (R. Jankowiak).
a b s t r a c t
Several different models have been proposed to explain the origin of the complex anti-hole featuresobserved in hole-burned (HB) spectra of excitonically coupled systems such as photosynthetic com-plexes. This lack of consensus presents a serious constraint on the interpretation of HB spectra and theunderlying electronic structures of these systems. To resolve this problem we present results of modelingstudies of non-resonant HB spectra taking uncorrelated excitation energy transfer and excitonic interac-tions into account. Simplified analytical results are compared with Monte Carlo simulations in whichexcitonic interactions are explicitly taken into account in order to disentangle a number of distincteffects. It is shown that these effects can accurately account for both hole shapes and the broad anti-holestructure observed in excitonically coupled systems. We argue that these models will provide a necessaryframework for probing the electronic structure of these systems via HB spectroscopy.
� 2009 Elsevier B.V. All rights reserved.
1. Introduction cal hole burning (NPHB), the changes in the absorption spectrum
Hole burning (HB) spectroscopy is a low-temperature spectro-scopic technique which has been employed over the years in prob-ing the electronic structure and dynamics of a wide variety ofsystems [1–4]. Although much early HB work was performed onisolated chromophore systems (e.g. dye molecules dispersed inglassy matrices [1,2]), the technique has found numerous applica-tions in multi-chromophore systems as well, including both photo-synthetic complexes [2,3,5,6] and molecular aggregates [7–10].The basic methodology of persistent HB spectroscopy involvesthe measurement of a low-temperature ‘‘pre-burn” absorptionspectrum of a sample, followed by (typically laser-based) irradia-tion (the ‘‘burn”) and measurement of a final ‘‘post-burn” absorp-tion spectrum. The HB spectrum is obtained as the differencebetween the pre-burn and post-burn absorption spectra; its fea-tures are defined by light-induced changes in the electronic prop-erties of the sample. These changes are typically attributed to oneof two mechanisms: in photochemical hole burning, the probedchromophores of the sample are chemically altered, for example,through an excited state tautomerization [1]; in non-photochemi-
ll rights reserved.
FWHM, full-width at halfg; NLN, non-line-narrowing;tribution function; TLS, two-
: +1 785 532 6666.
are most likely triggered by excited state tunneling between alter-nate physical configurations of the chromophore and its immediateenvironment, a situation commonly described in terms of a guest–host two-level system (TLS) [11,12]. Another NPHB mechanisminvolving TLS was proposed by Bogner and Schwarz [13]; in thismechanism hopping over the barrier occurs in the electronicground state, using the thermal energy provided by radiation lessdecay of the electronic excited state.
Although TLS have traditionally been used to describe a widevariety of features in NPHB spectra, it has been suggested that amore complete picture involving multiple accessible guest-chro-mophore configurations or multi-level systems (MLS) is requiredto explain many features of the NPHB process [4,11,12]. In bothmodels, NPHB results from tunneling of the system from one min-imum of the potential energy surface to the other (or to one of sev-eral other minima in the case of MLS). After relaxation back to theground state, the system is locked in the new post-burn configura-tion so long as the temperature is kept sufficiently low as to pre-vent thermal equilibration between the two minima (thermalhole filling).
One of the defining features of NPHB is that absorption intensityis conserved [11]. That is, the integrated intensity of the anti-holeshould be equal that of the hole (or, alternatively, the total integralof the hole spectrum should be zero). However, the shape andwidth of the anti-hole (photoproduct) distribution, especially inproteins, remains a subject of debate [14–16]. It is well known thatthe origin of such anti-holes is associated with the hierarchy of low

28 M. Reppert et al. / Chemical Physics 367 (2010) 27–35
temperature relaxation events in disordered (non-ergodic) matri-ces. That is, there is a hierarchy of configurational relaxation eventstriggered by electronic excitation that lead to hole formation. Sin-gle-molecule spectroscopy has revealed that there are very largespectral jumps of the order of inhomogeneous broadening (Cinh),as well as very small (more probable) spectral jumps (especiallyin protein systems) and jumps on an intermediate level, each typeof jump evidently reflecting different tiers of the energy landscape(see Refs. [17,18], and references therein).
Over the years, NPHB spectroscopy has provided a great deal ofinsight into the S1(Qy)-excited state electronic structure and exci-tation energy transfer (EET) dynamics of protein–chlorophyll (Chl)complexes at low temperatures. Holes can be burned resonantly—where a very narrow (relative to Cinh) hole termed the zero-pho-non hole (ZPH) can be burned into the S1(Qy)-excited state—andnon-resonantly (broad holes) by excitation into higher-energy ex-cited states (e.g. the Qx and Soret bands) or in the case of photosyn-thetic complexes into the absorption bands of other pigments(such as carotenoids) which efficiently transfer excitation energyto the pigments under consideration. An important feature to bearin mind here is that there is generally assumed to be no correlationbetween the transition energies of different excited states; such anabsence of correlation has been observed for many photosyntheticcomplexes [11,19]. HB via non-resonant excitation (into higherelectronic states) is the subject of this manuscript (a similardescription of resonant HB is being prepared for publicationelsewhere).
The NPHB process is further complicated in photosyntheticcomplexes due to the presence of excitation energy transfer(EET) between various excitonic states within a given complex. Adescription of the effects of EET on the measured ZPH action spec-trum in photosynthetic complexes has recently been provided byZazubovich and Jankowiak [20], but important work remains tobe done on this subject, particularly concerning the distributionof photoproduct in the post-burn spectrum. At present, the phononsideband structure (including anti-holes) observed in resonant HBspectra in many photosynthetic complexes is still being fitted withthe standard master equation (which was developed to account forthe hole shape produced by isolated impurities embedded inglasses [21,22]), while NLN HB spectra have for many years beenmodeled using simple Gaussian curves [14,23,24]. Since EET canrather significantly alter the observed shapes of both resonantand non-resonant HB spectra (as well as line-narrowed fluores-cence spectra), a thorough understanding of these effects is crucialfor accurate interpretation of a variety of experimental data, espe-cially the broad photoproduct distributions observed in both reso-nant and non-resonant HB experiments. Although excitonic MonteCarlo simulations [15] include each of these effects automatically,the individual effects are difficult to distinguish from one another,providing little physical insight into the underlying processes atwork.
A better understanding of photoproduct distributions in non-resonant HB spectroscopy is especially important in that very dif-ferent interpretations have been proposed in the literature for anumber of spectral features, particularly the broad, positive featureoften observed far to the blue of the pre-burn site distributionfunction (SDF) in the HB spectra of excitonically coupled systems[14,24–26]. Krausz and coworkers have proposed that this blue-shifted photoproduct is due to a suggested novel process referredto as ‘photoconversion’ involving Chl-protein hydrogen bonding[14,27]. In contrast, we have suggested [15] that these featurescan be rather simply explained by the NPHB process if excitonicinteractions and EET are taken into account. In particular, we haveproposed that the high-energy photoproduct in persistent HB spec-tra originates from regular NPHB accompanied by the redistribu-tion of oscillator strength due to modified post-burn excitonic
interactions. We have argued that the photoconversion process(suggested to occur via tunneling between alternate configurationsof the C@O� � �H–protein hydrogen bond when the molecule is inthe excited state [14,27]) while feasible, is not required to accountfor the strong positive absorption increase in the saturated HBspectra [15].
In order to build a more accurate fundamental understanding ofthe processes at work in NPHB, we present here a model for non-resonant HB spectra, including the effects of EET, and focusing onthe observed anti-hole and photoproduct distribution (modelingstudies of resonant holes in excitonically coupled chromophoreswill be reported elsewhere). For the current calculations, we as-sume that the photoproduct distribution is identical with thepre-burn SDF for the burned pigment, and that pre- and post-burnsite energies are uncorrelated. It is shown that the (non-excitonic)statistical redistribution of pigment site energies due to selectiveexcitation of low-energy pigment(s) and the redistribution of exci-tonic transition energies significantly affect the shape of the anti-hole, often producing rather surprising results. The main goal ofthis paper is to address in more detail the question of how the exci-tonic structure of simple homogeneous and heterogeneous dimers,as well as the multi-chromophoric assemblies often encounteredin photosynthetic complexes, manifests itself in non-resonant HBspectra. We anticipate that this work will provide a theoreticalfoundation to advance our understanding of NLN HB spectra in avariety of complex biological systems, providing a crucial frame-work for probing their electronic structures.
2. Results
2.1. Uncorrelated excitation energy transfer model
Following the model of uncorrelated EET [20], we consider a di-mer of two chromophores denoted A and B which are linked byefficient Förster [28] energy transfer; in particular, we assume thatin any given dimer, energy transfer between the two chromoph-ores is much more efficient than the HB quantum yield. Underthese conditions, excitation of the A-type pigment can result inHB only if energy transfer is impossible, i.e. if the excitation energyxA of the A-type pigment is lower than that of its B-type partner,xB. Likewise, excitation of the B-type pigment can result in HB onlyif xB is lower than xA. For HB purposes, then, we are interested inthe distribution of A- and B-type trap states (states which are inca-pable of energy transfer) rather than in simply the SDF for the twopigment types.
This situation is illustrated schematically in Fig. 1 which showsthe site energies of the A- and B-type pigments in two representa-tive realizations of disorder (Frames A and B) for such a system. Inboth frames, the solid and dashed curves show the SDF for the Aand B pigments, respectively, while the corresponding verticalsticks represent the actual excitation energies for each pigmentin a particular single randomly selected dimer. Frame A showsthe more likely scenario in which xA < xB so that the A-type pig-ment is a trap state; in this case, HB can occur at frequency xA,but not at xB. Frame B shows the alternative situation (which isless likely, but still possible due to disorder) in which xB < xA sothat HB can occur only at xB .
More quantitatively, let fA(x) and fB(x) represent the SDFs (i.e.probability density functions) for the zero-phonon line (ZPL)absorption energies of the A-type and B-type pigments, respec-tively. That is, if we consider a single randomly selected dimer,and take xA to be the ZPL frequency of the A-type pigment andxB to be the ZPL frequency of the B-type pigment, thenP(xA �x) = fA(x) and P(xB �x) = fB(x). Note that we assume that
ωA ωB
ωAωB
Frequency
A
B
Fig. 1. Schematic representation of the uncorrelated EET model. Each frameshows the site energies of A- and B-type pigments in a particular realization ofenergetic disorder (chosen from the smooth distribution curves in the back-ground). In both frames, solid lines indicate A-type pigments, and dashed linesindicate B-type pigments. Frame A represents the more likely situation in whichpigment A transfers energy to pigment B. Frame B represents the less likely (butpossible due to disorder) situation in which pigment B transfers energy topigment A.
fA(ω) fB(ω)
LA(ω)
UA(ω)
UB(ω)
LB(ω)
-300 -200 -100 0 100 200 300 4000
0.001
0.002
0.003
0.004
0.005
Frequency (cm-1)
Fig. 2. Distribution functions for trap pigments L(x) (red curves) and transferringpigments U(x) (blue curves) calculated using the uncorrelated EET model withpigment distribution functions shown in black. Solid curves represent A-typepigments, while dashed curves represent B-type pigments (also see labels in thefigure).
M. Reppert et al. / Chemical Physics 367 (2010) 27–35 29
the ZPL frequencies of the A and B pigments are uncorrelated, sothat in any given complex xA is independent of xB.
Observe first that the probability of finding an A-type pigmentcapable of energy transfer at frequency x is simply the joint prob-ability that xA �x and that xB < x, i.e. P(xA �x) � P(xB < x). Ifwe denote the probability density function for A-type pigmentswhich are capable of energy transfer as UA(x) and the probabilitydensity function for A-type trap states as LA(x) (‘U’ and ‘L’ for‘upper’ and ‘lower’ components, respectively), we have:
UAðxÞ ¼ PðxA � xÞ � PðxB < xÞ ¼ fAðxÞ �Z x
�1fBðtÞdt ð1Þ
LAðxÞ ¼ PðxA � xÞ � PðxB > xÞ ¼ fAðxÞ � 1�Z x
�1fBðtÞdt
� �ð2Þ
Equivalent expressions hold for the B-type distributions (with the Aand B subscripts switched). These curves are illustrated in Fig. 2 fortwo Gaussian distribution functions fA(x) (solid black curve) andfB(x) (dashed black curve) with the same width (200 cm�1) butwith distribution B shifted by 100 cm�1 toward higher energy.
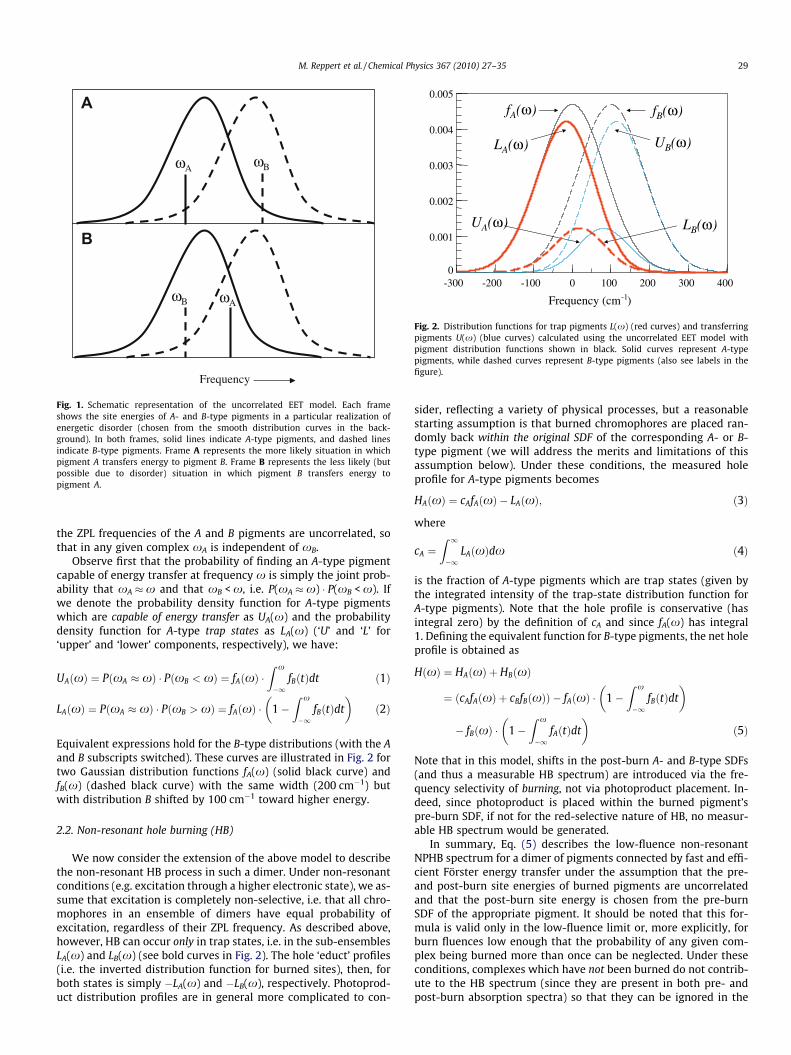
2.2. Non-resonant hole burning (HB)
We now consider the extension of the above model to describethe non-resonant HB process in such a dimer. Under non-resonantconditions (e.g. excitation through a higher electronic state), we as-sume that excitation is completely non-selective, i.e. that all chro-mophores in an ensemble of dimers have equal probability ofexcitation, regardless of their ZPL frequency. As described above,however, HB can occur only in trap states, i.e. in the sub-ensemblesLA(x) and LB(x) (see bold curves in Fig. 2). The hole ‘educt’ profiles(i.e. the inverted distribution function for burned sites), then, forboth states is simply �LA(x) and �LB(x), respectively. Photoprod-uct distribution profiles are in general more complicated to con-
sider, reflecting a variety of physical processes, but a reasonablestarting assumption is that burned chromophores are placed ran-domly back within the original SDF of the corresponding A- or B-type pigment (we will address the merits and limitations of thisassumption below). Under these conditions, the measured holeprofile for A-type pigments becomes
HAðxÞ ¼ cAfAðxÞ � LAðxÞ; ð3Þ
where
cA ¼Z 1
�1LAðxÞdx ð4Þ
is the fraction of A-type pigments which are trap states (given bythe integrated intensity of the trap-state distribution function forA-type pigments). Note that the hole profile is conservative (hasintegral zero) by the definition of cA and since fA(x) has integral1. Defining the equivalent function for B-type pigments, the net holeprofile is obtained as
HðxÞ ¼ HAðxÞ þ HBðxÞ
¼ ðcAfAðxÞ þ cBfBðxÞÞ � fAðxÞ � 1�Z x
�1fBðtÞdt
� �
� fBðxÞ � 1�Z x
�1fAðtÞdt
� �ð5Þ
Note that in this model, shifts in the post-burn A- and B-type SDFs(and thus a measurable HB spectrum) are introduced via the fre-quency selectivity of burning, not via photoproduct placement. In-deed, since photoproduct is placed within the burned pigment’spre-burn SDF, if not for the red-selective nature of HB, no measur-able HB spectrum would be generated.
In summary, Eq. (5) describes the low-fluence non-resonantNPHB spectrum for a dimer of pigments connected by fast and effi-cient Förster energy transfer under the assumption that the pre-and post-burn site energies of burned pigments are uncorrelatedand that the post-burn site energy is chosen from the pre-burnSDF of the appropriate pigment. It should be noted that this for-mula is valid only in the low-fluence limit or, more explicitly, forburn fluences low enough that the probability of any given com-plex being burned more than once can be neglected. Under theseconditions, complexes which have not been burned do not contrib-ute to the HB spectrum (since they are present in both pre- andpost-burn absorption spectra) so that they can be ignored in the

A
HA(ω)- LA(ω)
cA·fA(ω)
fA(ω) fB(ω)
-0.0025
0
0.0025
-0.0002
0
0.0002
HB(ω)
- LB(ω)
cB·fB(ω)fA(ω) fB(ω)
B
f (ω) + f (ω)
30 M. Reppert et al. / Chemical Physics 367 (2010) 27–35
HB calculation. A complete fluence-dependent expression reflect-ing the continuous shift in the pigment SDFs induced by non-reso-nant HB can be obtained by successively considering multiple-burnSDFs (i.e. the SDF for A and B pigments after one burn, two burns,three burns, etc.). The net HB spectrum is then obtained by sum-ming these individual expressions scaled by the appropriate prob-ability of finding a complex which has been burned once, twice,three times, etc. for a given burn fluence (a Poisson distribution).Such fluence-dependent calculations, however, are beyond thescope of this paper. For the present we note only that the shapeof any hole-burned within the low-fluence regime will be accu-rately reflected by Eq. (5), although the depth of the hole will de-pend on the exact fluence used.
2.3. Examples and limiting cases
As an instructive example, we consider first the degenerate casediscussed by Zazubovich and Jankowiak [20], i.e. fA(x) = fB(x) �f(x) where f(x) is a Gaussian distribution function. By symmetry,we have
UðxÞ � UAðxÞ ¼ UBðxÞ ¼ f ðxÞ �Z x
�1f ðtÞdt
LðxÞ � LAðxÞ ¼ LBðxÞ ¼ f ðxÞ � 1�Z x
�1f ðtÞdt
� �ð6Þ
(Recall that although pigments A and B have the same site energy,their excited states are not delocalized as excitonic coupling was as-sumed to be very small and Förster theory [28] describes the EETbetween these states.) Furthermore, it is clear that c �R1�1 LðxÞdx ¼ 1
2 so that the hole profile is simply
HðxÞ ¼ 12
f ðxÞ þ 12
f ðxÞ� �
� f ðxÞ � 1�Z x
�1f ðtÞdt
� �
� f ðxÞ � 1�Z x
�1f ðtÞdt
� �
¼ f ðxÞ � 2 � f ðxÞ � 1�Z x
�1f ðtÞdt
� �
¼ f ðxÞ � 2 � LðxÞ ¼ UðxÞ � LðxÞ ð7Þ
The measured hole profile, then, is just the difference between thehigher- and lower-energy distributions U(x) and L(x) .
This case is illustrated in Fig. 3. Note that although HB takesplace across the entire ‘educt’ curve �2 � L(x), the measured hole
H(ω)
-0.005
0
0.005
0.010
-300 -150 0 150 300
( )ωf
Frequency (cm-1)
( )ωL⋅− 2
( )( ) ( )ωω
ω
BA ff
f
+=⋅2
Fig. 3. Calculated HB spectrum H(x) for a degenerate dimer. See text for details.Also shown are the total pigment SDF 2f(x), the HB educt distribution �2L(x), andthe photoproduct distribution f(x).
profile is negative only in the extreme low-energy region sinceHB at higher energies is effectively ‘canceled’ by the distributionof photoproduct across the original SDF f(x). The result is a holeprofile which is red-shifted in comparison both with the originalSDF (as observed by Zazubovich and Jankowiak [20]) and withthe low-energy sub-ensemble L(x). It should be noted that becausenon-resonant excitation results in significant hole-refilling, theapparent HB efficiency is much lower than for resonant HB. Forthe degenerate example considered in Fig. 3, the maximum frac-tional hole depth is in fact only �31% of what would be observedin a resonantly burned hole. However, as we will see in later exam-ples, this response is in fact rather efficient when compared withnon-degenerate situations.
Fig. 4 shows an intermediate case in which both distributionfunctions are Gaussians with full widths at half maximum (FWHM)equal to 200 cm�1, but the B-type distribution function is blue-shifted by 200 cm�1. In this case, the trap-state A-type distributionLA(x) accounts for nearly all of the A-type pigments, so that thefraction cA of A-type pigments which undergo burning is nearlyone, i.e. cA ¼
R1�1 LAðxÞdx � 0:952. Conversely, UB(x) accounts
A B
-300 -150 0 150 300 450
-0.0004
0
0.0004
HB(ω)
HA(ω)
H(ω) C
Frequency (cm-1)
Fig. 4. Calculated HB spectra for a non-degenerate dimer of two identical pigmentswith Gaussian SDFs with the same width (200 cm�1) but shifted by 200 cm�1 fromone another. Frame A shows the calculated HB spectrum HA(x) for A-type pigmentstogether with both pigment SDFs fA(x) and fB(x) and the HB educt �LA(x) andphotoproduct cAfA(x) curves. Frame B shows the corresponding curves for HB of B-type pigments (note that the scale is adjusted for convenience due to the muchlower fraction of B-type pigments which undergo HB). Frame C shows the net HBspectrum H(x) (bold curve) together with the individual contributions from A- andB-type pigments (from Frames A and B) along with the combined SDFs for bothpigments (dotted curve).

M. Reppert et al. / Chemical Physics 367 (2010) 27–35 31
for nearly all of the B-type pigments, so that cB ¼R1�1 LBðxÞdx is
correspondingly small, cB � 0.048. Frame A of Fig. 4 shows theresultant HB spectra for A-type pigments. Note that althoughnearly all of the A-type pigments undergo HB, because the shapeof the photoproduct and photoeduct curves are so similar, thenet measured hole HA(x) is very weak (the fractional hole depthat the deepest point is only �4.4%).
Frame B of Fig. 4 shows the same curves for burning of B-typepigments. The most important point to notice here is that, althoughonly a very small fraction of B-type pigments participate in HB, be-cause the educt distribution �LB(x) is shifted far to the red of theSDF (where photoproduct is placed), those few pigments which doburn produce a significant hole. The maximum hole depth is in fact�16% deeper than that observed for burning of the A-type pig-ments above.
Frame C of Fig. 4 shows the net result of burning of both types ofpigments. The net hole is, of course, rather weak; for comparison,the sum of the two pigment distribution functions fA(x) + fB(x) isalso shown in Frame C (scaled by 0.1 to approximately match thehole intensity). An interesting feature of these spectra is that whilethe negative feature of the hole spectrum peaks near the maximumof the A-type distribution function fA(x), the positive feature peaksmuch nearer to the maximum of the B-type distribution function.Essentially, one can think of the positive feature of the A-type hole‘canceling out’ the negative feature of the B-type hole, so that thenet curve consists of a ‘hole’ reflecting A-type pigments and an‘anti-hole’ reflecting B-type pigments.
As the separation between the A and B distribution functions in-creases, these trends become even more pronounced. Fig. 5 showsthe total SDF profile normalized together with the total hole profilefor three cases: fB(x) = fA(x) (upper set), fB(x) = fA(x + 200) (mid-dle set), and fB(x) = fA(x + 400) (bottom set). We hasten to empha-size that because the curves have been normalized, the figure doesnot reflect the drastically decreasing apparent burning efficiency inthe three cases. Taking the maximum hole depth of the degeneratecase (fA(x) = fB(x)) as a reference, the relative hole depth of theremaining cases are 33% and 0.21%, respectively.
The essential point to notice here is that as separation betweenthe SDF peaks increases, the negative features in the measured HB
-300 -150 0 150 300 450 600
fB(ω) = fA(ω)
fB(ω) = fA(ω - 200)
fB(ω) = fA(ω - 400)
Frequency (cm-1)
OD
, ΔO
D (
a. u
.)
Fig. 5. Calculated HB spectra for the three cases: fB(x) = fA(x) (upper set),fB(x) = fA(x + 200) (middle set), and fB(x) = fA(x + 400) (bottom set); all units arein cm�1, and in each case the individual SDFs were modeled as Gaussians withFWHM = 200 cm�1. In each frame, the dashed curve is the HB spectrum, and thesolid curve is the sum of the pigment distribution functions (0–0 absorptionspectrum). The SDFs are scaled to 21% (Frame A), 6.4% (Frame B), and 0.044% (FrameC) of their actual intensities in order to allow easy comparison with thephotoproduct distributions.
curve increasingly reflect the shape of fA(x) alone, while the posi-tive features come to reflect fB(x). As separation increases, theshape of the measured hole spectrum seems to approachfA(x) � fB(x) (although since burning efficiency decreases drasti-cally as separation increases, the absolute intensity of the holespectrum also goes to zero).
2.4. Distinct oscillator strengths
To this point, we have assumed that we are dealing with a di-mer of pigments with equal oscillator strengths. In general, thiswill often not be the case, especially in that the very excitonicinteractions which allow for efficient energy transfer are likely toaffect not only the transition energies of the excitonic states ofthe coupled system, but also the transition oscillator strengths. Inthis section, we will address the effects of this type of excitonicinteraction on the observed hole shapes.
As a first example, we consider a weakly coupled heterodimer,where the pigments A and B have different oscillator strengths.As above, we assume for the present that the excitonic transitionsare essentially localized on the two pigments, allowing us to treatthe A and B distribution functions separately. (One example of sucha system might be a weakly coupled Chl a/Chl b heterodimer.) Themeasured absorption spectrum is then given by
AðxÞ ¼ lAfAðxÞ þ lBfBðxÞ; ð8Þ
where lA and lB are the oscillator strengths of the two transitions1.The HB spectra are likewise given as H(x) = HA(x) + HB(x) with
HiðxÞ ¼ liðcifiðxÞ � LiðxÞÞ ð9Þ
for i = A, B and ci ¼R1�1 LiðxÞdx and LiðxÞ ¼ fiðxÞð1�
Rx�1 fiðtÞdtÞ as
in Eqs. (2) and (4).Fig. 6 shows the results of such calculations for a pigment dimer
where lA = 3 � lB (left side, Frames A–C) and lB = 3 � lA (right side,Frames D–F). Each frame shows the calculated HB spectrum (solidline) compared with the corresponding HB spectrum from Fig. 5(dashed curves) and absorption spectrum A(x) = lAfA(x) + lBfB(x)(uniformly positive solid curve). Again, spectra are scaled arbi-trarily to allow for convenient comparison. As comparison of thedashed and solid HB spectra in Fig. 6 reveals, the effect of differentoscillator strengths depends strongly on the shift between the twodistribution functions. For the degenerate case, the only effect is tolower the apparent burning efficiency by half. For a moderate shiftbetween the SDFs (Frame B), the apparent burning efficiency re-mains relatively unchanged, but the hole shifts slightly to eitherthe red or the blue. For large SDF shifts (Frame C), on the otherhand, these effects can become quite significant, introducing astrong two-peak shape into either the negative or positive featuresof the hole spectrum.
2.5. Multiple distributions
We will comment only briefly on the application of the currentmodel to oligomers where there may be multiple more or lessoverlapping pigment distributions since the qualitative featuresof these complexes are for the most part unchanged from thoseof a dimer. It is worth noting, however, that the model describedabove can be easily extended to such situations. Using integers1, . . . , N to represent each of N pigments (in place of our A/B nota-tion for the two-pigment case), we have
1 We should also note at this point that we are considering here only theabsorption due to the pure electronic transition, neglecting both phonons andvibrational modes; the bulk absorption and emission spectra can be approximated byconvoluting the A(x) terms defined above with the appropriate single-site profiles.

Frequency (cm-1)-300 0 300 600
A
B
C0 300 600
D
E
F
OD
, ΔO
D (
a. u
.)
Fig. 6. Calculated HB spectra for heterodimers in which the two pigments have different oscillator strengths: lA = 3lB (right side, Frames A–C) or lB = 3lA (left side, FramesD–F). In each frame, the dashed uniformly positive curve is the sum of the pigment SDFs (scaled to match the HB spectra), the solid conservative curve is the calculated HBspectrum, and the dashed conservative curve is the corresponding HB spectrum from Fig. 5 (equal oscillator strengths).
Frequency (cm-1)-300 -150 0 150 300 450
-0.0025
0
0.0025
0.005
0.0075
0.01
f1(ω) = f2(ω) f3(ω) = f1(ω - 200)
f1(ω) + f2(ω) + f3(ω)
H(ω)
Fig. 7. Calculated HB spectrum for a trimer consisting of two pigments withidentical SDFs f1(x) = f2(x) and a third pigment with SDF f3(x) shifted by 200 cm�1
to the higher energy. The three SDFs are represented as long-dashed curves, whiletheir sum is shown as a solid line. The solid HB curve is the calculated HB spectrum,and is compared with the HB spectrum calculated for the degenerate two-pigmentcase from Fig. 3 (bold dotted curve). Note that the two HB spectra are essentiallyidentical, reflecting the fact that HB in the trimer is dominated by the twodegenerate distributions.
32 M. Reppert et al. / Chemical Physics 367 (2010) 27–35
L1ðxÞ ¼ Pðx1 � xÞ � Pðx2 > xÞ � Pðx3 > xÞ � � � PðxN > xÞ
¼ f1ðxÞ � 1�Z x
�1f2ðtÞdt
� �
� 1�Z x
�1f3ðtÞdt
� �� � � 1�
Z x
�1fNðtÞdt
� �ð10Þ
and
U1ðxÞ ¼ f1ðxÞ � L1ðxÞ
¼ f1ðxÞ � 1� 1�Z x
�1f2ðtÞdt
� �� 1�
Z x
�1f3ðtÞdt
� ��
� � � 1�Z x
�1fNðtÞdt
� ��ð11Þ
or, more generally, for pigment i (1 6 i 6 N)
LiðxÞ ¼ Pðxi � xÞ �YN
j¼1j–i
Pðxj > xÞ
¼ fiðxÞ �YN
j¼1j–i
1�Z x
�1fjðtÞdt
� �ð12Þ
and
UiðxÞ ¼ fiðxÞ � LiðxÞ ¼ fiðxÞ � 1�YNj¼1j–i
1�Z x
�1fjðtÞdt
� �2664
3775: ð13Þ
The formulas for the HB spectra are from this point essentially iden-tical to the dimer case, aside from summing over all N single-pig-ment hole profiles rather than only over A and B, i.e.
HðxÞ ¼XN
i¼1
HiðxÞ ¼XN
i¼1
liðcifiðxÞ � LiðxÞÞ ð14Þ
where li is the oscillator strength of the ith pigment and ci is de-fined as above in Eq. (4).
One point that is worth noting here is that since the apparentHB efficiency in near-degenerate dimers is drastically higher than
for non-degenerate dimers (e.g. Fig. 5 Frame A compared withFrame C), if a system with multiple pigment distributions hastwo (or more) distributions which are quasi-degenerate and signif-icantly lower in energy than the others, these quasi-degeneratestates will dominate the HB spectrum. In such systems, one caneasily disregard the higher-energy distributions in analyzing theHB spectrum. An example is presented in Fig. 7, which shows thecalculated HB spectrum for a trimer in which two pigment distri-bution functions f1(x) and f2(x) are degenerate and significantlyred-shifted from the third distribution function f3(x) = f1(x � 200).Note that if we ignore the third distribution function, the situationis identical to the degenerate case shown in Fig. 3. As expected, thecalculated hole spectrum from Fig. 3 (thick dotted line) is virtuallyidentical to the hole spectrum calculated with all three distribu-tions included (solid-line HB spectrum).

14700 14900 15100 15300 15500
Frequency (cm-1)
OD
, ΔO
D (
a. u
.)
Fig. 8. Comparison of HB and absorption spectra for the trimer of Fig. 7 calculatedwith excitonic interactions other than EET neglected as in Fig. 7 (long-dashed curve)and with excitonic interactions explicitly accounted for via Monte Carlo simulations(solid curves). For the excitonic calculations, all SDFs are shifted slightly (the centervalues are e1 = 15,013 cm�1, e2 = 15,187 cm�1, e3 = 15,000 cm�1, respectively) inorder to best approximate the absorption curve in Fig. 7. Inter-pigment couplingsare set at 100 cm�1 between pigments 1 and 3 and 10 cm�1 between pigment 2 andboth pigments 1 and 3. The transition dipole moments of the three pigments arechosen to be mutually perpendicular in order to restrict all excitonic transitions tohave equal oscillator strength.
M. Reppert et al. / Chemical Physics 367 (2010) 27–35 33
3. Discussion
As noted at the start, for simplicity, the model discussed aboveaccounts only for the statistical redistribution of pigment transi-tion energies due to energy transfer in non-resonant HB and notfor the effects of excitonic coupling itself. Although an extendeddiscussion of such effects is beyond the scope of this paper, wewish to emphasize two points regarding excitonic interactions.
First, as has recently been demonstrated both experimentallyand theoretically for the CP43 [15,25] and CP47 [29] complexesof Photosystem II, such effects can very strongly affect the shapeof the measured HB spectrum. In Ref. [15], these effects were ratio-nalized in terms of the ‘‘redistribution of oscillator strength” due tomodified excitonic interactions after HB occurs. This model is intu-itively appealing and provides a convenient qualitative descriptionof observed experimental data (Ref. [15,25] plus unpublisheddata). To avoid confusion, it is worth pausing for a moment to clar-ify what this phrase means, as several interpretations could be con-sidered, and since an exact definition was not given in Ref. [15]. Inits most general usage, ‘‘redistribution of oscillator strength” couldrefer to any type of change between the average pre- and post-burn oscillator strengths of the various excitonic states absorbingat a particular frequency. This definition is very broad, however,including a number of distinct effects, and for our purposes, we re-strict our definition of ‘‘oscillator strength redistribution” to meanthe following: as site energies are modified by HB (most likely viatunneling in the excited state [12]), the lower-energy pigments aregradually shifted, resulting in a change (usually a lessening) of theaverage gap between the site energies of the coupled pigments; asa result, the average distribution of oscillator strength between thehigher- and lower-energy components of the absorption spectrabegins to change. For example, if pigment orientations are suchthat in the pre-burn absorption spectrum the higher-energy transi-tion ‘‘steals” oscillator strength from the lower-energy transition,this effect may be amplified in the post-burn absorption spectrum,producing an apparent distribution of ‘‘photoproduct” in the high-energy region. It is this effect which we refer to as ‘‘oscillatorstrength redistribution” in what follows. We pause here to makethis definition more precise since in complex systems, other quitedifferent effects may exist which result in changes in the averageoscillator strength of a particular excitonic state. For example, ifstatistical re-shuffling of pigment transition energies results in dif-ferent pigments contributing to the ith excitonic state in the post-burn spectrum than in the pre-burn spectrum, it is likely that theoscillator strength of the ith excitonic state will be affected, eventhough excitonic interactions in the complex remain essentiallyunaltered.
Second, we wish to point out that in addition to these oscillatorstrength effects, excitonic interactions modify HB spectra simplyby shifting the transition energies of higher-energy excitonic com-ponents, i.e. without either burning the corresponding pigments ornecessarily altering the relative oscillator strengths of the transi-tions involved. This can be most easily demonstrated by consider-ing the HB spectrum of an excitonically coupled system in whichall involved pigments have identical transition dipole strengthsand perpendicular transition dipole moments. In such a system,all transitions must have equal oscillator strengths, regardless ofthe couplings or site energies of the pigments, so that oscillatorstrength redistribution effects are by definition excluded. Fig. 8shows the calculated absorption and HB spectra for such a hypo-thetical trimer in which pigments 1 and 2 are strongly coupledto each other (100 cm�1) and pigment 3 is more weakly coupled(10 cm�1) to both pigments 1 and 2. (The spectrum is calculatedusing a Monte Carlo method similar to that described in Ref. [15]with post-burn site energies placed randomly within the original
pigment distribution functions.) The site energies of the pigmentsare chosen to approximately reproduce the absorption spectrumshown for the decoupled trimer shown in Fig. 7 (the site energiesfor the three pigments are e1 = 15,013 cm�1, e2 = 15,187 cm�1,e3 = 15,000 cm�1, respectively); however, as is apparent from thefigure (the long-dashed curves are the HB and absorption spectrafrom Fig. 7) the shape of the HB spectrum is significantly differentin the high-energy region, reflecting the complicating effects ofexcitonic interactions on the transition frequencies in the photo-product distribution. Indeed, if one were interpreting the spectrumwithout any knowledge of the excitonic interactions between thepigments, one might easily conclude that the photoproduct fromthe low-energy hole was placed in two separate distributions,one at high energy (solid arrow) and one at low energy (dashed ar-row). We wish to emphasize once again (see Section 2.5) that thedirect contribution of distribution 2 to the HB spectrum is negligi-ble (as demonstrated in Fig. 7); the apparent ‘‘photoproduct” distri-bution near 15,200 cm�1 is due to modified excitonic interactionsbetween pigment 1 and pigment 2. Briefly, one can rationalizethese effects by recognizing that a gradual blue-shift of the low-er-energy pigment SDF will result in a corresponding (althoughpossibly weaker) blue-shift of the transition energies of the upperexcitonic component, even though the site energies of the moreblue-shifted pigments are unchanged. Again, we emphasize thatthis effect is independent of the pre-burn and post-burn oscillatorstrengths of the transitions (as clearly demonstrated in this case,since the perpendicular transition dipole moments ensure thatall transition oscillator strengths are equal); a detailed consider-ation of the effects of oscillator strength redistribution itself is con-sidered elsewhere [30].
Disentangling the contributions of excitonic effects from thenon-excitonic statistical effects discussed earlier in the paper is,unfortunately, quite complex in multi-chromophore systems.Although these simple examples clearly demonstrate that multipleeffects are present, they offer only limited insight into how each ofthese effects will play out in experimental spectra. When possible,the best approach to analyzing experimental data seems to beMonte Carlo simulations of the type described in Refs. [15,29]and used in calculating the solid curves in Fig. 8. Since these meth-

34 M. Reppert et al. / Chemical Physics 367 (2010) 27–35
ods include disorder directly by averaging over a large number ofindividual samples, they automatically include all three of the ef-fects discussed above. However, such methods are not of them-selves very intuitively satisfying, and they offer no explicitphysical explanation for the processes they model. Beyond the sta-tistical models presented here, such a description requires a moredetailed analysis of HB spectra in excitonically coupled systems[30].
It is important to note that the assumption that the photoprod-uct distribution function is identical to the pre-burn SDF is mostlikely not generally true. Indeed, after many years of HB in a varietyof systems, it has been concluded that photoproduct is generallyblue-shifted slightly from the pre-burn distribution function, whilein Ref. [15], a red-shift was required to fit the experimental anti-hole. The nature of these shifts evidently depends on the complex-ity of the protein/glass configurational space and, in particular, onthe nature of the multi-level systems coupled to the pigments con-tributing to the lowest excitonic state. As described briefly in Sec-tion 1, it has even been suggested in certain cases inphotosynthetic complexes [14] that HB photoproduct may beplaced in distributions far outside the original pigment SDF as a re-sult of site-specific modifications in pigment–protein hydrogenbonding.
With regard to the dramatic site energy shifts proposed byHughes et al. [14], we can only comment that although such shiftsare by no means precluded by our results (and could well exist un-der certain circumstances), since the effects described in this paperand in Ref. [15] can rather simply explain the HB spectral featureswhich inspired their suggestion, we believe that the great majorityof currently published HB data in excitonically coupled systems(including those of Ref. [14] as demonstrated in Ref. [15]) can beexplained without resorting to such novel physical processes. Thesame is true for non-resonant holes in the CP47 complex [29]and a variety of other pigment–protein complexes studied in ourlaboratory (manuscripts in preparation).
On the other hand, slight photoproduct shifts of the type ob-served in a large number of HB systems over the years will havea fairly weak effect on HB in systems with near-degenerate distri-bution functions, but may have quite pronounced effects on HB insystems with strongly non-degenerate distribution functions(since the apparent HB efficiency for the lowest state will drasti-cally increase). In this light, the strongly non-degenerate examplesgiven above (particularly the lowest set of curves in Figs. 5 and 6)should for now be taken as extreme cases which are useful forillustrating underlying concepts but which may or may not findpractical analogues. Further experimental and theoretical investi-gation into photoproduct distributions in both resonant and non-resonant HB spectra is clearly required for a complete analysis ofHB in these complex systems. However, the assumption that pho-toproduct is placed approximately within the original SDF has pro-duced excellent agreement with experimental data in HBsimulations for a variety of excitonically coupled systems (Refs.[15,29] and unpublished data), and provides a very useful startingassumption for the complex task of disentangling the underlyingmechanisms of both resonant and non-resonant HB. Indeed, calcu-lations of the type presented above may ultimately provide a con-venient means of testing various photoproduct models as moreexperimental data is gathered which either confirms or contradictsthe results presented here for non-degenerate distributionfunctions.
A final comment is in order regarding the multiple ‘tiers’ of dis-order that are likely to be observed in the HB mechanisms of com-plex systems such as protein complexes. As discussed in Section 1,single-molecule spectroscopy has revealed that the magnitude ofobserved site energy ‘jumps’ may vary widely from quite large(on the order of hundreds of cm�1, although still essentially within
the pre-burn SDF) to very small (on the order of a few cm�1)[17,18]. A complete consideration of various tier of the protein en-ergy landscape is beyond the scope of this manuscript, but we wishto note here only that the effects of small jumps on non-resonantHB spectra are expected to be rather small except in cases ofstrongly non-degenerate distribution functions (unpublishedobservations) where, due to the extremely low apparent HB effi-ciency, any change in photoproduct distribution is likely to pro-duce significant changes in the HB spectrum (as just discussedregarding photoproduct shifts). In contrast, multiple distributions(i.e. a complex tier of the protein energy landscape) appear to beimportant in modeling the sharp anti-holes which are frequentlyobserved evenly distributed (i.e. ±15–20 cm�1) about the ZPH inresonant HB spectra (to be submitted).
4. Conclusions
Models are presented for simulation of non-resonant HB spectrain model dimers and multi-chromophore systems coupled by effi-cient EET, guided by experimental observations of HB in variousphotosynthetic complexes [14,15,24,26]. Formulas are given forHB spectra in systems where excitonic interactions are sufficientlyweak to be neglected (aside from the effects of EET) and photo-product is placed randomly within the pre-burn SDF of the burnedpigment. These analytical results are compared with Monte Carlosimulations in which excitonic interactions are explicitly takeninto account in order to disentangle a number of distinct effectsin determining the fundamental features of HB spectra. In particu-lar, we demonstrate that non-resonant HB in excitonically coupledsystems is strongly affected by at least three contributions: (1) the(non-excitonic) statistical redistribution of pigment site energiesdue to selective excitation of low-energy pigments; (2) alteredtransition energies of upper excitonic components (with fixed siteenergies); and (3) redistribution of excitonic transition oscillatorstrengths due to modified excitonic interactions in the post-burnpigment distributions. A thorough understanding of these underly-ing mechanisms in HB spectra is not only essential for accurateinterpretation of HB data in excitonically coupled systems, buthas proven very useful for probing the excitonic structure of pho-tosynthetic complexes such as CP43 [15] and CP47 [29].
Acknowledgment
This work was supported by the NSF Grant (CHE-0907958) andin part by the Kansas Technology Enterprise Corporation (KTEC)and the Center for Integration of Undergraduate and Graduate Re-search, Mathematics Department, Kansas State University.
References
[1] W.E. Moerner (Ed.), Topics in Current Physics, Persistent Spectral HoleBurning: Science and Applications, Springer-Verlag, New York, 1987. vol. 44.
[2] R. Jankowiak, J.M. Hayes, G.J. Small, Chem. Rev. 93 (1993) 1472.[3] J.L. Hughes, E. Krausz, in: R.A. Scott, Ch.M. Lukehart (Eds.), Applications of
Physical Methods to Inorganic and Bioinorganic Chemistry, John Wiley & Sons,Ltd., 2007.
[4] A. Sigl, M. Orrit, T. Reinot, R. Jankowiak, J. Friedrich, J. Chem. Phys. 127 (2007)084510.
[5] R. Purchase, S. Völker, Photosynth. Rev., in press.[6] R. Jankowiak, G.J. Small, Photosynth. React. Cent. 2 (1993) 133.[7] R. Hirschmann, J. Friedrich, J. Opt. Soc. Am. B 9 (1992) 811.[8] R. Hirschmann, W. Köhler, J. Friedrich, E. Daltrozzo, Chem. Phys. Lett. 151
(1988) 60.[9] M. Lindrum, S. Daehne, Phys. Status Solidi B 189 (1995) 51.
[10] S. De Boer, K.J. Vink, D.A. Wiersma, Chem. Phys. Lett. 137 (1987) 99.[11] T. Reinot, V. Zazubovich, J.M. Hayes, G.J. Small, J. Phys. Chem. B 105 (2001)
5083.[12] D. Grozdanov, T. Reinot, N. Herascu, R. Jankowiak, V. Zazubovich, J. Phys. Chem.
B, submitted for publication.[13] U. Bogner, R. Schwarz, Phys. Rev. B 24 (1981) 2846.

M. Reppert et al. / Chemical Physics 367 (2010) 27–35 35
[14] J.L. Hughes, R. Picorel, M. Seibert, E. Krausz, Biochemistry 45 (2006) 12345.[15] M. Reppert, V. Zazubovich, N.C. Dang, M. Seibert, R. Jankowiak, J. Phys. Chem. B
112 (2008) 9934.[16] T. Reinot, N.C. Dang, G.J. Small, J. Chem. Phys. 119 (2003) 10404.[17] V.V. Ponkratov, J. Friedrich, J.M. Vanderkooi, A.L. Burin, Y.A. Berlin, J. Low
Temp. Phys. 137 (2004) 289.[18] C. Hofmann, T.J. Aartsma, H. Michel, J. Koehler, Proc. Natl. Acad. Sci. USA 100
(2003) 15534.[19] R.I. Personov, Site selection spectroscopy of complex molecules in solutions
and its applications, in: V.M. Agranovich, R.M. Hochstrasser (Eds.),Spectroscopy and Excitation Dynamics of Condensed Molecular Systems,North Holland, Amsterdam, 1983, p. 555.
[20] V. Zazubovich, R. Jankowiak, J. Lumin. 127 (2007) 245.[21] J.M. Hayes, J.K. Gillie, D. Tang, G.J. Small, Biochim. Biophys. Acta/Bioenerg. 932
(1988) 287.
[22] N.C. Dang, T. Reinot, M. Reppert, R. Jankowiak, J. Phys. Chem. B 111 (2007)1582.
[23] R. Jankowiak, V. Zazubovich, M. Ratsep, S. Matsuzaki, M. Alfonso, R. Picorel, M.Seibert, G.J. Small, J. Phys. Chem. B 104 (2000) 11805.
[24] J. Pieper, M. Raetsep, R. Jankowiak, K.-D. Irrgang, J. Voigt, G. Renger, G.J. Small,J. Phys. Chem. A 103 (1999) 2412.
[25] N.C. Dang, V. Zazubovich, M. Reppert, B. Neupane, R. Picorel, M. Seibert, R.Jankowiak, J. Phys. Chem. B 112 (2008) 9921.
[26] N.R.S. Reddy, R. Jankowiak, G.J. Small, J. Phys. Chem. 99 (1995) 16168.[27] J.L. Hughes, B.J. Prince, S.P. Arskold, E. Krausz, R.J. Pace, R. Picorel, M. Seibert, J.
Lumin. 108 (2004) 131.[28] T. Förster, Ann. Phys. 2 (1948) 55.[29] M. Reppert, K. Acharya, B. Neupane, R. Jankowiak, JACS, submitted for
publication.[30] M. Reppert, V. Naibo, R. Jankowiak, J. Chem. Phys., (2009), in press.