Modeling Preferences through Personality and Satisfaction to ...
31
Citation: Casto-Rivera, J.; Moralez-Rodriguez, M.L.; Rangel-Valdez, N.; Gomez-Santillan, C.; Aguilera-Vazquez, L. Modeling Preferences through Personality and Satisfaction to Guide the Decision Making of a Virtual Agent. Axioms 2022, 11, 232. https://doi.org/ 10.3390/axioms11050232 Academic Editor: Clemente Cesarano Received: 31 March 2022 Accepted: 13 May 2022 Published: 17 May 2022 Publisher’s Note: MDPI stays neutral with regard to jurisdictional claims in published maps and institutional affil- iations. Copyright: © 2022 by the authors. Licensee MDPI, Basel, Switzerland. This article is an open access article distributed under the terms and conditions of the Creative Commons Attribution (CC BY) license (https:// creativecommons.org/licenses/by/ 4.0/). axioms Article Modeling Preferences through Personality and Satisfaction to Guide the Decision Making of a Virtual Agent Jorge Castro-Rivera 1 , María Lucila Morales-Rodríguez 1 , Nelson Rangel-Valdez 2, * , Claudia Gómez-Santillán 1 and Luciano Aguilera-Vázquez 1 1 División de Estudios de Posgrado e Investigación, Tecnológico Nacional de México, Instituto Tecnológico de Ciudad Madero, Los Mangos 89440, Mexico; [email protected] (J.C.-R.); [email protected] (M.L.M.-R.); [email protected] (C.G.-S.); [email protected] (L.A.-V.) 2 División de Estudios de Posgrado e Investigación, CONACyT—Tecnológico Nacional de Mexico, Instituto Tecnológico de Ciudad Madero, Los Mangos 89440, Mexico * Correspondence: [email protected] Abstract: Satisfaction is relevant for decision makers (DM, Decision Makers). Satisfaction is the feeling produced in individuals by executing actions to satisfy their needs, for example, the payment of debts, jobs, or academic achievements, and the acquisition of goods or services. In the satisfaction literature, some theories model the satisfaction of individuals from job and customer approaches. However, considering personality elements to influence satisfaction and define preferences in strategies that optimize decision making provides the unique characteristics of a DM. These characteristics favor the scope of solutions closer to the satisfaction expectation. Satisfaction theories do not include specific elements of personality and preferences, so integrating these elements will offer more efficient decisions in computable models. In this work, a model of satisfaction with personality characteristics that influence the preferences of a DM is proposed. The proposed model is integrated into a preference-based optimizer that improves the decision-making process of a Virtual Decision Maker (VDM) in an optimization context. The optimization context addressed in this work is the product selection process within a food product shopping problem. An experimental design is proposed that compares two configurations that represent the cognitive part of an agent’s decision process to validate the operation of the proposed model in the context of optimization: (1) satisfaction, personality, and preferences, and (2) personality and preferences. The results show that considering satisfaction and personality in combination with preferences provides solutions closer to the interests of an individual, reflecting a more realistic behavior. Furthermore, this work demonstrates that it is possible to create a configurable model that allows adapting to different aptitudes and reflecting them in a computable model. Keywords: Decision Maker; satisfaction; personality; preferences; Virtual Decision Maker MSC: 93A30; 68T05 1. Introduction Satisfaction is a factor that represents the perception of individuals about the final result of a decision process, where elements such as cognitive effort and level of satisfaction intervene. Currently, organizations and institutions resort to strategies aimed at recognizing the expectation of satisfaction that meets the needs of decision makers (DM, Decision Maker). In this way, it is possible to offer goods and services closer to what the individual expects to obtain beyond their preferences. For example, the preference for dark clothing does not imply that any dark garment meets the individual’s expectations. Said garment may cover all the preferred search criteria (price, fabric quality, size, among others). However, it may be that the garment is not to Axioms 2022, 11, 232. https://doi.org/10.3390/axioms11050232 https://www.mdpi.com/journal/axioms
-
Upload
khangminh22 -
Category
Documents
-
view
1 -
download
0
Transcript of Modeling Preferences through Personality and Satisfaction to ...

�����������������
Citation: Casto-Rivera, J.;
Moralez-Rodriguez, M.L.;
Rangel-Valdez, N.; Gomez-Santillan,
C.; Aguilera-Vazquez, L. Modeling
Preferences through Personality and
Satisfaction to Guide the Decision
Making of a Virtual Agent. Axioms
2022, 11, 232. https://doi.org/
10.3390/axioms11050232
Academic Editor: Clemente Cesarano
Received: 31 March 2022
Accepted: 13 May 2022
Published: 17 May 2022
Publisher’s Note: MDPI stays neutral
with regard to jurisdictional claims in
published maps and institutional affil-
iations.
Copyright: © 2022 by the authors.
Licensee MDPI, Basel, Switzerland.
This article is an open access article
distributed under the terms and
conditions of the Creative Commons
Attribution (CC BY) license (https://
creativecommons.org/licenses/by/
4.0/).
axioms
Article
Modeling Preferences through Personality and Satisfaction toGuide the Decision Making of a Virtual AgentJorge Castro-Rivera 1 , María Lucila Morales-Rodríguez 1 , Nelson Rangel-Valdez 2,* ,Claudia Gómez-Santillán 1 and Luciano Aguilera-Vázquez 1
1 División de Estudios de Posgrado e Investigación, Tecnológico Nacional de México, Instituto Tecnológico deCiudad Madero, Los Mangos 89440, Mexico; [email protected] (J.C.-R.);[email protected] (M.L.M.-R.); [email protected] (C.G.-S.);[email protected] (L.A.-V.)
2 División de Estudios de Posgrado e Investigación, CONACyT—Tecnológico Nacional de Mexico,Instituto Tecnológico de Ciudad Madero, Los Mangos 89440, Mexico
* Correspondence: [email protected]
Abstract: Satisfaction is relevant for decision makers (DM, Decision Makers). Satisfaction is the feelingproduced in individuals by executing actions to satisfy their needs, for example, the payment of debts,jobs, or academic achievements, and the acquisition of goods or services. In the satisfaction literature,some theories model the satisfaction of individuals from job and customer approaches. However,considering personality elements to influence satisfaction and define preferences in strategies thatoptimize decision making provides the unique characteristics of a DM. These characteristics favorthe scope of solutions closer to the satisfaction expectation. Satisfaction theories do not includespecific elements of personality and preferences, so integrating these elements will offer moreefficient decisions in computable models. In this work, a model of satisfaction with personalitycharacteristics that influence the preferences of a DM is proposed. The proposed model is integratedinto a preference-based optimizer that improves the decision-making process of a Virtual DecisionMaker (VDM) in an optimization context. The optimization context addressed in this work is theproduct selection process within a food product shopping problem. An experimental design isproposed that compares two configurations that represent the cognitive part of an agent’s decisionprocess to validate the operation of the proposed model in the context of optimization: (1) satisfaction,personality, and preferences, and (2) personality and preferences. The results show that consideringsatisfaction and personality in combination with preferences provides solutions closer to the interestsof an individual, reflecting a more realistic behavior. Furthermore, this work demonstrates that itis possible to create a configurable model that allows adapting to different aptitudes and reflectingthem in a computable model.
Keywords: Decision Maker; satisfaction; personality; preferences; Virtual Decision Maker
MSC: 93A30; 68T05
1. Introduction
Satisfaction is a factor that represents the perception of individuals about the finalresult of a decision process, where elements such as cognitive effort and level of satisfactionintervene. Currently, organizations and institutions resort to strategies aimed at recognizingthe expectation of satisfaction that meets the needs of decision makers (DM, DecisionMaker). In this way, it is possible to offer goods and services closer to what the individualexpects to obtain beyond their preferences.
For example, the preference for dark clothing does not imply that any dark garmentmeets the individual’s expectations. Said garment may cover all the preferred search criteria(price, fabric quality, size, among others). However, it may be that the garment is not to
Axioms 2022, 11, 232. https://doi.org/10.3390/axioms11050232 https://www.mdpi.com/journal/axioms

Axioms 2022, 11, 232 2 of 31
the individual’s liking when trying it on. The above is related to causes associated withthe individual’s personality, which reflect traits that help define their level of satisfaction.Knowing this type of characteristics related to satisfaction (personality and preferences)guarantees suggestions of goods and services with a high expectation of satisfaction.
According to the previous idea, if organizations or institutions adopt this type ofoptimization mechanism, the existing link with their established market could be strength-ened by offering their goods or services personalized. They are even making it possibleto venture into a new potential market due to the new and efficient attention, which canbe interpreted as profits. These gains are the result of addressing the perception of thepreferences of each individual, in particular, considerably reducing results perceived asunfavorable by the individual.
For example, the authors Cruz-Reyes et al. [1] provide a study focused on the inte-gration of the perception of individuals through their preferences to optimize decisionprocesses, reflecting in some way their satisfaction. Another study that can be highlightedis that of the authors Castro-Rivera et al. [2], where they were not limited to integrating onlythe preferences of the individual but also their personality to give a better approximationto what satisfies them according to a decision context.
In general, profits play an essential role in different works that provide studies infavor of integrating the perception of individuals through their preferences. Such a linkbetween profits, perception, and preferences is built to gain an advantage in computableoptimization processes so that better solutions can be achieved [1,2]. Hence, the profitscan be seen as a means of characterizing the impact of a particular individual’s perceptionover distinct alternatives, which can vary. For example, from the perspective of someindividuals, it may be healthy to consume coffee with a lot of sugar, but for others, it is aprecursor to disease. The example above is a clear manifestation of preferences and theinfluence of satisfaction on them.
Satisfaction modeling is related to decision making, representing DM satisfactionthrough conceptual models. These models seek to provide various components thatvisualize the decisions of individuals and their agreement on the results. These componentshave been grouped into satisfaction models under the job and customer approaches. Bothapproaches share a relationship between their main components to represent the satisfactionof individuals. For example, they share emotional factors, motivation, commitment, equityfactors, and strengthening the quality of goods and services. In addition, these modelscan model satisfaction from questionnaires provided by the DM, generating representativevalues of their satisfaction expectations.
The job and customer satisfaction approaches aim to reflect the satisfaction of theDM by providing the degree of satisfaction concerning a decisional context [3,4]. How-ever, representing the satisfaction of the DM is a problem that requires involving morecharacteristics, such as preferences and personality.
The reason for considering personality as a characteristic to achieve the satisfaction ofthe DM is that preferences are particularities derived from personality; that is, personalityinfluences preferences. Additionally, personality distinguishes the DM’s behavior relativeto others in the decision-making process. For example, when buying products, an indi-vidual with a relaxed personality tends to see product attributes with similar relevance,regardless of whether the quality is lower than the price. On the other hand, an authoritar-ian personality emphasizes a preference for one of the product’s attributes over another. Toemulate this type of behavior in decision making, indirect strategies are applied [1,5], andoptimizers are based on preferences and influences of personality [2].
Personality influences not only the DM’s preferences but also their satisfaction. The sat-isfaction characteristic allows one to observe the influence of personality through satisfac-tion, showing that each individual expresses what uniquely satisfies them. The DM’s levelor degree of satisfaction indicates if the expectation of satisfaction concerning the resultsfrom a decision-making process has been achieved. Results can be obtained through astrategy based on preferences, such as HHGA-SPP (Hyper-Heuristic Genetic Algorithm

Axioms 2022, 11, 232 3 of 31
for Social Portfolio Problem) [6], RPM (Robust Portfolio Modeling) [7], or NOSGA-II(Non-Outranking Sorting Genetic Algorithm) [8].
Integrating characteristics such as personality and satisfaction in an optimizationstrategy based on preferences from the literature could offer more representative solutionsfor the interest of the DM. These alternatives are evaluated to see if they meet the DM’sexpectations or degree of satisfaction. This type of satisfaction indicator, together with theinfluence of personality on preferences, is an innovative feature of the proposed satisfactionmodel. Furthermore, the integration of satisfaction in metaheuristic algorithms has notbeen applied previously.
In this work, a satisfaction model with personality characteristics is proposed toinfluence the preferences of the DM seeking to improve the decision-making process of aVDM under an optimization context. Optimization context addresses the product selectionprocess within a food product shopping problem. This context will serve to evaluate thefunctioning of the proposed satisfaction model. In this case study, the intelligent agent isvirtual and takes on the role of a sales assistant who offers the user food product suggestionsaccording to interests through an optimization strategy based on preferences.
The configuration of the suggestions was classified according to the elements withwhich they were generated. This classification consists of two elements: (1) suggestionsgenerated with satisfaction, personality, and preferences, and (2) suggestions generatedwith personality and preferences. These suggestions will be compared with each other andevaluated with user satisfaction. It is expected that the suggestions of group 1 meet thesatisfaction expectation of the individual concerning the suggestions of the other group.
The main contributions of this work revolve around a satisfaction model and anarchitecture of intelligent agents to facilitate an interaction mechanism with the user.The proposed satisfaction model uses personality properties to influence an individual’spreferences through preference-based solution strategies. Influencing an individual’s pref-erences through these characteristics is the most remarkable contribution of this work.The developed architecture of intelligent agents integrates into its cognitive process the as-sisted satisfaction model with personality attributes and a strategy based on preferences inits deliberative process. Both the personality attributes and the preference-based optimiza-tion strategy come from the literature. The optimization strategy within the deliberativeprocess is influenced by the features provided by the satisfaction model. This architectureis the means to represent the cognitive part of the decision process of an intelligent agentwith the role of a VDM.
This research’s main objective is to model a DM’s preferences influenced by personalitycharacteristics and satisfaction level to improve the decision-making processes of a virtualagent in an optimization context. Furthermore, this objective intends to demonstratethat the integration of a satisfaction model that reflects the degree of satisfaction of anindividual in optimization problems that consider the characteristics of their personalityand preferences will provide better solutions than processes that do not integrate a modelof satisfaction. This hypothesis is discussed extensively in Section 5.6.
The following describes how the sections of this document are organized. Section 2presents the theoretical foundation that supports the realization of this work. Section 3shows the general architecture of the VDM project. Section 4 presents the satisfactionmodel proposed in this work and the description of its components. Section 5 presents theformulas involved in the satisfaction model and the evaluation of the model’s performancethrough a case study, as well as the experimental design. Section 6 corresponds to thediscussion about the results achieved in the experimentation. Finally, Section 7 correspondsto the conclusions of this work.
2. Background2.1. Approaches to Satisfaction in the Literature
The main concepts for developing theories and models of satisfaction are addressedin the literature from two approaches: the job and customer approach. In most jobs, job

Axioms 2022, 11, 232 4 of 31
satisfaction is the most recurrent concerning the satisfaction of individuals. Job satisfactionis made up of emotional and cognitive processes, and through these, the individual evalu-ates their experience at work [9,10]. Cognitive job satisfaction arises from evaluating jobcharacteristics more consciously and comparing them with a cognitive standard [10,11].On the other hand, affective or emotional job satisfaction represents a positive emotionalresponse from the employee towards work as a whole [10,12].
In addition to job satisfaction, another recurring concept in the literature is the con-cept of customer satisfaction. The wealth of companies comes mainly from having theircustomers satisfied. According to the above, it is necessary to have robust processes andqualified personnel who provide the consumer’s service or product quality. Measuringcustomer satisfaction allows one to know if the conditions in which said processes andpersonnel are carried out are adequate and, in this way, to predict the consumption of sales.Therefore, it is relevant to know the opinion of consumers about the service provided [13].The concepts of customer satisfaction are illustrated through customer satisfaction models,which are based on market research and are classified as macro- and micro-models [4].
Some of the most recurrent theories or models under the approach to job satisfactionare: the theory of affect [14], the theory of the two factors, the model of expectations ofPorter and Lawler [15], Fit-Job theory [16], among others. On the other hand, customersatisfaction models are divided into macro-models and micro-models. Macro-models high-light consumer satisfaction by comparing performance standards of services or products.Some of these macro-models are the traditional model, the models based on the valuechain, and the perceived quality of the service. On the other hand, micro-models look moredirectly at customer satisfaction. The micro-models are listed in seven types [4,17], such asthe model of disconfirmation of expectations, model of perceived performance, model ofnorms, model of multiple processes, models of attribution, affective models, and modelsof equity.
The job and customer satisfaction theories can be associated with personality the-ories and agent architectures to develop support models in decision making that makesatisfaction explicit through traits, types, emotions, cognitive elements, and real-worldsymbology. According to the above, the models of job satisfaction that, at first glance, showmore similarities at the conceptual level with the theories of personality and the architec-tures of agents are the Theory of Labor Adjustment or Fit-Job (it belongs to the emotionalapproaches) and Comparison Theory (belongs to a Motivational approach). In the case ofcustomer models, the Traditional Model has more similarities with personality theoriesand agent architectures, followed by the Value Chain Model.
The Fit-Job satisfaction models, Comparison Theory, Traditional Model, and the ValueChain Model are functional for developing a decision-making model in an intelligentvirtual agent that integrates the satisfaction and personality of the individuals in variousdecision contexts.
2.2. Personality
Personality is commonly seen as the set of behaviors that make up a person's individ-uality and is regularly used to describe and classify a person's behavior. The personalityincludes the external behavior of the person (gestures, behaviors, and observable events)and the internal experience of the person (desires, thoughts, feelings, and beliefs), whichwill produce observable events in the environment [18].
Studies on personality are supported by Personality Theories based on psychology,which explain the behavior of humans through two study approaches personality traitsand types [19]. Both approaches seek to describe the personality of individuals throughtheir strengths, weaknesses, preferences to act, and emotional states.
2.2.1. Personality Traits
In the development of systems that interact with people (simulators of human be-havior), personality traits cannot be ignored due to their influence. They constitute a

Axioms 2022, 11, 232 5 of 31
decisive part of human reasoning and behavior, mainly if one agent’s emotional state caninfluence the decisions. Furthermore, some personality traits can influence the definition ofemotions and their intensity, as is the case with neuroticism, which reflects the mood of theperson [20].
In contemporary psychology, a personality model seeks to describe the characteristicsof human behavior that constitute its individuality. In general, some of the most spreadtrait-based personality models are: big three [21,22], the big five [23,24], and the Five-Factor Model (FFM) (also known as OCEAN (Openness, Conscientiousness, Extraversion,Agreeableness, Neuroticism) [25]. According to McCrae and John [25] and Penn-State [26],six facets are derived from each of the five dimensions or factors of the OCEAN model,which are: (1) Extraversion: friendliness, gregariousness, assertiveness, activity level,excitement-seeking, and cheerfulness. (2) Agreeableness: trust, morality, altruism, coopera-tion, modesty, and sympathy. (3) Conscientiousness: self-efficacy, orderliness, dutifulness,achievement-striving, self-discipline, and cautiousness. (4) Neuroticism: anxiety, anger, de-pression, self-consciousness, immoderation, and vulnerability. (5) Openness: imagination,artistic interests, emotionality, adventurousness, intellect, and liberalism.
2.2.2. Personality Types
Personality types represent another of the approaches that conceptualize personality.In this approach, each of the humans presents a different vision of the world, making itclear that each individual is unique and independent in their behavior [27].
There are models of personality that employ Jung’s theory. This theory consists ofthree dichotomies that explain how humans differ in the way they perceive their environ-ment, interact with others, and how they make their decisions based on these personalitytypes [27]. Some of these models are MBTI (Myers-Briggs Type Indicator) [28], and theKeirsey Temperament Sorted (KTS) model of temperaments [29], which is based on MBTI.Of these two grand theories of personality on human behavior, the FFM and MBTI mod-els stand out as the most recurrent in the scientific literature. These types of models arecommonly used to model socio-emotional agents. In addition, they could influence deci-sion making through metaheuristics, mainly those that take into account other behavioralfactors, such as preferences.
2.3. Solution Strategy That Integrates the Preferences of a DM, NOSGA-II
Most current multi-objective evolutionary optimization literature approaches focus onadopting an evolutionary algorithm to generate an approximation of the Pareto Frontier.For example, the NOSGA-II (Non-Outranking Sorting Genetic Algorithm) algorithm [8]characterizes the best compromise solution of a multi-objective optimization problem byincreasing the selective pressure toward the most satisfactory solutions. In this way, itintegrates the preferences of a DM established a priori in a genetic algorithm [8,30].
In this work, NOSGA-II is used to integrate the preferences of a DM and generatealternatives influenced by a personality profile and satisfaction factors to further facilitatedecision making. The configuration applied in this work for the operation of NOSGA-II isdescribed in the work of the authors Fernández et al. [8].
In Section 2.4, it is possible to find some works related to strategies that integrate thepreferences of a DM, as well as research that offers a proposal to influence personalityfactors in this type of metaheuristics.
2.4. State the Art Analysis
Various investigations reveal the importance of personality and preferences on hu-man behavior in different situations, particularly decision making. They hypotheticallyvisualize that these characteristics allow them to reach the expectations of satisfaction ofthe individuals through the results of the application of their methodologies. However,the satisfaction of individuals is an issue whose characteristics must be considered indecision-making processes.

Axioms 2022, 11, 232 6 of 31
The absence of some of the distinctive factors of human behavior mentioned above isusually observed in the literature. For example, the work of Delgado-Hernández et al. [31]characterizes a dialogue with personality elements and selects the sentences of the conver-sation with a preference-based optimizer. However, it does not consider characteristicsof satisfaction.
On the other hand, in the work of Seltzer et al. [32], the characteristics of satisfactionare considered. They relate personality, life, and job satisfaction to highlight the influenceof personality on satisfaction. However, they do not consider the DM’s preferences and arerelevant to satisfaction. For example, a person whose job is not to their liking is more likelyto harm their satisfaction than someone who performs a job to their liking.
Bradea et al. [33] propose a management tool for the selection of assets that provideoptimal returns in the market. They use the preferences of the DM through an optimizerfor decision making. In this work, characteristics of satisfaction and personality are notconsidered, so the results could improve in its experimental simulation when consideringthese factors.
According to the reviewed literature, no proposals were found that consider thethree topics of human behavior (personality, preferences, and satisfaction) interacting in acomputable model. For this reason, the proposal of a satisfaction model influenced by apersonality that helps model the preferences of a DM is one of the novel characteristics ofthis research work.
3. General Architecture of VDM
This section deals with a proposed architecture of a virtual agent with human-likebehavioral traits [34] through satisfaction, personality, and preference models. This archi-tecture represents a VDM with the role of a decision maker.
The architecture of this work has a degree of topological and mathematical abstrac-tion [35]. The VDM and the flow of its components are modeled through a diagram.The data flow between its components comes from applying models that resort to mathe-matical formulations, as is the case of the proposed satisfaction model in this work.
In addition, the proposed architecture is based on the structure of a utility-basedagent [36] and on the fundamentals of a BDI (Beliefs, Desires, and Intentions) architec-ture [37,38]. This work aims to provide a framework [39,40] that facilitates the developmentof various decision contexts in which the VDM and a real DM can interact.
Figure 1 shows the general scheme of the VDM, whose structure has been developedto work in any case study. The operation of the architecture consists of selecting from theknowledge base the contextual elements, information on personality (through the MBTI [28]and IPIP-NEO [26] questionnaires), the Corpus Processed representative of the preferences(with the questionnaire proposed by Castro et al. [2]), and the DM satisfaction profile.With this information, it will be possible to obtain preferential parameters influenced bythe VDM’s personality and approximate the degree of personal satisfaction.
In this project, the PMUDC-I model (Personality Model Under a Decision Context I) [2]is responsible for generating personality parameters, as well as preferential parameters.Therefore, the PMUDC-I is the basis for concluding with the development of the PMUDC-II model. However, this investigation will not address its calculation procedure untilfuture investigations.
Satisfaction-based personality traits (detailed in Section 5) are generated by thePMUDC-II model. Therefore, the satisfaction metric to evaluate the results of the de-liberative process conformed by NOSGA-II comes from the satisfaction model.
In general terms, the VDM architecture aims to emulate a DM’s characteristics througha decision context. For example, the emulation of the skills of a laboratory technician,developing experimentation in a virtual laboratory as if they were the DM. This documentfocuses on the blocks within the dotted area of the agent architecture (Figure 1). Section 4presents the characteristics of the satisfaction model proposed in this work.

Axioms 2022, 11, 232 7 of 31
Figure 1. VDM architecture is composed of the satisfaction model, NOSGA-II, and PMUDC-II.
4. Personal Satisfaction Model
The module of the personal satisfaction model is part of the cognitive process of theagent or VDM. This model provides the parameters that reveal the satisfaction of theDM. This model comprises the customer satisfaction models, which are the TraditionalModel and the Theory of Value, as well as the theories of job satisfaction, which are theComparison Theory and the Fit-Job Theory.
The personal satisfaction model has three process blocks: definition of satisfactionparameters, parameter update, and satisfaction level validation module. Figure 2 showsthe personal satisfaction model with its process blocks. The interaction with the PMUDC-IImodel, the knowledge base, and the agent’s deliberative process (NOSGA-II) is mainlyobserved. Sections 4.1–4.3 describe the three process blocks of the personal satisfactionmodel proposed in this work.
Figure 2. Proposed satisfaction model and the interaction of its process modules.

Axioms 2022, 11, 232 8 of 31
4.1. Definition of Satisfaction Parameters Module
The definition of satisfaction parameters module consists of three internal blocks,which are: input data, processes, and results, which are composed of a combinationof the approaches of job satisfaction and customer satisfaction for their relationship insimilar processes.
In short, the block input data is responsible for retrieving the information from the sat-isfaction profile, which contains the attributes of the service-product (s-p). These attributesare: expected performance, quality, quality-performance standards, emotional value, RI-ASEC test [41], and the ideal-real expectations of the s-p. The block process comparesquality and performance with quality standards to interpret satisfaction, comparing idealand actual expectations, reporting whether or not there is satisfaction with the s-p. Finally,it retrieves the RIASEC test score. The block process defines satisfaction parameters namedvalue, equality, and utility.
Specifically, the parameter value is made up of information on the perceived perfor-mance of the p-s, combining characteristics of the Traditional Model and the Theory ofValue. Furthermore, the parameter equality compares the ideal-real expectations based onthe Comparison Theory. Finally, the utility parameter obtains the evaluation provided bythe RIASEC test, which comes from the Fit-Job theory.
Once the satisfaction parameters are generated, they are sent to the block parameterupdate module.
4.2. Parameter Update Module
The block parameter update module is made up of the following blocks: intensifypersonality traits, update personality traits, and influence parameters of satisfaction andpreferences with personality. In general terms, the parameter update module readjusts theparameters of satisfaction, personality traits, and preferences to reflect the DV’s behavior inmore satisfying and personality-influenced decision making.
Personality traits are given by the PMUDC-II model and are based on satisfactionattributes. These traits come from a set of personality parameters called value, equality,and utility and are intended to characterize satisfaction attributes, which are supported bysatisfaction models in the literature [3,4].
By way of clarification, from the perspective of satisfaction, the parameter value isdeveloped from the traditional models, and value theory [4] and represents the sentimentalvalue of the goods or services that produce well-being. On the other hand, from theperspective of personality, the parameter value comes from the facets of the OCEANdimension agreeableness and represents the moral values of the individual, which canproduce satisfaction and well-being by correctly orienting their actions towards society.
In the case of the satisfaction parameter equality, it is based on the comparisontheory [3,42], and represents the satisfaction or dissatisfaction in the expectation of a serviceor product. The personality parameter equality is based on the OCEAN facets of the factorneuroticism and represents dissatisfaction if conditions of equality with others do not exist.
Finally, the satisfaction parameter utility is based on the Job Fit theory [16] and aimsto highlight the skills of the person in the work areas where they perform best and feelsatisfied. The personality parameter utility is based on the facets of the extraversion,conscientiousness, neuroticism, and openness factors, reflecting aspects that intervene indecision making, favoring or limiting the results. For example, a shy person may loseopportunities in their environment due to self-consciousness; on the contrary, a naiveperson could make unreasonable decisions.
Through the personality parameters (value, equality, and utility), a set of personalitytraits associated with satisfaction are derived. These traits are quantified through theintensifies personality traits block described below.
The block intensify personality traits assigns the value of the OCEAN facets (dis-cussed in Section 5.3) to the set of personality traits proposed in this work (discussed in

Axioms 2022, 11, 232 9 of 31
Table 1). This assignment of values gives intensity to personality traits, thus influencing therepresentative parameters of satisfaction and preferences.
Table 1. Classification of personality traits.
Updating Cycle Influence of Parameters
Utility Value Equality Utility
Patience Ethic Cruelty ConceitDesperation Humility Generosity Egoism
Shyness NaivetyLazinessBravery
Cowardice
The intensity of personality traits determines how much influence they can provide onthe parameters mentioned above. Intensity is obtained through the IPIP-NEO (InternationalPersonality Item Pool-Neuroticism, Extraversion, and Openness) [26] questionnaire.
The relationship between the OCEAN facets and personality traits is possible throughthe similarities in its description’s attributes. In the case of facets, their descriptionshave been taken from the OCEAN model [25,26]. The descriptions or definitions of thepersonality traits proposed in this work have been taken from the RAE [43].
For example, according to OCEAN, the gregariousness facet of the extraversion dimen-sion mentions that gregarious people find the company of others rewarding and enjoy theexcitement of crowds. However, people with low scores tend to feel overwhelmed by largecrowds. This description has similarities to the shyness trait, so the gregariousness facetscore can be assigned to the shyness trait. This assignment of values can be consulted inSection 5.3, where the assignment of the values obtained from each facet to the personalitytraits through the IPIP-NEO questionnaire is observed.
Yet another example of similarity in their descriptions is the facet activity level andthe trait laziness. The facet activity level refers to participation in multiple activities. Lowscores on this facet indicate a very relaxed pace. The personality trait laziness describes aperson as being too lax in carrying out their tasks. The relationship of the rest of the facetswith the personality traits can be consulted in [44].
The block update personality traits receives the intensified personality traits to updateother personality traits, according to the classification presented in Table 1. Personalitytraits are classified in two ways: traits that control the update cycle of parameters and traitsthat influence preferences, satisfaction, and even other elements of personality. The traitsbelonging to the utility parameter, such as patience, desperation, laziness, timidity, bravery,and cowardice, control the update cycle of the parameters. Other personality traits that alsobelong to the utility parameter, as well as to the value and equality parameters, influencethe elements of satisfaction, preferences, and personality.
Once the personality traits are updated, they will be sent to the influence parameters ofsatisfaction and preferences with a personality block to influence the satisfaction parameters(value, equality, and utility) and in the preference thresholds given by PMUDC-I. After theprevious process, the influenced parameters will be sent to the deliberative process (toNOSGA-II) to integrate the preference thresholds. Solutions given by NOSGA-II will beevaluated by the Satisfaction level validation module.
4.3. Satisfaction Level Validation Module
The satisfaction level validation module receives the solution alternatives from thedeliberative process and validates them through the satisfaction characteristics, whichmake up the DM degree of satisfaction, in addition to the query or request formulated fromthe beginning by the DM.
The solution alternatives of the deliberative process and the DM request are composedof criteria or attributes. Depending on the context, these criteria may be colors, sizes,

Axioms 2022, 11, 232 10 of 31
and costs, which may be about selling or offering services. The criteria DM’s requestconsists of a value, which must be accumulated to be compared with the accumulated totalof the solution alternatives obtained together with the representative tolerance of the DM.For example, if a request is made under an element selection context, whose criteria orattributes are its color and size, assuming that each attribute has a weight, the procedure toperform to obtain the accumulated total is to add the weights of each criterion. Afterward,the accumulated total is evaluated with the tolerance, representing the deviation or distancebetween the expectation (request) and the reality (alternatives).
If the accumulated value of an alternative received criterion does not exceed thetolerated percentage, it will be counted as a hit. The more hits an alternative has, the moresatisfaction it will reflect. For example, a received or suggested alternative or list containingthree items governed by two criteria would generate a maximum of six hits and a minimumof zero. Satisfaction is subjective, so an alternative with three correct answers out of sixmay be considered satisfactory if the individual’s tolerance allows it. On the contrary,an alternative with five correct answers out of six may not be acceptable. The abovedepends a lot on the personality profile of the individual.
If the solution alternatives are close to those expected by the DM, they are sent to thegraphical interface. Otherwise, the parameters will be updated again to reach a level ofsatisfaction more appropriate for the DM, as the update cycle allows (e.g., iteration < 3).The iteration limit avoids spending too much time searching for an improvement that mayno longer exist because it has already been achieved. The equations and the procedureexplained above can be consulted in the topic Section 5.7.
Section 5 presents how satisfaction is modeled through the characteristics of fourindividuals under a case study. In addition, the experimental design and the analysis of theresults are described.
5. Analysis and Results
This section shows how the satisfaction model works using a food purchase casestudy. The calculation of parameters and values of each of the modules or process blockspresented in Section 4, corresponding to the personal satisfaction model, will be shown.
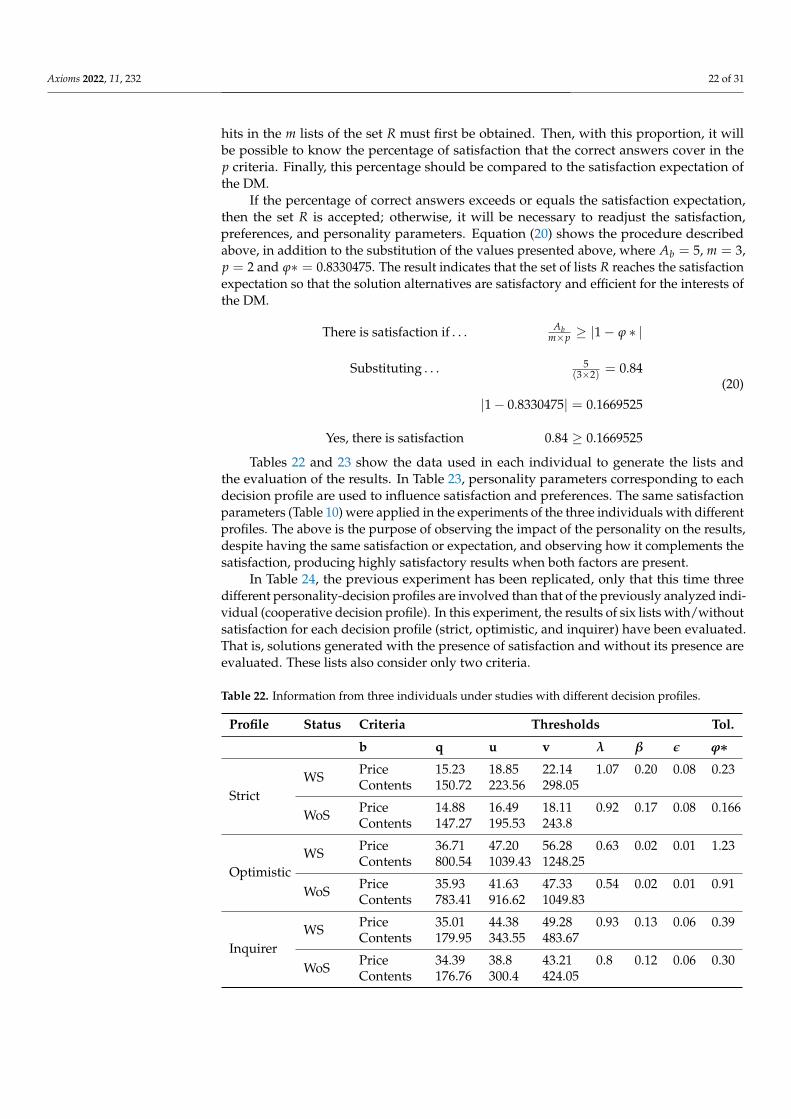
In Section 5.7, the case study will be addressed through two analysis cases. The firstcase analyzes an individual’s satisfaction with a collaborative personality profile. The sec-ond case analyzes the satisfaction of an individual corresponding to the rest of the person-ality profiles (optimistic, inquirer, and strict). The food products consider the price andcontent criteria in both analysis cases.
The representation of the shopping list is based on the Project Portfolio (PP) prob-lem [45]. The personality profiles, the preferential parameters, and the tolerance parameterare based on the work of Castro-Rivera et al. [2].
Table 2 shows the input data for the first case of analysis, belonging to a DM witha collaborative profile. These data are preference thresholds representative of the foodproduct shopping context, the tolerance parameter, and the personality parameters fromthe perspective of satisfaction (Table 1). In the second case of analysis, the input data willbe detailed in Section 5.7.
Table 2. Collaborative profile individual and its parameters.
Parmeter|Threshold Price Contents Value Personality Parameters
Indifference (q) 23.78 185.37 — Value = 0.4Preveto (u) 31.81 271.58 — Equality = 0.37
Veto (v) 39.85 357.79 — Utility = 0.65Credibility (λ) — — 0.71Asymmetry (β) — — 0.08Symmetry (ε) — — 0.04Tolerance (ϕ) — — 0.58125

Axioms 2022, 11, 232 11 of 31
The satisfaction parameters, developed from the information provided from the satis-faction profile, have been used in the experiments of the four individuals under analysis.The above is to observe the positive impact of the influence of satisfaction on the decisionmaking regardless of the personality/decision profile of the DM. On the other hand, ob-serve the contrast of the analysis of the results when there is no influence of satisfaction indecision making.
The process blocks of the satisfaction model are described through Sections 5.1–5.5. InSections 5.1 and 5.2, the modeled satisfaction parameters are described. Sections 5.3 and 5.4show how personality traits influence satisfaction characteristics. Finally, Section 5.5 presentsthe influence of satisfaction parameters and personality traits on preference modeling.
5.1. Interpretation of the Satisfaction Profile
The personal satisfaction model requires a series of input parameters for its operation,including the satisfaction profile. This profile is obtained from a questionnaire with fivequestions structured according to the Linkert scale (Appendix E). Each question representsthe concepts of satisfaction models from the literature.
The description of each question and the satisfaction model supporting it are asfollows: Question 1. The expected performance of the s-p is based on the Traditional Modeland Theory of Value; Question 2. Quality is expected to perceive and is built from theTheory of Value; Question 3. Emotional value for the s-p is based on the Theory of Value;Question 4. Finally, the ideal expectation of s-p takes its elements from the ComparisonTheory; Question 5. The fulfillment of realistic expectations of the s-p is based on theComparison Theory.
In addition, the satisfaction profile provides quality standards, which are elementsrequired by the Traditional Model to compare the quality and performance of the s-p. Thesestandards represent elements of the context previously-stored and evaluated according todifferent opinions collected from users. This profile also provides the result of the RIASECtest (based on Fit-Job Theory) [16] to take into account the capabilities of the individual inthe areas that satisfy him at work.
Through the satisfaction profile, you can obtain a minimum of 1 and a maximum of5 points. The result of the satisfaction profile is shown in Table 3 as an example, togetherwith the literals that identify each concept.
Table 3. A hypothetical score of the satisfaction profile questionnaire.
Satisfaction Profile Concept Points
Performance (D) 5Quality (C) 5Value (V) 5
Ideal expectation (A) 5Real expectation (B) 4
RIASEC test (R) 7RIASEC test (I) 4RIASEC test (A) 5
Table 4 aims to illustrate the quality and performance standards according to thedecision context or case study (purchase of products). However, the values correspondingto performance Y and quality Z in the calculations have been proposed and not taken froma collection of authentic standards. From these data, the perceived disagreement (d) can becalculated, which is a concept of the traditional model that measures the negative-positiveimpact of s-p.
Once the satisfaction profile data is known, it is possible to define the satisfactionparameters, named as value, equality, and utility.

Axioms 2022, 11, 232 12 of 31
Table 4. A hypothetical example of the context element standards.
Item Type Color Contents Availability ... Performance (Y) Quality (Z)
1 Product Coffee 3 pieces — ... 3 52 Service — — — ... — —4 Product ... ... ... ... 3 43 Product ... ... ... ... ... ...
5.2. Procedure for Defining Satisfaction Parameters
After obtaining the input data of the satisfaction profile, inside block processes definethe parameter value the performance (Y) and the quality (Z) of the standards for obtain theperceived disconfirmation (d). This calculation consists of taking only those values closestto the quality (C) and performance (D) given in the satisfaction profile. The selected Y andZ values will be averaged. The Equation (1) shows the sum of the average between Y andZ, as well as the sum between C and D, resulting in d.
d = (Y + Z) + (D + C) (1)
Within the block processes, D, C, V, and d are used to interpret the DM’s satisfaction(s) with the s-p through Equation (2).
s =D× C×V
d(2)
To calculate the equality parameter, the ideal expectation must be compared with thereal expectation of the s-p, according to the Theory of Comparison. The Equation (3) showsthe comparison procedure between A and B.
A = B→ satis f action
A > B→ dissatis f action
A < B→ guilty, inequity, discom f ort
(3)
Within the results block, the level of dissatisfaction or guilt obtained by the Equation (3)is defined using the absolute difference (k) between the ideal expected A and the realexpectation B of the s-p. Equation (4) shows this operation. The value resulting fromapplying Equation (4) is the result of calculating the parameter equality.
k = |A− B| (4)
Finally, within the block results, the utility parameter is defined, taking the valuesof the RIASEC test. According to what is specified in the RIASEC test, the highest scorethat can be obtained with the three literals (M) is 21; that is, 7 points for each literal.In Equation (5), a conversion of the total score to a scale of 10 is performed for easierhandling, where it is assumed that each literal has a maximum score of 7. The definitionof the parameter utility can be seen in Equation (6), where the value of L in each literalcorresponds to that of the answered RIASEC test.
m =M1 + M2 + M3
10(5)
u =L1 + L2 + L3
m(6)
Table 5 shows, in a summarized way, the calculation of the satisfaction parametersusing the equations and tables previously exposed. The data substituted in each equation(EQ) correspond to those obtained by the satisfaction profile.

Axioms 2022, 11, 232 13 of 31
Table 5. Definition of satisfaction parameters named as value, equality, and utility.
Parameter EQ Used Substitution of Values in EQ Result
Value (2) s = (5× 5× 5)÷ 17 7.36Equality (4) k = |5− 4| 1Utility (6) u = (7 + 4 + 5)÷ 2.1 7.62
5.3. Procedure for the Intensification or Quantification of Personality Traits
Personality traits are quantified in the intensify personality traits block. This process ispossible through the facets of the OCEAN model and the scores provided by the IPIP-NEOquestionnaire (addressed in Section 4.2). Table 6 shows the quantification of personalitytraits through the most similar facet. For example, the values shown in this table representan individual with a collaborative decision profile. The value assigned to each trait will bethe representative intensity, how shy, ethical, or desperate the person is, and influence theparameters in general. There are similarities of a personality trait with more than one facetin some cases, so it must be averaged to obtain its intensity value.
Table 6. Intensification of personality traits through the OCEAN facets [25] and IPIP-NEO question-naire [26].
OCEAN Factors Facets Value with IPIP-NEO Personality Trait Value with Facet Personality Parameter
ExtraversionActivity Level 0.80 Laziness 0.80
UtilityGregariousness 0.55 ShynessExcitement-Seeking 0.17 Bravery 0.17
AgreeablenessMorality 0.89 Ethic 0.89
ValueModesty 0.65 Humility 0.65Altruism 0.95 Generosity 0.95
Conscient.Self-Efficacy 0.80 Patience 0.80
UtilityCautiousness 0.72 Shyness Average: 0.63
Cowardice 0.72
Neuroticism
Anxiety 0.64 Desperation 0.64 Utility
Angry 0.27 Egoism 0.27 UtilityCruelty Equality
Immoderation 0.48 Conceit 0.48 UtilityCruelty Average: 0.37 Equality
Openness Imagination 0.50 Naivety 0.50 Utility
5.4. Personality Traits Update Procedure
The module personality traits update procedure is responsible for updating the per-sonality traits displayed in the Table 1. Updating is possible through the association of thedescription between the characteristics of these features (according to [44]). In this case,the related traits are ethics with patience, which have peaceful and correct behavior incommon; humility and shyness, which recognize their ability; conceit and bravery, whichboth emit arrogance. Table 7 shows the value of the intensity of said traits, according tothe quantification presented in Table 6. This intensity value will be used to calculate theupdate of the decision and influence characteristics.
Table 7. The intensity of personality traits is classified as decisive.
i Influence Traits (ni) Intensity (ni) Decision Traits (wi) Intensity (wi)
1 Ethic 0.89 Patience 0.802 Humility 0.65 Shyness 0.633 Conceit 0.48 Bravery 0.17

Axioms 2022, 11, 232 14 of 31
Equation (7) shows the rules that must be followed to apply influence to decision traits;that is, if the intensity of the traits desperation, laziness, and cowardice does not exceedthe intensity of the traits patience, shyness, and bravery, the latter will not be influenced,keeping their value, otherwise they will be influenced by applying Equation (8). This lastequation increases a small percentage, representing the influence trait update over thedecision trait. For example, the trait of patience increases due to the feedback it has withthe ethics part, so that it can overcome desperation.
w∗i =
wi if patience > desperation ∧shyness > laziness ∧bravery > cowardice
(ni × wi) + wi if patience < desperation ∧shyness < laziness ∧bravery < cowardice
(7)
w∗2 = (n2 × w2) + w2 = 1.03→ shyness∗ (8)
Updating the egoism, generosity, cruelty, and naivete traits is conducted in a similarway as explained for the previous traits. The common characteristics of these traits areintended to update the preference thresholds given by the PMUDC-I model. The relation-ship between the characteristics of both approaches (decision and influence) is observed asfollows: egoism and laziness, both are interested only in themselves; generosity and cow-ardice, both have neither humor nor courage to do harm; cruelty and desperation, present astate of mind altered by anger; naivety and patience handle simplicity without alterations.
Table 8 shows the intensity corresponding to each trait based on Table 6. The influencetraits are updated by applying Equation (9), except for the trait humility, which is calculatedusing the Equation (10). The relationship between the traits egoism, generosity, cruelty, andnaivety and preference thresholds will be discussed in the topic Section 5.5.
n∗1 = (n1 × w1) + n1 = 0.48→ Egoism∗ (9)
Humility =(Egoism∗ + Generosity∗)
2= 1.05 (10)
Table 8. The intensity of personality traits is classified as influential.
i Influence Traits (ni) Intensity (ni) Decision Traits (wi) Intensity (wi)
1 Egoism 0.27 Laziness 0.802 Generosity 0.95 Cowardice 0.723 Cruelty 0.37 Desperation 0.642 Naivety 0.50 Patience 0.80
In Table 9, the decision traits will be used to control a cycle that will determine ifthe influence traits should be updated or not. In addition, influence traits will serve toupdate preference thresholds and satisfaction parameters. Table 9 is a summary of theresults of the influence on each of the personality traits. This influence is the result ofapplying Equations (7)–(10). Finally, it only remains to send them to the following processto influence the satisfaction and preference parameters (thresholds).

Axioms 2022, 11, 232 15 of 31
Table 9. Results of the influence calculation of the decision and influence traits.
Influenced Decision Traits Intensity Influenced Traits of Influence Intensity
Patience 1.512 Egoism 0.48Shyness 1.03 Generosity 1.63Bravery 0.25 Humility 1.05
— — Cruelty 0.60— — Naivety 0.90
5.5. Procedure of Influence of the Parameters of Satisfaction and Preferences with the Personality
Within the procedure Procedure of influence of the parameters of satisfaction andpreferences with the personality the following elements are required: personality traits(Table 9), satisfaction parameters (Table 5), personality parameters, and preference thresh-olds (Table 2).
Equation (11) shows the process of influencing the satisfaction parameters with thepersonality parameters (relationship addressed in Section 4.2), where the parametersbelonging to the same group will perform the influence or update.
Equation (12) shows as an example the calculation of the influence of the satisfactionparameter value (ViSj) by substituting the values from Table 10 in Equation (11) accordingto their corresponding group. The satisfaction parameters were taken from Table 5 and thepersonality parameters are found in Table 2.
ViS∗j = (ViSj ×ViPj) + ViSj
EiS∗j = (EiSj × EiPj) + EiSj
UiS∗j = (UiSj ×UiPj) + UiSj
(11)
ViS∗j = (ViSj ×ViPj) + ViSj
Parameter Value∗ = (7.36× 0.4) + 7.36 = 10.304(12)
Table 10. Influence of personality on satisfaction through the parameters value, equality, and utility.
Params. (i) Satisf. Params. (Sj) Pers. Params. (Pj) Influence of Pers. on Satisf.
Value (Vi) 7.36 0.4 10.304Equality (Ei) 1 0.37 1.37Utility (Ui) 7.62 0.65 12.573
The influence traits presented in Table 9 influence the preference thresholds. The pref-erence thresholds indicate the differences between comparisons of alternatives througha strategy that integrates preferences of a DM, such as NOSGA-II [8]. The preferencethresholds will be provided by the PMUDC-I model preferential impact model [2].
In general terms, the description of the threshold q indicates the minor differencesbetween one alternative and another to consider them negligible. On the other hand,the description of the threshold v points out the significant differences between alternatives,considering one of them preferred over the other. Finally, the description of the thresholdu shows the magnitude of the differences between alternatives when the veto conditionsbegin to be observed. These descriptions have been taken from Rivera-Zárate’s work [46]
The description of the trait generosity indicates sensitivity and compassion for themisfortunes of others. The egoism trait describes excessive attention to oneself withoutcaring about others. In the case of the humility trait, it indicates the virtue of recognizingone’s limitations and weaknesses. These definitions or descriptions have been taken fromRAE [43]
Through the provided descriptions of the preference thresholds and the traits gen-erosity, egoism, and humility, it is possible to visualize a relationship in common and,in this way, influence thresholds of preference with the personality traits mentioned above.In the case of the threshold q and the trait generosity, they have in common that they are

Axioms 2022, 11, 232 16 of 31
indifferent to minimal situations. The threshold v and the trait egoism reflect a restrictivecharacter. Finally, the threshold u and the trait humility share that they both recognize theirlimitations, but it does not represent any problem.
Table 11 shows the satisfaction parameters and the result of the influence of personalitytraits. The threshold-related trait q (generosity) represents the least stringent trait; therefore,the satisfaction parameter with the least weight will be influenced by generosity, and thestrictest trait egoism, will influence the parameter with the highest weight.
In Table 11, the satisfaction parameters have been ordered in ascending order andplaced with the corresponding personality trait, influencing said parameter through itsintensity, generating a small percentage of equivalent increases of the trait over the param-eter. Through Equation (13), it is possible to influence the satisfaction parameters withpersonality traits to affect the DM preference thresholds later. The Table 11 shows the resultof applying Equation (13).
Equality∗ = (Equality×Generosity Intensity) + EqualityValue∗ = (Value×Humility Intensity) + ValueUtility∗ = (Utility× Egoism Intensity) + UtilityParameter Equality∗ = (1.37× 1.63) + 1.37 = 3.60
(13)
Table 11. Results of the influence of the satisfaction parameters with personality traits.
Parameter Parameter Value Influence Traits Intensity Result of Influence
Equality 1.37 Generosity 1.63 3.60Value 10.304 Humility 1.05 21.12Utility 12.573 Egoism 0.48 18.60
After influencing the parameters of satisfaction with personality, they are converted toa percentage to affect the preference thresholds consistently and moderately, increasing theequivalent percentage of each parameter over each of the thresholds. Table 12 shows theconversion of each parameter to a percentage. Equation (14) shows how the calculation ofthe influence of the preference parameters is carried out with the satisfaction parametersinfluenced by personality, and Table 13 shows the results of the influence of each threshold.
q∗ = (q× Equality) + qu∗ = (u×Value) + uv∗ = (v×Utility) + vParameter q∗ = (23.78× 0.036) + 23.78 = 24.63
(14)
Table 12. Conversion of the satisfaction parameters to a percentage fraction.
Parameter Influenced Parameter Value Conversion to % %
Equality 3.60 3.60÷ 100 0.036Value 21.12 21.12÷ 100 0.2112Utility 18.60 18.60÷ 100 0.186
Table 13. Preference thresholds influenced by satisfaction parameters from Table 12.
Threshold Threshold Value Satisf. Param. Param. Value Result of Influence
q 23.78 Equality 0.036 24.63u 31.81 Value 0.2112 38.52v 39.85 Utility 0.186 47.26
The influence of the preference thresholds λ (credibility), β (asymmetry), and ε (sym-metry) is completed in the same way as with the thresholds q, u, and v. In this case, the traitsused to influence are cruelty, naivety, and humility.

Axioms 2022, 11, 232 17 of 31
According to the description of the threshold λ, it is associated with credibility. Themore value you have, the more credibile and strict the character. The threshold β indicatesa preferential distinction between comparisons of alternatives. Finally, the threshold εestablishes indifference in comparing alternatives. These descriptions or definitions wereinterpreted from the work of Fernández et al. [47].
In the case of personality traits, the trait description or definition of cruelty reflects afierce or impious state of mind. The trait naivety indicates sincerity, straightforwardness,and lack of malice. The humility trait mentions recognizing limitations and weaknesses.These definitions or descriptions are based on RAE [43].
Through the provided descriptions of the thresholds λ, β, and ε, and of the traits cruelty,naivety, and humility, it is possible to visualize a common relationship and influence theaforementioned thresholds with personality traits. The common description betweenthe threshold λ and the trait cruelty is that they both share a strong and strict character.The relationship between the threshold β and the trait humility is that they recognize theirlimitations. Finally, the threshold ε and the trait naivety share an opening character.
Equation (15) shows how to calculate the influence of the parameters of satisfactionwith personality traits. Finally, Table 14 shows the result of calculating the influence of per-sonality on satisfaction parameters. According to their standard description, the parametershave been ordered in descending order and with the corresponding personality trait.
Utility∗ = (Utility×Cruelty Intensity) + UtilityValue∗ = (Value×Humility Intensity) + ValueEquality∗ = (Equality×Naivety Intensity) + EqualityParameter utility∗ = (12.573× 0.60) + 12.573 = 20.11
(15)
Table 14. Calculation of the influence of the parameters of satisfaction with the traits in order withthe thresholds λ, β, and ε.
Parameter Parameter Value Influence Traits Intensity Result of Influence
Utility 12.573 Cruelty 0.60 20.11Value 10.304 Humility 1.05 21.12
Equality 1.37 Naivety 0.90 2.60
Table 15 shows the conversion of the satisfaction parameters to generate a moderateincrease in the influence of personality and satisfaction on the thresholds λ, β, and ε.
Table 15. Conversion of satisfaction parameters.
Parameter Influenced Parameter Value Conversion to % %
Utility 20.11 20.11÷ 100 0.2011Value 21.12 21.12÷ 100 0.2112
Equality 2.60 2.60÷ 100 0.026
Equation (16) shows how to calculate the influence of the thresholds λ, β, and εwith the satisfaction parameters. Finally, Table 16 shows the thresholds influenced bythe satisfaction parameters ordered from strictest to most relaxed (in the same way as inTable 14).
λ∗ = (λ×Utility) + λβ∗ = (β×Value) + βε∗ = (ε× Equality) + εParameter λ∗ = (0.71× 0.2011) + 0.71 = 0.85
(16)

Axioms 2022, 11, 232 18 of 31
Table 16. Result of preference thresholds influenced by satisfaction.
Threshold Threshold Value Satisf. Param. Param. Value Result of Influence
λ 0.71 Utility 0.2011 0.85β 0.08 Value 0.2112 0.096ε 0.04 Equality 0.026 0.041
Table 17 shows the preference thresholds finally calculated and ready to be sent to thedeliberative process. The increase in each parameter can be seen with the naked eye, wheresaid increase represents the influence of satisfaction and personality on preferences duringthe decision-making process.
Table 17. Summary of preference thresholds influenced by satisfaction and personality.
Threshold Threshold Value
Indifference (q) 24.63Preveto (u) 38.52
Veto (v) 47.26
Credibility (λ) 0.85Asymmetry (β) 0.096Symmetry (ε) 0.041
5.6. Experimental Design
The experimental design validates the functioning of the proposed satisfaction modelintegrated into the cognitive process of an intelligent agent. Furthermore, the hypothesis tobe validated shows that integrating the degree of satisfaction of an individual in optimiza-tion problems that take into account personality and preferences generates better solutionsthan process solutions that do not incorporate satisfaction. The validation is carried outthrough a case study that addresses the purchase of food products.
The solutions that integrate characteristics of satisfaction, personality, and preferencesof the DM, come from the process of applying the satisfaction model proposed in thiswork, the NOSGA-II metaheuristic based on preferences [8], and a personality model(PMUDC -II). On the other hand, the solutions that only integrate personality charac-teristics and DM preferences come from the application of the PMUDC-I [2] personalitymodel and the NOSGA-II strategy. These solutions represent a set of shopping lists withthe products desired by the DM, which the VDM suggests. Both sets of shopping lists(generated with/without satisfaction characteristics) will be compared to validate theproposed hypothesis.
The hypothesis validation experiment will be applied to four individuals that reflectdifferent characteristics to contrast the solutions generated. These individuals will beidentified under the optimistic, collaborative, inquirer, and strict personality profiles.A parameter will indicate their tolerance for solutions differently from their decision, and aset of parameters will quantify their satisfaction from a personality perspective. To collectinformation on the personality of individuals, the questionnaire based on personality typesof the MBTI model is used [28] and the IPIP-NEO [26] questionnaire will be applied, whichis based on personality traits from the FFM-OCEAN model [25]. The personality profilesand the tolerance parameter will be taken from the PMUDC-I model [2]. The personalityparameters that characterize satisfaction will be taken from the PMUDC-II model, whichuses the PMUDC-I model for its development. The PMUDC-II model will be addressedin future research. The result of applying the personality questionnaire can be seen inAppendices B and C.
Information on the preferences of the individuals under experimentation will be col-lected through a questionnaire based on a specific decision context. In this case, the contextis the purchase of food products. In this way, it will be possible to generate representative

Axioms 2022, 11, 232 19 of 31
parameters of the preferences of a DM, which are: indifference, preveto, veto, credibil-ity, asymmetry, and symmetry. The questionnaire and the preference parameters will beprovided through the preferential impact model of the PMUDC-I model [2]. The resultof applying the preferences questionnaire can be seen in Appendix D, and the productdatabase can be found in Appendix A.
The information on the satisfaction profile will be obtained through a questionnaireproposed in this work, whose structure is presented in Section 5.1. The informationfrom the satisfaction profile (results of the satisfaction questionnaire and the RIASECtest [16,41]) will be used in the experimentation with the four study subjects to influence thecognitive and deliberative process. The reason for experimenting with the same set in thedecision process of the four individuals is to observe the positive impact of satisfaction onpreferences regardless of the personality characteristics of the DM. The result of applyingthe satisfaction questionnaire can be seen in Appendix E. The result of applying the RIASECtest can be seen in Appendix F.
Using the information of the individuals mentioned above, the VDM will providea set of instances generated with the influence of the satisfaction model and withoutthe intervention of said influence. Each instance will be evaluated using the degree ofsatisfaction metric proposed in this work to determine if it meets its expectations. Theseinstances are composed of a series of food products requested by the individual. In thisset, it is simulated that the four study subjects want or request to acquire the same type ofproducts (for example, water, milk, and bread).
The results obtained from evaluating the set of instances of the individuals’ understudywill be compared through the Wilcoxon non-parametric statistical test. This statistical testwill indicate whether or not there are significant differences between the solutions orinstances generated with the satisfaction model and without the said model. This statisticaltest will reinforce the hypothesis that guides this research work.
5.7. The Evaluation Process of the Degree or Level of Satisfaction (Satisfaction Metric)
The satisfaction metric is responsible for evaluating the solution alternatives providedby the deliberative process. These solutions come from the NOSGA-II solution strategy,which integrates the preference thresholds influenced by satisfaction and personality.Therefore, the alternative solutions (decisions) provided by NOSGA-II somehow reflect theDM’s satisfaction, preferences, and personality. In addition, the satisfaction metric ensuresthat the solutions are closest to the DM’s satisfaction expectations imposed, that is, to theirinitial request, which, according to the case study of product shopping, is a shopping listwith certain products selected by the user (DM).
The evaluation consists of taking the DM’s initial request or product list as a referenceand comparing it with the solution alternatives given by the NOSGA-II strategy, preventingthem from exceeding the tolerance (ϕ∗) allowed for deviation from their ideal satisfaction.
In the work of Castro-Rivera et al. [2], a method to calculate tolerance (ϕ) allowedfor distance concerning alternative solutions other than your preference has been pro-posed. However, this tolerance (ϕ) does not reflect the DM’s satisfaction. Equation (17)shows how to integrate satisfaction into tolerance (ϕ∗), where µ represents the unionof the set of satisfaction parameters and ϕ represents the tolerance of the DM withoutreflecting satisfaction.
The calculation of µ is proposed through the union of the satisfaction parameterscalculated in Table 12, whose result is 0.4332. The reason for using the satisfaction parame-ters to influence q, u, and v, is because these preference parameters represent a less strictcharacter with respect to the thresholds (λ, β, and ε), according to the description providedin Section 5.5. The above reason make them more suitable for calculating ϕ∗ since toleranceindicates relaxation and not restriction. After calculating ϕ∗, it is necessary to know theaccumulated value of each criterion, both the DM’s request and the solution alternativesgiven by the deliberative process (NOSGA-II), to compare them with var f i∗.

Axioms 2022, 11, 232 20 of 31
ϕ∗ = (ϕ× µ) + ϕ (17)
Table 18 shows the structure of both the query or list of products requested, as well asthe alternative solutions, where R represents the set of suggested alternatives/lists/shoppingbaskets, be it the request or the alternatives delivered by the deliberative processes (NOSGA-II strategy). This set goes from R1 to Rm and is made up of n elements or products xcharacterized by benefits, criteria, or attributes b that go from b1 to bp. Table 18 also showsthe total sum of each of the criteria (SbRm p
), which is formally expressed in Equation (18).The total sum of each criterion, determined by SbRm p
, will be compared with ϕ∗ usingEquation (19) as the first measure of evaluation of the satisfaction.
SbRk|k∈{1,2,...,m} j|j∈{1,2,...,p} =n
∑i=1
bRk jxRki (18)
Table 18. Structure of the requested shopping list and solution alternatives/suggested shopping lists.
Lists Products Criteria
R1
xR11, xR12
, . . . , xR1n bR11bR12
. . . bR1 p
xR11 bR11xR1 1 bR12xR1 1 . . . bR1 pxR11
xR12 bR11xR1 2 bR12xR1 2 . . . bR1 pxR1 2...
......
......
xR1 n bR11xR1 n bR12xR1 n . . . bR1 pxR1 n
SbR1 1 SbR1 2 . . . SbR1 p
......
......
......
Rm
xRm1 , xRm2 , . . . , xRmn bRm1 bRm2 . . . bRm p
xRm1 bRm1xRm 1 bRm2xRm 1 . . . bRm pxRm 1xRm2 bRm1xRm 2 bRm2xRm 2 . . . bRm pxRm 2
......
......
...xRmn bRm1xRm n bRm2xRm n . . . bRm pxRm n
SbRm1SbRm2
. . . SbRm p
Table 19 shows the structure of a list/request/alternative solution (Table 18) with theaccumulated total of each of its criteria (Equation (18)). In this case, said list represents thequery or shopping list of food products requested by the DM. This shopping list comprisesthree products and two criteria, the price and the content.
Table 19. DM’s initial shopping list for the VDM.
Product Price Contents
Natural water 5.80 600Soluble coffee 38 180Sweetbread 9.90 62
— SbR01: 53.70 SbR02
: 842
In Table 20, there are alternative solutions or shopping lists suggested by the VDM,generated with the NOSGA-II strategy. These lists are based on the shopping list requestedby the DM. Suggested lists by VDM try to cover the objectives from the list requestedby DM, improving either in some criterion or in both (price or content). In addition,the suggested lists reflect the preferences, personality, and satisfaction of the DM due to thepreference thresholds (Table 17) that were provided to NOSGA-II.

Axioms 2022, 11, 232 21 of 31
Table 20. Solution alternatives generated with NOSGA-II based on the list in Table 19.
List Product Price Contents
List 1Natural water 8.50 600Soluble coffee 41 180Sweetbread 14 200
SbR11: 63.50 SbR12
: 980
List 2Natural water 8.50 600Soluble coffee 41 180Sweetbread 9.90 62
SbR21: 59.40 SbR22
: 842
List 3
Natural water 8.50 600Natural water 12.60 1500Soluble coffee 38 180Sweetbread 14 200
SbR21: 73.10 SbR22
: 2480
The first strategy is to evaluate what was obtained against what was expected. Thatis to say, the requested list with the lists suggested by the VDM. Then, it is necessary tocalculate the proportion that exceeds each criterion of the suggested lists to the criteria ofthe requested list. In this work, it is proposed to compare the proportion of differencesbetween criteria with the tolerance (ϕ∗), ensuring that the total sum of each criterion (SbRm p
)of the suggested lists does not exceed what is allowed by ϕ∗. It will be counted as a hit (Ab).The higher the number of hits the set of suggested lists has (R = {1, 2, . . . , m}), the closerthe DM’s satisfaction will be. In Equation (19), the procedure described above is presented.
Ab = Ab + 1 si ϕ∗ ≥|SbR01
−SbR11|
SbR01
,|SbR02
−SbR12|
SbR02
, . . . ,|SbR0 p
−SbR1 p|
SbR0 p
Ab = Ab+1 si ϕ∗ ≥|SbR01
−SbR21|
SbR01
,|SbR02
−SbR22|
SbR02
, . . . ,|SbR0 p
−SbR2 p|
SbR0 p...
......
Ab = Ab + 1 si ϕ∗ ≥|SbR01
−SbRm1|
SbR01
,|SbR02
−SbRm2|
SbR02
, . . . ,|SbR0 p
−SbRm p|
SbR0 p
(19)
In Table 21, Equation (19) is replaced with the values of the suggested shopping lists(Table 20) and the list requested by the DM (Table 19). In this evaluation, the total hits ofthe set of suggested lists have been five hits out of six. Each list can obtain two maximumhits due to its two criteria and a minimum of zero hits.
Table 21. Substitution of values in Equation (19).
List Criteria Operation Comparison with ϕ∗ Hit (Ab)
List 1 Price |53.70− 63.50| ÷ 53.70 = 0.182 0.8330475 ≥ 0.182 Ab = 1Contents |842− 980| ÷ 842 = 0.163 0.8330475 ≥ 0.163 Ab = 2
List 2 Price |53.70− 59.40| ÷ 53.70 = 0.106 0.8330475 ≥ 0.106 Ab = 3Contents |842− 842| ÷ 842 = 0 0.8330475 ≥ 0 Ab = 4
List 3 Price |53.70− 73.10| ÷ 53.70 = 0.361 0.8330475 ≥ 0.361 Ab = 5Contents |842− 2480| ÷ 842 = 1.945 0.8330475 ≥ 1.945 Ab = 5
After counting the total hits of the solution alternatives (set R), verifying if the saidnumber of hits comes close to the DM’s ideal satisfaction expectation is necessary. For eval-uation satisfaction of the lists suggested by the VDM, the proportion represented by the
Axioms 2022, 11, 232 22 of 31
hits in the m lists of the set R must first be obtained. Then, with this proportion, it willbe possible to know the percentage of satisfaction that the correct answers cover in thep criteria. Finally, this percentage should be compared to the satisfaction expectation ofthe DM.
If the percentage of correct answers exceeds or equals the satisfaction expectation,then the set R is accepted; otherwise, it will be necessary to readjust the satisfaction,preferences, and personality parameters. Equation (20) shows the procedure describedabove, in addition to the substitution of the values presented above, where Ab = 5, m = 3,p = 2 and ϕ∗ = 0.8330475. The result indicates that the set of lists R reaches the satisfactionexpectation so that the solution alternatives are satisfactory and efficient for the interests ofthe DM.
There is satisfaction if . . . Abm×p ≥ |1− ϕ ∗ |
Substituting . . . 5(3×2) = 0.84
|1− 0.8330475| = 0.1669525
Yes, there is satisfaction 0.84 ≥ 0.1669525
(20)
Tables 22 and 23 show the data used in each individual to generate the lists andthe evaluation of the results. In Table 23, personality parameters corresponding to eachdecision profile are used to influence satisfaction and preferences. The same satisfactionparameters (Table 10) were applied in the experiments of the three individuals with differentprofiles. The above is the purpose of observing the impact of the personality on the results,despite having the same satisfaction or expectation, and observing how it complements thesatisfaction, producing highly satisfactory results when both factors are present.
In Table 24, the previous experiment has been replicated, only that this time threedifferent personality-decision profiles are involved than that of the previously analyzed indi-vidual (cooperative decision profile). In this experiment, the results of six lists with/withoutsatisfaction for each decision profile (strict, optimistic, and inquirer) have been evaluated.That is, solutions generated with the presence of satisfaction and without its presence areevaluated. These lists also consider only two criteria.
Table 22. Information from three individuals under studies with different decision profiles.
Profile Status Criteria Thresholds Tol.
b q u v λ β ε ϕ∗
StrictWS Price 15.23 18.85 22.14 1.07 0.20 0.08 0.23
Contents 150.72 223.56 298.05
WoS Price 14.88 16.49 18.11 0.92 0.17 0.08 0.166Contents 147.27 195.53 243.8
OptimisticWS Price 36.71 47.20 56.28 0.63 0.02 0.01 1.23
Contents 800.54 1039.43 1248.25
WoS Price 35.93 41.63 47.33 0.54 0.02 0.01 0.91Contents 783.41 916.62 1049.83
InquirerWS Price 35.01 44.38 49.28 0.93 0.13 0.06 0.39
Contents 179.95 343.55 483.67
WoS Price 34.39 38.8 43.21 0.8 0.12 0.06 0.30Contents 176.76 300.4 424.05

Axioms 2022, 11, 232 23 of 31
Table 23. Personality parameters corresponding to each decision profile.
Factor Profile Parameters
Personality
— Value Equality UtilityStrict 0.253846154 0.26 0.353846154
Optimistic 0.053076923 0.175384615 0.247692308Inquirer 0.27 0.2715385 0.4715385
Satisfaction — 7.34 1 7.62
Table 24. Experimentation of the impact of satisfaction in three individuals with different deci-sion profiles.
Profile Status Lists Hits (Ab) Satisf. (Equation (20))
Prices Contents
Strict
With satisfactionList 1 57.8 980
5 de 6List 2 65.70 2342 YESList 3 53.69 842
Without satisfactionList 1 69.90 1942
0 de 6List 2 70.70 1042 NOList 3 72.00 2342
Price Contents
Optimistic
With satisfactionList 1 60.00 1880
4 de 6List 2 65.80 2480 YESList 3 75.69 1110
Without satisfactionList 1 62.69 2342
3 de 6List 2 67.70 2842 YESList 3 67 2380
Price Contents
Inquirer
With satisfactionList 1 70.40 1042
5 de 6List 2 70.90 2442 YESList 3 60.50 980
Without satisfactionList 1 56.40 842
3 de 6List 2 67.00 2880 NOList 3 75.50 3480
The resulting shopping lists are shown in Table 24; each decision profile presents threelists for each strategy (with/without satisfaction) with the accumulated values of the priceand content criteria. The lists of each strategy have been selected from the deliberativeprocess (NOSGA-II) and represent the most optimal set of solutions suggested by the VDMconcerning the satisfaction, preferences, and personality of a DM.
The results of the experiment with three individuals with different profiles in Table 24indicate that the optimistic profile has a similar performance in both cases (with/withoutsatisfaction). The above is due to its high tolerance since optimistic or relaxed individualsare very open to decisions other than their preferred ones. Hence, their satisfaction ishigh, possibly in most decision contexts, so lists with the influence of satisfaction meetthe expectations of the optimistic DM. In contrast, in the case of the inquirer and strictprofile, the satisfaction-influenced lists have a more substantial advantage in meeting thesatisfaction expectation.
In Table 25, the same instances of the experiment above (Table 24) have been used,but evaluating each of the three decision profiles (with/without satisfaction) has. In the saidtable, similar behavior is observed concerning the results of Table 24, where an optimisticindividual in both cases (with/without satisfaction) shows a very high tolerance. In thecase of the individual with the strict profile, only the instance I1 was accepted as satisfactory,and the difference in results can be seen when satisfaction is present and when it is notpresent. In the inquirer profile, instances I2 and I5 show that the presence of satisfactionrepresents a difference concerning its absence. In Table 25, the terminology used is as

Axioms 2022, 11, 232 24 of 31
follows: H (Hits), WS (With satisfaction), WoS (Without satisfaction), S (Satisfaction), Y(Yes), N (No), and I (Instance).
Table 25. Experimentation with three decision profiles using six data instances.
Profile
Instance Values Strict Optimistic Inquirer
Price ContentWS WoS WS WoS WS WoS
H S H S H S H S H S H S
I157.8 980
5 Y 4 N 5 Y 5 Y 5 Y 5 Y65.7 234253.69 842
I269.9 1942
0 N 0 N 4 Y 4 Y 4 Y 1 N70.70 104272.00 2342
I360.00 1880
2 N 1 N 4 Y 4 Y 3 N 3 N65.80 248075.69 1110
I462.69 2342
1 N 0 N 3 Y 3 Y 3 N 3 N67.70 284267.00 2380
I570.40 1042
2 N 2 N 5 Y 5 Y 5 Y 3 N70.9 244260.50 980
I656.40 842
2 N 2 N 4 Y 4 Y 3 N 3 N67.00 288075.50 3480
The results of Table 25 were subjected to a statistical analysis taking the Hits (H) columnof the WS and WoS groups of the six instances evaluated with the three profiles of the DMs’.The statistical test applied was Wilcoxon to compare both groups and determine significantdifferences between them. The significance level used for the test was 0.05, obtaining ap-value of 0.0393, which means that the difference in means of both groups is the same,so the null hypothesis is rejected. The preceding affirms a significant difference when asatisfaction model is integrated into an optimization problem than when its integration isnot considered.
6. Discussion of Results
In this research work, the satisfaction model proposed was subjected to experimenta-tion, validating whether the definition of the satisfaction parameters of this model generatesa significant and positive influence on the preferences of a DM, improving the deliberativeprocess of a virtual agent.
Four types of individuals were required in food product shopping to test the satis-faction model. The strategy applied to ensure that these individuals provided distinctivecharacteristics to the experimentation was through the PMUDC-I model [2]. PMUDC-Iprovides a way to identify individuals through personality and decision profiling. Theseprofiles are optimistic, collaborative, inquirer, and strict. In addition, NOSGA-II [8] wasused like an optimization strategy that acts as the deliberative process of the VDM, produc-ing the shopping lists requested by individuals according to their preferences, satisfaction,and personality.
In the results of the experimentation shown in Table 21, carried out with the collabora-tive profile DM, the comparison between the criteria of the products expected by the DMand the lists suggested by the VDM could be observed. In said comparison, the level ofcorrect answers was very significant, achieving a total of five correct answers out of six.

Axioms 2022, 11, 232 25 of 31
The more correct answers, the greater the possibility of covering the satisfaction expectationof the DM. The above could be corroborated by applying Equation (20), showing thatthe DM with collaborative characteristics is 84% satisfied with the suggestions given bythe VDM.
The data provided in Tables 22 and 23 were used to replicate the previous experiment,generating instances or shopping lists suggested by the VDM for three different individuals.These individuals are identified under the strict, optimistic/relaxed, and inquirer profiles.The total number of instances generated was six, of which two of them were generatedthrough the corresponding data of each individual, integrating and restricting the influenceof the satisfaction model.
Table 24 shows the results of the experimentation with the six instances generated withthe three individuals. These results clearly show that integrating a satisfaction model toinfluence an agent’s deliberation positively impacts the scope of the satisfaction expectationconcerning when it is not integrated. It is worth mentioning that the optimistic DM wasthe only one that managed to reach the satisfaction expectation in both cases due to theirflexible characteristics being satisfied more easily and thus, reflected in a high tolerance. Thecorrect answers more clearly describe the scope of the satisfaction expectation accordingto the profile of each DM. For example, in the case of the strict DM, the hits highlight thatintegrating a satisfaction model improves the scope of the satisfaction expectation. Whenintegrating the characteristics of satisfaction, five out of six correct answers were obtained.On the contrary, zero of six correct answers were obtained by not integrating satisfaction.
In the experiment presented in Table 25, the six instances of the experiment in Table 24were used. In this new experiment, the six instances with the three individuals (strict, opti-mistic, and inquirer) were evaluated using the satisfaction metric proposed in Equation (20).From this new experimental case, we observed that the optimistic DM reached their satis-faction expectation regardless of whether or not there was any influence on satisfaction.In the strict DM, it can be seen that only one instance (I1) covers the level of satisfactionrequired by said individual, showing five of six correct answers when satisfaction wasintegrated compared to four of six correct answers when satisfaction does not influence.In the rest of the instances of the strict profile, the number of correct answers did not exceedtwo. In the case of the inquirer DM, it was possible to meet the expectation of satisfactionin three instances, of which instance I2 stands out, due to it showing a clear significantdifference when integrating satisfaction with four of six correct answers concerning one ofsix correct answers when satisfaction is not integrated.
To strengthen the results obtained from the experiment presented in Table 25, they weresubjected to the Wilcoxon statistical test. The results reveal the feasibility of consideringthe characteristics of satisfaction in a computable model to improve the cognitive processof a virtual agent.
The experimentation presented in this work confirms that the proposed satisfactionmodel is a novel contribution to behavioral simulation. However, despite the results andthe consistent behavior of each individual, it is necessary to strengthen these advantages.The above could be through the integration of personality traits more representative ofsatisfaction or other elements that assist in modeling the satisfaction of individuals moreprecisely. The preceding could give rise to future research that generates more significantadvantages in the experimentation results than that reported in this work.
7. Conclusions
In this document, a satisfaction model capable of influencing and improving thedecision-making process of a virtual agent in an optimization context was developed.The above was possible by integrating models from the literature aimed at assisting in thesimulation of behaviors, such as the NOSGA-II preference-based strategy, the PMUDC-Imodel, and its predecessor in the development phase PMUDC-II, as well as models ofsatisfaction with work and customer, approaches.

Axioms 2022, 11, 232 26 of 31
According to the above, the main objective of this research was achieved by usingthe attributes provided by the PMUDC-I, PMUDC-II models, and the satisfaction modelto assist in modeling and influencing the preferences of a DM, managing to improve thecognitive process of a virtual agent, as observed in the experimentation carried out inthis work.
The integration of parameters and attributes of personality and satisfaction generatean impact on preferences confirming the hypothesis that arises from the main objective ofthis work, demonstrating that better solutions are provided by integrating a satisfactionmodel compared to processes that do not consider integrating it.
In addition to contributing to developing a satisfaction model, an intelligent agentarchitecture was also developed to facilitate an interaction mechanism with the DM. The sat-isfaction model was integrated with the personality model and the NOSGA-II metaheuristicin the deliberative process.
However, despite contributing to a satisfaction model that provides excellent scope forimproving optimization process solutions focused on behavior simulation, there are stillcertain unknowns that limit the efficiency of the results in some way. These deficienciesor unknowns could be resolved by modeling other significant impacts, such as thoseaddressed. Nevertheless, the above is a reason to continue research and analyze theemulation of human behavior through computable models that provide credibility in thedevelopment of virtual entities.
Author Contributions: Conceptualization, J.C.-R. and M.L.M.-R.; methodology, J.C.-R. and N.R.-V.;software, J.C.-R.; validation, C.G.-S. and L.A.-V.; formal analysis, N.R.-V. and M.L.M.-R.; investigation,J.C.-R.; resources, L.A.-V. and C.G.-S.; data curation, J.C.-R. and M.L.M.-R.; writing—original draftpreparation, J.C.-R. and M.L.M.-R.; writing—review and editing, N.R.-V., L.A.-V. and C.G.-S.; visual-ization, J.C.-R.; supervision, M.L.M.-R. and N.R.-V.; project administration, M.L.M.-R. All authorshave read and agreed to the published version of the manuscript.
Funding: This research received no external funding.
Institutional Review Board Statement: Not applicable.
Informed Consent Statement: Not applicable.
Data Availability Statement: Not applicable.
Acknowledgments: The authors thanks CONACyT for the support granted through the Scholarshipfor Postgraduate Studies with CVU 784035, and the projects no. 3058, A1-S-11012. Moreover, wethank the Laboratorio Nacional de Tecnologías de la Información (LANTI), and acknowledge thesupport of ITCM, and the TECNM project 14612.22-P.
Conflicts of Interest: The authors declare no conflict of interest.
Sample Availability: Not applicable.
AbbreviationsThe following abbreviations are used in this manuscript:
NOSGA-II Non-Outranking Sorting Genetic AlgorithmDM Decision-MakerVDM Virtual Decision-MakerIVA Intelligent Virtual AgentPMUDC Personality Model Under Decision Context
FFM-OCEANFive-Factor Model-Openness, Conscientiousness, Extraversion, Agreeableness,Neuroticism
MBTI Myers-Brigg Type IndicatorKTS Keirsey Temperament Sorted

Axioms 2022, 11, 232 27 of 31
Appendix A. Case of the Study Details
The Table A1 present the products used in the food shopping case study, which consistsof 55 product variants.
Table A1. Table of products used in the experimentation with the case study of foods products.
No. Product Price Content No. Product Price Content
1 Water 5.8 600 29 Milk 21 10002 Water 6 1000 30 Milk 28.3 15003 Water 8 1500 31 Milkshake 7.2 2504 Water 12 2000 32 Milkshake 8.5 2005 Water 8.5 600 33 Milkshake 7.2 2506 Water 12.6 1500 34 Milkshake 21.5 10007 Water 6 500 35 Wholemeal bread 29.5 4808 Water 9 1500 36 Wholemeal bread 34.5 6809 Water 9 2000 37 Wholemeal bread 30.7 567
10 Instant coffee 38 180 38 Wholemeal bread 82 54011 Instant coffee 41 180 39 Wholemeal bread 64 45012 Instant coffee 63 205 40 Sweetbread 32 24013 Instant coffee 90 225 41 Sweetbread 9.9 6214 Instant coffee 155.5 350 42 Sweetbread 32.9 24015 Instant coffee 399 1200 43 Sweetbread 31.9 33016 Instant coffee 62 120 44 Sweetbread 14 20017 Soda 13.1 600 45 Dessert 115 70018 Soda 12 355 46 Dessert 11 11419 Soda 29 2000 47 Dessert 24.5 32420 Soda 30.6 2500 48 Dessert 15.4 1421 Soda 34.5 3000 49 Instant coffee 47.5 18022 Soda 10 600 50 Milk 50 100023 Soda 8 355 51 Milkshake 50 100024 Soda 21.9 2000 52 Instant coffee 41.9 25025 Soda 24 2500 53 Sweetbread 13.9 12526 Soda 25 3000 54 Milkshake 8.5 20027 Milk 19.9 1000 55 Sweetbread 6 10028 Milk 18.9 1000
Appendix B. Results from the Types-Based Personality Questionnaire
This section presents the results of the MBTI personality model questionnaire based onpersonality types [28]. This questionnaire consists of 4 questions that try to recognize thepreference of individuals to act in their environment. These characteristics are representedby a label consisting of 4 dichotomies or letters that form the individual’s personality profile.These dichotomies come from a set of 8 letters with which a total of 16 personality profilescan be formed. The results of the application of this questionnaire are presented in Table A2,where the MBTI profile of the four individuals or DM with whom the experimentation wascarried out in this work and their decision profile is given by the PMUDC-I model [2] toidentify the DM in decision-making more accurately.
Table A2. According to [2,28], the MBTI questionnaire results were applied to four DM.
No. of DM MBTI Profile PMUDC-I Profile
1 ESFP Optimistic2 ISFJ Collaborative3 INTP Inquirer4 ISTJ Strict
Appendix C. Results from Traits-Based Personality Questionnaire
This section presents the results of the IPIP-NEO questionnaire [26] based on personal-ity traits from the FFM-OCEAN model [25]. The questionnaire consists of 120 questions(reduced version) that aim to collect information about the strengths and weaknesses of anindividual. Table A3 presents the results of the questionnaire applied to the four individualsmentioned in Table A2, where the values of the facets of interest in this work are observed

Axioms 2022, 11, 232 28 of 31
according to each DM. In general, this table shows the dimensions or factors of OCEAN, thevalue of the dimension (factor value), the facets of each dimension, and the DM identifiedthrough the profile provided by PMUDC-I [2].
Table A3. Results of the IPIP-NEO questionnaire [26] belonging to the four DM under study.
PMUDC-I Profile
OCEAN Factors OCEAN Facets Optimistic (DM 1) Collaborative (DM 2) Inquirer (DM 3) Strict (DM 4)
Extraversion
Activity Level 0.3 0.80 0.27 0.78
Gregariousness 0.75 0.55 0.08 0.17
Excitement-Seeking 0.41 0.17 0.04 0.38
Factor value 0.60 0.70 0.21 0.38
Agreeableness
Morality 0.83 0.89 0.61 0.17
Modesty 0.69 0.65 0.89 0.35
Altruism 0.38 0.95 0.33 0.34
Factor value 0.18 0.88 0.60 0.05
Conscientiousness
Self-Efficacy 0.34 0.8 0.01 0.58
Cautiousness 0.93 0.72 0.64 0.64
Factor value 0.17 0.65 0.18 0.59
Neuroticism
Anxiety 0.3 0.64 0.55 0.3
Anger 0.27 0.27 0.2 0.65
Immoderation 0.42 0.48 0.38 0.31
Factor value 0.30 0.43 0.52 0.42
OpennessImagination 0.74 0.5 0.19 0.17
Factor value 0.34 0.59 0.51 0.20
Appendix D. Results form Preferences Questionnaire
This section presents the questionnaire proposed by Castro et al. [2], necessary togenerate representative parameters of the preferences of a DM through the PMUDC-I model.The questionnaire aims to collect information on the preferences of the DM according toa decision context, which in this work was applied under a context of shopping of foodproducts. The way in which this shopping context is expressed is through presentingthe DM with a set of food products from which he must select the ones of his preference,as well as forming shopping lists with said products, according to what is requested.in the questionnaire. In this way, it is possible to collect the DM’s preferences in thisshopping environment and form parameters representative of the DM’s preferences. Thefood products presented in Table A1 are the ones that the questionnaire uses to acquire thepreferential information of the DM. Table A4 shows the results of the questionnaire appliedto the four DM mentioned in Table A2, where the parameters or preference thresholdsgiven by the PMUDC-I model are presented with the influence of satisfaction (WS) andwithout the influence of satisfaction (WoS). The values presented were rounded to twofigures after the point.

Axioms 2022, 11, 232 29 of 31
Table A4. Preference thresholds resulting from the application of the preference questionnaire in thefour DM under study
Profile Status Thresholds
Criteria q u v λ β ε
Optimistic (DM 1)WS Price 36.71 47.20 56.28 0.63 0.02 0.01
Contents 800.54 1039.43 1248.25
WoS Price 35.93 41.63 47.33 0.54 0.02 0.01Contents 783.41 916.62 1049.83
Collaborative (DM 2)WS Price 24.63 38.52 47.26 0.85 0.096 0.041
Contents 192.04 328.93 424.33
WoS Price 23.78 31.81 39.85 0.71 0.08 0.04Contents 185.37 271.58 357.79
Inquirer (DM 3)WS Price 35.01 44.38 49.28 0.93 0.13 0.06
Contents 179.95 343.55 483.67
WoS Price 34.39 38.8 43.21 0.8 0.12 0.06Contents 176.76 300.4 424.05
Strict (DM 4)WS Price 15.23 18.85 22.14 1.07 0.20 0.08
Contents 150.72 223.56 298.05
WoS Price 14.88 16.49 18.11 0.92 0.17 0.08Contents 147.27 195.53 243.8
Appendix E. Satisfaction Questionnaire (Satisfaction Profile of the DM) and Results
This section presents the questionnaire proposed in this work, which collects informa-tion on the satisfaction of the DM. This questionnaire consists of five questions that meetthe satisfaction expectation of the DM according to a service or product. Table A5 showsthe satisfaction questionnaire, which gathers the satisfaction characteristics of the DM toform a satisfaction profile.
Table A5. Satisfaction questionnaire (satisfaction profile of the DM).
No. Question
1 What is the expected performance of your product?__Very low __low __Medium __Good __Very good
2 What is the quality you expect to perceive from your product?__Very low __low __Medium __Good __Very good
3 Does the product represent any emotional value to you?__Very little __Little __Regular __A lot of __Too much
4 In general terms, what is the expectation you expect from the product?__Very little __Little __Regular __A lot of __Too much
5 Do you think the product will meet your expectations?__Very little __Little __Regular __A lot of __Too much
Derived from the results of the proposed satisfaction questionnaire, representativeparameters of DM satisfaction are generated. These parameters are calculated using thestrategies shown in Sections 5.1 and 5.2. The values of these parameters are representativefor the four DM under study. The parameters and their values are as follows: value −7.34;equality −1; and utility −7.62.
Appendix F. Results from RIASEC Test
This Section presents the result of the application of the RIASEC [16,41] test. Thisquestionnaire consists of 6 dimensions and 42 questions that collect information on thework areas you perform best. The six dimensions comprise the RIASEC literals, where each

Axioms 2022, 11, 232 30 of 31
literal comprises seven questions. The result is a label formed by the three literals with thehighest score.
As in the previous Appendix E, the RIASEC result was used for the four studiedindividuals. The RIASEC result and its values are as follows: R (REALISTIC) −7; I(INVESTIGATIVE) −5 and A (ARTISTIC) −5.
This questionnaire is related to job satisfaction because it exposes the areas where theindividual has a better performance and, therefore, greater satisfaction.
References1. Cruz-Reyes, L.; Fernández, E.; Rangel-Valdez, N. A Metaheuristic Optimization-Based Indirect Elicitation of Preference Parameters
for Solving Many-Objective Problems. Int. J. Comput. Intell. Syst. 2017, 10, 56–77. [CrossRef]2. Castro-Rivera, J.; Morales-Rodríguez, M.L.; Rangel-Valdez, N.; Cruz-Reyes, L.; Pazos R., R.A. Prioritization of Elements Selection
in Order-Picking Problems through a Preference Model Influenced by Personality. In Handbook of Research on Metaheuristics forOrder Picking Optimization in Warehouses to Smart Cities; Ortiz-Zezzatti, A.O., Rivera, G., Gómez-Santillán, C., Sánchez-Lara, B.,Eds.; IGI Global: Hershey, PA, USA, 2019; pp. 117–142. [CrossRef]
3. Mallareddy, T. Employee job satisfaction a Case Study of South Central Railway. Ph.D. Thesis, Gulbarga University, Kalaburagi,Karnataka, India, 2015.
4. Hom, W. An Overview of Customer Satisfaction Models; Reports—Descriptive 141; ERIC: Pacific Grove, CA, USA, 2000.5. Frikha, H.M.; Charfi, S. Inferring an ELECTRE I model from binary outranking relations. Int. J. Multicriteria Decis. Mak. 2018,
7, 263–275. [CrossRef]6. García-Rodríguez, R. Hiper-heurístico para Resolver el Problema de Cartera de Proyectos Sociales. Master’s Thesis, Instituto
Tecnológico de Ciudad Madero, Cd. Madero, Tamaulipas, Mexico, 2010.7. Liesiö, J.; Mild, P.; Salo, A. Preference programming for robust portfolio modeling and project selection. Eur. J. Oper. Res. 2007,
181, 1488–1505. [CrossRef]8. Fernández, E.; López, E.; López, F.; Coello-Coello, C.A. Increasing Selective Pressure Toward the Best Compromise in Evolutionary
Multiobjective Optimization: The Extended NOSGA Method. J. Inf. Sci. Int. J. 2011, 181, 44–56. [CrossRef]9. Brief, A.P. Attitudes in and around Organizations; SAGE Publications: Thousand Oaks, CA, USA, 1998; Volume 9.10. Pujol-Cols, L.J.; Dabos, G.E. Satisfacción laboral: Una revisión de la literatura acerca de sus principales determinantes. Estud.
Gerenciales 2018, 34, 3–18. [CrossRef]11. Moorman, R.H. The Influence of Cognitive and Affective Based Job Satisfaction Measures on the Relationship Between Satisfaction
and Organizational Citizenship Behavior. SAGE Publ. 1993, 46, 759–776. [CrossRef]12. Spector, P.E. Job Satisfaction: Application, Assessment, Causes, and Consequences; SAGE Publications: Thousand Oaks, CA, USA,
1997; Volume 1.13. Flores-Juárez, J.B. ¿Por qué Medir la SatisfaccióN del Cliente? 2019. Available online: https://circulotne.com/por-que-medir-la-
satisfaccion-del-cliente.html (accessed on 30 April 2022).14. Locke, E.A. The nature and causes of job satisfaction. In Handbook of Industrial and Organizational Psychology; Dunnette, M.D., Ed.;
Rand McNally College Pub. Co.: Chicago, IL, USA, 1976; pp. 1297–1349.15. Porter, L.W.; Lawler, E.E. Managerial Attitudes and Performance; Irwin-Dorsey Series in Behavioral Science in Business; R.D. Irwin,
Inc.: Homewood, IL, USA, 1968; Volume 1.16. Deng, C.P.; Armstrong, P.I.; Rounds, J. The fit of Holland’s RIASEC model to US occupations. J. Vocat. Behav. 2007, 71, 1–22.
[CrossRef]17. Erevelles, S.; Leavitt, C. A Comparison of Current Models of Consumer Satisfaction/Dissatisfaction. J. Consum. Satisf. Dissatisf.
Complain. Behav. 1992, 5, 114–194.18. Polaino-Lorente, A.; Cabanyes-Truffino, J.; Pozo-Armentia, A.d. Fundamentos de Psicología de la Personalidad, 2nd ed.; Rialp
Editions: Madrid, Spain, 2003; Volume 1.19. Ahrndt, S.; Fähndrich, J.; Albayrak, S. Modelling of Personality in Agents: From Psycology to Implementation. In Proceeding of the
Fourth International Workshop on Human-Agent Interaction Design and Models (HAIDM 2015), Co-Located with AAMAS 2015; Bordini,R.H., Elkind, E., Weiss, G., Yolum, P., Eds.; IFAAMAS: Istanbul, Turkey, 2015; pp. 1–16.
20. Pérez-Pinillos, D.; Fernández, S.; Borrajo, D. Modeling Motivations, Personality Traits and Emotional States in Deliberative AgentsBased on Automated Planning. In International Conference on Agents and Artificial Intelligence: Agents and Artificial Intelligence;Filipe, J., Fred, A., Eds.; Springer: Berlin/Heidelberg, Germany, 2013; Volume 271, pp. 146–160. [CrossRef]
21. Eysenck, H.J.; Eysenck, S.B.G. Psychoticism as a Dimension of Personality; Crane, Russak: New York, NY, USA, 1977; Volume 1.22. Eysenck, H.J. Dimensions of Personality; Transaction Publishers: London, UK, 1998; Volume 1.23. Cattell, R.B. Personality: A Systematic Theoretical and Factual Study, 1st ed.; McGraw-Hill Publications in Psychology; McGraw-Hill:
New York, NY, USA, 1950; Volume 1.24. Cattell, H.E.; Mead, A.D. The Sixteen Personality Factor Questionnaire. In The Sage Handbook of Personality Theory and Assessment;
Boyle, G.J., Matthews, G., Saklofske, D.H., Eds.; SAGE Publications: Thousand Oaks, CA, USA, 2008; Volume 2, pp. 135–159.

Axioms 2022, 11, 232 31 of 31
25. McCrae, R.; John, O. An introduction to the Five-Factor Model and Its Applications. J. Personal. 1992, 60, 175–215. [CrossRef][PubMed]
26. Penn-State. The IPIP-NEO (International Personality Item Pool Representation of the NEO PI-R). 2018. Available online:http://www.personal.psu.edu/~j5j/IPIP/ (accessed on 30 April 2022).
27. Salvit, J.; Sklar, E. Modulating Agent Behavior using Human Personality Type. In Workshop on Human-Agent Interaction Designand Models (HAIDM) at Autonomous Agents and MultiAgent Systems (AAMAS); IFAAMAS: Valencia, Spain, 2012; pp. 145–160.
28. The-Myers-Briggs-Foundation. The Myers & Briggs Foundation. 2022. Available online: http://www.myersbriggs.org/my-mbti-personality-type/ (accessed on 30 April 2022).
29. Keirsey, D. Please Understand Me II: Temperament Character Intelligence, 1st ed.; Prometheus Nemesis Book Company: Del Mar, CA,USA, 2006.
30. Fernández, E.; López, E.; Navarro, J.; Vega, I. Aplicación de metaheurísticas multiobjetivo a la solución de problemas de carterade proyectos públicos con una valoración multidimensional de su impacto. Gestión Y Política Pública 2011, 20, 381–432.
31. Delgado-Hernández, X.; Morales-Rodríguez, M.; Rangel-Valdez, N.; Cruz Reyes, L.; Castro-Rivera, J. Development of Con-versational Deliberative Agents Driven by Personality via Fuzzy Outranking Relations. Int. J. Fuzzy Syst. 2020, 22, 2720–2734.[CrossRef]
32. Seltzer, B.K.; Ones, D.S.; Tatar, A. Using Personality Facets to Understand the Nature of Personality-Satisfaction Relationships:Findings from Meta-Analytic Bifactor Latent Modeling. Career Dev. Int. 2017, 22, 477–506. [CrossRef]
33. Bolos, , M.I.; Bradea, I.A.; Delcea, C. A Fuzzy Logic Algorithm for Optimizing the Investment Decisions within Companies.Symmetry 2019, 11, 186. [CrossRef]
34. Morales-Rodríguez, M.L.; Medellín-Martínez, F.; González B., J.J. Modeling Facial Expression of Intelligent Virtual Agents. In SoftComputing for Intelligent Control and Mobile Robotics; Castillo, O., Kacprzyk, J., Pedrycz, W., Eds.; Springer: Berlin/Heidelberg,Germany, 2010; Volume 318, pp. 303–313. [CrossRef]
35. Carvajal-Villaplana, Z. Teorías y modelos: Formas de representación de la realidad. Comunicación 2002, 12, 1–14.36. Russell, S.J.; Norvig, P.; Davis, E. Artificial Intelligence: A Modern Approach, 3rd ed.; Prentice Hall Series in Artificial Intelligence;
Pearson Education, Inc.: Upper Saddle River, NJ, USA, 2010; Volume 1.37. Iglesias-Fernández, C. Definición de una Metodología para el Desarrollo de Sistemas Multiagente. Ph.D. Thesis, Universidad
Politécnica de Madrid, Madrid, Spain, 1998.38. Wooldridge, M.J. An Introduction to MultiAgent Systems, 2nd ed.; John Wiley & Sons Ltd.: London, UK, 2002; Volume 1.39. Gutiérrez, J.J. ¿Qué es un Framework Web? 2005. Available online: http://www.lsi.us.es/~javierj/investigacion_ficheros/
Framework.pdf (accessed on 30 April 2022).40. Sarasty-España, H.F. Documentación y AnáLisis de los Principales Frameworks de Arquitectura de Software en Aplicaciones
Empresariales. Specialty Thesis, Facultad de InformáTica—Universidad Nacional de La Plata, Buenos Aires, Argentina, 2015.41. Career and Technical Education. Hawai’I Career Pathway System Handbook. 2022. Available online: http://www.
hawaiipublicschools.org/DOE%20Forms/CTE/CTEhandbook.pdf (accessed on 30 April 2022).42. Furnham, A. The Psychology of Behaviour at Work: The Individual in the Organization, 2nd ed.; Taylor & Francis: Abingdon, UK, 2012;
Volume 2.43. RAE. Diccionario de la Lengua EspañOla, 23rd ed. 2022. Available online: https://dle.rae.es/ (accessed on 9 May 2022).44. Castro-Rivera, J. Cuantificación de Rasgos de la Personalidad a TravéS del Modelo OCEAN para Influir en la Toma de Decisiones.
2021. Available online: https://www.academia.edu/61508873/Cuantificaci%C3%B3n_de_rasgos_de_la_personalidad_a_trav%C3%A9s_del_modelo_OCEAN_para_influir_en_la_toma_de_decisiones (accessed on 11 November 2021).
45. Carazo, A.F.; Gómez, T.; Molina, J.; Hernández-Díaz, A.G.; Guerrero, F.M.; Caballero, R. Solving a comprehensive model formultiobjective project portfolio selection. Comput. Oper. Res. 2010, 37, 630–639. [CrossRef]
46. Rivera-Zárate, G. Enfoque MetaheuríStico HíBrido para el Manejo de Muchos Objetivos en OptimizacióN de Cartera de ProyectosInterdependientes con Decisiones de Apoyo Parcial. Doctoral Thesis, Instituto Tecnológico de Tijuana, Tijuana, Baja California,Mexico, 2015.
47. Fernández, E.; López, E.; Mazcorro, G.; Olmedo, R.; Coello-Coello, C.A. Application of the Non-Outranked Sorting GeneticAlgorithm to Public Project Portfolio Selection. J. Inf. Sci. 2013, 228, 131–149. [CrossRef]