Modeling of the structural features of integral-membrane proteins reverse-environment prediction of...
10
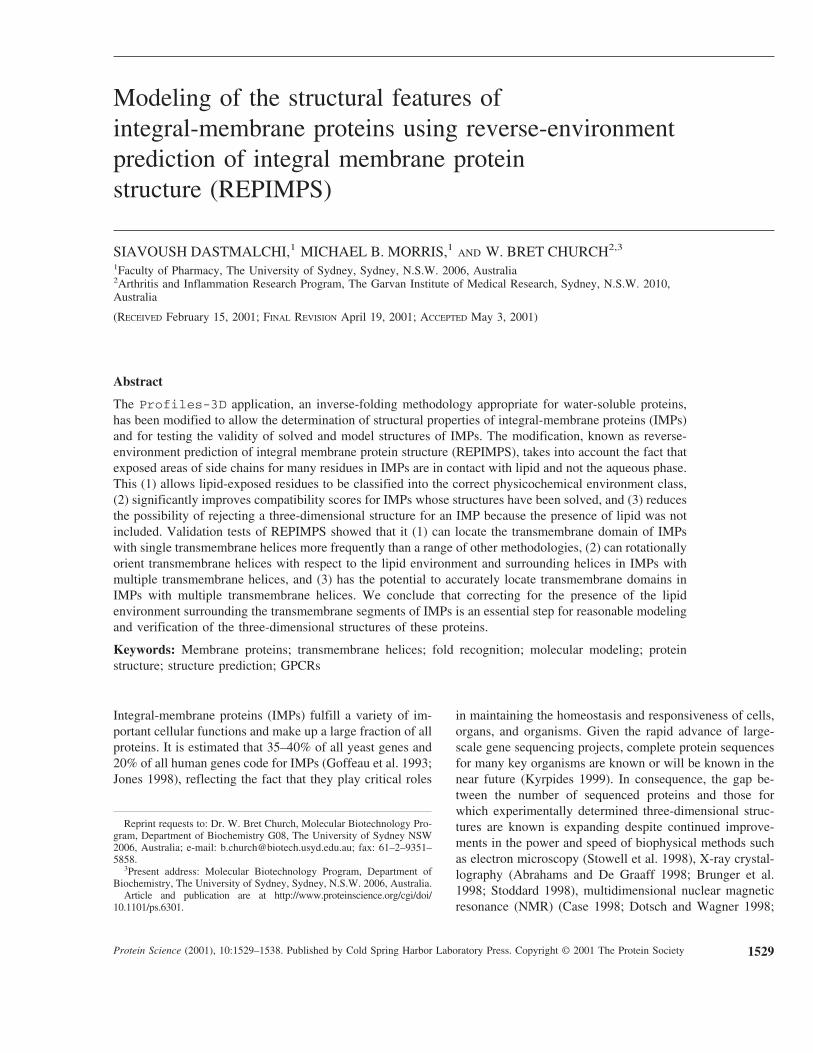
Modeling of the structural features of integral-membrane proteins using reverse-environment prediction of integral membrane protein structure (REPIMPS) SIAVOUSH DASTMALCHI, 1 MICHAEL B. MORRIS, 1 AND W. BRET CHURCH 2,3 1 Faculty of Pharmacy, The University of Sydney, Sydney, N.S.W. 2006, Australia 2 Arthritis and Inflammation Research Program, The Garvan Institute of Medical Research, Sydney, N.S.W. 2010, Australia (RECEIVED February 15, 2001; FINAL REVISION April 19, 2001; ACCEPTED May 3, 2001) Abstract The Profiles-3D application, an inverse-folding methodology appropriate for water-soluble proteins, has been modified to allow the determination of structural properties of integral-membrane proteins (IMPs) and for testing the validity of solved and model structures of IMPs. The modification, known as reverse- environment prediction of integral membrane protein structure (REPIMPS), takes into account the fact that exposed areas of side chains for many residues in IMPs are in contact with lipid and not the aqueous phase. This (1) allows lipid-exposed residues to be classified into the correct physicochemical environment class, (2) significantly improves compatibility scores for IMPs whose structures have been solved, and (3) reduces the possibility of rejecting a three-dimensional structure for an IMP because the presence of lipid was not included. Validation tests of REPIMPS showed that it (1) can locate the transmembrane domain of IMPs with single transmembrane helices more frequently than a range of other methodologies, (2) can rotationally orient transmembrane helices with respect to the lipid environment and surrounding helices in IMPs with multiple transmembrane helices, and (3) has the potential to accurately locate transmembrane domains in IMPs with multiple transmembrane helices. We conclude that correcting for the presence of the lipid environment surrounding the transmembrane segments of IMPs is an essential step for reasonable modeling and verification of the three-dimensional structures of these proteins. Keywords: Membrane proteins; transmembrane helices; fold recognition; molecular modeling; protein structure; structure prediction; GPCRs Integral-membrane proteins (IMPs) fulfill a variety of im- portant cellular functions and make up a large fraction of all proteins. It is estimated that 35–40% of all yeast genes and 20% of all human genes code for IMPs (Goffeau et al. 1993; Jones 1998), reflecting the fact that they play critical roles in maintaining the homeostasis and responsiveness of cells, organs, and organisms. Given the rapid advance of large- scale gene sequencing projects, complete protein sequences for many key organisms are known or will be known in the near future (Kyrpides 1999). In consequence, the gap be- tween the number of sequenced proteins and those for which experimentally determined three-dimensional struc- tures are known is expanding despite continued improve- ments in the power and speed of biophysical methods such as electron microscopy (Stowell et al. 1998), X-ray crystal- lography (Abrahams and De Graaff 1998; Brunger et al. 1998; Stoddard 1998), multidimensional nuclear magnetic resonance (NMR) (Case 1998; Dotsch and Wagner 1998; Reprint requests to: Dr. W. Bret Church, Molecular Biotechnology Pro- gram, Department of Biochemistry G08, The University of Sydney NSW 2006, Australia; e-mail: [email protected]; fax: 61–2–9351– 5858. 3 Present address: Molecular Biotechnology Program, Department of Biochemistry, The University of Sydney, Sydney, N.S.W. 2006, Australia. Article and publication are at http://www.proteinscience.org/cgi/doi/ 10.1101/ps.6301. Protein Science (2001), 10:1529–1538. Published by Cold Spring Harbor Laboratory Press. Copyright © 2001 The Protein Society 1529
Transcript of Modeling of the structural features of integral-membrane proteins reverse-environment prediction of...
Modeling of the structural features ofintegral-membrane proteins using reverse-environmentprediction of integral membrane proteinstructure (REPIMPS)
SIAVOUSH DASTMALCHI,1 MICHAEL B. MORRIS,1 AND W. BRET CHURCH2,3
1Faculty of Pharmacy, The University of Sydney, Sydney, N.S.W. 2006, Australia2Arthritis and Inflammation Research Program, The Garvan Institute of Medical Research, Sydney, N.S.W. 2010,Australia
(RECEIVED February 15, 2001; FINAL REVISION April 19, 2001; ACCEPTED May 3, 2001)
Abstract
The Profiles-3D application, an inverse-folding methodology appropriate for water-soluble proteins,has been modified to allow the determination of structural properties of integral-membrane proteins (IMPs)and for testing the validity of solved and model structures of IMPs. The modification, known as reverse-environment prediction of integral membrane protein structure (REPIMPS), takes into account the fact thatexposed areas of side chains for many residues in IMPs are in contact with lipid and not the aqueous phase.This (1) allows lipid-exposed residues to be classified into the correct physicochemical environment class,(2) significantly improves compatibility scores for IMPs whose structures have been solved, and (3) reducesthe possibility of rejecting a three-dimensional structure for an IMP because the presence of lipid was notincluded. Validation tests of REPIMPS showed that it (1) can locate the transmembrane domain of IMPswith single transmembrane helices more frequently than a range of other methodologies, (2) can rotationallyorient transmembrane helices with respect to the lipid environment and surrounding helices in IMPs withmultiple transmembrane helices, and (3) has the potential to accurately locate transmembrane domains inIMPs with multiple transmembrane helices. We conclude that correcting for the presence of the lipidenvironment surrounding the transmembrane segments of IMPs is an essential step for reasonable modelingand verification of the three-dimensional structures of these proteins.
Keywords: Membrane proteins; transmembrane helices; fold recognition; molecular modeling; proteinstructure; structure prediction; GPCRs
Integral-membrane proteins (IMPs) fulfill a variety of im-portant cellular functions and make up a large fraction of allproteins. It is estimated that 35–40% of all yeast genes and20% of all human genes code for IMPs (Goffeau et al. 1993;Jones 1998), reflecting the fact that they play critical roles
in maintaining the homeostasis and responsiveness of cells,organs, and organisms. Given the rapid advance of large-scale gene sequencing projects, complete protein sequencesfor many key organisms are known or will be known in thenear future (Kyrpides 1999). In consequence, the gap be-tween the number of sequenced proteins and those forwhich experimentally determined three-dimensional struc-tures are known is expanding despite continued improve-ments in the power and speed of biophysical methods suchas electron microscopy (Stowell et al. 1998), X-ray crystal-lography (Abrahams and De Graaff 1998; Brunger et al.1998; Stoddard 1998), multidimensional nuclear magneticresonance (NMR) (Case 1998; Dotsch and Wagner 1998;
Reprint requests to: Dr. W. Bret Church, Molecular Biotechnology Pro-gram, Department of Biochemistry G08, The University of Sydney NSW2006, Australia; e-mail: [email protected]; fax: 61–2–9351–5858.
3Present address: Molecular Biotechnology Program, Department ofBiochemistry, The University of Sydney, Sydney, N.S.W. 2006, Australia.
Article and publication are at http://www.proteinscience.org/cgi/doi/10.1101/ps.6301.
Protein Science (2001), 10:1529–1538. Published by Cold Spring Harbor Laboratory Press. Copyright © 2001 The Protein Society 1529
Marassi and Opella 1998), and site-directed spin labeling(Hubbell et al. 1998).
Comparative modeling of the three-dimensional struc-tures of proteins based on sequence similarity can now beapplied with reasonable accuracy to ten times more proteinsequences than the number of experimentally determinedprotein structures (Sanchez and Sali 1997). Although thisapproach becomes unreliable when the sequence identitydrops below 20–30% (Sander and Schneider 1991), it hasbeen estimated that more than 25% of all sequences in theSWISS-PROT sequence database can be modeled by ho-mology (Rost et al. 1995). The success of such modelingaside, knowledge about the structure of IMPs remains sparsebecause so few high-resolution three-dimensional structuresare available (Table 1). This lack of experimental data meansthat it is not usually possible to use sequence homology meth-ods to build accurate three-dimensional models of IMPs.
A number of inverse-folding methodologies have beendeveloped for water-soluble proteins which, rather than re-
lying on sequence alignments, attempt to predict three-di-mensional structures of proteins on the basis of physico-chemical parameters (Sippl 1990; Bowie et al. 1991; Joneset al. 1992; Bowie and Eisenberg 1993; Bryant andLawrence 1993; Godzik et al. 1993; Godzik 1995; Sippl1995; Hu et al. 1997). The methodologies use potentialfunctions frequently involving terms for pairwise aminoacid interaction and solvent exposure. The forms of thepotential functions and the weighting of the terms involveddiffer from method to method. Recently incorporated as-pects in fold recognition include multiple sequence align-ment and secondary structure predictions (Jones et al. 1999;Koretke et al. 1999; Murzin 1999).
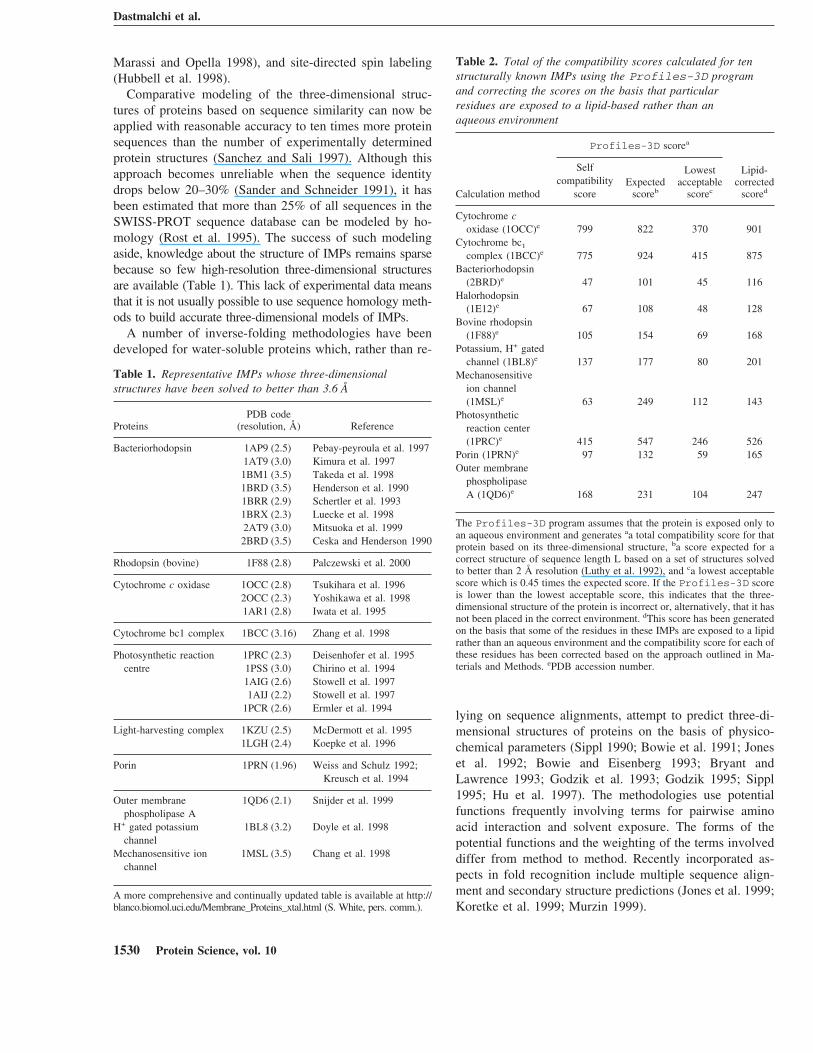
Table 2. Total of the compatibility scores calculated for tenstructurally known IMPs using the Profiles-3D programand correcting the scores on the basis that particularresidues are exposed to a lipid-based rather than anaqueous environment
Calculation method
Profiles-3D scorea
Lipid-corrected
scored
Selfcompatibility
scoreExpected
scoreb
Lowestacceptable
scorec
Cytochrome coxidase (1OCC)e 799 822 370 901
Cytochrome bc1
complex (1BCC)e 775 924 415 875Bacteriorhodopsin
(2BRD)e 47 101 45 116Halorhodopsin
(1E12)e 67 108 48 128Bovine rhodopsin
(1F88)e 105 154 69 168Potassium, H+ gated
channel (1BL8)e 137 177 80 201Mechanosensitive
ion channel(1MSL)e 63 249 112 143
Photosyntheticreaction center(1PRC)e 415 547 246 526
Porin (1PRN)e 97 132 59 165Outer membrane
phospholipaseA (1QD6)e 168 231 104 247
The Profiles-3D program assumes that the protein is exposed only toan aqueous environment and generates aa total compatibility score for thatprotein based on its three-dimensional structure, ba score expected for acorrect structure of sequence length L based on a set of structures solvedto better than 2 Å resolution (Luthy et al. 1992), and ca lowest acceptablescore which is 0.45 times the expected score. If the Profiles-3D scoreis lower than the lowest acceptable score, this indicates that the three-dimensional structure of the protein is incorrect or, alternatively, that it hasnot been placed in the correct environment. dThis score has been generatedon the basis that some of the residues in these IMPs are exposed to a lipidrather than an aqueous environment and the compatibility score for each ofthese residues has been corrected based on the approach outlined in Ma-terials and Methods. ePDB accession number.
Table 1. Representative IMPs whose three-dimensionalstructures have been solved to better than 3.6 Å
ProteinsPDB code
(resolution, Å) Reference
Bacteriorhodopsin 1AP9 (2.5) Pebay-peyroula et al. 19971AT9 (3.0) Kimura et al. 19971BM1 (3.5) Takeda et al. 19981BRD (3.5) Henderson et al. 19901BRR (2.9) Schertler et al. 19931BRX (2.3) Luecke et al. 19982AT9 (3.0) Mitsuoka et al. 19992BRD (3.5) Ceska and Henderson 1990
Rhodopsin (bovine) 1F88 (2.8) Palczewski et al. 2000
Cytochrome c oxidase 1OCC (2.8) Tsukihara et al. 19962OCC (2.3) Yoshikawa et al. 19981AR1 (2.8) Iwata et al. 1995
Cytochrome bc1 complex 1BCC (3.16) Zhang et al. 1998
Photosynthetic reaction 1PRC (2.3) Deisenhofer et al. 1995centre 1PSS (3.0) Chirino et al. 1994
1AIG (2.6) Stowell et al. 19971AIJ (2.2) Stowell et al. 1997
1PCR (2.6) Ermler et al. 1994
Light-harvesting complex 1KZU (2.5) McDermott et al. 19951LGH (2.4) Koepke et al. 1996
Porin 1PRN (1.96) Weiss and Schulz 1992;Kreusch et al. 1994
Outer membrane 1QD6 (2.1) Snijder et al. 1999phospholipase A
H+ gated potassium 1BL8 (3.2) Doyle et al. 1998channel
Mechanosensitive ion 1MSL (3.5) Chang et al. 1998channel
A more comprehensive and continually updated table is available at http://blanco.biomol.uci.edu/Membrane_Proteins_xtal.html (S. White, pers. comm.).
Dastmalchi et al.
1530 Protein Science, vol. 10
In the Profiles-3D inverse-folding method (Biosym/Molecular Simulations, Profiles-3D 95.0), the physico-chemical environments of residues in the three-dimensionalstructures of proteins are quantified in terms of (1) the areaof a residue’s side chain buried away from the aqueousphase, (2) the fraction of side-chain area in contact with apolar environment (polar atoms from the aqueous phase andfrom other residues), and (3) local secondary structure(Bowie et al. 1991; Luthy et al. 1992). Based on thesecriteria, the probability of finding specific residues in aparticular class of environment can be estimated by analyz-ing the well-defined structures of a set of water-solubleproteins. These probabilities are used to generate a 3D→ 1Dscoring table which can be used to link sequences and three-dimensional structures together; that is, possible structuresfor a protein can be generated following the conversion ofthe string of residues to a string of environment classes. Inaddition to finding compatible structures for a given se-quence, the alignment of an amino acid sequence with a 3Dprofile can be used for other purposes such as testing thevalidity of a preliminary or model structure, and findingsequences compatible with a defined structure.
We considered that such a general quantitative descrip-tion of environment preference could be adapted to predictstructural features of IMPs. Despite the difference in polar-ity of their surrounding environments, it has been suggestedthat IMPs and water-soluble proteins are variations on com-mon structural themes, differing primarily in the polarity ofthe residues on the protein surface (Rees et al. 1989). Ouraim was to modify the Profiles-3D approach so that itwould take into account the fact that certain residues inIMPs are exposed to a lipid environment rather than anaqueous environment. By making this correction, it shouldbe possible to predict structural features of IMPs and toassess the validity of both experimentally determined andmodeled structures of IMPs.
Results
Compatibility scores of IMPs improve when the lipidenvironment is included
Table 2 shows the total of the compatibility scores for tenrepresentative IMPs whose structures are known to highresolution. When using the Profiles-3D program alone,the assumption is made that all residues on the surface of theprotein are exposed to an aqueous environment. This givesrise to totals of the compatibility scores which are less thanthe scores expected for these proteins based on their se-quence lengths. In fact, for bacteriorhodopsin, the value ofthe total score is close to the lowest acceptable score. Ascore below this indicates that the structure is incorrect. Inthis case, however, the low Profiles-3D score probablydoes not indicate an incorrect structure but rather indicates
that 56% of the surface area of bacteriorhodopsin is exposedto a lipid rather than an aqueous environment.
We have recalculated the totals of the compatibilityscores for these proteins after first estimating which resi-dues are in contact with lipid in the membrane and assigningthe correct environmental class for lipid-exposed residuesusing Equation 1 and A*b (see Materials and Methods fordetails). On this basis, the totals of the compatibility scoresfor these proteins are now similar to or exceed the expectedscores in all cases (Table 2). As expected, the biggest per-centage correction was for bacteriorhodopsin, whose scoreimproved ∼150%. Other than for halorhodopsin and mecha-nosensitive ion channel, the relative improvements aresmaller for the other proteins such as cytochrome c oxidaseand the photosynthetic reaction center because a smallerpercentage of residues are in contact with lipid.
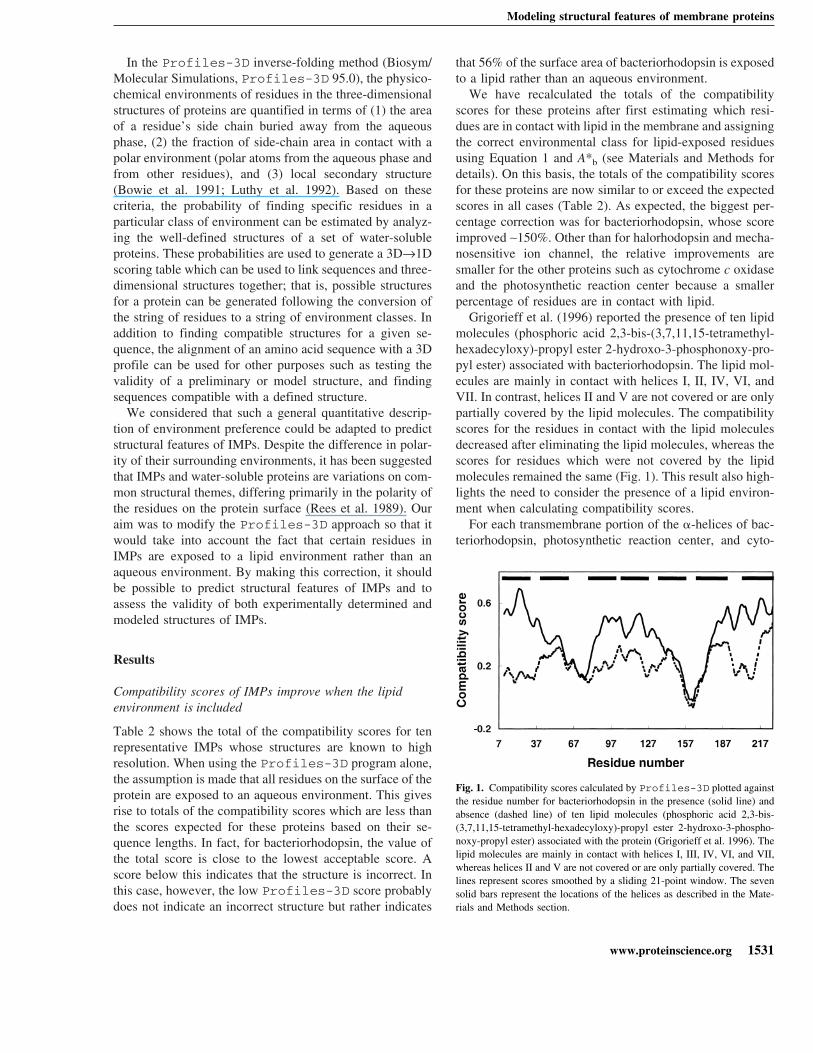
Grigorieff et al. (1996) reported the presence of ten lipidmolecules (phosphoric acid 2,3-bis-(3,7,11,15-tetramethyl-hexadecyloxy)-propyl ester 2-hydroxo-3-phosphonoxy-pro-pyl ester) associated with bacteriorhodopsin. The lipid mol-ecules are mainly in contact with helices I, II, IV, VI, andVII. In contrast, helices II and V are not covered or are onlypartially covered by the lipid molecules. The compatibilityscores for the residues in contact with the lipid moleculesdecreased after eliminating the lipid molecules, whereas thescores for residues which were not covered by the lipidmolecules remained the same (Fig. 1). This result also high-lights the need to consider the presence of a lipid environ-ment when calculating compatibility scores.
For each transmembrane portion of the �-helices of bac-teriorhodopsin, photosynthetic reaction center, and cyto-
Fig. 1. Compatibility scores calculated by Profiles-3D plotted againstthe residue number for bacteriorhodopsin in the presence (solid line) andabsence (dashed line) of ten lipid molecules (phosphoric acid 2,3-bis-(3,7,11,15-tetramethyl-hexadecyloxy)-propyl ester 2-hydroxo-3-phospho-noxy-propyl ester) associated with the protein (Grigorieff et al. 1996). Thelipid molecules are mainly in contact with helices I, III, IV, VI, and VII,whereas helices II and V are not covered or are only partially covered. Thelines represent scores smoothed by a sliding 21-point window. The sevensolid bars represent the locations of the helices as described in the Mate-rials and Methods section.
Modeling structural features of membrane proteins
www.proteinscience.org 1531
chrome c oxidase, we calculated the areas of the side chainsexposed to lipid and averaged this area per residue. We thencalculated the compatibility score for each of these trans-membrane domains assuming that the protein had been in-serted into a membrane, subtracted the score calculated as-suming an aqueous environment, and divided the differenceby the number of residues involved. The final value is ameasure of the improvement in the compatibility score forthe transmembrane domain compared to what would nor-mally be calculated using Profiles-3D. Figure 2 showsthe correlation between this improved score and the averagearea of side chain exposed to lipid. As expected, those trans-membrane domains which had the greatest area per residueexposed to the lipid had the largest improvement in theircompatibility score per residue.
Rotating individual helices in IMPs
We tested whether our method can discriminate betweendifferent three-dimensional structures for the same IMP.This was done by making changes to the native structureand then recalculating the total of the compatibility scores.We used two different approaches: in the first, we used thestructure for bacteriorhodopsin that contains a retinal mol-
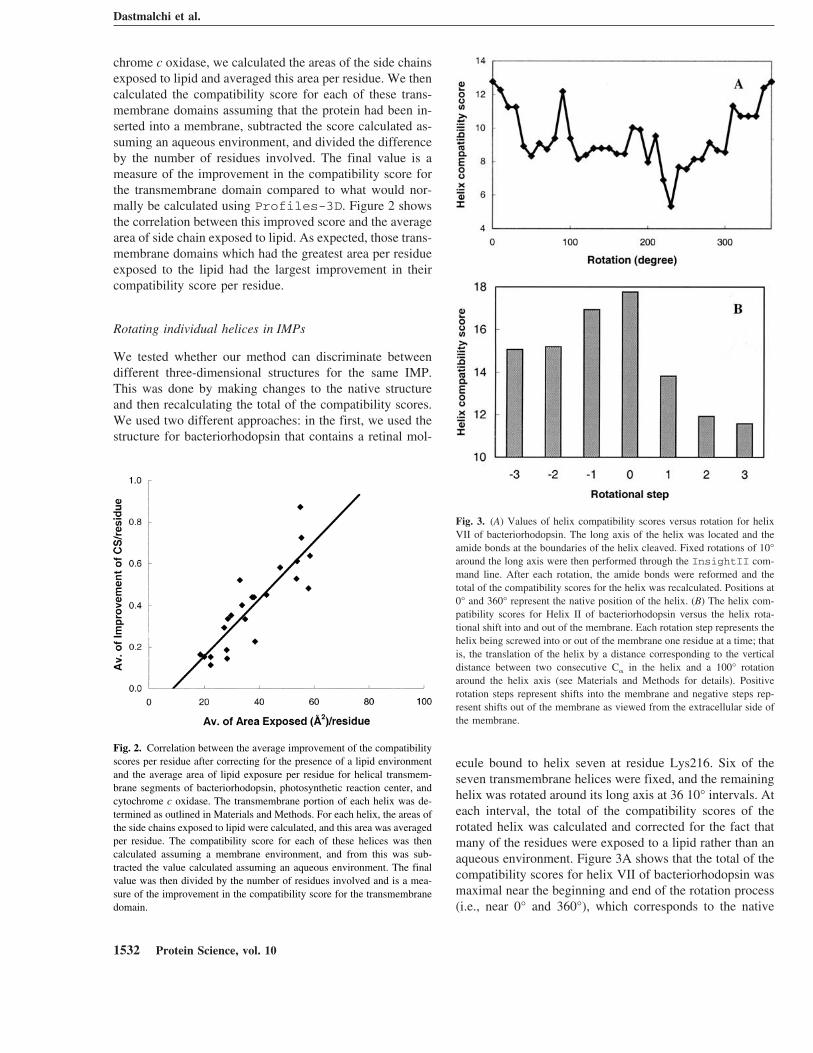
ecule bound to helix seven at residue Lys216. Six of theseven transmembrane helices were fixed, and the remaininghelix was rotated around its long axis at 36 10° intervals. Ateach interval, the total of the compatibility scores of therotated helix was calculated and corrected for the fact thatmany of the residues were exposed to a lipid rather than anaqueous environment. Figure 3A shows that the total of thecompatibility scores for helix VII of bacteriorhodopsin wasmaximal near the beginning and end of the rotation process(i.e., near 0° and 360°), which corresponds to the native
Fig. 2. Correlation between the average improvement of the compatibilityscores per residue after correcting for the presence of a lipid environmentand the average area of lipid exposure per residue for helical transmem-brane segments of bacteriorhodopsin, photosynthetic reaction center, andcytochrome c oxidase. The transmembrane portion of each helix was de-termined as outlined in Materials and Methods. For each helix, the areas ofthe side chains exposed to lipid were calculated, and this area was averagedper residue. The compatibility score for each of these helices was thencalculated assuming a membrane environment, and from this was sub-tracted the value calculated assuming an aqueous environment. The finalvalue was then divided by the number of residues involved and is a mea-sure of the improvement in the compatibility score for the transmembranedomain.
Fig. 3. (A) Values of helix compatibility scores versus rotation for helixVII of bacteriorhodopsin. The long axis of the helix was located and theamide bonds at the boundaries of the helix cleaved. Fixed rotations of 10°around the long axis were then performed through the InsightII com-mand line. After each rotation, the amide bonds were reformed and thetotal of the compatibility scores for the helix was recalculated. Positions at0° and 360° represent the native position of the helix. (B) The helix com-patibility scores for Helix II of bacteriorhodopsin versus the helix rota-tional shift into and out of the membrane. Each rotation step represents thehelix being screwed into or out of the membrane one residue at a time; thatis, the translation of the helix by a distance corresponding to the verticaldistance between two consecutive C� in the helix and a 100° rotationaround the helix axis (see Materials and Methods for details). Positiverotation steps represent shifts into the membrane and negative steps rep-resent shifts out of the membrane as viewed from the extracellular side ofthe membrane.
Dastmalchi et al.
1532 Protein Science, vol. 10
position of the helix in the 3D structure. The total generallyfalls in the middle of the rotational range, indicating thatresidues were being placed in incompatible environments.Similar trends were observed for helices I–V of this protein.Helix VI, however, was an exception with the plot showinga broad maximum centered at 130° (data not shown) and thevalue at 0° being among the lowest calculated. The resultsfor all helices were similar in both the presence and absenceof retinal.
In the second test, individual helices of bacteriorhodopsinwere advanced into or out of the membrane one residue ata time by screwing the long axis of the helix. The processused effectively achieved rotation steps of ∼100°, resultingin the loss of one residue from one end of the transmem-brane segment, and the addition of a new residue to theother end of the segment. Figure 3B shows that the total ofthe compatibility scores for helix II of bacteriorhodopsindrops progressively from its maximum value obtained withthe helix in the native position. This was also the case forhelices I–V, and VII, both in the absence and presence ofretinal. Again, helix VI did not exhibit the same behavior asthe other helices; it showed no obvious trend with rotation.
Validating the location of transmembrane domainsusing REPIMPS
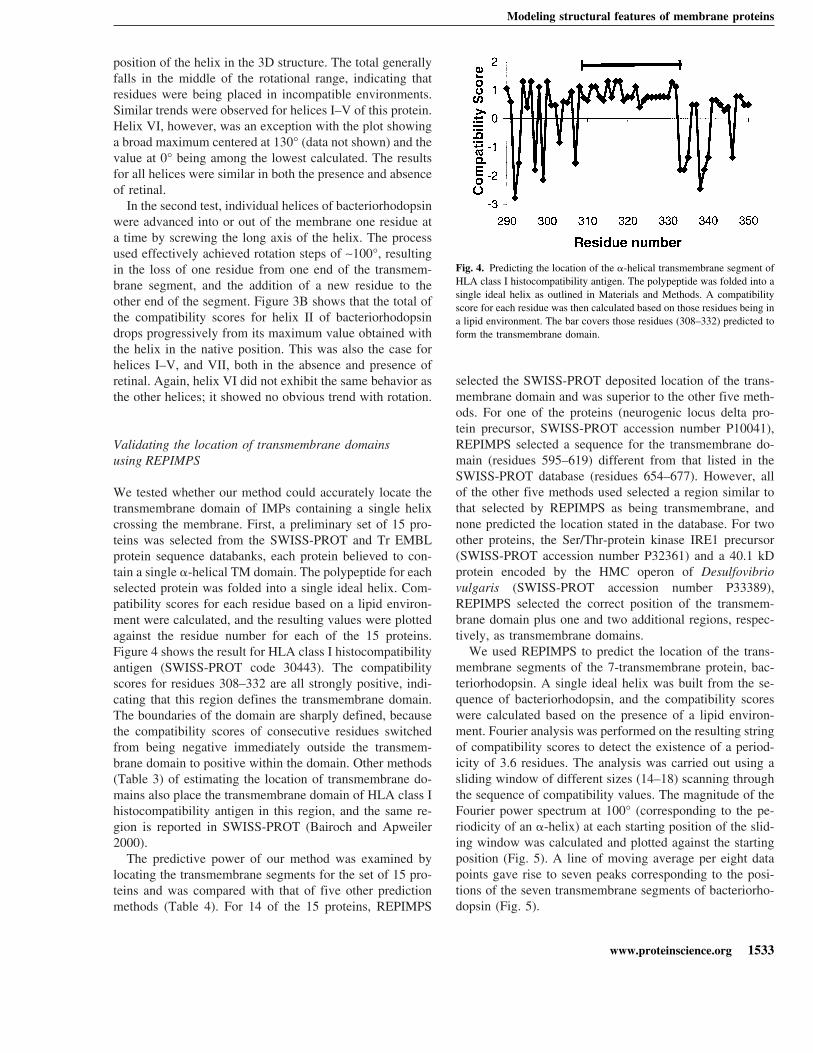
We tested whether our method could accurately locate thetransmembrane domain of IMPs containing a single helixcrossing the membrane. First, a preliminary set of 15 pro-teins was selected from the SWISS-PROT and Tr EMBLprotein sequence databanks, each protein believed to con-tain a single �-helical TM domain. The polypeptide for eachselected protein was folded into a single ideal helix. Com-patibility scores for each residue based on a lipid environ-ment were calculated, and the resulting values were plottedagainst the residue number for each of the 15 proteins.Figure 4 shows the result for HLA class I histocompatibilityantigen (SWISS-PROT code 30443). The compatibilityscores for residues 308–332 are all strongly positive, indi-cating that this region defines the transmembrane domain.The boundaries of the domain are sharply defined, becausethe compatibility scores of consecutive residues switchedfrom being negative immediately outside the transmem-brane domain to positive within the domain. Other methods(Table 3) of estimating the location of transmembrane do-mains also place the transmembrane domain of HLA class Ihistocompatibility antigen in this region, and the same re-gion is reported in SWISS-PROT (Bairoch and Apweiler2000).
The predictive power of our method was examined bylocating the transmembrane segments for the set of 15 pro-teins and was compared with that of five other predictionmethods (Table 4). For 14 of the 15 proteins, REPIMPS
selected the SWISS-PROT deposited location of the trans-membrane domain and was superior to the other five meth-ods. For one of the proteins (neurogenic locus delta pro-tein precursor, SWISS-PROT accession number P10041),REPIMPS selected a sequence for the transmembrane do-main (residues 595–619) different from that listed in theSWISS-PROT database (residues 654–677). However, allof the other five methods used selected a region similar tothat selected by REPIMPS as being transmembrane, andnone predicted the location stated in the database. For twoother proteins, the Ser/Thr-protein kinase IRE1 precursor(SWISS-PROT accession number P32361) and a 40.1 kDprotein encoded by the HMC operon of Desulfovibriovulgaris (SWISS-PROT accession number P33389),REPIMPS selected the correct position of the transmem-brane domain plus one and two additional regions, respec-tively, as transmembrane domains.
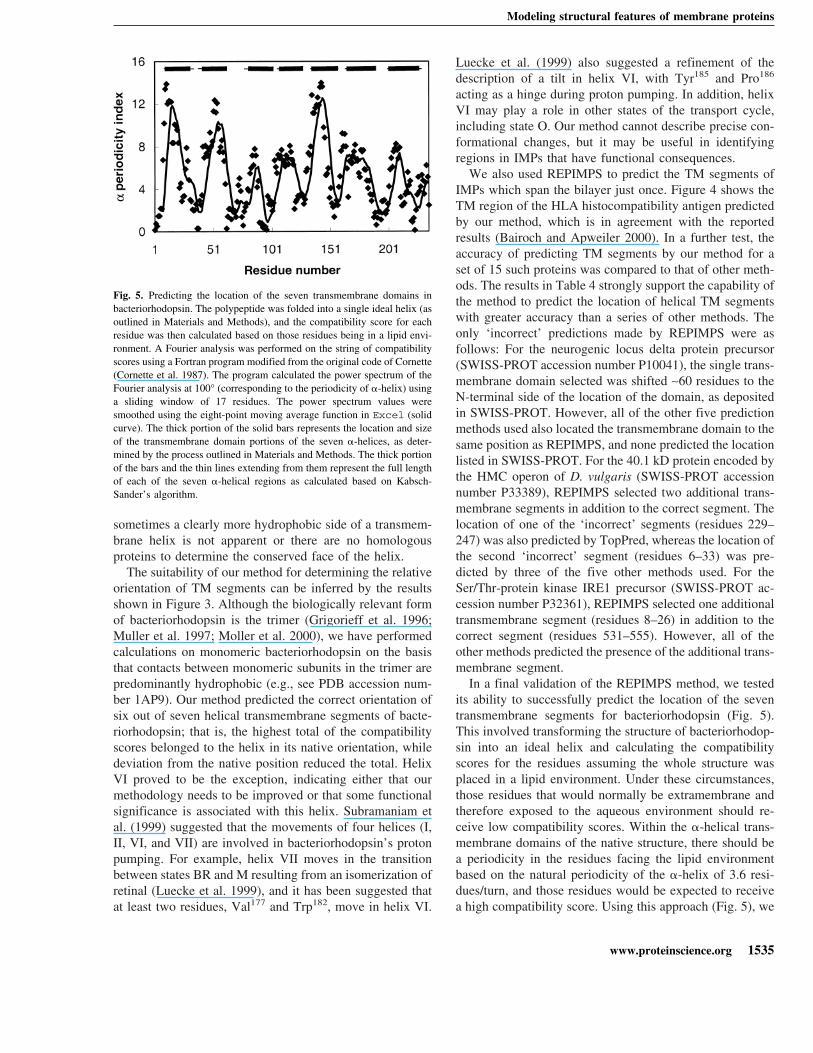
We used REPIMPS to predict the location of the trans-membrane segments of the 7-transmembrane protein, bac-teriorhodopsin. A single ideal helix was built from the se-quence of bacteriorhodopsin, and the compatibility scoreswere calculated based on the presence of a lipid environ-ment. Fourier analysis was performed on the resulting stringof compatibility scores to detect the existence of a period-icity of 3.6 residues. The analysis was carried out using asliding window of different sizes (14–18) scanning throughthe sequence of compatibility values. The magnitude of theFourier power spectrum at 100° (corresponding to the pe-riodicity of an �-helix) at each starting position of the slid-ing window was calculated and plotted against the startingposition (Fig. 5). A line of moving average per eight datapoints gave rise to seven peaks corresponding to the posi-tions of the seven transmembrane segments of bacteriorho-dopsin (Fig. 5).
Fig. 4. Predicting the location of the �-helical transmembrane segment ofHLA class I histocompatibility antigen. The polypeptide was folded into asingle ideal helix as outlined in Materials and Methods. A compatibilityscore for each residue was then calculated based on those residues being ina lipid environment. The bar covers those residues (308–332) predicted toform the transmembrane domain.
Modeling structural features of membrane proteins
www.proteinscience.org 1533
Discussion
We have adapted the Profiles-3D application, an in-verse-folding methodology appropriate for water-solubleproteins, to develop and test the idea that it might be usefulfor determining structural properties of IMPs. The resultsusing REPIMPS show that it is possible to use the samescoring system and set of environment classes for bothIMPs and water-soluble proteins. The only correction re-quired is to ensure that residues in contact with lipid areassigned to the correct class through the use of Equation 1.By taking into consideration the fact that certain residues inIMPs are exposed to a lipid environment, the total of thecompatibility scores for a series of IMPs whose three-di-mensional structures are known universally improved suchthat they were now close to or exceeded the expected scores(Table 2; Fig. 1). In addition, the greater the average area ofexposure of transmembrane residues to the lipid environ-
ment, the greater the improvement in the compatibilityscore (Fig. 2). Thus, correcting for the presence of the lipidenvironment surrounding transmembrane segments is an es-sential step for reasonable modeling and verification of thethree-dimensional structures of IMPs. It should be possibleto refine this approach by producing a scoring table specifi-cally for the transmembrane segments based on the cur-rently available three-dimensional structures of IMPs. Thetable itself could be refined as further high-resolution struc-tures of IMPs become available.
The relative orientation and depth of the helical trans-membrane segments are important structural features ofIMPs. Usually the decision on determining the interior-fac-ing side or lipid-facing side of helical transmembrane seg-ments is made by the analysis of hydrophobicity momentsor conservation patterns in these regions. In general, thehydrophobic and less-conserved side is more likely to facetoward the lipid bilayer (Baldwin et al. 1997). However,
Table 4. Prediction of the location of the single �-helical transmembrane region of a set of 15 IMPs using a suite of methodsa,b
REPIMPS SOSUI SPLIT TMHMM TMpred TopPred
Total number of predicted TM segments (T) 18 23 24 15 37 31Number of correctly located TM segments (C) 14 12 14 12 14 14Number of the proteins predicted as water-soluble protein (S) 0 1 0 1 0 0Prediction index: C/(T + S) 0.78 0.50 0.58 0.75 0.38 0.45
a SWISS-PROT accession numbers are O42204, O75503, P04195, P07359, P08195, P10041, P12555, P14585, P23654, P30443, P31789, P32361, P33389,P33767, and P34891.b Web locations of these programs are listed in Materials and Methods.
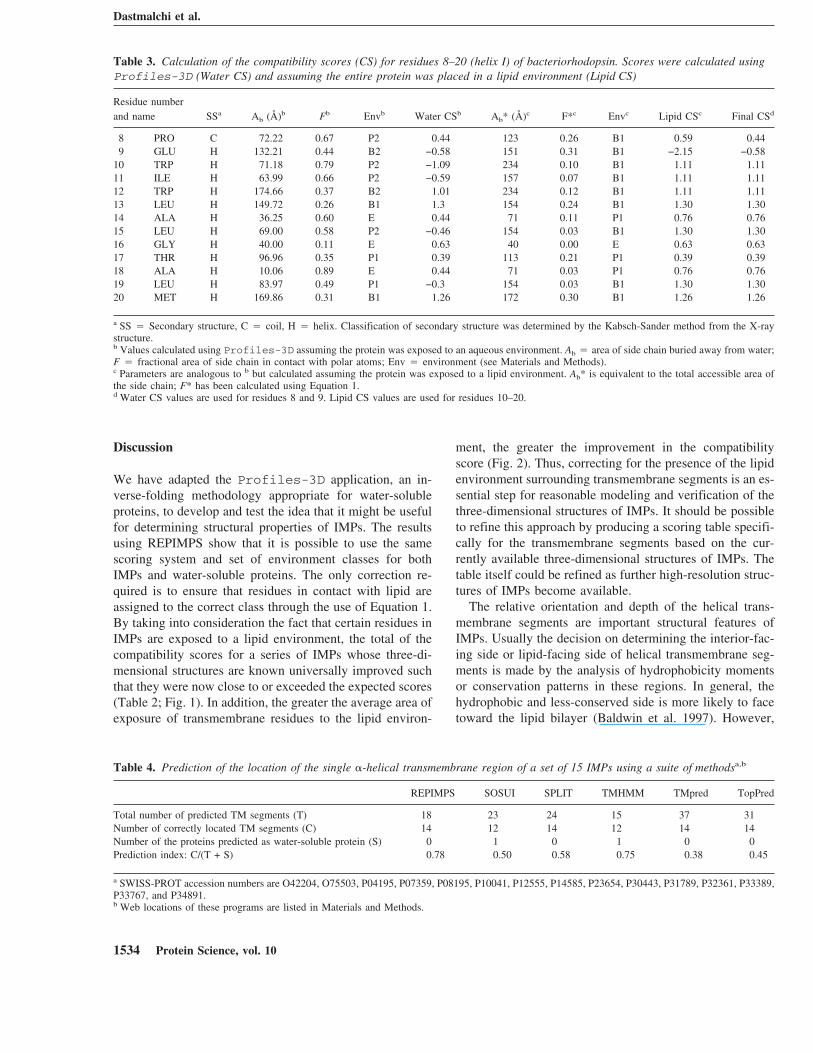
Table 3. Calculation of the compatibility scores (CS) for residues 8–20 (helix I) of bacteriorhodopsin. Scores were calculated usingProfiles-3D (Water CS) and assuming the entire protein was placed in a lipid environment (Lipid CS)
Residue numberand name SSa Ab (Å)b Fb Envb Water CSb Ab* (Å)c F*c Envc Lipid CSc Final CSd
8 PRO C 72.22 0.67 P2 0.44 123 0.26 B1 0.59 0.449 GLU H 132.21 0.44 B2 −0.58 151 0.31 B1 −2.15 −0.58
10 TRP H 71.18 0.79 P2 −1.09 234 0.10 B1 1.11 1.1111 ILE H 63.99 0.66 P2 −0.59 157 0.07 B1 1.11 1.1112 TRP H 174.66 0.37 B2 1.01 234 0.12 B1 1.11 1.1113 LEU H 149.72 0.26 B1 1.3 154 0.24 B1 1.30 1.3014 ALA H 36.25 0.60 E 0.44 71 0.11 P1 0.76 0.7615 LEU H 69.00 0.58 P2 −0.46 154 0.03 B1 1.30 1.3016 GLY H 40.00 0.11 E 0.63 40 0.00 E 0.63 0.6317 THR H 96.96 0.35 P1 0.39 113 0.21 P1 0.39 0.3918 ALA H 10.06 0.89 E 0.44 71 0.03 P1 0.76 0.7619 LEU H 83.97 0.49 P1 −0.3 154 0.03 B1 1.30 1.3020 MET H 169.86 0.31 B1 1.26 172 0.30 B1 1.26 1.26
a SS � Secondary structure, C � coil, H � helix. Classification of secondary structure was determined by the Kabsch-Sander method from the X-raystructure.b Values calculated using Profiles-3D assuming the protein was exposed to an aqueous environment. Ab � area of side chain buried away from water;F � fractional area of side chain in contact with polar atoms; Env � environment (see Materials and Methods).c Parameters are analogous to b but calculated assuming the protein was exposed to a lipid environment. Ab* is equivalent to the total accessible area ofthe side chain; F* has been calculated using Equation 1.d Water CS values are used for residues 8 and 9. Lipid CS values are used for residues 10–20.
Dastmalchi et al.
1534 Protein Science, vol. 10
sometimes a clearly more hydrophobic side of a transmem-brane helix is not apparent or there are no homologousproteins to determine the conserved face of the helix.
The suitability of our method for determining the relativeorientation of TM segments can be inferred by the resultsshown in Figure 3. Although the biologically relevant formof bacteriorhodopsin is the trimer (Grigorieff et al. 1996;Muller et al. 1997; Moller et al. 2000), we have performedcalculations on monomeric bacteriorhodopsin on the basisthat contacts between monomeric subunits in the trimer arepredominantly hydrophobic (e.g., see PDB accession num-ber 1AP9). Our method predicted the correct orientation ofsix out of seven helical transmembrane segments of bacte-riorhodopsin; that is, the highest total of the compatibilityscores belonged to the helix in its native orientation, whiledeviation from the native position reduced the total. HelixVI proved to be the exception, indicating either that ourmethodology needs to be improved or that some functionalsignificance is associated with this helix. Subramaniam etal. (1999) suggested that the movements of four helices (I,II, VI, and VII) are involved in bacteriorhodopsin’s protonpumping. For example, helix VII moves in the transitionbetween states BR and M resulting from an isomerization ofretinal (Luecke et al. 1999), and it has been suggested thatat least two residues, Val177 and Trp182, move in helix VI.
Luecke et al. (1999) also suggested a refinement of thedescription of a tilt in helix VI, with Tyr185 and Pro186
acting as a hinge during proton pumping. In addition, helixVI may play a role in other states of the transport cycle,including state O. Our method cannot describe precise con-formational changes, but it may be useful in identifyingregions in IMPs that have functional consequences.
We also used REPIMPS to predict the TM segments ofIMPs which span the bilayer just once. Figure 4 shows theTM region of the HLA histocompatibility antigen predictedby our method, which is in agreement with the reportedresults (Bairoch and Apweiler 2000). In a further test, theaccuracy of predicting TM segments by our method for aset of 15 such proteins was compared to that of other meth-ods. The results in Table 4 strongly support the capability ofthe method to predict the location of helical TM segmentswith greater accuracy than a series of other methods. Theonly ‘incorrect’ predictions made by REPIMPS were asfollows: For the neurogenic locus delta protein precursor(SWISS-PROT accession number P10041), the single trans-membrane domain selected was shifted ∼60 residues to theN-terminal side of the location of the domain, as depositedin SWISS-PROT. However, all of the other five predictionmethods used also located the transmembrane domain to thesame position as REPIMPS, and none predicted the locationlisted in SWISS-PROT. For the 40.1 kD protein encoded bythe HMC operon of D. vulgaris (SWISS-PROT accessionnumber P33389), REPIMPS selected two additional trans-membrane segments in addition to the correct segment. Thelocation of one of the ‘incorrect’ segments (residues 229–247) was also predicted by TopPred, whereas the location ofthe second ‘incorrect’ segment (residues 6–33) was pre-dicted by three of the five other methods used. For theSer/Thr-protein kinase IRE1 precursor (SWISS-PROT ac-cession number P32361), REPIMPS selected one additionaltransmembrane segment (residues 8–26) in addition to thecorrect segment (residues 531–555). However, all of theother methods predicted the presence of the additional trans-membrane segment.
In a final validation of the REPIMPS method, we testedits ability to successfully predict the location of the seventransmembrane segments for bacteriorhodopsin (Fig. 5).This involved transforming the structure of bacteriorhodop-sin into an ideal helix and calculating the compatibilityscores for the residues assuming the whole structure wasplaced in a lipid environment. Under these circumstances,those residues that would normally be extramembrane andtherefore exposed to the aqueous environment should re-ceive low compatibility scores. Within the �-helical trans-membrane domains of the native structure, there should bea periodicity in the residues facing the lipid environmentbased on the natural periodicity of the �-helix of 3.6 resi-dues/turn, and those residues would be expected to receivea high compatibility score. Using this approach (Fig. 5), we
Fig. 5. Predicting the location of the seven transmembrane domains inbacteriorhodopsin. The polypeptide was folded into a single ideal helix (asoutlined in Materials and Methods), and the compatibility score for eachresidue was then calculated based on those residues being in a lipid envi-ronment. A Fourier analysis was performed on the string of compatibilityscores using a Fortran program modified from the original code of Cornette(Cornette et al. 1987). The program calculated the power spectrum of theFourier analysis at 100° (corresponding to the periodicity of �-helix) usinga sliding window of 17 residues. The power spectrum values weresmoothed using the eight-point moving average function in Excel (solidcurve). The thick portion of the solid bars represents the location and sizeof the transmembrane domain portions of the seven �-helices, as deter-mined by the process outlined in Materials and Methods. The thick portionof the bars and the thin lines extending from them represent the full lengthof each of the seven �-helical regions as calculated based on Kabsch-Sander’s algorithm.
Modeling structural features of membrane proteins
www.proteinscience.org 1535
observed seven maxima, with each maximum located close tothe center of a transmembrane domain of bacteriorhodopsin.
In summary, we have modified an environment-basedinverse-folding method originally developed for water-soluble proteins. This approach has the potential to assessthe validity of experimentally determined IMP structuresand model structures and to predict structural features ofIMPs of unknown structure. We are in the process of opti-mizing the parameters for our method and extending thework presented here to test other structural parameters suchas packing. For example, it may be possible to develop otherpotential terms based on the success of other inverse-foldingmethods used for water-soluble proteins. In addition, we arein the process of refining our method for assessing the re-liability of models of IMP structures by encompassing adescription of the membrane environment. Methodologiesbased on inverse-folding potentials promise advantagesover sequence-alignment methods. Because only a smallnumber of existing structural templates for IMPs exist, wehope to examine the generality of the templates themselves,with the goal of reducing reliance on multiple sequencealignment and secondary structure in predicting the three-dimensional structures of IMPs.
Materials and methods
Databases and programs
All structure coordinates for the proteins used in this study wereretrieved from the Protein Data Bank (Berman et al. 2000). Se-quences and their annotations were from the SWISS-PROT and TrEMBL protein sequence database (Bairoch and Apweiler 2000).Computation was carried out on a Silicon Graphics workstation(Power Indigo2, R10000, 195 MHz processor). The Profiles-3D application was used within the InsightII molecular mod-eling package (v95.5, Molecular Simulations, San Diego).
The Profiles-3D software
For each residue in a protein of known three-dimensional structure,the Profiles-3D software will calculate (1) the area of eachresidue’s side chain that is buried away from the aqueous phase(Bowie et al. 1991), (2) the fraction of the area of each residue’sside chain that is in contact with polar atoms (either from thesolvent or other atoms in the protein), and (3) the secondary struc-ture (�-helix, �-strand, and other) for the residue based on theKABSCH-SANDER algorithm (Kabsch and Sander 1983). Basedon this information, each residue is assigned to one of 18 envi-ronment classes. A profile table can then be constructed in whicheach position in the sequence is assigned an environment class anda compatibility score for the residue filling the position. The com-patibility scores are derived from a basic set of 16 water-solubleproteins whose three-dimensional structures are known to highresolution and which represent a variety of protein folds. The totalof the compatibility scores, taking into account the size of theprotein, can be used to assess the validity of the structure.
Correcting compatibility scores for residue side-chainsin a lipid environment
For IMPs whose three-dimensional structures are known to highresolution (Table 1), a significant proportion of the residues would
normally be in contact with lipids of the membrane rather than theaqueous environment. Thus, a correction to values of the areas ofa side chain buried away from the aqueous phase and in contactwith polar atoms is required for those residues within the mem-brane. The equation used to correct the fractional area of side chainin contact with polar atoms, F*, is:
F* = F − �1 −Ab
At� (1)
where F is the uncorrected fractional area of side chain in contactwith polar atoms (i.e., calculated by the Profiles-3D assumingthat any exposed area of side chain faces an aqueous environment).Ab (Å2), also calculated by the Profiles-3D program, is thearea of side chain buried away from the aqueous environment andis defined as the solvent-accessible area of the side chain (At) in aGly-X-Gly tripeptide minus the solvent-accessible area of the sidechain in the protein. Values of At include the � carbon atom(Bowie et al. 1991). For those residues within the membrane, thetotal area of side chain buried away from the aqueous environment(A*b) was considered to be equal to At.
By using F*, A*b, and the local secondary structure of eachresidue located within the membrane of an IMP, it is possible toassign the appropriate environment class for each residue from theset of 18 environment classes. In this way, a residue exposed tolipid will be assigned differently and will have a new compatibilityscore, whereas a residue exposed to the aqueous phase will retainthe original class and compatibility score normally assigned byProfiles-3D.
Table 2 shows those proteins for which corrected compatibilityscores were obtained. Each of these proteins (except for porin andouter membrane phospholipase A) contains helical transmembranedomains. An empirical approach was used to identify the boundarybetween those residues in the polypeptide sequences exposed tothe aqueous phase and those buried in the membrane. This wasdone by first calculating (using Profiles-3D) the compatibilityscores for each residue in an IMP assuming that the IMP wasexposed only to water, and then recalculating (using an in-houseFortran program) the values using Equation 1 assuming the proteinwas entirely within the lipid membrane. For the proteins withhelical transmembrane domains, the point within each helix atwhich a marked improvement in the compatibility score was ob-served for the lipid-based value over the water-based value wastaken to be the boundary (Table 3). This approach accommodatesthe situation where a helical region may extend beyond the mem-brane into the aqueous environment. In ∼75% of cases, this bound-ary was clear. In those cases where the boundary was not as clearlydefined by this approach, one turn of helix was considered to lieoutside of the lipid membrane. A similar approach was used tolocate the boundaries of porin. In those cases where the boundarywas not clear, it was assumed that charged or polar residues (Ser,Thr, Tyr, Asn, Gln) represented the location of the boundary andthat residues at the top of the � turns were located outside of themembrane. It was assumed that water molecules filled the pore ofthe protein.
Once the boundaries were located, the total of the compatibilityscores for an IMP structure was calculated using the lipid-basedvalues for those residues located in the lipid bilayer and water-based values for those residues lying outside the bilayer (Table 3).
Rotation of individual helices within bacteriorhodopsin
Bacteriorhodopsin was selected because it contains seven close-to-ideal helices approximately perpendicular to the membrane. The
Dastmalchi et al.
1536 Protein Science, vol. 10
crystallized protein appears to retain both native conformation andactivity (Portmann et al. 1991; Landau and Luisi 1993; Hoch-koeppler et al. 1995). The rotation of individual helices was per-formed in two ways: (1) An individual helix was selected, the longaxis of the helix located, and the amide bonds at the boundaries ofthe helix cleaved. Fixed rotations of 10° around the long axis werethen performed through the InsightII command line. Aftereach rotation, the amide bonds were reformed, and the total of thecompatibility scores for the chosen helix was recalculated. (2) Anindividual helix was selected and effectively screwed into or out ofthe membrane one residue at a time. In order to simulate this typeof rotation, we used the mutation tool of the Swiss-PdbViewerprogram (v3.5b1). The backbone coordinates of the selected helixremained the same but the first residue of the helix within the lipidenvironment was replaced by the previous residue. In the sameway, the second residue was replaced by the first residue. Thisresidue replacement procedure was continued up to the end of themembrane region of the helix and left the last residue, previouslylying within the membrane, now lying outside of it. This in factsimulates the translation of the helix into the membrane by adistance corresponding to the vertical distance between two con-secutive C� in helix and a 100° rotation around the helix axis. Themutation tool in Swiss-PdbViewer automatically selects themost favorable rotamer to minimize steric clashes while increasingthe number of hydrogen and disulfide bonds (Ponder and Richards1987). Any remaining steric clashes were eliminated later eithermanually or using the “Fix selected side chains” option from theTools menu.
Detecting the transmembrane region of IMPswith a single transmembrane domain
The sequences of a random selection of 15 IMPs each believed tocontain a single �-helical transmembrane domain were down-loaded from SWISS-PROT and Tr EMBL. For this set, the highestpairwise alignment score was 19%. The sequence for each selectedprotein was folded into a single ideal helix using the Swiss-PdbViewer program (v3.5b1). The �-helical structures werebuilt from the sequences in FASTA format (Guex and Peitsch1997). Side chains were placed automatically by the program inmost favorable rotamer (Ponder and Richards 1987). A compat-ibility score for each residue in each protein was then calculatedbased on all residues being in a lipid environment.
Several other prediction methods were used to detect the loca-tion of transmembrane regions of the set of 15 single �-helix-containing IMPs listed in Table 4. These programs were run fromtheir web sites with the various options set at default values. Thenames and the web addresses of these programs are as follows:SOSUI (Hirokawa et al. 1998), http://sosui.proteome.bio.tuat.ac.jp/sosuiframe0E.html; SPLIT35 (Juretic and Lucin 1998), http://pref.etfos.hr/split/; Tmpred, http://www.ch.embnet.org/software/TMPRED_form.html; TMHMM (v. 0.1) (Sonnhammer et al. 1998),http://www.cbs.dtu.dk/services/TMHMM-1.0/; and TopPred2 (vonHeijne 1992), http://www.sbc.su.se/∼erikw/toppred2/.
Predicting the location of the seven transmembranedomains in bacteriorhodopsin
The sequence of bacteriorhodopsin was folded into a single idealhelix using the Swiss-PdbViewer program, as describedabove, and the compatibility score for each residue was then cal-culated based on all residues being in a lipid environment. A
Fourier analysis was performed on the string of compatibilityscores using a Fortran program modified from the original code ofCornette (Cornette et al. 1987). The program calculated the powerspectrum of the Fourier analysis using a sliding window of 14–18residues.
AcknowledgmentsThis work was supported by a scholarship from the Iranian Min-istry of Health and Medical Education to S. Dastmalchi and Aus-tralian Research Council and Sydney University Sesqui R and Dgrants to M.B. Morris.
The publication costs of this article were defrayed in part bypayment of page charges. This article must therefore be herebymarked “advertisement” in accordance with 18 USC section 1734solely to indicate this fact.
ReferencesAbrahams, J.P. and De Graaff, R. 1998. New developments in phase refinement.
Curr. Opin. Struct. Biol. 8: 601–605.Bairoch, A. and Apweiler, R. 2000. The SWISS-PROT protein sequence data-
base and its supplement TrEMBL in 2000. Nucleic Acids Res. 28: 45–48.Baldwin, J.M., Schertler, G.F.X., and Unger, V.M. 1997. An alpha-carbon
template for the transmembrane helices in the rhodopsin family of G-pro-tein-coupled receptors. J. Mol. Biol. 272: 144–164.
Berman, H.M., Westbrook, J., Feng, Z., Gililand, G., Bahat, T.N., Weissig, H.,and Shindyalov, P.E. 2000. The protein data bank. Nucleic Acids Res. 28:235–242.
Bowie, J.U. and Eisenberg, D. 1993. Inverted protein structure prediction. Curr.Opin. Struct. Biol. 3: 437–444.
Bowie, J.U., Luthy, R., and Eisenberg, D. 1991. A method to identify proteinsequences that fold into a known three-dimensional structure. Science 253:164–170.
Brunger, A.T., Adams, P.D., and Rice, M.L. 1998. Recent developments for theefficient crystallographic refinement of macromolecular structures. Curr.Opin. Struct. Biol. 8: 606–611.
Bryant, S.H. and Lawrence, C.E. 1993. An empirical energy function for thread-ing protein sequence through the folding motif. Proteins 16: 92–112.
Case, D.A. 1998. The use of chemical shifts and their anisotropies in bimolecu-lar structure determination. Curr. Opin. Struct. Biol. 8: 624–630.
Ceska, T.A. and Henderson, R. 1990. Analysis of high-resolution electron dif-fraction patterns from purple membrane labeled with heavy-atoms. J. Mol.Biol. 213: 539–560.
Chang, G., Spencer, R.H., Lee, A.T., Barclay, M.T., and Rees, D.C. 1998.Structure of the MscL homolog from Mycobacterium tuberculosis: A gatedmechanosensitive ion channel. Science 282: 2220–2226.
Chirino, A.J., Lous, E.J., Huber, M., Allen, J.P., Schenck, C.C., Paddock, M.L.,Feher, G., and Rees, D.C. 1994. Crystallographic analyses of site-directedmutants of the photosynthetic reaction center from Rhodobacter sphaer-oides. Biochemistry (Mosc). 33: 4584–4593.
Cornette, J.L., Cease, K.B., Margalit, H., Spouge, J.L., Berzofsky, J.A., andDeLisi, C. 1987. Hydrophobicity scales and computational techniques fordetecting amphipathic structures in proteins. J. Mol. Biol. 195: 659–685.
Deisenhofer, J., Epp, O., Sinning, I., and Michel, H. 1995. Crystallographicrefinement at 2.3 A resolution and refined model of the photosyntheticreaction centre from Rhodopseudomonas viridis. J. Mol. Biol. 246: 429–457.
Dotsch, V. and Wagner, G. 1998. New approaches to structure determination byNMR spectroscopy. Curr. Opin. Struct. Biol. 8: 619–623.
Doyle, D.A., Cabral, J.M., Pfuetzner, R., and Michel, H. 1998. The structure ofpotassium channel: Molecular basis of K+ conduction and selectivity. Sci-ence 280: 69–77.
Ermler, U., Fritzsch, G., Buchanan, S.K., and Michel, H. 1994. Structure of thephotosynthetic reaction centre from rhodobacter sphaeroides at 2.65 ang-stroms resolution: Cofactors and protein-cofactor interactions. Structure 2:925–936.
Godzik, A. 1995. In search of the ideal protein sequence. Protein Eng. 8:409–416.
Godzik, A., Kolinski, A., and Skolnick, J. 1993. De novo and inverse foldingpredictions of protein structure and dynamics. J. Comput. Aided Mol. Des.7: 397–438.
Goffeau, A., Nakai, K., Slonimski, P., and Risler, J.L. 1993. The membraneproteins encoded by yeast chromosome III genes. FEBS Lett. 325: 112–117.
Modeling structural features of membrane proteins
www.proteinscience.org 1537
Grigorieff, N., Ceska, T.A., Downing, K.H., Baldwin, J.M., and Henderson, R.1996. Electron-crystallographic refinement of the structure of bacteriorho-dopsin. J. Mol. Biol. 259: 393–421.
Guex, N. and Peitsch, M.C. 1997. SWISS-MODEL and the Swiss-Pdb-Viewer: An environment for comparative protein modeling. Electropho-resis 18: 2714–2723.
Henderson, R., Baldwin, J.M., Ceska, T.A., Zemlin, F., Beckmann, E., andDowning, K.H. 1990. Model for the structure of bacteriorhodopsin based onhigh-resolution electron cryo-microscopy. J. Mol. Biol. 213: 899–929.
Hirokawa, T., Boon-Chieng, S., and Mitaku, S. 1998. SOSUI: classification andsecondary structure prediction system for membrane proteins. Bioinformat-ics 14: 378–379.
Hochkoeppler, A., Landau, E.M., Venturoli, G., Zannoni, D., Feick, R., andLuisi, P.L. 1995. Photochemistry of a photosynthetic reaction centre immo-bilized in lipidic cubic phases. Biotechnol. Bioeng. 46: 93–98.
Hu, W.P., Godzik, A., and Skolnick, J. 1997. Sequence-structure specificity—how does an inverse folding approach work? Protein Eng. 10: 317–331.
Hubbell, W.L., Gross, A., Langen, R., and Lietzow, M.A. 1998. Recent ad-vances in site-directed spin labeling of proteins. Curr. Opin. Struct. Biol. 8:649–656.
Iwata, S., Ostermeier, C., Ludwig, B., and Michel, H. 1995. Structure at 2.8 Åresolution of cytochrome c oxidase from Paracoccus denitrificans. Nature376: 660–669.
Jones, D.T. 1998. Do transmembrane protein superfolds exist. FEBS Lett. 423:281–285.
Jones, D.T., Bryson, K., Tress, M.L., and Hadley, C. 1999. Successful proteinfold recognition using sequence and secondary structure constrained thread-ing methods. Proteins S3: 104–111.
Jones, D.T., Taylor, W.R., and Thornton, J.M. 1992. A new approach to proteinfold recognition. Nature 358: 86–89.
Juretic, D. and Lucin, A. 1998. The preference functions method for predictingprotein helical turns with membrane propensity. J. Chem. Inf. Comput. Sci.38: 575–585.
Kabsch, W. and Sander, C. 1983. Dictionary of protein secondary structure:Pattern recognition of hydrogen-bonded and geometrical features. Biopoly-mers 22: 2577–2637.
Kimura, Y., Vassylyev, D.G., Miyazawa, A., Kidera, A., Matsushima, M., Mit-suoka, K., Murata, K., Hirai, T., and Fujiyoshi, Y. 1997. Surface of bacte-riorhodopsin revealed by high-resolution electron crystallography. Nature389: 206–211.
Koepke, J., Hu, X., Muenke, C., Schulten, K., and Michel, H. 1996. The crystalstructure of the light-harvesting complex II (B800-850) from Rhodospiril-lum molischianum. Structure 4: 581–597.
Koretke, K.K., Russell, R.B., Copley, R.R., and Lupas, A.N. 1999. Fold rec-ognition using sequence and secondary structure information. ProteinsS3: 141–148.
Kreusch, A., Neubueser, A., Schiltz, E., Weckesser, J., and Schulz, G. 1994. Thestructure of the membrane channel porin from Rhodopseudomonas blasticaat 2.0 angstroms resolution. Protein Sci. 3: 58–63.
Kyrpides, N.C. 1999. Genomes OnLine Database (GOLD 1.0): A monitor of-complete and ongoing genome projects world-wide. Bioinformatics 15:773–774.
Landau, E.M. and Luisi, P.L. 1993. Lipidic cubic phases as transparent, rigidmatrices for the direct spectroscopic study of immobilized membrane pro-teins. J. Am. Chem. Soc. 115: 2102–2106.
Luecke, H., Richter, H.T., and Lanyi, J.K. 1998. Proton transfer pathway inbacteriorhodopsin at 2.3 angstrom resolution. Science 280: 1934–1937.
Luecke, H., Schobert, B., Richter, H.T., Cartailler, J.P., and Lanyi, J.K. 1999.Structural changes in bacteriorhodopsin during ion transport at 2 angstromresolution. Science 286: 255–260.
Luthy, R., Bowie, J.U., and Eisenberg, D. 1992. Assessment of protein modelswith three-dimensional profiles. Nature 356: 83–85.
Marassi, F.M. and Opella, S.J. 1998. NMR structural studies of membraneproteins. Curr. Opin. Struct. Biol. 8: 640–648.
McDermott, G., Prince, S.M., Freer, A.A., Hawthornthwaite-Lawless, A.M.,Papiz, M.Z., Cogdell, R.J., and Isaacs, N.W. 1995. Crystal structure of anintegral membrane light-harvesting complex from photosynthetic bacteria.Nature 374: 517–521.
Mitsuoka, K., Hirai, T., Murata, K., Miyazawa, A., Kidera, A., Kimura, Y., andFujioshi, Y. 1999. The structure of bacteriorhodopsin at 3.0 Å resolutionbased on electron crystallography: Implication of the charge distribution. J.Mol. Biol. 286: 861–882.
Moller, C., Buldt, G., Dencher, N.A., Engel, A., and Muller, D.J. 2000. Re-versible loss of crystallinity on photobleaching purple membrane in thepresence of hydroxylamine. J. Mol. Biol. 301: 869–879.
Muller, D.J., Schoenenberger, C.A., Schabert, F., and Engel, A. 1997. Structuralchanges in native membrane proteins monitored at subnanometer resolutionwith the atomic force microscope: A review. J. Struct. Biol. 119: 149–157.
Murzin, A.G. 1999. Structure classification-based assessment of CASP3 pre-dictions for the fold recognition targets. Proteins S3: 88–103.
Okada, T., Trong, I.L., Fox, B.A., Behnke, C.A., Stenkamp, R.E., and Pal-czewski, K. 2000. X-Ray diffraction analysis of three-dimensional crystalsof bovine rhodopsin obtained from mixed micelles. J. Struct. Biol. 130:73–80.
Palczewski, K., Kumasaka, T., Hori, T., Behnke, C.A., Motoshima, H., Fox,B.A., Le Trong, I., Teller, D.C., Okada, T., Stenkamp, R.E., et al. 2000.Crystal structure of rhodopsin: A G protein-coupled receptor. Science 289:739–745.
Pebay-peyroula, E., Rummel, G., Rosenbusch, J.P., and Landau, E.M. 1997.X-ray structure of bacteriorhodopsin at 2.5 angstroms from microcrystalsgrown in lipidic cubic phases. Science 277: 1676–1681.
Ponder, J.W. and Richards, F.M. 1987. Tertiary templates for proteins. Use ofpacking criteria in the enumeration of allowed sequences for different struc-tural classes. J. Mol. Biol. 193: 775–791.
Portmann, M., Landau, E.M., and Luisi, P.L. 1991. Spectroscopic and rheolog-ical studies of enzymes in rigid lipidic matrices: The case of a-chymotripsinin lysolectin/water phase. J. Phys. Chem. 95: 8437–8440.
Rees, D.C., DeAntonio, L., and Eisenberg, D. 1989. Hydrophobic organizationof membrane proteins. Science 245: 510–513.
Rost, B., Casadio, R., Fariselli, P., and Sander, C. 1995. Transmembrane helicespredicted at 95% accuracy. Protein Sci. 4: 521–533.
Sanchez, R. and Sali, A. 1997. Advances in comparative protein-structure mod-elling. Curr. Opin. Struct. Biol. 7: 206–214.
Sander, C. and Schneider, R. 1991. Database of homology-derived proteinstructures and the structural meaning of sequence alignment. Proteins 9:56–68.
Schertler, G.F., Villa, C., and Henderson, R. 1993. Projection structure of rho-dopsin. Nature 362: 770–772.
Sippl, M.J. 1990. The calculation of conformational ensembles from potentialsof mean force, an approach to the prediction of local structures in globularproteins. J. Mol. Biol. 213: 659–683.
Sippl, M.J. 1995. Knowledge-based potentials for proteins. Curr. Opin. Struct.Biol. 5: 229–235.
Snijder, H.J., Ubarretxena-Belandia, I., Blaauw, M., Kalk, K.H., Verheij, H.M.,Egmond, M.R., Dekker, N. and Dijkstra, B.W. 1999. Structural evidence fordimerization- regulated activation of an integral membrane phospholipase.Nature 401: 717–721.
Sonnhammer, E.L.L., von Heijne, G., and Krogh, A. 1998. A hidden Markovmodel for predicting transmembrane helices in protein sequences. Proc. Int.Conf. Intell. Syst. Mol. Biol. 6: 175–182.
Stoddard, B.L. 1998. New results using laue diffraction and time-resolved crys-tallography. Curr. Opin. Struct. Biol. 8: 612–618.
Stowell, M.H., McPhillips, T.M., Rees, D.C., Soltis, S.M., Abresch, E., andFeher, G. 1997. Light-induced structural changes in photosynthetic reactioncentre: Implications for mechanism of electron-proton transfer. Science 276:812–816.
Stowell, M.H.B., Miazawa, A., and Unwin, N. 1998. Macromolecular structuredetermination by electron microscopy: New advances and recent results.Curr. Opin. Struct. Biol. 8: 595–600.
Subramaniam, S., Lindahl, M., Bullough, P., Faruq, A.R., Tittor, J., Oesterhelt,D., Brown, L., Lanyi, J.K., and Henderson, R. 1999. Protein conformationalchanges in the bacteriorhodopsin photocycle. J. Mol. Biol. 287: 145–161.
Takeda, K., Sato, H., Hino, T., Kono, M., Fukuda, K., Sakurai, I., Okada, T., andKouyama, T. 1998. A novel three-dimensional crystal of bacteriorhodopsinobtained by successive fusion of the vesicular assemblies. J. Mol. Biol. 283:463–474.
Tsukihara, T., Aoyama, H., Yamashita, E., Tomizaki, T., Yamaguchi, H., Shin-zawa-Itoh, K., Nakashima, R., Yaono, R., and Yoshikawa, S. 1996. Thewhole structure of the 13-subunit oxidized cytochrome c oxidase at 2.8 Å.Science 272: 1136–1144.
von Heijne, G. 1992. Membrane protein structure prediction. Hydrophobicityanalysis and the positive-inside rule. J. Mol. Biol. 225: 487–494.
Weiss, M.S. and Schulz, G.E. 1992. Structure of porin refined at 1.8 Å resolu-tion. J. Mol. Biol. 227: 493–509.
Yoshikawa, S., Shinzawa-Itoh, K., Nakashima, R., Yaono, R., Yamashita, E.,Inue, N., Yao, M., Fei, M.J., Libeu, C.P., Mizushima, T., et al. 1998.Redox-coupled crystal structural changes in bovine heart cytochrome coxidase. Science 280: 1723–1729.
Zhang, Z.L., Huang, L.S., Shulmeister, V.M., Chi, Y.-I., Kim, K.K., Hung,L.-W., Crofts, A.R., Berry, E.A., and Kim, S.-H. 1998. Electron transfer bydomain movement in cytochrome bc1. Nature 392: 677–684.
Dastmalchi et al.
1538 Protein Science, vol. 10