
Modeling of data center airflow and heat transfer: State of the art and future trends
33
Distrib Parallel Databases (2007) 21:193–225 DOI 10.1007/s10619-006-7007-3 Modeling of data center airflow and heat transfer: State of the art and future trends Jeffrey Rambo · Yogendra Joshi Published online: 19 January 2007 C Springer Science + Business Media, LLC 2007 Abstract An assessment of the current thermal modeling methodologies for data centers is presented, with focus on the use of computational fluid dynamics and heat transfer as analysis tools, and model validation. Future trends in reduced or compact modeling of data center airflow and heat transfer are presented to serve as an overview of integrating rack-level compact models into full-scale facility level numerical computations. Compact models can be used to efficiently model data centers through varying model fidelity across length scales. Dynamic effects can be included to develop next-generation control schemes to maximize data center energy efficiency. Keywords Thermal modeling . Data center . Reduced order models 1 Introduction Data centers are computing infrastructure facilities utilized to provide a consistently reliable operating environment for servers, storage and networking devices, generi- cally referred to as data processing equipment (DPE). The continuous operation of the DPE is critical to industries data centers serve, such as telecommunications, banking, and high-performance scientific computing. Thermal management issues associated with continually increasing power dissipation from DPE are further compounded by the vertical stacking of such equipment in 2-m tall racks in the data center environment. In 1990, a typical rack with a 1.07 m by 0.61 m (42 in by 24 in) footprint dissipated Recommended by: Monem Beitelmal J. Rambo Shell Global Solutions (US), Inc. Houston, TX 77082 Y. Joshi () G. W. Woodruff School of Mechanical Engineering, Georgia Institute of Technology, Atlanta, GA 30332 e-mail: [email protected] Springer
Transcript of Modeling of data center airflow and heat transfer: State of the art and future trends
Distrib Parallel Databases (2007) 21:193–225
DOI 10.1007/s10619-006-7007-3
Modeling of data center airflow and heat transfer: Stateof the art and future trends
Jeffrey Rambo · Yogendra Joshi
Published online: 19 January 2007C© Springer Science + Business Media, LLC 2007
Abstract An assessment of the current thermal modeling methodologies for datacenters is presented, with focus on the use of computational fluid dynamics andheat transfer as analysis tools, and model validation. Future trends in reduced orcompact modeling of data center airflow and heat transfer are presented to serveas an overview of integrating rack-level compact models into full-scale facility levelnumerical computations. Compact models can be used to efficiently model data centersthrough varying model fidelity across length scales. Dynamic effects can be includedto develop next-generation control schemes to maximize data center energy efficiency.
Keywords Thermal modeling . Data center . Reduced order models
1 Introduction
Data centers are computing infrastructure facilities utilized to provide a consistentlyreliable operating environment for servers, storage and networking devices, generi-cally referred to as data processing equipment (DPE). The continuous operation of theDPE is critical to industries data centers serve, such as telecommunications, banking,and high-performance scientific computing. Thermal management issues associatedwith continually increasing power dissipation from DPE are further compounded bythe vertical stacking of such equipment in 2-m tall racks in the data center environment.In 1990, a typical rack with a 1.07 m by 0.61 m (42 in by 24 in) footprint dissipated
Recommended by: Monem Beitelmal
J. RamboShell Global Solutions (US), Inc. Houston, TX 77082
Y. Joshi (�)G. W. Woodruff School of Mechanical Engineering, Georgia Institute of Technology,Atlanta, GA 30332e-mail: [email protected]
Springer
194 Distrib Parallel Databases (2007) 21:193–225
approximately 1 kW of power [1], while today’s racks with the same footprint maydissipate up to 30 kW, based on current server heat loads. The large demand forcomputing power has caused data centers to grow as large as 9300 m2 (∼100,000 ft2),incorporating thousands of racks, and producing net facility power dissipation rateson the order of several MW. Data center practitioners measure power density as aheat flux based on the net power dissipated over the total footprint of the facility.Recent energy benchmarking studies have shown data centers are operating in the270–800 W/m2 (25–75 W/ft2) range [2], and growth to 100 W/ft2 average over thefacility, with local regions exceeding 200 W/ft2 is expected in the near future. Thesepower densities are well beyond conventional HVAC loads for the cooling of similarlysized rooms such as auditoria and office spaces, which are typically 4–8 W/ft2. Of the11 different data center benchmarked in [2], the computing load consumed between40–70% of the total power consumed and averaged 52%. Data center cooling loadsincluding the chiller operation, chilled water pumping power and air conditioning unitblower power consumed an additional 34% on average. The remaining 14% can beattributed to power conversion losses, lighting and other operational overhead. An-other benchmarking study showed that the computing, CRAC and chiller plant energyusage are roughly 1/3 of the total power consumption [3].
Data center floor space comes at a premium, with construction cost estimates ashigh as $15,000/m2 in metropolitan areas and annual operating costs ranging between$500–$1500/m2 [4]. High-power dissipation racks would ideally be spread out tominimize the local power density, however the high construction costs requires datacenters to maximize the floor space utilization by DPE. These cost constraints havecaused data center designers and operators to pack as much computing power intothe available space as possible, which combined with the DPE manufacturer trend ofproviding as much functionality into their equipment as possible, are causing severethermal management issues.
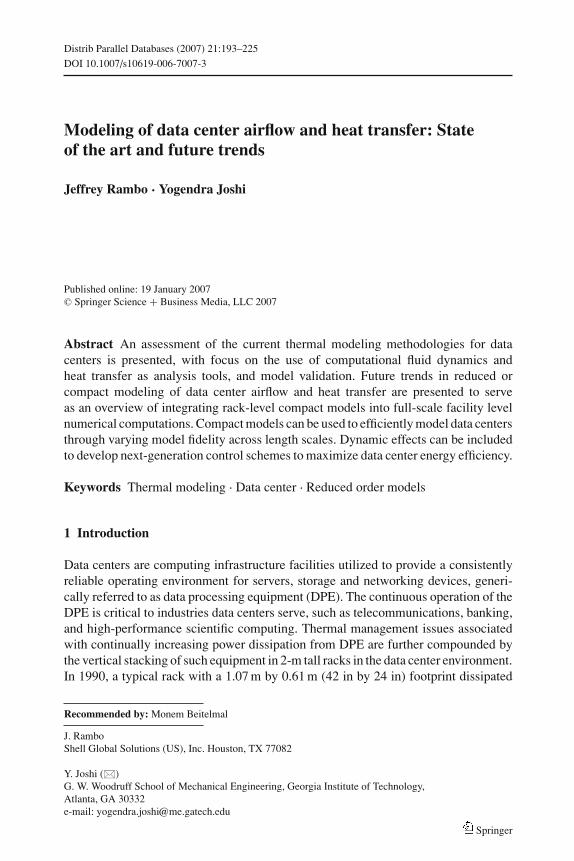
The predominant cooling scheme for current data centers is to use the computerroom air conditioning (CRAC) units to supply a raised floor plenum (RFP) underneaththe racks with cold air. Perforated tiles are then located near the racks to deliver thecool supply air to the front of the DPE. The hot exhaust air from the racks is thencollected from the upper portion of the facility by the CRAC units, completing theairflow loop, as shown in Fig. 1. Racks are typically arranged in rows with alternating
Fig. 1 Standard raised floor plenum and room return cooling scheme airflow schematics
Springer

Distrib Parallel Databases (2007) 21:193–225 195
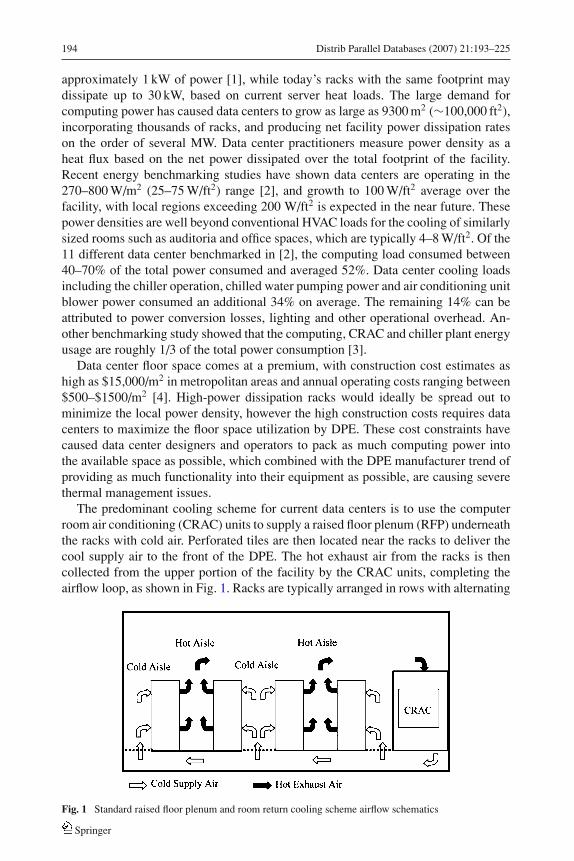
Fig. 2 Alternative cooling schemes employing (a) raised floor plenum (RFP) supply and standard return(SR), (b) RFP supply and overhead (OH) return, (c) OH supply with room return (RR) and (d) OH supplyand return
airflow directions, forming ‘hot’ and ‘cold’ aisles [5], with the perforated tiles locatedin the cold aisles where the rack inlets face each other and the exhaust air is collected inthe hot aisles. This hot aisle – cold aisle approach attempts to separate the supply fromthe exhaust air and increase the overall efficiency of the air delivery and collectionfrom each rack in the data center.
Improved thermal efficiency may be possible with alternative cool air supply andhot exhaust return configurations. While any location for the CRAC unit supply andreturn can be modeled, only certain combinations are feasible due to mechanicalconstraints of the CRAC units without introducing an excessive amount of ductworkand are illustrated in Fig. 2.
2 Data center modeling objectives
Access to operating data centers is limited due to their high reliability constraints, andthe large variations in data center architectures limit the extendibility of measurementsto other facilities. As a result, most previous investigations on data center thermal char-acterization have involved computational fluid dynamics and heat transfer (CFD/HT)to predict airflow and heat transfer characteristics. A reliable simulation methodologyfor data centers allows thermal designers to identify potentially dangerous local hotspots, quickly evaluate alternatives in cooling systems and investigate next generationdata center architectures.
Accurate data center airflow and heat transfer modeling can aid in the design ofnew facilities for energy efficiency, instead of drastic over-provisioning currently usedto guard against power density increases. A lifecycle mismatch problem also occursbecause most data center facilities are designed for 15–20 years of use [4], but theDPE becomes outdated in less than 2 years. With continual upgrades, the optimalarrangement of new DPE with higher power dissipation and flow rate requirementsneeds to be determined to mitigate its effect on neighboring DPE. Additional con-straints imposed by the grouping of DPE by functionality and cabling requirements
Springer

196 Distrib Parallel Databases (2007) 21:193–225
often conflict with thermal management strategies and data center managers need toprovide localized supplemental cooling to high power racks [6].
The first published results for data center airflow modeling appeared in 2000 [7].Since then, various modeling investigations have been presented, many employingCFD/HT to simulate data center airflow and heat transfer characteristics. The objectiveof this paper is to review data center modeling in an effort to highlight the wide rangeof techniques and assumptions that have been used in the thermal analysis of datacenters. A critical review of the current state-of-the-art can aid in unifying the differentmodeling approaches and provide future directions for the development of data centerthermal analysis tools.
3 Review of numerical modeling
The various modeling efforts have ranged from individual component modeling torack and power layouts and can be classified into the following main categories:
1. Raised floor plenum (RFP) airflow modeling to predict perforated tile flow rates2. Thermal implications of CRAC and rack layout and power distribution3. Alternative airflow supply and return schemes4. Energy efficiency and thermal performance metrics5. Rack-level thermal analysis6. Data center dynamics: control and lifecycle analysis
Previous thermal analysis efforts will be reviewed using the above partitioning andthe exact nature of each category will be further explored in the respective subsec-tion. Every attempt has been made to divide the literature as to minimize the overlapbetween the categories. Works with significant connections to multiple categorieswill be described in their primary category and noted in subsequent categories. Acompendium of data center literature was presented by Schmidt and Shaukatullah [8],which compares the cooling, energy efficiency, humidity and contamination require-ments between computer and telecommunication equipment rooms and also serves asa historical perspective considering the rapid growth in data center power density.
3.1 Raised floor plenum (RFP)
With a majority of operational data centers utilizing raised floor plena to deliver coolsupply air to the racks, predicting the perforated tile flow rate distribution (PTFRD)is of great concern. RFP data centers almost universally use 0.61 × 0.61 m (2 × 2 ft)tiles to form the raised floor. Typical RFP depths vary between 0.305 m (12 in) and0.914 m (36 in) across facilities with an industry trend to deeper plena in order tosupply larger volumetric rates of air more uniformly to cool higher power dissipationDPE. The RFP is commonly used to route the various power and data cables as wellas chilled water lines for the CRAC units, which can create substantial blockagesand severely alter the PTFRD. Experimental measurements and CFD prediction ofvelocities and pressure distributions in RFP have shown that the airflow patterns canbe very complex, especially when the exhausts from multiple CRAC units interact[9].
Springer

Distrib Parallel Databases (2007) 21:193–225 197
The plenum pressure distribution is important because pressure differences acrossthe perforated tiles drive the flow from the RFP into the facility. In regions of highvelocity, the static pressure may be lower that the facility pressure, causing reversedflow from the facility down into the plenum. Reversed flow commonly occurs whenthe perforated tiles are located in close proximity to the CRAC units where the blowerscreate high velocity exhaust jets. Note all investigations in this section consider theflow in the RFP only and no DPE equipment above the raised floor was modeled.Not modeling the DPE above the RFP means the back pressure for each tile needs tobe specified and a constant value for all tiles has been prescribed in all the previousworks. The pressure drop across the perforated tiles are much greater than any otherpressure drop in the flow path and the pressure variations above the raised floor arevery small relative to the pressure variations in the RFP, such that the pressure on thefacility side of the perforated tile can be treated as a constant for all practical purposes.
The first modeling of data center RFP was performed by Kang et al. [7] who usedflow network modeling [10] and CFD to predict perforated tile flow rates. Their designstudy showed that the flow distribution can be altered by varying the percent openarea of the tiles. With no obstructions in the plenum, the only airflow resistance in theloop is caused by the pressure drop across the perforated tiles, making the assumptionof a uniformly pressurized plenum valid. Specific details of each major investigationcited can be found in Table 2.
Schmidt et al. present a numerical model for a 0.284 m (11.2 in) deep plenum [11]and for a 0.292 m (11.5 in) deep plenum [12] for a 6.10 m × 20.1 m (66 ft × 20 ft) datacenter. The facility contains one CRAC unit near an artificially created wall and an-other unit located 15 tiles away in the middle of the plenum. Some of the models usedturning vanes to direct the CRAC unit exhaust in various directions. A 2-dimensional(depth-averaged) computational model was developed and comparison with measure-ments showed the model predicts the general PTFRD trends but fails to capture sharpvariations between neighboring tiles and in some cases does not resolve experimen-tally measured reversed flow. A fully 3-dimensional model of the same facility [12]showed improved agreement with experimental measurements for various perforatedtile layouts, but also failed to predict the reversed flow in many tile configurations. Inboth papers, it is noted that a 0.1 m (3.9 in) diameter pipe and a 0.025 m (1.0 in) tallcable tray are located in the bottom of the plenum, although there is no discussion ofhow these obstructions are accounted for in the depth-averaged equations. Schmidtet al. [12] state that for plenum depths less than 0.3 m (11.8 m) deep, depth-averagedmodeling is an adequate tradeoff between computational cost and accuracy.
Perforated tiles may be located near CRAC units to save data center floor space andthe minimum distance between a row of perforated tiles and the front of a CRAC unitwas numerically investigated in [13]. Special treatments were introduced to simulatethe CRAC unit discharging into an infinitely large plenum without constructing anexcessively large numerical model. The results showed that reversed flow may occur upto 4 tiles away from the CRAC unit, in agreement with the experimental measurementsof [11, 12].
Radmehr et al. [14] experimentally investigated the leakage flow, or portion oftotal CRAC airflow that seeps through the seams of the raised floor tiles. Distribut-ing the leakage flow uniformly throughout the perforated tile seams and modelingchilled water supply lines, Radmehr et al. [14] were able to produce predictions
Springer

198 Distrib Parallel Databases (2007) 21:193–225
with an overall accuracy of 90%. Van Gilder and Schmidt [15] present a paramet-ric study of plenum airflow for various data center footprints, tile arrangements, tileporosity and plenum depth. A vacant plenum was assumed, which makes the per-forated tile resistance much greater than any other flow resistance in the plenumand allows the resulting perforated tile flow rate to scale with the net CRAC flowrate.
A systematic description of the boundary conditions, including the modeling ofthe perforated tiles and CRAC units was presented in [16] which used CFD to modelthe PTFRD in a large operational data center containing 11 CRAC units and over200 perforated tiles. The results showed fairly good agreement with measured valuesand the computational techniques serve as the basis of a commercially available tool[17]. Karki and Patankar [18] present a 1-dimensional model to predict perforated tileflow rates, with somewhat limited applicability, but the analytical technique is able toprovide additional insight beyond purely computational results.
3.2 Layout and power distribution
Layout type studies have generally sought optimal dimensions, including the hot andcold aisle spacing and facility ceiling height, to improve the thermal efficiency ofstandard room-level data center cooling. The relative orientation between the rows ofracks and CRAC units has received attention in order to mitigate the effects of recir-culation and short-circuiting, or cool supply air returning to the CRAC unit before itpasses through any DPE. Another important layout concern is determining the opti-mal position to locate high power dissipation racks. This issue is continuously facingdata center operators, as new equipment is upgraded due to the lifecycle mismatchbetween the facility and DPE. Locating higher-powered racks is also an importantconcern in day-to-day operations because data centers do not contain uniformly dissi-pating racks and even in a facility containing identically configured racks, the powerdissipation would vary spatially over time due to different workloads imposed on theDPE.
Patel et al. [19] modeled a RFP data center containing 4 rows of 7 racks, eachdissipating 12 kW. Further details regarding the model geometry and boundary con-ditions are summarized in Table 3. Moving a row of racks to perturb the hot andcold aisle spacing only a few inches showed a 15% change in load on the CRACunits. Rack power dissipation was also varied between rows by a factor of 4, whichresulted in 30% variation in CRAC load. Sharma et al. [20] used a slightly dif-ferent model geometry to evaluate the effect of hot and cold aisle width, top rackto ceiling height and distance between racks and facility walls. The rack to walldistance showed no effect, the ceiling height showed no effect in the room returnscenario, but a lower distance between the top of the racks and the ceiling in anoverhead return scheme improves the thermal performance. Improved thermal per-formance was demonstrated when the cold aisle width was increased in the roomreturn case and when the hot aisle width was decreased in the overhead returncase.
A novel concept of introducing cold supply air into the hot aisles to mitigate theeffects recirculation and created a more uniform temperature throughout the facilitywas proposed by Schmidt and Cruz [21], although computational results showed this
Springer
Distrib Parallel Databases (2007) 21:193–225 199
modification could diminish the basic cooling scheme’s efficiency. The RFP plenumwas not modeled and flow rates and temperatures entering the hot and cold aisles wereprescribed as boundary conditions.
To better characterize the performance variations through a data center, a proce-dure to model individual servers within each rack was developed in [22]. Each rackcontained 10 server models, each with their power dissipation and fan model to drivethe flow in an attempt to mimic the convective processes of forced air-cooled DPE.The sub-models in [22] used a uniform heat flux surface to model the board-levelpower dissipation, but more detailed geometry and boundary conditions can be usedas computational resources allow.
Each data center has a unique geometrical footprint and rack layout, thereforea common basis is needed to compare the thermal performance of various coolingschemes. A unit cell architecture of a RFP data center was formulated by consideringthe asymptotic flow distribution in the cold aisles with increasing number of racksin a row [23]. Preliminary analyses showed that at least 4 rows of racks are requiredto produce the hot aisle – cold aisle behavior, with 1 hot aisle and 2 cold aisles. Therack flow rates were successively halved, resulting in 1.16, 0.59, 0.29 and 0.15 m3/s(2463, 1240, 620 and 310 CFM). The data show that flow rate of entrained air throughthe sides of the cold aisle is relatively independent of the number of racks in a rowand increases with increasing rack flow rate. The air entrained through the top of thecold aisle increases with both the number of racks in a row and increasing rack flowrate. The unit cell study predicted trends in the distribution of airflow in the cold aislefor increasing number of racks. The findings indicate separate trends for the ‘small’rack flow rate limit and the ‘large’ rack flow rate limit, with the large rack flow ratelimit being of higher importance considering the rapid increase in power density. For9 racks in a row, the portion of entrained air through the sides of the cold aisle hassufficiently approached its asymptotic limit for all rack flow rates, indicating that 9racks is representative of a long row of racks and captures the behavior of racks at theend and middle of a row adequately for all flow rates. Using 7 racks in a row will alsobe sufficient to model current high power density data centers because the maximumflow rate of 2463 CFM is extremely high. Air temperature rises of 40 ◦C are allowablefor extremely high-powered racks, and an overall energy balance indicates that eachrack could dissipate up to 57 kW, which may be realized in several years if the currentDPE heat loads persist at the current rate.
Schmidt and Cruz [24, 25] use the same model as in [21] to investigate the effect ofPTFRD on uniformly dissipating racks. The PTFRD was varied by altering the perfo-rated tile open area and RFP depth, resulting in more uniform rack inlet temperaturein the vertical direction for specific combinations of tile open area, RFP depth andrack power dissipation.
A parametric study of the effect of ceiling height, RFP depth and perforated tiledistance from CRAC on rack inlet temperature was presented by Bhopte et al. [26]. Amulti-objective optimization study with equal weighting for the above 3 dimensionalparameters showed the minimum rack inlet temperature occurred at the maximumplenum depth (4 ft), maximum ceiling height (20 ft) and perforated tiles located at themedian value (8.75 ft), which need to be weighed against the financial constraints ondata center space.
Springer
200 Distrib Parallel Databases (2007) 21:193–225
3.3 Alternative supply and return configurations
The earliest full-scale CFD/HT modeling of data centers by Patel et al. [1] examineda data center facility using an overhead supply and return air distribution system, thatwas first suggested in [27]. Comparison with measurements showed an average error of14% when predicting rack inlet temperature. Shrivastava et al. [28] modeled 7 differentpermutations of floor, room and ceiling supply and return configurations for same datacenter geometry and rack layout as [21, 25] for fixed room geometry, uniform rackpower and fixed CRAC conditions. Iyengar investigated various geometrical layoutsfor an overhead supply and room return data center with the same geometry as [21,25, 28]. The dimensional parameters included supply diffuser height, arrangementand angle, return vent locations and ceiling height, in addition to the rack powerdissipation and power distribution.
Various cooling schemes being investigated beyond the standard RFP design and themodels presented in [1, 19, 20, 24, 29, 30] have used a variety of orientations betweenthe CRAC units and racks. To develop a mechanistic understanding of convectiveprocesses in data centers, the global cooling scheme was divided into the processesof (1) the CRAC exhaust to the cold aisle, (2) cold aisle distribution of supply airthrough the racks and (3) the hot exhaust air return to the CRAC units [31]. Numericalmodeling of various supply and return schemes, coupled with various orientationsbetween the racks and the CRAC units, identified the causes of recirculation and non-uniformity in thermal performance throughout the data center. The parametric studypresented in [32] is the first attempt to generally quantify these effects and followingwork using the same procedures was contributed in [28].
3.4 Energy efficiency and thermal performance metrics
The performance of the assorted data center models is assessed in various waysby different authors, with most authors reporting the maximum inlet temperatureto each rack. This makes specific comparisons between various cooling scenariosdifficult. Sharma et al. [20] introduced dimensionless numbers to quantify the effectsof recirculation. These dimensionless numbers are arrived at by considering the ratios(cold supply air enthalpy rise before it reaches the racks) / (enthalpy rise at the rackexhaust), and (heat extraction by the CRAC units) / (enthalpy rise at the rack exhaust),which in practice require the air temperature evaluation at arbitrary points near the rackinlet and exhaust. Sharma et al. [33] later computed these dimensionless performancemetrics in an operational data center by taking a air temperature measurements justbelow the top of each rack inlet and outlet. Norota et al. [34] used the statisticaldefinition of the Mahalanobis generalized distance to describe the non-uniformity inrack thermal performance. Shah et al. [35–37] proposed an exergy-based analysismethod that divides the data center into a series of subcomponents and then CRACunit operation is optimized, given information regarding the rack power dissipation.
Thermal performance metrics for systems level electronics cooling based on theconcept of thermal resistance (power dissipation / temperature rise) were formu-lated and applied to data centers in [32]. The metrics consider the spatial uniformityof thermal performance to characterize poor designs causing local hot spots. Entropygeneration minimization was also proposed as a data center thermal performance met-
Springer

Distrib Parallel Databases (2007) 21:193–225 201
ric because poor thermal performance is often attributed to recirculation effects. Sincethe mixing of hot exhaust air with the supply air in the cold aisles generates entropy,cold aisle entropy generation minimization was employed as a metric. The results pre-sented in [32] show that using entropy generation minimization and thermal resistancewith spatial uniformity considerations predict the same design as being the best.
3.5 Rack-level thermal analysis
With hot exhaust recirculation and cold supply air short-circuiting causing major in-efficiencies in facility-level cooling schemes, recent trends have focused on rack-levelthermal analysis to provide adequate cooling to the DPE. Using the thermal resistanceand entropy generation metrics of [32], the optimal arrangement of servers and powerdissipation profile for a forced air cooled rack was computationally investigated in[38]. Herrlin [39] also formulated rack-level thermal performance metrics based onrack inlet temperature exceeding desirable limits.
Heydari and Sabounchi [40] incorporated a model of an overhead rack-level sup-plemental refrigeration device and used CFD to compute the temperature distributionsin a RFP data center. The results showed the airflow rate had a greater effect on rackthermal performance than refrigerant temperature or flow rate. Rolander et al. [41, 42]combined the reduced-order modeling approaches of [43, 44] to optimize the layoutand inlet airflow rate to a sealed DPE cabinet with a single inlet and outlet. The resultsshowed that rearranging the servers, or equivalently redistributing the heat load, couldallow 50% more cabinet power dissipation than simply increasing the cooling supplyflow rate.
3.6 Data center dynamics: control and lifecycle analysis
All of the above investigations are concerned with a nearly fixed geometry, numberof CRAC units and number of racks, which may represent only a single point in timeover a data center’s life. To compensate for time varying heat loads, Boucher et al. [50]attempted to control rack inlet temperature by varying CRAC temperature and flowrate, as well as perforated tile open area. Sharma et al. [45] proposed redistributingthe computing workload rather than the cooling resources and present CFD-basedresults and Patel et al. discusses the advantages for distributable cooling resources atvarious levels [46]. Other investigations have considered combined power and coolingsystems and their viability over the facility lifecycle [47, 48].
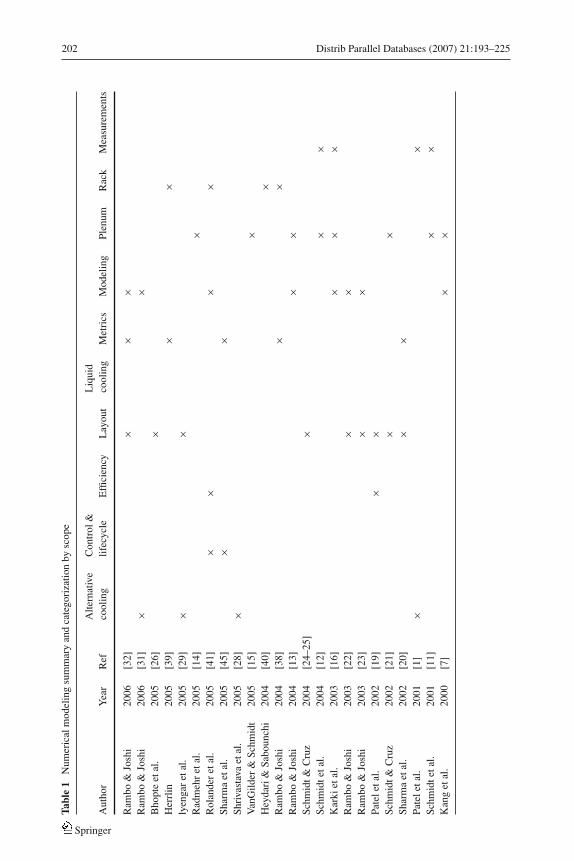
Table 1 below summarizes data center thermal management studies that are nu-merical in nature including the use of CFD/HT or other modeling technique thatnumerically integrates the governing equations of fluid flow and heat transfer. Notesome of the literature in Table 1 has been assigned multiple categories and any workcomparing numerical simulation with measured values has been noted in the lastcolumn. Note the 4th category defined §3 has been split to segregate investigationsconcerning energy efficiency and the development of thermal performance metrics andthe column ‘modeling’ has been added to catalog papers developing new, innovativeor systematic computational approaches.
Springer
202 Distrib Parallel Databases (2007) 21:193–225
Tabl
e1
Num
eric
alm
odel
ing
sum
mar
yan
dca
tego
riza
tion
bysc
ope
Alte
rnat
ive
Con
trol
&L
iqui
dA
utho
rY
ear
Ref
cool
ing
lifec
ycle
Effi
cien
cyL
ayou
tco
olin
gM
etri
csM
odel
ing
Plen
umR
ack
Mea
sure
men
ts
Ram
bo&
Josh
i20
06[3
2]×
××
Ram
bo&
Josh
i20
06[3
1]×
×B
hopt
eet
al.
2005
[26]
×H
errl
in20
05[3
9]×
×ly
enga
ret
al.
2005
[29]
××
Rad
meh
ret
al.
2005
[14]
×R
olan
der
etal
.20
05[4
1]×
××
×Sh
arm
aet
al.
2005
[45]
××
Shri
vast
ava
etal
.20
05[2
8]×
Van
Gild
er&
Schm
idt
2005
[15]
×H
eyda
ri&
Sabo
unch
i20
04[4
0]×
Ram
bo&
Josh
i20
04[3
8]×
×R
ambo
&Jo
shi
2004
[13]
××
Schm
idt&
Cru
z20
04[2
4–25
]×
Schm
idte
tal.
2004
[12]
××
Kar
kiet
al.
2003
[16]
××
×R
ambo
&Jo
shi
2003
[22]
××
Ram
bo&
Josh
i20
03[2
3]×
×Pa
tele
tal.
2002
[19]
××
Schm
idt&
Cru
z20
02[2
1]×
×Sh
arm
aet
al.
2002
[20]
××
Pate
leta
l.20
01[1
]×
×Sc
hmid
teta
l.20
01[1
1]×
×K
ang
etal
.20
00[7
]×
×
Springer

Distrib Parallel Databases (2007) 21:193–225 203
4 Model validation
Only limited validation studies of data center CFD/HT models have been performeddue to the complexity of data center airflow and heat transfer, which is further com-pounded by each data center facility having its own unique layout, making a commonbasis of comparison difficult to achieve. A primary concern in data center CFD/HTvalidation is the appropriate resolution at which to validate numerical models. Even asmall prototypical data center facility would provide an opportunity to take countlesspoint-wise temperature, velocity and pressure measurements. Full-field visualizationand measurement techniques, such as particle image velocimetry, tomographic infer-ometry and laser-induced fluorescence can provide very detailed descriptions of thevelocity and temperature fields, although there are many challenges for using suchsystems in a data center environment beyond the colossal amount of data produced.With either point-wise or full-field measurement techniques, acquiring data at a fineenough resolution to validate CFD/HT models is a considerable undertaking.
4.1 Raised floor plenum (RFP) models
A majority of the results with experimental measurements are RFP investigations thatused a flow rate measurement device, as outlined in [11], to measure the net flowthrough each perforated tile. While it may be the end goal to predict the PTFRD,comparing only the perforated tile flow rate with the CFD simulation does not ensurethat the simulation has accurately captured the flow field between the CRAC exhaustand perforated tiles. Comparison with measurements in [11, 12, 15] shows all theCFD predictions have a root mean square error of at least 10% with specific locationsexhibiting more than 100% error in some cases. A solution that matches the observedboundary conditions (perforated tile flow rates) does not guarantee that the solutionover the domain is correct or even unique. With perforated tile flow rate predictionerrors on the order of 10%, the error associated with the velocity field in the RFP maybe significantly larger, rendering the physical arguments used to develop RFP designguidelines questionable.
The boundary conditions used to model the CRAC unit blowers supplying the RFPdeserve some further investigation. Many of the RFP models fix the CRAC flow ratearguing the pressure drop across the CRAC unit is much greater than the sum of all theother pressure drops in the flow loop, which for a commercially available CRAC unitis approximately 500 Pa (∼2.0 in H2O). A simplistic flow network analysis of RFPairflow would place multiple CRAC units in parallel causing their aggregate resistanceto be the same as a single resistance with their flow rates adding. Multiple perforatedtiles are also in parallel, assuming a (unrealistic) uniformly pressurized plenum asin [7], with an average flow rate of 0.165 m3/s (350 CFM), the aggregate resistanceis only 12 Pa (0.05 in H2O) from the Schmidt et al. correlation [12]. Also note nodetailed measurements or model of a CRAC unit that would provide the details ofthe flow direction and distribution among exhausts of a single CRAC unit has beenreported in the literature.
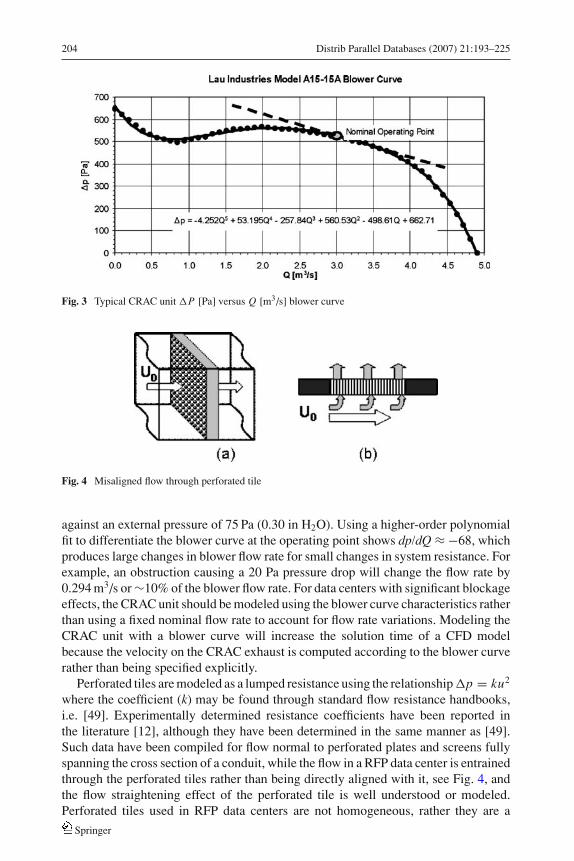
Figure 3 plots the blower curve (�p [Pa] vs. Q [m3/s]) for a Lau Industries ModelA15–15A blower. The Liebert series FH529C CRAC unit, commonly used in RFPdata centers, uses 2 such blowers to create a net flow rate of 5.85 m3/s (12,400 CFM)
Springer
204 Distrib Parallel Databases (2007) 21:193–225
Fig. 3 Typical CRAC unit �P [Pa] versus Q [m3/s] blower curve
Fig. 4 Misaligned flow through perforated tile
against an external pressure of 75 Pa (0.30 in H2O). Using a higher-order polynomialfit to differentiate the blower curve at the operating point shows dp/dQ ≈ −68, whichproduces large changes in blower flow rate for small changes in system resistance. Forexample, an obstruction causing a 20 Pa pressure drop will change the flow rate by0.294 m3/s or ∼10% of the blower flow rate. For data centers with significant blockageeffects, the CRAC unit should be modeled using the blower curve characteristics ratherthan using a fixed nominal flow rate to account for flow rate variations. Modeling theCRAC unit with a blower curve will increase the solution time of a CFD modelbecause the velocity on the CRAC exhaust is computed according to the blower curverather than being specified explicitly.
Perforated tiles are modeled as a lumped resistance using the relationship �p = ku2
where the coefficient (k) may be found through standard flow resistance handbooks,i.e. [49]. Experimentally determined resistance coefficients have been reported inthe literature [12], although they have been determined in the same manner as [49].Such data have been compiled for flow normal to perforated plates and screens fullyspanning the cross section of a conduit, while the flow in a RFP data center is entrainedthrough the perforated tiles rather than being directly aligned with it, see Fig. 4, andthe flow straightening effect of the perforated tile is well understood or modeled.Perforated tiles used in RFP data centers are not homogeneous, rather they are a
Springer

Distrib Parallel Databases (2007) 21:193–225 205
Fig. 5 Photographs for nominal 25% open area tiles, (a) facility side and (b) plenum side
combination of a thin perforated screen attached to a relatively thick structural support.Figure 5 shows top and bottom photographs of a commercially available perforatedtile with nominal 25% open area, constructed of a combination of a 0.00635 m (1/4 in)thick perforated screen with measured 21.26% open area, attached to a 0.028575 m(1−1/8 in) thick support with a measured open area of 30.68%. The inhomogeneousconstruction of the perforated tiles suggests the pressure drop characteristics maybe directionally dependent, resulting in a significantly different loss coefficient inreversed flow situations. The resistance coefficient is not particularly significant in thelimiting case of all perforated tiles having the same % open area, but the coefficientmagnitude determines the relative flow weighting when various % open area tiles,such as to achieve a uniform PTFRD [21, 24, 25].
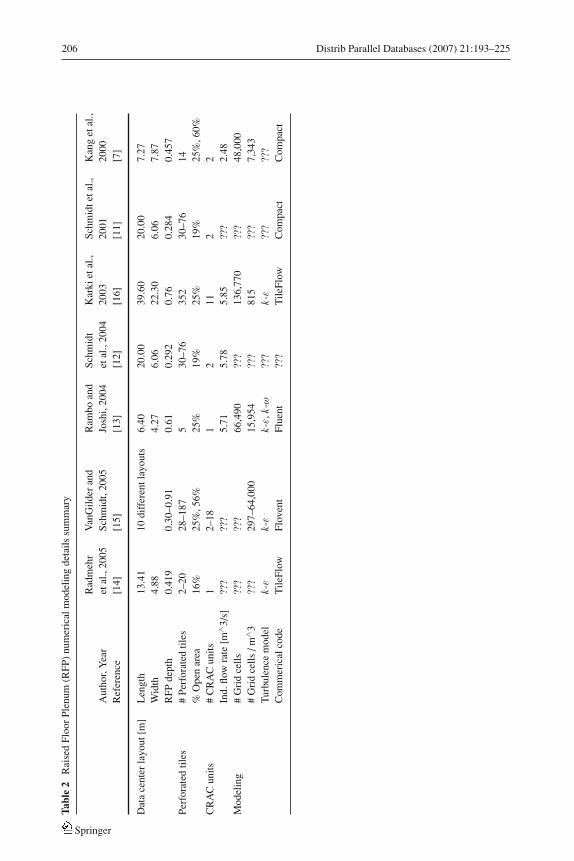
Table 2 summarizes the details of previous numerical RFP investigations in termsof facility geometry, number and % open area of the perforated tiles, the number andindividual flow rate of each CRAC unit and some information regarding the mesh sizeand commercial CFD code used to model the flow. (Note an entry of ‘???’ indicatesno data specific data was reported) All of the RFP models presented in Table 2 assumea ‘vacant’ condition for the plenum or no obstructions caused by chilled water piping,power and data cables, with the exception of [14] which included the effects of achilled water pipe. A current outstanding issue is the modeling of obstructions in RFP.The development of a generalized model is difficult because each data center has aunique set of blockages. Correlations for the pressure drop across single and multipletube banks typically assume the flow is normal to the tube axis, but RFP flows arecomplex, swirling type flows where the flow direction is not easily determined withoutdetailed CFD results. Thus, some numerical modeling will be required to predict theairflow patterns in the RFP and the challenge is shifted to determining the appropriatelevel of modeling for obstructions. A main parameter that needs to be determined isthe size below which obstructions have no significant effect on the PTFRD, whichfor a tubular obstruction could possibly be quantified by a blockage area ratio of tubediameter to plenum depth.
Springer
206 Distrib Parallel Databases (2007) 21:193–225
Tabl
e2
Rai
sed
Floo
rPl
enum
(RFP
)nu
mer
ical
mod
elin
gde
tails
sum
mar
y
Rad
meh
rV
anG
ilder
and
Ram
boan
dSc
hmid
tK
arki
etal
.,Sc
hmid
teta
l.,K
ang
etal
.,A
utho
r,Y
ear
etal
.,20
05Sc
hmid
t,20
05Jo
shi,
2004
etal
.,20
0420
0320
0120
00R
efer
ence
[14]
[15]
[13]
[12]
[16]
[11]
[7]
Dat
ace
nter
layo
ut[m
]L
engt
h13
.41
10di
ffer
entl
ayou
ts6.
4020
.00
39.6
020
.00
7.27
Wid
th4.
884.
276.
0622
.30
6.06
7.87
RFP
dept
h0.
419
0.30
–0.9
10.
610.
292
0.76
0.28
40.
457
Perf
orat
edtil
es#
Perf
orat
edtil
es2–
2028
–187
530
–76
352
30–7
614
%O
pen
area
16%
25%
,56%
25%
19%
25%
19%
25%
,60%
CR
AC
units
#C
RA
Cun
its1
2–18
12
112
2In
d.flo
wra
te[m
∧ 3/s
]??
???
?5.
715.
785.
85??
?2.
48M
odel
ing
#G
rid
cells
???
???
66,4
90??
?13
6,77
0??
?48
,000
#G
rid
cells
/m∧ 3
???
297–
64,0
0015
,954
???
815
???
7,34
3T
urbu
lenc
em
odel
k-ε
k-ε
k-ε,k
-ω??
?k-
ε??
???
?C
omm
eric
alco
deT
ileFl
owFl
oven
tFl
uent
???
Tile
Flow
Com
pact
Com
pact
Springer

Distrib Parallel Databases (2007) 21:193–225 207
4.2 Above floor facility models
Regardless of whether the cold supply air is delivered through a raised floor plenumor overhead ductwork, the space that houses the actual racks is where the primarythermal management issues arise. Schmidt et al. [21, 24, 25] has modeled the RFP flowseparately and input the perforated tile flow rate predictions as boundary conditions toan above floor model. Validation in data center models above the RFP has usually comein the form of point-wise temperature measurements at the inlet to individual racksat various vertical locations. These measurements have also shown significant errorsin the numerical temperature predictions. The temperature field is closely coupled tothe velocity field due to the nature of most turbulence models that are applicable todata center CFD/HT, making accurate velocity field predictions essential to accuratetemperature predictions. The only work that reported velocity measurements is thatof Patel et al. [1], which found relative prediction error of greater than 10% for allpoint-wise velocity measurements taken and showed 14% relative error in point-wisetemperature measurements, (cf. Section 3.3).
Buoyancy effects have been included in some CFD/HT computations, althoughscaling arguments have shown that they are negligible in the rack exhaust [32] andexperiments have shown linear changes in point-wise temperatures measurementsfor varying CRAC exhaust temperature [50], further confirming these estimates. In-creasing rack flow rates reduces the effects of buoyancy relative to the flow inertia;however, servers are being designed to allow larger temperature rises across the rack,increasing the effects of buoyancy. Buoyancy effects may become significant far fromthe rack exhaust and the spatially vary effects of buoyancy needs to be validatedbecause including these effects may significantly increase the computational time ofCFD/HT simulation depending on the structure, the coupling of the momentum andenergy equations and treatment of the turbulence model.
A general issue that arises in the characterization of functional data centers is de-termining the actual power dissipation from the DPE. Thermal analyses of electronicequipment usually use the maximum power dissipation from each component to deter-mine the heat load, although in practice all the DPE in a data center may dissipate themaximum amount of power simultaneously less than 5% of the time. The discrepancybetween the actual power dissipation and theoretical maximum power supported bythe device has caused chip manufactures to produce ‘thermal design power’ guide-lines that are often significantly less than the power dissipation obtained assuming allelectric power is converted directly into thermal energy. Variations in DPE workloadcould cause a facility comprised of identically configured racks to exhibit widelydifferent power dissipation levels, both between racks at any given instant in time aswell as overall facility power dissipation over time.
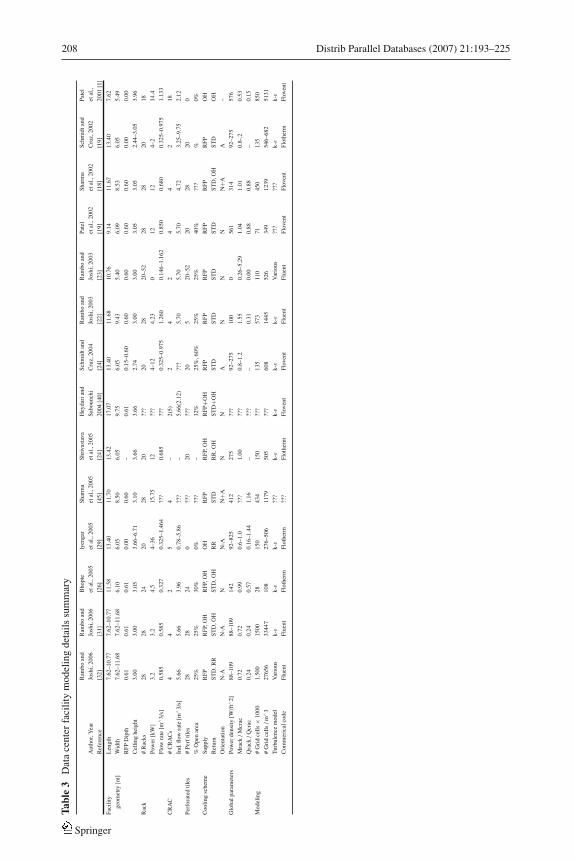
Table 3 summarizes the modeling details for those investigations primarily con-cerned with the data center facility and not the RFP. The table is organized into facilitygeometry, rack and CRAC details (note the number in parenthesis indicates supple-mental cooling flow rate above the CRAC unit) the cooling scheme and some detailsregarding the mesh size and CFD model construction. The abbreviation STD, RFPand OH refer to the standard CRAC return, raised floor plenum supply and overheadsupply and returns, respectively. The em dash (—) indicates a range of parameters,while the plus sign (+) indicates a combination of different parameters. The cooling
Springer
208 Distrib Parallel Databases (2007) 21:193–225
Tabl
e3
Dat
ace
nter
faci
lity
mod
elin
gde
tails
sum
mar
y
Ram
boan
dR
ambo
and
Bho
pte
lyen
gar
Shar
ma
Shri
vast
ava
Hey
dari
and
Schm
idta
ndR
ambo
and
Ram
boan
dPa
tel
Shar
ma
Schm
idta
ndPa
tel
Aut
hor,
Yea
rJo
shi,
2006
Josh
i,20
06et
al.,
2005
etal
.,20
05et
al.,
2005
etal
.,20
05Sa
boun
chi
Cru
z,20
04Jo
shi,
2003
Josh
i,20
03et
al.,
2002
etal
.,20
02C
ruz,
2002
etal
.,
Ref
eren
ce[3
2][3
1][2
6][2
9][4
5][2
4]20
04[4
0][2
4][2
2][2
3][1
9][1
8][1
9]20
01[1
]
Faci
lity
Len
gth
7.62
–10.
777.
62–1
0.77
11.5
813
.40
11.7
013
.42
17.0
713
.40
11.6
810
.76
9.14
11.6
713
.40
7.62
geom
etry
[m]
Wid
th7.
62–1
1.68
7.62
–11.
686.
106.
058.
506.
059.
756.
059.
435.
406.
098.
536.
055.
49
RFP
Dip
th0.
610.
610.
610.
000.
60–
0.61
0.15
–0.6
00.
600.
600.
600.
600.
000.
00
Cel
ling
heig
ht3.
003.
003.
053.
66–6
.71
3.10
3.66
3.66
2.74
3.00
3.00
3.05
3.05
2.44
–3.0
53.
96
Rac
k#
Rac
ks28
2824
2028
20??
?20
2820
–52
2828
2018
Pow
er[k
W]
3.2
3.2
4.5
4–36
15.7
512
???
4–12
4.23
012
124–
214
.4
Flow
rate
[m∧ 3
/s]
0.58
50.
585
0.32
70.
325–
1.46
4??
?0.
685
???
0.32
5–0.
975
1.26
00.
146–
1.16
20.
850
0.68
00.
325–
0.97
51.
133
CR
AC
#C
RA
Cs
44
25
4–
2(5)
24
24
42
18
Ind.
flow
rate
[m∧ 3
/s]
5.66
5.66
3.96
0.78
–5.8
6??
?–
5.66
(2.1
2)??
?5.
705.
705.
704.
723.
25–9
.75
2.12
Perf
orat
edtil
es#
Perf
tiles
2828
240
???
20??
?20
520
–52
2028
200
%O
pen
area
25%
25%
30%
0%??
?–
32%
25%
,60%
25%
25%
40%
???
%0%
Coo
ling
sche
me
Supp
lyR
FPR
FP,O
HR
FP,O
HO
HR
FPR
FP,O
HR
FP+O
HR
FPR
FPR
FPR
FPR
FPR
FPO
H
Ret
urn
STD
.RR
STD
,OH
STD
,OH
RR
STD
RR
.OH
STD
+OH
STD
STD
STD
STD
STD
,OH
STD
OH
Ori
enta
tion
N-A
N-A
NN
-AN
+AN
NA
NN
NN
+AA
–
Glo
balp
aram
eter
sPo
wer
dens
ity[W
/ft∧ 2
]88
–109
88–1
0914
292
–825
412
275
???
92–2
7510
00
561
314
92–2
7557
6
Mra
ck/M
crac
0.72
0.72
0.99
0.6–
1.0
???
1.00
???
0.8–
1.2
1.55
0.26
–5.2
91.
041.
010.
8-.2
0.53
Qra
ck/Q
crac
0.24
0.24
0.57
0.16
–1.4
41.
16–
???
–0.
310.
000.
880.
88–
0.15
Mod
elin
g#
Gri
dce
lls×
1000
1.50
015
0028
150
434
150
???
135
573
110
7145
013
585
0
#G
rid
cells
/m∧ 3
2765
633
447
108
276–
506
1179
505
???
608
1445
526
349
1239
546–
682
5131
Tur
bule
nce
mod
elV
ario
usk-
εk-
εk-
ε??
?k-
εk-
εk-
εk-
εV
ario
us??
???
?k-
εk-
ε
Com
mer
ical
code
Flue
ntFl
uent
Flot
herm
Flot
herm
???
Flot
herm
Flov
ent
Flov
ent
Flue
ntFl
uent
Flov
ent
Flov
ent
Flot
herm
Flov
ent
Springer
Distrib Parallel Databases (2007) 21:193–225 209
scheme orientation ‘N’ indicates the CRAC unit exhaust direction is normal to thecold aisle while ‘A’ indicates the CRAC unit exhaust direction is aligned down the coldaisle. The global metric mrack/mCRAC indicates the ratio between the net rack flow rateand net CRAC flow and serves as a measure of recirculation while the Qrack/QCRAC
metric indicates the ratio of the new power dissipated by all the racks in the facilityto the net cooling capacity of all the CRAC units, which is used to indicate the levelof cooling provisioning.
4.3 Turbulence modeling
Data center airflows are turbulent throughout the facility based on the velocity andlengths scales, although the Reynolds number can vary drastically and the flow patternsexhibit a wide range of characteristics. In the absence of detailed experimental mea-surements, most CFD studies have employed the standard k-ε turbulence model, cf.Table 3. This model is the most basic of the differential closure models for Reynolds-averaged Navier-Stokes (RANS) equations. It is most broadly applicable because itinvolves the least number of assumptions. However, applicability does not imply ac-curacy and the standard k-ε model has been demonstrated to produce extremely largeerrors in a number of simple flows [51].
Specifying the boundary conditions and turbulence model validation are the pri-mary issues in the simulation of complex industrial flows. Wall functions are usedto compute the boundary conditions for the k and ε equations at solid surfaces, butsuch boundary conditions need to be prescribed for various inlet and outlet situations.Without detailed measurements, the profiles or even area-weighted average values of kand ε are not known and need to be manufactured. Correlations exist for k and ε giventhe turbulent intensity and hydraulic diameter, assuming fully developed conduit flowupstream of the imposed boundary condition.
4.4 Grid resolution and numerical accuracy
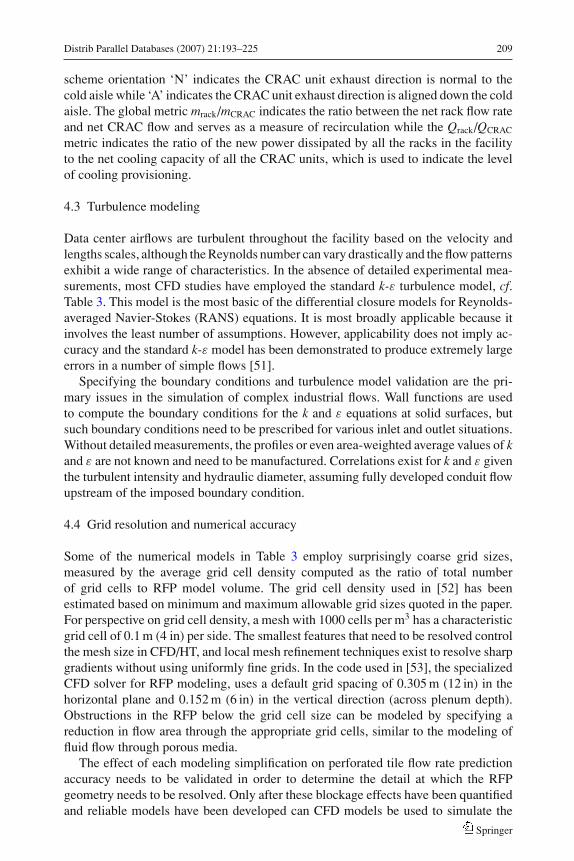
Some of the numerical models in Table 3 employ surprisingly coarse grid sizes,measured by the average grid cell density computed as the ratio of total numberof grid cells to RFP model volume. The grid cell density used in [52] has beenestimated based on minimum and maximum allowable grid sizes quoted in the paper.For perspective on grid cell density, a mesh with 1000 cells per m3 has a characteristicgrid cell of 0.1 m (4 in) per side. The smallest features that need to be resolved controlthe mesh size in CFD/HT, and local mesh refinement techniques exist to resolve sharpgradients without using uniformly fine grids. In the code used in [53], the specializedCFD solver for RFP modeling, uses a default grid spacing of 0.305 m (12 in) in thehorizontal plane and 0.152 m (6 in) in the vertical direction (across plenum depth).Obstructions in the RFP below the grid cell size can be modeled by specifying areduction in flow area through the appropriate grid cells, similar to the modeling offluid flow through porous media.
The effect of each modeling simplification on perforated tile flow rate predictionaccuracy needs to be validated in order to determine the detail at which the RFPgeometry needs to be resolved. Only after these blockage effects have been quantifiedand reliable models have been developed can CFD models be used to simulate the
Springer
210 Distrib Parallel Databases (2007) 21:193–225
airflow in real-world data center RFPs. Dependable and robust modeling techniquescan greatly aid in the development of RFP design guidelines, because actual RFPfacilities that can be used for design studies are rare and detailed measurements arehighly time-consuming.
Grid sizes employed in many facility level simulations are seen in Table 3. Theinvestigations [1, 22, 31, 32] model details at the rack level, which greatly increasesthe number of grid cells. Bhopte et al. [26] also modeled some details within the rackand used a far coarser mesh. While most CFD/HT investigations report some sort ofgrid convergence study, the criteria are often not specified and using such metrics asmaximum temperature and velocities may not be sufficient to guarantee that reasonableestimates of all the velocity and temperature profiles have been computed.
Data center designers and managers want to quickly assess the thermal performanceby using simple numerical models with short solution times. This goes against theCFD/HT fine grid requirements for modeling the complex airflows and heat transferprocesses in data centers. Excessively coarse grids may result in serious errors, sothere needs to be an acceptable trade-off between the levels of detail modeled andmodel size for quick analysis times.
4.5 Prototypical flow comparison
A generic data center model can be decomposed in a series of prototypical flows [23].Any turbulence model employed for data center simulation must produce accuratepredictions in these regions, while still being robust enough to produce reasonablyaccurate predictions in the remaining portions of the model. The CRAC exhaust regionin a raised floor plenum is akin to a confined impinging jet, the cold aisle is similarto flow in a channel with distributed suction, and the hot aisle is essentially a bank ofjets directed at each other.
The length scales of RFP flows are similar to those of other indoor airflows,especially the modeling of large office spaces or auditoria. Indoor airflows typicallyfall into the regime of turbulent mixed convection. However, the flow in data centerRFPs is at a Reynolds number (Re) significantly greater than indoor airflows. Theliterature for high Re cavity flows typically considers compressible and supersonicflows for acoustic modeling, making existing CFD modeling studies of incompressibleflows at high Re in cavity-type geometries scarce.
A CRAC flow rate of 5.75 m3/s is representative of most RFP investigations, asshown in Table 3. Note all flow rates are referenced to the density of air taken at 15 ◦C,the common outlet temperature of CRAC units. Commercially available CRAC unitstypically use 2 blowers without exhaust areas of approximately 0.117 m2 (1.25 ft2)for a hydraulic diameter based Reynolds number (Re = u Dh/ν) of ∼530,000. Recentimpinging jet investigations [53–57] have considered target plate distances (H) be-tween 2 to 50 jet nozzle hydraulic diameters (Dh), 2 ≤ H/Dh ≤ 50. Based on CRACexhaust of a single blower, the aspect ratio for RFP data centers between 0.305 m(12 in) to 0.914 m (36 in) is 0.941 ≤ H/Dh ≤ 2.82, putting the geometry in the lowerrange of prototypical studies. The standard k-ε model has been shown to fail forpredicting impinging jet velocity profiles, wall shear stress and heat transfer rates,and the previous studies [53–57] use the k-ω model [51] to predict the flow field forRe ≤ 110, 000. The CRAC exhaust Re is well beyond the range of other numerical
Springer

Distrib Parallel Databases (2007) 21:193–225 211
investigations, requiring the validation of the standard k-ε model for RFP predictions.Although very detailed velocity profiles in the CRAC exhaust region may not appearto be of primary concern to data center designers, a number of recent studies [13, 58]have focused on the behavior of perforated tiles in close proximity to the CRAC units,and especially the prediction of reversed flow.
The hot-aisle cold-aisle approach has gained wide acceptability in data centerlayouts, making this rack configuration possibly the only common feature betweendata centers. This makes it a good candidate for validation studies, since the hot-and cold-aisle flow patterns strongly influence the overall thermal performance ofthe data center. The flow in a cold aisle is similar to flow in a channel with wallsuction, or fluid pulled out of the bulk flow through perforations in the wall. The flowis independent of the channel orientation, either vertical or horizontal, because bothbuoyancy effects and the weight of the fluid are negligible. Limiting cases of ‘low’ and‘high’ suction rates need to be considered. The low suction rate would be applicableto low flow rate racks that do not draw a large portion of the bulk and correspondsto a more prototypical flow where literature may be available. The high suction ratelimit is more applicable to data centers where all of the bulk flow is entrained throughthe sidewalls. The hot aisle is also similar to a channel flow, but with injection orfluid being added to the bulk flow through the walls. While there are some differencesbetween the flow in data center cold- and hot-aisles and channel flows with suction andinjection, an experimentally validated model of such flows would provide guidancein selecting appropriate turbulence models for data center airflow simulations.
5 Rack-level compact modeling
Modeling approaches for racks in data center CFD/HT simulations have varied signif-icantly depending on the purpose of the investigation. The level at which data centermanagers are ultimately responsible for the DPE is currently a source of debate. Someargue that the DPE manufacturer has designed an adequate thermal management sys-tem for the components contained within the racks, and the data center designer isonly responsible for meeting the airflow rate and inlet temperature requirements. Con-sidering the high reliability expected from data processing environments and notingthat an equipment failure is a failure regardless of the root cause, others argue thatsome level of modeling of the individual servers is required to fully understand datacenter thermal management.
In the recent analysis of data center airflows, researchers have either modeled therack in a black-box fashion with prescribed flow rate and temperature rise, or as abox with fixed flow rate and uniform heat generation [1, 6]. Subdividing the rackinto a series of server models was introduced in [22] where each server contained aninduced-draft fan model at the exhaust, a lumped flow resistance at the inlet to modelthe pressure drop, and a uniform heat flux over the bottom surface to model the powerdissipation from a number of components. The reasoning behind subdividing the rackinto multiple server models is that it is the heat generated at the chip level insidethe servers that causes the need for a data center cooling scheme and the convectiveprocesses at the server level should be captured in some manner.
Springer

212 Distrib Parallel Databases (2007) 21:193–225
Fig. 6 Rack-level modeling approach comparison for a given inlet velocity and temperature profile (flowis left to right) showing (a) uniform velocity and temperature exhaust profiles for a prescribed rack model,(b) slight velocity change and constant (T(x) + �T) change in temperature profile for uniform volumetricheat generation models and (c) localized velocity and temperature profiles for server-level modeling
The rack-level model employed depends upon the objective of the simulation.Figure 6 illustrates the differences between the different rack modeling approaches.Black-box type models are essentially boundary conditions that prescribe outlet condi-tions on the velocity and temperature field at the rack exhaust, given a set of conditionsover the rack inlet. The most common approach is based on an overall energy balance(Q = mcp�T , where Q is the rack power dissipation rate, m is mass flow rate, cp
is the specific heat of air and �T is the fluid bulk temperature rise between the rackinlet and outlet). Here the rack flow rate m is computed based on the rack powerdissipation rate (Q), and the specified fluid bulk temperature rise �T. The velocityand temperature profiles are then specified as uniform values over the rack exhaust,because no specific information regarding the flow details inside the rack have beencomputed. This approach requires the least computational effort, but nearly all thedetails of how the rack interacts with the data center facility are lost. Another black-box type approach coarsely computes the flow through the rack and models the powerdissipation rate as a uniform volumetric energy source, q ′′′ Q/Vrack. This procedurewill produce a profile at the rack exhaust, which is entirely dependent on the rack inletprofiles because the rack model does not significantly alter the velocity field.
The rack flow rate is fixed for both fixed temperature rise and uniform powerdissipation black-box rack models. The rack sub-modeling of [22] used pressure-velocity relationships to model server-level fans and up to 10% variations in net rackflow rate were observed in a CFD/HT study of 28 racks using the same flow rate modeldesigned for a high rack flow rate of 1.260 m3/s (∼2400 CFM). Specifying the rackflow rate also smears out the effect of inhomogeneous rack populations since racksin operational data centers often contain a variety of DPE, each with their own flowrate characteristics. Fixing the net rack flow rate cannot determine if higher flow rateDPE is consuming most of the cooling supply and starving the lower flow rate DPE ofadequate airflow. Another emerging issue is that DPE manufacturers are beginning touse variable speed fans in order to maintain constant component temperatures insidethe servers. The rationale behind this considers DPE workload variations and aims tonot waste cooling supply air for a nominally high power dissipation server that is notbeing used and therefore not outputting any heat.
Modeling individual servers can describe power dissipation and flow rate variationsat the rack level, but such an approach significantly increases the CFD/HT modelsize. Limits on available computing have severely restricted the server-level detailsin the past, reducing server-level models to boxes with constant heat fluxes on thebottom surface and a fan model specified over the entire exhaust region. This is still
Springer
Distrib Parallel Databases (2007) 21:193–225 213
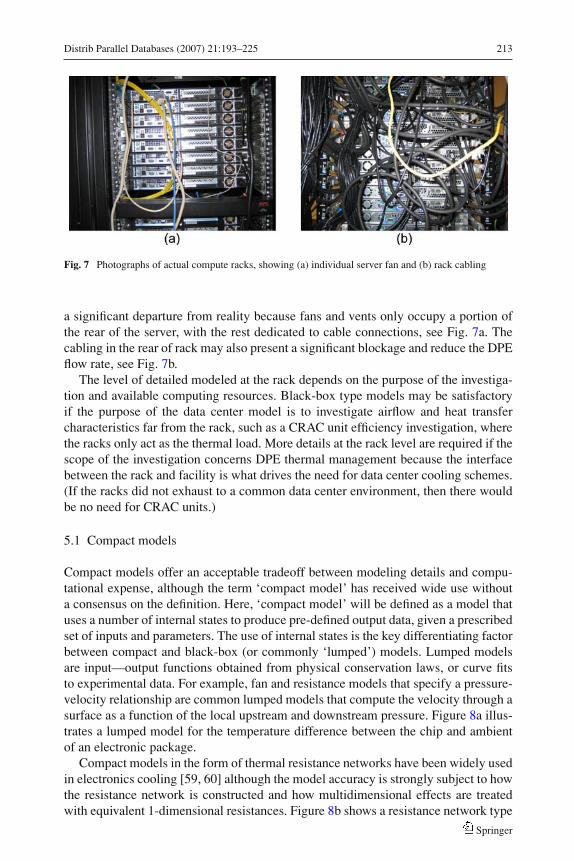
Fig. 7 Photographs of actual compute racks, showing (a) individual server fan and (b) rack cabling
a significant departure from reality because fans and vents only occupy a portion ofthe rear of the server, with the rest dedicated to cable connections, see Fig. 7a. Thecabling in the rear of rack may also present a significant blockage and reduce the DPEflow rate, see Fig. 7b.
The level of detailed modeled at the rack depends on the purpose of the investiga-tion and available computing resources. Black-box type models may be satisfactoryif the purpose of the data center model is to investigate airflow and heat transfercharacteristics far from the rack, such as a CRAC unit efficiency investigation, wherethe racks only act as the thermal load. More details at the rack level are required if thescope of the investigation concerns DPE thermal management because the interfacebetween the rack and facility is what drives the need for data center cooling schemes.(If the racks did not exhaust to a common data center environment, then there wouldbe no need for CRAC units.)
5.1 Compact models
Compact models offer an acceptable tradeoff between modeling details and compu-tational expense, although the term ‘compact model’ has received wide use withouta consensus on the definition. Here, ‘compact model’ will be defined as a model thatuses a number of internal states to produce pre-defined output data, given a prescribedset of inputs and parameters. The use of internal states is the key differentiating factorbetween compact and black-box (or commonly ‘lumped’) models. Lumped modelsare input—output functions obtained from physical conservation laws, or curve fitsto experimental data. For example, fan and resistance models that specify a pressure-velocity relationship are common lumped models that compute the velocity through asurface as a function of the local upstream and downstream pressure. Figure 8a illus-trates a lumped model for the temperature difference between the chip and ambientof an electronic package.
Compact models in the form of thermal resistance networks have been widely usedin electronics cooling [59, 60] although the model accuracy is strongly subject to howthe resistance network is constructed and how multidimensional effects are treatedwith equivalent 1-dimensional resistances. Figure 8b shows a resistance network type
Springer

214 Distrib Parallel Databases (2007) 21:193–225
Fig. 8 Two models of an electronic package, (a) lumped model and (b) resistance network compact model
compact model of an electronic package, which computes the temperature at a numberof discrete locations (i.e. internal states), such as junction and case temperatures.
Compact models use slightly more degrees of freedom (DOF) than lumped models,but provide internal states based on additional details that allow for further exami-nation of the model. An important process in modeling is system identification, orthe rigorous experimentation with unknown (black-box) or partially characterized(gray-box) systems to efficiently and accurately determine the underlying behavior.At the other end of the DOF spectrum are detailed CFD/HT models and finite ele-ment analyses, which are subsets of distributed parameter modeling which aims toapproximate the full-field system behavior. The process of taking a model from a largenumber of DOF, either from detailed numerical simulations or full-field experimentalmeasurements, to a model involving significantly fewer DOF is termed model reduc-tion. A number of tools exist for reducing the number of internal states of large linearsystems, such as those resulting from discretizing differential equations [61]. As anexample, the proper orthogonal decomposition has been used to accurately reducedetailed turbulent CFD/HT models by a factor of 104 and 105 [41, 42, 44, 62, 63].Figure 9 illustrates this taxonomy of efficient modeling procedures by comparing thelevel of description and model size, measured in DOF.
The rack level is the appropriate scale for compact modeling in data centers becauseinterface between the racks and the data center facility is the key focus for data centerthermal management. Also, the uniqueness in layout and cooling scheme at the facility
Springer

Distrib Parallel Databases (2007) 21:193–225 215
Fig. 9 Modeling description level and DOF taxonomy
Fig. 10 Server thermal model sketch for compact model development
level makes developing generalized models above the rack level very difficult. Toprovide the broadest description as possible, rack level compact models will actuallybe an agglomeration of server-level compact models to account for heterogeneous rackpopulations. The end goal of the compact model is for it to be integrated with full scaleCFD/HT models of data center facility to efficiently produce detailed descriptions atthe rack level without significantly increasing the computational cost over black-boxtype rack models.
Figure 10 shows a server model used to describe the compact model developmentprocedure. The main features of the model include some flow obstructions created bydrive bays and power supplies that provide a representative system pressure drop. Anumber of power dissipating components are also modeled with arbitrarily complexdetails including multiple materials and chip-level thermal management devices suchas heat sinks. The model includes an induced-draft fan to pull the air through the serverbox and may also include a lumped resistance to simulate the pressure drop throughscreens at the front of the server. Modeling the server inlet and outlet as discrete ventsand fans is a significant improvement over the previous attempts to subdivide the rackinto a series of server models because those models required the inlet and exhaust tobe smeared over the entire face of the server inlet and outlet due to computation limits.
The model thermal inputs are inlet temperature and component-wise power dissi-pation rates. The flow inputs may vary depending on the scope of the compact model,with the simplest being a fixed velocity that also fixes the outlet velocity by continuity.More advanced strategies would use a fan model to drive the flow against the server
Springer

216 Distrib Parallel Databases (2007) 21:193–225
system resistance accounting for the inlet and outlet static pressures. Since the ultimategoal is for the compact model to be integrated into the full CFD/HT computation ofdata center facility, detailed velocity, pressure and temperature profiles are availablefrom the neighboring grid cells in the computational mesh. This means that the com-pact models can be formulated to accept and output either profiles or area-averagedquantities. The model parameters are the geometry and material properties, whichmay range over specified values, if the model is constructed to accommodate suchvariability.
The specific details of compact model construction are beyond the scope of thisreview, but suffice it to say a wide range of tools is available. A straightforward ap-proach would be to construct a physical or numerical model of the server and correlatethe maximum component temperature as a function the server flow rate, componentpower dissipation and geometrical properties. Alternatively, reduced-order modelingtechniques could be used to quickly approximate the velocity and temperature fieldsand a post-processing layer can be added to extract maximum chip temperatures [32,41, 42]. More detailed analytic approaches would involve control volume methodscoupled with heat transfer correlations for flow over multiple heated blocks, which isthe prototypical geometry for electronics thermal management and has been studiedextensively in the literature.
5.2 Model integration
Rack-level compact models interact with the CFD/HT simulation as input—outputfunctions, but unlike black-box models, they output their internal states such as a list ofcomponent temperatures and energy usage data for thermal performance monitoring.If the server compact model has a fixed flow rate, the CFD/HT simulation only interactswith the compact model through prescribed boundary conditions, but the model stillresides in the category of compact models if it outputs internal states. A compactmodel that determines the server flow rate from a fan model coupled to the CFD/HTmesh needs to be solved iteratively with the velocity and pressure fields, because theserver flow rate is a function of the inlet and outlet pressure fields neighboring thecompact model.
Server-level compact models can be stacked up to form a rack-level compactmodel, with 4 such models used here for illustrative purposes. The compact modelsare vertically located on top of each other do not directly interact by exchangingmass or momentum, i.e. the top and bottom of the servers are treated as adiabaticsolid walls. This is typical of most air-cooled racks that draw air in from the frontand exhaust it through the rear. The server-level models indirectly interact as theoutput of server or rack may eventually lead to the input of another model through thecomputational mesh, resolving recirculation effects. Direct compact model interactioncan be accounted for by specifying additional heat fluxes on the top or bottom surfaceof the server-level models. A major issue is coupling the discrete exhaust velocityand temperature profiles from each compact model because the exhaust of typicalrack-mounted DPE does align flush with the back of the rack to allow for powerand data cabling. The mixing of the individual exhaust jets can be accounted forwith smoothing functions that conserve mass, momentum and energy across the shear
Springer
Distrib Parallel Databases (2007) 21:193–225 217
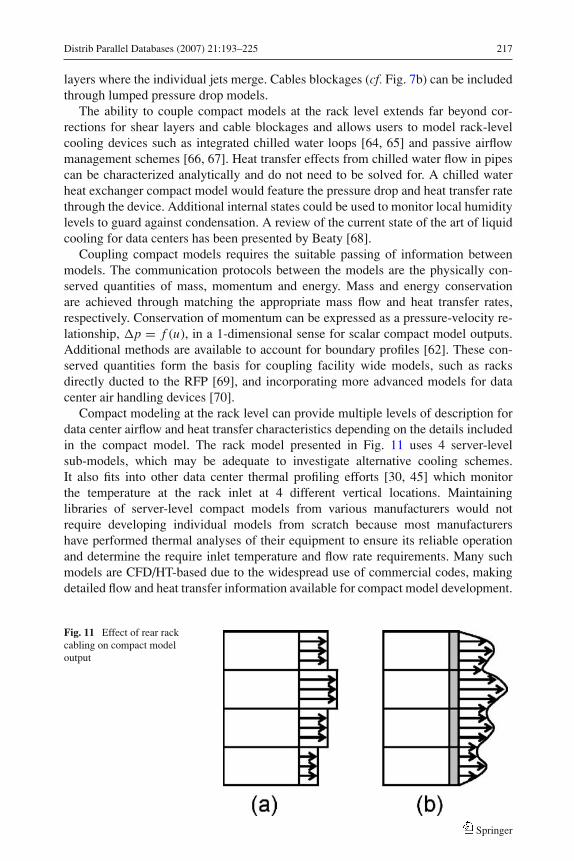
layers where the individual jets merge. Cables blockages (cf. Fig. 7b) can be includedthrough lumped pressure drop models.
The ability to couple compact models at the rack level extends far beyond cor-rections for shear layers and cable blockages and allows users to model rack-levelcooling devices such as integrated chilled water loops [64, 65] and passive airflowmanagement schemes [66, 67]. Heat transfer effects from chilled water flow in pipescan be characterized analytically and do not need to be solved for. A chilled waterheat exchanger compact model would feature the pressure drop and heat transfer ratethrough the device. Additional internal states could be used to monitor local humiditylevels to guard against condensation. A review of the current state of the art of liquidcooling for data centers has been presented by Beaty [68].
Coupling compact models requires the suitable passing of information betweenmodels. The communication protocols between the models are the physically con-served quantities of mass, momentum and energy. Mass and energy conservationare achieved through matching the appropriate mass flow and heat transfer rates,respectively. Conservation of momentum can be expressed as a pressure-velocity re-lationship, �p = f (u), in a 1-dimensional sense for scalar compact model outputs.Additional methods are available to account for boundary profiles [62]. These con-served quantities form the basis for coupling facility wide models, such as racksdirectly ducted to the RFP [69], and incorporating more advanced models for datacenter air handling devices [70].
Compact modeling at the rack level can provide multiple levels of description fordata center airflow and heat transfer characteristics depending on the details includedin the compact model. The rack model presented in Fig. 11 uses 4 server-levelsub-models, which may be adequate to investigate alternative cooling schemes.It also fits into other data center thermal profiling efforts [30, 45] which monitorthe temperature at the rack inlet at 4 different vertical locations. Maintaininglibraries of server-level compact models from various manufacturers would notrequire developing individual models from scratch because most manufacturershave performed thermal analyses of their equipment to ensure its reliable operationand determine the require inlet temperature and flow rate requirements. Many suchmodels are CFD/HT-based due to the widespread use of commercial codes, makingdetailed flow and heat transfer information available for compact model development.
Fig. 11 Effect of rear rackcabling on compact modeloutput
Springer

218 Distrib Parallel Databases (2007) 21:193–225
Again, the language of physically conserved quantities can form the basis to developa common reporting system for different manufacturers to share information withouthaving to disclose proprietary information.
6 Data center dynamics
Most data center thermal analyses have focused on a single operating state of thefacility, or considered the data center over its entire lifecycle, but the overall thermalefficiency can be improved by considering the intermediate timescale of hour-by-hour and day-to-day operation. Some racks and possibly entire data center facilitiesexperience a drastic change in computing load over the course of several hours anddays depending on the nature of computing being performed. Recent studies havesuggested dynamically partitioning the computing load to maximize cooling systemefficiency [45, 50], although this may require radical changes in current computinginfrastructures. However, dynamically adjusting the cooling capacity to meeting con-tinually changing power dissipations at the rack level can lead to large savings for thedata center end-user.
There is a sizable increase in computational expense associated with simulatingdynamical phenomena with CFD/HT because of large model sizes needed to accu-rately resolve spatial gradients and the large number of time steps needed to accuratelyresolve temporal gradients. The use of compact models is deeply rooted in dynamicalinvestigations, especially for control to efficiently predict internal states of complexsystems based on measured quantities at specified locations. A simple data centercontrol scheme could sense rack inlet temperatures and adjust CRAC flow rates andoutput temperature to eliminate local hotspots. More efficient control schemes wouldbe at the rack level with variable chilled water flow rates to rack-level heat exchangersand a relatively few number of CRAC units to provide supplemental cooling to thefacility for human comfort. Current research issues concerning the type and placementof sensors need to be addressed.
With chip temperatures being the ultimate concern in data centers, compact modelscan play an important role in developing efficient dynamic multi-scale simulationtools, with resolution down to components within individual servers. A large portionof the existing literature in compact modeling is aimed at dynamic modeling andimplementing such models in control schemes. Dynamic compact models at the racklevel can be integrated with full-scale data center CFD/HT simulations to developcontrol scheme that resourcefully use variable speed fans at the server and racklevel in order to efficiently accommodate power dissipation variations and avoiddrastic over-provisioning of cooling resources. Since dynamic compact models can beintegrated out in time given a set of initial conditions, it may be possible to implementcompact models and the full scale CFD/HT at different time scales. Dynamic compactmodel development can extend beyond individual servers and include rack-level liquidcooling schemes and supplementary cooling units at the rack level.
7 Summary
To review the existing literature, Table 4 summarizes all the literature presented inSection 3–5 directly related to data center thermal management, organized in reverse
Springer

Distrib Parallel Databases (2007) 21:193–225 219
Tabl
e4
Dat
ace
nter
ther
mal
man
agem
entl
itera
ture
sum
mar
y
Alte
rnat
ive
Con
trol
and
Liq
uid
Aut
hor
Yea
rR
efco
olin
glif
ecyc
leE
ffici
ency
Lay
out
cool
ing
Met
rics
Mod
elin
gPl
enum
Rac
kM
easu
rem
ents
Com
puta
tiona
l
Kar
kian
dPa
tank
ar20
06[1
8]×
×R
ambo
and
Josh
i20
06[3
2]×
××
×R
ambo
and
Josh
i20
06[3
1]×
××
Rol
ande
ret
al.
2006
[42]
××
××
Bho
pte
etal
.20
05[2
6]×
×H
errl
in20
05[3
9]×
××
lyen
gar
etal
.20
05[2
9]×
××
Kar
lsso
nan
dM
oshf
egh
2005
[3]
××
Pate
leta
l.20
05[4
6]×
×R
adm
ehr
etal
.20
05[1
4]×
×R
ambo
and
Josh
i20
05[3
8]×
××
Rol
ande
ret
al.
2005
[41]
××
××
×Sc
hmid
teta
l.∗∗
∗20
05[4
]×
Schm
idta
ndIv
enqa
r20
05[3
0]×
×Sh
ahet
al.
2005
[37]
××
×Sh
ahet
al.
2005
[36]
××
×Sh
ahan
dK
rish
nan
2005
[48]
×Sh
arm
aet
al.
2005
[45]
××
×Sh
riva
stav
aet
al.
2005
[28]
××
Van
Gild
eran
dSc
hmid
t20
05[1
5]×
×W
ebb
and
Nas
ir20
05[6
4]×
×B
eaty
2004
[68]
×B
ouch
eret
al.
2004
[50]
××
Furi
hata
etal
.20
04[6
6]×
×H
eyda
rian
dSa
boun
chi
2004
[40]
××
Hw
ang
etal
.20
04[6
9]×
×
(Con
tinu
edon
next
page
)
Springer

220 Distrib Parallel Databases (2007) 21:193–225
Tabl
e4
(Con
tinue
d)
Alte
rnat
ive
Con
trol
and
Liq
uid
Aut
hor
Yea
rR
efco
olin
glif
ecyc
leE
ffici
ency
Lay
out
cool
ing
Met
rics
Mod
elin
gPl
enum
Rac
kM
easu
rem
ents
Com
puta
tiona
l
Ram
boan
dJo
shi
2004
[13]
××
×Sc
hmid
tand
Cru
z20
04[2
4,25
]×
×Sc
hmid
teta
l.20
04[1
2]×
××
Shar
ma
etal
.20
04[3
3]×
×W
ang
2004
[67]
××
Wils
onet
al.
2004
[65]
××
Kar
kiet
al.
2003
[16]
××
××
Kop
lin20
03[9
]×
×N
orot
aet
al.
2003
[34]
××
×R
ambo
and
Josh
i20
03[2
2]×
××
Ram
boan
dJo
shi
2003
[23]
××
×Sh
ahet
al.
2003
[35]
××
×A
nton
etal
.20
02[7
0]×
Her
old
and
Rad
erm
ache
r20
02[4
7]×
Pate
leta
l.20
02[1
9]×
××
Schm
idta
ndC
ruz
2002
[21]
××
×Sc
hmid
tand
Shau
katu
llah∗
∗∗20
02[8
]Sh
arm
aet
al.
2002
[20]
××
×Su
lliva
n20
02[5
]×
Bae
r20
01[6
]×
Pate
leta
l.20
01[1
]×
××
Schm
idte
tal.
2001
[11]
××
×St
ahla
ndB
elad
y20
01[2
7]×
×K
ang
etal
.20
00[7
]×
××
∗∗∗ R
evie
wpa
per
with
hist
oric
alpr
espe
ctiv
e
Springer

Distrib Parallel Databases (2007) 21:193–225 221
Fig. 12 Data center thermal management organizational chart
chronological order. Table 4 utilizes the subdivisions of Section 3 and extends thesummary presented in Table 1 and includes the additional column of ‘Computational’to highlight those investigations, which are predominantly computational in nature,and also includes 2 review papers.
In addition to a brief review of numerical modeling and possible validation studiesfor data center airflows and heat transfer, this paper presents a number of future direc-tions to increase data center energy efficiency. Figure 12 presents a data center thermalanalysis organization chart that establishes a hierarchy of research directions and theinterconnections between different topics. The three main thrusts are evaluation ofglobal cooling schemes, investigating the effects of local and supplemental coolingschemes, and improving energy efficiency at all levels of the data center. All topicsin the organizational chart are directed at thermal optimization and thus no specificoptimization block is included as it is the underlying theme of the entire hierarchy.
Acknowledgements The authors acknowledge the support of this work through the Consortium for EnergyEfficient Thermal Management (CEETHERM), a joint academic and industry initiative focusing on currentand next-generation thermal issues in systems level electronic architectures.
References
1. C.D. Patel, C.E. Bash, C. Belady, L. Stahl, and D. Sullivan, “Computational fluid dynamics modelingof high compute density data centers to assure system inlet air specifications,” Presented at Proc.IPACK’01 – The Pacific Rim/ASME International Electronics Packaging Technical Conference andExhibition Kauai, HI, 2001.
Springer

222 Distrib Parallel Databases (2007) 21:193–225
2. “Data Center Energy Benchmarking Case Study.” California: Lawrence Berkeley National Laboratoryand Rumsey Engineers, Inc., 2003.
3. J.F. Karlsson and B. Moshfegh, “Investigation of indoor climate and power usage in a data center,”Energy and Buildings, vol. 37, pp. 1075–1083, 2005.
4. R.R. Schmidt, E.E. Cruz, and M. Iyengar, “Challenges of data center thermal management,” IBMJournal of Research and Development, vol. 49, pp. 709–723, 2005.
5. R.F. Sullivan, “Alternating cold and hot aisles provides more reliable cooling for server farms,” TheUptime Institute, 2002.
6. D.B. Baer, “Emerging cooling requirements and systems in telecommunications spaces,” Liebert Cor-poration 2001.
7. S. Kang, R.R. Schmidt, K.M. Kelkar, A. Radmehr, and S.V. Patankar, “A methodology for the design ofperforated tiles in a raised floor data center using computational flow analysis,” presented at ITHERM2000 – Intersociety Conference on Thermal and Thermomechanical Phenomena in Electronic Systems,Las Vegas, NV, 2000.
8. R.R. Schmidt and H. Shaukatullah, “Computer and telecommunications equipment room cooling: areview of the literature,” presented at ITHERM 2002 – Eight Intersociety Conference on Thermal andThermomechanical Phenomena in Electronic Systems, San Diego, CA, 2002.
9. E.C. Koplin, “Data center cooling,” ASHRAE Journal, vol. 45, pp. 46–53, 2003.10. C. Belady, K.M. Kelkar, and S.V. Patankar, “Improving productivity in electronic packaging with flow
network modeling (FNM),” Electronics Cooling, vol. 5, pp. 36–40, 1995.11. R.R. Schmidt, K.C. Karki, K.M. Kelkar, A. Radmehr, and S.V. Patankar, “Measurements and predictions
of the flow distribution through perforated tiles in raised floor data centers,” Presented at IPACK’01 –The Pacific Rim / ASME International Electronics Packaging Technical Conference and Exhibition,Kauai, HI, 2001.
12. R.R. Schmidt, K.C. Karki, and S.V. Patankar, “Raised-floor data center: perforated tile flow rates forvarious tile layouts,” Presented at ITHERM 2004 – Ninth Intersociety Conference on Thermal andThermomechanical Phenomena in Electronic Systems, Las Vegas, NV, USA, 2004.
13. J. Rambo and Y. Joshi, “Supply air distribution from a single air handling unit in a raised floorplenum data center,” Presented at ISHMT/ASME’04 –Joint Indian Society of Heat and Mass Transfer– American Society of Mechanical Engineers Heat and Mass Transfer Conference, Kalpakkam, India,2004.
14. A. Radmehr, R.R. Schmidt, K.C. Karki, and S.V. Patankar, “Distributed leakage flow in raised-floordata centers,” Presented at IPACK’05 – International Electronic Packaging Technical Conference andExhibition, San Franciso, CA, 2005.
15. J.W. Van Gilder and R.R. Schmidt, “Airflow uniformity through perforated tiles in a rasied-floordata center,” Presented at IPACK’05 – International Electronic Packaging Technical Conference andExhibition, San Francisco, CA, 2005.
16. K.C. Karki, A. Radmehr, and S.V. Patankar, “Use of computational fluid dynamics for calculating flowrates through perforated tiles in raised-floor data centers,” International Journal of Heating, Ventilation,Air-Conditioning and Refrigeration Research, vol. 9, pp. 153–166, 2003.
17. Innovative Research Inc., TileFlow v. 3.0: A Simulation Tool for Airflow and Temperature Distributionin Raised-Floor Data Centers. Plymouth, MN, 2006.
18. K.C. Karki and S.V. Patankar, “Airflow distribution through perforated tiles in raised-floor data centers,”Building and Environment, vol. 41, pp. 734–744, 2006.
19. C.D. Patel, R. Sharma, C.E. Bash, and A. Beitelmal, “Thermal considerations in cooling of large scalehigh compute density data centers,” Presented at ITHERM 2002 – Eight Intersociety Conference onThermal and Thermomechanical Phenomena in Electronic Systems, San Diego, CA, 2002.
20. R.K. Sharma, C.E. Bash, and C.D. Patel, “Dimensionless parameters for the evaluation of thermaldesign and performance of large-scale data centers,” AIAA, vol. AIAA 2002–3091, 2002.
21. R.R. Schmidt and E. Cruz, “Raised floor computer data center: effect on rack inlet temperatures ofchilled air exiting form both the hot and cold aisles,” Presented at ITHERM 2002 – Eight IntersocietyConference on Thermal and Thermomechanical Phenomena in Electronic Systems, San Diego, CA,2002.
22. J. Rambo and Y. Joshi, “Multi-scale modeling of high power density data centers,” Presented atIPACK’03 – The Pacific Rim / ASME International Electronics Packaging Technical Conference andExhibition, Kauai, HI, 2003.
23. J. Rambo and Y. Joshi, “Physical models in data center airflow simulations,” Presented at IMECE’03 –ASME International Mechanical Engineering Congress and R&D Exposition, Washington D.C., 2003.
Springer

Distrib Parallel Databases (2007) 21:193–225 223
24. R.R. Schmidt and E. Cruz, “Cluster of high powered racks within a raised floor computer data center:Effects of perforated tiles flow distribution on rack inlet air temperature,” Presented at IMECE’03 –ASME International Mechanical Engineering Congress and R&D Exposition, Washington D.C, 2003.
25. R.R. Schmidt and E.E. Cruz, “Cluster of high-powered racks within a raised-floor computer datacenter: Effect of perforated tile flow distribution on rack inlet air temperatures,” ASME Journal ofElectronic Packaging, vol. 126, pp. 510–518, 2004.
26. S. Bhopte, D. Agonafer, R.R. Schmidt, and B. Sammakia, “Optimization of data center room layoutto minimize rack inlet air temperature,” Presented at IPACK’05 – International Electronic PackagingTechnical Conference and Exhibition, San Francisco, CA, 2005.
27. L. Stahl and C. Belady, “Designing an alternative to conventional room cooling,” Presented atINTELEC’01 – 24th Annual International Telecommunications Energy Conference, 2001.
28. S. Shrivastava, B. Sammakia, R.R. Schmidt, and M. Iyengar, “Comparative analysis of differentdata center airflow management configurations,” Presented at IPACK’05 – International ElectronicPackaging Technical Conference and Exhibition, San Francisco, CA, 2005.
29. M. Iyengar, R.R. Schmidt, A. Sharma, G. McVicker, S. Shrivastava, S. Sri-Jayantha, Y. Amemiya,H. Dang, T. Chainer, and B. Sammakia, “Thermal characterization of non-raised floor air cooleddata centers using numerical modeling,” Presented at IPACK’05 – International Electronic PackagingTechnical Conference and Exhibition, San Francisco, CA, 2005.
30. R.R. Schmidt and M. Iyengar, “Effect of data center layout on rack inlet air temperatures,” Presented atIPACK’05 – International Electronic Packaging Technical Conference and Exhibition, San Francisco,CA, 2005.
31. J. Rambo and Y. Joshi, “Convective transport processes in data centers,” Numerical Heat Transfer A– Applications, accepted for publication 2006.
32. J. Rambo and Y. Joshi, “Thermal modeling of technology infrastructure facilities: A Case Study ofData Centers,” in The Handbook of Numerical Heat Transfer: Vol II, W.J. Minkowycz, E.M. Sparrow,and J.Y. Murthy, Eds. New York: Taylor and Francis, 2006, pp. 821–849.
33. R. Sharma, C.E. Bash, C.D. Patel, and M. Beitelmal, “Experimental investigation of design andperformance of data centers,” Presented at ITHERM 2004 – Ninth Intersociety Conference on Thermaland Thermomechanical Phenomena in Electronic Systems, Las Vegas, NV, 2004.
34. M. Norota, H. Hayama, M. Enai, T. Mori, and M. Kishita, “Research on efficiency of air conditioningsystem for data center,” Presented at INTELEC’03 – 25th International Telecommunications EnergyConference, Yokohama, Japan, 2003.
35. A. Shah, V.P. Carey, C.E. Bash, and C.D. Patel, “Exergy analysis of data center thermal managementsystems,” Presented at IMECE’03 – ASME International Mechanical Engineering Congress and R&DExposition, Washington, D.C, 2003.
36. A.J. Shah, V.P. Carey, C.E. Bash, and C.D. Patel, “Exergy-based optimization strategies for multi-component data center thermal management: Part I: Analysis,” presented at IPACK’05 – InternationalElectronic Packaging Technical Conference and Exhibition, San Francisco, CA, 2005.
37. A.J. Shah, V.P. Carey, C.E. Bash, and C.D. Patel, “Exergy-based optimization strategies formulti-component data center thermal management: Part II: Application and validation,” Presented atIPACK’05 – International Electronic Packaging Technical Conference and Exhibition, San Francisco,CA, 2005.
38. J. Rambo and Y. Joshi, “Thermal performance metrics for arranging forced air cooled servers in a dataprocessing cabinet,” ASME Journal of Electronic Packaging, vol. 127, pp. 452–459, 2005.
39. M.K. Herrlin, “Rack cooling effectiveness in data centers and telecom central offices: The rack coolingindex (RCI),” ASHRAE Transactions, vol. 111, pp. 725–731, 2005.
40. A. Heydari and P. Sabounchi, “Refrigeration assisted spot cooling of a high heat desnity data center,”Presented at ITHERM 2004 – Ninth Intersociety Conference on Thermal and ThermomechanicalPhenomena in Electronic Systems, Las Vegas, NV, 2004.
41. N. Rolander, J. Rambo, Y. Joshi, and F. Mistree, “Towards sustainable design of data centers:Addressing the lifecycle mismatch problem,” Presented at IPACK’05 – International ElectronicPackaging Technical Conference and Exhibition, San Franciso, CA, 2005.
42. N. Rolander, J. Rambo, Y. Joshi, F. Mistree, and J.K. Allen, “Robust design of turbulent convectivesystems using the proper orthogonal decomposition,” ASME Journal of Mechanical Design: SpecialIssue Robust and Risk Based Design, accepted for publication 2006.
43. J. Rambo, “Reduced-order modeling of multiscale turbulent convection: Application to data centerthermal management,” Ph.D. Thesis, Department of Mechanical Engineering, Georgia Institute ofTechnology, 2006.
Springer

224 Distrib Parallel Databases (2007) 21:193–225
44. J. Rambo and Y. Joshi, “Reduced order modeling of steady turbulent flows using the POD,” Presentedat ASME Summer Heat Transfer Conference, San Francisco, CA, 2005.
45. R.K. Sharma, C.E. Bash, C.D. Patel, R.J. Friedrich, and J.S. Chase, “Balance of power: Dynamicthermal management for internet data centers,” IEEE Internet Computing, vol. 9, pp. 42–49, 2005.
46. C.D. Patel, C.E. Bash, R. Sharma, A. Beitelmal, and C.G. Malone, “Smart chip, system and datacenter enabled by advanced flexible cooling resources,” Presented at Twenty First Annual IEEESemiconductor Thermal Measurement and Management Symposium, 2005.
47. K.E. Herold and R. Radermacher, “Integrated power and cooling systems for data centers,” Presentedat ITHERM 2002 – Eight Intersociety Conference on Thermal and Thermomechanical Phenomena inElectronic Systems, San Diego, CA, 2002.
48. A.J. Shah and N. Krishnan, “Life evaluation of combined heat and power alternatives in data centers,”Presented at IEEE Interantional Symposium on Electronics and the Environment 2005.
49. E. Fried and I.E. Idelchik, Flow Resistance: A Design Guide for Engineers. New York: HemispherePublishing, 1989.
50. T.D. Boucher, D.M. Auslander, C.E. Bash, C.C. Federspiel, and C.D. Patel, “Viability of dynamic cool-ing control in a data center environment,” Presented at ITHERM 2004 – Ninth Intersociety Conferenceon Thermal and Thermomechanical Phenomena in Electronic Systems, Las Vegas, NV, 2004.
51. S.B. Pope, Turbulent Flows. New York: Cambridge University Press, 2000.52. J.W. VanGilder and R.R. Schmidt, “Airflow uniformity through perforated tiles in a rasied-floor
data center,” Presented at IPACK’05 – International Electronic Packaging Technical Conference andExhibition, San Francisco, CA, 2005.
53. Q. Chen and V. Modi, “Mass transfer in turbulent impinging slot jets,” International Journal of Heatand Mass Transfer, vol. 42, pp. 873–887, 1999.
54. S. Maurel and C. Solliec, “A turbulent plane jet impingment nearby and far from a flat plate,”Experiments in Fluids, vol. 31, pp. 687–696, 2001.
55. B. Merci, J. Vierendeels, C. DeLanghe, and E. Dick, “Numerical simulation of heat transfer ofturbulent impinging jets with two-equation turbulence models,” International Journal of NumericalMethods for Heat and Fluid Flow, vol. 13, pp. 110–132, 2002.
56. T.H. Park, H.G. Choi, J.Y. Yoo, and S.J. Kim, “Streamline upwind numerical simulation of two-dimensional confined impinging slot jets,” International Journal of Heat and Mass Transfer, vol. 46,pp. 251–262, 2003.
57. S.H. Seyedein and A.S. Majumdar, “Modeling of a Single Confined Turbulent Slot Jet Impingmentusing Various k-ε Turbulence Models,” Applied Mathematical Modeling, vol. 18, pp. 526–537, 1994.
58. J. Rambo, G. Nelson, and Y. Joshi, “Airflow distribution through perforated tiles in close proximity tocomputer room air conditioning units,” Presented at ASHRAE Symposia, 2006, submitted.
59. A. Bar-Cohen and W. Krueger, “Thermal characterization of chip packages – evolutionary design ofcompact models,” IEEE Transactions on Components, Packaging, and Manufacturing Technology –Part A, vol. 20, pp. 399–410, 1997.
60. C.J.M. Lasance, “Highlights from the european thermal project PROFIT,” ASME Journal of ElectronicPackaging, vol. 126, pp. 565–570, 2004.
61. B. Shapiro, “Creating reduced-order models for electronic systems: An overview and suggested useof existing model reduction and experimental system identification tools,” in Thermal Challenges inNext Generation Electronics Systems, Y.K. Joshi and S.V. Garimella, Eds. Rotterdam, Netherlands:Millpress, 2002, pp. 299–306.
62. J. Rambo, “Reduced-order modeling of multiscale turbulent convection: Application to data centerthermal management” Ph.D. Thesis, Department of Mechanical Engineering, Georgia Institute ofTechnology, 2006.
63. J. Rambo and Y. Joshi, “POD analysis of steady flows with parametric boundary conditions,” SIAMJournal of Scientific Computing, under review.
64. R.L. Webb and H. Nasir, “Advanced technology for server cooling,” Presented at IPACK’05 –International Electronic Packaging Technical Conference and Exhibition San Francisco, CA, 2005.
65. M. Wilson, J. Wattelet, and K. Wert, “A thermal bus system for cooling electronic components inhigh-density cabinets,” ASHRAE Transactions, pp. 567–573, 2004.
66. Y. Furihata, H. Hayama, M. Enai, and T. Mori, “Improving the efficiency of cooling systems in datacenter considering equipment characteristics,” Presented at INTELEC – 26th Annual InternationalTelecommunications Energy Conference, 2004.
67. D. Wang, “A Passive solution to a difficult data center environment problem,” Presented at ITHERM2004 – Ninth Intersociety Conference on Thermal and Thermomechanical Phenomena in ElectronicSystems, Las Vegas, NV, 2004.
Springer

Distrib Parallel Databases (2007) 21:193–225 225
68. D.L. Beaty, “Liquid cooling: friend or foe?,” ASHRAE Transactions, pp. 643–652, 2004.69. Y. Hwang, R. Radermacher, S. Spinazzola, and Z. Menachery, “Performance measurements of a
force-convection air-cooled rack,” Presented at THERM 2004 – Ninth Intersociety Conference onThermal and Thermomechanical Phenomena in Electronic Systems, Las Vegas, NV, 2004.
70. R. Anton, H. Jonsson, and B. Palm, “Modeling of air conditioning systems for cooling of data centers,”Presented at ITHERM 2002 – Eight Intersociety Conference on Thermal and ThermomechanicalPhenomena in Electronic Systems, San Diego, CA, 2002.
Springer