
Modeling of ATP-mediated signal transduction and wave propagation in astrocytic cellular networks
20
Journal of Theoretical Biology 241 (2006) 649–668 Modeling of ATP-mediated signal transduction and wave propagation in astrocytic cellular networks Michail Stamatakis, Nikos V. Mantzaris Department of Chemical and Biomolecular Engineering, Rice University, Houston, TX 77005, USA Received 7 June 2005; received in revised form 12 November 2005; accepted 3 January 2006 Available online 7 February 2006 Abstract Astrocytes, a special type of glial cells, were considered to have supporting role in information processing in the brain. However, several recent studies have shown that they can be chemically stimulated by neurotransmitters and use a form of signaling, in which ATP acts as an extracellular messenger. Pathological conditions, such as spreading depression, have been linked to abnormal range of wave propagation in astrocytic cellular networks. Nevertheless, the underlying intra- and inter-cellular signaling mechanisms remain unclear. Motivated by the above, we constructed a model to understand the relationship between single-cell signal transduction mechanisms and wave propagation and blocking in astrocytic networks. The model incorporates ATP-mediated IP 3 production, the subsequent Ca 2+ release from the ER through IP 3 R channels and ATP release into the extracellular space. For the latter, two hypotheses were tested: Ca 2+ - or IP 3 -dependent ATP release. In the first case, single astrocytes can exhibit excitable behavior and frequency-encoded oscillations. Homogeneous, one-dimensional astrocytic networks can propagate waves with infinite range, while in two dimensions, spiral waves can be generated. However, in the IP 3 -dependent ATP release case, the specific coupling of the driver ATP–IP 3 system with the driven Ca 2+ subsystem leads to one- and two-dimensional wave patterns with finite range of propagation. r 2006 Elsevier Ltd. All rights reserved. Keywords: Astrocytes; ATP wave; Ca 2+ wave; Spiral wave; Wave blocking; ATP release 1. Introduction The nervous system consists of two types of cells: the neurons, which are responsible for signal propagation and information processing and the glial cells, which exist in between the neurons (Brodal, 1998). A special type of glial cells, which will be the focus of our modeling studies, are the so-called astrocytes. Before 1990, astrocytes were considered to have just supporting role for the neurons, by holding them together and supplying nutrients to them (Haydon, 2001; Nedergaard et al., 2003). This viewpoint was mainly due to the stimulation techniques that were employed: astrocytes are not electrically excitable like the neurons and studies in which electrical stimuli were applied to them could not reveal their role (Haydon, 2001). One early exception came from the studies of Orkand et al. who showed that neuronal activity results in membrane depolarization of astrocytes (Orkand et al., 1966). Major insights into the possible role of astrocytes in the mammalian brain started to appear in the literature in the early 1990s, when new experimental techniques became available (ion-sensitive fluorescent indicators, quantitative imaging techniques, patch clamp recordings from brain slices, confocal microscopy) (Haydon, 2001). The milestone paper by Cornel-Bell showed that glutamate can induce Ca 2+ waves in astrocytic cultures (Cornell-Bell et al., 1990). Many subsequent studies showed that astrocytes use a form of signaling to communicate with each other and with neighboring neurons. Thus, a focal stimulus applied to a specific cell, not only initiates a response from that cell, but it also results in a Ca 2+ wave, which is then propagated to the culture (Cornell-Bell et al., 1990). Wave propagation also occurs in situ in slices of the hippocampus (Nett et al., 2002) and the thalamus (Parri et al., 2001). The wave can subsequently reach and stimulate neurons (Nedergaard, 1994; Parpura et al., 1994). Finally, it has been suggested ARTICLE IN PRESS www.elsevier.com/locate/yjtbi 0022-5193/$ - see front matter r 2006 Elsevier Ltd. All rights reserved. doi:10.1016/j.jtbi.2006.01.002 Corresponding author. Tel.: +1 713 348 2955; fax: +1 713 348 5478. E-mail address: [email protected] (N.V. Mantzaris).
-
Upload
independent -
Category
Documents
-
view
0 -
download
0
Transcript of Modeling of ATP-mediated signal transduction and wave propagation in astrocytic cellular networks

ARTICLE IN PRESS
0022-5193/$ - se
doi:10.1016/j.jtb
�CorrespondE-mail addr
Journal of Theoretical Biology 241 (2006) 649–668
www.elsevier.com/locate/yjtbi
Modeling of ATP-mediated signal transduction and wavepropagation in astrocytic cellular networks
Michail Stamatakis, Nikos V. Mantzaris�
Department of Chemical and Biomolecular Engineering, Rice University, Houston, TX 77005, USA
Received 7 June 2005; received in revised form 12 November 2005; accepted 3 January 2006
Available online 7 February 2006
Abstract
Astrocytes, a special type of glial cells, were considered to have supporting role in information processing in the brain. However,
several recent studies have shown that they can be chemically stimulated by neurotransmitters and use a form of signaling, in which ATP
acts as an extracellular messenger. Pathological conditions, such as spreading depression, have been linked to abnormal range of wave
propagation in astrocytic cellular networks. Nevertheless, the underlying intra- and inter-cellular signaling mechanisms remain unclear.
Motivated by the above, we constructed a model to understand the relationship between single-cell signal transduction mechanisms and
wave propagation and blocking in astrocytic networks. The model incorporates ATP-mediated IP3 production, the subsequent Ca2+
release from the ER through IP3R channels and ATP release into the extracellular space. For the latter, two hypotheses were tested:
Ca2+- or IP3-dependent ATP release. In the first case, single astrocytes can exhibit excitable behavior and frequency-encoded
oscillations. Homogeneous, one-dimensional astrocytic networks can propagate waves with infinite range, while in two dimensions, spiral
waves can be generated. However, in the IP3-dependent ATP release case, the specific coupling of the driver ATP–IP3 system with the
driven Ca2+ subsystem leads to one- and two-dimensional wave patterns with finite range of propagation.
r 2006 Elsevier Ltd. All rights reserved.
Keywords: Astrocytes; ATP wave; Ca2+ wave; Spiral wave; Wave blocking; ATP release
1. Introduction
The nervous system consists of two types of cells: theneurons, which are responsible for signal propagation andinformation processing and the glial cells, which exist inbetween the neurons (Brodal, 1998). A special type of glialcells, which will be the focus of our modeling studies, arethe so-called astrocytes. Before 1990, astrocytes wereconsidered to have just supporting role for the neurons,by holding them together and supplying nutrients to them(Haydon, 2001; Nedergaard et al., 2003). This viewpointwas mainly due to the stimulation techniques that wereemployed: astrocytes are not electrically excitable like theneurons and studies in which electrical stimuli were appliedto them could not reveal their role (Haydon, 2001). Oneearly exception came from the studies of Orkand et al. who
e front matter r 2006 Elsevier Ltd. All rights reserved.
i.2006.01.002
ing author. Tel.: +1713 348 2955; fax: +1 713 348 5478.
ess: [email protected] (N.V. Mantzaris).
showed that neuronal activity results in membranedepolarization of astrocytes (Orkand et al., 1966).Major insights into the possible role of astrocytes in the
mammalian brain started to appear in the literature in theearly 1990s, when new experimental techniques becameavailable (ion-sensitive fluorescent indicators, quantitativeimaging techniques, patch clamp recordings from brainslices, confocal microscopy) (Haydon, 2001). The milestonepaper by Cornel-Bell showed that glutamate can induceCa2+ waves in astrocytic cultures (Cornell-Bell et al.,1990). Many subsequent studies showed that astrocytes usea form of signaling to communicate with each other andwith neighboring neurons. Thus, a focal stimulus appliedto a specific cell, not only initiates a response from that cell,but it also results in a Ca2+ wave, which is then propagatedto the culture (Cornell-Bell et al., 1990). Wave propagationalso occurs in situ in slices of the hippocampus (Nett et al.,2002) and the thalamus (Parri et al., 2001). The wave cansubsequently reach and stimulate neurons (Nedergaard,1994; Parpura et al., 1994). Finally, it has been suggested

ARTICLE IN PRESS
Jleak
J
ReticulumCa
Ca2+
IP3
–
PLC
receptorPIP2
Neurotransmitter(ATP)
Neurotransmitter(ATP) secretion
+
Extra cellular Space
JpumpJchannel
EndoplasmicReticulum
Caer
–
PLCPLC
+
er
er
er
cyt
Fig. 1. Signal transduction mechanisms. ATP binds to P2Y purinergic
receptors in the membrane of the cell activating PLC which catalyses IP3
production from PIP2. IP3 binds synergistically with Ca2+ in receptors on
the surface of the endoplasmic reticulum (ER) and opens channels
through which Ca2+ ions are secreted in the cytosol. Ca2+ has both
promoting and inhibitory role on its own release. There is also a Ca2+ leak
due to the large Ca2+ concentration gradient. Ca2+ is returned back to the
ER by an ATP dependent pump. As a result of this cascade ATP is
released in the extracellular space. There are two hypotheses about ATP
release (shown in dashed lines): Ca2+-dependent or IP3-dependent ATP
release.
M. Stamatakis, N.V. Mantzaris / Journal of Theoretical Biology 241 (2006) 649–668650
that abnormal wave propagation in astrocytic tissues islinked to pathological conditions, such as spreadingdepression, migraine (Leibowitz, 1992; Nedergaard et al.,2003) and epilepsy (D’Ambrosio, 2004). These findings ledto a reconsideration of the role of astrocytes in the brain.Astrocytes were no longer viewed as passive bystandersin the synapse, but as active components playing theirrole in information processing and signal propagation(Nedergaard et al., 2003).
At the single-cell level, it was discovered that astrocytescan modulate their intracellular calcium concentrationwhen stimulated with a neurotransmitter, such as gluta-mate (Cornell-Bell et al., 1990) or ATP (Cotrina et al.,1998; Guthrie et al., 1999; Wang et al., 2000). The types ofbehavior that can be observed after stimulation involve arapid increase in the cytosolic Ca2+ concentration followedby a sustained plateau phase, rapid increase in the cytosolicCa2+ concentration, which finally returns to the basallevels, and Ca2+ oscillations that persist for severalminutes (Salm and McCarthy, 1990). There are severalmechanisms by which the cell can increase its cytosolicCa2+. They include Ca2+ influx from the extracellularspace or efflux from intracellular Ca2+ stores, such as theendoplasmic reticulum (ER) and the mitochondria. How-ever, it is considered that the main mechanism by which theCa2+ concentration is modulated in astrocytes, involves anIP3-dependent pathway, which results in the release ofCa2+ through channels on the surface of the ER.
This pathway is schematically shown in Fig. 1. Astro-cytes are known to express a variety of purine receptors(P2Y) (Nedergaard et al., 2003). When a neurotransmitter,such as ATP, binds to these receptors in the membraneof the cell, phospholipase C (PLC) is activated througha G-protein coupled pathway. The activated PLC catalysesthe conversion of phosphatidylinositol 4,5-bisphosphate(PtdIns(4,5)P2, PIP2) into inositol 1,4,5-trisphosphate(Ins(1,4,5)P3, IP3) and diacylglycerol (DAG) (Berridgeet al., 1998). IP3 binds synergistically with Ca2+ ions to theIP3 receptor (IP3R) on the membrane of the ER and openschannels, through which Ca2+ is released into the cytosol.There exist also ATPase pumps on the surface of the ERwhich return Ca2+ back into the ER (Carafoli, 2002).There are two reasons for this: first the Ca2+ concentrationin the cytosol must be kept low for it to function as aneffective messenger and second, prolonged high cytosolicconcentration of Ca2+ will signal cell death. Transientelevations of the intracellular Ca2+ concentration are onlyone consequence of astrocytic stimulation. Stimulatedastrocytes are also capable of glutamate uptake (Andersonand Swanson, 2000) as well as release of glutamate(Innocenti et al., 2000), ATP (Newman, 2001) and Ca2+
to the extracellular space (Goldman et al., 1994; Holgadoand Beauge, 1995).
Moreover, the neurotransmitter-, or mechanically-, orelectrically- induced Ca2+ responses do not remain local;they spread over a coupled network of astrocytes in theform of a calcium wave, which is characterized by a finite
range of propagation in both space and time. IntercellularCa2+ waves were first reported by Cornell-Bell et al.(1990), who described propagated increases in intracellularCa2+ in astrocytes from rat hippocampus in response tobath application of glutamate. Glutamate-induced Ca2+
waves were also studied in rat and human hippocampalastrocytes in many other experiments (Cornell-Bell andFinkbeiner, 1991; Finkbeiner, 1992; Kim et al., 1994; Lee etal., 1995). Mechanically induced intercellular Ca2+ waveswere also observed in cortical mixed glia (Charles, 1994;Charles et al., 1991, 1993), C6 glioma cells (Charles et al.,1992), cortical astrocytes (Enkvist and McCarthy, 1992),oligodendrocytes (Takeda et al., 1995) and striatal astro-cytes (Venance et al., 1995, 1997). In addition, electricalstimuli evoked intercellular Ca2+ waves in hippocampalslice cultures (Dani et al., 1992), in cortical astrocyte–neur-on cultures (Parpura et al., 1994), in hippocampalastrocyte–neuron cultures (Hassinger et al., 1995) and inrat cortical astrocytes (Guthrie et al., 1999). Finally, localastrocytic stimulation with ATP was also found to result inCa2+ wave propagation in the acutely isolated retina(Newman, 2001; Newman and Zahs, 1997). Radial, as wellas spiral Ca2+ waves have been observed in cell cultures(Harris-White et al., 1998) with speeds that vary from 10 to30 mm/s (Charles et al., 1992; Innocenti et al., 2000;Newman and Zahs, 1997; Yagodin et al., 1994, 1995) and

ARTICLE IN PRESSM. Stamatakis, N.V. Mantzaris / Journal of Theoretical Biology 241 (2006) 649–668 651
range of propagation in the order of 200 mm (Guthrie et al.,1999).
Two mechanisms for intercellular astrocytic Ca2+
signaling have been suggested in the literature. Initially,Ca2+ waves were thought to spread as a result of gap-junction-mediated metabolic coupling between astrocytes(Charles et al., 1992; Sanderson et al., 1994; Sneyd et al.,1995). According to this hypothesis, IP3 diffuses betweenastrocytes through gap junctions, stimulates the release ofCa2+ from intracellular ER stores of neighboring astro-cytes and consequently leads to a calcium wave. Thereexists experimental evidence in support of this hypothesis.First, C6 glioma cells, which express few gap junctions donot exhibit Ca2+ waves unless connexins are artificiallyexpressed (Charles et al., 1992). Moreover, caged IP3
experiments have indicated that IP3 diffuses through gapjunctions and photolysis experiments have shown Ca2+
waves propagating in non-injected cells adjacent to thosethat were injected with the caged compound (Leybaert etal., 1998). However, the intercellular Ca2+ waves observedin these experiments usually propagated for much shorterdistances (2–3 cell diameters) than those observed incultures. Thus, the Achille’s heel of the IP3-mediatedhypothesis (intercellular mode of communication) is thatIP3 diffusion by itself does not seem sufficient to accountfor the range of the wave propagation. As supported bymathematical studies (Sneyd et al., 1994, 1995), thereshould be a form of regeneration.
Such a regeneration mechanism is present in the secondhypothesis that has been suggested to explain theexperimentally observed range of Ca2+ wave propagation.This hypothesis involves an extracellular agonist (extra-
cellular mode of communication) and was basicallysupported by experiments showing that a wave of elevatedintracellular Ca2+ wave can ‘‘jump’’ the gap between twogroups of cultured astrocytes separated by cell-free lanes.The Ca2+ wave can pass between disconnected cells as longas the gap is less than �120 mm (Hassinger et al., 1996). Ithas also been shown that Ca2+ waves are blocked bypurinergic receptor antagonists and by pretreatment withapyrase, an ATP degrading enzyme (Guthrie et al., 1999).Moreover, local stimulation with ATP has been found tobe sufficient to evoke the experimentally observed Ca2+
waves (Guthrie et al., 1999). These experiments providedevidence that the aforementioned extracellular mode ofastrocytic Ca2+ signaling is mediated by ATP released bystimulated astrocytes (Guthrie et al., 1999).
Newman has recently shown that the ATP-mediatedextracellular pathway for Ca2+ wave propagation is alsoused by retinal glial cells. He utilized a bioluminescenceassay to show that in addition to intercellular Ca2+ waves,ATP released by local mechanical stimulation of astrocytesalso spreads in the form of a wave in retinal glial cells(Newman, 2001). The peak ATP concentration wasapproximately 78 mM, while the range of propagationgreater than 100 mm. Moreover, the ATP wave was foundto be faster than the corresponding Ca2+ wave, and the
range of the Ca2+ wave was found to be smaller than thatof the corresponding ATP wave. Finally, Innocenti et al.(2000) have shown that glutamate released from stimulatedcultured astrocytes also propagates in the form of a wave,at an average speed of 26 mm/s and extending to �100 mm.Recent reports have shed light into the physiological
significance of astrocyte wave propagation by providingevidence for the dynamic interaction between astrocytesand neurons. Nedergaard (1994) showed that focalelectrical stimulation of single astrocytes in mixed culturesof rat forebrain astrocytes and neurons triggers a wave ofcalcium increase, propagating from astrocyte to astrocyte,while neurons resting on these astrocytes respond withlarge increases in their cytosolic Ca2+ concentration. Kanget al. (1998) demonstrated that interneuronal firing elicitstransient elevations of intracellular Ca2+ concentration inneighboring astrocytes, which, upon stimulation, potenti-ate miniature inhibitory postsynaptic currents (mIPSCs) inpyramidal neurons. Newman and Zahs showed that spikeactivity of neurons within the ganglion cell layer changed,when Ca2+ waves in astrocytes and Muller cells reachedthese neurons (Newman and Zahs, 1997).As indicated by many of the aforementioned experi-
mental studies, ATP plays a key role in intracellularsignaling as well as wave propagation in astrocytic cellularnetworks. Despite recent progress, the mechanism bywhich ATP is released after stimulation is still largelyunknown. Two main hypotheses have been postulated inthe literature. The first hypothesis accounts for Ca2+-dependent ATP release (Cotrina et al., 1998) and thesecond for IP3-dependent ATP release (Wang et al., 2000).The focus of this work is on investigating the consequencesof each hypothesis on the single-cell level dynamics and theresulting wave propagation characteristics in entire cellcultures.Due to the complexity and the partial knowledge of the
underlying biological mechanisms, understanding whatcontrols wave propagation and blocking is a complicatedtask. Mathematical modeling and computations can ob-viously help in examining closely the consequences ofdifferent hypotheses about the key signaling pathways. Tothis end, in the following section we develop a model thatdescribes signal transduction and wave propagation inastrocytic cellular networks. The model consists of asubsystem that describes Ca2+ release from internal storesand equations which model the IP3 production and ATPrelease, according to the aforementioned biological hypoth-eses. Using tools from bifurcation theory, we investigate theconsequences of each biological hypothesis andwe study the effects of key parameters on the transientand asymptotic behavior at the single-cell level. To studycoupled astrocytic networks, we incorporate the model in areaction diffusion framework. We assume that astrocyticcoupling occurs in a homogeneous cell culture throughthe diffusion of extracellular ATP and we study therelationship between different single-cell ATP release me-chanisms and wave generation, propagation and blocking

ARTICLE IN PRESSM. Stamatakis, N.V. Mantzaris / Journal of Theoretical Biology 241 (2006) 649–668652
characteristics. Due to the homogeneity assumption, we onlyconsider focal stimulation of cell cultures, since simulationsof bath application of ATP would predict the same results atthe distributed level as those predicted at the single-cell levelin a spatially homogeneous domain.
2. Model
We start our modeling studies by describing themechanisms responsible for the release of Ca2+ into thecytosol. After obtaining quantitative insight into thebehavior of this calcium subsystem, we expand thissingle-cell model to include ATP and IP3 dynamics.Finally, we incorporate the entire model in a reaction–dif-fusion framework that allows us to study the relationshipbetween wave propagation/blocking phenomena and sin-gle-cell mechanisms.
2.1. Calcium subsystem
Ca2+ dynamics have been studied extensively over thepast two decades and several models have been presentedin the literature. In our study, we have chosen to work withthe Li–Rinzel (Li and Rinzel, 1994) reduced version of theDe Young–Keizer model (De Young and Keizer, 1992) inorder to capture the dynamics of the Ca2+ subsystem,because this model strikes the best balance betweengenerality and simplicity. The Li–Rinzel model consistsof Eqs. (1)–(7). Eq. (1) is a mass balance for Ca2+ in whichthe following fluxes are considered: efflux from the ERthrough IP3R channels as well as Ca2+ leakage and influxthrough an ATP-ase pump. Eq. (2) is derived from thescheme proposed by De Young and Keizer for the kineticsof the IP3R by using singular perturbation arguments (Liand Rinzel, 1994). In this equation, h is a dimensionlesslumped variable that contains information about thefraction of open channels.
dC
dt¼ �ðc1v1m3
1h3þ c1v2ÞðC � ½Ca
2þer �Þ �
v3C2
k23 þ C2, (1)
dh
dt¼
h1 � h
th
, (2)
where I and C denote intracellular IP3 and Ca2+
concentrations, respectively, and
m1 ¼I
I þ d1
� �C
C þ d5
� �, (3)
th ¼1
a2ðQ2 þ CÞ, (4)
h1 ¼Q2
Q2 þ C, (5)
Ca2þer
� �¼
c0 � C
c1, (6)
Q2 ¼ d2I þ d1
I þ d3. (7)
The Li and Rinzel model does not exhibit excitablebehavior if the original parameter set (used by De Young,Keizer and Li, Rinzel) is employed (for definition andconditions of excitability see FitzHugh, 1960; Murray,1989). However, it has been experimentally shown thatCa2+ dynamics are excitable in a variety of cells, includingastrocytes (Bootman et al., 1992; Charles, 1998; Lechleiter etal., 1991; Neylon and Irvine, 1990; Putney, 1993; Shao andMcCarthy, 1995; Woods et al., 1987). Detailed investigationof the Li–Rinzel model using phase plane techniques hasshown that there exists a clear separation of the time-scalesof C and h. Moreover, two parameters were found able tosignificantly affect excitability by making the Ca2+ nullclinesufficiently cubic-shaped: (a) The dissociation constant forCa2+ binding to activating site (parameter d5), whichinfluences the extent to which the Calcium Induced CalciumRelease (CICR; Roderick et al., 2003) mechanism acts.Increase of this parameter promotes excitability, as it makesCICR more pronounced. (b) The threshold constant thataffects the operation of the pump (parameter k3). Lowervalues activate the pump at lower Ca2+ concentrations, thuspromoting all-or-nothing type excitable responses. Since theoriginal parameter values for the channel kinetics (includingd5), suggested by De Young and Keizer, were shown to yieldexcellent agreement with experimental data on the fractionof open channels with respect to IP3 concentration(Bezprozvanny et al., 1991), we chose to change the valueof parameter k3 in order to obtain excitable responses. Fig. 2shows the nullclines, the vector field and the correspondingtransient dynamics for the two cases of the original andmodified values of the pump threshold constant. As shownin the figure, in the case where k3 is half that of the originalvalue, the cubic shape of the nullcline is sufficientlypronounced to evoke excitable behavior.Furthermore, in Figs. 3a and b the bifurcation diagrams
with respect to the IP3 concentration for the two values of k3are shown and in Figs. 3c and d the periods of theoscillations are plotted. We note that these and allbifurcation diagrams were computed with XppAut(Ermentrout, 2002); solid lines represent stable steady statesand dashed lines unstable ones, while filled circles denotestable periodic orbits and open circles unstable ones; forlimit cycles the lower and upper points of the oscillation areplotted so that the amplitude can be illustrated. First, noticethat Ca2+ concentrations lie in a range of 0.01–1.2mM. Thiscompares well with experimental data, as the resting Ca2+
concentrations in astrocytes have been found to be around0.1mM and raise up to 0.8mM after stimulation (Charles,1998; Charles et al., 1991). Moreover, notice that for theoriginal parameter set, the amplitude of the stable oscillationchanges noticeably with the IP3 concentration, while theperiod changes less than 5 s. However, for the parameter setthat exhibits excitable behavior, the amplitude of theoscillations remains nearly constant, whereas the period

ARTICLE IN PRESS
[Ca2+] (µM)
[Ca2+
] (µ
M)
(d)(c)
(a) (b)
Ca2+ stimulus
Ca2+ stimulus
0 0.5 1 1.5[Ca2+] (µM)
0 0.5 1 1.50.4
0.6
h 0.8
1 1
1.2
0.4
0.6
h 0.8
1.2
← 0.75 µM
← 0.60 µM
← 0.55 µM
← 0.25 µM
t (s)0
0
0.2
0.4
0.6
0.8
1
[Ca2+
] (µ
M)
0
0.2
0.4
0.6
0.8
1
10 20 30 40 50
t (s)
0 10 20 30 40 50
Fig. 2. Effect of the Ca2+ pump Michaelis–Menten constant k3 on the excitability of the Ca2+ subsystem. The nullclines and vector field for the non-
excitable case are shown in panel (a) (k3 ¼ 0:1mM). The cubic shaped nullcline corresponds to dC=dt ¼ 0. The cubic shape is not sufficiently pronounced
although there is a time scale separation. Thus, threshold phenomena are not observed as shown in the two transient simulations of panel (c), where the
system starts from steady-state conditions and a square pulse in time is imposed on [Ca2+]. The duration of the pulse is 5 s and the amplitude is 0.25 mMfor the lower curve and 0.75mM for the upper curve. Notice that the response in the two cases is proportional to the amplitude of stimuli. On the contrary,
in the excitable case (k3 ¼ 0:05mM) the cubic shape is sufficiently pronounced (panel (b)) and sharp responses are observed for stimuli above a threshold as
shown in panel (d), where again a square pulse of duration 5 s is imposed on the [Ca2+] steady-state concentration. The amplitude for the lower curve is
0.55mM and for the upper is 0.60mM. Notice how large a departure from the steady state is invoked by such a small difference between the two stimuli.
M. Stamatakis, N.V. Mantzaris / Journal of Theoretical Biology 241 (2006) 649–668 653
changes orders of magnitude, due to an infinite periodbifurcation at the knee around [IP3] ¼ 0.5mM. Theseoscillations are thus shown to be frequency encoded, aphenomenon closely related to excitability (Mishchenko andRozov, 1980; Tang and Othmer, 1995).
2.2. IP3 and ATP dynamics
The model for calcium dynamics assumes that IP3
remains at constant concentrations in the cytosol. How-ever, it is known that IP3 is produced when astrocytes arestimulated with a neurotransmitter, such as ATP (Kas-tritsis et al., 1992; Wang et al., 2000). As shown inexperimental data by Kastritsis et al. (1992), ATP-mediated IP3 production follows Michaelis–Menten ki-netics. Therefore, in order to account for IP3 dynamics wewrite a mass balance for intracellular IP3 with a Michae-lis–Menten production term, in which positive Ca2+
feedback is taken into account in the way suggested inDe Young and Keizer (1992); a dimensionless parameter(a5) quantifies the extent of the feedback. Degradation ofIP3 is assumed to be linear
dI
dt¼ v4
H
k4 þH
C þ ð1� a5Þk5C þ k5
� v6I . (8)
Clearly, the dynamics of IP3 are coupled with those ofextracellular ATP (H). As described in the introduction,ATP stimulates the cell, but the cell also releases ATP intothe extracellular space through an unknown mechanismwhich we intend to investigate. To this end, ATP release isassumed to be either Ca2+-dependent or IP3-dependent.This is modeled by utilizing a generic release termc7v7F ðCÞ GðIÞ. Since one of the objectives of this paper isto investigate the potential, unknown role of Ca2+ and/orIP3 in ATP release, we considered quite general expressionsfor F ðCÞ and GðIÞ that can describe both activating and/orinhibitory roles of these signals depending on theirintracellular levels. To distinguish between the twomechanisms, in the case of IP3-dependent ATP release,function F ðCÞ is set equal to 1, while GðIÞ has a bell-shapedfunctional form to account for the possible promoting orinhibitory role of IP3 in ATP release for different IP3
concentrations. Similarly, in the case of Ca2+-dependentATP release, GðIÞ is set equal to 1 and F ðCÞ takes the formof a bell-shaped function to account for concentration-dependent, promoting and/or inhibitory effects of Ca2+ onATP release. The functional forms for F ðCÞ and GðIÞ havebeen constructed such that F ðCÞ ðGðIÞ) reaches a maximumwhen C ¼ Cmax (I ¼ Imax), and is equal to F 0 (G0) forC ¼ 0mM (I ¼ 0mM), where ATP is released only due to

ARTICLE IN PRESS
(d)(c)
(a) (b)
0.6
0.5
0.4
0.3
0.2
0.1
00 0.2 0.4 0.6 0.8 1
[IP3] (µM) [IP3] (µM)
[IP3] (µM) [IP3] (µM)
[Ca2+
] (µ
M)
[Ca2+
] (µ
M)
1.2
1
0.8
0.6
0.4
0.2
00 0.5 1 1.5 2
80
60
40
20
00.4 0.6 0.8 1 1.2
14
13
12
11
100.3 0.4 0.5 0.6 0.7
Per
iod
(s)
Per
iod
(s)
Fig. 3. Effect of excitability in the bifurcation structure. Solid lines correspond to stable steady states, dashed, to unstable ones. Filled circles denote stable
limit cycles, open circles unstable ones. In panels (a) and (c) all the attractors and the period of the limit cycles are shown for the non-excitable case
(k3 ¼ 0:10mM, all other parameters as in Table 1), with respect to IP3 concentration. In panels (b) and (d) the bifurcation diagram and the periods are
shown for the excitable case (k3 ¼ 0:05mM, all other parameters as in Table 1). In the excitable case frequency-encoded oscillations are observed: the
amplitude remains roughly constant but the period changes noticeably.
M. Stamatakis, N.V. Mantzaris / Journal of Theoretical Biology 241 (2006) 649–668654
leakage. We considered a small, non-zero value for F0 andG0 to describe basal ATP release when C ¼ 0mM(I ¼ 0mM). Also, the function is normalized, which meansthat the maximum value is equal to unity. ATP degrada-tion to adenosine is assumed to follow Michaelis–Mentenkinetics. Therefore the mass balance is
dH
dt¼ c7v7F ðCÞGðIÞ � v8
H
k8 þH, (9)
where
F ðCÞ ¼
F0F0�1
� 2 CCmax
� �1
F0�1� C
Cmax
� �2 for Ca2þ�dependent ATP release;
1 1 for IP3�dependent ATP release;
8><>:
(10)
GðIÞ ¼
1 for Ca2þ�dependent ATP release;G0
G0�1� 2 I
Imax
� �1
G0�1� I
Imax
� �2 for IP3�dependent ATP release:
8>><>>:
(11)
Thus, the full single-cell model describes the Ca2+
mobilization from the ER and the release of ATP tothe extracellular space when an astrocyte is stimulated byan increase in the extracellular ATP concentration. Itconsists of Eqs. (1)–(11) with parameter values shown inTables 1–3.
2.3. Distributed model
In order to study wave propagation in a couplednetwork of astrocytes, we incorporated these four equa-tions into a reaction–diffusion framework with no fluxboundary conditions. The general formulation is asfollows:
q u�
qt¼ D��r2 u
�þ f�
ðu�Þ; ðx; yÞ 2 D, (12)
u�ðx; y; 0Þ ¼ u
�0ðx; yÞ; n
��r u�
���qD¼ 0, (13)
where
u�¼
½ATP�
½IP3�
½Ca2þ�
h
2666664
3777775; D�¼
DATP 0 0 0
0 DIP30 0
0 0 0 0
0 0 0 0
2666664
3777775,
f�
ðu�Þ ¼
f ATP
f IP3
f Ca2þ
f h
2666664
3777775. ð14Þ
The reaction terms are the ones that appear as right-hand sides in Eqs. (1), (2), (8) and (9). Notice that in order

ARTICLE IN PRESS
Table 1
Parameters for the Ca2+ subsystem of the Li–Rinzel reduced model
Symbol Value Units Description
c0 2.0 mM Total Ca2+ concentration
c1 0.185 Dimensionless Ratio ER volume/cytoplasm volume
v1 6.0 s�1 Channel flux constant
v2 0.11 s�1 Ca2+ leak flux constant
v3 0.9 mMs�1 Max pump flux
k3 0.05 mM Constant in Hill function (this is the only parameter different than Li–Rinzel where k3 ¼ 0:1)a2 0.2 (mMs)�1 Rate constant for Ca2+ binding in inhibitory site presence IP3
d1 0.13 mM Dissociation constant
d2 1.049 mM Dissociation constant
d3 0.9434 mM Dissociation constant
d5 0.08234 mM Dissociation constant
Table 2
Parameters for the IP3 balance
Symbol Values Units Description
v4 4.0 mMs�1 Max IP3 production
k4 0.3 mM Constant in Michaelis–Menten func. for Ha
a5 0.0 Dimensionless Calcium feedback in IP3 production
k5 1.1 mM Constant in Michaelis–Menten func. for Cab
v6 0.19 s�1 IP3 degradation rate constantc
aFrom Kastritsis et al. (1992) and Charest et al. (1985) the Michaelis–Menten constant is about at �log([ATP]) ¼ 5.5–6.5 we use the values
10�6.5E0.3 mM.bThis is the same value as in De Young and Keizer (1992).cRange of values for this parameter can be found in Wang et al. (1995).
Table 3
Parameters for the ATP balance
Symbol Values Units Description
c7 1.0 Dimensionless Ratio cytoplasm vol./extracellular vol.
v7 5.0 mMs�1 Max production rate
F0, G0 0.05 Dimensionless Constant (ATP feedback)
Cmax, Imax 1.5 mM Constant (ATP feedback)a
v8 6.0 mMs�1 Max degradation rate
k8 5.0 mM Constant in Michaelis–Menten function for ATP degradation
aThese values for Cmax, Imax are representative maximum values for intracellular Ca2+ and IP3 concentrations that have been experimentally observed.
M. Stamatakis, N.V. Mantzaris / Journal of Theoretical Biology 241 (2006) 649–668 655
to accommodate the intercellular and extracellular modesof astrocytic communication, we allow for diffusion ofATP and/or IP3 although our focus is the former. Ca2+
diffusion has been experimentally found to have negligiblecontribution to astrocytic wave propagation due tobuffering effects (Allbritton et al., 1992), therefore it wasomitted. Clearly, Dh ¼ 0mm2=s, since channels do notdiffuse. This reaction–diffusion model was simulated inboth one- and two-dimensional domains, with appropriateATP focal stimuli as initial conditions. Simulations andresults will be described in the following section.
To solve the reaction–diffusion problem numerically, avariety of Finite Difference and Finite Element schemes for
spatial discretization were implemented, in conjunctionwith different time integrators. To verify the validity ofthese algorithms, we applied them to model reaction–diffu-sion problems where analytical solutions can be easilyobtained. Moreover, through comparison with resultspublished in the literature, we also saw that our numericalschemes can successfully simulate the reaction–diffusionproblem with FitzHugh–Nagumo reaction terms. For theone-dimensional case, a Central Difference spatial dis-cretization scheme in conjunction with the Trapezoid Rule(Adams–Moulton second order) for time integration wasfound to offer the best results. In two-dimensionalsimulations, a nine-point Finite Difference approximation
ARTICLE IN PRESSM. Stamatakis, N.V. Mantzaris / Journal of Theoretical Biology 241 (2006) 649–668656
of the Laplacian with Runge–Kutta fourth order as thetime integrator was shown to be the most computationallyefficient.
3. Results
In this section, we will present results from oursimulation studies, aiming at quantitatively elucidatingthe relationship between single-cell signal transductionmechanisms and wave propagation properties in a coupledastrocytic network. Specifically, we will investigate thequalitative and quantitative differences observed at boththe single-cell and cell network levels due to Ca2+- or IP3-dependent ATP release mechanisms.
3.1. Ca2+-dependent ATP release
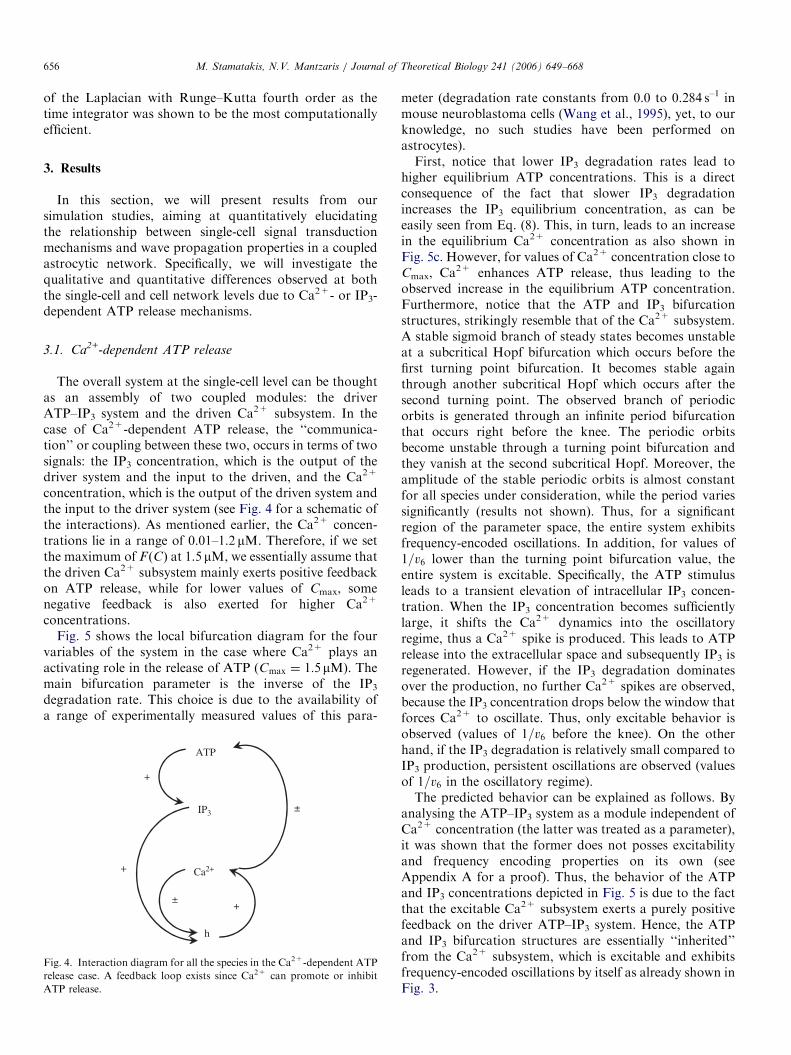
The overall system at the single-cell level can be thoughtas an assembly of two coupled modules: the driverATP–IP3 system and the driven Ca2+ subsystem. In thecase of Ca2+-dependent ATP release, the ‘‘communica-tion’’ or coupling between these two, occurs in terms of twosignals: the IP3 concentration, which is the output of thedriver system and the input to the driven, and the Ca2+
concentration, which is the output of the driven system andthe input to the driver system (see Fig. 4 for a schematic ofthe interactions). As mentioned earlier, the Ca2+ concen-trations lie in a range of 0.01–1.2 mM. Therefore, if we setthe maximum of F ðCÞ at 1.5 mM, we essentially assume thatthe driven Ca2+ subsystem mainly exerts positive feedbackon ATP release, while for lower values of Cmax, somenegative feedback is also exerted for higher Ca2+
concentrations.Fig. 5 shows the local bifurcation diagram for the four
variables of the system in the case where Ca2+ plays anactivating role in the release of ATP (Cmax ¼ 1:5mM). Themain bifurcation parameter is the inverse of the IP3
degradation rate. This choice is due to the availability ofa range of experimentally measured values of this para-
IP3
Ca2+
h
±+
+
±
+
ATP
Fig. 4. Interaction diagram for all the species in the Ca2+-dependent ATP
release case. A feedback loop exists since Ca2+ can promote or inhibit
ATP release.
meter (degradation rate constants from 0.0 to 0.284 s–1 inmouse neuroblastoma cells (Wang et al., 1995), yet, to ourknowledge, no such studies have been performed onastrocytes).First, notice that lower IP3 degradation rates lead to
higher equilibrium ATP concentrations. This is a directconsequence of the fact that slower IP3 degradationincreases the IP3 equilibrium concentration, as can beeasily seen from Eq. (8). This, in turn, leads to an increasein the equilibrium Ca2+ concentration as also shown inFig. 5c. However, for values of Ca2+ concentration close toCmax, Ca2+ enhances ATP release, thus leading to theobserved increase in the equilibrium ATP concentration.Furthermore, notice that the ATP and IP3 bifurcationstructures, strikingly resemble that of the Ca2+ subsystem.A stable sigmoid branch of steady states becomes unstableat a subcritical Hopf bifurcation which occurs before thefirst turning point bifurcation. It becomes stable againthrough another subcritical Hopf which occurs after thesecond turning point. The observed branch of periodicorbits is generated through an infinite period bifurcationthat occurs right before the knee. The periodic orbitsbecome unstable through a turning point bifurcation andthey vanish at the second subcritical Hopf. Moreover, theamplitude of the stable periodic orbits is almost constantfor all species under consideration, while the period variessignificantly (results not shown). Thus, for a significantregion of the parameter space, the entire system exhibitsfrequency-encoded oscillations. In addition, for values of1=v6 lower than the turning point bifurcation value, theentire system is excitable. Specifically, the ATP stimulusleads to a transient elevation of intracellular IP3 concen-tration. When the IP3 concentration becomes sufficientlylarge, it shifts the Ca2+ dynamics into the oscillatoryregime, thus a Ca2+ spike is produced. This leads to ATPrelease into the extracellular space and subsequently IP3 isregenerated. However, if the IP3 degradation dominatesover the production, no further Ca2+ spikes are observed,because the IP3 concentration drops below the window thatforces Ca2+ to oscillate. Thus, only excitable behavior isobserved (values of 1=v6 before the knee). On the otherhand, if the IP3 degradation is relatively small compared toIP3 production, persistent oscillations are observed (valuesof 1=v6 in the oscillatory regime).The predicted behavior can be explained as follows. By
analysing the ATP–IP3 system as a module independent ofCa2+ concentration (the latter was treated as a parameter),it was shown that the former does not posses excitabilityand frequency encoding properties on its own (seeAppendix A for a proof). Thus, the behavior of the ATPand IP3 concentrations depicted in Fig. 5 is due to the factthat the excitable Ca2+ subsystem exerts a purely positivefeedback on the driver ATP–IP3 system. Hence, the ATPand IP3 bifurcation structures are essentially ‘‘inherited’’from the Ca2+ subsystem, which is excitable and exhibitsfrequency-encoded oscillations by itself as already shown inFig. 3.

ARTICLE IN PRESS
(d)(c)
(a) (b)
10
8
6
4
2
00 0.1 0.2 0.3 0.4 0.5
[AT
P]
(µM
)
1/v6 (s) 1/v6 (s)
1/v6 (s)1/v6 (s)
2
1.5
1
0.5
00 0.1 0.2 0.3 0.4 0.5
1.5
1
0.5
00 0.1 0.2 0.3 0.4 0.5
1
0.8
0.6
0.4
0.2
00 0.1 0.2 0.3 0.4 0.5
h
[Ca2+
] (µ
M)
[IP
3] (
µM)
Fig. 5. Bifurcation diagrams for all four species in the Ca2+-dependent ATP release case. The bifurcation structure of the Ca2+ subsystem is inherited to
ATP and IP3. Excitability and frequency encoding are observed for all species. All parameters as in Tables 1–3.
M. Stamatakis, N.V. Mantzaris / Journal of Theoretical Biology 241 (2006) 649–668 657
A drastically different behavior of the system is observedif ATP release is significantly inhibited by high Ca2+
concentrations (this happens for lower values of Cmax).Fig. 6a shows the ATP bifurcation diagram for a differentextent of Ca2+ inhibition (Cmax ¼ 0:5mM). First, noticethat the steady state now appears in higher concentrations,because Cmax can be reached and the maximum possiblepositive feedback in ATP can be attained. After that, thesteady state falls to lower values because of the inhibitoryeffects. For even stronger inhibition effects(Cmax ¼ 0:1mM), a rather interesting folding of thesteady-state branch appears (Fig. 6b). The cross point ofthe folding is not a singular point as it may seem at firstglance; it appears this way because of the projection of the4-dimensional bifurcation structure on a two-dimensionalplane. Fig. 7 explains how strong inhibition creates thefolding. The bottom sketch (Fig. 7e) presents the Ca2+
bifurcation structure. We note the region of Ca2+
concentration where Ca2+ inhibits ATP release for thechosen value of Cmax, as well as the region where Ca2+
enhances ATP release. The left upper sketch (Fig. 7a) is theATP bifurcation diagram, drawn as if no inhibition tookplace. Due to the inhibition at values higher than Cmax thebranch above the dashed curve folds and creates thecharacteristic ‘‘lasso’’ shown in Fig. 7b. A major effect ofthis increasingly inhibitory role of Ca2+ in ATP release(represented by the lower Cmax values) is that the overallexcitability of the system is suppressed. Thus, despite thefact that the underlying Ca2+ subsystem remains excitable,the excitable behavior is no longer inherited to the
ATP–IP3 system. Therefore, a purely inhibitory role ofCa2+ on ATP release leads to non-excitable single-astrocyte behavior.We further explored the effect of the ATP degradation
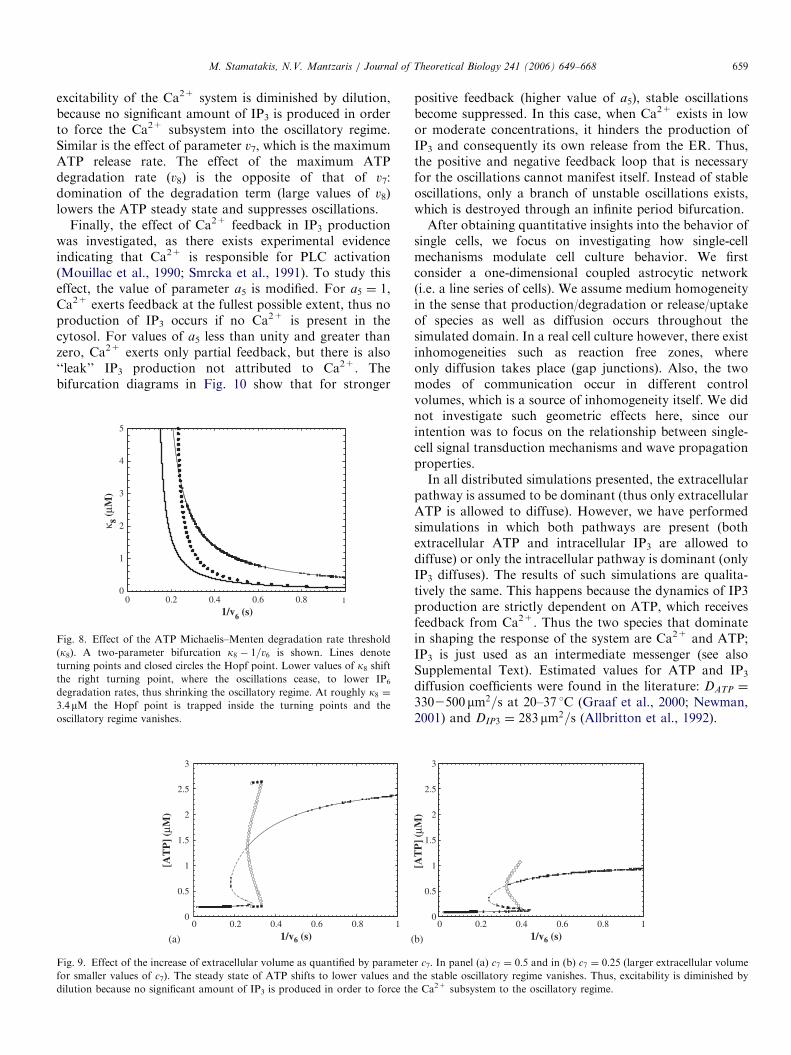
Michaelis–Menten constant (k8), since this parameter isknown to vary greatly not only between cells of differenttypes, but also within the same cell population (Cunha etal., 1998; Dunwiddie et al., 1997). Lower values of k8 resultin lower ATP steady-state concentrations for the samevalue of IP3 degradation rate. As a result, IP3 production isreduced, and the Ca2+ subsystem is forced out of theoscillatory regime. Thus, the beginning of the oscillatoryregime will move to the right. This is shown in Fig. 8 inwhich the point where the oscillatory regime starts isplotted as a function of k8. The increase of the IP3
production Michaelis–Menten constant (k4) has a verysimilar effect on the system (results not shown).The extracellular volume can be experimentally manipu-
lated in astrocytic cell cultures. The effect of such amanipulation can be quantitatively studied with our modelby changing parameter c7, which is the ratio of thecytosolic volume over the extracellular volume. Smallvalues of c7 indicate large extracellular volumes. Thebifurcation diagram (Fig. 9) reveals two interesting effectsof the increase of the extracellular volume (decrease of c7).First, the steady state of ATP is lowered significantly, asthe production term for ATP at the extracellular space islowered. Second, stable periodic solutions cease to exist,due to the domination of ATP degradation over ATPproduction. Furthermore, transient simulations reveal that

ARTICLE IN PRESS
(a)
30
25
20
15
10
5
0 0 0.1 0.2 0.3 0.4 0.5
1/v6 (s)
[AT
P]
(µM
)
(b)
30
25
20
15
10
5
0 0 0.1 0.2 0.3 0.4 0.5
1/v6 (s)
[AT
P]
(µM
)
Fig. 6. Effect of the extent of Ca2+ inhibition on ATP release as quantified by parameter Cmax. For Cmax ¼ 0:5mM (panel a) the ATP steady state shifts to
higher values, since the maximum positive feedback can be achieved, and starts decreasing. For Cmax ¼ 0:1mM (panel (b)) the inhibition is rather strong
and an interesting folding appears.
(d)(c)
(a) (b)
(f)(e)
30
25
20
15
10
5
00 0.1 0.2 0.3 0.4 0.5
1/v6 (s)
1/v6 (s)
1/v6 (s)
[AT
P]
(µM
)
30
25
20
15
10
5
00 0.1 0.2 0.3 0.4 0.5
1/v6 (s)
[AT
P]
(µM
)
2
1.5
1
0.5
00 0.1 0.2 0.3 0.4 0.5
[IP
3] (
µM)
1/v6 (s)
2
1.5
1
0.5
00 0.1 0.2 0.3 0.4 0.5
[IP
3] (
µM)
1
0.8
0.6
0.4
0.2
00 0.1 0.2 0.3 0.4 0.5
[Ca2+
] (µ
M)
1/v6 (s)
1
0.8
0.6
0.4
0.2
00 0.1 0.2 0.3 0.4 0.5
[Ca2+
] (µ
M)
Fig. 7. Illustration of how the folding in Fig. 6 is created. The left column panels ((a), (c) and (e)) correspond to the hypothetical case where no Ca2+
inhibition on ATP release is present, while in the right column panels ((b), (d) and (f)) Ca2+ inhibition is included. Panels (e) and (f) present the Ca2+
bifurcation structure. We note the region of Ca2+ concentration where Ca2+ inhibits ATP release for the chosen value of Cmax, as well as the region where
Ca2+ enhances ATP release. Panel (a) shows the ATP bifurcation diagram, drawn as if no inhibition took place. Due to the inhibition at values higher
than Cmax the branch above the dashed curve folds and creates the characteristic ‘‘lasso’’ shown in panel (b). The range of IP3 for which oscillations occur
is the same as the range depicted in Fig. 4b.
M. Stamatakis, N.V. Mantzaris / Journal of Theoretical Biology 241 (2006) 649–668658
ARTICLE IN PRESSM. Stamatakis, N.V. Mantzaris / Journal of Theoretical Biology 241 (2006) 649–668 659
excitability of the Ca2+ system is diminished by dilution,because no significant amount of IP3 is produced in orderto force the Ca2+ subsystem into the oscillatory regime.Similar is the effect of parameter v7, which is the maximumATP release rate. The effect of the maximum ATPdegradation rate (v8) is the opposite of that of v7:domination of the degradation term (large values of v8)lowers the ATP steady state and suppresses oscillations.
Finally, the effect of Ca2+ feedback in IP3 productionwas investigated, as there exists experimental evidenceindicating that Ca2+ is responsible for PLC activation(Mouillac et al., 1990; Smrcka et al., 1991). To study thiseffect, the value of parameter a5 is modified. For a5 ¼ 1,Ca2+ exerts feedback at the fullest possible extent, thus noproduction of IP3 occurs if no Ca2+ is present in thecytosol. For values of a5 less than unity and greater thanzero, Ca2+ exerts only partial feedback, but there is also‘‘leak’’ IP3 production not attributed to Ca2+. Thebifurcation diagrams in Fig. 10 show that for stronger
5
4
3
2
1
00 0.2 0.4 0.6 0.8 1
κ 8 (µM
)
1/v6 (s)
Fig. 8. Effect of the ATP Michaelis–Menten degradation rate threshold
(k8). A two-parameter bifurcation k8 � 1=v6 is shown. Lines denote
turning points and closed circles the Hopf point. Lower values of k8 shiftthe right turning point, where the oscillations cease, to lower IP6
degradation rates, thus shrinking the oscillatory regime. At roughly k8 ¼3:4mM the Hopf point is trapped inside the turning points and the
oscillatory regime vanishes.
(a)
3
2.5
2
1.5
1
0.5
00 0.2 0.4 0.6 0.8 1
[AT
P]
(µM
)
1/v6 (s) (
Fig. 9. Effect of the increase of extracellular volume as quantified by paramete
for smaller values of c7). The steady state of ATP shifts to lower values and
dilution because no significant amount of IP3 is produced in order to force th
positive feedback (higher value of a5), stable oscillationsbecome suppressed. In this case, when Ca2+ exists in lowor moderate concentrations, it hinders the production ofIP3 and consequently its own release from the ER. Thus,the positive and negative feedback loop that is necessaryfor the oscillations cannot manifest itself. Instead of stableoscillations, only a branch of unstable oscillations exists,which is destroyed through an infinite period bifurcation.After obtaining quantitative insights into the behavior of
single cells, we focus on investigating how single-cellmechanisms modulate cell culture behavior. We firstconsider a one-dimensional coupled astrocytic network(i.e. a line series of cells). We assume medium homogeneityin the sense that production/degradation or release/uptakeof species as well as diffusion occurs throughout thesimulated domain. In a real cell culture however, there existinhomogeneities such as reaction free zones, whereonly diffusion takes place (gap junctions). Also, the twomodes of communication occur in different controlvolumes, which is a source of inhomogeneity itself. We didnot investigate such geometric effects here, since ourintention was to focus on the relationship between single-cell signal transduction mechanisms and wave propagationproperties.In all distributed simulations presented, the extracellular
pathway is assumed to be dominant (thus only extracellularATP is allowed to diffuse). However, we have performedsimulations in which both pathways are present (bothextracellular ATP and intracellular IP3 are allowed todiffuse) or only the intracellular pathway is dominant (onlyIP3 diffuses). The results of such simulations are qualita-tively the same. This happens because the dynamics of IP3production are strictly dependent on ATP, which receivesfeedback from Ca2+. Thus the two species that dominatein shaping the response of the system are Ca2+ and ATP;IP3 is just used as an intermediate messenger (see alsoSupplemental Text). Estimated values for ATP and IP3
diffusion coefficients were found in the literature: DATP ¼
3302500mm2=s at 20–37 1C (Graaf et al., 2000; Newman,2001) and DIP3 ¼ 283mm2=s (Allbritton et al., 1992).
b)
3
2.5
2
1.5
1
0.5
00 0.2 0.4 0.6 0.8 1
[AT
P]
(µM
)
1/v6 (s)
r c7. In panel (a) c7 ¼ 0:5 and in (b) c7 ¼ 0:25 (larger extracellular volume
the stable oscillatory regime vanishes. Thus, excitability is diminished by
e Ca2+ subsystem to the oscillatory regime.

ARTICLE IN PRESS
(a) 1/v6(s) 1/v6(s)(b)0
0
2
4
6
8
[AT
P]
(µM
)
α 5
10
12
00 0.2 0.4 0.6 0.8 1
0.2
0.4
0.6
0.8
1
1 2 3 4 5 6
Fig. 10. Effect of Ca2+ feedback on IP3 production as quantified by parameter a5. In panel (a) the bifurcation structure for ATP is presented for a5 ¼ 1,
where the maximum possible feedback is obtained. In panel (b) a two-parameter bifurcation diagram is shown. Solid lines show the turning points, while
closed circles the Hopf point, from which the unstable periodic orbits of panel (a) arise. At around a5 ¼ 0:35 the Hopf point is trapped inside the two
turning points consequently the periodic orbits that arise are destroyed through homoclinic bifurcations before becoming stable.
M. Stamatakis, N.V. Mantzaris / Journal of Theoretical Biology 241 (2006) 649–668660
Furthermore, the choice of parameter values for thedistributed simulations has been made in such a way that theastrocytic network initially rests at a stable steady state,which gives basal concentrations for all the species. Thereason is that we are interested in reproducing experimen-tally observed behaviors. In experiments with cultures ortissue slices of astrocytes, the cells are excited from a reststate. The concentrations of Ca2+ and ATP are within basallevels ([Ca2+]E0.1mM and extracellular [ATP]o10mM).Therefore the oscillatory regime is not of interest. Similarly,the regime in which a stable steady state with highconcentrations exists (large 1/v6 values) is not of interest,since the concentrations of Ca2+ and/or ATP are wellbeyond the basal levels. However, these regimes, as well asthe regime in which a stable steady state coexists with astable limit cycle, were investigated and the simulationsindicate that no chemical waves can be generated there (seeSupplemental Text and Figures). In the oscillatory regime,an ATP stimulus results in a shift of phase, whichpropagates by diffusional coupling to neighboring cells,yet this is not an chemical wave. In the regime where theupper steady state exists, an ATP stimulus merely producesa response since the cells are already excited and their Ca2+
levels are already high. This behavior is also observed in theregime in which the steady state coexists with the limit cycle.
The choice of a stimulation protocol was made on thebasis of reproducing experimental results. To reproducefocal stimulation, in all 1-D simulations a narrow ATPsquare pulse in space was imposed, while cylindrical ATPpulses were used in 2-D simulations. All cells were initiallyat rest. Focal stimulation initially raises the local levels ofATP, and consequently IP3 and Ca2+, only in a very smallregion of the astrocytic culture. Simulations of bathapplications of agonist would not show any patterns thatcould explain experimental findings because we haveassumed homogeneity of the astrocytic network. Thus,simulating the distributed network will yield the sameresults as if the single cell model were simulated. Therefore,we will only present results in which a focal ATP stimulus
is applied to an astrocytic network which rests at the basalsteady state.Due to the excitable nature of the local dynamics, if
Ca2+ has a sufficiently promoting role in ATP release(higher values of Cmax), the system can generate andpropagate waves. Fig. 11 shows such a traveling wave pulsegenerated by a focal ATP stimulus (DATP ¼ 350mm2=s, noIP3 diffusion). Due to the excitability properties of theentire system, in this case the wave has infinite range ofpropagation in both space and time. The wave speed wasfound to be proportional to the square root of the diffusioncoefficient, in agreement with the theory of wave propaga-tion. Since only one species diffuses, the diffusioncoefficient just affects the space scaling (Fife, 1979). Theobserved wave speeds lie in a range of 10–20 mm/s which isin the same order of magnitude with experimentallyobserved wave speeds (Innocenti et al., 2000; Newmanand Zahs, 1997).We further expanded our analysis to simulate wave
propagation in two-dimensional homogeneous cultures. Aparticularly interesting pattern that has been observedexperimentally is the formation of spiral waves (Harris-White et al., 1998; Jung et al., 1998). It has been suggestedthat spiral waves are the most stable type of waves in two-dimensional excitable media (Fernandez-Garcia et al.,1994) because their wavelength is less than of any othertype of wave.For generation of spiral waves we exploit a property
termed ‘‘vulnerability’’, Specifically, a stimulus placedappropriately at an anisotropically excitable medium cangenerate a unidirectionally propagating wave (Starobin etal., 1994; Wiener and Rosenblueth, 1946). In two dimen-sions, a sequence of two point ATP stimuli can generateATP spirals as shown in Fig. 12. We note that the ATPspiral wave presented in Fig. 12 is accompanied by a similarCa2+ spiral wave (results not shown). The first stimulusgenerates a circular wave that creates the desired anisotropyas it propagates: each cell undergoes a refractory periodafter excitation, but cells along the direction of propagation

ARTICLE IN PRESS
(a) (b)
00 500 1000 1500 2000 0
0
0.2
0.4
0.6
0.8
1
1.2
500 1000 1500 2000
1
1
3
4
[AT
P]
(µm
)
x (µm) x (µm)
[Ca2+
] (µ
m)
5
Fig. 11. Snapshots of traveling wave ATP and Ca2+ pulses of infinite range in one-dimensional cell cultures for Ca2+-dependent ATP release and the
extracellular mode of communication (DATP ¼ 350mm2=s; DIP3 ¼ 0mm2=s). The corresponding time in seconds is given above each snapshot. Parameters
as in Tables 1–3 except v6 ¼ 6:0 s21.
(a) (b) (c) (d)
(e) (f) (g) (h)
Fig. 12. Generation of a two armed spiral by applying point stimuli in ATP concentration. A circular wave is initiated at t ¼ 0 s (stimulus radius 7.5mm,
amplitude 100mM). At t ¼ 73 s another stimulus generates a unidirectionally propagating front that evolves to a two armed ATP spiral.
DATP ¼ 350mm2=s; DIP3 ¼ 0mm2=s, v6 ¼ 6:0 s21. Other parameters as in Tables 1–3.
M. Stamatakis, N.V. Mantzaris / Journal of Theoretical Biology 241 (2006) 649–668 661
have been excited in different times. Cells close to the frontwere excited more recently so they are in the early refractoryperiod, while the cells away form the front were excitedearlier, so they are in the late refractory period. As a result,it is very difficult (if at all possible) to re-excite cells close tothe front, but this does not apply to cells away from thefront. Therefore, anisotropy arises. The second stimulusgenerates a circular front which breaks as it tries topropagate to cells that are in the early refractory period.We note that the stimulus must be carefully placed in spaceand time so that vulnerability is exhibited. Premature stimulido not lead to wave generation at all and late stimuligenerate circular fronts.
Spiral waves in the context of Ca2+ signaling have alsobeen presented in previous modeling studies (Atri et al.,1993; Hofer et al., 2001; Wilkins and Sneyd, 1998).
However, the authors considered the IP3-mediated inter-cellular mode of cellular coupling in conjunction with theexistence of spatial inhomogeneities, such as gap junctions.Our results indicate that this mode of cellular signaling inthe presence of reaction-free gap junctions is not the onlymechanism that can explain spiral wave generation andpropagation. In particular, ATP and Ca2+ spiral wavescan be obtained if appropriate stimulation patterns areemployed in homogeneous astrocytic cell cultures wherethe extracellular (ATP-mediated) mode of communicationdominates astrocytic coupling.
3.2. IP3-dependent ATP release
As opposed to the bi-directional communicationbetween the ATP–IP3 and Ca2+ systems in the case of

ARTICLE IN PRESSM. Stamatakis, N.V. Mantzaris / Journal of Theoretical Biology 241 (2006) 649–668662
Ca2+-dependent ATP release, in this case, the two systemsare coupled in a unidirectional fashion (see Fig. 13 for theinteraction diagram). Specifically, the output of theATP–IP3 system (IP3 concentration) drives the excitableCa2+ subsystem, without Ca2+ feeding back to ATP. As aresult, the local bifurcation structure of the ATP–IP3
system is fundamentally different than in the case of Ca2+-dependent ATP release (compare Figs. 13 and 5). Thereexists a unique, globally stable ATP concentration for eachvalue of the IP3 degradation rate, while oscillations andexcitable behavior are no longer observed. A similarbehavior is predicted for the IP3 concentration (notshown). In contrast, the Ca2+ system still exhibitsfrequency-encoded oscillations and excitability. Thesebifurcation structures are a direct consequence of the lackof feedback from Ca2+ to the driver system, due to whichthe Ca2+ subsystem cannot ‘‘transmit’’ its special proper-ties to the driver ATP–IP3 system.
The range of the IP3 degradation rate (v6) for whichoscillatory behavior is observed in the Ca2+ subsystem, is afunction of the extent of inhibition of IP3 in ATP release, asquantified by parameter Imax. The effect of Imax is shown inFig. 14 and can be understood in terms of the changes ofthe slope of the IP3 steady state. As discussed earlier, thereis a specific IP3 concentration window leading to oscillatoryCa2+ dynamics (see Fig. 3). If the slope of the IP3 steady-state concentration is high (first case, panels a, b,Imax ¼ 1:5mM), IP3 exits the regime for which Ca2+
oscillations are observed for higher IP3 degradation rates.As a result, the oscillatory regime will shrink, while, forsmaller slopes (second case, panels c, d, Imax ¼ 0:1mM) theoscillatory regime is magnified.
The sensitivity of these bifurcation structures to values ofthe parameters which quantify the effect of ATP degrada-tion (k8) and the feedback of ATP to IP3 (k4) wasinvestigated. The analysis in the present situation issimplified in comparison to the Ca2+ dependent ATPrelease case: here the steady-state mass balances for IP3 and
ATP
IP3
Ca2+
h
± +
+
+ ±
Fig. 13. Interaction diagram in the IP3-dependent ATP release case. The
system now consists a ‘‘master’’ non-excitable ATP–IP3 subsystem, which
drives the ‘‘slave’’ excitable Ca2+ subsystem.
ATP (Eqs. (8) and (9)) can be solved separately as a 2� 2system. The IP3 concentration as a function of the mainbifurcation parameter can be then used to predict the Ca2+
subsystem behavior. It was thus found that lower valuesfor the ATP degradation Michaelis–Menten constant k8,result in lower ATP steady-state concentrations andconsequently lower IP3 concentrations for the same IP3
degradation rate. This occurs because the ATP degradationterm becomes dominant, consequently the IP3 produced isnot enough to excite the Ca2+ subsystem. Therefore,stronger ATP degradation diminishes excitability; the sameeffect was observed for the Ca2+ dependent ATP releasecase. Furthermore, higher Michaelis–Menten constants forIP3 production (k4) result in lower values for the IP3
production term for the same ATP concentration. There-fore the ATP steady-state concentrations shift to lower(higher) values in the region where IP3 has a promoting(inhibitory) effect. Moreover the peak ATP concentrationas well as the oscillatory regime for the Ca2+ subsystemshift to lower IP3 degradation rates (higher 1/v6 values).To study the qualitative differences between the two
ATP release mechanisms with respect to their wavepropagation characteristics, we performed detailed one-dimensional simulations for the IP3-dependent ATP releasecase. As argued previously, we are interested in simulatinga focal ATP stimulus applied to an astrocytic networkwhich rests at the basal steady state. The other parameterregimes (oscillatory regime, upper steady state and regimeof coexistence) are not of physiological interest and werefound unable to support wave generation and propagation(see Supplemental Text).Fig. 15 shows a representative example for the case where
astrocytic communication occurs through the extracellularmode of communication (DATP ¼ 350mm2=s2DIP3 ¼
0mm2=s). The stimulus is a square pulse (in space) super-imposed on the basal ATP concentration. Notice the strikingqualitative difference between this wave and the onesgenerated in the Ca2+-dependent ATP release case(Fig. 11). The wave here vanishes after propagating forseveral cell diameters.The number of cells that the signal manages to excite
depends on the amplitude of the stimulus. Moreover, forlarge enough stimuli ([ATP]41mM) multiple Ca2+ waveswith finite range of propagation are predicted (results notshown). These regeneration phenomena, which have alsobeen experimentally observed (Salm and McCarthy, 1990),are a consequence of the prolonged high concentrations ofIP3 produced locally as a result of high ATP concentra-tions, which keep the local Ca2+ dynamics in theoscillatory regime long enough for multiple spikes to begenerated. However, we emphasize the fact that the patternof this finite range of propagation is not influenced by theamplitude of the stimulus. It is also very robust tovariations in the parameter values, such as the diffusioncoefficient or parameters of the signal transduction path-way. The predicted pattern of finite range of propagation isa direct consequence of the single cell dynamics. In

ARTICLE IN PRESS
30
25
20
15
10
5
0
30
25
20
15
10
5
0
0 0.1 0.2 0.3 0.4 0.5 0 0.1 0.2 0.3 0.4 0.5
1/v6 (s) 1/v6 (s)
0 0.1 0.2 0.3 0.4 0.5 0 0.1 0.2 0.3 0.4 0.5
1/v6 (s) 1/v6 (s)
[Ca2+
] (µ
M)
[Ca2+
] (µ
M)
[AT
P]
(µM
)[A
TP
] (µ
M)
1
0.8
0.6
0.4
0.2
0
1
0.8
0.6
0.4
0.2
0
(a) (b)
(c) (d)
Fig. 14. Panels (a) and (b): bifurcation diagrams for ATP and Ca2+ in the IP3-dependent ATP release case parameters as in Tables 1–3. A qualitatively
different picture than in the Ca2+-dependent ATP release case is observed, since ATP exhibits a stable steady state; no frequency-encoded oscillations or
excitability is observed. The effect of strong IP3 inhibition is shown in panels (c) and (d) (Imax ¼ 0:1mM): the ATP steady state drops to lower values and
the oscillatory regime is enlarged.
[AT
P]
(µM
)
100
80
60
40
20
00 400200 600 800
x (µm)
2
4
6
810
1214 16 18
(a)0
0
0.2
400200 600 800
x (µm)
0.4
0.6
0.8
1
1.2
[Ca2
+ ] (
µM)
1410 4 6 8 12 1618
(b)
Fig. 15. Snapshots of ATP and Ca2+ spatial profiles in a one-dimensional domain for the case of IP3-dependent ATP release generated by an ATP point
stimulus (amplitude 500mM, diameter 15mm which is slightly greater than a cell diameter) are shown. The corresponding time in seconds is given above
each snapshot. IP3 degradation rate v6 ¼ 7:2 s21, all other parameters as in Tables 1–3.
M. Stamatakis, N.V. Mantzaris / Journal of Theoretical Biology 241 (2006) 649–668 663
particular, the non-excitable ATP–IP3 driver system (seeAppendix A for a proof) drives the excitable Ca2+
subsystem. Due to the lack of Ca2+ feedback in ATPrelease in the case of IP3-dependent ATP release, theexcitable properties of the Ca2+ subsystem cannot betransmitted to the driver ATP–IP3 system. Hence, ATPregeneration is insufficient to sustain the wave and thisexplains the diffusion-like pattern for the propagation ofthe ATP signal that is shown in Fig. 15. Therefore, as soonas the extracellular ATP concentration, which drives IP3-mediated Ca2+ release, drops below a certain value, the
Ca2+ subsystem will return to rest as well. As a result,despite the excitable properties of the Ca2+ subsystem, thegenerated ATP, IP3 and Ca2+ waves can only have a finiterange of wave propagation. On the contrary, in the Ca2+-dependent ATP release case, discussed earlier, IP3 iscontinuously regenerated due to the positive feedback thatthe excitable Ca2+ system exerts on ATP release. Thus,both the ATP and Ca2+ waves will never become blockedonce generated in a spatially homogeneous medium.We note that the aforementioned unidirectional coupling
between IP3 and ATP constitutes a semi-regenerative

ARTICLE IN PRESSM. Stamatakis, N.V. Mantzaris / Journal of Theoretical Biology 241 (2006) 649–668664
mechanism for calcium wave propagation. A differentmechanism has been postulated by Hofer et al. (2002) toexplain such phenomena. Since this study focused on theintercellular pathway of astrocytic coupling, semi-regen-eration of calcium waves was explained on the basis ofsimultaneous intercellular diffusion of IP3 and Ca2+
through gap junctions. However, Ca2+ diffusion wasfound to have negligible contribution to astrocytic wavepropagation due to buffering effects (Allbritton et al.,1992). Thus, the proposed mechanism of partial regenera-tion of IP3 and Ca2+ waves with finite range ofpropagation due to IP3-dependent and not Ca2+-depen-dent ATP release offers an alternative explanation for theexperimentally observed patterns.
In addition to the finite range of wave propagation, theaforementioned unidirectional coupling between theATP–IP3 and Ca2+ systems at the single-cell level canalso explain several other experimental findings. Inparticular, it can explain the fact that the calcium wavedoes not propagate beyond the excursion range of the ATPwave (Wang et al., 2000) and that ATP waves travel fasterthan Ca2+ waves (41 versus 28 mm/s, data from Newman,2001). Intracellular Ca2+ levels become elevated only incells in which IP3 is above a certain threshold. Moreover,IP3 levels are modulated by ATP, which is not regeneratedsufficiently due to the lack of Ca2+ feedback on ATPrelease. Thus, the range and speed of the Ca2+ wave cannever exceed those of ATP and IP3. Moreover, Wang et al.(2000) observed a large decrease of the ATP signal as a
Fig. 16. Generation of a circular wave of finite range of propagation by applyi
cells are stimulated) and amplitude 500mM on ATP is applied and creates
(approximately 10 cell diameters). Notice the large decrease of the ATP signa
experimentally observed. IP3 degradation rate: v6 ¼ 7:2 s21; all other paramet
function of space and time after the initial stimulation, butonly a modest attenuation of the Ca2+ signal. This cannotbe explained if Ca2+ exerts a significant positive feedbackon ATP release. However, it can be understood in terms ofthe IP3-mediated release mechanism. Finally, the findingthat flash photolysis of caged Ca2+ does not initiate awave, but the increase of IP3 in the cell is sufficient for wavegeneration (Leybaert et al., 1998), further supports thehypothesis for IP3-dependent ATP release.We note that in all simulations presented so far
we assumed that IP3 production is not significantlydecreased by low intracellular Ca2+ concentrations(i.e. we set a5 ¼ 0). If this is not the case, the strictlyunidirectional coupling between the two subsystemsis destroyed. However, we emphasize that the patternof finite range of propagation remains intact. This is due tothe fact that Ca2+ cannot invoke the production ofIP3 by itself and lower cytosolic Ca2+ concentrationsmay hinder IP3 production, thus shrinking the oscillatoryregime for the Ca2+ subsystem and diminishingexcitability.In two-dimensional astrocytic networks, circular waves
with finite range of propagation can be observed. Such awave is shown in Fig. 16. A focal ATP stimulus creates awave of ATP and a wave of Ca2+, which both exhibit finiterange. The radius of the stimulus is 7.5 mm which meansthat one cell is stimulated, while the amplitude is 500 mM,which is less than the intracellular ATP content of one cell.The wave propagates for a radius of approximately
ng a point ATP stimulus. At t ¼ 0 s a stimulus of radius 7.5mm (roughly 2
an ATP and a Ca2+ wave that propagate for approximately 100mml in contrast to the modest attenuation of the Ca2+ signal, which is also
ers as in Tables 1–3.

ARTICLE IN PRESSM. Stamatakis, N.V. Mantzaris / Journal of Theoretical Biology 241 (2006) 649–668 665
100 mm, (roughly 10 cell diameters), which compares wellwith experimental data. The maximum range is reachedapproximately 10 seconds after stimulation and then itstarts to fade until the system returns to rest. Moreover, thespeed of the ATP wave speed seems to be greater (around40–50 mm/s) than the speed of the Ca2+ wave (around15 mm/s). It is interesting to observe that initially, the ATPwave spreads quickly and its attenuation is very large. Onthe contrary, the Ca2+ signal exhibits only modestattenuation, but it finally vanishes as shown in the lastpanel.
4. Discussion
We developed a model that describes signal transductionmechanisms in a single astrocyte. The model describes ATPrelease, the production of IP3 from extracellular ATPstimuli and the subsequent secretion of Ca2+ to thecytosolic space due to the opening of IP3R channels. Byincorporating the equations in a reaction–diffusion frame-work, wave generation, propagation and blocking werealso studied. Two biological hypotheses about the mechan-ism of ATP release postulated in the literature were tested:Ca2+- and IP3-dependent ATP release. Using this frame-work we studied the relationship between single-cell signaltransduction mechanisms and wave propagation propertiesof coupled astrocytic networks.
The overall single-cell system consists of two subsystems,the ATP–IP3 non-excitable driver system and the Ca2+
excitable subsystem. In the case of Ca2+-dependent ATPrelease, the coupling between the two systems is bidirec-tional: the means of communication is the IP3 concentra-tion (output of the driver, input to the driven) and theCa2+ concentration (output of the driven, input to thedriver). This is not the case however in the IP3-dependentATP release, in which the coupling is unidirectional: theIP3 concentration is the only ‘‘signal’’ (output of the driver,input to the driven). The different coupling mechanismswere found to have a striking effect on the single cell andthe coupled astrocytic network dynamics.
Ca2+-dependent ATP release leads to excitable behaviorand frequency-encoded oscillations in the entire system atthe single-cell level, since these properties of the Ca2+
subsystem are inherited to the whole system. This behavioris observed only if Ca2+ has a sufficiently enhancing effecton ATP release, for when Ca2+ inhibits ATP release, theexcitability of the system is destroyed. Infinite range ofwave propagation is predicted in one-dimensional cellcultures when the Ca2+ positive feedback loop is suffi-ciently strong. The speed of the wave was found to scalewith the square root of the diffusion coefficient of ATP, inagreement with the theory of reaction–diffusion equations.Significant Ca2+ feedback in IP3 production has astabilizing effect, damping the oscillations due to thedepression of IP3 production when Ca2+ exists in lowconcentrations.
In two-dimensional homogeneous astrocytic cellularnetworks, ATP and Ca2+ spiral waves were generatedfrom appropriate ATP stimulation patterns in the casewhere astrocytic coupling occurs predominantly throughdiffusion of extracellular ATP. These results suggest analternative mechanism for the generation of the experi-mentally observed spiral waves than the one postulated byother authors, where spirals were a result of spatialinhomogeneities in conjunction with the IP3-mediatedintercellular mode of communication.On the other hand IP3-dependent ATP release leads to a
unidirectional coupling of the non-excitable ATP–IP3
master system, which drives the excitable Ca2+ subsystem.Thus, waves of finite range of propagation are generated inboth the one and two-dimensional homogeneous domains.The range of wave propagation depends on the amplitudeof the ATP stimulus, but is always finite due to the single-cell level signal transduction mechanisms. For large enoughATP stimuli (higher than 1mM), multiple Ca2+ waves withfinite range of propagation can be generated, as a result ofthe prolonged high concentration of IP3 in the cytosol ofthe cells close to the point of stimulation.In conclusion, the IP3-dependent ATP release hypothesis
can help us understand finite range of propagation in termsof the single-cell mechanisms and the coupling between theATP–IP3 and the Ca2+ subsystems. We have notconsidered spatial inhomogeneities in our computationalanalysis. Thus, we show that finite range of propagationmay not necessarily be a result of the geometry of theastrocytic network (namely the location of the ATP releasesites and the dimensions of the reaction-free gap junctionsthrough which IP3 can diffuse between astrocytes). Theunderlying mechanisms may inherently possess the abilityto block waves from spreading throughout the whole cellculture. We have shown that in the case where a non-excitable driver system (ATP–IP3) drives an excitablesubsystem (Ca2+ subsystem) finite range of propagationcan be predicted.
Acknowledgments
M.S. would like to thank Professors AndreasG. Boudouvis (National Technical University of Athens)and Kyriakos Zygourakis (Rice University) formany stimulating discussions regarding this work.N.V.M. would like to thank Professors Hans Othmer andEric Newman (University of Minnesota) for introducinghim to various aspects of astrocyte signaling. Both authorswould like to thank the reviewers for their constructivecriticism and their contribution to the improvement of thiswork.
Appendix A
We will show that, independently of the ATP releasemechanism, the ATP–IP3 subsystem cannot be excitable.

ARTICLE IN PRESSM. Stamatakis, N.V. Mantzaris / Journal of Theoretical Biology 241 (2006) 649–668666
(i)
Ca2+-dependent ATP release:From Eqs. (10) and (11) the nullclines can be expressedin the H2I plane as follows:H ¼k8c7v7F ðCÞ
v8 � c7v7F ðCÞ, (A.1)
H ¼Iv6k4
v4ðC þ ð1� a5Þk5=C þ k5Þ � Iv6. (A.2)
The maximum degradation term is assumed to begreater than the maximum production term (to ensurethat the concentration never blows up) thus thedenominator in expression (A.1) is always positive.For every C value, the nullcline dH=dt ¼ 0 is ahorizontal line (independent of IP3) and the nullclinedI=dt ¼ 0 is a monotonically increasing function of I,with a singularity at:
I ¼v4
v6
C þ ð1� a5Þk5C þ k5
. (A.3)
Thus, the ATP–IP3 subsystem itself cannot havecubic shaped nullclines. Therefore, it cannot beexcitable. Also it is interesting to note that it cannoteven have multiple of solutions (C always assumed tobe constant).
(ii)
IP3-dependent ATP release:From Eq. (10) and the nullcline for dH=dt ¼ 0 can beexpressed in the H–I plane as follows:H ¼k8c7v7GðIÞ
v8 � c7v7GðIÞ. (A.4)
The nullcline dI=dt ¼ 0 is the same as previously(Eq. (A.2)). In this case the dH=dt ¼ 0 nullcline is abell-shaped function of I since GðIÞ is bell-shaped too.Taking the derivative of the expression of Eq. (A.4),with respect to I we obtain:
dH
dI¼
v8k8c7v7G0ðIÞ
ðv8 � c7v7GðIÞÞ2. (A.5)
Since all parameters are positive and the denomi-nator positive and finite, the roots of dH=dI ¼ 0 areexactly the same as the roots of G0ðIÞ. Therefore, thedH=dt ¼ 0 nullcline has exactly as many extrema asGðIÞ. Thus, since G0ðIÞ has one root the dH=dt ¼ 0nullcline has only one extremum. Hence, this nullclinecan never be cubic since a cubic nullcline has twoextrema. The nullcline for dI=dt ¼ 0 is monotonic asexplained before. Therefore, as in the case of Ca2+-dependent ATP release excitable behavior is notpossible. Notice however that in this case we can havemultiplicity of solutions for the ATP–IP3 system itself.
Appendix B. Supplementary materials
Supplementary data associated with this article can befound in the online version at doi:10.1016/j.jtbi.2006.01.002.
References
Allbritton, N.L., Meyer, T., Stryer, L., 1992. Range of messenger action of
calcium ion and inositol 1,4,5-trisphosphate. Science 258 (5089),
1812–1815.
Anderson, C.M., Swanson, R.A., 2000. Astrocyte glutamate transport:
review of properties, regulation, and physiological functions. Glia 32 (1),
1–14.
Atri, A., Amundson, J., Clapham, D., Sneyd, J., 1993. A single-pool
model for intracellular calcium oscillations and waves in the Xenopus
laevis oocyte. Biophys. J. 65 (4), 1727–1739.
Berridge, M.J., Bootman, M.D., Lipp, P., 1998. Calcium—a life and death
signal. Nature 395 (6703), 645–648.
Bezprozvanny, I., Watras, J., Ehrlich, B.E., 1991. Bell-shaped calcium-
response curves of Ins(1,4,5)P3 and calcium-gated channels from
endoplasmic reticulum of cerebellum. Nature (London) 351 (6329),
751–754.
Bootman, M.D., Berridge, M.J., Taylor, C.W., 1992. All-or-nothing Ca2+
mobilization from the intracellular stores of single histamine-stimu-
lated HeLa cells. J. Physiol. 450 (1), 163–178.
Brodal, P., 1998. The Central Nervous System. Oxford University Press,
New York 675pp.
Carafoli, E., 2002. Calcium signaling: a tale for all seasons. Proc. Natl
Acad. Sci. USA 99 (3), 1115–1122.
Charest, R., Prpic, V., Exton, J.H., Blackmore, P.F., 1985. Stimulation of
inositol trisphosphate formation in hepatocytes by vasopressin,
adrenaline and angiotensin II and its relationship to changes in
cytosolic free Ca2+. Biochem. J. 227 (1), 79–90.
Charles, A., 1998. Intercellular calcium waves in glia. Glia 24 (1), 39–49.
Charles, A.C., 1994. Glia-neuron intercellular calcium signaling. Dev.
Neurosci. 16 (3/4), 196–206.
Charles, A.C., Dirksen, E.R., Merril, J.E., Sanderson, M.J., 1991.
Intercellular signaling in glial cells: calcium waves and oscillations in
response to mechanical stimulation and glutamate. Neuron 6 (6),
983–992.
Charles, A.C., Naus, C.C., Zhu, D., Kidder, G.M., Dirksen, E.R.,
Sanderson, M.J., 1992. Intercellular calcium signaling via gap
junctions in glioma cells. J. Biol. Chem. 118 (1), 195–201.
Charles, A.C., Dirksen, E.R., Merrill, J.E., Sanderson, M.J., 1993.
Mechanisms of intercellular calcium signaling in glial cells studied
with dantrolene and thapsigargin. Glia 7 (134–145).
Cornell-Bell, A.H., Finkbeiner, S.M., 1991. Ca2+ waves in astrocytes. Cell
Calcium 12 (2/3), 185–204.
Cornell-Bell, A.H., Finkbeiner, S.M., Cooper, M.S., Smith, S.J., 1990.
Glutamate induces calcium waves in cultured astrocytes: long-range
glial signaling. Science N.S 247 (4941), 470–473.
Cotrina, M.L., Lin, J.H.-C., Alves-Rodrigues, A., Liu, S., Li, J., Azmi-
Ghadimi, H., Kang, J., Naus, C.C.G., Nedergaard, M., 1998.
Connexins regulate calcium signaling by controlling ATP release.
Proc. Natl Acad. Sci. USA. 95 (26), 15735–15740.
Cunha, R.A., Sebastia, A.M., Ribeiro, J.A., 1998. Inhibition by ATP of
hippocampal synaptic transmission requires localized extracellular
catabolism by ecto-nucleotidases into adenosine and channeling to
adenosine A1 receptors. J. Neurosci. 18 (6), 1987–1995.
D’Ambrosio, R., 2004. The role of glial membrane ion channels in seizures
and epileptogenesis. Pharmacol. Therap. 103 (2), 95–108.
Dani, J.W., Chernjavsky, A., Smith, S.J., 1992. Neuronal activity
triggers calcium waves in hippocampal astrocyte networks. Neuron
8, 429–440.
De Young, G.W., Keizer, J., 1992. A single-pool inositol 1,4,5-tripho-
sphate-receptor-based model for agonist-stimulates oscillations in
Ca2+ concentration. PNAS 89 (20), 9895–9899.
Dunwiddie, T.V., Diao, L., Proctor, W.R., 1997. Adenine nucleotides
undergo rapid, quantitative conversion to adenosine in the extra-
cellular space in rat hippocampus. J. Neurosci. 17 (20), 7673–7682.
Enkvist, M.O., McCarthy, K.D., 1992. Activation of protein kinase C
blocks astroglial gap junction communication and inhibits the spread
of calcium waves. J. Neurochem. 59, 519–526.
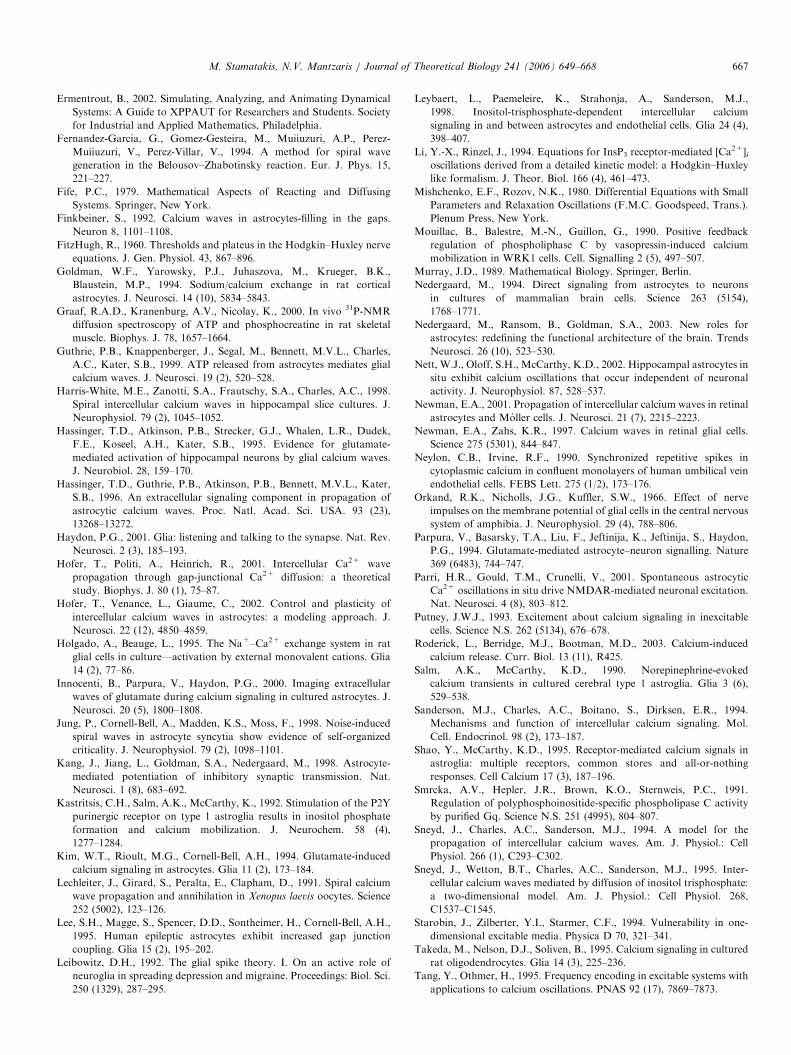
ARTICLE IN PRESSM. Stamatakis, N.V. Mantzaris / Journal of Theoretical Biology 241 (2006) 649–668 667
Ermentrout, B., 2002. Simulating, Analyzing, and Animating Dynamical
Systems: A Guide to XPPAUT for Researchers and Students. Society
for Industrial and Applied Mathematics, Philadelphia.
Fernandez-Garcia, G., Gomez-Gesteira, M., Muiiuzuri, A.P., Perez-
Muiiuzuri, V., Perez-Villar, V., 1994. A method for spiral wave
generation in the Belousov–Zhabotinsky reaction. Eur. J. Phys. 15,
221–227.
Fife, P.C., 1979. Mathematical Aspects of Reacting and Diffusing
Systems. Springer, New York.
Finkbeiner, S., 1992. Calcium waves in astrocytes-filling in the gaps.
Neuron 8, 1101–1108.
FitzHugh, R., 1960. Thresholds and plateus in the Hodgkin–Huxley nerve
equations. J. Gen. Physiol. 43, 867–896.
Goldman, W.F., Yarowsky, P.J., Juhaszova, M., Krueger, B.K.,
Blaustein, M.P., 1994. Sodium/calcium exchange in rat cortical
astrocytes. J. Neurosci. 14 (10), 5834–5843.
Graaf, R.A.D., Kranenburg, A.V., Nicolay, K., 2000. In vivo 31P-NMR
diffusion spectroscopy of ATP and phosphocreatine in rat skeletal
muscle. Biophys. J. 78, 1657–1664.
Guthrie, P.B., Knappenberger, J., Segal, M., Bennett, M.V.L., Charles,
A.C., Kater, S.B., 1999. ATP released from astrocytes mediates glial
calcium waves. J. Neurosci. 19 (2), 520–528.
Harris-White, M.E., Zanotti, S.A., Frautschy, S.A., Charles, A.C., 1998.
Spiral intercellular calcium waves in hippocampal slice cultures. J.
Neurophysiol. 79 (2), 1045–1052.
Hassinger, T.D., Atkinson, P.B., Strecker, G.J., Whalen, L.R., Dudek,
F.E., Koseel, A.H., Kater, S.B., 1995. Evidence for glutamate-
mediated activation of hippocampal neurons by glial calcium waves.
J. Neurobiol. 28, 159–170.
Hassinger, T.D., Guthrie, P.B., Atkinson, P.B., Bennett, M.V.L., Kater,
S.B., 1996. An extracellular signaling component in propagation of
astrocytic calcium waves. Proc. Natl. Acad. Sci. USA. 93 (23),
13268–13272.
Haydon, P.G., 2001. Glia: listening and talking to the synapse. Nat. Rev.
Neurosci. 2 (3), 185–193.
Hofer, T., Politi, A., Heinrich, R., 2001. Intercellular Ca2+ wave
propagation through gap-junctional Ca2+ diffusion: a theoretical
study. Biophys. J. 80 (1), 75–87.
Hofer, T., Venance, L., Giaume, C., 2002. Control and plasticity of
intercellular calcium waves in astrocytes: a modeling approach. J.
Neurosci. 22 (12), 4850–4859.
Holgado, A., Beauge, L., 1995. The Na+–Ca2+ exchange system in rat
glial cells in culture—activation by external monovalent cations. Glia
14 (2), 77–86.
Innocenti, B., Parpura, V., Haydon, P.G., 2000. Imaging extracellular
waves of glutamate during calcium signaling in cultured astrocytes. J.
Neurosci. 20 (5), 1800–1808.
Jung, P., Cornell-Bell, A., Madden, K.S., Moss, F., 1998. Noise-induced
spiral waves in astrocyte syncytia show evidence of self-organized
criticality. J. Neurophysiol. 79 (2), 1098–1101.
Kang, J., Jiang, L., Goldman, S.A., Nedergaard, M., 1998. Astrocyte-
mediated potentiation of inhibitory synaptic transmission. Nat.
Neurosci. 1 (8), 683–692.
Kastritsis, C.H., Salm, A.K., McCarthy, K., 1992. Stimulation of the P2Y
purinergic receptor on type 1 astroglia results in inositol phosphate
formation and calcium mobilization. J. Neurochem. 58 (4),
1277–1284.
Kim, W.T., Rioult, M.G., Cornell-Bell, A.H., 1994. Glutamate-induced
calcium signaling in astrocytes. Glia 11 (2), 173–184.
Lechleiter, J., Girard, S., Peralta, E., Clapham, D., 1991. Spiral calcium
wave propagation and annihilation in Xenopus laevis oocytes. Science
252 (5002), 123–126.
Lee, S.H., Magge, S., Spencer, D.D., Sontheimer, H., Cornell-Bell, A.H.,
1995. Human epileptic astrocytes exhibit increased gap junction
coupling. Glia 15 (2), 195–202.
Leibowitz, D.H., 1992. The glial spike theory. I. On an active role of
neuroglia in spreading depression and migraine. Proceedings: Biol. Sci.
250 (1329), 287–295.
Leybaert, L., Paemeleire, K., Strahonja, A., Sanderson, M.J.,
1998. Inositol-trisphosphate-dependent intercellular calcium
signaling in and between astrocytes and endothelial cells. Glia 24 (4),
398–407.
Li, Y.-X., Rinzel, J., 1994. Equations for InsP3 receptor-mediated [Ca2+]ioscillations derived from a detailed kinetic model: a Hodgkin–Huxley
like formalism. J. Theor. Biol. 166 (4), 461–473.
Mishchenko, E.F., Rozov, N.K., 1980. Differential Equations with Small
Parameters and Relaxation Oscillations (F.M.C. Goodspeed, Trans.).
Plenum Press, New York.
Mouillac, B., Balestre, M.-N., Guillon, G., 1990. Positive feedback
regulation of phospholiphase C by vasopressin-induced calcium
mobilization in WRK1 cells. Cell. Signalling 2 (5), 497–507.
Murray, J.D., 1989. Mathematical Biology. Springer, Berlin.
Nedergaard, M., 1994. Direct signaling from astrocytes to neurons
in cultures of mammalian brain cells. Science 263 (5154),
1768–1771.
Nedergaard, M., Ransom, B., Goldman, S.A., 2003. New roles for
astrocytes: redefining the functional architecture of the brain. Trends
Neurosci. 26 (10), 523–530.
Nett, W.J., Oloff, S.H., McCarthy, K.D., 2002. Hippocampal astrocytes in
situ exhibit calcium oscillations that occur independent of neuronal
activity. J. Neurophysiol. 87, 528–537.
Newman, E.A., 2001. Propagation of intercellular calcium waves in retinal
astrocytes and Moller cells. J. Neurosci. 21 (7), 2215–2223.
Newman, E.A., Zahs, K.R., 1997. Calcium waves in retinal glial cells.
Science 275 (5301), 844–847.
Neylon, C.B., Irvine, R.F., 1990. Synchronized repetitive spikes in
cytoplasmic calcium in confluent monolayers of human umbilical vein
endothelial cells. FEBS Lett. 275 (1/2), 173–176.
Orkand, R.K., Nicholls, J.G., Kuffler, S.W., 1966. Effect of nerve
impulses on the membrane potential of glial cells in the central nervous
system of amphibia. J. Neurophysiol. 29 (4), 788–806.
Parpura, V., Basarsky, T.A., Liu, F., Jeftinija, K., Jeftinija, S., Haydon,
P.G., 1994. Glutamate-mediated astrocyte–neuron signalling. Nature
369 (6483), 744–747.
Parri, H.R., Gould, T.M., Crunelli, V., 2001. Spontaneous astrocytic
Ca2+ oscillations in situ drive NMDAR-mediated neuronal excitation.
Nat. Neurosci. 4 (8), 803–812.
Putney, J.W.J., 1993. Excitement about calcium signaling in inexcitable
cells. Science N.S. 262 (5134), 676–678.
Roderick, L., Berridge, M.J., Bootman, M.D., 2003. Calcium-induced
calcium release. Curr. Biol. 13 (11), R425.
Salm, A.K., McCarthy, K.D., 1990. Norepinephrine-evoked
calcium transients in cultured cerebral type 1 astroglia. Glia 3 (6),
529–538.
Sanderson, M.J., Charles, A.C., Boitano, S., Dirksen, E.R., 1994.
Mechanisms and function of intercellular calcium signaling. Mol.
Cell. Endocrinol. 98 (2), 173–187.
Shao, Y., McCarthy, K.D., 1995. Receptor-mediated calcium signals in
astroglia: multiple receptors, common stores and all-or-nothing
responses. Cell Calcium 17 (3), 187–196.
Smrcka, A.V., Hepler, J.R., Brown, K.O., Sternweis, P.C., 1991.
Regulation of polyphosphoinositide-specific phospholipase C activity
by purified Gq. Science N.S. 251 (4995), 804–807.
Sneyd, J., Charles, A.C., Sanderson, M.J., 1994. A model for the
propagation of intercellular calcium waves. Am. J. Physiol.: Cell
Physiol. 266 (1), C293–C302.
Sneyd, J., Wetton, B.T., Charles, A.C., Sanderson, M.J., 1995. Inter-
cellular calcium waves mediated by diffusion of inositol trisphosphate:
a two-dimensional model. Am. J. Physiol.: Cell Physiol. 268,
C1537–C1545.
Starobin, J., Zilberter, Y.I., Starmer, C.F., 1994. Vulnerability in one-
dimensional excitable media. Physica D 70, 321–341.
Takeda, M., Nelson, D.J., Soliven, B., 1995. Calcium signaling in cultured
rat oligodendrocytes. Glia 14 (3), 225–236.
Tang, Y., Othmer, H., 1995. Frequency encoding in excitable systems with
applications to calcium oscillations. PNAS 92 (17), 7869–7873.

ARTICLE IN PRESSM. Stamatakis, N.V. Mantzaris / Journal of Theoretical Biology 241 (2006) 649–668668
Venance, V., Piomelli, D., Glowinski, J., Giaume, C., 1995. Inhibition by
anandamide of gap junctions and intercellular calcium signalling in
striatal astrocytes. Nature 376, 590–594.
Venance, L., Stella, N., Glowinski, J., Giaume, C., 1997. Mechanism involved
in initiation and propagation of receptor-induced intercellular calcium
signaling in cultured rat astrocytes. J. Neurosci. 17 (6), 1981–1992.
Wang, S.S.H., Alousi, A.A., Thomson, S.H., 1995. The lifetime of inositol
1,4,5-trisphosphate in single cells. J. Gen. Physiol. 105, 149–175.
Wang, Z., Haydon, P.G., Yeung, E.S., 2000. Direct observation of
calcium-independent intercellular ATP signalling in astrocytes. Anal.
Chem. 72 (9), 2001–2007.
Wiener, N., Rosenblueth, A., 1946. The mathematical formulation of the
problem of conduction of impulses in a network of connected exitable
elements specifically in cardiac muscle. Arch. Inst. Cardiol. Mexico.
Ano 16 XVI (3,4), 205–265.
Wilkins, M., Sneyd, J., 1998. Intercellular spiral waves of calcium. J.
Theor. Biol. 191 (3), 299–308.
Woods, N.M., Cuthbertson, K.S.R., Cobbold, P.H., 1987. Agonist-
induced oscillations in cytoplasmic free calcium concentration in single
rat hepatocytes. Cell Calcium 8 (1), 79–100.
Yagodin, S.V., Holtzclaw, L., Sheppard, C.A., Russell, J.T., 1994.
Nonlinear propagation of agonist-induced cytoplasmic calcium waves
in single astrocytes. J. Neurobiol. 25 (3), 265–280.
Yagodin, S.V., Holtzclaw, L., Russell, J.T., 1995. Subcellular calcium
oscillators and calcium influx support agonist-induced calcium waves
in cultured astrocytes. Mol. Cell. Biochem. 149, 137–144.


![Astrocytic tracer dynamics estimated from [1-11C]-acetate PET measurements](https://static.fdokumen.com/doc/165x107/6334cca03e69168eaf070c95/astrocytic-tracer-dynamics-estimated-from-1-11c-acetate-pet-measurements.jpg)

