A review of mathematical modeling of fixed-bed columns for carbon dioxide adsorption
Upload
khangminh22Category
view
0download
0
Modeling Chemistry and Flow in
Catalytic Fixed-Bed Reactors
with Detailed Geometry
Vom Promotionsausschuss derTechnischen Universitat Hamburg-Harburg
zur Erlangung des akademischen GradesDoktor-Ingenieurin (Dr.-Ing.)
genehmigte Dissertation
von
Ying Dong
ausHangzhou, China
2018

1. Gutachter: Prof. Dr. rer. nat. Raimund Horn2. Gutachter: Prof. Dr.-Ing. habil. Dr. h. c. Stefan HeinrichTag der mundlichen Prufung: 4. Mai 2018


Abstract
Industrial catalytic fixed-bed reactors are made of steel, operate at high temperaturesand pressures and contain hazardous chemicals. What happens inside remains hid-den. Due to the limited information elucidated from the conventional measurementtechniques aiming to resolve the gradients of species and temperature along the re-actor (typically only in and out information are available), engineers have to rely ontime consuming and costly trial and error method in reactor design and optimizationas well as reactor model development. In order to design and develop reactors withhigher accuracy, to trouble-shoot and optimize reactor in a cost-effective manner, areliable, predictive and informative reactor model is desired. Three-dimensional com-putational fluid dynamics (CFD) models with detailedly resolved bed geometry arepromising modeling approach for achieving this goal.
In this work, CFD models were developed and applied to simulate three catalyticfixed-bed reactors with different types of packing configuration and reactions. Basedon the packing geometry, different approaches were taken to create the simulationdomains. A unit cell containing 1/4 of a single Pt wire was drawn to simulate thecatalytically assisted combustion of methane on a Pt gauze. The reconstruction ofX-ray microtomographic scans was used as input to generate the modeling domain tosimulate CO oxidation on a Pt coated α-Al2O3 foam monolith. Computer generatedrandom packing by discrete element method (DEM) was applied to simulate andoptimize a pilot-scale fixed-bed reactor for n-butane oxidation to maleic anhydrideunder industrial relevant operational conditions.
A spatially resolved profile measurement technique was applied in this work. Thissampling technique provides high resolution concentration and temperature profilesinside the reactor, providing the possibility to critically validate the simulation results,and to calibrate parameters required in the model with high confidence.
This work demonstrates that detailed reactor modeling and profile measurementsare useful tools for achieving in-depth understanding of the interactions between flow,heat and mass transfer and catalytic reactions in fixed-bed reactors. Furthermore, withthe comprehensive knowledge gained from both methods, a knowledge-based reactoroptimization approach can be put forward.

Kurzfassung
Industrielle, katalytische Festbettreaktoren werden unter hohen Reaktordrucken und-temperaturen betrieben und prozessieren zum Teil gefahrliche Chemikalien. Typis-cherweise sind diese Reaktoren aus Stahl gefertigt, wodurch die Vorgange in ihremInneren unsichtbar sind. Durch konventionelle Methoden zur Beprobung von Fest-bettreaktoren ist man bei der Beobachtung der Reaktionsvorgange auf wenige Messs-tellen entlang des Katalysatorbettes limitiert (typisch: Reaktoreingang und Reakt-orausgang). Reaktormodelle werden anhand solcher Daten validiert, was begrundet,dass Chemieingenieure bei der Reaktorauslegung und Reaktoroptimierung auf zeitinte-nsive und teure Trial-and-Error-Methoden angewiesen sind. Um die Reaktorauslegunggenauer und kosrengunstiger durchfuhren zu konnen, sind zuverlassige Reaktorsimu-lationen notwendig. Ein vielversprechender Ansatz zur Erreichung dieses Ziels istdie Verwendung von dreidimensionalen, computergestutzten Fluiddynamik-Modellen(CFD-Modelle) gekoppelt mit geeigneten Reaktionskinetiken.
In der vorliegenden Arbeit wurden CFD-Modelle entwickelt und angewand umdrei unterschiedliche Festbettreaktoren zu simulieren. Es wurden drei verschiedeneFestbettgeometrien und drei Reaktionen untersucht. In Abhangigkeit von der Pack-ungsgeometrie wurden unterschiedliche Ansatze zur Erzeugung der Reaktormodelleeingesetzt.
Fur die Methanoxidation an einem Platinnetzkatalysator wurde eine Einheitszellegewahlt, die ein Viertel eines Platindrahtes enthalt. Zur Simulation der Kohlenstoff-monoxid Oxidation an einem platinbeschichteten α-Al2O3-Schaummonolithen wurdeder Monolith rontgenmikrotomographisch charackterisiert und die exakte Schaumgeo-metrie rekonstruiert. Fur die Simulation und Optimierung eines Pilotreaktors fur diekatalytische Oxidation von n-Butan zu Maleinsaureanhydrid wurde eine Katalysat-orpackung unter Zuhilfenahme der sogenannten Diskrete-Elemente-Methode (DEM),durch zufallige Schuttung der Katalysatorkorper, erzeugt.
Die Simulationen wurde in allen Fallen durch die Messung von ortlich aufgelostenReaktorprofilen kritisch validiert. Die Untersuchungen fanden unter indutriell relev-anten Bedingungen statt. Die experientellen Daten erlauben außerdem die Kalibrier-ung wichtiger Modellparameter mit sehr hoher Genauigkeit und Zuverlassigkeit. Dievorliegende Arbeit zeigt, dass die durchgefuhrten detailierten Simulationen in Kombin-ation mit der experimentellen Messung von Reaktorkonzentrations und Reaktortem-peraturprofilen, ein außerordentlich nutzliches Werkzeug fur ein tieferes Verstandnisdes Zusammenspiels von Fluiddynamik, Warme- und Stofftransport und der katalyt-ischen Reaktion in Festbettreaktoren darstellt. Das so erreichte tiefere Verstandnis desReaktionsprozesses, stellt einen Schritt in die Richtung einer wissensbasierten Reakt-orauslegung bzw. -optimierung dar.

Acknowledgements
I would like to take this chance and express my gratitude to all the people who havehelped me in my PhD period. I cannot image to arrive at this point without all yoursupport.
I thank my advisor Prof. Dr. Raimund Horn for guiding me through the four yearsPhD adventure. Thank you for always having trust in me and encouraging me to bepersistent. Every time I am confused with the theory, lost in details, your patience andinstructive ideas helped me out. I would remember all the hours we spend derivingequations, trouble-shooting the pitfall in the simulations, polishing our manuscriptsespecially my ‘missing article’. Thank you also for sharing many pieces of your lifestories which provide me the right momentum when things gets difficult.
I thank Prof. Dr. Dr. h. c. Frerich Keil for recommending me for this PhD posi-tion and all the motivations and supports during years of study and research. Youreverlasting enthusiasm for research and unselfishness in knowledge transfer is alwaysa source of inspiration to me. Thank you for selecting book chapters and reviewsfor me so that I can get myself into the topic more efficiently. Also, thank you forproofreading my thesis and publications.
I thank Prof. Dr.-Ing. habil. Dr. h. c. Stefan Heinrich for referring my thesis.During my master study in TUHH, I had the pleasure to attend your lectures onparticle technology. This knowledge is important to this work especially for the DEMsimulation part.
I thank Prof. Dr.-Ing. Michael Schluter for bringing me into the world of CFD. Ilearned a lot from your lectures on multiphase flow and CFD modeling. These twolectures provide me the foundation of my research.
Many thanks to Dr. Oliver Korup, the hero behind the stage without who many ofthe simulations I did would lose their meaning. Thank you for the inspiring suggestionsin work, valuable advice in life and generous share of knowledge and experience.
I want to thank all the colleagues in the Institute of Chemical Reaction Engin-eering, TUHH: (best and only office mate) Viktor Berg, Stephan Bendt, Dr. LudwigScharfenberg, Andres Aquino, Bahne Sosna, Jan Pottbacker, Klaus Mandel, ChristinaLaarmann, Hermine Oppelaar, Dr. Achim Bartsch. It is a nice experience workingwith you all and lovely life memory for all the brilliant ideas during our ‘coffee-break’.Especially, I would like to say thank you to Stephan Bendt for proofreading my PhDthesis and continuous encouragement during this four years of work.
A major part of my PhD project is in collaboration with BasCat in Berlin and Iwould like to thank all the people there who have contribute to this work. Special thankgoes to Dr. Frank Rosowski for initiating the topics, sharing of valuable industrialexpertise and all kinds of supports during our four years research collaborations. Manythanks to Dr. Michael Geske for numerous efforts in building up, testing the profilereactor, measuring and analysing profiles as well as the scientific input in our paperand presentations. I want to thank Dr. Benjamin Frank and Christian Schulz for the

iv
kinetic model and interesting discussions.
It is my pleasure and luck to advisor the master works of Bahne Sosna, Nils Ellen-feld, Julian Gerdts who did excellent jobs and contributed major experimental inputto this thesis. Also, Nina Heitz and Jannis Reich with whom I enriched my simulationexperience.
Special thank goes to Dr. Heiner Schwarz who shared his experimental data ongauze reactor with me so that I can verify my simulation. I learned a lot from thissimulation experience.
Thanks to all the friends, particularly to MiaoTian, simply for your company andcaring nature.
Last but not least, I want to say thank you to my parents, and to my dear husbandJin for your understanding and support.

Contents
Abstract i
Kurzfassung ii
Acknowledgements iii
1 Introduction 1
2 Summary of Results and Future Perspective 5
3 Theoretical Background and Methodology 8
3.1 Heterogeneous model . . . . . . . . . . . . . . . . . . . . . . . . . . . . 9
3.1.1 Particle model . . . . . . . . . . . . . . . . . . . . . . . . . . . 9
3.1.2 Reactor model . . . . . . . . . . . . . . . . . . . . . . . . . . . 13
3.2 Particle-resolved CFD approach . . . . . . . . . . . . . . . . . . . . . . 16
3.2.1 Packing generation: Discrete Element Method . . . . . . . . . 16
3.2.2 Meshing . . . . . . . . . . . . . . . . . . . . . . . . . . . . . . . 18
3.2.3 Fundamental equations . . . . . . . . . . . . . . . . . . . . . . 19
3.2.4 Modeling reaction . . . . . . . . . . . . . . . . . . . . . . . . . 21
3.2.5 Turbulence model . . . . . . . . . . . . . . . . . . . . . . . . . 23
4 Catalytical Methane Combustion on a Platinum Gauze 25
4.1 Experimental details . . . . . . . . . . . . . . . . . . . . . . . . . . . . 26
4.2 Simulation details . . . . . . . . . . . . . . . . . . . . . . . . . . . . . 27
4.3 Results and discussion . . . . . . . . . . . . . . . . . . . . . . . . . . . 28
4.4 Conclusions . . . . . . . . . . . . . . . . . . . . . . . . . . . . . . . . . 32
5 Microtomography-Based CFD Modeling of A Foam Monolith 33
5.1 Experimental details . . . . . . . . . . . . . . . . . . . . . . . . . . . . 34
5.2 Simulation details . . . . . . . . . . . . . . . . . . . . . . . . . . . . . 38
5.3 Results and discussion . . . . . . . . . . . . . . . . . . . . . . . . . . . 43
5.4 Conclusions . . . . . . . . . . . . . . . . . . . . . . . . . . . . . . . . . 50
6 Packing Study: DEM Simulations and Validations 54
6.1 Spherical packings . . . . . . . . . . . . . . . . . . . . . . . . . . . . . 54
6.2 Raschig ring packings . . . . . . . . . . . . . . . . . . . . . . . . . . . 57
6.3 Conclusions . . . . . . . . . . . . . . . . . . . . . . . . . . . . . . . . . 62

vi Contents
7 Heat Transport: CFD Simulations and Validations 63
7.1 Experimental details . . . . . . . . . . . . . . . . . . . . . . . . . . . . 64
7.2 Simulation details . . . . . . . . . . . . . . . . . . . . . . . . . . . . . 64
7.3 Results and discussion . . . . . . . . . . . . . . . . . . . . . . . . . . . 68
7.4 Conclusions . . . . . . . . . . . . . . . . . . . . . . . . . . . . . . . . . 77
8 N-butane Oxidation to Maleic Anhydride: CFD Simulations andProfile Measurements 79
8.1 Experimental details . . . . . . . . . . . . . . . . . . . . . . . . . . . . 81
8.2 Simulation details . . . . . . . . . . . . . . . . . . . . . . . . . . . . . 84
8.3 Results and discussion . . . . . . . . . . . . . . . . . . . . . . . . . . . 86
8.4 Conclusions . . . . . . . . . . . . . . . . . . . . . . . . . . . . . . . . . 96
9 Catalyst Pore Structure Study 98
9.1 Simulation details . . . . . . . . . . . . . . . . . . . . . . . . . . . . . 98
9.2 Results and discussion . . . . . . . . . . . . . . . . . . . . . . . . . . . 100
9.3 Conclusions . . . . . . . . . . . . . . . . . . . . . . . . . . . . . . . . . 109
Bibliography 110
Nomenclature 127
List of Figures 129
List of Tables 134

1Introduction
The fixed-bed reactor is historically one of the oldest reactor configurations for per-forming fluid (gas or liquid) solid reactions in synthetic chemical and petroleum pro-duction industries [1]. As its name implies, a fixed-bed reactor is arranged so that thesolid particles, which are mostly the catalyst, are held in position while the fluids flowaround them [2]. Due to its fairly simple construction, stability, and controllability,this reactor type retains its favoured position in industrial practice over other moreadvanced and sophisticated reactors.
Substantial progress has been made in chemical engineering to understand thephenomenological and mechanistic aspects happening inside fixed-bed reactors [3–8]. Based on this knowledge, mathematical models of varying complexity have beenderived and routinely practised with respect to reactor design, scale-up and processintensification [2, 9–11]. The performance of an industrial reactor for specific catalyticreactions is a complex function of the chemistry and transport processes [12]. Withouta comprehensive knowledge of what happens inside the reactor, engineers have to relyon design by analogy, trial and error approach which is clearly not efficient. Therefore,numerical simulations preferably based on accessible parameters routing from physicalproperties are desired to, for example, find optimal operating parameters for reactors[13–15]. The main driving force for continuous modeling efforts in chemical engineeringis not only to better design and control the reactor with improved model accuracy, butalso to gain more fundamental and in-depth understanding of the interacting transportand reaction phenomena inside the fixed-bed reactor.
In order to simulate chemically reacting flows inside a fixed-bed reactor in detail,three-dimensional Computational Fluid Dynamics (CFD) models are developed in thiswork. The first step in a typical CFD simulation is to create the bed geometry. For aregular and periodic type of packing, one can draw the geometry with known geomet-rical parameters. Often, one draws only a representative unit-cell type of geometrydue to the periodic nature of such a packing. One example of such a type of fixed-bedreactor is one packed with metal gauze catalysts. Reactions on catalytic gauzes areamong the oldest processes in the chemical industry, for example, the Ostwald processand Andrussow process [16–18]. Because the catalytic reactions on the gauzes are sofast, those processes are often run under external transport limitations, and thus thereactor performance is dictated by mass and heat transport. Such a gauze reactor forcatalytically assisted methane combustion over platinum is studied in this work andpresented in Chapter 4.
When a packing structure does not have regular and repetitive geometry units,creating a calculation domain simply by drawing is not possible. For small beds,one can reconstruct the packing from non-invasive imaging method such as MagneticResonance Imaging (MRI) [19, 20] and X-ray computed microtomographic (µ-CT)scans [21, 22]. One good packing configuration for conducting µ-CT scans is the open-cell foam. It has randomized and reticulated pore structure which is difficult to draw

2 1 Introduction
but can be well captured by the µ-CT [23]. Catalytically foams have been proposed asalternative porous catalyst carriers for strong exothermic/endothermic reactions [23].In this work, CFD simulations based on reconstructed structure from µ-CT scans ofCO oxidation on an open-cell foam monolith catalyst is explored and presented inChapter 5.
Despite the vast research efforts in foam packing for heterogeneous catalysis, in-dustrial application of this type of packing is rare [23]. Even nowadays, the mostemployed configuration of a fixed-bed reactor is still the well-known random packingof (catalyst) pellets. The dominating approach to model fixed-bed reactor with suchrandom packing is the ‘pseudo-homogeneous’ and ‘heterogeneous’ models. In thesemodels, the geometry of the packing is not resolved but regarded as an effective por-ous medium [24]. Since the particles are not resolved in those models, packing inducedcomplex flow patterns cannot be described in detail. Furthermore, the model accuracyis questionable for fixed-bed reactors with small ratios of reactor diameter D to pelletdiameter d (D/d ratio) due to pronounced confining wall effects [25]. This type offixed-bed reactor is of particular interests to this work since many of the industrialimportant exothermic and endothermic reactions are conducted in this configurations[26, 27].
A recent advance in the field of modeling fixed-beds with random packing is theintroduction of discrete-particle resolved three-dimensional CFD simulations by thepioneering work of Dixon et al. [28–32]. In this modeling approach, shapes andlocations of each particle are modeled and the interstitial velocity field as well as otherphysical quantities are resolved. Thus, this approach reflects a more physical profoundbasis compared to the aforementioned conventional porous medium approach [33–38].Many recent publications have also demonstrated encouraging results that this toolcan indeed be applied to better understand the local phenomena [39], to developcorrelations replacing experiments [38, 40], to design and control fixed-bed reactors[30], to study catalyst deactivation [41], to design catalyst shape [42, 43], as well as tofind optimal operation conditions [44, 45] to various reactions especially for reformingreactions and exothermic oxidation of small hydrocarbons.
Even though it is rather a straightforward procedure to load pellets into a technicalreactor in real life, creating such a random packing geometry in a simulation is by nomeans an easy task. To apply µ-CT on a technical-scale reactor is currently notfeasible and is too costly to be routinely practised [46]. Hence, methods have beenproposed to generate random packings by computer, among them are the DiscreteElement Method (DEM) [26, 47–52] and the Monte Carlo method [36, 53–56]. Oncea stable packing is generated by either method, one can extract the information ofthe location and orientation of each pellet and use as an input for CFD simulations.Obviously, due to the random nature, one obtains rather a numerical representationof the real packing than an exact copy. As a prerequisite, the computer generatedrandom packing has to match the experimental packing in terms of bed density andporosity within statistical bounds [57]. In this work, the discrete element method isapplied. It is widely applied in particle simulations with decent success [26, 58–61].In order to gain confidence using computer generated random packing from DEMsimulations especially for fixed-bed reactors with small D/d ratios, validation studieshave been carried out and presented in Chapter 6.
The following step after generating a packing is meshing. An accurate, robustand cost-effective meshing strategy has been a popular research topic in this fieldfor the past few years and is still to this day. Meshing techniques for the contactpoints (lines/areas) between the computer generated packings of both spherical andnon-spherical particles have been advanced from the global shrinking or expansion
3
[62] to local modifications by bridging the particles with cylinders [49] or flatteningthe particle surface to make gaps [26]. The choice of a meshing strategy is oftenlinked to the experience one has with a certain CFD program. Systematic analysisand guidance of the applied meshing strategy to the performance of flow, pressuredrop, void fraction, heat transfer, and reaction simulations are reported by Dixon etal. [63] using ANSYS Fluent, Eppinger et al. [26] and Wehinger et al. [64] usingSTAR-CCM+, Boccardo et al. [65] using OpenFoam and Rebughini et al. [66] usingcatalyticFOAM [67]. In this work, the work flow proposed by Eppinger et al. [26] forSTAR-CCM+ users is adopted. To validate the DEM-CFD approach coupled with theapplied meshing strategy, heat transfer studies in a fixed-bed reactor with low D/dratio (4 ≤ D/d ≤ 7) for both spherical and Raschig ring packings in moderate flowconditions and high temperature ranges were conducted. This study is demonstratedin Chapter 7.
To further improve the confidence of such simulations and achieve widespread use,even as primary design tool for chemical industrial practice [57], joint efforts from aca-demia research and industry are needed [51]. N-butane oxidation to maleic anhydride(MA) was chosen in this work as the studied reaction. It is one of the most importantindustrial catalytic oxidation reactions with a high annual worldwide MA production(2.8 million metric tons in 2015) [68]. Currently, one of the dominant reactor con-figurations is the multi-tubular fixed-bed reactor cooled by circulating molten salt,packed with shaped pellets of vanadyl pyrophosphate (VPP) catalyst [69, 70]. Dueto the explosion limitation, the butane inlet composition is typically below 2 % [71].Since the unconverted n-butane is not recycled at the end of the bed, this process runsat high conversion levels typically at 80-85 % n-butane conversion [72]. The overallyield of MA reported is 57-65 % [72], which is unsatisfactory. The high productionrate and growing demand of MA motivate chemists to find higher performance cata-lysts [73–75], engineers to improve operational conditions [76] or designing new reactorconfigurations [77, 78]. In view of the large scale of the process even small improve-ments (1 %) translate into significant revenue [72, 79]. CFD simulation and profilemeasurement of a pilot-scale profile reactor designed and developed for studying n-butane oxidation under industrial-relevant conditions have been carried out in thiswork. Since no lumped transport parameters are used in the CFD model, expensiveexperimentation input can be minimized by careful choice of representative experi-ments. Details of CFD modeling and measurements of a catalytic n-butane oxidationreactor are presented in Chapter 8.
Ideally and rigorously speaking, intra-particle diffusion limitations should be in-corporated in the aforementioned CFD simulations for n-butane oxidation by solvingmass balance (diffusion and reaction) inside each catalyst pellet [80]. However, thecomputational costs required to simulate a pilot-scale reactor including this aspect istoo high to be realizable at the moment [81]. Hence, the trade-off has been madeto simplify the reactor model while the main focus is paid to the effect of catalystpore structure on n-butane oxidation to maleic anhydride in a fixed-bed reactor. Suchnumerical study is presented in Chapter 9.
This work is motivated by the scientific intuition for fundamental understandingof the fixed-bed reactor and, at the same time, is application driven. The aim ofthis work is to develop reliable, accurate and affordable models to perform simulationswhich facilitate in-depth understanding of the interactions between flow, heat and masstransport as well as chemistry. Furthermore, those simulations should be developedinto a better tool to help interpret experimental data, to assist reactor design and, topredict safe operation conditions and, most importantly, to put forward model-basedor knowledge-based optimization of the underlying processes in fixed-bed reactors.

4 1 Introduction
This work does not only emphasize on model development, but also highlights theimportance of reliable experimental validation. Conventional reactors with a few sidesampling ports cannot achieve similar level of data density as the simulation deliversand, as a result, no critical comparison can be made. On the other hand, one cannotavoid the iterative process in the model improvement by comparing experimental datafor fine tuning some model parameters. Consequently, the quantity and quality ofthe input experimental data can directly influence the model accuracy [57]. Thespatially resolved profile reactor offers a solution to this problem as it can realizehigh resolution sampling of gas phase composition, gas temperature as well as solidtemperature by means of the center sampling capillary [82–85]. Hence, these profilingtechniques have been applied and presented thoroughly in the thesis together with themodeling efforts. High resolution spatial measurements of species and temperatureprofiles inside the reactor combined with particle resolved CFD modeling of chemistryand flow is a promising approach to understand the physical and chemical processesinside a catalytic fixed-bed reactor and provide a methodology for knowledge basedoptimization of important industrial processes.

2Summary of Results
and Future Perspective
As soon as a new approach like spatially resolved CFD modeling of catalytic fixed-bedreactors, rapidly and enthusiastically progress, the same level of doubts and criticismarise [1, 57]. Is it reliable? What are the benefits and, naturally, what are the limita-tions? This work tries to answer these questions and to put forward this approach to bea preferred design tool in industry. Three fixed-bed packing configurations: a singlecatalytic gauze, a foam monolith coated with catalytic material as well as randompacking of catalyst pellets have been modeled in detail in this work. To demonstratethe validity and benefits of the applied numerical approach, high resolution profilemeasurements have been carried out. Critical judgement of the model performancehas been made by comparing the simulated species and temperature profiles to themeasured ones.
Catalytically assisted methane combustion over a single platinum gauze in a fixed-bed reactor is studied in this work. Three dimensional numerical reactor simulationsincluding flow, mass transport, heat transport and microkinetic models for both sur-face and gas phase chemistry were carried out. Due to symmetry, only 1/4 of the gauzesurface was considered in the calculation domain. Simulated species profiles show goodagreement with the measurements previously carried out by Dr. Heiner Schwarz [86]in which work the steep spatial gradients in the vicinity of the gauze are resolved atsubmillimeter scale. Furthermore, this reactor combines a capillary sampling tech-nique with a novel fiber-optic Laser-Induced Fluorescence (LIF) Spectroscopy methodfor detection and quantification of gas phase OH· radicals serving as indicator speciesfor gas phase reactions. Full methane conversion was observed experimentally. Thecontribution of gas phase reactions to the methane conversion was analyzed by com-paring simulation results with and without taking gas phase reactions into calculationto the measured ones. Results show that surface reactions alone account for abouttwo-thirds of the experimental CH4 conversion. This study provides insight into theinteraction of chemistry and transport processes upstream, at and downstream of thecatalytic gauze. The gradients upstream of the gauze are caused by diffusion while thegradients downstream of the gauze are a combined effect of diffusion and gas phasechemistry. Furthermore, this study highlights the interaction of surface and gas phasereactions by exchange of heat and radicals released from the catalyst surface.
Pore-scale resolved three dimensional CFD simulations based on reconstructedstructure from µ-CT scans of an open-cell foam monolith catalyst have been carriedout in this work. CO oxidation on a Pt coated α-Al2O3 foam monolith is chosen dueto the well-know reaction kinetics [87]. CFD model takes into consideration laminarflow, chemistry by means of microkinetics, conjugated heat transfer as well as surfaceradiation. Meanwhile, high resolution profiles of gas species concentration and solidtemperature in the center line of the reactor were measured by means of capillarysampling techniques together with a light-collecting optical pyrometer fibre (master

6 2 Summary of Results and Future Perspective
thesis of Julian Gerdts [88]). To compute the surface reaction rates, a parameter ofAcat/Ageo has to be introduced to account for the Pt coating. This parameter werescreened in the simulations and best fit to the measurement is found with a value of0.03. Furthermore, the measured solid temperature profile can only be approximatedby the simulation with enforced heat loss through the reactor wall together with radi-ation heat loss on the foam surfaces. Based on those results, the adiabatic conditionswere not achieved in the measurement. This study demonstrates that the µ-CT basedCFD modeling is a promising modeling approach to reveal how complex the inter-play between flow, heat generation and heat transport is and how subtle differencesin geometry and flow velocity lead to pronounced non-uniformity in reaction rate andcatalyst temperature. Also, this work illustrates a critical comparison between CFDsimulation results and sub-millimeter resolved species and temperature profiles canhelp to identify model deficiencies and experimental artifacts.
The biggest part of this work focuses on the application and validation of theparticle resolved CFD modeling of fixed-bed reactors at small D/d ratios packed withcomputer generated random packing by DEM simulations. DEM generated randompackings have been validated by comparing simulated radial porosity profiles to ex-perimental data and correlations from literature for spherical packings and in-housemeasurements (master thesis of Nils Ellenfeld [89]) for Raschig ring packings. Highporosity values are found in the vicinity of the container wall for both packings due tothe wall ordering effects and the stochastic nature of random packings. This methodis found to be physically sound and reliable for reproducing the experimental packingswithin stochastic bounds.
After validating the DEM generated random packings, heat transfer studies in afixed-bed reactor with low D/d ratio (4 ≤ D/d ≤ 7) for both spherical and Ras-chig ring packings in moderate flow conditions and high temperature ranges wereconducted. An improved experimental technique for providing continuous high res-olution radial temperature profiles has been proposed (master thesis of Bahne Sosna[90]) compared to conventional measurement methods (few discrete data points) inthe literature. DEM-CFD approach has been validated to predict accurately radialtemperature profiles for both packing types at different packing heights and differ-ent flow rates. The DEM-CFD approach has been found to work particularly well incases when the packing can be accurately modeled while systematic errors result ifthe packing is not accurately simulated. Both simulation and experiment reveal highlocal inhomogeneity of fixed-bed reactors with small D/d ratio especially for ring typepackings which are often used industrially. These packing induced local phenomenacannot be captured by rotationally symmetric pseudo-homogeneous models employingeffective transport parameters and as a result, three-dimensional CFD simulations aremore accurate.
Simulations and measurements of concentration and temperature profiles for n-butane oxidation to maleic anhydride were carried out under industrially relevanttemperature-, flow- and pressure conditions in a pilot-scale fixed-bed reactor equippedwith five heating zones. The results demonstrate that particle resolved CFD modelingof chemistry and flow is a promising approach for knowledge-based optimization of im-portant catalytic process in industry. Simulations and measurements of concentrationand temperature profiles for n-butane oxidation to maleic anhydride under industriallyrelevant temperature-, flow- and pressure conditions in a pilot-scale fixed-bed reactor,equipped with five heating zones, were carried out. Catalytic chemistry was includedby a kinetic model of intrinsic reaction rates determined in separate measurementson crushed and sieved catalyst. Transport resistances and packing deviations werelumped in reaction rate multipliers determined by fitting the model to profiles meas-

7
ured at a uniform reactor wall temperature of 370 C.
Simulated temperature-, flow velocity- and butane concentration fields reveal stronginhomogeneities inside the catalyst bed. A hot-spot develops at 370 C wall tem-perature. Inside this hot-spot temperature differences of 40 K and more exist onone and the same pellet with negative impact on maleic anhydride selectivity andcatalyst lifetime. An optimized wall temperature profile was derived by combin-ing knowledge from the experimental profiles at uniform wall temperature and theparticle resolved CFD results. A gradual increasing temperature with the heatingzones set to Twall,1 = 360 C, Twall,2 = 365 C, Twall,3 = 370 C, Twall,4 = 375 C andTwall,5 = 380 C was predicted by the model to eliminate the hot-spot and increaseintegral maleic anhydride selectivity at constant n-butane conversion. This predictionwas confirmed by experiment. At 80 % n-butane conversion the maleic anhydride se-lectivity could be improved from 72 % to almost 75 %. Facing the scale of the process,this improvement translates into significant n-butane savings, reduced COx emissionsand increased revenue.
Another attempt to improve n-butane oxidation to maleic anhydride is to take alook at the effect of catalyst pore structure on the reactor performance by numericalsimulations. Coupling diffusion and reaction inside each catalyst pellet to the CFDsimulation of technical scale reactor is computationally expensive. Hence, a fixed-bed reactor was simulated with a two-dimensional heterogeneous model taking intoconsideration the radial bed porosity variation. Since vanadyl pyrophosphate catalystsapplied for this process in industrial fixed-bed reactors are bulk catalysts made bypressing the active powder into a pellet [91], the micro- and macro pore model ofWakao and Smith [92] was applied to model the diffusion-reaction inside the catalystpellet. Simulation results have demonstrated that the reactor performance is sensitiveto the chosen pore structure parameters especially the macro-pore porosity and meanmicro-pore diameter. A bi-modal catalyst pellet with bigger macro-pores and smallermicro-pores is favored to achieve higher yields of maleic anhydride. This simulationhighlights the potential of improving this process by pore structure optimization.
At the time of this writing, several future aspects can be recommended by theauthor taking n-butane oxidation as an example. Firstly, one can further exploreand screen the space for reactor operation parameters based on the provided CFDmodels. A potential project is to study systematically the orientation and shapeof the catalyst pellets to the reactor performance. One may improve the productyield by rational structuring of the packing. Another idea is to investigate stage-wisedosing of reactants. This can be easily probed in simulations and maybe realizableexperimentally with the side sampling ports in the profile reactor used in this work.In the long run, it would be a good idea to ‘map’ the local flow, temperature andconcentration field around each catalyst pellet to the chemistry nature of the catalystto further investigate the local selectivity. For this purpose, coupling spatially-resolvedcatalyst characterization (e.g. Raman) to the profile reactor would be desired.
With continuous efforts in model improvement, numerical algorithm developmenttogether with the advance in computational resources [32, 93, 94], it can be anticipatedthat this modeling approach will become routine for both academy and industry in thenear future. Furthermore, by combining this method with molecular modeling and abinitio calculations, the arrival at the frontier of a priori design of reactors [7] will nolonger be a fantasy.

“We must remember that the most elegant and high-powered math-ematical analysis based on a model which does not match reality isworthless for the engineer who must make design predictions.”
Octave Levenspiel [4]
3Theoretical
Background and Methodology
Nowadays, reactor simulation plays a key role in scale-up and process optimizationsas it offers a more cost-effective approach compared to experimentation [57]. Thischapter presents the fundamentals and state-of-the-art simulation methods of the ap-plied models within the scope of this thesis.
Modeling a fixed-bed reactor is indeed a multi-scale task: from the molecular scaleof the intrinsic kinetics to particle scale of diffusion-reaction inside the pore structuresand finally to the reactor scale with fluid flow, heat and mass transport [7, 9, 95].Depending on the purpose of the simulation and the system of interest, engineers haveto make wise decision on which level of details the model should cover.
From the reactor model scale standpoint, the simplest and still widely used oreven favoured model is the plug-flow model in which an radially uniform and constantvelocity field is assumed. For modeling wall-cooled or wall-heated reactors, an artificialwall heat transfer coefficient has been introduced into this conventional approach todescribe the experimental observed temperature ‘jump’ in the near-wall region [96].The driving force for continuous efforts to extend the basic plug-flow model with moredetailed hydrodynamic effects is the accuracy needed for temperature field predictions,especially in the radial directions [97]. This model is generally agreed to be insufficientfor reactors with small D/d ratios especially for exothermic and endothermic reactions.However, a huge library of semi-empirical correlations and practical know-how madethis type of model preferred design tool in industry. Often, up to 20 % error estimationis added to the model predictions [96, 98].
More advanced models are the ‘pseudo-’ family models which take the radial bedporosity variations into consideration and employ improved correlations for heat andmass transfer [99, 100]. The accuracy of the predictions and model performance of thismodel type rely on the chosen effective transport parameters for describing dispersion[101, 102] and heat transfer which are usually presented in form of empirical correla-tions [24, 103–106]. Those empirical correlations are often derived for certain packingshapes, D/d ratios and operational conditions and thus are limited in applicability[107]. Especially for fixed-beds with small D/d ratio (below 10), the non-uniformitiesof the packing structure and wall effect challenge the circumferential symmetrical av-eraged properties used in ‘pseudo-homogeneous’ and ‘heterogeneous’ models [54, 108]which are historically developed for beds with high D/d ratios. Those local effects callfor the need of continuous model refinement [109, 110] or more advanced modelingapproach. To further develop this modeling approach, more systematic experimentswith respect to a diversity of packings and wide range of operational conditions arenecessary [111]. Even more efforts should be paid to analyse the transport modelsunder reaction conditions [24, 112].
The alternative way to overcome the uncertainty in the effective parameters is toresolve the bed structure in detail and compute the three-dimensional interstitial ve-

3.1 Heterogeneous model 9
locity field inside a fixed-bed reactor by solving the Navier-Stokes equations. Hence,particle-resolved three-dimensional computational fluid dynamics (CFD) simulationshave been extensively developed for the past twenty years [28]. Many efforts havebeen made to put forward the application of this approach as discussed in Chapter1 [50, 113]. The computer generated random packing of spherical and non-sphericalparticles is realized either by Discrete Element Methods (DEM) [26, 49, 51] or Monte-Carlo methods [114]. Meshing strategies are intensively researched, especially the con-tact point treatment for preventing cell skewness and enhancing convergence. Dixonet al. [63] have systematically evaluated the different contact point treatments: globalshrink, overlapping, local flattening (cap) and bridging with respect to the void frac-tion, pressure drop and heat transfer. Rebughini et al. [66] further investigated thebridging approach and proposed a meshing protocol for properly describing the sur-face reactivity in fixed-bed reactors packed randomly with spheres. Simulations areextended from detailed flow [26] and heat transport [29, 115, 116] to include surfacereactions described by microkinetics [117–119] as well as diffusion and reactions insidethe catalyst particles [39, 120, 121]. Many works have proven the spatially resolvedCFD simulation a great tool for chemical engineers to better understand the local phe-nomena, design and develop fixed-bed reactors especially for the ones with small D/dratios [30]. Figure 3.1 illustrates the hierarchy of the aforementioned models in termsof the model complexity with respect to the computational efforts required. Clearly,the more sophisticated the model is, the more computational effort it needs [123].Based on the experience of the author with commercial codes, a plug-flow model withmacrokinetics converges within a few minutes while the two-dimensional heterogeneousmodel takes a couple of hours to converge. For these two types of models, a normaloffice computer would be sufficient. For the CFD approach, a computer cluster is gen-erally required. The computational time can span between days to months dependingon the number of mesh and kinetic model as well as the number of CPUs.
3.1 Heterogeneous model
The main difference between the pseudo-homogeneous and heterogeneous model isthat the heterogeneous model considers explicitly the presence of the catalyst phase.Therefore, two sets of conservation equations are applied for the interstitial fluid andthe catalyst phase, respectively [124]. Concentration and temperature profiles insidethe catalyst pellets are coupled to the bulk fluid phase via the boundary conditionsapplied on the pellet surface. Therefore, the heterogeneous model can be a useful toolfor studying the catalyst scale parameters with respect to the reactor performance. Aschematic drawing of the model is shown in Figure 3.2. The details of this model areexplained in the following sections, examples of the model performance are shown inChapter 9.
3.1.1 Particle model
To solve the reaction-diffusion equation inside the catalyst pellet, two models areavailable. The simpler one is the ‘pseudo-continuum model’ in which the catalystpellet is treated as a continuum described by global parameters: the void fraction εand the tortuosity τ . The effective diffusivity is used to describe the transport withinthe pores [2]. This model is not very realistic for studies aiming to improve the porestructures of the catalyst. For a more detailed modeling, pore structure models anddiffusion models are needed. Often used pore structure models in literature are themicro- and macro pore model of Wakao and Smith [92], the random pore model of

10 3 Theoretical Background and Methodology
Figure 3.1: Illustration of the model complexity with respect to computational ef-forts for three types of fixed-bed models. From left to right: plug-flow model, 2-Daxis-symmetric pseudo-homogeneous model with radial porosity profiles, 3-D particle-resolved CFD model [122].

3.1 Heterogeneous model 11
Figure 3.2: Schematic illustration of a two-dimensional heterogeneous model (left),micro- and macro pore model of Wakao and Smith (right) [92].
Johnson and Stewart [125], and the grain model of Szekeley and Evans [126]. Morerecently, a more detailed and realistic three-dimensional pore network model has beenproposed by Rieckmann and Keil [127]. The diffusion fluxes are usually modeled usingthe dusty gas model, Maxwell-Stefan model, Wilke or Wilke-Bosanquet models [128].One may refer to the works of Solsvik and Jakobsen [129] for a detailed summaryof different diffusion models. For catalyst pellets containing a bi-modal pore sizedistribution, the micro- and macro pore model of Wakao and Smith [92] with theWilke fomular can be a good option for practical reaction engineering calculations[130].
VPP catalyst pellets for n-butane oxidation to maleic anhydride typically have abimodal pore structure, i.e. the micro-porous structure from the chemical synthesis ofthe active powder and the macro-porous region between the powders formed by thepelleting process. Therefore, the micro- and macro pore model of Wakao and Smith[92, 131] was applied for modeling VPP catalyst pellets in this work (Chapter 9). Inthis model the pore structure of the catalyst pellets is described by four parameters:mean macro-pore diameter dM , mean micro-pore diameter dm, macro-pore porosityεM , and micro-pore porosity εm as illustrated in Figure 3.2. The specific surface area(surface per catalyst weight) Sg and pellet density ρpellet are directly related to thepore structure and can be evaluated as follows [130]:
Sg =4VMdM
+4Vmdm
(3.1)
ρpellet = ρsolid(1− εtotal), εtotal = εM + εm (3.2)
Combining Eq. 3.1 and 3.2, one obtains:
Sg =4
ρpellet(εMdM
+εmdm
) (3.3)
Both Knudsen diffusion and molecular diffusion are considered in this model [92, 131]

12 3 Theoretical Background and Methodology
and the effective diffusivity of each species is expressed as:
Deff = DM · ε2M +ε2m · (1 + 3εM )
1− εMDm (3.4)
1
DM=
1
DAB+
1
DK,M(3.5)
1
Dm=
1
DAB+
1
DK,m(3.6)
where M and m stands for the macro-pore and micro-pore, respectively. The Knudsendiffusivity is calculated by:
DK,i =dM,m
3
√8RT
πMi(3.7)
The molecular diffusivity is simplified to the binary diffusivity of each component innitrogen since air is used as an oxidizer. It is calculated by the Fuller equation asfollows [99]:
DAB
cm2/s=
0.00143
(T
K
)1.75[(
M1
g/mol
)−1+
(M2
g/mol
)−1]0.5p
bar
√2[(∑δv1)
1/3 + (∑δv2)
1/3]2 (3.8)
where δv is the so-called diffusion volume listed in Table 3.1.
Table 3.1: Diffusion volumes for the Fuller equation used in this work [99].
Molecule (∑δv)
C4H10 86.7
C4H2O3 86.55
O2 16.3
CO2 26.7
CO 18.0
H2O 13.1
N2 18.5
C3H4O2 69.16
C2H4O2 53.26
Air 19.7
For the pore structure study presented in Chapter 9, the VPP catalyst pellet isassumed to be a full cylinder and the corresponding conservation equations are:Mass balance:
4
d2Deff,i
[∂2ci∂ζ2
+1
ζ
∂ci∂ζ
]= ρpelletSg
3∑j=1
νijrj,s, (3.9)
Heat balance:
4
d2λpellet
[∂2T
∂ζ2+
1
ζ
∂T
∂ζ
]= ρpelletSg
3∑j=1
−∆Hjrj,s, (3.10)

3.1 Heterogeneous model 13
where Deff,i is the effective diffusivity of each species, λpellet is the effective thermalconductivity of the pellet and ζ is the dimensionless radial cylindrical coordinate ofthe pellet. In this study, the conservation equations were only solved along the radialcoordinate of the pellet, i.e. concentration and temperature gradient along the heightof the pellet were neglected. This is because in the heterogeneous model, the detailedparticle geometry is not resolved in the calculation domain and thus only one effectivecoordinate can be taken for solving pellet equations. Furthermore, the concentrationand temperature gradient between the outer surface of the pellet and the bulk gas wereneglected. Solsvik and Jakobsen have found in their studies [129, 132] that the viscousflow and pressure drop inside the pellet are very small and can be neglected. Hence,no convective term and no momentum balance are applied in the pellet equations.Eq. 3.9 and Eq. 3.10 can be solved using the following boundary conditions:
ζ = 0 :∂ci∂ζ
= 0,∂T
∂ζ= 0 (3.11)
ζ = 1 : ci = ci,bulk, T = Tbulk (3.12)
3.1.2 Reactor model
A two dimensional axis-symmetric reactor model including mass and heat transfer, aswell as momentum balance taking into consideration of radial porosity profile of the bedpacking, is perhaps the most sophisticated model in the ‘pseudo-’ model family [2]. Themost advanced improvement in this approach is to model the flow with the extendedBrinkman equation [133] including radial porosity profiles and effective viscosity [134].Mass and heat transport parameters are then correlated with the radially varyingfunctions of axial flow component and new correlations were developed especially forheat transfer (effective thermal conductivities in axial and radial direction, wall heattransfer coefficient) [135]. Neglecting the interfacial gradients (film diffusion), thegoverning equations solved for the reactor at steady state are [136]:Mass balance:
∇ · (−Di∇ci + uci) = −(1− εbed)avDeff,i2
d
∂ci∂ζ
(ζ = 1) (3.13)
whereas the dispersion coefficient matrix is expressed as:
Di =
[Dr,i 0
0 Dax,i
](3.14)
Heat balance:
ρfCpfu · ∇T −∇ · (λeff∇T ) = −(1− εbed)avλpellet2
d
∂T
∂ζ(ζ = 1) (3.15)
whereas the effective thermal conductivity matrix is expressed as:
λeff =
[λr 0
0 λax
](3.16)
Momentum balance:
µeffKE
u = ∇ ·[−pI +
µeffεbed
(∇u + (∇u)T )
](3.17)

14 3 Theoretical Background and Methodology
Continuity equation:∇ · (ρfu) = 0 (3.18)
Eq. 3.17 is the extended-Brinkman equation which is recommended for the use ofcalculating velocity fields in fixed-bed reactors instead of using the conventional plug-flow assumption [137]. The reactor wall effects on the flow in fixed-bed reactors,especially with small reactor diameter to particle diameter ratio (D/d), is included inthe Brinkman equation by introducing the radial function of the bed porosity εbed(r).The radial porosity function used in this work is as follows [24]:
εbed(r) = ε0
(1 + a · exp
[−bR− r
dp
])(3.19)
a =0.65
ε0− 1; b = 6.0 (3.20)
The porosity of a cylindrical packing in an infinite bed ε0 according to Zou et al. [138]equals to 0.32. The inertia resistance in the bed is described by the Ergun hydraulicpermeability KE as [136]:
1
KE=
1
KD+CEρf |u|K
1/2D µ
; CE =1.75√150ε2bed
(3.21)
The set of effective heat and mass transport parameters were calculated following thework of Winterberg and Tsotsas et al. [24, 97]:
Dr,i = 1−√
1− εbed(r)DAB +K1Pemu(r = 0)
uf(R− r)DAB (3.22)
Dax,i = 1−√
1− εbed(r)DAB +udp2
(3.23)
λr = λbed +K1Pehu(r = 0)
uλff(R− r) (3.24)
λax = λbed +Pehλf
2(3.25)
f(R− r) =
(
(R− r)(K2dp)
)nif 0 < R− r < K2dp
1 if R− r > K2dp
(3.26)
K1 = 1/6.25 (3.27)
K2 = 0.40 + 0.6exp
(−Re230
)(3.28)
n = 2 (3.29)
The effective thermal conductivity of the fixed-bed without gas flow λbed is calculatedaccording to the model of Tsotsas and Schlunder [24, 139]. The conservation equationswere solved with the boundary conditions listed in Table 3.2.

3.2 Particle-resolved CFD approach 15
Table 3.2: Boundary conditions applied to the two-dimensional heterogeneous reactormodel
z = 0,∀r : ci = ci,0 T = T0 |~u| = u0
z = lR,∀r :∂ci∂z
= 0∂T
∂z= 0 p = 1 [atm]
r = 0,∀z :∂ci∂r
= 0∂T
∂r= 0
∂u
∂r= 0
r = R,∀z :∂ci∂r
= 0 T = Tw u = 0
Figure 3.3: Illustration of the general workflow of the particle-resolved CFD ap-proach: a) generating packing from DEM simulations; b) creating bed geometry basedon the input from DEM simulations when all the particles are settled; c) meshing thecalculation domains.

16 3 Theoretical Background and Methodology
Figure 3.4: Illustration of the normal force component ~Fn and the tangential forcecomponent ~Ft acting on DEM particles upon contacting [140].
3.2 Particle-resolved CFD approach
The general work flow of the particle-resolved CFD approach used in this work can besummarized into the following steps. Firstly, a random packing is generated using thediscrete element method and the position of each particle center are extracted. Fornon-spherical particles, the particle orientation information is also extracted. Secondly,a calculation domain is created based on the particle position data from the first step.Thirdly, the calculation domains including the particles and the voids in between arevolume meshed. Lastly, physical models are set and boundary conditions as well asthe initial conditions are specified. Figure 3.3 illustrates the general work flow for atypical CFD simulation taking the steatite rings as packing example. All steps canbe realized in the commercial package STAR-CCM+ [140]. This methodology is firstproposed by Eppinger et al. [26] and further applied and developed extensively byWehinger et al. [64, 81, 117, 118, 141].
3.2.1 Packing generation: Discrete Element Method
Discrete Element Method (DEM) is an explicit numerical method to simulate themotion behavior of many-body solid system by including interparticle contact forcesinto the equations of motion [47, 140]. Originally proposed by Cundall and Stack [48]for geophysics, DEM has been widely applied to simulate fixed-bed packing as well asfluidized bed [142]. STAR-CCM+ uses a soft contact model which means the rigidparticles are allowed to overlap upon contacts [140]. These contact forces betweenparticles are simulated with a variant of the spring-dashpot model in which the springaccounts for the elastic part of repulsive force while the dashpot accounts for energydissipation during collision [140]. One of the contact force model used in this workis the Hertz-Mindlin model [143, 144]. Taking spherical particles as an example asshown in Figure 3.4, the contact forces between them are:
~Fcontact = ~Fn + ~Ft (3.30)
where ~Fn is the normal force component and ~Ft is the tangential force component.The normal force is calculated as [140]
~Fn = −Kndn −Nnvn (3.31)
where Kn is the normal spring stiffness, dn is the overlap in the normal direction, Nn
is normal damping, vn is the normal velocity component of the relative sphere surface

3.2 Particle-resolved CFD approach 17
velocity at the contact point. Kn and Nn are calculated as follows:
Kn =4
3Eeq√dnReq (3.32)
Nn =√
(5KnMeq)Nn,damp (3.33)
where the equivalent radius Req is a function of the radii of the spheres A and B, RAand RB:
Req =1
1
RA+
1
RB
(3.34)
The equivalent particle mass is defined as a function of the mass of the spheres A andB, MA and MB:
Meq =1
1
MA+
1
MB
(3.35)
The equivalent Young’s modulus is a function of the Young’s modulus of the spheresA and B, EA and EB:
Eeq =1
1− ν2AEA
+1− ν2BEB
(3.36)
where νA and νB are the Poisson’s ratios of sphere A and B. The tangential force isdefined as [140]:
~Ft =
−Ktdt −Ntvt if |Ktdt| < |Kndn|Cfs|Kndn|Cfsdt|dt|
otherwise(3.37)
where Cfs is a static friction coefficient, dt is overlap in the tangential directionsat the contact point, vt is the tangential velocity component of the relative spheresurface velocity at the contact point, Kt is the tangential spring stiffness, and Nt isthe tangential damping.
Kt = 8Geq√dnReq (3.38)
Nt =√
(5KtMeq)Nt,damp (3.39)
The equivalent shear modulus is calculated as:
Geq =1
2 (2− νA) (1 + νA)
EA+
2 (2− νB) (1 + νB)
EB
(3.40)
The normal and tangential damping coefficients are calculated as:
Nn,damp =−ln (Cn,rest)√π2 + ln (Cn,rest)
2(3.41)
Nt,damp =−ln (Ct,rest)√π2 + ln (Ct,rest)
2(3.42)
where Cn,rest and Ct,rest are the normal and tangential coefficients of restitution [140].

18 3 Theoretical Background and Methodology
For particle-wall collisions, the wall radius and mass are assumed to be infinite andthus the equivalent radius and mass are reduced to Req = Rparticle and Meq = Mparticle,respectively [140].
For cylinder or ring type packings, the linear spring contact model is used which isthe only available model for cylindrical particles in STAR-CCM+ [140]. In this modelthe normal and tangential spring constants are defined as:
Kn =4
3
√λmaxEeqReq (3.43)
Kt = 8√λmaxGeqReq (3.44)
λmax =δmaxReq
(3.45)
where δmax is the maximum overlap. The normal and tangential damping coefficientsare calculated as:
Nn = 2Nn,damp
√KNMeq (3.46)
Nt = 2Nt,damp
√KtMeq (3.47)
3.2.2 Meshing
Mesh to a CFD simulation should be appreciated as the skeleton to a human body.Without a valid mesh, a numerical simulation cannot run or converge. Not only that,mesh determines the accuracy and reliability of a CFD simulation. To the best ofour knowledge, choices of the type and size of a mesh are often made as trade-offbetween accuracy and computational efforts. Hence, a mesh convergence study isalways required in a CFD simulation to find the maximum possible mesh size basedon which the simulation results do not vary any more.
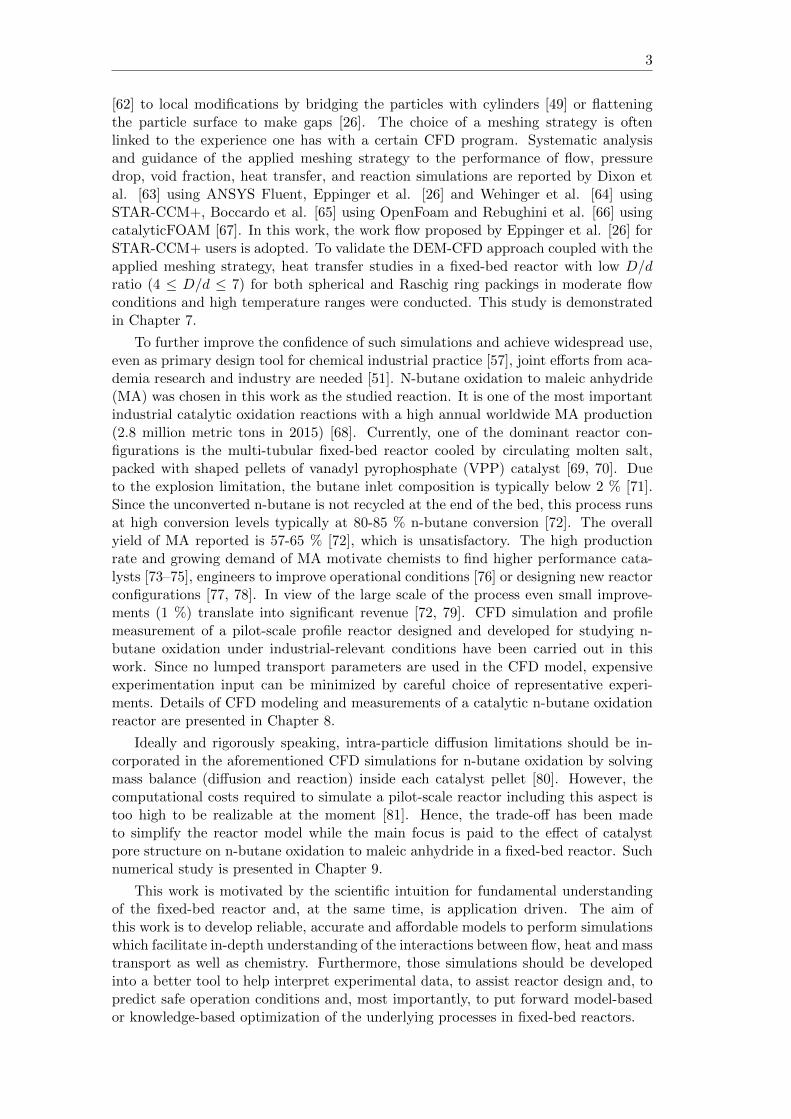
In this work, the meshing strategy developed by Eppinger et al. [26] is followed.This meshing strategy is designed specifically for modeling particle-resolved fixed-bedreactor using STAR-CCM+ [140]. Figure 3.5 shows the details of the applied mesh.A dense polyhedral volume mesh is used for the main calculation domain includingboth fluid and solid regions. This type of mesh is recommended for solving conjugateheat transfer problems over tetrahedral mesh due to its flexibility to have a highernumber of neighboring cells and a better gradient approximation [140]. As describedin the work of Eppinger et al. [26], a base size of one particle diameter is suggestedfor spherical packings. All the mesh properties are set as percentage of this base size.This strategy simplifies the procedure for mesh independence studies so that one hasonly to vary the base size. Two prism mesh layers are set for resolving boundary flows.The prism layer mesh has the benefit of capturing the flow and temperature field inthe near-wall region with a lesser amount of cells [26]. For simulating the heat transferbetween fluid and solid regions, conformal mesh in the fluid-solid interface is required.
‘Local flattening’ methods [26, 44] are used in order to deal with the contactpoint problem for both spheres and rings. This method locally modifies the surfaceelement when the defined minimal distance between two surfaces is reached. In thisway, meshes with very high skewness are avoided which is beneficial for simulationconvergence. This method creates artificially gaps in-between the contacting particles.Since the gaps are filled with fluid cells, certain errors for example in the bed voidfraction and pressure drops in the models are introduced. However, this effect is keptminimal with a fine structured mesh [26]. Extrusions in both the inlet and outletboundaries are taken to avoid the influence of the boundary conditions and to help
3.2 Particle-resolved CFD approach 19
Figure 3.5: Illustration of different mesh types applied in this work taking a sphericalpacking as example.
with the convergence. As rule of thumb, five particle layers for the inlet extrusion andmore than ten particle layers for the outlet extrusions are suggested [26] .
3.2.3 Fundamental equations
The set of governing equations for modeling a laminar reacting flow through a hetero-geneous catalytic reactor include the Navier-Stokes equations (conservation of massand momentum) and conservation equations of participating species and energy. Sinceall the simulations presented in this work were carried out in steady state, the time-independent version of all the governing equations are introduced in this section. Theequations are formulated in Cartesian coordinates and Einstein convention is adopted[25].Conservation of mass:
∂ (ρui)
∂xi= 0 (3.48)
where ρ is the density, ui is the Cartesian components i of the velocity vector and xiis the Cartesian coordinates i (i = 1, 2, 3). This equation is often called the continuityequation [145].Conservation of momentum:
∂
∂xj(ρuiuj) +
∂p
∂xi+∂τij∂xj
= 0 (3.49)
τij is the stress tensor and is calculated as:
τij = −µ(∂ui∂xj
+∂uj∂xi
)+
(2
3µ− κ
)δij∂uk∂xk
(3.50)
where µ is the dynamic viscosity of the mixture, κ is the bulk viscosity which is set tozero at low speed of the flow, and δij is the Kronecker delta which is one when i = j,else zero [146].Conservation of species i:
∂ (ρujYi)
∂xj+∂ji,j∂xj
−Rhomi = 0, i = 1, ..., Ng (3.51)
where Yi is the mass fraction of species i in the mixture, Ng is the number of gasphase species and Rhomi is the net rate of production of species i due to homogeneous

20 3 Theoretical Background and Methodology
chemical reactions [147] and are calculated as [148]:
Rhomi = Mi
Kg∑k=1
νikAkTβkexp
(−Ea,kRT
) Ng∏j=1
cν′jkj (3.52)
where Kg is the number of elementary gas phase reactions, νik is the stoichiometriccoefficient of species i in reaction k (positive as product and negative as reactant), ν′jkis the stoichiometric coefficient of species j in reaction k when it is reactant, A is thepre-exponential factor, β is the temperature coefficient, Ea is the activation energyand cj is the concentration of species j [148].The diffusion mass flux ~ji is calculated as:
~ji = −ρDi,mYiXi∇Xi (3.53)
In Equation 3.53, Xi is the mole fraction of species i, Di,m is the diffusion coefficientof species i in the mixture. Di,m can be calculated as mass average of the binarydiffusion coefficient as
Di,m =1− Yi∑Ng
j 6=iXj
Di,j
(3.54)
Binary diffusion coefficient Di,j can be calculated from the Chapman-Enskog equationas [140]:
Di,j =2.66 · 10−7 · T 3/2
p ·M1/2i,j · σ2i,j · Ω(T ∗)
(3.55)
where Mi,j = 2MiMj/(Mi + Mj). σi,j can be calculated by applying the Lorentz-Berthelot mixing rule to the Lennard-Jones characteristic length of each componentas:
σi,j =σi + σj
2(3.56)
the collision integral Ω(T ∗) is a function of reduced temperature T ∗ which is definedas [140]:
T ∗ =kBT
εi,j(3.57)
with kB being the Boltzmann constant. εi,j can be calculated by applying the Lorentz-Berthelot mixing rule to the Lennard-Jones energy of each component to be:
εi,j =√εi · εj (3.58)
Function parameters for Ω(T ∗) are not listed here but are well documented in literature[149].Conservation of energy:
∂ (ρujh)
∂xj− ∂
∂xj
(λ∂T
∂xj
)+
∂
∂xj
Ng∑i
hiji,j − uj∂p
∂xj−
Ng∑i
hiRhomi = 0 (3.59)
where h is the enthalpy of the mixture and is calculated as mass average of the enthalpyof each species hi via
h =
Ng∑i
Yihi (3.60)

3.2 Particle-resolved CFD approach 21
The enthalpy of each species hi is a function of the temperature and is calculated as:
hi = hi(Tref ) +
∫ T
Tref
cp,i · dT (3.61)
The specific heat capacity at constant pressure of each species cp,i is computed fromthe NASA polynomial functions with the thermodynamic data accompanied with thereaction micro kinetics. The thermal conductivity of the mixture λ is a function ofthe local composition and temperature and can be calculated via the kinetic theory[149].
It is common practice to model the heat transport in solid catalyst pellet as well,e.g. for conjugated heat transfer. The energy conservation for solid phase can beformulated as:
∂
∂xj
(λ∂T
∂xj
)= sh (3.62)
where λ is the thermal conductivity of the solid material and sh in unit of W/m3 isthe heat source due to chemical reactions or radiative heating of the solid [150].The system of governing equations is closed with the ideal gas law:
p =ρRT∑Ng
i XiMi
(3.63)
where Mi is the molar mass of species i.
3.2.4 Modeling reaction
On the catalytic surface, heterogeneous catalytic surface reactions take place, whichare coupled with the gas phase stream via a boundary flux. At steady state, theconsumed or produced species have to diffuse to and away from the catalytic surfaceas follows [146]:
~n(~ji
)= Rheti (3.64)
where ~n is the outward-pointing unit vector normal to the surface, ~ji is the diffusivemass flux. Rheti is the heterogeneous surface reaction rate which is given per unitgeometric surface area and can be computed as:
Rheti = ηAcatAgeo
Misi (3.65)
where Acat/Ageo is the ratio of catalytically active area to geometric area, si is themolar net production rate of species i in unit of mol· m−2s−1. Consequently, theproduct of Acat/Ageo and si has now the unit referred to the actual catalytically activesurface area. η is defined as the effectiveness factor which includes the effect of internalmass transfer resistance if the porous structure of the catalyst pellets are considered[147].
In general, two categories of kinetic models are available to describe rate of reac-tions Rheti . One is the macrokinetics which simplifies the complex reaction networksinto few representing (apparent) reaction steps with semi-empirical reaction rate ex-pressions [151]. The parameters, e.g. rate constant and (apparent) activation energyare typically obtained from a set of kinetic measurement experiments in a differentialreactor [152]. This type of kinetic model is easy to use and shows decent perform-ance. However, one has to be careful not to extrapolate the operational conditions

22 3 Theoretical Background and Methodology
(p, T and so on) beyond the kinetic measuring boundary [153]. When applying thesekinetic models which are usually derived with respect to the total mass or volumeof catalyst, one shall convert the unit into mol· m−2s−1 using the catalyst density,specific surface area, and volumetric unit. In Chapter 8, coupling of macrokinetics ofn-butane oxidation to CFD model will be discussed in detail with examples for kineticexpressions.
The other type of kinetic model is the microkinetics [154] which is a comprehensiveand mechanistic description of sequences of elementary steps occurring on a catalyst[155]. It includes adsorption and desorption of the participating species as well asreaction intermediates and surface reactions on the active sites on the catalyst surface[156, 157]. The rate parameters are obtained from first-principles calculations and fromspectroscopic experiments. This type of models can provide detailed insights into thereaction mechanism and (in theory) could be extrapolated to a wide range of conditions[158]. The availability of such a microkinetic model is somewhat limited to modelcatalysts which are typically single crystals [159]. The state-of-the-art concept tomodel surface reactions using micro-kinetics in CFD is the mean field approximation.This concept assumes randomly and uniform distributed adsorbates on the catalystsurface which are described by the surface temperature and surface coverage of eachsurface species θi [150]. Under this condition, si in Eq. 3.65 is calculated as:
si =
Ks∑k=1
νikkfk
Ng+Ns∏j=1
cν′jkj (3.66)
where Ks is the number of elementary surface reactions including adsorption anddesorption, ci is the species concentration which is in unit of mol/m2 for surface speciesand in unit of mol/m3 for the gas phase species, Ns is the total number of adsorbedspecies, kfk is the forward reaction coefficient of reaction k which is computed as:
kfk = AkTβkexp
(−EakRT
) Ns∏i=1
θµiki exp
(εikθiRT
)(3.67)
with the surface coverage θi defined as:
θi = ciσiΓ−1 (3.68)
Here, σi is the coordinate number which describes the number of surface sites coveredby species i and Γ is the surface site density in unit of mol/m2. At steady state, thefollowing condition is fulfilled for all surface species [150]:
∂θi∂t
=siσiΓ
= 0 (3.69)
The two extra coverage parameters, µik and εik, in Eq. 3.67 describe the variation ofthe binding states of adsorption as a function of the surface converges [146].
For adsorption steps, the sticking coefficient is often given instead of the rateconstant in the microkinetics from literature. If the rate constant of adsorption stepsare required for the simulation program, one can convert them from sticking coefficientsas follows:
Ak =
(Si
1− Si/2
)1
Γτ
√RT
2πMi(3.70)
where Si is the initial sticking coefficient, τ is the sum of all stoichiometric coefficientsof the surface reactants.

3.2 Particle-resolved CFD approach 23
3.2.5 Turbulence model
Turbulent flow is characterized as spatial and temporal highly unsteady (chaotic),fluctuating, diffusive, and dissipative in nature [145]. Rotational flow structures, socalled turbulence eddies which spread a wide range of length scales, are present in afluid in a turbulent state [160]. Interactions between eddies at different length scalespromote effective contact between fluid particles and enhance the momentum, heat andmass transfer rates [12]. Those effects are often desired in industrial fixed-bed reactorsdespite the compromise of high pressure drop. Turbulence is indeed a science in itsown right [161] and the discussion here is restricted to the key aspects in engineeringmodeling approach.
Flow regimes inside a fixed-bed reactor can be categorized according to the particlerelated Reynolds number which is defined as:
Rep =uin · ρin · dp
η(3.71)
When Rep is higher than 300, the flow is treated as fully turbulent [25, 33, 162].The most accurate way to simulate turbulent flow is the so-called Direct NumericalSimulation (DNS) which solves the Navier-Stokes equations without averaging andapproximation of the variables describing the system [145]. Thus, a history record ofall the flow motions down to the smallest scale is calculated [12]. So far, this methodis too expensive to achieve wide application for flow inside complex geometries and,as a result, is limited as a research tool for fundamental flow studies [145]. A morepopular approach in engineering to model turbulence is the Reynolds-averaged Navier-Stokes (RANS) turbulence model. Since this approach does not resolve small-scalephenomena, it requires less computational efforts. In RANS equations, variables likevelocity component, pressure, energy, and species concentration are decomposed intotheir mean values φ(xi) and their fluctuating components φ′(xi, t) [140, 145]:
φ(xi, t) = φ(xi) + φ′(xi, t) (3.72)
The continuity and momentum equations can be then written with respect to themean terms [145]:
∂ (ρui)
∂xi= 0 (3.73)
∂
∂xj
(ρuiuj + ρu′iu
′j
)+∂p
∂xi− ∂τij∂xj
= 0 (3.74)
An additional term in form of ρu′iu′j appears compared to the original form in Eq. 3.49.
This term is called the Reynolds stress which is a tensor quantity [145]. In order tosolve the set of equations, a turbulence model to approximate the Reynolds stresstensor in terms of the mean flow quantities is required [140]. One way to do so is touse the eddy viscosity hypothesis which is based on an analogy between molecular andturbulent motions [12]. It introduces a turbulent eddy viscosity µt and describes theReynold stresses as [145]:
−ρu′iu′j = µt
(∂ui∂xj
+∂uj∂xi
)− 2
3ρδijk (3.75)
where k is the turbulent kinetic energy:
k =1
2u′iu′j (3.76)

24 3 Theoretical Background and Methodology
The turbulent viscosity can be related to the characteristic velocity ut and lengthscales of turbulence lt. Thus, various turbulence models, especially two-equation mod-els, are developed to estimate these two aforementioned parameters [12, 163–165]. Themost popular one is the ‘k − ε’ model. In this model turbulent viscosity is related tothe turbulent kinetic energy k and turbulent energy dissipation rate ε:
µt =Cµρk
2
ε(3.77)
where Cµ is an empirical coefficient [12]. Two equations are formulated for k and ε[12]:
∂ (ρuik)
∂xi=
∂
∂xi
(µtσk
∂k
∂xi
)+G− ρε (3.78)
∂ (ρuiε)
∂xi=
∂
∂xi
(µtσε
∂ε
∂xi
)+ε
k(C1G− C2ρε) (3.79)
G =1
2µt
[∇u+ (∇u)T
]2(3.80)
where σk is a turbulence Prandtl number and its value is approximately unity [145].The five empirical parameters Cµ, C1, C2, σk, σε in Equations 3.77, 3.78 and 3.80 areobtained from experiments of simple flows and the values are:
Cµ = 0.09, C1 = 1.44, C2 = 1.92, σk = 1.0, σε = 1.3 (3.81)
The above mentioned transport equations together with the parameters in Eq. 3.81Complete the so-called ‘standard k−ε’ model [166]. It is known that this model is validonly for fully turbulence flows and it over-predicts turbulence generation in regionswhere the mean flow is highly accelerated [12]. Several attempts have been proposedto modify this model for specific applications, for example, by introducing dampingfunctions to some of the coefficients for low-Reynolds number flow conditions [140].
The influence of walls to the turbulent flow is a non-trivial task which brings diffi-culty to simulate wall-bounded flows [12]. To supplement the wall boundary conditionsand to avoid an unaffordable dense mesh near the wall, ‘wall functions’ are introducedwhich are based on experimental findings. Between no-slip conditions at the wall andfree stream flow away from the wall, three layers can be subdivided for the near-wallregion: a viscous sub-layer, a buffer layer and a fully turbulent layer. In the viscoussub-layer, molecular viscosity dominants and the flow resembles a laminar one. In thebuffer layer, molecular viscosity and turbulence play an equally important role. In thefully turbulent layer, the turbulence dominants.
The majority of the simulations in this work are carried out at laminar flow condi-tions. In case the system is turbulent or in the transition flow regime, the ‘Realizablek − ε’ model with all wall treatment is applied. For the viscous sub-layer and thefully turbulent layer, velocity and other turbulence quantities can be calculated aslinear function and logarithmic function of the dimensionless distance from the wall,respectively. For the buffer layer, blended wall functions are used [140]. This turbu-lence model is an improvement over the ‘standard k − ε’ model due to the additionof a new transport equation for the turbulent dissipation rate ε and treating Cµ as afunction of mean flow and turbulence properties [140, 167]. The turbulence models,as discussed above, are semi-empirical in nature since they rely on adjustable parame-ters from experimental fittings. However, they are so far the most efficient models forindustrial fixed-bed reactor simulations [12].

4Catalytical
Methane Combustion
on a Platinum Gauze
Noble metal gauze catalysts are used in chem-ical industry for rapid exothermic reactions.Examples are the ammonia oxidation to nitricoxide (Ostwald process) [17, 168, 169] and theammoxidation of methane to hydrogen cyan-ide (Andrussow process) [170] both on Pt/Rhgauzes. Despite their apparent simplicity asadiabatic furnaces, gauze reactors are highlycomplex. In particular, the intricate inter-play between physical transport processes ofmass, heat, and momentum with reactions atthe gauze surface and possibly reactions inthe gas phase make both experimental andnumerical investigation a highly challenging task. A particular handicap with regardto gaining mechanistic insight is the high reaction rate of these processes. Catalyticoxidations on noble metal gauzes typically proceed at milli- to microsecond timescales,which translates into submillimeter gradients in a flow reactor. The intrinsic kineticsof these reactions is virtually not accessible by experiments, due to pronounced massand heat transport limitations [171].
Due to the corrosive nature and toxicity of compounds like NH3, HCN or NO,catalytic methane combustion was studied as test reaction.
CH4 + 2O2 → CO2 + 2H2O ∆Hr(298K) = −802 kJmol−1 (4.1)
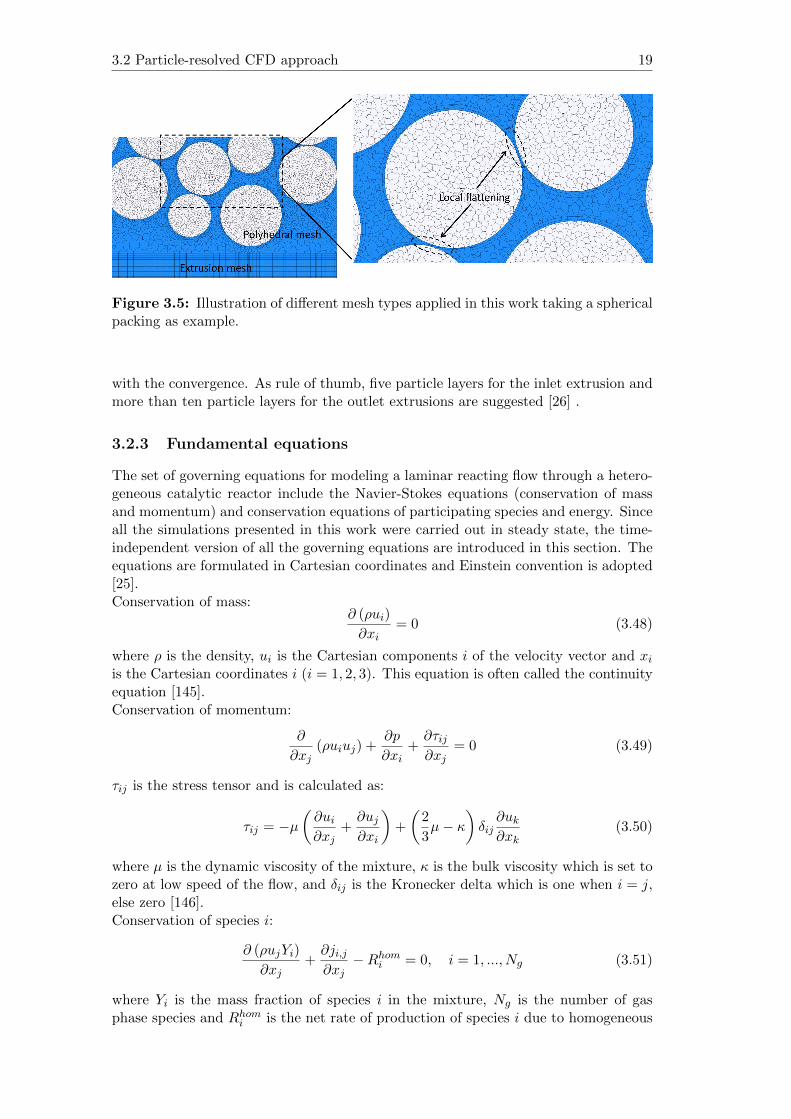
Concentration profiles for the main species (CH4, O2, CO2, H2O) as well as for minorspecies (H2, CO, C2H6, C2H4, C2H2) are measured by means of a capillary samplingtechnique. Fiber based Laser Induced Fluorescence spectroscopy is used to measurequantitative concentration profiles of OH· radicals being an indicator species for gasphase oxidation reactions. Details of the experiments are given in [86, 172]. Insight intoextent and nature of the interaction between surface and gas phase chemistry, as well aschemistry and transport is obtained by conducting three-dimensional CFD simulationsof flow coupled with heat and mass transport, as well as detailed heterogeneous andhomogeneous reaction kinetics.
This chapter is adopted from publication: H. Schwarz, Y. Dong and R. Horn, Catalytic MethaneCombustion on a Pt Gauze: Laser-Induced Fluorescence Spectroscopy, Species Profiles, and Simula-tions, Chemical Engineering & Technology 39 (11) (2016) 2011-2019.

26 4 Catalytical Methane Combustion on a Platinum Gauze
Figure 4.1: Schematic drawing of the experimental setup. The magnification showsthe fiber-optic probe for LIF measurements positioned inside the sampling capillary[86].
4.1 Experimental details
The reactor assembly is schematically depicted in Figure 4.1. The platinum gauzeconsists of 3600 meshes/cm2 with a wire diameter of 40 µm and is mounted insidethe reactor as shown. The fused-silica flow reactor is heated by an electrical furnaceand operated at a slightly elevated pressure of 1.5 bar. The sampling capillary canbe traversed along the center of the reactor, allowing reactant mixture samples to beextracted continuously. Placing the capillary by using a stepper motor permits po-sitioning with micrometer accuracy. The magnification in Figure 4.1 illustrates thesampling process and shows how the fiber-optic probe for LIF detection is accommod-ated inside the sampling capillary. The sampling rates are adjusted such that they areconsiderably smaller than the total flow rate, assuring that the main flow remains un-affected by the sampling. Rapid sample extraction and radical removal by collisionalwall quenching [4] inhibit reaction progress inside the sampling capillary and henceensure unbiased ex situ sample analysis. The composition analysis was done using acalibrated mass spectrometer (Pfeiffer Vacuum) and Ar as internal standard. Due tocondensation, water was removed from the sampling stream and was calculated fromthe oxygen balance.
In the experiment, the Pt gauze was prepared and activated in a similar manneras described by de Smet et al. [173]. It was first reduced in a flow of 10 vol %H2 in Ar while heating the reactor up to 700 C. Then, the catalyst was activatedusing a C2H6/O2/Ar 3:2:5 mixture. The actual experiments were conducted with aCH4/O2 mixture diluted in 80 vol% Ar. The flow rates were 120 mLNmin−1 CH4,480 mLNmin−1 O2 and 2400 mLNmin−1 Ar, corresponding to an equivalence ratio ofφ=0.5. The furnace temperature was held at 700 C.
The experiments were previously carried out by Dr. Heiner Schwarz and more details of themeasurement are presented in his dissertation [86].

4.2 Simulation details 27
4.2 Simulation details
A representative geometry of the experimental gauze reactor was used as the compu-tational domain as shown in Figure 4.2 following the work of de Smet et al. [173] andQuiceno et al. [148]. Due to symmetry, only 1/4 of the gauze surface was calculatedand periodic boundary conditions were applied for all other surfaces except for the in-let, outlet and gauze surface. The standard velocity inlet and pressure outlet boundaryconditions were used. Inlet temperature and inlet mass fractions of the species werespecified to match the experiments. The length of the calculation domain extendedfrom 2 mm upstream to 2 mm downstream the gauze.
Figure 4.2: Illustration of the computation domain of the catalytic gauze reactorand boundary conditions applied.
All simulations assumed steady state and laminar flow and were conducted bythe commercial CFD code STAR-CCM+ 10.04 [140]. To limit the computationalefforts and reach convergence, the gauze temperature was assumed to be isothermal.The GRI 3.0 mechanism [174] was used to describe the gas phase chemistry anda mechanism from Deutschmann et al. [175] was used for describing the methaneoxidation on Pt surfaces. Both mechanisms were imported into STAR-CCM+ 10.04[140] as CHEMKIN files and the build-in stiff solver DARS was used for handlingthe microkinetics. For improving efficiency, the operator splitting algorithm was used,which decouples the transport equations and the chemical reactions [176].
Figure 4.3: Meshed computation domain of the catalytic gauze reactor.
Due to the complex system and the stiffness caused by the homogeneous and

28 4 Catalytical Methane Combustion on a Platinum Gauze
heterogeneous reactions, different meshing strategies were applied in the computationaldomain. A dense polyhedral mesh was used in the volume around the gauze whiledirected mesh were used elsewhere as shown in Figure 4.3. A mesh conformity of 100% at the interfaces between the two kinds of meshing and the cell quality was verified.All the mesh parameters were set as percentage of the base size. Table 4.1 lists somecharacteristic number of the mesh. The dense polyhedral mesh in the region near thegauze is the most demanding part considering the small size of the gauze comparedto the whole computational domain. A fine mesh is used in this region due to thesteep gradients around the gauze. Mesh independence study was verified for base sizeof 3 · 10−5 m and 2 · 10−5 m. Both sizes gave identical results as shown in Figure 4.4;therefore, all simulations were carried out with a base size of 3 · 10−5 m.
0
0.02
0.04
0.06
0.08
0.1
0.12
0.14
0.16
−2 −1.5 −1 −0.5 0 0.5 1 1.5 2
400
600
800
1000
1200
1400
1600
1800
2000
Mo
le f
ractio
n [
−]
Te
mp
era
ture
[K
]x−coordinate [mm]
CH4 CO2
H2O
O2
CO
T
bs=3e−5 mbs=2e−5 m
Figure 4.4: Mesh independence study. Mesh convergence is achieved at base size of3 · 10−5.
Table 4.1: Mesh parameters for simulating the gauze reactor.
Base size [m] Total number of cells [-] Number of polyhedral cells [-]
3 · 10−5 84617 29217
2 · 10−5 184029 71829
4.3 Results and discussion
Experimental and simulated species profiles along the centerline of the reactor areshown in Figure 4.5. A gauze temperature of 1500 K and an inlet temperature of 360K were used in the simulation. The top plot in Figure 4.5 shows mole fractions ofthe reactants and the major products with respect to the left axis and the simulatedtemperature profile with respect to the right axis. The bottom plot in Figure 4.5shows the mole fraction profiles of the minor species on the left axis and the OH·

4.3 Results and discussion 29
0
0.02
0.04
0.06
0.08
0.1
0.12
0.14
0.16
−2 −1.5 −1 −0.5 0 0.5 1 1.5 2
400
600
800
1000
1200
1400
1600
1800
2000M
ole
fra
ction [−
]
Tem
pera
ture
[K
]
x−coordinate [mm]
CH4 CO2
H2O
O2
CO
T
SurfaceSurface+Gas
0
2
4
6
8
10
12
−2 −1.5 −1 −0.5 0 0.5 1 1.5 2 0
2
4
6
8
10
12
14
Mole
fra
ction ×
10
−4 [−
]
OH
· num
ber
density ×
10
15 [cm
−3]
x−coordinate [mm]
H2
OH·
C2H6 C2H4
C2H2
Figure 4.5: Simulated profiles (lines) and measured profiles (dots) of the main speciesand temperature (top) and the minor species and OH· (bottom) for φ = 0.5, dilutedin 80 % at 1.5 bar and a total flow rate of 3000 mLN/min. Simulations results aregiven when surface reactions are considered alone (Surface) and combined with gasphase reactions (Surface + Gas). The gauze temperature was set to 1500 K and theinlet temperature to 360 K. The dotted grey lines indicate the location of the gauze.
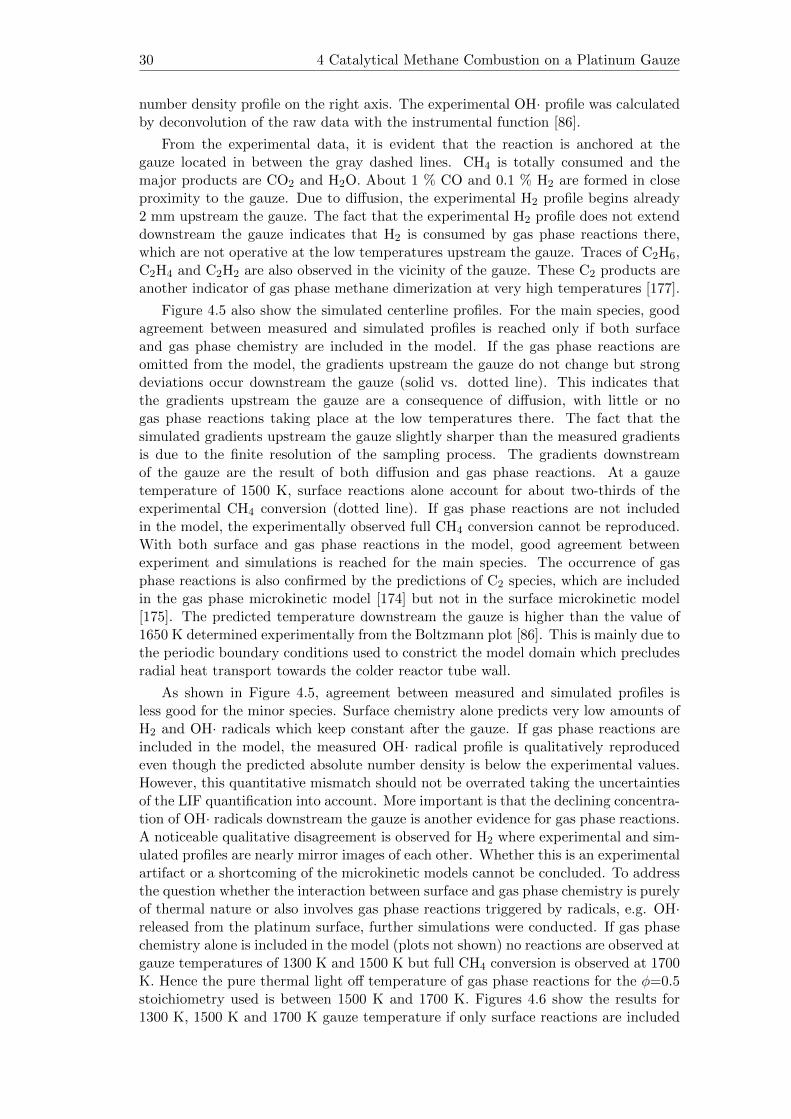
30 4 Catalytical Methane Combustion on a Platinum Gauze
number density profile on the right axis. The experimental OH· profile was calculatedby deconvolution of the raw data with the instrumental function [86].
From the experimental data, it is evident that the reaction is anchored at thegauze located in between the gray dashed lines. CH4 is totally consumed and themajor products are CO2 and H2O. About 1 % CO and 0.1 % H2 are formed in closeproximity to the gauze. Due to diffusion, the experimental H2 profile begins already2 mm upstream the gauze. The fact that the experimental H2 profile does not extenddownstream the gauze indicates that H2 is consumed by gas phase reactions there,which are not operative at the low temperatures upstream the gauze. Traces of C2H6,C2H4 and C2H2 are also observed in the vicinity of the gauze. These C2 products areanother indicator of gas phase methane dimerization at very high temperatures [177].
Figure 4.5 also show the simulated centerline profiles. For the main species, goodagreement between measured and simulated profiles is reached only if both surfaceand gas phase chemistry are included in the model. If the gas phase reactions areomitted from the model, the gradients upstream the gauze do not change but strongdeviations occur downstream the gauze (solid vs. dotted line). This indicates thatthe gradients upstream the gauze are a consequence of diffusion, with little or nogas phase reactions taking place at the low temperatures there. The fact that thesimulated gradients upstream the gauze slightly sharper than the measured gradientsis due to the finite resolution of the sampling process. The gradients downstreamof the gauze are the result of both diffusion and gas phase reactions. At a gauzetemperature of 1500 K, surface reactions alone account for about two-thirds of theexperimental CH4 conversion (dotted line). If gas phase reactions are not includedin the model, the experimentally observed full CH4 conversion cannot be reproduced.With both surface and gas phase reactions in the model, good agreement betweenexperiment and simulations is reached for the main species. The occurrence of gasphase reactions is also confirmed by the predictions of C2 species, which are includedin the gas phase microkinetic model [174] but not in the surface microkinetic model[175]. The predicted temperature downstream the gauze is higher than the value of1650 K determined experimentally from the Boltzmann plot [86]. This is mainly due tothe periodic boundary conditions used to constrict the model domain which precludesradial heat transport towards the colder reactor tube wall.
As shown in Figure 4.5, agreement between measured and simulated profiles isless good for the minor species. Surface chemistry alone predicts very low amounts ofH2 and OH· radicals which keep constant after the gauze. If gas phase reactions areincluded in the model, the measured OH· radical profile is qualitatively reproducedeven though the predicted absolute number density is below the experimental values.However, this quantitative mismatch should not be overrated taking the uncertaintiesof the LIF quantification into account. More important is that the declining concentra-tion of OH· radicals downstream the gauze is another evidence for gas phase reactions.A noticeable qualitative disagreement is observed for H2 where experimental and sim-ulated profiles are nearly mirror images of each other. Whether this is an experimentalartifact or a shortcoming of the microkinetic models cannot be concluded. To addressthe question whether the interaction between surface and gas phase chemistry is purelyof thermal nature or also involves gas phase reactions triggered by radicals, e.g. OH·released from the platinum surface, further simulations were conducted. If gas phasechemistry alone is included in the model (plots not shown) no reactions are observed atgauze temperatures of 1300 K and 1500 K but full CH4 conversion is observed at 1700K. Hence the pure thermal light off temperature of gas phase reactions for the φ=0.5stoichiometry used is between 1500 K and 1700 K. Figures 4.6 show the results for1300 K, 1500 K and 1700 K gauze temperature if only surface reactions are included

4.3 Results and discussion 31
0
0.02
0.04
0.06
0.08
0.1
0.12
0.14
0.16
−2 −1.5 −1 −0.5 0 0.5 1 1.5 2
400
600
800
1000
1200
1400
1600
1800
2000
Mole
fra
ction [−
]
Tem
pera
ture
[K
]
x−coordinate [mm]
CH4
CO2
H2O
O2
T
T=1300 KT=1500 KT=1700 K
0
2
4
6
8
10
12
−2 −1.5 −1 −0.5 0 0.5 1 1.5 2 0
0.1
0.2
0.3
0.4
0.5
0.6
Mole
fra
ction ×
10
−5 [−
]
OH
· num
ber
density ×
10
15 [cm
−3]
x−coordinate [mm]
CO
H2
OH·T=1300 KT=1500 KT=1700 K
Figure 4.6: Influence of the gauze temperature on the simulated profiles if surfacereactions are considered alone. Top: main species and temperature; bottom: minorspecies and OH· radical density.

32 4 Catalytical Methane Combustion on a Platinum Gauze
in the model.
Even at a gauze temperature of 1700 K, CH4 conversion is not complete after thegauze. The contact time with the gauze is simply too short. Furthermore, all speciesremain at constant concentration after the gauze and the gas stream takes on thetemperature of the gauze. Taking these observations into account and consideringalso that full CH4 conversion is reached at already at 1500 K gauze temperature ifboth gas and surface chemistry is included in the model, it can be concluded thatradicals desorbing from the catalyst surface must play a role in the reaction network.The interaction of surface and gas phase chemistry cannot be of pure thermal nature.Reactive radicals such as OH· must desorb from the platinum surface and trigger rad-ical chain reactions in the downstream section of the gauze, accounting for additionalCH4 conversion and product formation there. The numerically predicted decline ofOH· radicals after the gauze which is also observed experimentally, directly shows theinvolvement of gas phase reactions.
4.4 Conclusions
With the spatial profile technique, it was possible to resolve the steep concentra-tion gradients in the vicinity of a platinum gauze during catalytically assisted meth-ane combustion. Quantitative OH· radical profiles could be measured by fiber-basedLaser-Induced Fluorescence spectroscopy. By comparing these experimental data withnumerical simulations including flow, mass and heat transport and microkinetic sur-face and gas phase chemistry, it is possible to show that the reaction occurs partly atthe platinum surface and partly in the gas phase. The gradients upstream of the gauzeare caused by diffusion while the gradients downstream of the gauze are a combinedeffect of diffusion and gas phase chemistry. It can further be concluded that the in-teraction between surface and gas phase chemistry is not limited to heat transfer onlybut also involves the desorption of surface-generated radicals which trigger gas phasechain reactions. As such, this chapter presents an example of coupled heterogeneous-homogeneous reactions in high temperature catalysis.

5Microtomography-Based CFD
Modeling of A Foam Monolith
Foam monoliths made from mechanicallystable, chemically inert and temperature res-istant materials like refractory oxides, ceram-ics, silicon carbide or metals have attractedmuch interest as catalyst support in catalyticfixed-bed reactors. Due to their high porosity,foam monoliths generate low pressure dropeven at high gas flow rates. High convectionin the interconnected macro-pores enhancesmass transfer, heat transfer and radial mix-ing [23, 178–180]. If the foam is made ofmaterials of high thermal conductivity, heattransport in the struts of the irregular cellnetwork increases which can be beneficial forexothermic reactions suffering from selectiv-ity loss or hot-spot formation [181]. The in-trinsic low specific surface area of foam sup-ports can be increased by a washcoat carryingfinely dispersed catalyst particles [182].
Strong modeling efforts have been madeto understand the physical and chemical pro-cesses occuring inside fixed-bed reactors withfoam monoliths [183, 184]. Much attention has been paid to hydrodynamics, heattransport inside the pore network [21, 22, 185] and heat transfer to the reactor wall[186, 187]. Heat and mass transport correlations have been derived from simulationdata which can be applied for reactor design and development [182, 188–192].
In general, there are two approaches to model the foam structure. The unit cellapproach [193] idealizes a foam monolith by periodic repetition of a representativeunit cell in 3D space (e.g. Kelvin cells) [194]. The other approach is to simulate flowand transport using the foam geometry reconstructed from X-ray computed micro-tomography (µ-CT) scans [21, 22]. µ-CT is more costly, but it captures the irregularand randomized foam structure in high fidelity. µ-CT based CFD simulations deliverresults closer to reality because the foam geometry in the model is the very same asthat in the reactor.
This chapter is adopted from submitted manuscript: Y. Dong, O. Korup, J. Gerdts, R. Horn,Microtomography-based CFD modeling of a fixed-bed reactor with an open-cell foam monolith and ex-perimental verification by reactor profile measurements. Submitted to Chemical Engineering Journal,2018.

34 5 Microtomography-Based CFD Modeling of A Foam Monolith
Figure 5.1: Photography of the PANalytical Empyrean interior: X-ray tube, sampleholder (magnified) and GaliPIX3D detector.
In order to gain confidence in µ-CT based CFD simulations, experimental val-idation is required. High resolution temperature and species concentration profilesmeasured through the centerline of foam catalysts offer currently the highest datapoint density for model validation [85, 195]. Spatial reactor measurements have alsobeen used for validating CFD simulations of fixed-bed reactors with random packingsof spherical [141] and non-spherical particles [27]. In those studies, the stochasticpacking geometry is generated by DEM simulations. It represents the packing in thereactor within statistical bounds but it is not an exact copy of the bed inside thereactor.
If the packing geometry is reconstructed from µ-CT scans, as demonstrated in thepresent work for a foam monolith, the uncertainty in the bed structure is close tozero. Deviations between model and experiment are reduced to deficits in the kineticmodel of the catalytic reaction, shortcomings in the description of momentum, massand heat transport, inaccurate boundary conditions or erroneous experimental data.
In this work, we present, according to our knowledge for the first time, a compar-ison between temperature and concentration profiles measured through a foam catalystunder reaction conditions and µ-CT based CFD simulations of these data. We striveto keep uncertainties in the model as small as possible by choosing CO oxidation onPt as a test reaction with well-known microkinetics, by using Pt nanoparticles witha narrow size distribution on a plain 45 ppi (pore per inch) α-Al2O3 foam monolithas simple catalyst system and by modeling transport processes and boundary condi-tions as accurately as possible including conjugated heat transport at the gas-surfaceinterface and heat transport by radiation inside the foam. Deviations between themeasured and simulated profiles are critically discussed in terms of having their originin the experiment or in the model.
5.1 Experimental details
X-ray computed microtomography and reconstruction
The µ-CT system used in this work was the Empyrean research diffractometer fromPANalytical [196]. Even though this instrument is normally used for X-ray diffraction,it can be operated as tomography setup. In this configuration, shown in Figure 5.1, the

5.1 Experimental details 35
Figure 5.2: Illustration of the cone-beam µ-CT setup.
Figure 5.3: Side and top view of the CT reconstructed foam monolith.
X-ray tube is oriented line-of-sight to the detector (2θ = 0). A molybdenum tube wasused because hard X-rays penetrate solid objects better than soft X-rays, e.g. from acopper tube. The tube was operated at 30 kV and 10 mA and a zirconium filter wasused to remove the beta-line. The detector, the GaliPIX3D from PANalytical, had asensor area of 24.8 mm in width and 30.7 mm in height, pixel dimensions of 60×60µm and was capable of detecting hard X-rays. The point focus of the X-ray tube wasused with the X-rays being emitted in a cone like fashion from the Mo-anode. Thecatalyst foam was mounted on a rotatable sample platform 452 mm from the conebeam source and 28 mm from the detector (Figure 5.2) [88].
In a typical µ-CT-scan, the catalyst foam was rotated by 360 in steps of 0.2−2.0
and a measurement time of 0.5-2 s. After a flat field correction was performed oneach X-ray transmission image, the 3D-structure of the foam was reconstructed in thesoftware VGStudio MAX 2.2. Figure 5.3 shows side and top views of the reconstructedfoam geometry. The channel in the center of the foam, seen in the view from top,accommodates the sampling capillary for the profile measurements [85, 195].
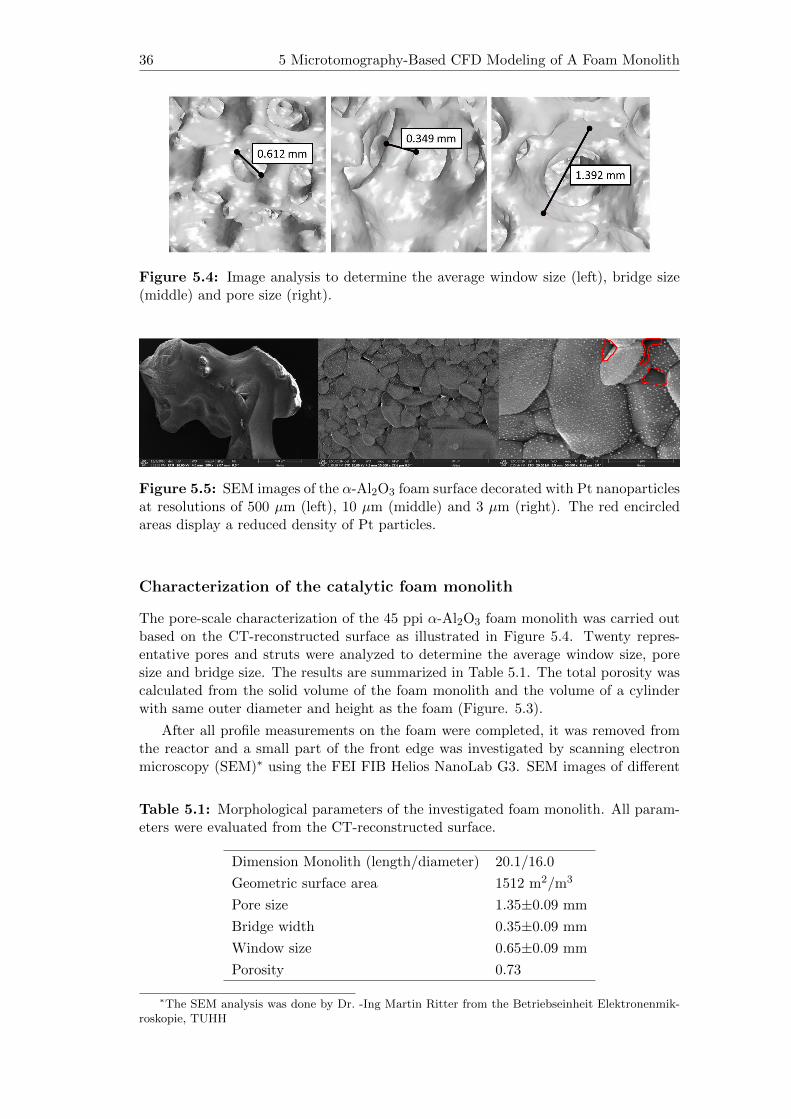
36 5 Microtomography-Based CFD Modeling of A Foam Monolith
Figure 5.4: Image analysis to determine the average window size (left), bridge size(middle) and pore size (right).
Figure 5.5: SEM images of the α-Al2O3 foam surface decorated with Pt nanoparticlesat resolutions of 500 µm (left), 10 µm (middle) and 3 µm (right). The red encircledareas display a reduced density of Pt particles.
Characterization of the catalytic foam monolith
The pore-scale characterization of the 45 ppi α-Al2O3 foam monolith was carried outbased on the CT-reconstructed surface as illustrated in Figure 5.4. Twenty repres-entative pores and struts were analyzed to determine the average window size, poresize and bridge size. The results are summarized in Table 5.1. The total porosity wascalculated from the solid volume of the foam monolith and the volume of a cylinderwith same outer diameter and height as the foam (Figure. 5.3).
After all profile measurements on the foam were completed, it was removed fromthe reactor and a small part of the front edge was investigated by scanning electronmicroscopy (SEM)∗ using the FEI FIB Helios NanoLab G3. SEM images of different
Table 5.1: Morphological parameters of the investigated foam monolith. All param-eters were evaluated from the CT-reconstructed surface.
Dimension Monolith (length/diameter) 20.1/16.0
Geometric surface area 1512 m2/m3
Pore size 1.35±0.09 mm
Bridge width 0.35±0.09 mm
Window size 0.65±0.09 mm
Porosity 0.73
∗The SEM analysis was done by Dr. -Ing Martin Ritter from the Betriebseinheit Elektronenmik-roskopie, TUHH

5.1 Experimental details 37
Figure 5.6: SEM image at 4 µm resolution after image processing. The white dotsare the Pt particles, the α-Al2O3 crystals appear as black background.
resolutions are shown in Figure 5.5. The Pt nanoparticles are evenly distributedover the α-Al2O3 surface. Even though the reaction heated the foam catalyst totemperatures above 1500 K, no obvious sintering of the Pt nanoparticles was observed.As shown in Figure 5.6 and 5.7, the ratio of active Pt surface (Acat) to the geometricsurface of the foam (Ageo) was determined from a SEM image at a resolution of 4µm. This ratio Acat/Ageo is needed to incorporate the catalytic reactions as fluxboundary condition in the CFD model by means of Eq. 3.65. In a first step the imageanalysis software ImageJ [197] was used to distinguish the Pt-particles from the α-Al2O3 crystals (Figure 5.6). The Pt particles were colored white, the α-Al2O3 crystalswere colored black. From the processed image a size histogram was computed (Figure5.7). The average particle diameter was determined to be 51 nm. It was assumed thatall Pt nanoparticles were spherical and fully accessible. With this assumption a ratioAcat/Ageo = 0.4 was obtained. This value is an upper bound because not all Pt atomsare accessible. The Pt atoms in contact with the alumina surface are not accessible forthe catalytic reaction. Also crevices between the α-Al2O3 crystals (red encircled areasin Figure 5.5) seem to contain fewer Pt-particles than terraces accounted for in theimage analysis. Therefore, the value of Acat/Ageo was one of several model parametersthat were investigated systematically in Section 5.3.
Profile measurement
The investigated Pt coated 45 ppi α-Al2O3 foam monolith was sandwiched between twoinert, uncoated 80 ppi foam monoliths, wrapped in InteramTM (3MTM) and mountedin the fused silica reactor tube which had an inner diameter of 18 mm and an outerdiameter of 38 mm (Figure 5.8). The two blank foams, each 12 mm long, reducedradiative heat losses from the catalyst foam. Gas flow was from bottom to top. Cor-respondingly and in agreement with earlier nomenclature, the blank foam below thecatalyst was denoted as ‘front heat shield (FHS)’ and the blank foam above the cata-lyst as ‘back heat shield (BHS)’ respectively [198]. A channel of 1 mm diameter wasdrilled through the center of the foam stack in which a sampling capillary of 700 µmouter diameter and 530 µm inner diameter was inserted. The sampling capillary hada 100 µm side sampling orifice through which a gas sample could be extracted forgas chromatographic analysis. For measuring the catalyst temperature at the positionof sampling, a thin pyrometer fiber was inserted into the sampling capillary and tip-
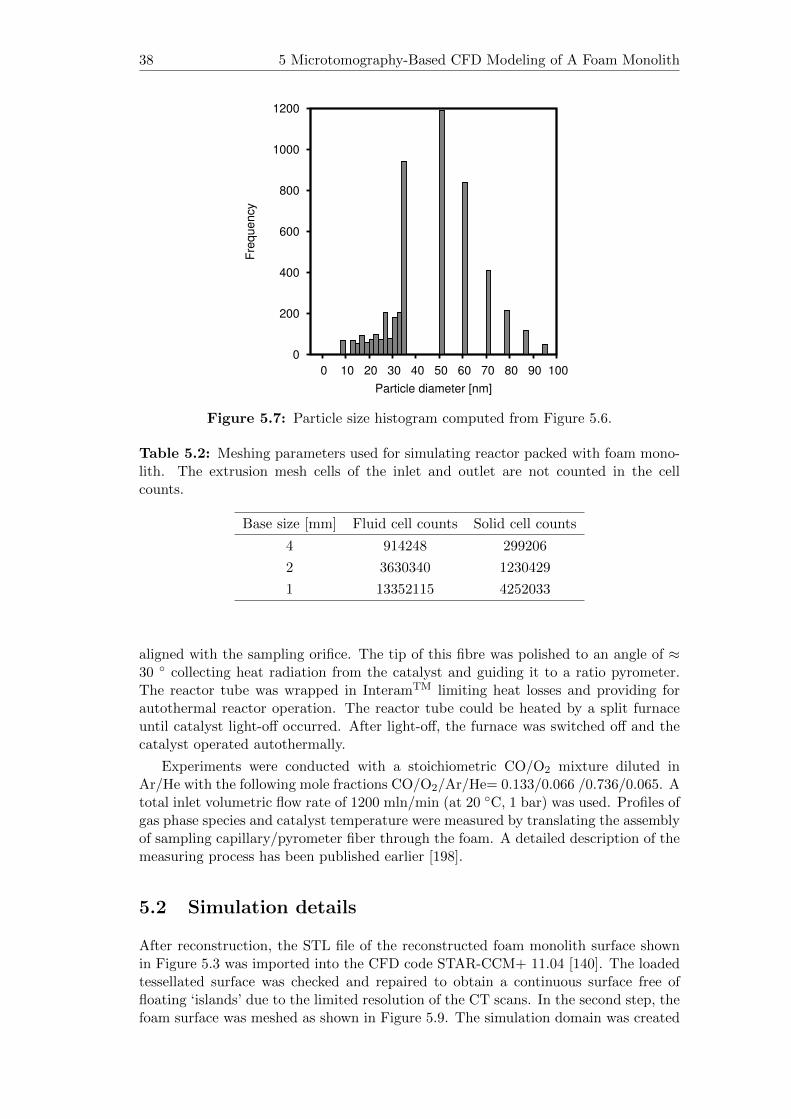
38 5 Microtomography-Based CFD Modeling of A Foam Monolith
0
200
400
600
800
1000
1200
0 10 20 30 40 50 60 70 80 90 100
Fre
qu
ency
Particle diameter [nm]
Figure 5.7: Particle size histogram computed from Figure 5.6.
Table 5.2: Meshing parameters used for simulating reactor packed with foam mono-lith. The extrusion mesh cells of the inlet and outlet are not counted in the cellcounts.
Base size [mm] Fluid cell counts Solid cell counts
4 914248 299206
2 3630340 1230429
1 13352115 4252033
aligned with the sampling orifice. The tip of this fibre was polished to an angle of ≈30 collecting heat radiation from the catalyst and guiding it to a ratio pyrometer.The reactor tube was wrapped in InteramTM limiting heat losses and providing forautothermal reactor operation. The reactor tube could be heated by a split furnaceuntil catalyst light-off occurred. After light-off, the furnace was switched off and thecatalyst operated autothermally.
Experiments were conducted with a stoichiometric CO/O2 mixture diluted inAr/He with the following mole fractions CO/O2/Ar/He= 0.133/0.066 /0.736/0.065. Atotal inlet volumetric flow rate of 1200 mln/min (at 20 C, 1 bar) was used. Profiles ofgas phase species and catalyst temperature were measured by translating the assemblyof sampling capillary/pyrometer fiber through the foam. A detailed description of themeasuring process has been published earlier [198].
5.2 Simulation details
After reconstruction, the STL file of the reconstructed foam monolith surface shownin Figure 5.3 was imported into the CFD code STAR-CCM+ 11.04 [140]. The loadedtessellated surface was checked and repaired to obtain a continuous surface free offloating ‘islands’ due to the limited resolution of the CT scans. In the second step, thefoam surface was meshed as shown in Figure 5.9. The simulation domain was created

5.2 Simulation details 39
Figure 5.8: Left: Photography of the catalyst foam sandwiched between front heatshield below and back heat shield above. Right: Foam stack wrapped in InteramTM in-side the fused silica reactor tube.
Figure 5.9: Foam monolith with meshed surface: side view (left) and top view (right).

40 5 Microtomography-Based CFD Modeling of A Foam Monolith
Figure 5.10: Translational plan section plot of the volume mesh.
0
0.02
0.04
0.06
0.08
0.1
0.12
0.14
0.16
−5 0 5 10 15
Mo
le f
ractio
n [
−]
z−coordinate [mm]
CO
O2
BS=1 mmBS=2 mmBS=4 mm
Figure 5.11: Simulated concentration profiles of CO oxidation on at different basesize of the volume mesh.

5.2 Simulation details 41
by inserting the foam monolith into a cylindrical container representing the reactortube and by placing a thin cylinder in the center hole simulating the sampling capillary.To keep computational time within bounds, only the catalyst foam was considered inthe model. Front and back heat shield were indirectly considered in form of inlet andoutlet boundary conditions but their geometry was not resolved in the CFD model.The simulation domain was then volume meshed (Figure 5.10). The mesh strategywas the same as in a previous paper by the authors [27]. Both, fluid and solid domainwere meshed with a polyhedral mesh while two layers of prism meshes were appliedto all surfaces (foam surface, capillary wall and reactor tube wall). Inlet and outletsurfaces were extended with a structured cuboid mesh to avoid back flow effects. Meshparameters were set as percentage of the base size and mesh convergence was checkedby reducing the base size until the simulated concentration profiles converged (Figure5.11). Mesh independence was reached at a base size of 2 mm and all simulationsdiscussed below were done with this base size.
The CFD simulations were set up to mimic the experimental profile measurementsas closely as possible. Laminar flow (Re ≈ 10), conjugated heat transfer between fluidand catalyst foam, CO oxidation on the foam surface and radiation were includedand solved in STAR-CCM+ 11.04 [140]. Gravitational and external forces, thermaldiffusion and viscous heating were not considered [148]. Uniform inlet velocity, tem-perature and gas composition were assumed as inlet boundary conditions. A pressureoutlet boundary condition was used at the upper end of the computational domain.No-slip boundary conditions were assigned to all solid walls (foam surface, capillarywall, reactor tube wall). The capillary wall was set as adiabatic. Apart from fewsimulations where heat losses through the wall were considered the reactor wall wasalso considered adiabatic. All simulations were carried out at steady state and thecorresponding governing equations are given in Chapter 3.
In this work, a mechanism from Deutschmann et al. [175] was used for describingCO oxidation on Pt. The reactions and the kinetic parameters are given in Table5.3. The mechanism was imported into STAR-CCM+ 11.04 [140] as CHEMKIN filesand the build-in stiff solver DARS was used for handling the microkinetics. In orderto improve efficiency, the operator splitting algorithm was used which decouples thetransport equations and the chemical reactions [176].
Due to the high reaction temperature, thermal radiation was also considered byemploying the surface-to-surface (S2S) radiation model in STAR-CCM+ [140]. Thisbrings a radiant flux q′rad in W/m2 in the energy equation source term at the solidboundaries. The gas phase between solid surfaces is non-participating (no absorption,emission, or scattering of thermal radiation). Radiation properties were treated aswavelength independent and the emissivity of the foam, the capillary and the reactorsurface were set to 0.9 [199]. At first, STAR-CCM+ [140] calculates view factors by raytracing for each pair of surface patches (discretized boundary surfaces). View factorsare defined as ‘fraction of uniform diffuse radiation leaving a surface that directlyreaches another surface’ [200]. From the view factors radiosity and irradiation fieldsare calculated on all surfaces. More details on the S2S radiation model can be foundin the user guide of STAR-CCM+ [140] or in the work of Wehinger et al. [141].

42 5 Microtomography-Based CFD Modeling of A Foam Monolith
Tab
le5.3
:S
urf
ace
reac
tion
step
san
dra
tep
aram
eter
sof
CO
oxid
atio
non
Pt
use
din
this
work
.T
he
mec
han
ism
isad
op
ted
from
Deu
tsch
man
nm
ech
anis
mof
CH
4ox
idat
ion
onP
t[1
75,
201
,202
].
Rea
ctio
nP
re-e
xp
onen
tial
fact
ora
Tem
per
ature
exp
onen
t,β
Act
ivati
on
ener
gy
[kJ/m
ol]
O2
+2
Pt(
s)→
2O
(s)
0.02
3b
00
2O
(s)→
O2
+2
Pt(
s)3.
70·1
021
0213.2
-60·θO(s)
CO
+P
t(s)→
CO
(s)c
1.61
8·1
020
0.5
0
CO
(s)→
CO
+P
t(s)
1.0·1
013
0125.5
CO
(s)
+O
(s)→
CO
2(s
)+
Pt(
s)3.
70·1
021
0105
CO
2+
Pt(
s)→
CO
2(s
)5.
0·1
0−3
b0
0
CO
2(s
)→
CO
2+
Pt(
s)1.0·1
013
020.5
C(s
)+
O(s
)→
CO
(s)
+P
t(s)
3.7
0·1
021
062.8
CO
(s)
+P
t(s)→
C(s
)+
O(s
)1.
0·1
018
0184
apre
-exp
onen
tial
fact
or
inunit
sof
[cm
,m
ol,
s]bst
ickin
gco
effici
ent
[dim
ensi
onle
ss]
cre
act
ion
ord
erof
Pt(
s)is
2fo
rth
isst
ep.
surf
ace
site
den
sity
Γ=
2.7
2·1
0−9
mol/
cm2

5.3 Results and discussion 43
5.3 Results and discussion
Figure 5.12 displays plots of the simulated pressure, velocity, temperature and con-centration fields of CO, O2 and CO2 inside the foam. At the low flow rates used in thecurrent study, the pressure drop along the foam is just a few Pascal. There is basicallyno radial pressure gradient. The flow field is very inhomogeneous with almost stagnantflow in windows, in the wake of struts and fast flow in the main channels, close to thewall and in the vicinity of the sampling capillary. Similar results were obtained fornon-reacting flows by Fan et al. [21].
The temperature field is also very inhomogeneous but much more difficult to ra-tionalize than the flow field. When the reactant mixture reaches the front of thefoam, the gas temperature rises steeply. The reaction rate in the entrance regionof the foam is high because CO and O2 have their highest concentration there andthe liberated heat increases temperature and reaction rate even further. Interestingand eye-catching however is the hot-spot that can be seen in the temperature plotof Figure 5.12, a few mm inside the foam close to the wall on the right side. Thishot-spot forms because the geometry of the foam there is accidentally such that someunconverted O2 and CO can channel a few millimeters into the foam. In consequencea gas stream with still rather high concentration of O2 and CO hits a catalyst thatis significantly hotter than the catalyst at the front face of the foam. Because thereaction rate depends more sensitively on temperature than on concentration, a veryhigh reaction rate results in a spatially confined area leading to a hot-spot. On theleft side of the temperature plot of Figure 5.12 no hot-spot is seen because there is noreactant channeling. This shows how complex the interplay between flow, heat gener-ation and heat transport is and how subtle differences in geometry and flow velocitylead to pronounced non-uniformity in reaction rate and catalyst temperature. Thischallenges the unit cell approach because a regular foam structure would lead to aregular flow and temperature pattern which is not observed in reality.
With decreasing reactant concentration the reaction rate and the rate of heatproduction decrease and become zero once the reactants are fully consumed. Dueto radiative heat losses at the back face of the foam and axial heat transport byconduction, convection and radiation, the temperature decreases in flow direction.Temperature gradients in radial direction smoothen out once the reaction comes tohold because of the adiabatic boundary condition at the reactor wall.
As mentioned in Section 5.1, an initial Acat/Ageo ratio of 0.4 was determined fromthe SEM image in Figure 5.6 under the assumption that all Pt particles were sphericaland fully accessible. In reality the particles wet the α-Al2O3 support partly whichresults in a lower Acat/Ageo ratio. Also the SEM image in Figure 5.6 might not berepresentative of the entire foam because it was taken at the rather cold front edgeof the used foam. In hot areas inside the foam, Pt sintering or even Pt losses couldhave occurred, e.g. by vaporization of PtO2. Hence the Acat/Ageo ratio is a parameterin the simulation and the value of 0.4 can merely be considered as a starting value.Figure 5.13 shows a screening study of this parameter in a range from 1 to 0.01 bycomparing the experimental and simulated CO profile.
As can be expected, the Acat/Ageo ratio influences the slope of the profiles. Thehigher the value, the faster CO is consumed. The decreasing CO concentration in frontof the catalyst foam at z < 0 mm is due to diffusion. Gas phase chemistry was notconsidered in the model. Best agreement was found for a value Acat/Ageo = 0.03. Thisvalue is much lower than the initial estimate of 0.4. Whether this is due to wettingof the Pt particles or Pt losses or whether this is due to erroneous kinetic parameterscannot be inferred from the present data. Other experimental methods like H2 or CO

44 5 Microtomography-Based CFD Modeling of A Foam Monolith
Figure 5.12: Translational cut plane plots of the simulated relative pressure (topleft), velocity (top middle), gas phase temperature (top right), mass fraction of CO(bottom left), O2 (bottom middle) and CO2 (bottom right).

5.3 Results and discussion 45
0
0.02
0.04
0.06
0.08
0.1
0.12
0.14
−5 0 5 10 15
Mo
le f
raction
[−
]
z−coordinate [mm]
COAcat/Ageo=0.01
Acat/Ageo=0.02
Acat/Ageo=0.03
Acat/Ageo=0.04
Acat/Ageo=0.05
Acat/Ageo=0.1
Acat/Ageo=1
Figure 5.13: Effect of the Acat/Ageo ratio on the simulated CO profiles.
chemisorption could be used to determine this value more accurately but the entirefoam did not fit into any available sample cell and destruction of the foam would havecreated additional Al2O3 surface biasing the true value. Hence the best fit value ofAcat/Ageo = 0.03 was used in all simulations that follow hereafter.
A comparison of the simulated and measured species and temperature profiles isdisplayed in Figure 5.14. The catalytic foam monolith starts at z=0 mm as indicatedby the vertical grey dotted line. The overall agreement between the simulated andmeasured species profiles is very good. The experimentally observed rapid conversionof CO and O2 reaching full conversion at about z=8 mm is confirmed by the model.Similar good agreement is found for CO2. The observed local deviations between thesimulated profiles and the measured data points are due to the fact that the simulatedtrajectory is in all likelihood not the same as the scan line along which the samplingorifice was translated through the foam. Both the measured and simulated speciesprofiles depend sensitively on the pore structure along the probed trajectory. In thecurrent study the experimental scan line was chosen arbitrarily and local deviations arethe natural consequence. The easiest and fastest way to illustrate this is by plottingsimulation trajectories at the same radial coordinate but different azimuthal angles.Figure 5.15 shows four simulated CO trajectories at 0, π/2, π and 3/2π azimuthalangle at the outer wall of the sampling capillary. While the overall shape of the COprofiles is similar, pore structure effects lead to local deviations.
While such random deviations can be minimized by averaging a high number ofsimulated and measured trajectories, the simulated and measured temperature profilesin Figure 5.14 are systematically different. The temperature profile measured with thepyrometer fiber inside the sampling capillary increases slowly in the front heat shieldfrom 1502 K at z=-5 mm to a maximum of 1544 K at the entrance of the catalystfoam (z=0 mm) and falls then steeply to 1005 K at the end of the catalyst foam(z=20 mm). Because the simulation domain did not include the heat shields, thesimulated temperature profile starts at the entrance of the catalyst foam (z=0 mm)at 1490 K and rises to 1562 K at z=2.5 mm. The simulated temperature maximumcoincides with the inflection point in the measured and simulated CO and O2 profiles.

46 5 Microtomography-Based CFD Modeling of A Foam Monolith
0
0.02
0.04
0.06
0.08
0.1
0.12
0.14
0.16
−5 0 5 10 15 20 1000
1100
1200
1300
1400
1500
1600
Mole
fra
ctio
n [−
]
Tem
pe
ratu
re [K
]
z−coordinate [mm]
CO
O2
CO2
Ts,exp
Ts,sim
Figure 5.14: Comparison of the simulated (lines) and measured (dots) species profilesand solid surface temperature profiles of CO oxidation on Pt loaded α-Al2O3 foammonolith. The grey dotted line marks the inlet of the catalyst foam.
Figure 5.15: Effect of the local pore structure on the simulated species profiles. Thelines P1, P2, P3, P4 are four trajectories taken at 0, π/2, π and 3/2π azimuthal angleat the same radial coordinate corresponding to the outer wall of the sampling capillary.

5.3 Results and discussion 47
1000
1200
1400
1600
1800
2000
2200
−5 0 5 10 15
Tem
pera
ture
[K
]
z−coordinate [mm]
exp,s
sim,s,30 W loss
sim,g,30 W loss
sim,s,rad,λs=2 W/m/K
sim,g,rad,λs=2 W/m/K
sim,s,rad,λs=10 W/m/K
sim,s,rad,20 W loss
Figure 5.16: Effects of the different heat transport phenomenon (radiation, heat lossthrough the reactor wall, thermal conductivity of the solid material) on the simulatedsolid surface temperature.
Therefore, the position of the simulated temperature maximum is correct. While themeasured and simulated maximum temperature values are close (1544 K vs. 1562 Krespectively), it is physically impossible, that the temperature maximum occurs rightat the entrance of the catalyst foam because the catalytic reaction is the only heatsource and the maximum temperature occurs at the position of highest reaction rate.The measured temperature maximum at the entrance of the catalyst foam is thereforean experimental artifact. The fused silica fiber that is used to collect thermal radiationand guide it to the pyrometer has a rather flat acceptance angle and looks ahead, inthis case about 2.5 mm. This ‘looking ahead’ phenomenon is well known and wasexperimentally and mathematically quantified in earlier publications [198, 203].
Not only the positions of the temperature maxima deviate significantly betweenexperiment and simulation, the slopes before and after the temperature maximum arealso quite different. Both, the simulated and the measured temperature profiles inFigure 5.14 decrease after the maximum until the end of the foam. This indicates heatlosses. In a truly adiabatic reactor, the temperature would remain constant if heatrelease by exothermic chemistry ceases. In the model, as described in Section 5.2, theonly heat losses occur by radiation at the front and back face of the catalyst foam.Because the front heat shield was neglected in the simulation to keep the computa-tion manageable, the radiative boundary in the model is closer to the temperaturemaximum than in the experiment and hence the slope of the simulated temperatureprofile to the left of the maximum is steeper than that of the measured one. This isobserved and according to expectations. To the right of the maximum the temperaturein the simulated profile decreases less steeply than in the measurement even thoughthe radiative boundary condition in the model is also closer due to the lacking heat

48 5 Microtomography-Based CFD Modeling of A Foam Monolith
shield. This indicates that either the thermal conductivity of the foam material usedin the model is too low or that the adiabatic boundary condition at the reactor wallis not correct.
To investigate these options, heat transport parameters and thermal boundaryconditions were varied in the model and the simulation results were compared with theexperimental temperature profile. Figure 5.16 summarizes the results. Increasing thethermal conductivity of the foam from λsolid = 2 W/m/K (orange triangles) to λsolid =10 W/m/K (grey triangles) has only a small effect on the simulated temperatureprofile. The temperature maximum and the slopes go down slightly. This shows thataxial heat conduction in the struts of the foam play a minor role for heat transport.However, if a heat loss is applied to the reactor wall in the model, it has a stronginfluence on the simulated temperature profile. The temperature maximum goes downand the slopes before and after the maximum become steeper. A heat loss of 20 Wat the wall (brown squares in Figure. 5.16) gives almost perfect agreement in termsof slope after the maximum but then the temperature maximum itself falls below theexperimental value. If an attempt is made to bring the temperature maximum backup by turning off radiation losses at the front and back face of the catalyst foam, atemperature profile far above the measured one results. Even with 30 W heat lossesat the wall, a temperature maximum of almost 2200 K is predicted if radiation lossesare neglected (blue dots Figure 5.16).
The simulation results in Figure 5.16 show how difficult it is to capture the correcttemperature profile in the foam at these high temperatures. Heat losses by radiationare very important but cannot be properly implemented in the model because the com-putational costs to also include the heat shields in the modeling domain are currentlystill too high. A shortcoming of the experiment is the ill-defined thermal boundarycondition at the wall of the reactor tube. Because the reactor wall was wrapped byinsulation material it was initially considered adiabatic in the model but the simu-lation results in Figure 5.16 show that there must be wall heat losses on the size of20 W having a distinct impact on the slope of the temperature profile. Expansionof the modeling domain to include the heat shields and a more accurate definitionof the thermal boundary conditions in the experiment will be necessary to bring thesimulated and the experimental temperature profile in agreement.
The last question that will be addressed in this work is how it is possible that meas-ured and simulated species profiles agree within statistical bounds while the measuredand simulated temperature profiles are distinctly different. Two ideas come to mindwhich are i) the reaction is film transport limited and hence not very sensitive to theunderlying kinetics and ii) the reaction is kinetically controlled but the rate limitingstep is insensitive to temperature. It will be shown in the following that both effectsare operational. The presence of film transport limitations can already be seen inFigure 5.16 which compares simulated gas and solid temperature profiles for the casesradiation + adiabatic wall and no radiation + 30 W losses at the wall (yellow line vs.orange triangles and green line vs. blue dots respectively). Because heat productionby the exothermic surface reaction is initially much faster than heat transport to thegas phase, the solid temperature at the entrance of the foam (z=0 mm) is signific-antly higher than the gas temperature. By going into the foam, the gas temperatureapproaches that of the solid and from about 3 mm on they fall on top of each other.
If heat transport limitations are present mass transport limitations can be expectedas well. Figure 5.17 shows a comparison of the surface concentration of CO, O2 andCO2 to their bulk gas phase concentration values. Due to the large pores of the foamthe surface concentration values have some discontinuities but it can be clearly seenthat in the first 3 mm of the foam the surface concentration values of the reactants CO

5.3 Results and discussion 49
0
0.02
0.04
0.06
0.08
0.1
0.12
0.14
0.16
−2 0 2 4 6 8 10
Mole
fra
ction [−
]
z−coordinate [mm]
CO
O2
CO2
surfacegas
Figure 5.17: Comparison of the species profiles in the gas phase and on the nearestsolid surface.
Table 5.4: Surface and gas compositions extracted from simulations at z-coordinateof 2 mm.
θCO(s) 0.022 [-]
θCO2(s) 1.11 · 10−7 [-]
θO(s) 0.0035 [-]
θC(s) 6.27 · 10−8 [-]
θPt(s) 0.9745 [-]
cCO 0.375 mol · m−3
cCO2 2.288 mol · m−3
cO2 0.178 mol · m−3
and O2 are much lower and that of CO2 much higher than their gas phase counterparts.This different concentration values show that diffusion to or from the surface limits thereaction rate to some extent but not fully. In the latter case the surface concentrationof CO and O2 would be zero. Still, the influence of diffusion reduces the temperaturesensitivity of the reaction rate because the diffusion coefficient of a molecule in the gasphase is only a weak function of temperature (D ∼ T 1.5).
To identify the rate limiting step in the catalytic cycle given in Table 5.3, a graph-ical method suggested by M. A. Vannice was applied [204]. At first, surface sitefractions of all species as well as gas phase concentrations were extracted from thesimulation results at a position close to the maximum reaction rate (z=2 mm). Thenumerical values are listed in Table 5.4. With this concentration values the local reac-tion rates of all elementary steps in the microkinetic network were calculated. Figure5.18 shows a plot of these reaction rates divided by their stoichiometric numbers on alogarithmic scale. The lowest net rate is that of O2 adsorption which equals the rateof the surface reaction step because the latter is irreversible. The CO adsorption step

50 5 Microtomography-Based CFD Modeling of A Foam Monolith
1 10
reaction rates [mol m−2
s−1
]
rCO adsorption/2
rCO desorption/2
rO2 adsorption
rO2 desorption
rsurface reaction/2
rCO2 desorption/2
rCO2 adsorption/2
Figure 5.18: Analysis of the rate limiting step in a reaction sequence by plottingstoichiometry normalized reaction rates computed from the concentration values listedin Table 5.4.
and CO2 desorption step are much faster and kinetically irrelevant. To distinguishwhether the O2 adsorption step or the surface reaction step is rate limiting speciesprofiles were calculated for increasing O2 sticking coefficients and for increasing pre-exponential factors of the surface reaction step. Figure 5.19 summarizes the results.
If the sticking coefficient of O2 is increased, as shown in the upper plot of Figure5.19, the profiles become steeper. If the pre-exponential factor of the surface reactionstep is increased, as shown in the lower plot of Figure 5.19, the profiles do not change.This clearly shows that the adsorption of O2 on the Pt catalyst is the rate limitingstep under the high temperature reaction conditions encountered in the foam. ThatO2 adsorption is rate limiting can also be seen by plotting surface site fractions of themost abundant surface species Pt(s) and CO(s) on the foam surface (Figure. 5.20).The surface is basically empty. Almost all Pt sites are free because any adsorbingmolecules CO and O2 molecules react immediately to CO2 which desorbs. Only in asmall strip right at the foam inlet where the catalyst surface is convectively cooled bythe incoming gases can a measurable CO(s) coverage exist (∼ 7 %).
With this analysis it becomes clear why the simulated species profiles can fit nicelyto the measured species profiles while the simulated temperature profile is quite dif-ferent from the measured one. On the one hand the reaction rate is influenced byfilm diffusion which reduces the temperature sensitivity already. On the other handand more importantly the non-activated O2 adsorption is rate limiting and the onlytemperature dependence of this step is given by Equation 3.70 (∼ T 0.5) and henceeven lower than that of diffusion.
5.4 Conclusions
CFD simulations of catalytic reactors become more and more popular because theyare in many aspects superior to conventional pseudo-homogeneous and heterogeneous

5.4 Conclusions 51
0
0.02
0.04
0.06
0.08
0.1
0.12
0.14
0.16
−5 0 5 10 15
Mole
fra
ction [−
]
z−coordinate [mm]
CO
O2
CO2
Si: 0.023
Si: 0.115
Si: 0.23
0
0.02
0.04
0.06
0.08
0.1
0.12
0.14
0.16
−5 0 5 10 15
Mole
fra
ction [−
]
z−coordinate [mm]
CO
O2
CO2
A: 3.70·1021
A: 1.85·1022
Figure 5.19: Top: Variation of the O2 sticking coefficient (Si) shows that O2 ad-sorption is the rate limiting step for CO oxidation on Pt at the high temperatureconditions of this study. Bottom: Variation of the pre-exponential factor (A) of thesurface reaction step CO(s) + O(s) → CO2(s) + Pt(s) has no effect on the simulatedprofiles. This step is fast and kinetically irrelevant at the conditions of this study.

52 5 Microtomography-Based CFD Modeling of A Foam Monolith
Figure 5.20: Illustration of the surface site fraction of the Pt sites (left) and adsorbedCO(s) species (right).
reactor models. They produce 2D or even 3D concentration-, flow- and temperaturefields which are almost impossible to measure. If coupled with microkinetic reactionmodels CFD simulations even allow computing 3D pictures of surface coverages. Meas-urements are often restricted to what flows into the reactor and what comes out of it(‘in-out’ data). What happens inside the reactor remains hidden. CFD simulationsof catalytic reactors can provide this much-wanted insight but the question is howrealistic the simulation data are and how to validate them against experiments.
The present work is a critical comparison between CFD simulation results andsub-millimeter resolved species and temperature profiles measured through a catalyticfoam monolith. Profile data have a much higher information content than conventional‘in-out’ data and are therefore a much more stringent touchstone for model validation.CO oxidation on Pt nanoparticles with narrow size distribution supported on an α-Al2O3 foam was chosen as simple catalytic system with well known microkinetics. Tokeep uncertainties in the CFD geometry as small as possible, the structure of the foamcatalyst was resolved by X-ray microtomography. Simulation parameters and bound-ary conditions were determined as accurately as possible. To validate the simulationresults, concentration and temperature profiles were measured in a dedicated reactorsetup on the very same foam of which the geometry was determined by X-ray tomo-graphy. To the best of our knowledge, it is the first time that such a comparison ismade. It allows a critical assessment of strengths and weaknesses of both, the modeland the experiment and can serve as basis for a knowledge based design of processesemploying catalytic foams or similar random geometries.
The simulations reveal very inhomogeneous flow, temperature and concentrationfields inside the foam due to the random nature of the foam structure and the complexinterplay between flow, heat transport and heterogeneous chemistry. These local in-homogeneities challenge the accuracy of the unit cell approach for simulating catalyticfoams which assume a regular structure. µ-CT based CFD simulations are there-fore more realistic but of course much more expensive and restricted to rather smallsamples. By varying the Acat/Ageo ratio, a parameter describing the density of Pt siteson the foam catalyst, the simulated and measured species profiles could be brought inclose agreement while the simulated and measured catalyst temperature profiles couldnot. This at first contradicting result could be rationalized by showing that the reac-tion rate is partly controlled by film diffusion and kinetically limited by O2 adsorption.

5.4 Conclusions 53
Both steps are rather insensitive to the catalyst temperature. An Acat/Ageo ratio of0.03 described the measured species profiles best. This value is much lower than thevalue of 0.4 determined by SEM image analysis implying that either the sticking coef-ficient of O2 is too high in the kinetic model or that the Pt site density is lower thansuggested by SEM image analysis. The latter could be due to the non-accessibility ofthe Pt atoms in contact with the α-Al2O3 support, platinum losses under reaction con-ditions or a reduced particle density in cracks and kinks of the support not capturedby SEM image analysis.
To rationalize the mismatch between simulated and measured catalyst temperaturethe contribution of heat transport by conduction and radiation and the occurrence ofheat losses through the reactor wall were explored in a series of simulations. Whileheat transport by conduction in the struts of the foam is negligible, radiation andheat losses through the reactor wall have a strong influence on the temperature profile.Neglecting radiation in the model leads to unreasonably high temperatures in the foam,way above what is measured. Considering radiative heat transport and radiative lossesat the front and back face of the foam brings the temperature maximum down to whatis measured but the slopes of the measured and simulated catalyst temperature profilesdiffer still substantially. Heat losses through the reactor wall are one cause of that.Despite thick insulation of the reactor tube about 20 W of heat are lost through the walland the initial assumption of an adiabatic wall turned out to be incorrect. The othercause for the mismatch between simulated and measured catalyst temperature profilesare the missing heat shields in the model. With the computer hardware available itwas simply not feasible to include them in the computational domain.
In summary it can be said that CFD simulations provide detailed insight into thechemical and physical processes inside catalytic reactors. No experimental method canprovide comparable data. However, simulation results are only as good as the modelfrom which they are produced and many parameters and boundary conditions mustbe specified in this type of simulations to obtain meaningful results. This requiressometimes to extent the computational domain beyond the frontiers of the possible.However computational power is every increasing and it is only a matter of timebefore CFD simulations will become the standard design tool in catalytic reactionengineering.

6Packing Study: DEM
Simulations and Validations
Fixed-bed reactors are typically packed bydropping particles in a random fashion. Dueto the stochastic nature of the random pack-ing process, duplicating experimental packingby computer model is not possible. Instead,a statistical representation by applying Dis-crete Element Method (DEM) has gain muchattention since it offer a cost-effective wayto mimic the experimental packing processclosely [61].
In this work, random packings of bothspherical and Raschig ring types of packing infixed-bed reactors were modeled in the com-mercial software STAR-CCM+ [140]. Figure6.1 illustrates a typical DEM simulation workflow. Particles were injected from the top ofthe reactor with randomized angular velocity and orientation and fall due to gravity.In order to accelerate the falling process, an initial velocity of 1 m/s was applied to theparticles. Particles may collide with each other and the wall and settle layer by layer.Constant particle flow is injected to the reactor until the pre-set maximum numberis reached. The packing generation was finished when all the particles were restingwhich means all the particles had a nearly zero velocity. In order to gain confidenceof the DEM predictions for fixed-bed reactors with low D/d ratio in which the walleffects are dominant, radial porosity profiles of simulated packings are compared toexperimental data available in literature and in-house measurement.
6.1 Spherical packings
For spherical packings, DEM simulations were conducted by injecting glass spheresof 3 mm in diameter into a cylindrical container of 17.88 mm in diameter (D/d ratioof 5.96) and 21 mm (D/d ratio of 7, used for heat transfer simulation in Chapter7). The particle-particle and particle-wall interactions were described by the Hertz-
This chapter is adopted from publications: Y. Dong, B. Sosna, O. Korup, F. Rosowski, R. Horn,Investigation of radial heat transfer in a fixed-bed reactor: CFD simulations and profile measurements,Chemical Engineering Journal 317 (2017) 204-214. Submitted manuscript: Y. Dong, M. Geske, O.Korup, N. Ellenfeld, F. Rosowski, R. Horn, What happens in a catalytic fixed-bed reactor for n-butaneoxidation to maleic anhydride? Insights from spatial profile measurements and particle resolved CFDsimulations. Submitted to Chemical Engineering Journal, 2018.

6.1 Spherical packings 55
Figure 6.1: Example illustration of a general work flow in a DEM simulation.
Mindlin model as discussed in Section 3.2.1. The material properties were taken fromthe built-in material database from STAR-CCM+ [140] of glass. The radial porosityprofiles were analyzed in the following way: Firstly, the container coordinates r, z, θwere discretized in 100 points in radial direction r, 200 points in height z and 360 pointsin azimuthal direction θ. Secondly, the distance between the coordinate of each pointand the coordinate of the centroid of each sphere was calculated. The sphere centroidswere extracted from the DEM simulations. If the calculated distance is smaller orequal to the sphere radius, the porosity is set to zero, otherwise the porosity is set toone. Thirdly, for a given magnitude of the radial coordinate, the porosity values wereaveraged over all z and θ values.
The resulting radial profiles are shown in Figure 6.2 and 6.3. Good agreement isfound between our DEM simulated profile and experimental data from Mueller [205]for a D/d ratio of 5.96. Except for some points in the center of the packing also thecorrelation suggested by de Klerk [206] is in good agreement with our DEM porosityprofiles and the experimental data reported by Mueller [205].
The correlation from de Klerk [206] is used to generate porosity profiles for theD/d = 7 ratio investigated in this work in terms of heat transfer (Chapter 7) for whichno experimental porosity data could be found in the literature. The DEM simulatedporosity profiles were calculated as described above and additionally by analyzingthe volume mesh data (denoted as ‘DEM, mesh’ in Figure 6.3). For the mesh basedanalysis, the positions of the centroid of each particle from DEM simulations wereextracted and the packing was reconstructed in the CAD module in a new simula-tions. Voids between the particles were volume meshed with polyhedral mesh and‘local flattening’ method [26] as discussed in Section 3.2.2. The meshed bed structurewas then circumferentially sliced at different radial positions and the averaged radialporosity profiles were obtained as the surface area of the slice divided by the total area(rectangular surface). An example cut plane is shown in Figure 6.4.
Both analysis methods give almost identical profiles with minor deviations in the
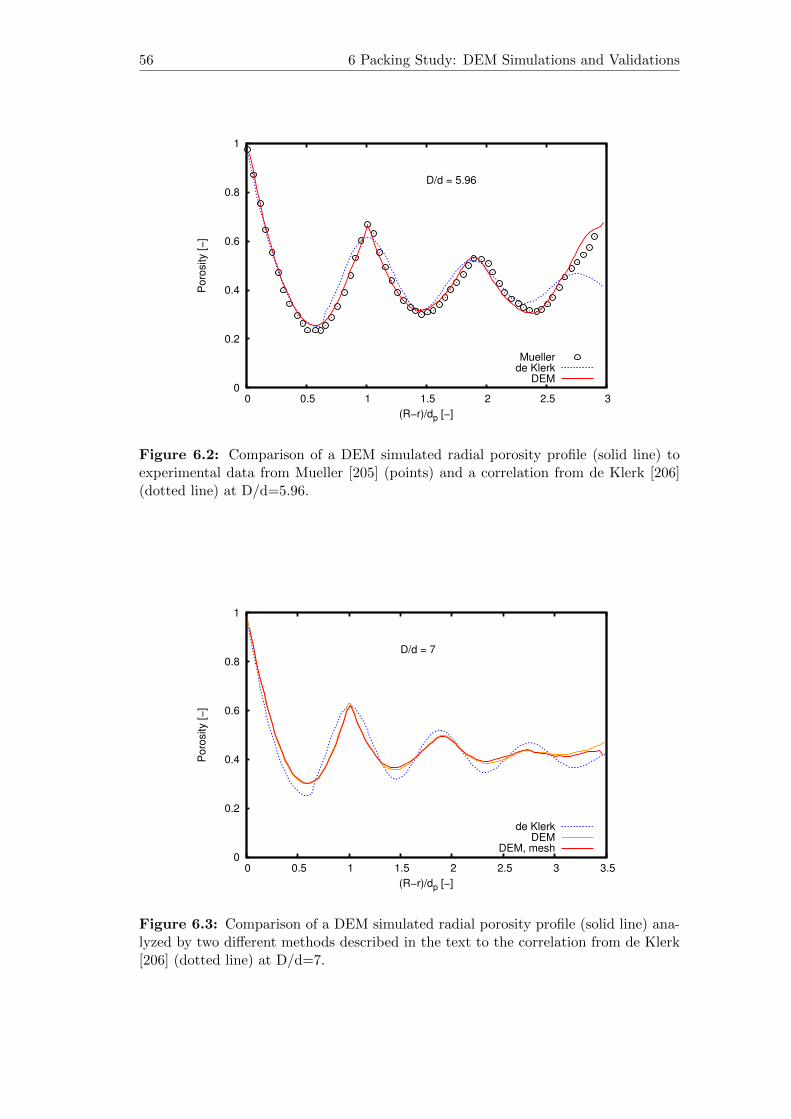
56 6 Packing Study: DEM Simulations and Validations
0
0.2
0.4
0.6
0.8
1
0 0.5 1 1.5 2 2.5 3
Poro
sity [−
]
(R−r)/dp [−]
D/d = 5.96
Muellerde Klerk
DEM
Figure 6.2: Comparison of a DEM simulated radial porosity profile (solid line) toexperimental data from Mueller [205] (points) and a correlation from de Klerk [206](dotted line) at D/d=5.96.
0
0.2
0.4
0.6
0.8
1
0 0.5 1 1.5 2 2.5 3 3.5
Poro
sity [−
]
(R−r)/dp [−]
D/d = 7
de KlerkDEM
DEM, mesh
Figure 6.3: Comparison of a DEM simulated radial porosity profile (solid line) ana-lyzed by two different methods described in the text to the correlation from de Klerk[206] (dotted line) at D/d=7.

6.2 Raschig ring packings 57
Figure 6.4: Example cut plane of a spherical packing (left) and a Raschig ringpacking (right) for evaluating the mesh based porosity profiles.
bed center indicating that the meshed structure represents the packing very well andthat the ‘local flattening method’ has only a small effect on the porosity. Also, theDEM simulated porosity profile for D/d=7 follows closely the periodicity of the corre-lation from de Klerk [206] with small deviations in amplitude. The deviations increasetowards the center of the packing due to the vanishing ordering effect of the wall[206]. Another possible cause of deviations is that the DEM simulated packing is not‘perfectly dense’ in the sense of ‘hammering’ or ‘shaking’ the container as done in apacking experiment. In the DEM simulations the particles just drop into the containerwithout any additional measures to densify the packing.
6.2 Raschig ring packings
For modeling Raschig ring packings in DEM simulations, the Raschig rings were ap-proximated by a full cylinder with the same outer diameter and height as the ring.Contact forces between particles and particle with walls were modeled by the linerspring contact model [140]. The mesh based method is used to evaluate the radialporosity profiles. Unlike for spherical packings, radial porosity profiles for Raschigrings are scarce and no general agreement has been reached for correlations [24]. Gieseet al. [134] have reported porosity data for glass ring packings (do/di/h = 8/6/8 mm)in a container with 80 mm diameter (D/d=10). This packing was simulated twice byDEM with the same parameters and settings.
Comparison with the experimental data reported by Giese et al. [134] is shownin Figure 6.5. Taking the stochastic nature of the packing process into account, theagreement between DEM simulation and experiment is fair. The periodicity of theporosity profile is nicely reproduced with some deviations in absolute values. In theDEM simulations the particles are dropped from the top of the container at randomizedpositions and randomized angular velocity. Perfect agreement of repeated simulationscan therefore not be expected but the ordering effect of the wall leads to very similarsimulation results close to the wall. Towards the center of the bed random fluctuationsof the porosity values from repeated simulations occur.

58 6 Packing Study: DEM Simulations and Validations
0
0.2
0.4
0.6
0.8
1
0 0.5 1 1.5 2 2.5 3 3.5 4 4.5 5
Poro
sity [−
]
(R−r)/dp [−]
GieseDEM
DEM, 2nd
Figure 6.5: Comparison of DEM simulated radial porosity profiles (repeated twice)to experimental data reported by Giese et al. [134] for glass ring packings (do/di/h =8/6/8 mm) in a cylindrical container with 80 mm diameter (D/d=10).
Since no literature radial porosity data can be found for packings with low D/dratio as for industrial reactor for n-butane oxidation, experimental measurement hasbeen conducted with the VPP catalyst pellets (master thesis from Nils Ellenfeld [89]).First, packing of an empty tube was studied by filling an empty acrylic glass tube of 21mm inner diameter with hollow cylinders of the VPP catalyst (Packing 1, not shown).In a second study, the influence of the central sampling capillary and additional fiberBragg gratings for temperature measurements running through the reactor tube atdifferent radial coordinates was studied (Packing 2). An acrylic glass tube, again of21 mm inner diameter, was fitted with a concentric acrylic glass tube (do = 3 mm)simulating the central sampling capillary. Three additional acrylic glass tubes (do =1 mm) 5.5 mm, 7.5 mm and 9.5 mm away from the center and at an angle of 120 relative to each other were used to simulate the fiber Bragg gratings (Packing 2,Figure. 6.6). Catalyst pellets were then filled in between these components, both inthe laboratory and by DEM simulation.
Figure 6.7 and Figure 6.8 illustrate how the porosity profiles were then determined.After filling the acrylic glass tubes with catalyst pellets up to a height of approximately10 cm, opacified resin was carefully filled in the voids without that air-bubbles weretrapped in the packing. After five to seven days, the resin was completely hardened. Inthe next step, the hardened packings were cut into 40 slices, each approximately 2 mmthick. Each slice was then photographed from bottom and from top. The resulting 80images were analyzed in the software GIMP [207]. Up to 18 radial positions with aradial step width of ∆r = 0.5 mm were analyzed as shown in Figure 6.8. By countingthe number of black pixels (solid phase) and white pixels (void), 80 radial porosityprofiles were obtained, which, after averaging, gave a representative radial porosityprofile of the packing [89].
The model parameters used for simulating these two packings are listed in Table6.1. Even if physical properties required as input for DEM simulations are unknownor uncertain, e.g. friction coefficients of the catalyst pellets [58, 143], their influence

6.2 Raschig ring packings 59
Figure 6.6: Illustration of the simulated (left) and experimental (right) packing ofthe reactor tube with central sampling capillary and three fiber Bragg gratings fortemperature measurements (Packing 2).
Figure 6.7: Work flow to determine radial porosity profiles: Acrylic glass tube withcatalyst pellets (left). Packing filled with opacified and hardened resin (middle). Sli-cing of the packing into 40 slices of 2 mm thickness (right).

60 6 Packing Study: DEM Simulations and Validations
Figure 6.8: Image analysis of a photograph of a slice to obtain radial porosity profiles.
Table 6.1: Parameters used in the DEM simulations of VPP catalyst.
Property Wall Particle
Density [kg/m3] 2500 2645
Poission’ ratio [-] 0.235 0.225
Young’s modulus [MPa] 78500 17000
Static friction coefficient [-] 0.2 0.2
Normal restitution coefficient [-] 0.9 0.9
Tangential restitution coefficient [-] 0.5 0.5
Coefficient of rolling resistance 0.002 0.002

6.2 Raschig ring packings 61
0
0.2
0.4
0.6
0.8
1
0 1 2 3 4 5 6 7 8 9 10 11
po
rosity / −
radial position / mm
exp, this workDEM
DEM, 2ndDEM, 3rdDEM, 4th
0
0.2
0.4
0.6
0.8
1
1 2 3 4 5 6 7 8 9 10 11
poro
sity / −
radial position / mm
exp.DEM
Figure 6.9: Top: Comparisons between simulated (lines) and measured (symbols)radial porosity profiles of Packing 1 (empty tube). Porosity profiles of four repeatedDEM simulations are plotted to demonstrate the reproducibility and stochastic natureof the packing process. Bottom: Comparisons between simulated (lines) and measured(symbols) radial porosity profiles of Packing 2 (tube with central sampling capillaryand three fiber Bragg gratings). Gray dotted lines indicate the positions of the extrathin tubes simulating three fiber Bragg gratings.

62 6 Packing Study: DEM Simulations and Validations
on the final packing is not too pronounced unless particle-fluid interactions or particlebreakage are goal of the simulation. In fact it becomes common practice to takethese parameters as calibration factors to reproduce the experimental porosity profiles[49, 58, 61].
The simulated and measured radial porosity profiles of the studied two packingsare plotted in Figure 6.9. The experimental values are displayed as height-averagedmean values with error bars indicating the fluctuations of the porosity values alongthe bed. Simulation values are present as height-averaged values. For Packing 1, foursimulation results are plotted to illustrate the reproducibility of the DEM simulations.Some difference is observed between the simulations due to the stochastic nature ofthe random packing. Similar behaviours are also observed for spherical packings inour earlier work [27].
The results are as follows. Close to the wall, porosity values are very high, thesimulated porosity profiles agree well with the experimental one, experimental errorbars are small and repeated simulations produce almost identical results. All of thisis due to the ordering effect of the wall. In Packing 1, this wall ordering effect fadesaway towards the bed center, the porosity fluctuates around 0.55 and variations inthe experimental data and among repeated simulations become larger. For Packing 2,the sampling capillary in the center of the reactor tube introduces another wall andleads to increased porosity values close to it. The disturbances of the thin fiber Bragggratings are negligible.
6.3 Conclusions
Computer generated random packings by discrete element method are studied in thischapter. DEM simulation mimics the experimental filling process by dropping particlesfrom the top of the container with randomized inject position, angular velocity as wellas initial rotation for non-spherical particles. The packing structures generated fromDEM simulations are verified by comparing the height-averaged radial porosity pro-files from simulations with experimental data. DEM simulations have been validatedas a reliable tool for generating realistic spherical and ring type packings at variousD/d ratios. Two methods are used to evaluate the radial porosity profile of sphericalpacking: analytical and mesh based. Both methods give almost the same result indic-ating the meshing strategy used in this work has minimized influence on the resultingbed structure.
High porosity values are found in the vicinity of the container wall for both pack-ings. This is due to the wall ordering effects which damps away towards the packingcenter. Due to the stochastic nature of random packings, DEM simulations with thesame input generate not identical packings. Radial porosity profiles from repetitivesimulations show same profile shape with minor difference towards the center wherewall effect are less pronounced.
Packings of VPP catalyst pellets in an acrylic container with same diameters asthe profile reactor (Chapter 8) have been investigated numerically and experimentally.In addition, the influence of possible extra sampling instruments to the packing isalso studied. For both scenarios, good agreement has been found between simulatedand measured radial porosity profiles and the influences of extra wall to the packingare well captured by the DEM simulations. In summary DEM generated packingsreproduce the experimental packings within stochastic bounds. It can be concludedthat packing and meshing are physically sound and can be used for particle resolvedCFD simulations of fixed-bed reactors at small D/d ratios.
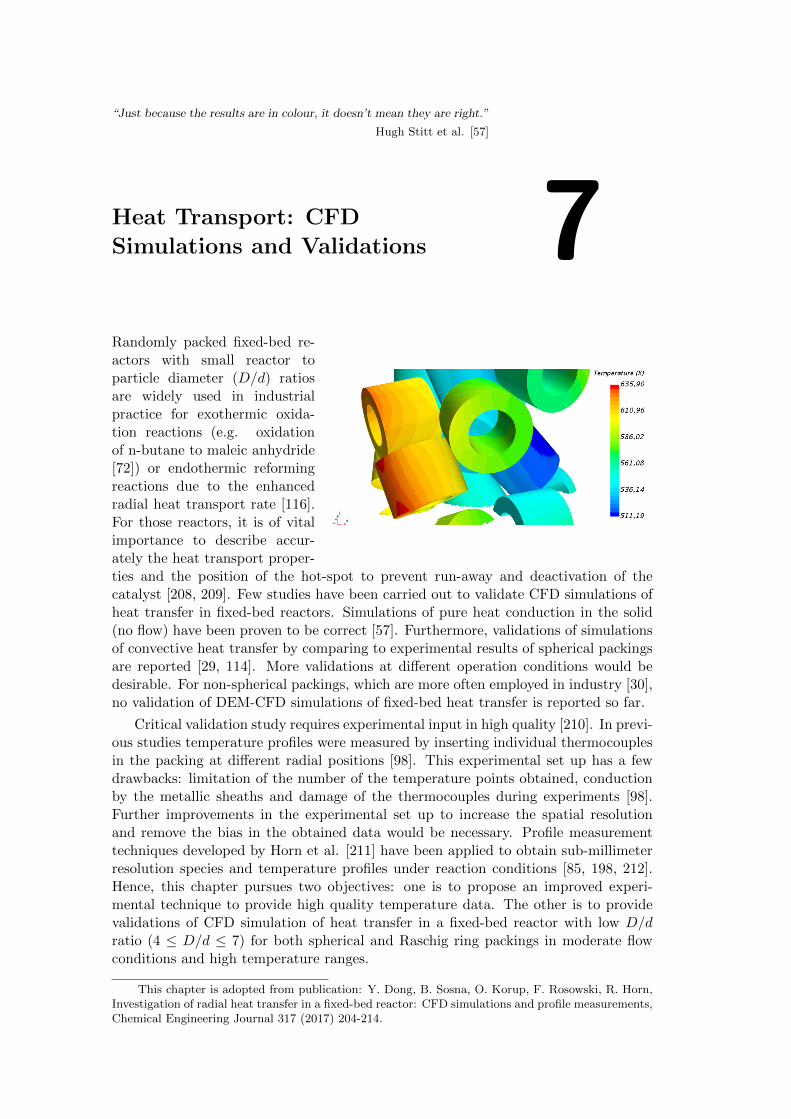
“Just because the results are in colour, it doesn’t mean they are right.”
Hugh Stitt et al. [57]
7Heat Transport: CFD
Simulations and Validations
Randomly packed fixed-bed re-actors with small reactor toparticle diameter (D/d) ratiosare widely used in industrialpractice for exothermic oxida-tion reactions (e.g. oxidationof n-butane to maleic anhydride[72]) or endothermic reformingreactions due to the enhancedradial heat transport rate [116].For those reactors, it is of vitalimportance to describe accur-ately the heat transport proper-ties and the position of the hot-spot to prevent run-away and deactivation of thecatalyst [208, 209]. Few studies have been carried out to validate CFD simulations ofheat transfer in fixed-bed reactors. Simulations of pure heat conduction in the solid(no flow) have been proven to be correct [57]. Furthermore, validations of simulationsof convective heat transfer by comparing to experimental results of spherical packingsare reported [29, 114]. More validations at different operation conditions would bedesirable. For non-spherical packings, which are more often employed in industry [30],no validation of DEM-CFD simulations of fixed-bed heat transfer is reported so far.
Critical validation study requires experimental input in high quality [210]. In previ-ous studies temperature profiles were measured by inserting individual thermocouplesin the packing at different radial positions [98]. This experimental set up has a fewdrawbacks: limitation of the number of the temperature points obtained, conductionby the metallic sheaths and damage of the thermocouples during experiments [98].Further improvements in the experimental set up to increase the spatial resolutionand remove the bias in the obtained data would be necessary. Profile measurementtechniques developed by Horn et al. [211] have been applied to obtain sub-millimeterresolution species and temperature profiles under reaction conditions [85, 198, 212].Hence, this chapter pursues two objectives: one is to propose an improved experi-mental technique to provide high quality temperature data. The other is to providevalidations of CFD simulation of heat transfer in a fixed-bed reactor with low D/dratio (4 ≤ D/d ≤ 7) for both spherical and Raschig ring packings in moderate flowconditions and high temperature ranges.
This chapter is adopted from publication: Y. Dong, B. Sosna, O. Korup, F. Rosowski, R. Horn,Investigation of radial heat transfer in a fixed-bed reactor: CFD simulations and profile measurements,Chemical Engineering Journal 317 (2017) 204-214.

64 7 Heat Transport: CFD Simulations and Validations
Table 7.1: Physical properties of the packing materials used in experiments of meas-uring radial heat temperature profile.
packing type geometry parameters thermal conductivity
[mm] [W/m/K]
glass spheres d: 3 1.4
steatite rings do/di/h: 6.2/3.5/4.5 2.5
7.1 Experimental details
A pilot-scale fixed-bed reactor of 21 mm inner diameter, with side ports for samplingin radial direction, was employed. A fused silica capillary (0.7 mm inner and 0.85mm outer diameter) was placed in the side port. A type K thermocouple (0.5 mmdiameter) was inserted in the capillary and the loose end was fixed on a linear axiswith a stepper motor. This setting allowed the thermocouple to be moved throughthe reactor in radial direction with a resolution of 10 µm. With this procedure radialtemperature profiles for two different angular positions were obtained. Figure 7.1illustrates the experimental set up where the capillary is magnified for illustrationpurpose (master thesis of Bahne Sosna [90]).
Synthetic air (mixture of 80 % nitrogen and 20 % oxygen) pre-heated to 60 Centered the reactor from the top. The reactor wall was heated by electrical heatersto 400 C. Due to the fixed position of the side sampling port and fast flatteningtemperature profiles in the investigated system, only a short bed was packed withoutcalming section. Two packing materials were used: glass spheres and steatite rings.The geometry and physical properties are given in Table 7.1. The packing height ofthe glass spheres was 3.4 cm and 6.6 cm whereas for steatite rings it was 6.0 cm and9.4 cm above the sampling position. There was approximately 9.5 cm packing underthe sampling position to avoid the influence of the metal holder and mixing effectof the gas stream. Measurements with flow rates of 10 and 15 l/min (at STP) wereconducted at steady state.
7.2 Simulation details
The random packings of glass spheres and steatite rings are generated by the discreteelement method. In the DEM simulations, both particle-particle and particle-wallinteractions are considered and described by the Hertz-Mindlin model for glass spheresand liner spring model for steatite rings (section 3.2.1) [144]. The material propertiesare taken from the built-in material database from STAR-CCM+ [140]: glass for theglass spheres and magnesium oxide for the steatite rings. The particles are injectedrandomly from the top of the reactor and fall down due to gravity. The steatite ringsare approximated by a cylinder particle with the same outer diameter and height asgiven in Table 7.1. For the injection of the cylinders, randomized angular velocity isused to mimic the experiment. The DEM simulation is stopped when all the particlesare settled i.e. when the particle velocity is almost zero.
Simulations were set up according to the experiments with the same operationparameters and packing heights. Hence, both heat transfer in the empty tube andin the packing was simulated. The influence of the capillary and the packing belowthe capillary was not considered in the simulations. The flow is non-isothermal and

7.2 Simulation details 65
Figure 7.1: Schematic illustration of the experimental set-up of measuring radial heattemperature profile. The size of the capillary is magnified for illustration purpose.

66 7 Heat Transport: CFD Simulations and Validations
Figure 7.2: Illustration of the meshed surface of a ring packing (left) and a sphericalpacking (right).
Table 7.2: Meshing parameters used in heat transfer study. The packing height forglass spheres is 3.4 cm, for steatite rings 6 cm. The extrusion mesh cells of the inletand outlet are not counted in the cell counts.
packing type particle counts base size cell counts
[-] [mm] [million]
glass spheres 444 4 4.2
3 11.8
2 29.2
steatite rings 66 4 3.6
3 5.5
2 8.8
standard conservation formulations of momentum, mass and energy were applied [114].The particle Reynolds numbers are calculated based on the volume equivalent diameterfor the Raschig rings and diameter for spheres [24]. They are in the range of 60-100,which fall in the transient range between laminar and fully turbulent flow [26]. Hence,simulations with both a laminar model and the ‘realizable k − ε’ model with ‘all y+treatment’ were conducted. This model with combined wall treatment is recommendedfor both low and high ‘y+’ situations. The physical properties of the fluid were takenfrom air and considered as temperature dependent by means of kinetic theory. Thephysical properties of the solid phase are given in Table 7.1. The following boundaryconditions were applied: velocity and temperature at the inlet and ambient pressureat the outlet. ‘No-slip’ boundary conditions were applied at the reactor wall as wellas at the particle surfaces. A fixed value of 400 C was set at the reactor wall. Allsimulations were done at steady state and were computed parallel on a computingcluster.
Mesh independence studies were carried out for a base size of 2-4 mm. Simulatedradial temperature profiles for glass spheres and steatite ring packings are given inFigure 7.3. For both packings, mesh independence is reached at a base size of 3mm. Therefore, all simulations were done with a base size of 3 mm. Meshing is thebottleneck in the whole work flow since it is highly RAM (Random-Access Memory)

7.2 Simulation details 67
460
480
500
520
540
560
580
600
620
640
660
0 0.002 0.004 0.006 0.008 0.01
T [K
]
r−coordinate [m]
BS=4 mmBS=3 mmBS=2 mm
540
560
580
600
620
640
660
680
0 0.002 0.004 0.006 0.008 0.01
T [K
]
r−coordinate [m]
BS=4 mmBS=3 mm
BS=2.5 mm
Figure 7.3: Simulated radial temperature profiles at different mesh base size for:(left) a glass sphere packing with a packing height of 3.4 cm and a volumetric flowrate of 15 l/min, (right) a steatite ring packing with a packing height of 6.0 cm and avolumetric flow rate of 15 l/min.

68 7 Heat Transport: CFD Simulations and Validations
Table 7.3: Global bed porosity of glass spheres and steatite ring packings.
packing type experimental value simulation value
[-] [-]
glass spheres 0.38± 0.066 0.46
steatite rings 0.66± 0.009 0.69
demanding. As shown in Table 7.2, refinement from a base size of 4 mm to 3 mmmore than doubles the mesh size for packing of 444 spherical particles. Thus, forfurther implementation of a higher number of particles, a trade-off between accuracyand computational efforts has to be made.
7.3 Results and discussion
In addition to comparing DEM simulated porosity profiles to correlations and exper-imental data as shown in Chapter 6, the global bed porosity of the packings used inthe present work on heat transfer was measured in a glass tube with the same innerdiameter (21 mm) as the reactor tube shown in Figure 7.1. The results are summar-ized in Table 7.3. The global porosity of the DEM simulated steatite ring packingis in good agreement with the measured value. The global porosity of the simulatedglass sphere packing is higher than the measured value. Possibly the rate of droppingparticles into the container is higher in the DEM simulation than in the experimentresulting in slightly ‘looser’ packings. However, also the experimental error bar forthe glass sphere packing is much higher than for the steatite rings indicating that alsothe experimental values are prone to error. Overall the results presented above arereassuring that the DEM simulations conducted in the present work generate realisticparticle packings for the simulations presented in the following.
Typical velocity- and temperature fields of sphere and steatite ring packings fromthe particle-resolved CFD simulations are shown in Figure 7.4 and Figure 7.5, re-spectively. For both packings, local inhomogeneities in the velocity fields are observed[213]. Channeling or bypass is found near the wall and in areas where the packing isloose. At some points, especially in the wake of the particles, the velocity is very lowor the gas is even stagnant. These observations are typical for flow inside fixed-bedswith small D/d ratio [26, 114, 118]. In reactors employing such packings wall effectsare high and the internal flow is far from plug-flow [97]. The local inhomogeneity ishigher for the steatite ring packing due to the low D/d ratio (around 4) and arbitraryorientation. In Figure 7.5, many local voids with high velocity can be seen, whereasstagnant zones are visible inside the rings and in places where the packing is moredense [118].
The temperature field in each packing ‘maps’ the velocity field closely. Lowertemperature spots can be seen where the local velocity is high and vice versa. Theinhomogeneity in the temperature field of a steatite ring packing is much higher thanin a sphere packing. As shown in Figure 7.5, the shape of some individual particlescan even be recognized in the temperature field. In contrast to the almost rotationallysymmetric temperature field in a sphere packing, there is no rotational symmetry inthe temperature field of a steatite ring packing. Hence, it is difficult to reach a highenough accuracy when applying axis-symmetric two-dimensional models for steatitering packings at low D/d ratios. Particle resolved CFD simulations resolve local

7.3 Results and discussion 69
Figure 7.4: Typical velocity field (left) and temperature field (right) of a sphericalpacking. The packing height in this example is 6.6 cm.
Figure 7.5: Typical velocity field (left) and temperature field (right) of a ring packing.The packing height in this example is 6.0 cm.

70 7 Heat Transport: CFD Simulations and Validations
0
50
100
150
200
250
300
350
400
0 0.01 0.02 0.03 0.04 0.05 0.06 0.07
rela
tive
pre
ssu
re [
Pa
]
z−coordinate [m]
6.6 cm, 10 l/min
6.6 cm, 15 l/min
3.4 cm, 10 l/min
3.4 cm, 15 l/min
glass sphere
laminarturbulent, k−ε
Ergun
Figure 7.6: Simulated pressure drop of glass sphere packings with laminar model(squares) and k − ε model (points) compared to the Ergun equation (lines).
velocity and temperature inhomogeneities in ring packings much better.
In order to gain confidence of the prediction of the turbulence model with thewall treatment function used in this work at low particle Reynolds numbers, laminarsimulations were also conducted. The pressure drop along the center line of the bedis sampled for all packings and flow rates for both glass spheres and steatite rings.
Comparisons of the predicted pressure drop are presented in Figure 7.6 and Figure7.7. The laminar and the turbulence model give almost identical results, both for theglass spheres and for the steatite rings. This indicates that in the studied flow regime(Rep = 60−100), the turbulence effects are very small and that the flow behaves almostlaminar. Also the low values of y+ (< 1) found after initializing the simulations pointin this direction. More important than the choice of the flow model at low Rep numbersis the packing structure. For sphere packings, up to 350 Pa pressure drop is observedin good agreement with the Ergun equation based on the simulated global porositylisted in Table 7.3. For the steatite rings the porosity is higher and the pressure dropis lower. In contrast to the well established Ergun equation for sphere beds no reliablecorrelation exists for ring packings.
Figure 7.8 compares CFD simulations and experimental radial temperature profilesof glass sphere packings at different bed heights and different inlet volumetric flowrates. The experimental values are taken as average of the two values measured at thesame radial positions. The original experimental data have a resolution of 10 µm. Forillustration purpose, only data points at every 500 µm are plotted. The simulationresults are evaluated as circumferential average of the fluid temperature at differentradial positions. Simulation results of both the laminar model and the turbulence‘k − ε’ model are presented. For one set of conditions: packing height of 3.4 cm andflow rate of 10 l/min, a turbulent ‘k − ω’ simulation was conducted. As can be seenin Figure 7.8 all three models give very similar radial temperature profiles.
Fair agreement can be found between measurement and simulation, especially forthe packing height of 3.4 cm. Higher deviations can be found for the packing heightof 6.6 cm with a maximum temperature difference of 30 K in the bed center. Similar

7.3 Results and discussion 71
0
10
20
30
40
50
60
70
80
90
0 0.02 0.04 0.06 0.08 0.1
rela
tive
pre
ssu
re [
Pa
]
z−coordinate [m]
6.0 cm, 10 l/min
6.0 cm, 15 l/min
9.4 cm, 10 l/min
9.4 cm, 15 l/min
steatite ring
laminarturbulent, k−ε
Figure 7.7: Simulated pressure drop of Raschig ring packing with laminar model andk − ε model.
460
480
500
520
540
560
580
600
620
640
660
680
0 0.002 0.004 0.006 0.008 0.01
T [
K]
r−coordinate [m]
6.6 cm, 10 l/min
6.6 cm, 15 l/min
3.4 cm, 10 l/min
3.4 cm, 15 l/min
glass sphere
turbulent, k−ε
turbulent k−ω
laminar
Figure 7.8: Comparison of simulated radially averaged temperature profiles (lines)with experimental measurements (points) at different bed heights and flow rates forglass sphere packings.

72 7 Heat Transport: CFD Simulations and Validations
540
560
580
600
620
640
660
680
0 0.002 0.004 0.006 0.008 0.01
T [
K]
r−coordinate [m]
6.0 cm, 10 l/min
6.0 cm, 15 l/min
9.4 cm, 10 l/min
9.4 cm, 15 l/min
steatite ring
turbulent, k−ε
laminar
Figure 7.9: Comparison of simulated radially averaged temperature profiles (lines)with experimental measurements (points) at different bed heights and flow rates forsteatite ring packing.
trends are reported in earlier studies [29, 114]. Both experimental errors and modeldeficiencies may contribute to this deviations. In the investigated flow region, con-duction plays a big role [107]. Because heat is conducted from the tube wall to thebed center, a higher porosity from the DEM simulation will lead to a systematic un-derestimation of temperatures inside the packing. This systematic underestimationis less pronounced at high flow rates because convection becomes the dominant heattransport mechanism. Another systematic source of error is the meshing, where localflattening techniques are used for the contact point problem as shown in Figure 7.2.This artificially creates fluid volume in between the particles which reduces heat con-duction from the reactor wall to the particles and in between them. Also this effectresults in a systematic lower temperature profile than in reality. A third systematicerror leading to underestimation of heat transport to the bed center is omission of radi-ation. Radiation becomes important if materials are glowing but because temperaturesare low in this study (Tmax = 400 C) it was omitted here. Including radiation wouldintroduce a large number of uncertain parameters into the model like emissivities andwould make the computations even more demanding than they already are.
Figure 7.9 shows the comparison of the simulated and measured radial temperatureprofiles of the steatite ring packing at different packing heights and inlet volumetricflow rates. The missing values of the simulation data in the center (r = 0) are due tothe occupancy of the particle while only fluid temperature is sampled. The laminar andturbulent ‘k−ε’ model predict the same radial temperature profiles at the studied Rep.For this packing, good agreement is observed between simulations and experiments.
In terms of random errors, the stochastic nature of the packing process has to beconsidered. The DEM simulated packing will be different from the experimental bedand hence the experimental temperature profile will always be slightly different fromthe simulated one. To study the influence of the packing simulation on the predictedtemperature profiles, additional simulations were conducted in which physical packingparameters were varied. Figure 7.10 shows a variation of Young’s modulus for all
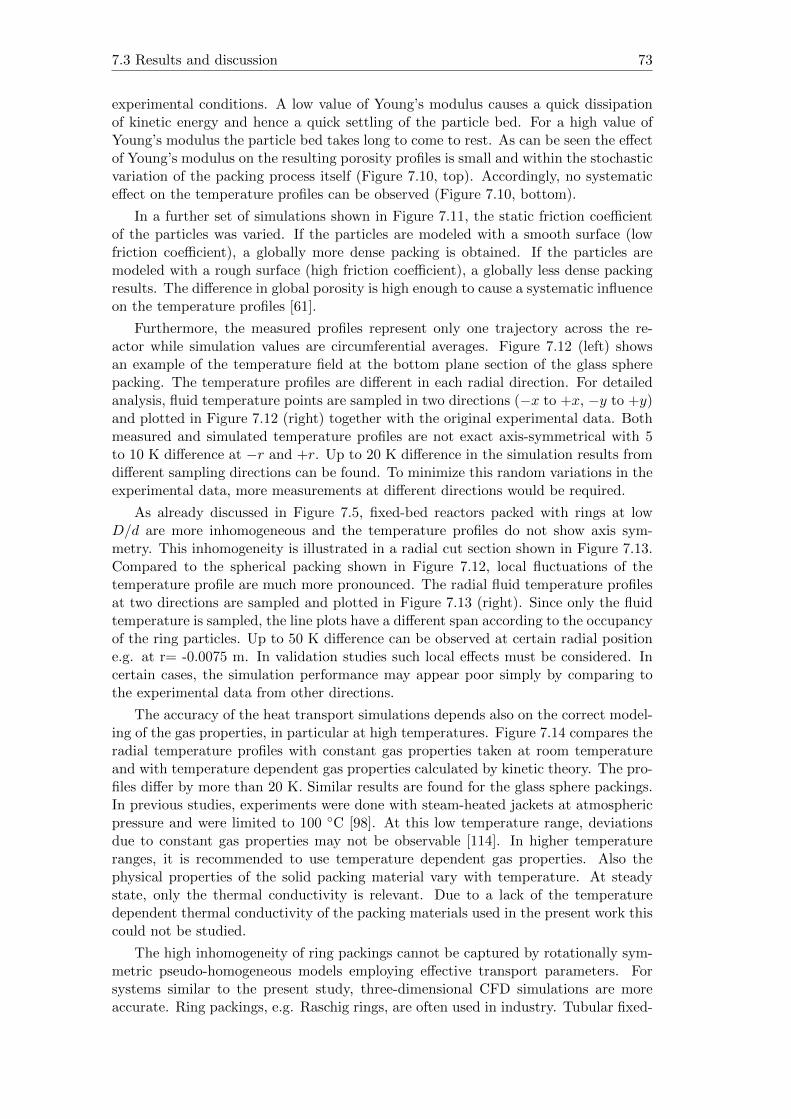
7.3 Results and discussion 73
experimental conditions. A low value of Young’s modulus causes a quick dissipationof kinetic energy and hence a quick settling of the particle bed. For a high value ofYoung’s modulus the particle bed takes long to come to rest. As can be seen the effectof Young’s modulus on the resulting porosity profiles is small and within the stochasticvariation of the packing process itself (Figure 7.10, top). Accordingly, no systematiceffect on the temperature profiles can be observed (Figure 7.10, bottom).
In a further set of simulations shown in Figure 7.11, the static friction coefficientof the particles was varied. If the particles are modeled with a smooth surface (lowfriction coefficient), a globally more dense packing is obtained. If the particles aremodeled with a rough surface (high friction coefficient), a globally less dense packingresults. The difference in global porosity is high enough to cause a systematic influenceon the temperature profiles [61].
Furthermore, the measured profiles represent only one trajectory across the re-actor while simulation values are circumferential averages. Figure 7.12 (left) showsan example of the temperature field at the bottom plane section of the glass spherepacking. The temperature profiles are different in each radial direction. For detailedanalysis, fluid temperature points are sampled in two directions (−x to +x, −y to +y)and plotted in Figure 7.12 (right) together with the original experimental data. Bothmeasured and simulated temperature profiles are not exact axis-symmetrical with 5to 10 K difference at −r and +r. Up to 20 K difference in the simulation results fromdifferent sampling directions can be found. To minimize this random variations in theexperimental data, more measurements at different directions would be required.
As already discussed in Figure 7.5, fixed-bed reactors packed with rings at lowD/d are more inhomogeneous and the temperature profiles do not show axis sym-metry. This inhomogeneity is illustrated in a radial cut section shown in Figure 7.13.Compared to the spherical packing shown in Figure 7.12, local fluctuations of thetemperature profile are much more pronounced. The radial fluid temperature profilesat two directions are sampled and plotted in Figure 7.13 (right). Since only the fluidtemperature is sampled, the line plots have a different span according to the occupancyof the ring particles. Up to 50 K difference can be observed at certain radial positione.g. at r= -0.0075 m. In validation studies such local effects must be considered. Incertain cases, the simulation performance may appear poor simply by comparing tothe experimental data from other directions.
The accuracy of the heat transport simulations depends also on the correct model-ing of the gas properties, in particular at high temperatures. Figure 7.14 compares theradial temperature profiles with constant gas properties taken at room temperatureand with temperature dependent gas properties calculated by kinetic theory. The pro-files differ by more than 20 K. Similar results are found for the glass sphere packings.In previous studies, experiments were done with steam-heated jackets at atmosphericpressure and were limited to 100 C [98]. At this low temperature range, deviationsdue to constant gas properties may not be observable [114]. In higher temperatureranges, it is recommended to use temperature dependent gas properties. Also thephysical properties of the solid packing material vary with temperature. At steadystate, only the thermal conductivity is relevant. Due to a lack of the temperaturedependent thermal conductivity of the packing materials used in the present work thiscould not be studied.
The high inhomogeneity of ring packings cannot be captured by rotationally sym-metric pseudo-homogeneous models employing effective transport parameters. Forsystems similar to the present study, three-dimensional CFD simulations are moreaccurate. Ring packings, e.g. Raschig rings, are often used in industry. Tubular fixed-

74 7 Heat Transport: CFD Simulations and Validations
0.3
0.4
0.5
0.6
0.7
0.8
0.9
1
0 1 2 3 4 5 6 7 8 9 10
Poro
sity [−
]
r [mm]
packing 1, Young’s modulus of 45000 MPa
packing 2, Young’s modulus of 0.517 MPa
steatite ring
packing 1, packing height of 6.0 cmpacking 1, packing height of 9.4 cmpacking 2, packing height of 6.0 cmpacking 2, packing height of 9.4 cm
540
560
580
600
620
640
660
680
0 0.002 0.004 0.006 0.008 0.01
T [K
]
r−coordinate [m]
6.0 cm, 10 l/min
6.0 cm, 15 l/min
9.4 cm, 10 l/min
9.4 cm, 15 l/min
steatite ring
packing 1, Young’s modulus of 45000 MPapacking 2, Young’s modulus of 0.517 MPa
Figure 7.10: DEM simulations of steatite ring packings with different values ofYoung’s modulus. Top: Porosity profiles. Bottom: Temperature profiles.
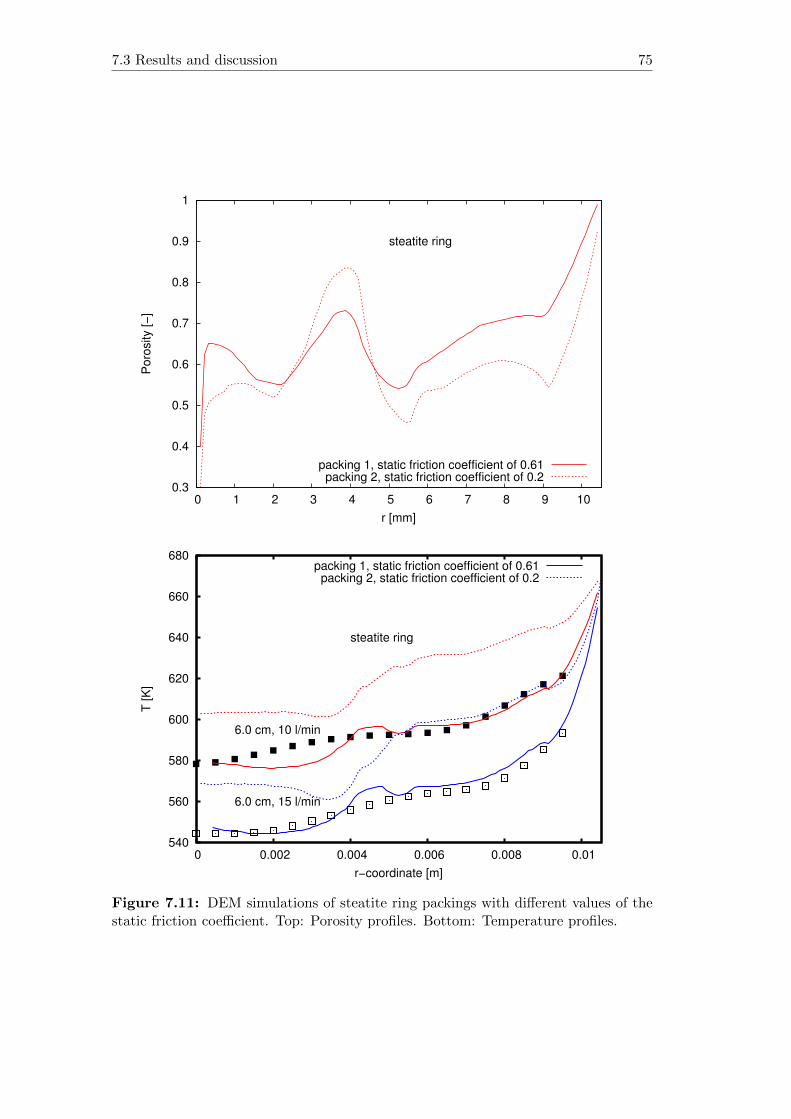
7.3 Results and discussion 75
0.3
0.4
0.5
0.6
0.7
0.8
0.9
1
0 1 2 3 4 5 6 7 8 9 10
Poro
sity [−
]
r [mm]
steatite ring
packing 1, static friction coefficient of 0.61packing 2, static friction coefficient of 0.2
540
560
580
600
620
640
660
680
0 0.002 0.004 0.006 0.008 0.01
T [K
]
r−coordinate [m]
6.0 cm, 10 l/min
6.0 cm, 15 l/min
steatite ring
packing 1, static friction coefficient of 0.61packing 2, static friction coefficient of 0.2
Figure 7.11: DEM simulations of steatite ring packings with different values of thestatic friction coefficient. Top: Porosity profiles. Bottom: Temperature profiles.

76 7 Heat Transport: CFD Simulations and Validations
520
540
560
580
600
620
640
660
680
−0.01 −0.005 0 0.005 0.01
T [K
]
r−coordinate [m]
glass sphere, 6.6 cm, 15 l/min
exp.
sim. y direction sim. x direction
Figure 7.12: Left: temperature field at the bottom plane section of the glass spherepacking (z = 1.5 mm). Right: comparison of the experimental data with the radialtemperature profiles of glass sphere packing sampled at two directions. Packing heightis 6.6 cm, inlet volumetric flow rate is 15 l/min.
520
540
560
580
600
620
640
660
680
−0.01 −0.005 0 0.005 0.01
T [K
]
r−coordinate [m]
steatite ring, 6.0 cm, 15 l/min
exp.
sim. y direction sim. x direction
Figure 7.13: Left: temperature field at the bottom plane section of the steatitering packing (z = 2 mm). Right: comparison of the experimental data with the radialtemperature profiles of steatite ring packing sampled at two directions. Packing heightis 6.0 cm, inlet volumetric flow rate is 15 l/min.

7.4 Conclusions 77
540
560
580
600
620
640
660
680
0 0.002 0.004 0.006 0.008 0.01
T [
K]
r−coordinate [m]
6.0 cm, 10 l/min
temperature dependentconstant
Figure 7.14: Effect of the gas properties on the radial temperature profiles of thesteatite ring packing. Packing height is 6.0 cm, inlet volumetric flow rate is 10 l/min.
bed reactors with low D/d are employed for highly exothermic reactions like catalyticoxidations (e.g. n-butane oxidation to maleic anhydride). Due to the heat of reac-tion, local temperature inhomogeneities might even be higher than without chemistryand the catalyst pellets packed in the same axial position might see very differentthermal environments. Because reaction rates depend exponentially on temperaturethe concentration field around a single pellet can be very different. Therefore, spatiallyresolved simulations are needed for more accurate predictions.
The critical judgement of the simulation performance is based on the high res-olution of the experimental points achieved by the profile measurement techniques[195, 211]. Even though the point density inside the bed is high, the resolution oftemperature points near the reactor wall remains a challenge. In Figures 7.8 and 7.9,the experimental points in the vicinity of the reactor wall are not presented. This isdue to the difficulty avoiding influence from the ambient air near the side samplingports. We believe with further development of profile measurement techniques, moreprecise description of heat transport in fixed-bed reactors can be achieved.
7.4 Conclusions
This chapter provides validations of the DEM-CFD approach for simulating heat trans-fer in a fixed-bed reactor with small D/d ratio at different flow rates and packingheights. Good agreement is found between the simulated and measured radial tem-perature profiles of spherical and ring type packings at different packing heights andflow rates. The DEM-CFD approach works particularly well in cases when the packingcan be accurately modeled like in this work for steatite rings. If the packing is notaccurately simulated like for long sphere packings systematic errors result. The highresolution of experimental data obtained from spatial profile measurements makes itpossible to critically evaluate the predictions of the simulations. Therefore, the profilemeasurement techniques can be a useful tool to provide insight into the reactor andto deliver high quality data for theoretical developments.

78 7 Heat Transport: CFD Simulations and Validations
Both simulation and experiment reveal the local inhomogeneity of fixed-bed re-actors with small D/d ratio especially for ring type packings which are often usedindustrially. Spatially resolved CFD simulations with computer generated packingsare superior to pseudo-homogeneous or heterogeneous models in terms of details andaccuracy. With the ever increasing computational power this type of simulations mightbecome the industry standard for future reactor modeling.

8N-butane Oxidation to Maleic
Anhydride: CFD Simulations
and Profile Measurements
N-butane oxidation to maleic anhydride (MA,Eq. 8.1) is an important catalytic oxidationprocess. In 2015 the annual worldwide MAconsumption amounted to 2.8 Mio metrictons [68]. One popular process variant em-ploys multi-tubular fixed-bed reactors filledwith catalyst pellets of vanadyl pyrophos-phate (VPP) cooled by circulating moltensalt [69, 70]. The fixed-bed process runs typ-ically at 80-85 % n-butane conversion achiev-ing an overall MA yield of about 57-65 %[72]. This unsatisfactory MA yield motivateschemists and chemical engineers to improvereactor and catalyst performance. In view ofthe large scale of the process even small im-provements translate into significant revenue[72].
C4H10 + 3.5 O2 → C4H2O3 + 4 H2O ∆HR,298K = −1240kJ
mol(8.1)
Radial heat transfer limitations require rather small reactor tubes for this exo-thermic reaction (Eq. 8.1). Typical inner diameters are on the order of a few cen-timeters. Pressure drop determines size and shape of the catalyst pellets. Hollowcylinders of bulk VPP with an outer diameter of 5-6 mm are often used. Therefore,industrial catalytic fixed-bed reactors for n-butane oxidation are characterized by smallD/d ratios (ratio of reactor diameter D to pellet diameter d). The random packing ofcatalyst pellets in reactor tubes fitting only a few particles across the tube diameterleads inevitably to pronounced local inhomogeneities. The interactions between flow,heat and mass transfer and catalytic reactions in such highly inhomogeneous packingsare of particular interest and subject of this work. High resolution spatial measure-ments of species and temperature inside the reactor combined with particle resolvedCFD modeling of chemistry and flow is a promising approach to understand the phys-ical and chemical processes inside a catalytic n-butane oxidation reactor and providea methodology for knowledge based optimization of this important industrial process.
This chapter is adopted from submitted manuscript: Y. Dong, M. Geske, O. Korup, N. Ellen-feld, F. Rosowski, R. Horn, What happens in a catalytic fixed-bed reactor for n-butane oxidation tomaleic anhydride? Insights from spatial profile measurements and particle resolved CFD simulations.Submitted to Chemical Engineering Journal, 2018.

80 8 N-butane Oxidation to Maleic Anhydride: CFD Simulations and Profile . . .
The conventional way to study catalytic reactions and to test new catalysts inthe laboratory is the ‘in-out’ approach. If concentration and temperature gradientsover the catalyst bed are kept small, it is sufficient to analyze what is flowing inthe reactor and what comes out of the reactor. A thermocouple inside the catalystbed delivers a representative temperature value. In pilot scale reactors operatingat industrial conversion levels concentration and temperature gradients are naturallypronounced. ‘In-out’ species analysis and a single temperature reading from the centerof the fixed-bed are not sufficient to resolve the gradients occurring inside the reactor.Side sampling ports equipped with thermocouples provide some spatial resolution butthe point density in regions of steep gradients is often insufficient and wall effectscompromise the representativeness of the measured concentration and temperaturevalues.
In recent years movable capillaries with side sampling orifices have been used tomeasure species profiles through laboratory fixed-bed reactors with submillimeter res-olution [85, 211, 214]. Temperature sensors or spectroscopic fibers placed inside thecapillary provide temperature profiles and spectroscopic information about the cata-lyst [215]. In the present work this methodology has been taken to pilot-scale for thefirst time. A pilot-scale profile reactor was designed and built for studying n-butaneoxidation on vanadyl pyrophosphate (VPP) pellets under industrially relevant condi-tions. The fixed-bed reactor has the same diameter (D=2.1 cm) as a single tube inan industrial multi-tubular reactor. VPP pellets of industrial dimensions were used ascatalyst packing. The catalyst bed was 50 cm in height to keep gas flow rates withinbounds.
To interpret the measured species and temperature profiles and to allow for model-based optimization the reactor was modeled by means of particle-resolved three-dimensional computational fluid dynamics (CFD) [28]. A particle-resolved CFD modelwas chosen over the more common pseudo-homogeneous models because transport cor-relations in the ‘pseudo-’ model family become inaccurate in fixed-beds at small D/dratio (below 10), especially for heat transfer and highly exothermic reactions [24, 98].Furthermore, pseudo-homogeneous or heterogeneous models are unable to reproducespikes and dips observed in the experimental profiles due to the very inhomogeneouspacking [141] and to separate reaction effects from dead zones or bypass flow.
Several factors affect the prediction performance of CFD simulations of fixed-bedreactors [57]. Besides the computer generated packing and meshing as discussed inChapter 6. The most important factor is the kinetic model [9]. Most of the publishedCFD simulation of fixed-bed reactor use microkinetics for surface reactions [80, 117,121]. The model prediction is sensitive to the value of the active site density anddiscrepancies between experiment and simulation often result because the active sitedensity of the used catalyst is different from the value in the microkinetic model. Alsothis parameter is often tuned for the simulations to match the measurements [141].
Microkinetic models consisting of sequences of elementary steps are most reliablefor metal catalysts with simple active sites, e.g. single surface atoms or monoatomicsteps, and work best at conditions where the mean field hypothesis applies, e.g. athigh temperatures. This type of kinetic model has been applied in this work formethane combustion on Pt gauze in Chapter 4 and CO oxidation on Pt loaded foamcatalyst in Chapter 5. For n-butane oxidation on vanadium phosphate catalysts noreliable microkinetic model exists. Kinetic models comprising power rate laws andLangmuir-Hinshelwood-Hougen-Watson type rate expressions do exist [216] and seemmore applicable to this rather complex catalytic reaction because catalyst propertiesare lumped together in model parameters which are obtained from fitting the modelto kinetic data [217].

8.1 Experimental details 81
Consequently a kinetic model with experimentally determined parameters was usedin the present work. The kinetic model augments the widely applied reaction schemeto incorporate acrylic and acetic acid in the network. The kinetic measurementswere done with crashed catalyst in a classic kinetic test reactor and delivered intrinsicreaction rates with negligible impact of mass and heat transfer. Since the profile meas-urements were conducted with full-size catalyst pellets, effectiveness factors had to beintroduced into the CFD model to take pore diffusion into consideration [81]. Due tothe unknown pore structure of the industrial catalyst pellet, effectiveness factors wereadjusted in the kinetic model such that for one set of operation conditions (trainingset) the predicted temperature and species profiles match the experimental profiles asclosely as possible. The model was then used to predict profiles at different operationconditions.
This approach worked well and resulted in a model with predictive power suitableto screen the space for reactor operation parameters that would give a higher maleicanhydride yield. The wall temperature profile was selected for optimization. N-butaneoxidation in fixed-bed reactors has been reported to suffer from the development ofa hot-spot temperature (max. 60 K) inside the bed [69, 71]. This hot spot shortensthe lifetime of the catalyst and promotes the combustion route to CO2 and CO [76].By optimizing the wall temperature profile of the reactor hot spot formation could beavoided and the yield to maleic anhydride could be improved.
8.1 Experimental details
Species and temperature profile measurements were carried out in a in-house developedpilot-scale fixed-bed profile reactor. A sketch of the operational principle is shown inFigure 8.1. The reactor tube had an inner diameter of 21 mm and was filled withhollow cylinders of bulk VPP catalyst to a bed height of 50 cm. The industrial VPPreference catalyst was synthesized according to Patent [218] via an organic synthesisroute using iso-butanol. A pre-packing (15 cm) of inert Raschig rings was installedto preheat the feed to the desired temperature before it enters the catalyst section.The reactor was equipped with five independent electrical heating zones as shown inFigure 8.1. Each heating zone was 12.5 cm long. The reactor could be operated atpressures up to 5 bar, was fully automized and could run unattended for extendedperiods of time.
The capillary sampling technique used to measure species and temperature profileswas based on the work of Horn et al. [211] published previously. In brief, a fused silicacapillary with a side sampling orifice runs through the center of the catalyst packing.A small amount of the reaction mixture is extracted through the side sampling orificeand sent to a GC for quantitative analysis. A thermocouple inside the samplingcapillary, tip aligned with the side sampling orifice and in direct contact with thesampled gases, measures the local gas temperature. By means of a stepper motor,the sampling capillary with the thermocouple inside, can be translated up and downalong the centerline axis of the catalyst bed, allowing for simultaneous measurementof species concentration and gas temperature profiles.
Quantitative species analysis was accomplished in two gas chromatographs (Agilent7890 B) operated sequentially reducing the total measurement time for a full profileto about 7.5 hours. The reactor profiles presented in this work have been measured byfeeding 1 % n-butane and 3 % water vapor in synthetic air to the reactor inlet. Thetotal volumetric flow rate was 5.7 ln/min and the reactor pressure was 2 bar.
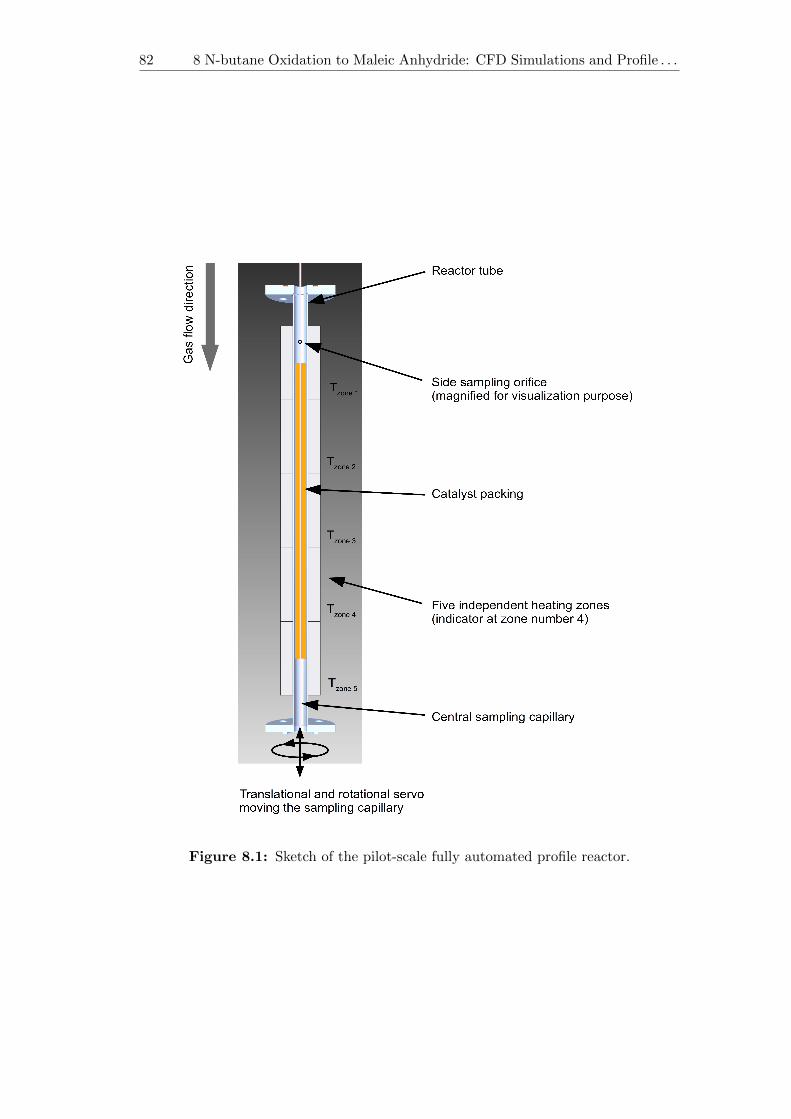
82 8 N-butane Oxidation to Maleic Anhydride: CFD Simulations and Profile . . .
Figure 8.1: Sketch of the pilot-scale fully automated profile reactor.

8.1 Experimental details 83
Figure 8.2: Left: Calculation domain and boundary conditions used for particleresolved CFD simulation. Right: translational plane plot of mesh.

84 8 N-butane Oxidation to Maleic Anhydride: CFD Simulations and Profile . . .
8.2 Simulation details
A graphic illustration of the calculation domain is shown in Figure 8.2. DEM simula-tions (cf. Section 6.2) were used to fill the reactor tube of 21 mm inner diameter withpackings of hollow VPP cylinders to a height of 50 cm representing the catalyst bed.In the center of the tube, a cylinder of 4 mm outer diameter represented the samplingcapillary. Both, the solid region and the fluid region (voids between the particles)were meshed as shown in Figure 8.2. The pre-packing used in reactor experiments wasnot considered in the CFD model. It just provided uniform inlet temperature (Tin)and inlet velocity (uin) conditions. The inlet temperature was set to the experimentaltemperature value measured at the entrance of the catalyst packing. It turned outthat the feed gas had reached the wall temperature at this point. The inlet flow velo-city was calculated from the set experimental volumetric flow rate (5.7 ln/min), inlettemperature and inlet pressure. The inlet gas composition (xin) was 1 % n-butaneand 3 % water vapor in air. A pressure boundary condition, set to 2 bar, was usedat the outlet. No-slip boundary conditions were applied at the reactor wall and thecapillary wall. In terms of temperature boundary conditions, the reactor wall wassubdivided into five zones each set to the temperature used experimentally (Figure8.2, Twall,1...Twall,5).
The particle Reynolds number at the studied operation condition is 52 and hencethe flow is calculated as laminar with standard governing equations given in Section3.2.3. All the calculations were carried out at steady state in the CFD softwareSTAR-CCM+ [140]. Since more than 90 % of the gas is air in the studied system, themolecular diffusivity is simplified to the binary diffusivity of each component in aircalculated by the Fuller equation [99]. The equations and parameters are given in Eq.3.8 and Table 3.1.
For most species, the specific heat capacity at constant pressure cp,i was computedfrom NASA polynomials built-in the thermodynamic database of STAR-CCM+ [140].For C4H2O3, C3H4O2 and C2H4O2, polynomials are not available and constant valuesof 1531 J/(kg·K), 1917 J/(kg·K) and 1933 J/(kg·K) respectively were taken from theNIST Chemistry WebBook [219]. The thermal conductivity of the mixture λ wastaken as that of air and treated as temperature dependent.
Catalytic reactions were included as boundary conditions at the surface of eachcatalyst particle (Eq. 3.65). In steady state the diffusional flux of each species normalto the surface was set equal to the catalytic consumption or production rate of therespective species [146] as discussed in Section 3.2.4. To calculate the catalytic con-sumption/production rate of each species i, the following reactions were considered:
C4H10 + 3.5 O2r1−→ C4H2O3 + 4 H2O (8.2)
C4H10 + (6.5− 2 φ1) O2r2−→ 4 φ1 CO + 4 (1− φ1) CO2 + 5 H2O (8.3)
C4H2O3 + (3− 2 φ2) O2r3−→ 4 φ2 CO + 4 (1− φ2) CO2 + H2O (8.4)
C4H10 + (3.5− 0.5 φ1) O2r4−→ C3H4O2 + φ1 CO + (1− φ1) CO2 + 3 H2O (8.5)
C3H4O2 + (3− 1.5 φ1) O2r5−→ 3 φ1 CO + 3 (1− φ1) CO2 + 2 H2O (8.6)
C4H10 + 2.5 O2r6−→ 2 C2H4O2 + H2O (8.7)
C2H4O2 + (2− φ1) O2r7−→ 2 φ1 CO + 2 (1− φ1) CO2 + 2 H2O (8.8)
The stoichiometric coefficients φ1 and φ2 were set to values of 0.556 and 0.5 re-spectively to match the experimentally observed CO/CO2 ratio. Power rate laws wereused to describe the rate of each of the seven reaction steps.

8.2 Simulation details 85
r1 = k1 · pn1C4H10
· pn2O2
(8.9)
r2 = k2 · pn3C4H10
· pn4O2
(8.10)
r3 = k3 · pn5C4H2O3
· pn6O2
(8.11)
r4 = k4 · pn7C4H10
· pn8O2
(8.12)
r5 = k5 · pn9C3H4O2
· pn10O2
(8.13)
r6 = k6 · pn11C4H10
· pn12O2
(8.14)
r7 = k7 · pn13C2H4O2
· pn14O2
(8.15)
kj = Aj · exp(−Ea,jRT
)(8.16)
Reaction orders, activation energies and pre-exponential factors were determinedby fitting the rate laws to kinetic measurements which were free of transport artifactsand conducted on crushed and sieved catalyst particles in an isothermal kinetic testreactor. The kinetic experiments covered a temperature range from 360 - 420 C, an-butane fraction from 0.5 - 2 %, an O2 fraction from 15 - 20 % as well as co-feeding3 % of water vapor. The parameters are given in Table 8.1. Details on the kineticexperiments and model parameter determination will be published in a forthcomingpaper [220, 221].
Table 8.1: Kinetic parameters for n-butane oxidation to maleic anhydride developedin house.
A1 14613 Ea,1 81740.5 n1 0.5 n2 0.42
A2 43221 Ea,2 101173 n3 0.34 n4 0.37
A3 4363.3 Ea,3 86342.2 n5 0.5 n6 0.24
A4 1.8441·109 Ea,4 155539 n7 0.83 n8 0.53
A5 1.6959·109 Ea,5 143761 n9 0.68 n10 0.33
A6 2.2077 Ea,6 51545.6 n11 0.63 n12 0.17
A7 852.07 Ea,7 91629.1 n13 0.21 n14 0.11
mol/(kg · s) J/mol - -
To convert the molar reaction rates based on mass of catalyst r1− r7 to consump-tion/production rates of each species at the surface of each catalyst particle Rheti ing ·m−2 · s−1, the following equation was used:
Rheti =7∑j=1
νijηjrjρcatalystVcatalystScatalyst
Mi (8.17)
Eq. 8.17 takes into account that diffusional resistances might exist in the full catalystpellets used in the profile reactor which are absent in the kinetic measurements oncrushed pellets. Hence an internal effectiveness factor ηj is introduced for each reactionstep. To convert reaction rates from unit mass of catalyst to unit surface as neededin Eq. 3.65 a conversion factor ρcatalyst · Vcatalyst/Scatalyst is introduced. ρcatalyst isthe experimentally determined catalyst density of 1630 kg/m3. The ratio of pelletvolume Vcatalyst to pellet surface Scatalyst was extracted from the mesh. νij is thestoichiometric coefficient of species i in reaction j and Mi denotes the molar mass of

86 8 N-butane Oxidation to Maleic Anhydride: CFD Simulations and Profile . . .
Figure 8.3: Velocity field (left), mass fraction of C4H10 (middle) and temperaturefield (right) at a uniform reactor wall temperature of 370 C predicted by particleresolved CFD simulations. The zoomed sections show details around the hot-spot.
species i. The heat generated at each surface element was calculated from
Q = Rheti · hi (8.18)
and released to the gas phase and the solid phase by conduction.
8.3 Results and discussion
Cross sections of typical flow, concentration and temperature fields at a uniform reactorwall temperature of 370 C are shown in Figure 8.3 for a packing height of 50 cm.Pronounced local inhomogeneities are observed in the flow field due to the randomarrangement of the catalyst pellets. If the hollow cylinders are oriented perpendicularto the tube axis, dead zones inside and behind them arise with flow velocities closeto zero. If the hollow cylinders are oriented parallel to the tube axis, the gas flowsthrough them very quickly. The same holds for gaps in the packing which are oftenfound near the sampling capillary because the space between capillary and tube wallfits only one pellet on average. The temperature and the concentration field in thereactor are very inhomogeneous as well because they result from an interplay betweenflow velocity, residence time, exothermic reactions and radial heat transfer. Littlebutane conversion happens in gaps and parallely oriented hollow cylinders due to highflow velocity and short contact time with the catalyst. Zones of low flow velocity, e.g.in perpendicularly oriented hollow cylinders or in the wake of catalyst particles leadto high butane conversion. In the first 10 cm of the tube, the velocity field and thebutane mass fraction field are almost a superposition of each other. The high butaneconcentration due to channelling and the increasing temperature due to the heat ofreaction lead to a high reaction rate in the upper half of the catalyst bed forming
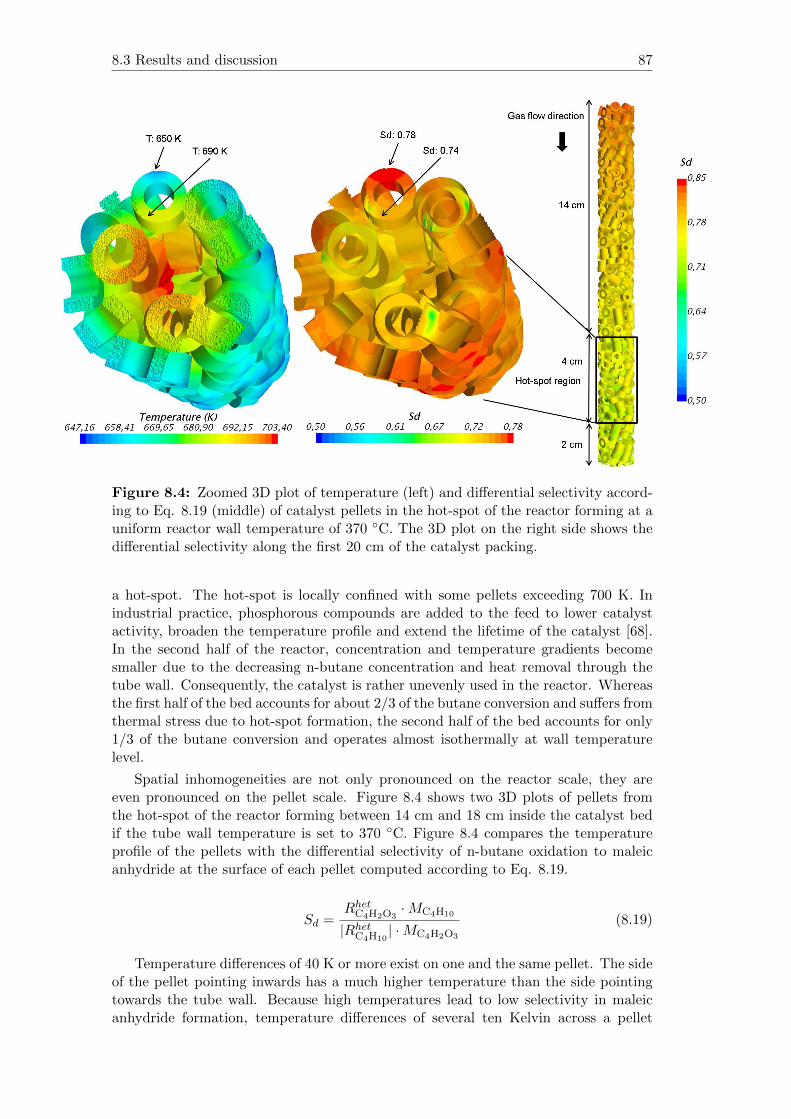
8.3 Results and discussion 87
Figure 8.4: Zoomed 3D plot of temperature (left) and differential selectivity accord-ing to Eq. 8.19 (middle) of catalyst pellets in the hot-spot of the reactor forming at auniform reactor wall temperature of 370 C. The 3D plot on the right side shows thedifferential selectivity along the first 20 cm of the catalyst packing.
a hot-spot. The hot-spot is locally confined with some pellets exceeding 700 K. Inindustrial practice, phosphorous compounds are added to the feed to lower catalystactivity, broaden the temperature profile and extend the lifetime of the catalyst [68].In the second half of the reactor, concentration and temperature gradients becomesmaller due to the decreasing n-butane concentration and heat removal through thetube wall. Consequently, the catalyst is rather unevenly used in the reactor. Whereasthe first half of the bed accounts for about 2/3 of the butane conversion and suffers fromthermal stress due to hot-spot formation, the second half of the bed accounts for only1/3 of the butane conversion and operates almost isothermally at wall temperaturelevel.
Spatial inhomogeneities are not only pronounced on the reactor scale, they areeven pronounced on the pellet scale. Figure 8.4 shows two 3D plots of pellets fromthe hot-spot of the reactor forming between 14 cm and 18 cm inside the catalyst bedif the tube wall temperature is set to 370 C. Figure 8.4 compares the temperatureprofile of the pellets with the differential selectivity of n-butane oxidation to maleicanhydride at the surface of each pellet computed according to Eq. 8.19.
Sd =RhetC4H2O3
·MC4H10
|RhetC4H10| ·MC4H2O3
(8.19)
Temperature differences of 40 K or more exist on one and the same pellet. The sideof the pellet pointing inwards has a much higher temperature than the side pointingtowards the tube wall. Because high temperatures lead to low selectivity in maleicanhydride formation, temperature differences of several ten Kelvin across a pellet

88 8 N-butane Oxidation to Maleic Anhydride: CFD Simulations and Profile . . .
translate into selectivity differences of several percentage points.
The particle resolved CFD simulations in Figure 8.3 and 8.4 illustrate that conven-tional pseudo-homogeneous or heterogeneous reactor models would not be able captur-ing the very inhomogeneous concentration, temperature and velocity field inside thisreactor. Both model families treat the catalyst phase as continuum and are not ableto resolve gradients caused by the discrete nature of the catalyst particles. Particleresolved reactor simulations reproduce physical reality much better. They would evenallow studying the effect of pellet orientation on pressure drop, hot spot formation,product selectivity and yield. Unfortunately, particle resolved CFD simulations arecomputationally much more expensive than conventional pseudo-homogeneous or het-erogeneous models. At the time of this writing, the simulations shown in Figure8.3 and 8.4 took several weeks on a computational cluster to converge. Nevertheless,computational power is ever increasing and particle resolved reactor simulations mightbecome routine in the not too distant future. To illustrate their potential, a knowledgebased manipulation of the reactor wall temperature profile will be presented next.
Training Case: Uniform Reactor Wall Temperature
The kinetic model (Eq. 8.2-8.16, Table 9.1) describes intrinsic reaction rates, freeof diffusional resistances. It was measured in a gradient free kinetic test reactor oncrushed and sieved catalyst. Used in the particle resolved CFD simulations as is,diffusion limitations inside the VPP hollow cylinders would not be accounted for.Reaction rates would be too high and the model would predict full conversion of n-butane before the end of the packing. Therefore, reaction rate multipliers (ηi ≤ 1)were introduced and multiplied with the pre-exponential factors (Ai in Table 9.1) todecrease the reaction rates. Activation energies and reaction orders were kept constant.
The reactor profiles that were measured with all five heating zones set to 370 Cwall temperature was chosen as ‘training set’ to determine these multipliers. To checkfor catalyst deactivation, profile measurements were conducted twice with two monthstime on stream in between. Measured and simulated species profiles with the reactionrate multipliers η1 = 1.0, η2 = 0.8, η3 = 0.6, η4 = 1.0, η5 = 0.6, η6 = 1.0 and η7 = 1.0are shown in Figure 8.5. These multipliers, lumping besides pore diffusion also effectsof film transport and deviations of the DEM packing from the real packing, gave thebest fit to the measured species profiles. Another systematic difference between thekinetic measurements leading to Equations 8.2-8.16 and Table 9.1 and data measuredin the pilot scale profile reactor is the CO to CO2 ratio expressed by the parametersφ1 and φ2. In the kinetic measurements, a CO/CO2 ratio close to 1 was observed(φ1 = 0.556 and φ2 = 0.5). All profiles measured in the pilot-scale reactor showa higher CO/CO2 ratio. Similar findings have been reported in [71]. Hence, thestoichiometric factor φ1 in Equation 8.3, the main source of CO and CO2, was increasedto a value of 0.75 in order to reproduce the measured ratio. Why the CO/CO2 ratiodepends on reactor and catalyst size is not yet clear and requires further investigations.
Another parameter that was determined from the training data set was the thermalconductivity of the catalyst pellets. The only value reported in the open literature is0.585 W/m/K [222]. Figure 8.6 shows a screening study on this parameter using aslightly shorter catalyst bed of 30 cm length to save computational time. If the originalvalue of 0.585 W/m/K is used, the hot-spot is markedly overpredicted. Best agreementwas found with a value of 1.2 W/m/K which was then used in all simulations discussedhereafter.
The experimental profiles in Figure 8.5 are very reproducible taking into accountthat they were measured with two months time-on-stream in between. The spikes

8.3 Results and discussion 89
0
0.2
0.4
0.6
0.8
1
1.2
1.4
1.6
1.8
2
2.2
2.4
2.6
0 100 200 300 400 500
mola
r flow
rate
/ m
mol m
in−
1
axial position / mm
C4H2O3
C4H10
O2/20
−x+x
0
0.2
0.4
0.6
0.8
1
1.2
1.4
0 100 200 300 400 500
mola
r flow
rate
/ m
mol m
in−
1
axial position / mm
CO
CO2
0
0.005
0.01
0.015
0.02
0.025
0.03
0.035
0.04
0.045
0 100 200 300 400 500
mola
r flow
rate
/ m
mol m
in−
1
axial position / mm
CH3COOH
CH2CH−COOH
Figure 8.5: Measured (points) vs. simulated (lines) species profiles. All five heatingzones were set to 370 C. Simulation results are displayed from two axial trajectoriesextracted at the same radial distance from the tube center but opposite azimuthalangle (solid lines, dotted lines). Profile measurements were repeated twice with twomonths time on stream in between (two types of symbols).

90 8 N-butane Oxidation to Maleic Anhydride: CFD Simulations and Profile . . .
370
380
390
400
410
420
430
440
450
460
470
0 50 100 150 200 250 300
tem
pera
ture
/ °
C
axial position / mm
exp.λsolid = 1.8 W/m/Kλsolid = 1.2 W/m/Kλsolid = 1.0 W/m/K
λsolid = 0.585 W/m/K
Figure 8.6: Effect of the thermal conductivity of the solid (λsolid) on the simulatedtemperature profiles. The experimental temperature profile corresponds to the casewhere all five heating zones were set to 370 C.
and dips in the experimental data are real and no scatter. They are caused by therandom orientation of the catalyst pellets in the reactor and the local flow, temperatureand concentration conditions around the sampling orifice. This can be seen best byanalyzing simulation data which are free of experimental scatter. The solid and dottedlines in Figure 8.5 correspond to two simulated axial species profiles extracted at thesame radial distance from the tube center but opposite azimuthal angles. The spikesand dips in the simulated profiles are even more pronounced than in the measuredprofiles because sampling through the orifice, which had a diameter of 100 µm in thisstudy, averages over a finite volume smoothing the amplitudes to some extent.
A similar comparison is shown in Figure 8.7 for the temperature profiles. Thesimulated temperature profiles are sampled at four axial trajectories around the centralsampling capillary at the same radial distance from the tube center but at four differentazimuthal angles +x = 0,−x = π,+y = π/2,−y = 3/2π. There is a qualitativeagreement among the four simulated temperature profiles in terms of hot-spot positionand slopes before and after the hot-spot. Quantitatively the simulated temperatureprofiles differ slightly due to the random orientation of the particles. For example, thehot-spot temperature varies by up to 18 K among the four simulated profiles shown.
Deviations between simulated and measured profiles are easier spotted if the sim-ulated profiles are angular averaged as shown in Figure 8.8 for the species profiles.Systematic deviations from the measurements are found for all species from 350 mmto 500 mm. This is most likely caused by the slightly over-predicted temperature inthis section (cf. Figure. 8.7) leading to a higher consumption rate of n-butane and ahigher production rate of the reaction products.
Eye-catching different profiles, both measured and simulated, were observed forthe two acids, acetic acid CH3COOH and acrylic acid CH2CH-COOH. Acetic acid isformed along the entire catalyst bed. Acrylic acid is formed at the same rate as aceticacid up to about z ≈ 150 mm, the location of the hot-spot. At this point, acrylic acidformation stops. From 150 mm to about 280 mm the molar flow rate of acrylic acid

8.3 Results and discussion 91
Figure 8.7: Measured (points) vs. simulated (solid and dotted lines) temperatureprofiles. All five heating zones were set to 370 C. Simulated temperatures are dis-played for four axial trajectories extracted at the same radial distance from the tubecenter but four different azimuthal angles (+x = 0,−x = π,+y = π/2,−y = 3/2π).
stays almost constant. From 280 mm onwards, the acrylic acid profile goes down untilthe end of the catalyst bed at 500 mm. In this zone, the production rate of acrylicacid is negative.
The molecular details of this different behaviour are not yet clear but the devel-opment of the two acids is nicely captured by the kinetic model (Eq. 8.2-8.16, Table9.1). According to this reaction network, the formation rate of CH3COOH is 2 ·r6−r7and that of CH2CH-COOH is r4 − r5. Figure 8.9 plots these reaction rates along thebed. The reaction rates producing and consuming acrylic acid, r4 and r5 respectively,follow the temperature profile closely. This is due to the high values of the activationenergy of these two reactions (Ea,4 = 156 kJ ·mol−1, Ea,5 = 144 kJ ·mol−1). Down-stream of 300 mm, the value of r4 becomes lower than that of r5 explaining the slowdecrease of the CH2CH-COOH profile. The reaction rates producing and consumingacetic acid, r6 and r7 respectively, have lower activation energies (Ea,6 = 52 kJ ·mol−1,Ea,7 = 92 kJ ·mol−1) and are less sensitive to temperature variations. The net forma-tion rate of acetic acid, 2 · r6 − r7 decreases along the catalyst bed but never becomesnegative. In consequence, the molar flow rate of acetic acid increases monotonouslyalong the reactor but flattens in slope.
Predictive Case: Staged Reactor Wall Temperature
After ‘training’ the kinetic model to match the measured reactor profiles as closelyas possible at a uniform wall temperature of 370 C, predictions were made for otherreactor wall temperatures and compared with measurements. Because a uniform re-actor wall temperature of 370 C led to a non-acceptable hot-spot of about 425 C,the temperature of all five heating zones was lowered to 360 C. The correspondingtemperature and species profiles are provided in Figure 8.11 and Figure 8.10. Agree-ment between experiment and simulation is still good. The hot-spot temperature in

92 8 N-butane Oxidation to Maleic Anhydride: CFD Simulations and Profile . . .
0
0.2
0.4
0.6
0.8
1
1.2
1.4
1.6
1.8
2
2.2
2.4
2.6
0 100 200 300 400 500
mola
r flow
rate
/ m
mol m
in−
1
axial position / mm
C4H2O3
C4H10
O2/20
0
0.1
0.2
0.3
0.4
0.5
0.6
0.7
0.8
0.9
1
1.1
1.2
1.3
1.4
1.5
0 100 200 300 400 500
mola
r flow
rate
/ m
mol m
in−
1
axial position / mm
CO
CO2
0
0.005
0.01
0.015
0.02
0.025
0.03
0.035
0.04
0.045
0 100 200 300 400 500
mola
r flow
rate
/ m
mol m
in−
1
axial position / mm
CH3COOH
CH2CH−COOH
Figure 8.8: Angular averaged simulated species profiles (lines) vs. measured speciesprofiles (symbols). The measured species profiles correspond to two measurementsalong the same axial trajectory but with two months time on stream in between. Allfive heating zones were set to 370 C.

8.3 Results and discussion 93
0
5e−06
1e−05
1.5e−05
2e−05
2.5e−05
3e−05
3.5e−05
4e−05
4.5e−05
0 100 200 300 400 500
rea
ction
rate
/ m
ol m
−2 s
−1
tem
pera
ture
/ °
C
axial position / mm
r4r5
r6*2r7
Figure 8.9: Angular averaged simulated reaction rates related to acetic acidCH3COOH and acrylic acid CH2CH-COOH. All five heating zones were set at 370C. The grey dotted line shows the simulated temperature profile for comparison.
the catalyst bed is reduced disproportionately due to the parametric sensitivity of thesystem (Tmaxmeas ≈ 397 C, Tmaxsim ≈ 392 C). The reduced temperature in the reactorlowers the thermal stress on the catalyst which is desirable but it also lowers reactionrates and leads to reduced maleic anhydride production which is not acceptable froman industrial point of view. Lowering the reactor wall temperature along the entirereactor is therefore not an option.
Without knowledge of the concentration and temperature profiles inside the reactorand without a predictive reactor model time consuming and costly trial and errorcampaigns would now be in order to reduce the thermal stress on the catalyst withoutcompromising maleic anhydride production. With the knowledge from the profilemeasurements and with the predictive model, knowledge based reactor optimizationallows reaching this goal faster and cheaper. At 370 C reactor wall temperature theprofiles showed a detrimental hot-spot formation in the first half of the catalyst bedbecause high butane concentrations meet hot catalyst particles. As described above2/3 of the butane was converted under these conditions in the first half of the catalystbed while the second half only accounted for 1/3 of the overall butane conversion.This knowledge implies that an optimum reactor wall temperature profile featuresgradually increasing temperatures with lower temperatures and reduced reaction ratesat the reactor inlet and higher temperatures towards the outlet compensating for thedecreasing butane concentration. The predictive reactor model can now be used tocalculate an optimized wall temperature profile according to this general strategy.
To demonstrate this concept, Figure 8.12 shows a side-by-side comparison of exper-imental and computed reactor profiles for the ‘training’ case of 370 C uniform reactorwall temperature on the left side and a stagewise increasing wall temperature profile onthe right side. For the staged profile the heating zones 1-5 were set to Twall,1 = 360 C,Twall,2 = 365 C, Twall,3 = 370 C, Twall,4 = 375 C and Twall,5 = 380 C respectively.For better comparison of reactor performance, the profiles in Figure 8.12 are plotted asconversion profiles for n-butane (C4H10) and selectivity profiles for the main products
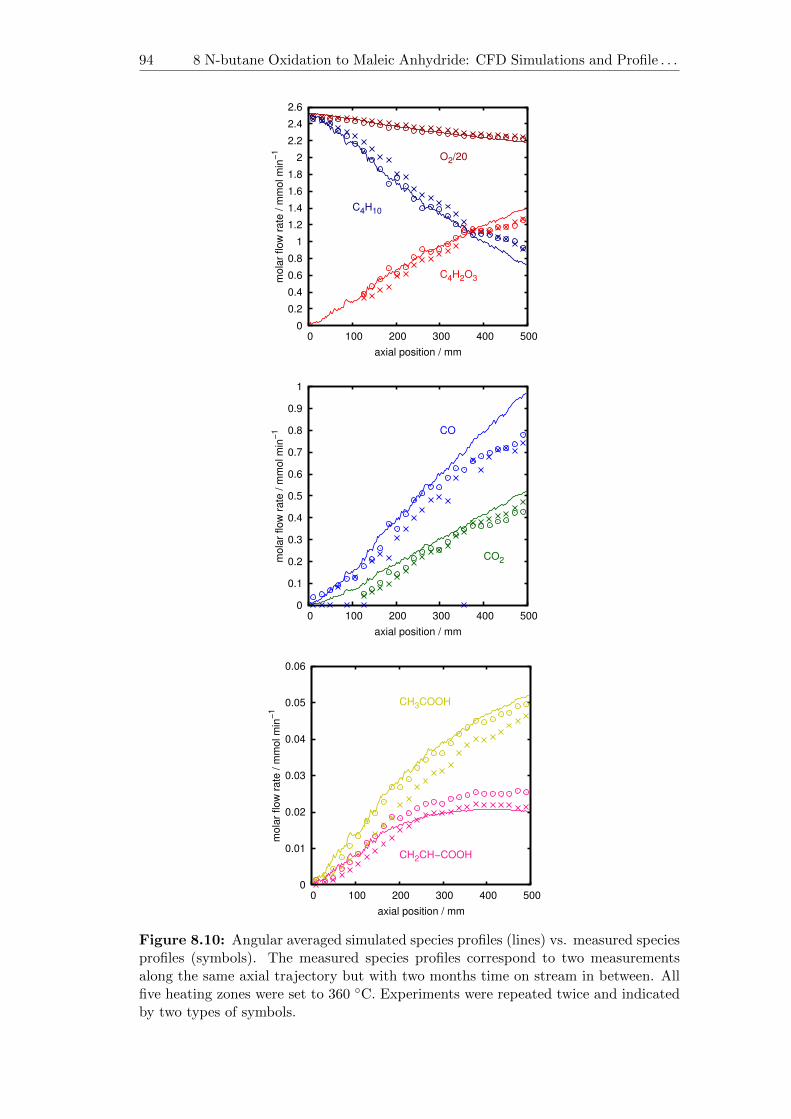
94 8 N-butane Oxidation to Maleic Anhydride: CFD Simulations and Profile . . .
0
0.2
0.4
0.6
0.8
1
1.2
1.4
1.6
1.8
2
2.2
2.4
2.6
0 100 200 300 400 500
mola
r flow
rate
/ m
mol m
in−
1
axial position / mm
C4H2O3
C4H10
O2/20
0
0.1
0.2
0.3
0.4
0.5
0.6
0.7
0.8
0.9
1
0 100 200 300 400 500
mola
r flow
rate
/ m
mol m
in−
1
axial position / mm
CO
CO2
0
0.01
0.02
0.03
0.04
0.05
0.06
0 100 200 300 400 500
mola
r flow
rate
/ m
mol m
in−
1
axial position / mm
CH3COOH
CH2CH−COOH
Figure 8.10: Angular averaged simulated species profiles (lines) vs. measured speciesprofiles (symbols). The measured species profiles correspond to two measurementsalong the same axial trajectory but with two months time on stream in between. Allfive heating zones were set to 360 C. Experiments were repeated twice and indicatedby two types of symbols.

8.3 Results and discussion 95
360
365
370
375
380
385
390
395
400
0 100 200 300 400 500
tem
pera
ture
/ °
C
axial position / mm
exp.sim, average
Figure 8.11: Comparison of the measured center line reactor temperature profile(points) with the angular averaged simulated temperature profile (line). All five heat-ing zones were set to 360 C.
0
0.1
0.2
0.3
0.4
0.5
0.6
0.7
0.8
0.9
0 100 200 300 400 500 370
380
390
400
410
420
430
buta
ne c
onvers
ion / −
tem
pera
ture
/ °
C
axial position / mm
C4H10
Tgas
exp.sim, average
0
0.1
0.2
0.3
0.4
0.5
0.6
0.7
0.8
0.9
0 100 200 300 400 500 360
370
380
390
400
410
420buta
ne c
onvers
ion / −
tem
pera
ture
/ °
C
axial position / mm
C4H10
Tgas
exp.sim, average
0
0.05
0.1
0.15
0.2
0.25
0.3
100 150 200 250 300 350 400 450 500 0.5
0.55
0.6
0.65
0.7
0.75
0.8
0.85
0.9
0.95
1
sele
ctivity C
Ox / −
sele
ctivity C
4H
2O
3 / −
axial position / mm
C4H2O3
CO
CO2
0
0.05
0.1
0.15
0.2
0.25
0.3
100 150 200 250 300 350 400 450 500 0.5
0.55
0.6
0.65
0.7
0.75
0.8
0.85
0.9
0.95
1
sele
ctivity C
Ox / −
sele
ctivity C
4H
2O
3 / −
axial position / mm
C4H2O3
CO
CO2
Figure 8.12: Comparisons of the simulated (line) and measured (points) conversion,selectivity and temperature profiles. Left: five heating zones are set uniform at 370 C.Right: five heating zones are set stepwise increase from 360 C to 380 C. Simulationresults are circumferentially averaged. The applied reactor wall temperature settingsare show as sketch.

96 8 N-butane Oxidation to Maleic Anhydride: CFD Simulations and Profile . . .
maleic anhydride (C4H2O3), carbon monoxide (CO) and carbon dioxide (CO2).
In both cases a butane conversion of about 80 % was measured at the end of thecatalyst bed. This conversion level is comparable to industrial reactors. In case ofthe stagewise increasing wall temperature profile the butane conversion rate is indeedreduced in the first half of the catalyst bed and increased in the second half of thecatalyst bed. As intended, this leads to a more uniform temperature profile inside thecatalyst bed without punctual hot-spot formation. The temperature increases almostlinearly from the inlet value of 360 C at 0 mm to 410 C at about 220 mm, stayingconstant up to about 380 mm before decreasing to 400 C at the end of the catalystbed (500 mm). The differences to the 370 C wall temperature case seem subtle butan inspection of the selectivity profile shows that not only the thermal stress of thecatalyst is reduced but that also the selectivity to maleic anhydride is increased. Thiscomes as no surprise because the detrimental influence of high catalyst temperatures onthe maleic anhydride selectivity was already seen in Figure 8.4. While the measuredintegral maleic anhydride selectivity is about 72 % for a uniform wall temperatureof 370 C, the stagewise increasing wall temperature profile increases the measuredintegral maleic anhydride selectivity to almost 75 %. This increase seems minor but ata world scale production of 2.8 Mio t it translates into significant savings in n-butaneconsumption, reduced COx emissions and increased revenue [79].
8.4 Conclusions
We present for the first time species and temperature profiles inside a pilot-scalefixed-bed reactor for n-butane oxidation on VPP catalyst pellets under industrially-relevant temperature-, flow- and pressure conditions. Besides high resolution profilesfor the main species n-butane, oxygen, maleic anhydride, CO and CO2 profiles ofthe intermediates/by-products acetic acid (CH3COOH) and acrylic acid (CH2CH-COOH) were measured. The species and temperature profiles provide insight into thereaction network and lead to strategies for reactor optimization. For optimization ofthe reactor wall temperature profile, the pilot-scale profile reactor was equipped withfive independent heating zones offering the possibility to imprint a temperature profileonto the reactor wall.
To make predictions of the reactor performance at different operation conditions,a particle-resolved CFD reactor model was developed. Classical pseudo-homogeneousor heterogeneous reactor models would not be able to capture the very inhomogeneousvelocity-, temperature- and concentration fields inside the catalyst bed because thelarge catalyst pellets inside the narrow reactor tube cannot be approximated as onecontinuous phase. The packing structure generated from DEM simulations was foundto be in very good agreement with the experimentally determined porosity profile.Close to the reactor wall agreement was almost perfect due to the ordering effect ofthe wall. In the tube center measured and simulated porosity profiles agreed withinthe statistical bounds of the packing process. The influence of the central samplingcapillary on the packing was also well captured by the DEM simulations.
The catalytic reactions inside the catalyst pellets were described by an intrinsickinetic model, measured on crushed and sieved catalyst particles in a separate kineticsetup under conditions free of transport artifacts. Because it was computationallynot possible to solve reaction-diffusion equations in each catalyst pellet on top of thealready very demanding CFD simulations, reaction rate multipliers were introduced inthe kinetic model lumping transport effects and minor deviations between the simu-lated and the real catalyst packing. These reaction rate multipliers were determined by

8.4 Conclusions 97
changing them until the best possible agreement with a set of reactor profiles measuredat a uniform reactor wall temperature of 370 C was reached. The trained model wasthen used to make predictions for the reactor profiles at other wall temperature condi-tions and good agreement was found with the corresponding measurements. Particleresolved CFD reactor modeling suggested a stagewise increasing temperature with in-crements of 5 C from 360 C to 380 C as close to optimum. When this temperatureprofile was imprinted onto the reactor wall, the hot-spot was indeed eliminated, con-version remained at 80 % and the integral selectivity to maleic anhydride at the end ofthe catalyst bed increased from 72 % to almost 75 %. The reduced thermal stress onthe catalyst extends the lifetime of the VPP catalyst and the increasing selectivity tomaleic anhydride at constant n-butane conversion translates into a better use of thefeedstock n-butane, reduced COx emissions and higher revenue.
This work demonstrates the potential of combining spatial reactor measurementswith appropriate reactor modeling to improve even well established catalytic processes.The oxidation of n-butane to maleic anhydride on vanadyl pyrophosphate was chosenas test reaction in this work but this approach can be extended to all heterogeneouscatalytic reactions carried out in fixed-bed reactors.

“Catalyst particles have a very complicated pore structure and describ-ing diffusion from the external surface to the active sites where thereactions take place is not a simple task.”
Gilbert F. Froment et al.[2]
9Catalyst Pore Structure Study
Most applied vanadyl pyrophosphate (VPP)catalysts for n-butane oxidation to maleic an-hydride (MA) in industrial fixed-bed reactorsare bulk catalysts typically made by pressingthe active powder into a pellet with the de-sired dimensions [91]. The resulting catalystpellets therefore have a bimodal pore struc-ture, i.e. the micro-porous structure from thechemical synthesis of the active powder andthe macro-porous region between the powderformed by the pelleting process. Due to diffu-sion limitation, the global reaction rate of thecatalyst pellet in the reactor can be differentfrom the intrinsic reaction rate measured forthe active powder [71]. Hence, the real per-formance of the VPP catalyst pellet in a technical fixed-bed reactor is an overall resultof the chemistry nature of the active component and the pore structure of the pel-let. Most of current research on n-butane oxidation focus on improving the catalyticchemistry of the VPP catalyst [72, 223, 224]. New synthesis methods are continuouslyproposed to increase the intrinsic activity of the VPP precursors [75, 225]. To the bestof our knowledge, the pore structure optimization of the VPP catalyst for n-butaneoxidation is not explored yet.
Early studies have shown that an optimal pore structure of the catalyst pellet canbe of great importance [226–228]. With the development of experimental techniques,rational design and synthesis of catalyst pellets with desired pore structure for betterperformance is nowadays possible [229, 230]. The effect of the pore structure param-eters of the VPP catalyst pellet on the reactor performance for n-butane oxidationin a fixed-bed reactor is investigated in this work by means of detailed mathematicalmodelling. If the overall yield of maleic anhydride can be improved by 1 % with alter-ing the catalyst pore structure, this may open up a new direction for research of thisprocess.
9.1 Simulation details
A two-dimensional heterogeneous model [2] including mass, heat and momentum bal-ances in both axial and radial direction were applied to model a fixed-bed reactor. The
This chapter is adopted from publication: Y. Dong, F.J. Keil, O. Korup, F. Rosowski, R. Horn,Effect of the catalyst pore structure of fixed-bed reactor performance of partial oxidation of n-butane:A simulation study, Chemical Engineering Science 142 (2016) 299-309.

9.1 Simulation details 99
three-dimensional reactor was simplified to a two-dimensional rectangular geometryassuming rotational symmetry. The pseudo-homogeneous and heterogeneous modelshave been applied successfully to simulate the n-butane oxidation in fixed-bed reactors[71, 222, 231–233] and membrane reactors [78, 234, 235]. The micro- and macro poremodel of Wakao and Smith [92, 131] was applied for describing diffusion-reactions in-side the porous catalyst pellet. Details of the models are described in Section 3.1. Allthe simulations were carried out with COMSOL Multiphysics 5.0 R© [236].
For this simulation work, the triangle (three-reaction) network as shown in Figure9.1 was used which includes the main reaction of n-butane to maleic anhydride, totaloxidation of n-butane to carbon oxides (CO2 and CO) and consecutive MA oxidationto CO2 and CO [237]. The formation of other by-products such as acetic acid, acrylicacid, phthalic and methacrylic acids are generally neglected in the reaction modelbecause of observed low concentrations (lower than 2 %) [78, 234].
Figure 9.1: Triangle reaction network for n-butane oxidation [237].
The stoichiometric equations used were as follows:
C4H10 + 3.5 O2r1−→ C4H2O3 + 4 H2O ∆HR,298K = −1240 kJ/mol (9.1)
C4H10 + 5.5 O2r2−→ 2 CO2 + 2 CO + 5 H2O ∆HR,298K = −2092 kJ/mol (9.2)
C4H2O3 + 2 O2r3−→ 2 CO2 + 2 CO + H2O ∆HR,298K = −852 kJ/mol (9.3)
The intrinsic rate expressions and kinetic parameters were taken from Guettel et al.[233], and the parameters are given in Table 9.1:
kj = Aj · exp(−Ea,jRT
)(9.4)
r1 =k1pC4H10
p0.5O2
1 +K1pC4H10+K2pH2O
(9.5)
r2 =k2pC4H10
p0.5O2
1 +K1pC4H10+K2pH2O
(9.6)
r3 =k3pC4H2O3
p0.25O2
1 +K1pC4H10+K2pH2O
(9.7)
Since the aim of the present simulation is to investigate the effect of the pore struc-ture of the catalyst pellet on the reactor performance, the above mentioned reactionrates rj which are in units of mol/(kgcat· s) were converted to the surface area basedreaction rate rj,s which is in units of mol/ (m2· s) with assumed active surface percatalyst mass Sg of 6.7 ·105 m2/kg.
The shape of the catalyst pellet studied in the present paper is cylindrical (d =h = 3 mm) and physical parameters of the catalyst were adapted from Guettel et al.
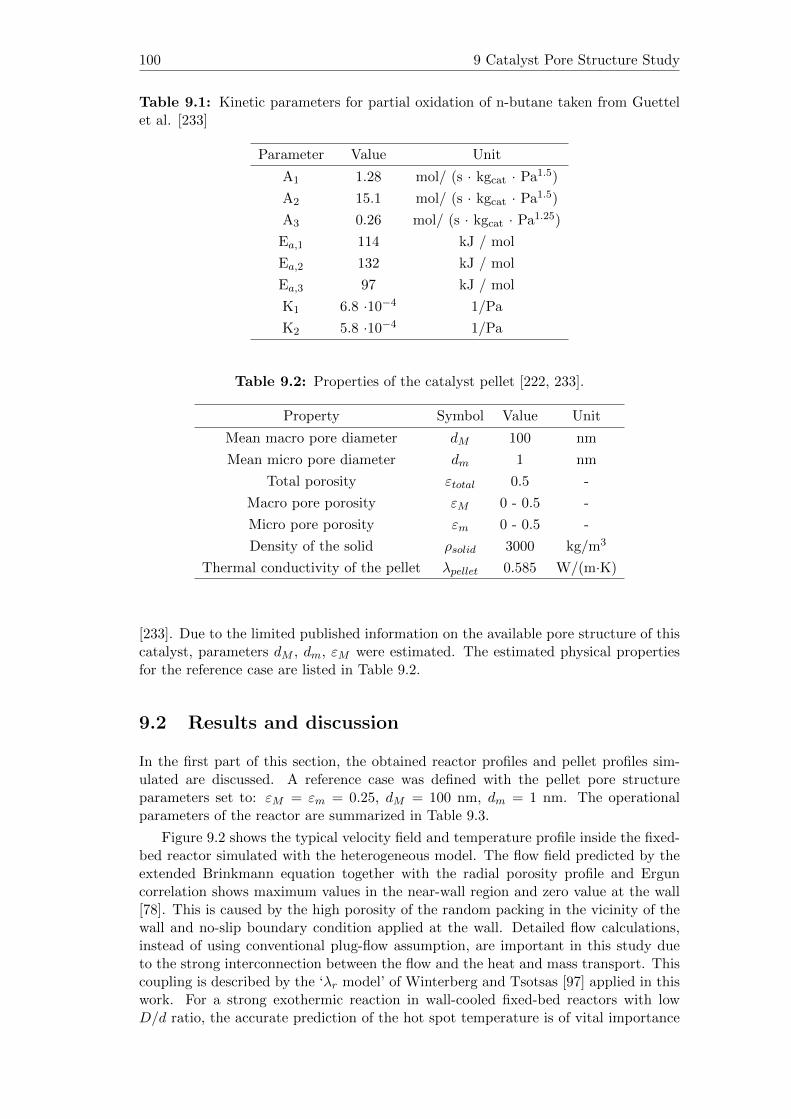
100 9 Catalyst Pore Structure Study
Table 9.1: Kinetic parameters for partial oxidation of n-butane taken from Guettelet al. [233]
Parameter Value Unit
A1 1.28 mol/ (s · kgcat · Pa1.5)
A2 15.1 mol/ (s · kgcat · Pa1.5)
A3 0.26 mol/ (s · kgcat · Pa1.25)
Ea,1 114 kJ / mol
Ea,2 132 kJ / mol
Ea,3 97 kJ / mol
K1 6.8 ·10−4 1/Pa
K2 5.8 ·10−4 1/Pa
Table 9.2: Properties of the catalyst pellet [222, 233].
Property Symbol Value Unit
Mean macro pore diameter dM 100 nm
Mean micro pore diameter dm 1 nm
Total porosity εtotal 0.5 -
Macro pore porosity εM 0 - 0.5 -
Micro pore porosity εm 0 - 0.5 -
Density of the solid ρsolid 3000 kg/m3
Thermal conductivity of the pellet λpellet 0.585 W/(m·K)
[233]. Due to the limited published information on the available pore structure of thiscatalyst, parameters dM , dm, εM were estimated. The estimated physical propertiesfor the reference case are listed in Table 9.2.
9.2 Results and discussion
In the first part of this section, the obtained reactor profiles and pellet profiles sim-ulated are discussed. A reference case was defined with the pellet pore structureparameters set to: εM = εm = 0.25, dM = 100 nm, dm = 1 nm. The operationalparameters of the reactor are summarized in Table 9.3.
Figure 9.2 shows the typical velocity field and temperature profile inside the fixed-bed reactor simulated with the heterogeneous model. The flow field predicted by theextended Brinkmann equation together with the radial porosity profile and Erguncorrelation shows maximum values in the near-wall region and zero value at the wall[78]. This is caused by the high porosity of the random packing in the vicinity of thewall and no-slip boundary condition applied at the wall. Detailed flow calculations,instead of using conventional plug-flow assumption, are important in this study dueto the strong interconnection between the flow and the heat and mass transport. Thiscoupling is described by the ‘λr model’ of Winterberg and Tsotsas [97] applied in thiswork. For a strong exothermic reaction in wall-cooled fixed-bed reactors with lowD/d ratio, the accurate prediction of the hot spot temperature is of vital importance

9.2 Results and discussion 101
Table 9.3: Operational parameters applied in a two-dimensional heterogeneous modelto simulate n-butane oxidation in a fixed-bed reactor.
Parameter Symbol Value Unit
Reactor length lR 0.5 m
Reactor diameter dR 21 mm
Inlet temperature T0 673.15 K
Reactor wall temperature Tw 673.15 K
Inlet molar fraction of C4H10 yC4H10,00.02 -
Inlet molar fraction of O2 yO2,00.2 -
Inlet molar fraction of H2O yH2O,00.03 -
Gas hourly space velocity GHSV 2000 h−1
Figure 9.2: Example illustration of the predicted velocity field (left), temperatureprofile (right) of a 2-D heterogeneous model incorporated with radial porosity profileand exothermic reactions.
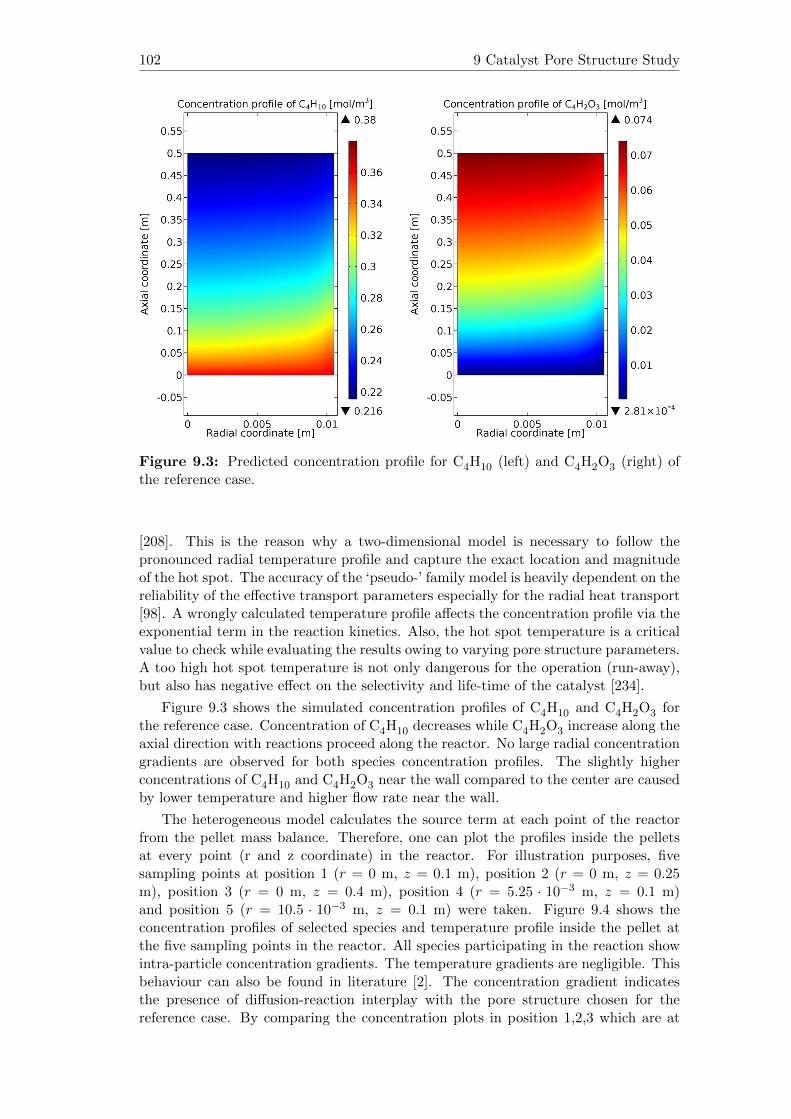
102 9 Catalyst Pore Structure Study
Figure 9.3: Predicted concentration profile for C4H10 (left) and C4H2O3 (right) ofthe reference case.
[208]. This is the reason why a two-dimensional model is necessary to follow thepronounced radial temperature profile and capture the exact location and magnitudeof the hot spot. The accuracy of the ‘pseudo-’ family model is heavily dependent on thereliability of the effective transport parameters especially for the radial heat transport[98]. A wrongly calculated temperature profile affects the concentration profile via theexponential term in the reaction kinetics. Also, the hot spot temperature is a criticalvalue to check while evaluating the results owing to varying pore structure parameters.A too high hot spot temperature is not only dangerous for the operation (run-away),but also has negative effect on the selectivity and life-time of the catalyst [234].
Figure 9.3 shows the simulated concentration profiles of C4H10 and C4H2O3 forthe reference case. Concentration of C4H10 decreases while C4H2O3 increase along theaxial direction with reactions proceed along the reactor. No large radial concentrationgradients are observed for both species concentration profiles. The slightly higherconcentrations of C4H10 and C4H2O3 near the wall compared to the center are causedby lower temperature and higher flow rate near the wall.
The heterogeneous model calculates the source term at each point of the reactorfrom the pellet mass balance. Therefore, one can plot the profiles inside the pelletsat every point (r and z coordinate) in the reactor. For illustration purposes, fivesampling points at position 1 (r = 0 m, z = 0.1 m), position 2 (r = 0 m, z = 0.25m), position 3 (r = 0 m, z = 0.4 m), position 4 (r = 5.25 · 10−3 m, z = 0.1 m)and position 5 (r = 10.5 · 10−3 m, z = 0.1 m) were taken. Figure 9.4 shows theconcentration profiles of selected species and temperature profile inside the pellet atthe five sampling points in the reactor. All species participating in the reaction showintra-particle concentration gradients. The temperature gradients are negligible. Thisbehaviour can also be found in literature [2]. The concentration gradient indicatesthe presence of diffusion-reaction interplay with the pore structure chosen for thereference case. By comparing the concentration plots in position 1,2,3 which are at
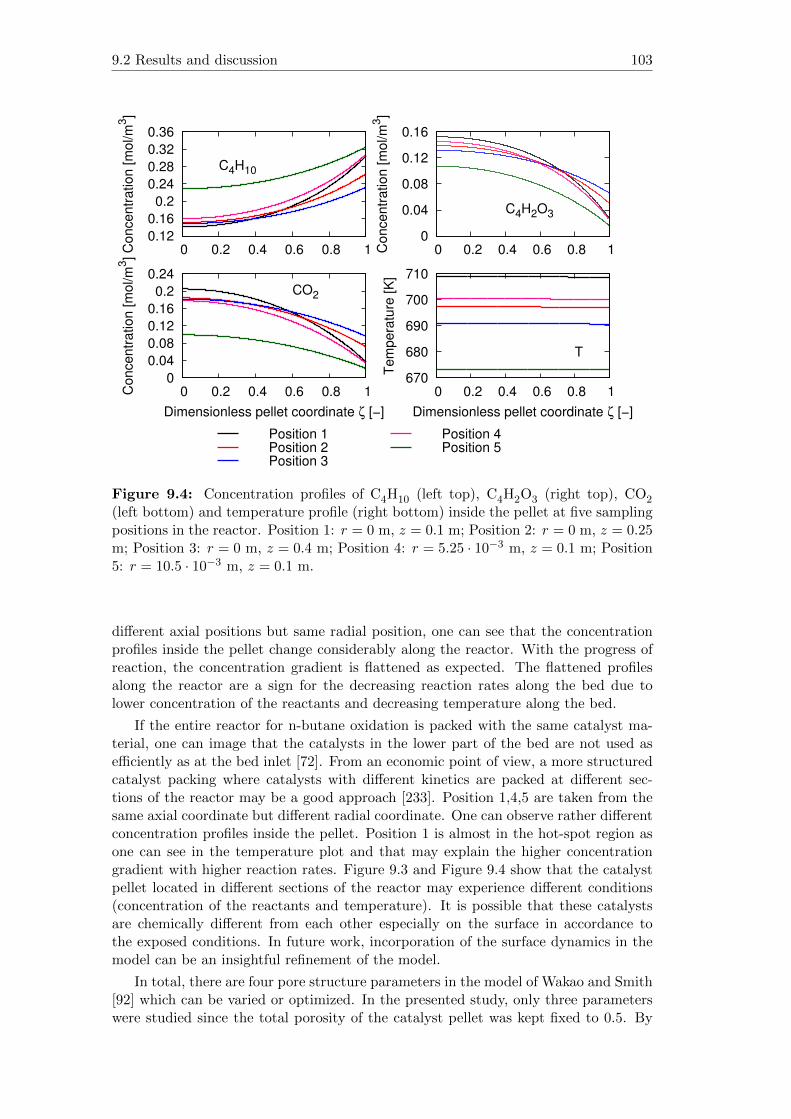
9.2 Results and discussion 103
0.12
0.16
0.2
0.24
0.28
0.32
0.36
0 0.2 0.4 0.6 0.8 1Concentr
ation [m
ol/m
3]
C4H10
Position 1Position 2Position 3
0
0.04
0.08
0.12
0.16
0 0.2 0.4 0.6 0.8 1Concentr
ation [m
ol/m
3]
C4H2O3
0
0.04
0.08
0.12
0.16
0.2
0.24
0 0.2 0.4 0.6 0.8 1Concentr
ation [m
ol/m
3]
Dimensionless pellet coordinate ζ [−]
CO2
670
680
690
700
710
0 0.2 0.4 0.6 0.8 1T
em
pera
ture
[K
]
Dimensionless pellet coordinate ζ [−]
T
Position 4Position 5
Figure 9.4: Concentration profiles of C4H10 (left top), C4H2O3 (right top), CO2
(left bottom) and temperature profile (right bottom) inside the pellet at five samplingpositions in the reactor. Position 1: r = 0 m, z = 0.1 m; Position 2: r = 0 m, z = 0.25m; Position 3: r = 0 m, z = 0.4 m; Position 4: r = 5.25 · 10−3 m, z = 0.1 m; Position5: r = 10.5 · 10−3 m, z = 0.1 m.
different axial positions but same radial position, one can see that the concentrationprofiles inside the pellet change considerably along the reactor. With the progress ofreaction, the concentration gradient is flattened as expected. The flattened profilesalong the reactor are a sign for the decreasing reaction rates along the bed due tolower concentration of the reactants and decreasing temperature along the bed.
If the entire reactor for n-butane oxidation is packed with the same catalyst ma-terial, one can image that the catalysts in the lower part of the bed are not used asefficiently as at the bed inlet [72]. From an economic point of view, a more structuredcatalyst packing where catalysts with different kinetics are packed at different sec-tions of the reactor may be a good approach [233]. Position 1,4,5 are taken from thesame axial coordinate but different radial coordinate. One can observe rather differentconcentration profiles inside the pellet. Position 1 is almost in the hot-spot region asone can see in the temperature plot and that may explain the higher concentrationgradient with higher reaction rates. Figure 9.3 and Figure 9.4 show that the catalystpellet located in different sections of the reactor may experience different conditions(concentration of the reactants and temperature). It is possible that these catalystsare chemically different from each other especially on the surface in accordance tothe exposed conditions. In future work, incorporation of the surface dynamics in themodel can be an insightful refinement of the model.
In total, there are four pore structure parameters in the model of Wakao and Smith[92] which can be varied or optimized. In the presented study, only three parameterswere studied since the total porosity of the catalyst pellet was kept fixed to 0.5. By

104 9 Catalyst Pore Structure Study
0
10
20
30
40
50
60
70
0 0.1 0.2 0.3 0.4 0.5 670
680
690
700
710
Conve
rsio
n,
Sele
ctivity, Y
ield
[%
]
Hot
spot
tem
pera
ture
[K
]
εM [−]
ConversionSelectivity
YieldThot
Figure 9.5: Effect of the macro-pore porosity εM on the simulated fixed-bed reactorperformance for n-butane oxidation.
fixing the total porosity, the pellet density and bed density were kept unchanged withvarying distribution of the macro and micro pores porosity in the pellets. The followingquestion is addressed in this work: Which pore structure of the catalyst pellet is moreefficient for a given mass of active catalyst and fixed pellet shape. All simulations werecarried out at the same operational conditions as for the reference case.
Firstly, the macro-pore porosity εM was varied from 0 to 0.5 while the macro andmicro-pore diameters were kept to the values of the reference case. Figure 9.5 showsthe simulated reactor performance, i.e the overall conversion, selectivity and yield atthe outlet of the fixed-bed. These were calculated as integral average at the outlet:
Conversion =NC4H10,in
−NC4H10
NC4H10,in, (9.8)
Selectivity =NC4H2O3
NC4H10,in−NC4H10
, (9.9)
Y ield = Conversion · Selectivity, (9.10)
where the NC4H10stands for the molar flux of C4H10 in unit of mol ·m−2·s−1. The
hot spot temperature was evaluated as the maximum temperature in the calculationdomain.
With increasing fraction of macro-pores in the catalyst pellet, conversion of n-butane first increases and experiences a maximum when εM = 0.2. Then, the con-version drops and reaches the lowest value at the upper limit when all the pores aremacro-pores. The selectivity increases gradually with increasing εM except for thecase when εM = 0.5. For industry, yield is important as n-butane is not recycled. Asone can see in Figure 9.5, the yield has similar shape as the conversion with respectto εM but the maximum is slight shifted to εM = 0.25 which is also the reference caseused in this work. The hot spot temperature follows the same trend as the conversiondue to the reaction progress. The highest hot spot temperature for εM = 0.2 is 36 K

9.2 Results and discussion 105
0
0.2
0.4
0.6
0.8
1
1.2
1.4
0 0.1 0.2 0.3 0.4 0.5 0
0.5
1
1.5
2
2.5
3
3.5
4
Sg [
10
6 m
2/k
g]
Eff
ective d
iffu
siv
ity [10
−6 m
2/s
]
εM [−]
SgDeff,C4H10Deff,C4H2O3Deff,CO2
Figure 9.6: Effect of the macro-pore porosity εM on the specific surface area Sg andeffective diffusivity Deff,i.
0 0.05 0.1
0.15 0.2
0.25 0.3
0.35
0 0.2 0.4 0.6 0.8 1Concentr
ation [m
ol/m
3]
Dimensionless pellet coordinate ζ [−]
C4H10
C4H2O3
0 0.02 0.04 0.06 0.08 0.1
0.12 0.14 0.16 0.18
0 0.2 0.4 0.6 0.8 1Concentr
ation [m
ol/m
3]
Dimensionless pellet coordinate ζ [−]
C4H10
C4H2O3
εM = 0.02
εM = 0.1
εM = 0.2
εM = 0.25
εM = 0.3
εM = 0.4
Figure 9.7: Effect of the macro-pore porosity εM on concentration profiles of C4H10
and C4H2O3 inside the pellet located at position 1.

106 9 Catalyst Pore Structure Study
0
0.05
0.1
0.15
0.2
0.25
0 0.1 0.2 0.3 0.4 0.5
Re
actio
n r
ate
[m
ol/m
3s]
εM [−]
r1r2r3
Figure 9.8: Effect of the macro-pore porosity εM on the integrated average reactionrates ri of the pellet located at position 1.
higher than the inlet temperature. This temperature rise is still within the tolerancetemperature rise (Max. 60 K in literature) [233]. The resulting reactor performanceindicates that catalysts with bimodal pore structure can out-perform those with onlymicro-pores or only macro-pores being the two limiting cases. The optimal distributionof the macro- and micro- pores in the presented study is achieved when εM = 0.25 ifthe maximum yield is the concerned criteria. This optimum is a compromise betweenthe high reactive surface mostly created by the micro-pores, and high diffusion ratefacilitated by the macro-pores (transport pores).
Figure 9.6 illustrates the specific surface Sg and the effective diffusivity of selectedspecies Deff,i as function of εM . The specific surface area decreases linear with εM andthe diffusivity increases quadratically with εM . Both trends can be mathematicallyexplained by Eq. 3.1 and Eq. 3.4. The interplay between diffusion and reaction wasalready found a few decades ago [130]. The question is how much the yield can beimproved by tuning the pore-structure of the catalyst pellet. In the presented study,even with slight modification, from εM = 0.3 to εM = 0.25, 1% of yield improvementcan be achieved which is of industrial interest [72] due to high production capacityof MA. These results clearly demonstrate that the role of the pore structure of thecatalyst can be as important as the improvement of the catalyst. Eventhough thepresented values are based on estimated values of pore structure, the trend observedfrom the calculations will be conserved in reality. Another message from Figure 9.5is that a not optimised fraction of macro-pores from the pelleting process can make apoor-performance catalyst even though the active ingredients are not altered.
In order to better understand the influence of the pore structure parameter εMon the pellet scale, the concentration profiles of C4H10 and C4H2O3 inside the pelletlocated at position 1 are plotted in Figure 9.7. When εM is lower than 0.1, very steepconcentration gradient of C4H10 can be observed. This is a clear indication of thediffusion limitation that barely any reactant molecules can enter the interior activesurface. After introducing the macro-pores, for example εM = 0.1, the inner parts ofthe catalyst pellet become accessible. When εM < 0.1, the concentration profile of

9.2 Results and discussion 107
15
20
25
30
35
40
45
50
55
60
40 60 80 100 120 140 160 180 200 220 240 700
705
710
715
720
725
Conve
rsio
n,
Sele
ctivity, Y
ield
[%
]
Hot
spot
tem
pera
ture
[K
]
dM [nm]
ConversionSelectivity
YieldThot
Figure 9.9: Effect of the macro-pore diameter dM on the simulated fixed-bed reactorperformance for n-butane oxidation.
C4H2O3 first increases gradually due to the higher concentration of C4H10 and thushigher reaction rates. The maximum found around ζ = 0.80 is likely because of theaccumulation of the C4H2O3 molecules when the diffusion rate is still low comparedto the reaction. With increasing fraction of the macro-pores inside the pellet, theconcentration profiles for both species flatten out. It is not only because of the fasterdiffusion of the reactants inwards and products outwards of the pore, but also becauseof the loss of reaction sites due to the reduced specific surface. Above εM = 0.3, thecatalyst performance is limited by the reduction of the active surfaces.
Integral averages of the reaction rates inside the pellet at position 1 were evalu-ated and depicted in Figure 9.8. Reaction rates r1 and r2 show the same trend withrespect to εM . This is expected from the kinetic expressions in Eq. 9.5 and 9.6. Thedecomposition reaction rate r3 shows a different behaviour as a function of εM . Itseems that the influence of accelerated diffusion rate on r3 is less pronounced than thereduction of the surface area as one can see from the slope of the increasing part (r1,r2) compared to the decreasing part (r3). This means the diffusion-reaction balancehas a different effect on each individual reaction. With that it is possible to not onlypromote conversion, but also the selectivity by changing the pore structure. From thepresented results, the key is to find the ‘right’ pore structure where the main reactionrate r1 is high enough and the undesired consecutive reaction rate r3 is rather low.The optimal value for εM is 0.25, the same value as observed for the reactor scale.At this point, one can deduce that the fractions of macro- and micro-pores inside thecatalyst pellet have effects on both the concentration profiles and reaction kinetics onthe pellet scale and on the reactor scale. In addition to catalyst synthesis, optimizingthe pellet pore structure offers the possibility to improve industrial maleic anhydridesynthesis.
The other two parameters studied in this work were the macro-pore diameter dMand micro-pore diameter dm. Simulations with independent variation of dM and dmwere carried out while the fraction of the macro- and micro-porosity (εM = εm = 0.25)were fixed. From the presented results above, εM = 0.25 is the optimal value for dM

108 9 Catalyst Pore Structure Study
0
5
10
15
20
25
30
35
40
45
50
55
60
65
70
0 1 2 3 4 5 6 7 8 9 10 675
680
685
690
695
700
705
710
715
720
725
730
735
740
745
750
Conve
rsio
n,
Sele
ctivity, Y
ield
[%
]
Hot
spot
tem
pera
ture
[K
]
dm [nm]
ConversionSelectivity
YieldThot
Figure 9.10: Effect of the micro-pore diameter dm on the simulated fixed-bed reactorperformance for n-butane oxidation.
= 100 nm and dm = 1 nm. In the following section, the main goal is to investigate iffurther improvement is possible by tuning the pore size. Figure 9.9 shows the overallconversion, selectivity, yield and hot spot temperature with respect to the macro-porediameter. Both conversion and selectivity increase with increasing macro-pore dia-meter slightly. The overall yield of the product is improved, e.g. by 3% by increasingdM from 100 nm to 200 nm. The increase of the overall reactor performance can be ex-plained by the acceleration of the diffusion rate since the Knudsen diffusivity increaseslinearly with the pore diameters. On the other hand, the specific area for reactiondecreases with increasing dM but to a less significant extent than the promotion of thediffusion. However, the hot spot temperature increases further with increasing con-version and eventually will lead to destruction of the catalyst. Therefore, a maximumof 200 nm of the macro-pore diameter can be suggested for this case.
The influence of micro-pore diameter dm on the overall reactor performance isshown in Figure 9.10. The conversion of n-butane decreases rapidly with increasingdm. Even though the selectivity increases slightly, the overall yield of the productdecreases with increasing dm. The decrease of conversion is a consequence of the de-creasing specific area with decreasing dm. Since the micro-pore diameter is in thedenominator for calculating the specific area, a reduced value of dm will lead to muchhigher surface area and thus an enhanced reaction rate. Whilst, the diffusivity de-creases with decreasing dm. The decrease of the selectivity is probably because theparallel and consecutive reactions are both enhanced with higher surface area andslower diffusion. Again, taking into account the hot-spot temperature, a minimumvalue of 0.8 nm can be suggested for the micro-pore diameter based on the presentedresults.
The results of the reactor performance in regard to the changing pore diametersreveal that the ‘bi-modal’ catalyst with larger transport pores (higher value of dM ) andhigher surface area (lower values of dm) are preferred for the given kinetics. Similarresults can be found in the work of Hegedus [130] even though the reactions studiedwere totally different. In order to check the generality of the obtained results, the

9.3 Conclusions 109
kinetic parameters (ai) are changed artificially to a ‘better’ catalyst and the simulationswere repeated. Similar behaviour can be found for the reactor performance withrespect to the pore structure parameters. In the case of the modified kinetics, theoptimal value for εM is 0.2. The same values are found for dM and dm with highestyield within the limited values calculated. With this, it is possible to say that porestructure optimization can be a general strategy for improving the efficiency of thecatalyst as well as the processes. The optimal structure can be different with differentreaction kinetics or process parameters.
One may observe that the reactor performance is more sensitive to εM and dm thandM at the given conditions. Since the micro-pore diameter is formed during synthesisthe active powder, tuning this parameter is rather difficult. The pore structure of themacro-pores may be manipulated by pore-templating e.g. by embedding of polymericmicro-spheres into the pellet as suggested by Hegedus [130]. For example, the macro-porosity and macro-pore diameter maybe tuned by the portion and size of the templateadded. Carreon and Guliants [238] have synthesized macroporous VPP catalyst byemploying monodisperse polystyrene spheres arrays as a template. They reportedbetter performance of the macroporous VPP catalyst compared to the conventionalorganic VPP catalyst. The authors attribute the better performance to the highsurface area and active phase of the precursor [239].
9.3 Conclusions
N-butane oxidation to maleic anhydride in a fixed-bed reactor has been simulatedwith a detailed two-dimensional heterogeneous model. The diffusion-reaction balancesinside the pellet were solved with the help of the micro- and macro pore model ofWakao and Smith [92, 131] considering both Knudsen and molecular diffusion in themicro and macro pore regions. Effects of the pore structure parameters εM , dM anddm on the performance of the reactor were highlighted. With the overall yield ofmaleic anhydride as target object, catalyst pellets with bi-modality, bigger macro-pore and smaller micro-pore are favoured from the simulation results. The optimalvalues of the pore structure parameters correspond to the given operation conditionand kinetics used in this work. The model parameters could be adjusted according toexperimental inputs when translated to other systems. Rational design and synthesisof VPP catalyst with desirable pore structure may offer a new strategy to improvethis process.

Bibliography
[1] R. H. Wilhelm, Progress towards the a priori design of chemical reactors, Pureand Applied Chemistry 5 (3-4).
[2] G. F. Froment, Chemical reactor analysis and design, 3rd Edition, Wiley,Hoboken, N.J, 2011.
[3] R. Aris, Elementary chemical reactor analysis, Dover Publication, Mineola, N.Y,1999.
[4] O. Levenspiel, Chemical reaction engineering, 3rd Edition, Wiley, New York,1999.
[5] S. Ergun, Fluid flow through packed columns, Chemical Engineering Progress48 (1952) 89–94.
[6] H. Freund, K. Sundmacher, Towards a methodology for the systematic analysisand design of efficient chemical processes, Chemical Engineering and Processing:Process Intensification 47 (12) (2008) 2051–2060.
[7] J. Joshi, K. Nandakumar, Computational Modeling of Multiphase Reactors,Annual Review of Chemical and Biomolecular Engineering 6 (1) (2015) 347–378.
[8] J. M. Thomas, W. J. Thomas, Principles and practice of heterogeneous catalysis,2nd Edition, Wiley-VCH, Weinheim, 2015.
[9] F. J. Keil, Complexities in modeling of heterogeneous catalytic reactions, Com-puters & Mathematics with Applications 65 (10) (2013) 1674–1697.
[10] S. S. Elnashaie, Modelling, simulation and optimization of industrial fixed bedcatalytic reactors, Vol. 7, CRC Press, 1994.
[11] F. J. Keil, Process intensification, Reviews in Chemical Engineering 0 (0).
[12] V. V. Ranade, Computational flow modeling for chemical reactor engineering,Elsevier, Amsterdam [u.a., 2002, oCLC: 874342924.
[13] S. Matera, M. Maestri, A. Cuoci, K. Reuter, Predictive-Quality Surface ReactionChemistry in Real Reactor Models: Integrating First-Principles Kinetic MonteCarlo Simulations into Computational Fluid Dynamics, ACS Catalysis 4 (11)(2014) 4081–4092.
[14] D. Vlachos, A. Mhadeshwar, N. Kaisare, Hierarchical multiscale model-baseddesign of experiments, catalysts, and reactors for fuel processing, Computers &Chemical Engineering 30 (10-12) (2006) 1712–1724.

Bibliography 111
[15] F. J. Keil, Modelling of phenomena within catalyst particles, Chemical Engin-eering Science 51 (10) (1996) 1543–1567.
[16] A. Ko lodziej, J. Lojewska, Experimental and modelling study on flow resistanceof wire gauzes, Chemical Engineering and Processing: Process Intensification48 (3) (2009) 816–822.
[17] V. I. Vanchurin, E. V. Golovnya, A. V. Yashchenko, Oxidation of ammonia onwoven and knitted platinoid gauzes, Catalysis in Industry 4 (2) (2012) 105–109.
[18] N. Waletzko, L. D. Schmidt, Modeling catalytic gauze reactors: HCN synthesis,AIChE Journal 34 (7) (1988) 1146–1156.
[19] M. Baker, P. Young, G. Tabor, Image based meshing of packed beds of cylindersat low aspect ratios using 3d MRI coupled with computational fluid dynamics,Computers & Chemical Engineering 35 (10) (2011) 1969–1977.
[20] E. Yuen, A. Sederman, F. Sani, P. Alexander, L. Gladden, Correlations betweenlocal conversion and hydrodynamics in a 3-D fixed-bed esterification process:An MRI and lattice-Boltzmann study, Chemical Engineering Science 58 (3-6)(2003) 613–619.
[21] X. Fan, X. Ou, F. Xing, G. A. Tdisableurley, P. Denissenko, M. A. Williams,N. Batail, C. Pham, A. A. Lapkin, Microtomography-based numerical simula-tions of heat transfer and fluid flow through β-SiC open-cell foams for catalysis,Catalysis Today.
[22] S. Meinicke, T. Wetzel, B. Dietrich, Scale-resolved CFD modelling of single-phase hydrodynamics and conjugate heat transfer in solid sponges, InternationalJournal of Heat and Mass Transfer 108 (2017) 1207–1219.
[23] M. Twigg, J. Richardson, Theory and Applications of Ceramic Foam Catalysts,Chemical Engineering Research and Design 80 (2) (2002) 183–189.
[24] E. Tsotsas, M7 Heat and Mass Transfer in Packed Beds with Fluid Flow, in:VDI e. V. (Ed.), VDI Heat Atlas, Springer Berlin Heidelberg, Berlin, Heidelberg,2010, pp. 1327–1342.
[25] G. D. Wehinger, Particle-resolved CFD simulations of catalytic flow reactors,Ph.D. thesis, Technische Universitat Berlin (2016).
[26] T. Eppinger, K. Seidler, M. Kraume, DEM-CFD simulations of fixed bed reactorswith small tube to particle diameter ratios, Chemical Engineering Journal 166 (1)(2011) 324–331.
[27] Y. Dong, B. Sosna, O. Korup, F. Rosowski, R. Horn, Investigation of radialheat transfer in a fixed-bed reactor: CFD simulations and profile measurements,Chemical Engineering Journal 317 (2017) 204–214.
[28] A. G. Dixon, M. Nijemeisland, CFD as a Design Tool for Fixed-Bed Reactors,Industrial & Engineering Chemistry Research 40 (23) (2001) 5246–5254.
[29] M. Nijemeisland, A. G. Dixon, Comparison of CFD simulations to experimentfor convective heat transfer in a gassolid fixed bed, Chemical Engineering Journal82 (1-3) (2001) 231–246.

112 Bibliography
[30] M. Nijemeisland, A. G. Dixon, E. Hugh Stitt, Catalyst design by CFD for heattransfer and reaction in steam reforming, Chemical Engineering Science 59 (22-23) (2004) 5185–5191.
[31] S. A. Logtenberg, A. G. Dixon, Computational fluid dynamics studies of fixedbed heat transfer, Chemical Engineering and Processing: Process Intensification37 (1) (1998) 7–21.
[32] A. G. Dixon, M. Ertan Taskin, E. Hugh Stitt, M. Nijemeisland, 3d CFD sim-ulations of steam reforming with resolved intraparticle reaction and gradients,Chemical Engineering Science 62 (18-20) (2007) 4963–4966.
[33] A. G. Dixon, M. Nijemeisland, E. H. Stitt, Packed Tubular Reactor Modelingand Catalyst Design using Computational Fluid Dynamics, in: Advances inChemical Engineering, Vol. 31, Elsevier, 2006, pp. 307–389.
[34] A. Guardo, M. Coussirat, M. Larrayoz, F. Recasens, E. Egusquiza, Influence ofthe turbulence model in CFD modeling of wall-to-fluid heat transfer in packedbeds, Chemical Engineering Science 60 (6) (2005) 1733–1742.
[35] H. Calis, J. Nijenhuis, B. Paikert, F. Dautzenberg, C. van den Bleek, CFDmodelling and experimental validation of pressure drop and flow profile in anovel structured catalytic reactor packing, Chemical Engineering Science 56 (4)(2001) 1713–1720.
[36] M. Baker, S. Daniels, P. Young, G. Tabor, Investigation of flow through a com-putationally generated packed column using CFD and Additive Layer Manufac-turing, Computers & Chemical Engineering 67 (2014) 159–165.
[37] M. Baker, G. Tabor, Computational analysis of transitional air flow throughpacked columns of spheres using the finite volume technique, Computers &Chemical Engineering 34 (6) (2010) 878–885.
[38] S. Romkes, F. Dautzenberg, C. van den Bleek, H. Calis, CFD modelling andexperimental validation of particle-to-fluid mass and heat transfer in a packedbed at very low channel to particle diameter ratio, Chemical Engineering Journal96 (1-3) (2003) 3–13.
[39] A. G. Dixon, CFD study of effect of inclination angle on transport and reactionin hollow cylinder catalysts, Chemical Engineering Research and Design 92 (7)(2014) 1279–1295.
[40] A. Singhal, S. Cloete, S. Radl, R. Quinta-Ferreira, S. Amini, Heat transfer toa gas from densely packed beds of monodisperse spherical particles, ChemicalEngineering Journal 314 (2017) 27–37.
[41] M. Behnam, A. G. Dixon, M. Nijemeisland, E. H. Stitt, Catalyst Deactivation in3d CFD Resolved Particle Simulations of Propane Dehydrogenation, Industrial& Engineering Chemistry Research 49 (21) (2010) 10641–10650.
[42] M. E. Taskin, A. G. Dixon, M. Nijemeisland, E. H. Stitt, CFD Study of theInfluence of Catalyst Particle Design on Steam Reforming Reaction Heat Effectsin Narrow Packed Tubes, Industrial & Engineering Chemistry Research 47 (16)(2008) 5966–5975.

Bibliography 113
[43] A. G. Dixon, J. Boudreau, A. Rocheleau, A. Troupel, M. E. Taskin, M. Nije-meisland, E. H. Stitt, Flow, Transport, and Reaction Interactions in ShapedCylindrical Particles for Steam Methane Reforming, Industrial & EngineeringChemistry Research 51 (49) (2012) 15839–15854.
[44] T. Eppinger, G. D. Wehinger, N. Jurtz, R. Aglave, M. Kraume, A numericaloptimization study on the catalytic dry reforming of methane in a spatially re-solved fixed-bed reactor, Chemical Engineering Research and Design 115 (2016)374–381.
[45] A. G. Dixon, Local transport and reaction rates in a fixed bed reactor tube: En-dothermic steam methane reforming, Chemical Engineering Science 168 (2017)156–177.
[46] A. Akolkar, J. Petrasch, Tomography-Based Characterization and OptimizationOf Fluid Flow Through Porous Media, Transport in Porous Media 95 (3) (2012)535–550.
[47] J. Theuerkauf, P. Witt, D. Schwesig, Analysis of particle porosity distribution infixed beds using the discrete element method, Powder Technology 165 (2) (2006)92–99.
[48] P. A. Cundall, O. D. Strack, A discrete numerical model for granular assemblies,geotechnique 29 (1) (1979) 47–65.
[49] S. Ookawara, M. Kuroki, D. Street, K. Ogawa, High-fidelity dem-cfd modelingof packed bed reactors for process intensification, in: Proceedings of EuropeanCongress of Chemical Engineering (ECCE-6), Copenhagen, 2007, pp. 16–20.
[50] M. V. Tabib, S. T. Johansen, S. Amini, A 3d CFD-DEM Methodology for Sim-ulating Industrial Scale Packed Bed Chemical Looping Combustion Reactors,Industrial & Engineering Chemistry Research 52 (34) (2013) 12041–12058.
[51] H. Bai, J. Theuerkauf, P. A. Gillis, P. M. Witt, A Coupled DEM and CFD Sim-ulation of Flow Field and Pressure Drop in Fixed Bed Reactor with RandomlyPacked Catalyst Particles, Industrial & Engineering Chemistry Research 48 (8)(2009) 4060–4074.
[52] N. Zobel, T. Eppinger, F. Behrendt, M. Kraume, Influence of the wall structureon the void fraction distribution in packed beds, Chemical Engineering Science71 (2012) 212–219.
[53] W. Soppe, Computer simulation of random packings of hard spheres, PowderTechnology 62 (2) (1990) 189–197.
[54] H. Freund, T. Zeiser, F. Huber, E. Klemm, G. Brenner, F. Durst, G. Emig,Numerical simulations of single phase reacting flows in randomly packed fixed-bed reactors and experimental validation, Chemical Engineering Science 58 (3-6)(2003) 903–910.
[55] H. Freund, J. Bauer, T. Zeiser, G. Emig, Detailed Simulation of TransportProcesses in Fixed-Beds, Industrial & Engineering Chemistry Research 44 (16)(2005) 6423–6434.
[56] R. Caulkin, M. Fairweather, X. Jia, A. Ahmad, R. A. Williams, Application of adigital packing algorithm to cylindrical pellet-packed beds, in: Computer AidedChemical Engineering, Vol. 25, Elsevier, 2008, pp. 745–750.

114 Bibliography
[57] H. Stitt, M. Marigo, S. Wilkinson, How Good is Your Model?, Johnson MattheyTechnology Review 59 (2) (2015) 74–89.
[58] M. Marigo, E. H. Stitt, Discrete Element Method (DEM) for Industrial Applica-tions: Comments on Calibration and Validation for the Modelling of CylindricalPellets, KONA Powder and Particle Journal 32 (0) (2015) 236–252.
[59] M. Dosta, S. Dale, S. Antonyuk, C. Wassgren, S. Heinrich, J. D. Litster, Nu-merical and experimental analysis of influence of granule microstructure on itscompression breakage, Powder Technology 299 (2016) 87–97.
[60] S. Eckhard, M. Fries, S. Antonyuk, S. Heinrich, Dependencies between internalstructure and mechanical properties of spray dried granules Experimental studyand DEM simulation, Advanced Powder Technology 28 (1) (2017) 185–196.
[61] Z. Yan, S. K. Wilkinson, E. H. Stitt, M. Marigo, Discrete element modelling(DEM) input parameters: understanding their impact on model predictions us-ing statistical analysis, Computational Particle Mechanics 2 (3) (2015) 283–299.
[62] T. Atmakidis, E. Y. Kenig, CFD-based analysis of the wall effect on the pressuredrop in packed beds with moderate tube/particle diameter ratios in the laminarflow regime, Chemical Engineering Journal 155 (1-2) (2009) 404–410.
[63] A. G. Dixon, M. Nijemeisland, E. H. Stitt, Systematic mesh development for3d CFD simulation of fixed beds: Contact points study, Computers & ChemicalEngineering 48 (2013) 135–153.
[64] G. D. Wehinger, C. Futterer, M. Kraume, Contact Modifications for CFD Sim-ulations of Fixed-Bed Reactors: Cylindrical Particles, Industrial & EngineeringChemistry Research 56 (1) (2017) 87–99.
[65] G. Boccardo, F. Augier, Y. Haroun, D. Ferre, D. L. Marchisio, Validation of anovel open-source work-flow for the simulation of packed-bed reactors, ChemicalEngineering Journal 279 (2015) 809–820.
[66] S. Rebughini, A. Cuoci, M. Maestri, Handling contact points in reactive CFDsimulations of heterogeneous catalytic fixed bed reactors, Chemical EngineeringScience 141 (2016) 240–249.
[67] M. Maestri, A. Cuoci, Coupling CFD with detailed microkinetic modeling inheterogeneous catalysis, Chemical Engineering Science 96 (2013) 106–117.
[68] G. Mestl, D. Lesser, T. Turek, Optimum Performance of Vanadyl PyrophosphateCatalysts, Topics in Catalysis 59 (17-18) (2016) 1533–1544.
[69] S. A. Schunk, Oxyfunctionalization of Alkanes, in: Handbook of HeterogeneousCatalysis, Wiley-VCH Verlag GmbH & Co. KGaA, Weinheim, Germany, 2008,pp. 3400–3425.
[70] V. Guliants, J. Benziger, S. Sundaresan, I. Wachs, Molecular structure-reactivityrelationships in n-butane oxidation over bulk VPO and supported vanadia cata-lysts: Lessons for molecular engineering of new selective catalysts for alkaneoxidation, in: Studies in Surface Science and Catalysis, Vol. 130, Elsevier, 2000,pp. 1721–1726.

Bibliography 115
[71] R. K. Sharma, D. L. Cresswell, E. J. Newson, Kinetics and fixed-bed reactormodeling of butane oxidation to maleic anhydride, AIChE Journal 37 (1) (1991)39–47.
[72] F. Trifiro, R. K. Grasselli, How the Yield of Maleic Anhydride in n-Butane Oxid-ation, Using VPO Catalysts, was Improved Over the Years, Topics in Catalysis57 (14) (2014) 1188–1195.
[73] J. C. Vedrine, G. J. Hutchings, C. J. Kiely, Molybdenum oxide model catalystsand vanadium phosphates as actual catalysts for understanding heterogeneouscatalytic partial oxidation reactions: A contribution by jean-claude volta, Cata-lysis Today 217 (2013) 57–64.
[74] C. Kiely, Characterisation of variations in vanadium phosphate catalyst micro-structure with preparation route, Journal of Catalysis 162 (1) (1996) 31–47.
[75] G. J. Hutchings, Vanadium phosphate: a new look at the active components ofcatalysts for the oxidation of butane to maleic anhydride, Journal of MaterialsChemistry 14 (23) (2004) 3385.
[76] D. Lesser, G. Mestl, T. Turek, Transient behavior of vanadyl pyrophosphatecatalysts during the partial oxidation of n-butane in industrial-sized, fixed bedreactors, Applied Catalysis A: General 510 (2016) 1–10.
[77] S. Hofmann, T. Turek, Process intensification of n-butane oxidation to maleicanhydride in a milli-structured reactor, Chemical Engineering & Technology.
[78] P. Marın, C. Hamel, S. Ordonez, F. Dıez, E. Tsotsas, A. Seidel-Morgenstern,Analysis of a fluidized bed membrane reactor for butane partial oxidation tomaleic anhydride: 2d modelling, Chemical Engineering Science 65 (11) (2010)3538–3548.
[79] H. Lintz, A. Reitzmann, Alternative Reaction Engineering Concepts in PartialOxidations on Oxidic Catalysts, Catalysis Reviews 49 (1) (2007) 1–32.
[80] B. Partopour, A. G. Dixon, Resolved-particle fixed bed CFD with microkineticsfor ethylene oxidation, AIChE Journal 63 (1) (2017) 87–94.
[81] G. D. Wehinger, F. Klippel, M. Kraume, Modeling pore processes for particle-resolved CFD simulations of catalytic fixed-bed reactors, Computers & ChemicalEngineering 101 (2017) 11–22.
[82] R. Horn, K. Williams, N. Degenstein, L. Schmidt, Syngas by catalytic partialoxidation of methane on rhodium: Mechanistic conclusions from spatially re-solved measurements and numerical simulations, Journal of Catalysis 242 (1)(2006) 92–102.
[83] R. Horn, K. Williams, N. Degenstein, L. Schmidt, Mechanism of H2 and COformation in the catalytic partial oxidation of CH4 on Rh probed by steady-statespatial profiles and spatially resolved transients, Chemical Engineering Science62 (5) (2007) 1298–1307.
[84] J. Touitou, F. Aiouache, R. Burch, R. Douglas, C. Hardacre, K. Morgan, J. S,C. Stewart, J. Stewart, A. Goguet, Evaluation of an in situ spatial resolutioninstrument for fixed beds through the assessment of the invasiveness of probesand a comparison with a micro-kinetic model, Journal of Catalysis 319 (2014)239–246.

116 Bibliography
[85] O. Korup, C. F. Goldsmith, G. Weinberg, M. Geske, T. Kandemir, R. Schlogl,R. Horn, Catalytic partial oxidation of methane on platinum investigated by spa-tial reactor profiles, spatially resolved spectroscopy, and microkinetic modeling,Journal of Catalysis 297 (2013) 1–16.
[86] H. Schwarz, Gas-phase methane oxidation investigated by laser-induced fluores-cence, species profile measurements and kinetic reactor simulations, Ph.D. thesis,Technische Universitat Berlin (Jan. 2014).
[87] H.-J. Freund, G. Meijer, M. Scheffler, R. Schlogl, M. Wolf, CO Oxidation as aPrototypical Reaction for Heterogeneous Processes, Angewandte Chemie Inter-national Edition 50 (43) (2011) 10064–10094.
[88] J. Gerdts, Foam catalyst for partial oxidation reactions studied by x-ray micro-tomography, reactor profile measurements and numerical simulations, Master’sthesis, Hamburg University of Technology (2016).
[89] N. Ellenfeld, Investigation of porosity profiles, heat and mass transport in cata-lyst packings of hollow cylinders and split, Master’s thesis, Hamburg Universityof Technology (Mar. 2016).
[90] B. Sosna, Determination of effective axial and radial heat transfer coefficientsin a fixed catalyst bed by experiment and simulation, Master’s thesis, HamburgUniversity of Technology (May 2015).
[91] F. Cavani, C. Cortelli, A. Frattini, G. Puccinotti, M. Ricotta, F. Rodeghiero,F. Trifir, C. Fumagalli, G. Mazzoni, The dilution of vanadyl pyrophosphate,catalyst for n-butane oxidation to maleic anhydride, with aluminum phosphate:unexpected reactivity due to the contribution of the diluting agent, Topics inCatalysis 38 (4) (2006) 295–301.
[92] N. Wakao, J. Smith, Diffusion in catalyst pellets, Chemical Engineering Science17 (11) (1962) 825–834.
[93] S. Rebughini, A. Cuoci, A. G. Dixon, M. Maestri, Cell agglomeration algorithmfor coupling microkinetic modeling and steady-state CFD simulations of catalyticreactors, Computers & Chemical Engineering 97 (2017) 175–182.
[94] T. Maffei, G. Gentile, S. Rebughini, M. Bracconi, F. Manelli, S. Lipp, A. Cuoci,M. Maestri, A multiregion operator-splitting CFD approach for coupling mi-crokinetic modeling with internal porous transport in heterogeneous catalyticreactors, Chemical Engineering Journal 283 (2016) 1392–1404.
[95] N. Hansen, Multiscale modeling of reaction and diffusion in Zeolites, Ph.D.thesis, Hamburg University of Technology (2010).
[96] O. R. Derkx, A. G. Dixon, Effect of the wall Nusselt number on the simulationof catalytic fixed bed reactors, Catalysis Today 35 (4) (1997) 435–442.
[97] M. Winterberg, E. Tsotsas, A. Krischke, D. Vortmeyer, A simple and coherentset of coefficients for modelling of heat and mass transport with and withoutchemical reaction in tubes filled with spheres, Chemical Engineering Science55 (5) (2000) 967–979.
[98] A. G. Dixon, Fixed bed catalytic reactor modelling-the radial heat transfer prob-lem, The Canadian Journal of Chemical Engineering 90 (3) (2012) 507–527.

Bibliography 117
[99] M. Kleiber, R. Joh, D1 Calculation Methods for Thermophysical Properties, in:VDI e. V. (Ed.), VDI Heat Atlas, Springer Berlin Heidelberg, Berlin, Heidelberg,2010, pp. 119–152.
[100] J. Papageorgiou, G. Froment, Simulation models accounting for radial voidageprofiles in fixed-bed reactors, Chemical Engineering Science 50 (19) (1995) 3043–3056.
[101] J. M. P. Q. Delgado, A critical review of dispersion in packed beds, Heat andMass Transfer 42 (4) (2006) 279–310.
[102] R. W. Fahien, J. M. Smith, Mass transfer in packed beds, AIChE Journal 1 (1)(1955) 28–37.
[103] O. Bey, G. Eigenberger, Fluid flow through catalyst filled tubes, Chemical En-gineering Science 52 (8) (1997) 1365–1376.
[104] J. G. H. Borkink, K. R. Westerterp, Significance of axial heat dispersion for thedescription of heat transport in wall-cooled packed beds, Chemical Engineering& Technology 15 (6) (1992) 371–384.
[105] E. Tsotsas, E.-U. Schlunder, Heat transfer in packed beds with fluid flow: re-marks on the meaning and the calculation of a heat transfer coefficient at thewall, Chemical Engineering Science 45 (4) (1990) 819–837.
[106] E. Tsotsas, H. Martin, Thermal conductivity of packed beds: A review, ChemicalEngineering and Processing: Process Intensification 22 (1) (1987) 19–37.
[107] P. Magnico, Pore-scale simulations of unsteady flow and heat transfer in tubularfixed beds, AIChE Journal 55 (4) (2009) 849–867.
[108] B. Eisfeld, K. Schnitzlein, The influence of confining walls on the pressure dropin packed beds, Chemical Engineering Science 56 (14) (2001) 4321–4329.
[109] A. G. Dixon, An improved equation for the overall heat transfer coefficientin packed beds, Chemical Engineering and Processing: Process Intensification35 (5) (1996) 323–331.
[110] M. Nijemeisland, A. G. Dixon, CFD study of fluid flow and wall heat transferin a fixed bed of spheres, AIChE Journal 50 (5) (2004) 906–921.
[111] B. Sosna, Y. Dong, L. Chromow, O. Korup, R. Horn, Effective Axial ThermalConductivity in Catalyst Packings from High Resolution Temperature Profiles,Chemie Ingenieur Technik 88 (11) (2016) 1676–1683.
[112] R. Wijngaarden, K. Westerterp, Do the effective heat conductivity and the heattransfer coefficient at the wall inside a packed bed depend on a chemical reaction?Weaknesses and applicability of current models, Chemical Engineering Science44 (8) (1989) 1653–1663.
[113] K. Vollmari, T. Oschmann, S. Wirtz, H. Kruggel-Emden, Pressure drop invest-igations in packings of arbitrary shaped particles, Powder Technology 271 (2015)109–124.
[114] A. G. Dixon, G. Walls, H. Stanness, M. Nijemeisland, E. H. Stitt, Experimentalvalidation of high Reynolds number CFD simulations of heat transfer in a pilot-scale fixed bed tube, Chemical Engineering Journal 200-202 (2012) 344–356.

118 Bibliography
[115] M. Behnam, A. G. Dixon, M. Nijemeisland, E. H. Stitt, A New Approach toFixed Bed Radial Heat Transfer Modeling Using Velocity Fields from Compu-tational Fluid Dynamics Simulations, Industrial & Engineering Chemistry Re-search 52 (44) (2013) 15244–15261.
[116] M. T. Zambon, D. A. Asensio, G. F. Barreto, G. D. Mazza, Application of Com-putational Fluid Dynamics (CFD) for the Evaluation of Fluid Convective RadialHeat Transfer Parameters in Packed Beds, Industrial & Engineering ChemistryResearch 53 (49) (2014) 19052–19061.
[117] G. D. Wehinger, T. Eppinger, M. Kraume, Detailed numerical simulations ofcatalytic fixed-bed reactors: Heterogeneous dry reforming of methane, ChemicalEngineering Science 122 (2015) 197–209.
[118] G. D. Wehinger, T. Eppinger, M. Kraume, Evaluating Catalytic Fixed-Bed Re-actors for Dry Reforming of Methane with Detailed CFD, Chemie IngenieurTechnik 87 (6) (2015) 734–745.
[119] M. Behnam, A. G. Dixon, P. M. Wright, M. Nijemeisland, E. H. Stitt, Compar-ison of CFD simulations to experiment under methane steam reforming reactingconditions, Chemical Engineering Journal 207-208 (2012) 690–700.
[120] A. G. Dixon, M. E. Taskin, M. Nijemeisland, E. H. Stitt, CFD Method ToCouple Three-Dimensional Transport and Reaction inside Catalyst Particles tothe Fixed Bed Flow Field, Industrial & Engineering Chemistry Research 49 (19)(2010) 9012–9025.
[121] B. Partopour, A. G. Dixon, Computationally efficient incorporation of microkin-etics into resolved-particle CFD simulations of fixed-bed reactors, Computers &Chemical Engineering 88 (2016) 126–134.
[122] M. Salciccioli, M. Stamatakis, S. Caratzoulas, D. Vlachos, A review of multiscalemodeling of metal-catalyzed reactions: Mechanism development for complexityand emergent behavior, Chemical Engineering Science 66 (19) (2011) 4319–4355.
[123] M. P. Dudukovic, F. Larachi, P. L. Mills, Multiphase reactors revisited, Chem-ical Engineering Science 54 (13-14) (1999) 1975–1995.
[124] H. A. Jakobsen, Chemical Reactor Modeling, Springer International Publishing,Cham, 2014.
[125] M. Johnson, Pore structure and gaseous diffusion in solid catalysts, Journal ofCatalysis 4 (2) (1965) 248–252.
[126] J. Szekely, J. Evans, A structural model for gas-solid reactions with a movingboundary-II, Chemical Engineering Science 26 (11) (1971) 1901–1913.
[127] C. Rieckmann, F. J. Keil, Simulation and experiment of multicomponent diffu-sion and reaction in three-dimensional networks, Chemical Engineering Science54 (15-16) (1999) 3485–3493.
[128] J. Solsvik, H. A. Jakobsen, Multicomponent mass diffusion in porous pellets:Effects of flux models on the pellet level and impacts on the reactor level. Ap-plication to methanol synthesis, The Canadian Journal of Chemical Engineering91 (1) (2013) 66–76.

Bibliography 119
[129] J. Solsvik, H. A. Jakobsen, Impacts on the Reactor Performance of Intra-ParticleMulticomponent Mass Diffusion Limitations: Knudsen Diffusion, Energy Pro-cedia 26 (2012) 116–124.
[130] L. L. Hegedus, Catalyst Pore Structures by Constrained Nonlinear Optimization,Industrial & Engineering Chemistry Product Research and Development 19 (4)(1980) 533–537.
[131] N. Wakao, J. M. Smith, Diffusion and Reaction in Porous Catalysts, Industrial& Engineering Chemistry Fundamentals 3 (2) (1964) 123–127.
[132] J. Solsvik, H. A. Jakobsen, A Survey of Multicomponent Mass Diffusion FluxClosures for Porous Pellets: Mass and Molar Forms, Transport in Porous Media93 (1) (2012) 99–126.
[133] D. Schlereth, O. Hinrichsen, A fixed-bed reactor modeling study on the methana-tion of CO2, Chemical Engineering Research and Design 92 (4) (2014) 702–712.
[134] M. Giese, K. Rottschafer, D. Vortmeyer, Measured and modeled superficial flowprofiles in packed beds with liquid flow, AIChE Journal 44 (2) (1998) 484–490.
[135] O. Bey, G. Eigenberger, Gas flow and heat transfer through catalyst filled tubes,International Journal of Thermal Sciences 40 (2) (2001) 152–164.
[136] P. Marın, F. V. Dıez, S. Ordonez, Fixed bed membrane reactors for WGSR-based hydrogen production: Optimisation of modelling approaches and reactorperformance, International Journal of Hydrogen Energy 37 (6) (2012) 4997–5010.
[137] M. L. Hunt, C. L. Tien, Non-Darcian Convection in Cylindrical Packed Beds,Journal of Heat Transfer 110 (2) (1988) 378.
[138] Y. A. Zou R.P., Wall effect on the packing of cylindrical particles, ChemicalEngineering Science 51 (7) (1996) 1177–1180.
[139] A. G. Dixon, A. K. Gurnon, M. Nijemeisland, E. H. Stitt, CFD testing of thepointwise use of the ZehnerSchlunder formulas for fixed-bed stagnant thermalconductivity, International Communications in Heat and Mass Transfer 42(2013) 1–4.
[140] STAR-CCM+ User guide, CD-adapco (2017).
[141] G. D. Wehinger, M. Kraume, V. Berg, O. Korup, K. Mette, R. Schlogl,M. Behrens, R. Horn, Investigating dry reforming of methane with spatial re-actor profiles and particle-resolved CFD simulations, AIChE Journal 62 (12)(2016) 4436–4452.
[142] M. Sakai, M. Abe, Y. Shigeto, S. Mizutani, H. Takahashi, A. Vire, J. R. Percival,J. Xiang, C. C. Pain, Verification and validation of a coarse grain model of theDEM in a bubbling fluidized bed, Chemical Engineering Journal 244 (2014)33–43.
[143] A. Di Renzo, F. P. Di Maio, Comparison of contact-force models for the sim-ulation of collisions in DEM-based granular flow codes, Chemical EngineeringScience 59 (3) (2004) 525–541.
[144] K. L. Johnson, Contact mechanics, 9th Edition, Cambridge Univ. Press, Cam-bridge, 2003.

120 Bibliography
[145] J. H. Ferziger, M. Peric, Computational methods for fluid dynamics, 2nd Edition,Springer, Berlin ; New York, 1999.
[146] O. Deutschmann, Modeling of the Interactions Between Catalytic Surfaces andGas-Phase, Catalysis Letters 145 (1) (2015) 272–289.
[147] V. M. Janardhanan, O. Deutschmann, Computational Fluid Dynamics of Cata-lytic Reactors, in: O. Deutschmann (Ed.), Modeling and Simulation of Hetero-geneous Catalytic Reactions, Wiley-VCH Verlag GmbH & Co. KGaA, Weinheim,Germany, 2011, pp. 251–282.
[148] R. Quiceno, J. Perez-Ramrez, J. Warnatz, O. Deutschmann, Modeling the high-temperature catalytic partial oxidation of methane over platinum gauze: De-tailed gas-phase and surface chemistries coupled with 3d flow field simulations,Applied Catalysis A: General 303 (2) (2006) 166–176.
[149] B. E. Poling, The properties of gases and liquids, 5th Edition, McGraw-Hill,New York, 2001.
[150] O. Deutschmann, Computational Fluid Dynamics Simulation of Catalytic Re-actors, in: Handbook of Heterogeneous Catalysis, Wiley-VCH Verlag GmbH &Co. KGaA, Weinheim, Germany, 2008, pp. 1811–1828.
[151] I. Chorkendorff, J. W. Niemantsverdriet, Concepts of modern catalysis and kin-etics, Wiley-VCH, Weinheim [Germany], 2003, oCLC: ocm51862977.
[152] R. Prins, A. Wang, X. Li, Introduction to heterogeneous catalysis, no. volume1 in Advanced textbooks in chemistry, World Scientific, Imperial College Press,Hackensack, NJ, 2016.
[153] C. T. Campbell, Future Directions and Industrial Perspectives Micro- andmacro-kinetics: Their relationship in heterogeneous catalysis, Topics in Cata-lysis 1 (3-4) (1994) 353–366.
[154] J. A. Dumesic, The microkinetics of heterogeneous catalysis, An AmericanChemical Society Publication, 1993.
[155] M. Neurock, The microkinetics of heterogeneous catalysis. By J. A. Dumesic, D.F. Rudd, L. M. Aparicio, J. E. Rekoske, and A. A. Trevino, ACS ProfessionalReference Book, American Chemical Society, Washington, DC, 1993, 315 pp.,AIChE Journal 40 (6) (1994) 1085–1087.
[156] A. A. Gokhale, S. Kandoi, J. P. Greeley, M. Mavrikakis, J. A. Dumesic,Molecular-level descriptions of surface chemistry in kinetic models using densityfunctional theory, Chemical Engineering Science 59 (22-23) (2004) 4679–4691.
[157] C. F. Goldsmith, R. H. West, Automatic Generation of Microkinetic Mechanismsfor Heterogeneous Catalysis, The Journal of Physical Chemistry C 121 (18)(2017) 9970–9981.
[158] P. Stoltze, Microkinetic simulation of catalytic reactions, Progress in SurfaceScience 65 (3-4) (2000) 65–150.
[159] K. Reuter, Ab Initio Thermodynamics and First-Principles Microkinetics forSurface Catalysis, Catalysis Letters 146 (3) (2016) 541–563.

Bibliography 121
[160] H. K. Versteeg, W. Malalasekera, An introduction to computational fluid dynam-ics: the finite volume method, nachdr. Edition, Pearson/Prentice Hall, Harlow,2005, oCLC: 255001925.
[161] P. A. Davidson, Turbulence: an introduction for scientists and engineers, OxfordUniversity Press, Oxford, UK ; New York, 2004.
[162] D. Seguin, A. Montillet, J. Comiti, Experimental characterisation of flow regimesin various porous mediaI: Limit of laminar flow regime, Chemical EngineeringScience 53 (21) (1998) 3751–3761.
[163] B. Launder, D. Spalding, The numerical computation of turbulent flows, Com-puter Methods in Applied Mechanics and Engineering 3 (2) (1974) 269–289.
[164] T. L. Chambers, D. C. Wilcox, Critical examination of two-equation turbulenceclosure models for boundary layers, AIAA J 15 (6) (1977) 821–828.
[165] D. C. Wilcox, Formulation of the k-w Turbulence Model Revisited, AIAAJournal 46 (11) (2008) 2823–2838.
[166] W. Jones, B. Launder, The prediction of laminarization with a two-equationmodel of turbulence, International journal of heat and mass transfer 15 (2) (1972)301–314.
[167] T.-H. Shih, W. W. Liou, A. Shabbir, Z. Yang, J. Zhu, A new k- eddy viscositymodel for high reynolds number turbulent flows, Computers & Fluids 24 (3)(1995) 227–238.
[168] Wiley-VCH Verlag GmbH & Co. KGaA (Ed.), Ullmann’s Encyclopedia of Indus-trial Chemistry, Wiley-VCH Verlag GmbH & Co. KGaA, Weinheim, Germany,2000.
[169] V. Sadykov, L. Isupova, I. Zolotarskii, L. Bobrova, A. Noskov, V. Parmon,E. Brushtein, T. Telyatnikova, V. Chernyshev, V. Lunin, Oxide catalysts forammonia oxidation in nitric acid production: properties and perspectives, Ap-plied Catalysis A: General 204 (1) (2000) 59–87.
[170] C. H. Bartholomew, R. J. Farrauto, Fundamentals of Industrial Catalytic Pro-cesses: Bartholomew/Fundamentals, John Wiley & Sons, Inc., Hoboken, NJ,USA, 2005.
[171] A. Jess, U. Kragl, P. Wasserscheid, Chemical technology: an integral textbook,Wiley-VCH, Weinheim, 2009.
[172] H. Schwarz, Y. Dong, R. Horn, Catalytic Methane Combustion on a Pt Gauze:Laser-Induced Fluorescence Spectroscopy, Species Profiles, and Simulations,Chemical Engineering & Technology 39 (11) (2016) 2011–2019.
[173] C. de Smet, M. de Croon, R. Berger, G. Marin, J. Schouten, An experimentalreactor to study the intrinsic kinetics of catalytic partial oxidation of methane inthe presence of heat-transport limitations, Applied Catalysis A: General 187 (1)(1999) 33–48.
[174] G. P. Smith, D. M. Golden, M. Frenklach, N. W. Moriarty, B. Eiteneer,M. Goldenberg, C. T. Bowman, R. K. Hanson, S. Song, W. C. Gardiner Jr,et al., Gri-mech 3.0 (1999).

122 Bibliography
[175] O. Deutschmann, R. Schmidt, F. Behrendt, J. Warnat, Numerical modelingof catalytic ignition, Symposium (International) on Combustion 26 (1) (1996)1747–1754.
[176] Z. Ren, S. B. Pope, Second-order splitting schemes for a class of reactive systems,Journal of Computational Physics 227 (17) (2008) 8165–8176.
[177] H. Schwarz, M. Geske, C. Franklin Goldsmith, R. Schlogl, R. Horn, Fuel-richmethane oxidation in a high-pressure flow reactor studied by optical-fiber laser-induced fluorescence, multi-species sampling profile measurements and detailedkinetic simulations, Combustion and Flame 161 (7) (2014) 1688–1700.
[178] L. Giani, G. Groppi, E. Tronconi, Heat Transfer Characterization of MetallicFoams, Industrial & Engineering Chemistry Research 44 (24) (2005) 9078–9085.
[179] L. Giani, G. Groppi, E. Tronconi, Mass-Transfer Characterization of MetallicFoams as Supports for Structured Catalysts, Industrial & Engineering ChemistryResearch 44 (14) (2005) 4993–5002.
[180] G. Incera Garrido, F. Patcas, S. Lang, B. Kraushaar-Czarnetzki, Mass transferand pressure drop in ceramic foams: A description for different pore sizes andporosities, Chemical Engineering Science 63 (21) (2008) 5202–5217.
[181] E. Bianchi, W. Schwieger, H. Freund, Assessment of Periodic Open CellularStructures for Enhanced Heat Conduction in Catalytic Fixed-Bed Reactors:Heat Conduction in Periodic Open Cellular Structures, Advanced EngineeringMaterials 18 (4) (2016) 608–614.
[182] W. Peng, M. Xu, X. Li, X. Huai, Z. Liu, H. Wang, CFD study on thermal trans-port in open-cell metal foams with and without a washcoat: Effective thermalconductivity and gas-solid interfacial heat transfer, Chemical Engineering Sci-ence 161 (2017) 92–108.
[183] S. T. Kolaczkowski, S. Awdry, T. Smith, D. Thomas, L. Torkuhl, R. Kolvenbach,Potential for metal foams to act as structured catalyst supports in fixed-bedreactors, Catalysis Today 273 (2016) 221–233.
[184] A. Della Torre, G. Montenegro, G. Tabor, M. Wears, CFD characterization offlow regimes inside open cell foam substrates, International Journal of Heat andFluid Flow 50 (2014) 72–82.
[185] P. Ranut, E. Nobile, L. Mancini, High resolution X-ray microtomography-based CFD simulation for the characterization of flow permeability and effect-ive thermal conductivity of aluminum metal foams, Experimental Thermal andFluid Science 67 (2015) 30–36.
[186] E. Bianchi, T. Heidig, C. G. Visconti, G. Groppi, H. Freund, E. Tronconi, Heattransfer properties of metal foam supports for structured catalysts: Wall heattransfer coefficient, Catalysis Today 216 (2013) 121–134.
[187] S. Razza, T. Heidig, E. Bianchi, G. Groppi, W. Schwieger, E. Tronconi, H. Fre-und, Heat transfer performance of structured catalytic reactors packed withmetal foam supports: Influence of wall coupling, Catalysis Today 273 (2016)187–195.

Bibliography 123
[188] P. Ranut, On the effective thermal conductivity of aluminum metal foams: Re-view and improvement of the available empirical and analytical models, AppliedThermal Engineering 101 (2016) 496–524.
[189] A. Inayat, M. Klumpp, M. Lammermann, H. Freund, W. Schwieger, Develop-ment of a new pressure drop correlation for open-cell foams based completely ontheoretical grounds: Taking into account strut shape and geometric tortuosity,Chemical Engineering Journal 287 (2016) 704–719.
[190] G. Groppi, L. Giani, E. Tronconi, Generalized Correlation for Gas/Solid Mass-Transfer Coefficients in Metallic and Ceramic Foams, Industrial & EngineeringChemistry Research 46 (12) (2007) 3955–3958.
[191] P. Habisreuther, N. Djordjevic, N. Zarzalis, Statistical distribution of residencetime and tortuosity of flow through open-cell foams, Chemical Engineering Sci-ence 64 (23) (2009) 4943–4954.
[192] P. Parthasarathy, P. Habisreuther, N. Zarzalis, Evaluation of longitudinal dis-persion coefficient in open-cell foams using transient direct pore level simulation,Chemical Engineering Science 90 (2013) 242–249.
[193] G. D. Wehinger, H. Heitmann, M. Kraume, An artificial structure modeler for 3dCFD simulations of catalytic foams, Chemical Engineering Journal 284 (2016)543–556.
[194] A. Della Torre, F. Lucci, G. Montenegro, A. Onorati, P. Dimo-poulos Eggenschwiler, E. Tronconi, G. Groppi, CFD modeling of catalytic reac-tions in open-cell foam substrates, Computers & Chemical Engineering 92 (2016)55–63.
[195] R. Horn, O. Korup, M. Geske, U. Zavyalova, I. Oprea, R. Schlogl, Reactor for insitu measurements of spatially resolved kinetic data in heterogeneous catalysis,Review of Scientific Instruments 81 (6) (2010) 064102.
[196] http://www.panalytical.com/Empyrean.htm, accessed: 2017.
[197] http://imagej.net, accessed: 2017.
[198] O. Korup, S. Mavlyankariev, M. Geske, C. F. Goldsmith, R. Horn, Measurementand analysis of spatial reactor profiles in high temperature catalysis research,Chemical Engineering and Processing: Process Intensification 50 (10) (2011)998–1009.
[199] S. Kabelac, D. Vortmeyer, K1 Radiation of Surfaces, in: VDI e. V. (Ed.), VDIHeat Atlas, Springer Berlin Heidelberg, Berlin, Heidelberg, 2010, pp. 945–960.
[200] R. Siegel, J. R. Howell, Thermal radiation heat transfer, 2nd Edition, Series inthermal and fluids engineering, Hemisphere Pub. Corp, Washington, 1981.
[201] http://www.detchem.com, accessed: 2016.
[202] O. Deutschmann, L. Maier, U. Riedel, A. Stroemman, R. Dibble, Hydrogenassisted catalytic combustion of methane on platinum, Catalysis Today 59 (1-2)(2000) 141–150.

124 Bibliography
[203] H. Schwarz, M. Geske, C. F. Goldsmith, R. Schlogl, R. Horn, Fuel-rich methaneoxidation in a high-pressure flow reactor studied by optical-fiber laser-inducedfluorescence, multi-species sampling profile measurements and detailed kineticsimulations., Combust. Flame 161 (7) (2014) 1688–1700.
[204] M. A. Vannice, Kinetics of catalytic reactions, Springer, New York, 2005.
[205] G. E. Mueller, Numerically packing spheres in cylinders, Powder Technology159 (2) (2005) 105–110.
[206] A. de Klerk, Voidage variation in packed beds at small column to particle dia-meter ratio, AIChE Journal 49 (8) (2003) 2022–2029.
[207] GNU Image Manipulation Program, http://gimp.org (2016).
[208] A. I. Anastasov, A study of the influence of the operating parameters on thetemperature of the hot spot in a fixed bed reactor, Chemical Engineering Journal86 (3) (2002) 287–297.
[209] A. de Wasch, G. Froment, Heat transfer in packed beds, Chemical EngineeringScience 27 (3) (1972) 567–576.
[210] M. Freiwald, W. Paterson, Accuracy of model predictions and reliability of ex-perimental data for heat transfer in packed beds, Chemical Engineering Science47 (7) (1992) 1545–1560.
[211] R. Horn, N. J. Degenstein, K. A. Williams, L. D. Schmidt, Spatial and temporalprofiles in millisecond partial oxidation processes, Catalysis Letters 110 (3-4)(2006) 169–178.
[212] O. Korup, R. Schlogl, R. Horn, Carbon formation in catalytic partial oxidationof methane on platinum: Model studies on a polycrystalline Pt foil, CatalysisToday 181 (1) (2012) 177–183.
[213] A. Sederman, M. Johns, P. Alexander, L. Gladden, Structure-flow correlationsin packed beds, Chemical Engineering Science 53 (12) (1998) 2117–2128.
[214] M. Geske, O. Korup, R. Horn, Resolving kinetics and dynamics of a catalytic re-action inside a fixed bed reactor by combined kinetic and spectroscopic profiling,Catal. Sci. Technol. 3 (1) (2013) 169–175.
[215] M. Geske, K. Pelzer, R. Horn, F. Jentoft, R. Schlogl, In-situ investigation ofgas phase radical chemistry in the catalytic partial oxidation of methane on Pt,Catalysis Today 142 (1-2) (2009) 61–69.
[216] J. Gascon, R. Valenciano, C. Tellez, J. Herguido, M. Menendez, A generalizedkinetic model for the partial oxidation of n-butane to maleic anhydride underaerobic and anaerobic conditions, Chemical Engineering Science 61 (19) (2006)6385–6394.
[217] S. Bocklein, G. Mestl, S. V. Auras, J. Wintterlin, On the Correlation of Structureand Catalytic Performance of VPO Catalysts, Topics in Catalysis 60 (19-20)(2017) 1682–1697.
[218] C. Dobner, M. Duda, S. Storck, J. Weiguny, Catalyst and method for producingmaleic anhydride, european Patent EP1487576A1, BASF SE, 2002.URL https://patents.google.com/patent/EP1487576A1/en

Bibliography 125
[219] P. J. Linstrom, W. G. Mallard, NIST Chemistry WebBook; NIST StandardReference Database No. 69, Gaithersburg MD, 2001.
[220] C. Schulz, Ph.D. thesis, Technische Universitat Berlin (2018).
[221] C. Schulz, F. Pohl, F. Rosowski, B. Frank, to be submitted.
[222] W. M. Brandstadter, B. Kraushaar-Czarnetzki, Maleic Anhydride from Mixturesof n -Butenes and n -Butane: Simulation of a Production-Scale NonisothermalFixed-Bed Reactor, Industrial & Engineering Chemistry Research 46 (5) (2007)1475–1484.
[223] J. B. Benziger, V. Guliants, S. Sundaresan, New precursors to vanadium phos-phorus oxide catalysts, Catalysis Today 33 (1-3) (1997) 49–56.
[224] G. Centi, Some prospects and priorities for future research on vanadyl pyrophos-phate, Catalysis Today 16 (1) (1993) 147–153.
[225] R. Glaum, C. Welker-Nieuwoudt, C.-K. Dobner, M. Eichelbaum, F. Gruchow,C. Heine, A. Karpov, R. Kniep, F. Rosowski, R. Schlogl, S. A. Schunk, S. Titl-bach, A. Trunschke, Resource-Efficient Alkane Selective Oxidation on New Crys-talline Solids: Searching for Novel Catalyst Materials, Chemie Ingenieur Technik84 (10) (2012) 1766–1779.
[226] F. Keil, Diffusion and reaction in porous networks, Catalysis Today 53 (2) (1999)245–258.
[227] J. Wei, Catalyst designs to enhance diffusivity and performanceI: Concepts andanalysis, Chemical Engineering Science 66 (19) (2011) 4382–4388.
[228] M.-O. Coppens, J. Sun, T. Maschmeyer, Synthesis of hierarchical porous silicaswith a controlled pore size distribution at various length scales, Catalysis Today69 (1-4) (2001) 331–335.
[229] Y. Liu, J. Goebl, Y. Yin, Templated synthesis of nanostructured materials,Chem. Soc. Rev. 42 (7) (2013) 2610–2653.
[230] D. Luss, Reaction engineering of advanced ceramic materials, Chemical Engin-eering Science 45 (8) (1990) 1979–1999.
[231] M. A.-H. Ali, K. Al-Humaizi, Maleic anhydride production in a cross-flow re-actor: A comparative study, The Canadian Journal of Chemical Engineering92 (5) (2014) 876–883.
[232] J. Diedenhoven, A. Reitzmann, G. Mestl, T. Turek, A model for the phosphorusdynamics of VPO catalysts during the selective oxidation of n -butane to maleicanhydride in a tubular reactor, Chemie Ingenieur Technik 84 (4) (2012) 517–523.
[233] R. Guettel, T. Turek, Assessment of micro-structured fixed-bed reactors forhighly exothermic gas-phase reactions, Chemical Engineering Science 65 (5)(2010) 1644–1654.
[234] M. Alonso, M. Lorences, M. Pina, G. Patience, Butane partial oxidation inan externally fluidized bed-membrane reactor, Catalysis Today 67 (1-3) (2001)151–157.

126 Bibliography
[235] B. M. Cruz, J. D. da Silva, A two-dimensional mathematical model for thecatalytic steam reforming of methane in both conventional fixed-bed and fixed-bed membrane reactors for the Production of hydrogen, International Journalof Hydrogen Energy 42 (37) (2017) 23670–23690.
[236] COMSOL Multiphysics Reference Manual, version 5.0, www.comsol.com (2016).
[237] T. Wellauer, D. Cresswell, E. Newson, Optimal policies in maleic anhydrideproduction through detailed reactor modelling, Chemical Engineering Science41 (4) (1986) 765–772.
[238] M. A. Carreon, V. V. Guliants, Macroporous Vanadium Phosphorus OxidePhases Displaying Three-Dimensional Arrays of Spherical Voids, Chemistry ofMaterials 14 (6) (2002) 2670–2675.
[239] M. A. Carreon, V. V. Guliants, Synthesis of catalytic materials on multiplelength scales: from mesoporous to macroporous bulk mixed metal oxides forselective oxidation of hydrocarbons, Catalysis Today 99 (1-2) (2005) 137–142.
Nomenclature
Abbreviations
µ-CT computed microtomography
BHS back heat shield
CFD computational fluid dynamics
D/d ratio of reactor diameter D to pel-let diameter d
DEM discrete element method
DNS direct numerical simulation
FHS front heat shield
LIF laser-induced fluorescence
MA maleic anhydride
MRI magnetic resonance imaging
PPI pore per inch
RANS Reynolds-averaged Navier-Stokes
VPP vanadyl pyrophosphate
Greek letters
φ′ fluctuating value of variable [vari-ous]
φ mean value of variable [various]
β temperature exponent [-]
δv diffusion volume [-]
δij Kronecker delta [-]
δmax maximum overlap [m]
η effectiveness factor [-]
Γ surface site density [mol/m2]
κ bulk viscosity [Pa·s]λ thermal conductivity [W/(m·K)]
λbed effective stagnant bed thermal con-ductivity [W/(m·K)]
µ dynamic viscosity [Pa·s]µt turbulent energy [J]
ν′jk stoichiometric coefficient of speciesj in reaction k when it is reactant[-]
νik stoichiometric coefficient of speciesi in reaction k [-]
Ω(T ∗) collision integral
ρ density [kg/m3]
σ Lennard-Jones characteristiclength [A]
σ coordinate number [-]
σk turbulence Prandtl number [-]
τ sum of all stoichiometric coefficientof the surface reactants [-]
τ tortuosity [-]
τij stress tensor [N]
θ surface coverage [-]
ε Lennard-Jones energy [J]
ε turbulent energy dissipation rate[J/(kg·s)]
ε void fraction [-]
ε0 infinite bed porosity [-]
εM macro-pore porosity [-]
εm micro-pore porosity [-]
εbed bed porosity [-]
εtotal total pore porosity [-]
ζ dimensionless radial cylindrical co-ordinate of the pellet [-]
Latin letters
∆HR,298K reaction enthalpy at standardcondition [J/mol]
si molar net production rate of spe-cies i [mol/m2· s]
u velocity field [m/s]
ν Poisson’s ratios [-]~F force [N]
A pre-exponential factor (variable]
av specific surface area [1/m]
Acat/Ageo ratio of catalytically active areato geometric area [-]
CE Ergun parameter [-]
ci species concentration [mol/m3 ormol/m2]
cp specific heat capacity [J/(kg·K)]

128 Nomenclature
Cµ,C1,C2,σε empirical coefficient in thestandard k − ε model [-]
Cfs static friction coefficient [-]
Crest coefficient of restitution [-]
D reactor diameter ([m]
d diameter of the cylinder [m]
d overlap [m]
d particle diameter [m]
dM macro-pore diameter [m]
dm micro-pore diameter [m]
Dr radial dispersion coefficient [m2/s]
DAB binary diffusivity [m2/s]
Dax axial dispersion coefficient [m2/s]
Deff effective diffusivity [m2/s]
Di,j binary diffusion coefficient [m2/s]
Di,m diffusion coefficient of species i inthe mixture [m2/s]
DK Knudsen diffusivity [m2/s]
DM,m diffusivity in macro and micropores [m2/s]
E Young’s modulus [N/m2]
Ea activation energy [J/mol]
G shear modulus [N·s/m]
h height of the cylindrical pellet [m]
h specific enthalpy [J/kg]
ji diffusion mass flux [kg/(m2· s)]
K kinetic parameter [1/Pa]
K spring stiffness [N/m]
k reaction rate constant (variable]
k turbulent kinetic energy [J]
K1 slope parameter [-]
K2 damping parameter [-]
kB Boltzmann constant [m2kg/(s2·K)]
KD darcy hydraulic permeability [m2]
KE Ergun hydraulic permeability [m2]
Ks number of elementary surface reac-tions [-]
lR Reactor length [m]
Mi molar mass of species i [kg/mol]
MA,MB mass of sphere A and B [kg]
N damping [N·s/m]
n exponent of damping function [-]
Ng number of gas phase species [-]
Ni molar flux [mol/(m2·s)]Ns number of adsorbed species [-]
Ndamp damping coefficient [-]
p pressure [Pa]
Peh Peclet numbe for heat transferudpCpfρf/λf [-]
Pem molecular Peclet number udp/DAB
[-]
q′rad radiant flux [W/m2]
R ideal gas constant [J/(K·mol)]
R radius [m]
R reactor radius [m]
Rheti heterogeneous surface reaction rate[kg/(m2·s)]
Rhomi homogeneous reactions rate[kg/(m3·s)]
rj reaction rate [mol/(kgcat·s)]rs reaction rate [mol/(m2·s)]Re Reynolds number ρfudp/µ [-]
Sg specific area per catalyst mass[m2/kg]
sh heat source [W/m3]
Si initial sticking coefficient [-]
T absolute temperature [K]
T ∗ reduced temperature [-]
u superficial velocity [m/s]
v velocity components of the relativesphere surface velocity at the con-tact point [m/s]
VM macro-pore volume [m3/kg]
Vm micro-pore volume [m3/kg]
Xi molar fraction of species i [-]
xi Cartesian coordinate [m]
Yi mass fraction of species i [-]
yi molar fraction [-]
Subscript
ax axial direction, cylindrical coordin-ate
bulk bulk gas phase
eff effective
eq equivalent
f fluid
i gas species
M macro-pore
m micro-pore
n normal component
p particle
r radial direction, cylindrical co-ordinate
t tangential component

List of Figures
3.1 Illustration of the model complexity with respect to computational ef-forts for three types of fixed-bed models. . . . . . . . . . . . . . . . . . 10
3.2 Schematic illustration of a two-dimensional heterogeneous model (left),micro- and macro pore model of Wakao and Smith (right). . . . . . . . 11
3.3 Illustration of the general workflow of the particle-resolved CFD approach. 15
3.4 Illustration of the normal force component ~Fn and the tangential forcecomponent ~Ft acting on DEM particles upon contacting. . . . . . . . . 16
3.5 Illustration of different mesh types applied in this work taking a spher-ical packing as example. . . . . . . . . . . . . . . . . . . . . . . . . . . 19
4.1 Schematic drawing of the experimental setup. The magnification showsthe fiber-optic probe for LIF measurements positioned inside the samplingcapillary. . . . . . . . . . . . . . . . . . . . . . . . . . . . . . . . . . . . 26
4.2 Illustration of the computation domain of the catalytic gauze reactorand boundary conditions applied. . . . . . . . . . . . . . . . . . . . . . 27
4.3 Meshed computation domain of the catalytic gauze reactor. . . . . . . 27
4.4 Mesh independence study. Mesh convergence is achieved at base size of3 · 10−5. . . . . . . . . . . . . . . . . . . . . . . . . . . . . . . . . . . . 28
4.5 Simulated profiles (lines) and measured profiles (dots) of the main spe-cies and temperature (top) and the minor species and OH· (bottom)for φ = 0.5, diluted in 80 % at 1.5 bar and a total flow rate of 3000mLN/min. . . . . . . . . . . . . . . . . . . . . . . . . . . . . . . . . . . 29
4.6 Influence of the gauze temperature on the simulated profiles if surfacereactions are considered alone. Top: main species and temperature;bottom: minor species and OH· radical density. . . . . . . . . . . . . . 31
5.1 Photography of the PANalytical Empyrean interior: X-ray tube, sampleholder (magnified) and GaliPIX3D detector. . . . . . . . . . . . . . . . 34
5.2 Illustration of the cone-beam µ-CT setup. . . . . . . . . . . . . . . . . 35
5.3 Side and top view of the CT reconstructed foam monolith. . . . . . . . 35
5.4 Image analysis to determine the average window size (left), bridge size(middle) and pore size (right). . . . . . . . . . . . . . . . . . . . . . . . 36
5.5 SEM images of the α-Al2O3 foam surface decorated with Pt nano-particles at resolutions of 500 µm (left), 10 µm (middle) and 3 µm(right). The red encircled areas display a reduced density of Pt particles. 36
5.6 SEM image at 4 µm resolution after image processing. The white dotsare the Pt particles, the α-Al2O3 crystals appear as black background. 37
5.7 Particle size histogram computed from Figure 5.6. . . . . . . . . . . . 38

130 List of Figures
5.8 Left: Photography of the catalyst foam sandwiched between front heatshield below and back heat shield above. Right: Foam stack wrappedin InteramTM inside the fused silica reactor tube. . . . . . . . . . . . . 39
5.9 Foam monolith with meshed surface: side view (left) and top view (right). 39
5.10 Translational plan section plot of the volume mesh. . . . . . . . . . . . 40
5.11 Simulated concentration profiles of CO oxidation on at different basesize of the volume mesh. . . . . . . . . . . . . . . . . . . . . . . . . . . 40
5.12 Translational cut plane plots of the simulated relative pressure (topleft), velocity (top middle), gas phase temperature (top right), massfraction of CO (bottom left), O2 (bottom middle) and CO2 (bottomright). . . . . . . . . . . . . . . . . . . . . . . . . . . . . . . . . . . . . 44
5.13 Effect of the Acat/Ageo ratio on the simulated CO profiles. . . . . . . . 45
5.14 Comparison of the simulated (lines) and measured (dots) species profilesand solid surface temperature profiles of CO oxidation on Pt loaded α-Al2O3 foam monolith. . . . . . . . . . . . . . . . . . . . . . . . . . . . 46
5.15 Effects of the local structure on the simulated species profiles. . . . . . 46
5.16 Effects of the different heat transport phenomenon (radiation, heat lossthrough the reactor wall, thermal conductivity of the solid material) onthe simulated solid surface temperature. . . . . . . . . . . . . . . . . . 47
5.17 Comparison of the species profiles in the gas phase and on the nearestsolid surface. . . . . . . . . . . . . . . . . . . . . . . . . . . . . . . . . 49
5.18 Analysis of the rate limiting step in a reaction sequence by plotting stoi-chiometry normalized reaction rates computed from the concentrationvalues listed in Table 5.4. . . . . . . . . . . . . . . . . . . . . . . . . . 50
5.19 Top: Variation of the O2 sticking coefficient (Si) shows that O2 ad-sorption is the rate limiting step for CO oxidation on Pt at the hightemperature conditions of this study. Bottom: Variation of the pre-exponential factor (A) of the surface reaction step CO(s) + O(s) →CO2(s) + Pt(s) has no effect on the simulated profiles. This step is fastand kinetically irrelevant at the conditions of this study. . . . . . . . . 51
5.20 Illustration of the surface site fraction of the Pt sites (left) and adsorbedCO(s) species (right). . . . . . . . . . . . . . . . . . . . . . . . . . . . 52
6.1 Example illustration of a general work flow in a DEM simulation. . . . 55
6.2 Comparison of a DEM simulated radial porosity profile (solid line) toexperimental data from Mueller (points) and a correlation from de Klerk(dotted line) at D/d=5.96. . . . . . . . . . . . . . . . . . . . . . . . . . 56
6.3 Comparison of a DEM simulated radial porosity profile (solid line) ana-lyzed by two different methods described in the text to the correlationfrom de Klerk (dotted line) at D/d=7. . . . . . . . . . . . . . . . . . . 56
6.4 Example cut plane of a spherical packing (left) and a Raschig ringpacking (right) for evaluating the mesh based porosity profiles. . . . . 57
6.5 Comparison of DEM simulated radial porosity profiles (repeated twice)to experimental data reported by Giese et al. for glass ring packings(do/di/h = 8/6/8 mm) in a cylindrical container with 80 mm diameter(D/d=10). . . . . . . . . . . . . . . . . . . . . . . . . . . . . . . . . . . 58
6.6 Illustration of the simulated (left) and experimental (right) packing ofthe reactor tube with central sampling capillary and three fiber Bragggratings for temperature measurements (Packing 2). . . . . . . . . . . 59

List of Figures 131
6.7 Work flow to determine radial porosity profiles: Acrylic glass tube withcatalyst pellets (left). Packing filled with opacified and hardened resin(middle). Slicing of the packing into 40 slices of 2 mm thickness (right). 59
6.8 Image analysis of a photograph of a slice to obtain radial porosity profiles. 60
6.9 Top: Comparisons between simulated (lines) and measured (symbols)radial porosity profiles of Packing 1 (empty tube). Bottom: Comparis-ons between simulated (lines) and measured (symbols) radial porosityprofiles of Packing 2 (tube with central sampling capillary and threefiber Bragg gratings). . . . . . . . . . . . . . . . . . . . . . . . . . . . 61
7.1 Schematic illustration of the experimental set-up of measuring radialheat temperature profile. The size of the capillary is magnified forillustration purpose. . . . . . . . . . . . . . . . . . . . . . . . . . . . . 65
7.2 Illustration of the meshed surface of a ring packing (left) and a sphericalpacking (right). . . . . . . . . . . . . . . . . . . . . . . . . . . . . . . . 66
7.3 Simulated radial temperature profiles at different mesh base size for:(left) a glass sphere packing with a packing height of 3.4 cm and avolumetric flow rate of 15 l/min, (right) a steatite ring packing with apacking height of 6.0 cm and a volumetric flow rate of 15 l/min. . . . 67
7.4 Typical velocity field (left) and temperature field (right) of a sphericalpacking. . . . . . . . . . . . . . . . . . . . . . . . . . . . . . . . . . . . 69
7.5 Typical velocity field (left) and temperature field (right) of a ring packing. 69
7.6 Simulated pressure drop of glass sphere packings with laminar model(squares) and k − ε model (points) compared to the Ergun equation(lines). . . . . . . . . . . . . . . . . . . . . . . . . . . . . . . . . . . . . 70
7.7 Simulated pressure drop of Raschig ring packing with laminar modeland k − ε model. . . . . . . . . . . . . . . . . . . . . . . . . . . . . . . 71
7.8 Comparison of simulated radially averaged temperature profiles (lines)with experimental measurements (points) at different bed heights andflow rates for glass sphere packings. . . . . . . . . . . . . . . . . . . . . 71
7.9 Comparison of simulated radially averaged temperature profiles (lines)with experimental measurements (points) at different bed heights andflow rates for steatite ring packing. . . . . . . . . . . . . . . . . . . . . 72
7.10 DEM simulations of steatite ring packings with different values of Young’smodulus. Top: Porosity profiles. Bottom: Temperature profiles. . . . . 74
7.11 DEM simulations of steatite ring packings with different values of thestatic friction coefficient. Top: Porosity profiles. Bottom: Temperatureprofiles. . . . . . . . . . . . . . . . . . . . . . . . . . . . . . . . . . . . 75
7.12 Left: temperature field at the bottom plane section of the glass spherepacking (z = 1.5 mm). Right: comparison of the experimental datawith the radial temperature profiles of glass sphere packing sampled attwo directions. . . . . . . . . . . . . . . . . . . . . . . . . . . . . . . . 76
7.13 Left: temperature field at the bottom plane section of the steatite ringpacking (z = 2 mm). Right: comparison of the experimental data withthe radial temperature profiles of steatite ring packing sampled at twodirections. . . . . . . . . . . . . . . . . . . . . . . . . . . . . . . . . . . 76
7.14 Effect of the gas properties on the radial temperature profiles of thesteatite ring packing. . . . . . . . . . . . . . . . . . . . . . . . . . . . . 77
132 List of Figures
8.1 Sketch of the pilot-scale fully automated profile reactor. . . . . . . . . 82
8.2 Left: Calculation domain and boundary conditions used for particleresolved CFD simulation. Right: translational plane plot of mesh. . . 83
8.3 Velocity field (left), mass fraction of C4H10 (middle) and temperaturefield (right) at a uniform reactor wall temperature of 370 C predictedby particle resolved CFD simulations. The zoomed sections show detailsaround the hot-spot. . . . . . . . . . . . . . . . . . . . . . . . . . . . . 86
8.4 Zoomed 3D plot of temperature (left) and differential selectivity accord-ing to Eq. 8.19 (middle) of catalyst pellets in the hot-spot of the reactorforming at a uniform reactor wall temperature of 370 C. The 3D ploton the right side shows the differential selectivity along the first 20 cmof the catalyst packing. . . . . . . . . . . . . . . . . . . . . . . . . . . 87
8.5 Measured (points) vs. simulated (lines) species profiles. All five heatingzones were set to 370 C. . . . . . . . . . . . . . . . . . . . . . . . . . 89
8.6 Effect of the thermal conductivity of the solid (λsolid) on the simulatedtemperature profiles. The experimental temperature profile correspondsto the case where all five heating zones were set to 370 C. . . . . . . 90
8.7 Measured (points) vs. simulated (solid and dotted lines) temperatureprofiles. All five heating zones were set to 370 C. . . . . . . . . . . . 91
8.8 Angular averaged simulated species profiles (lines) vs. measured speciesprofiles (symbols). The measured species profiles correspond to twomeasurements along the same axial trajectory but with two monthstime on stream in between. All five heating zones were set to 370 C. 92
8.9 Angular averaged simulated reaction rates related to acetic acid CH3COOHand acrylic acid CH2CH-COOH. All five heating zones were set at 370C. The grey dotted line shows the simulated temperature profile forcomparison. . . . . . . . . . . . . . . . . . . . . . . . . . . . . . . . . . 93
8.10 Angular averaged simulated species profiles (lines) vs. measured speciesprofiles (symbols). The measured species profiles correspond to twomeasurements along the same axial trajectory but with two monthstime on stream in between. All five heating zones were set to 360 C.Experiments were repeated twice and indicated by two types of symbols. 94
8.11 Comparison of the measured center line reactor temperature profile(points) with the angular averaged simulated temperature profile (line).All five heating zones were set to 360 C. . . . . . . . . . . . . . . . . 95
8.12 Comparisons of the simulated (line) and measured (points) conversion,selectivity and temperature profiles. Left: five heating zones are setuniform at 370 C. Right: five heating zones are set stepwise increasefrom 360 C to 380 C. . . . . . . . . . . . . . . . . . . . . . . . . . . . 95
9.1 Triangle reaction network for n-butane oxidation [237]. . . . . . . . . . 99
9.2 Example illustration of the predicted velocity field (left), temperatureprofile (right) of a 2-D heterogeneous model incorporated with radialporosity profile and exothermic reactions. . . . . . . . . . . . . . . . . 101
9.3 Predicted concentration profile for C4H10 (left) and C4H2O3 (right) ofthe reference case. . . . . . . . . . . . . . . . . . . . . . . . . . . . . . 102
9.4 Concentration profiles of C4H10 (left top), C4H2O3 (right top), CO2
(left bottom) and temperature profile (right bottom) inside the pelletat five sampling positions in the reactor. . . . . . . . . . . . . . . . . . 103

List of Figures 133
9.5 Effect of the macro-pore porosity εM on the simulated fixed-bed reactorperformance for n-butane oxidation. . . . . . . . . . . . . . . . . . . . 104
9.6 Effect of the macro-pore porosity εM on the specific surface area Sg andeffective diffusivity Deff,i. . . . . . . . . . . . . . . . . . . . . . . . . . 105
9.7 Effect of the macro-pore porosity εM on concentration profiles of C4H10
and C4H2O3 inside the pellet located at position 1. . . . . . . . . . . . 105
9.8 Effect of the macro-pore porosity εM on the integrated average reactionrates ri of the pellet located at position 1. . . . . . . . . . . . . . . . . 106
9.9 Effect of the macro-pore diameter dM on the simulated fixed-bed reactorperformance for n-butane oxidation. . . . . . . . . . . . . . . . . . . . 107
9.10 Effect of the micro-pore diameter dm on the simulated fixed-bed reactorperformance for n-butane oxidation. . . . . . . . . . . . . . . . . . . . 108

List of Tables
3.1 Diffusion volumes for the Fuller equation used in this work . . . . . . 12
3.2 Boundary conditions applied to the two-dimensional heterogeneous re-actor model . . . . . . . . . . . . . . . . . . . . . . . . . . . . . . . . . 15
4.1 Mesh parameters for simulating the gauze reactor. . . . . . . . . . . . 28
5.1 Morphological parameters of the investigated foam. . . . . . . . . . . . 36
5.2 Meshing parameters used for simulating reactor packed with foam mono-lith. . . . . . . . . . . . . . . . . . . . . . . . . . . . . . . . . . . . . . 38
5.3 Surface reaction steps and rate parameters of CO oxidation on Pt usedin this work. . . . . . . . . . . . . . . . . . . . . . . . . . . . . . . . . . 42
5.4 Surface and gas compositions extracted from simulations at z-coordinateof 2 mm. . . . . . . . . . . . . . . . . . . . . . . . . . . . . . . . . . . . 49
6.1 Parameters used in the DEM simulations of VPP catalyst. . . . . . . . 60
7.1 Physical properties of the packing materials used in experiments ofmeasuring radial heat temperature profile. . . . . . . . . . . . . . . . . 64
7.2 Meshing parameters used in heat transfer study . . . . . . . . . . . . . 66
7.3 Global bed porosity of glass spheres and steatite ring packings. . . . . 68
8.1 Kinetic parameters for n-butane oxidation to maleic anhydride developedin house. . . . . . . . . . . . . . . . . . . . . . . . . . . . . . . . . . . . 85
9.1 Kinetic parameters for partial oxidation of n-butane taken from Guettelet al. . . . . . . . . . . . . . . . . . . . . . . . . . . . . . . . . . . . . . 100
9.2 Properties of the catalyst pellet . . . . . . . . . . . . . . . . . . . . . . 100
9.3 Operational parameters applied in a two-dimensional heterogeneousmodel to simulate n-butane oxidation in a fixed-bed reactor. . . . . . . 101
Copyright © 2022 FDOKUMEN