Modeling a Three-Stage Biological Trickling Filter Based on ...
19
water Article Modeling a Three-Stage Biological Trickling Filter Based on the A2O Process for Sewage Treatment Jiabin Liang 1, *, Yuan Yuan 2, *, Zimeng Zhang 1 , Shijie You 1 and Yixing Yuan 1 Citation: Liang, J.; Yuan, Y.; Zhang, Z.; You, S.; Yuan, Y. Modeling a Three-Stage Biological Trickling Filter Based on the A2O Process for Sewage Treatment. Water 2021, 13, 1152. https://doi.org/10.3390/ w13091152 Academic Editor: Luiza Campos Received: 13 March 2021 Accepted: 19 April 2021 Published: 22 April 2021 Publisher’s Note: MDPI stays neutral with regard to jurisdictional claims in published maps and institutional affil- iations. Copyright: © 2021 by the authors. Licensee MDPI, Basel, Switzerland. This article is an open access article distributed under the terms and conditions of the Creative Commons Attribution (CC BY) license (https:// creativecommons.org/licenses/by/ 4.0/). 1 State Key Laboratory of Urban Water Resource and Environment, School of Environment, Harbin Institute of Technology, Harbin 150090, China; [email protected] (Z.Z.); [email protected] (S.Y.); [email protected] (Y.Y.) 2 School of Biological Engineering, Beijing Polytechnic, Beijing 100176, China * Correspondence: [email protected] (J.L.); [email protected] (Y.Y.) Abstract: Biological trickling filters are widely used for sewage treatment. This study models a biological trickling filter based on an anaerobic–anoxic–oxic process (A2O–BTF), established by a combination of aerobic and anaerobic technology. The performance and operational parameters were analyzed using Sumo, a commercially available wastewater treatment process (WWTP) simulation software. The wastewater treatment performance of the anaerobic–anoxic–oxic process biological trickling filter (A2O–BTF), the conventional three-stage biological trickling filter (Three-Stage–BTF), and the single-stage biological trickling filter (Single–BTF) was compared, which indicated the higher performance of A2O–BTF in terms of COD, TN, NH 3 -N, and TP removal. The operational parameters of A2O–BTF were optimized by Sumo simulation software, and the results showed that the removal efficiency of pollutants was increased by raising the temperature to the range of 13.94–21.60 ◦ C. The dissolved oxygen (DO) in the aerobic reactor enhanced removal efficiency under a saturation concentration of 2.2–2.6 g O 2 /m 3 . In addition, the optimization of the reflux ratio promoted the removal efficiency of the pollutants, indicated by the maximum removal efficiency of COD and TN, achieved at the reflux ratio of 2.25, and that of NH 3 -N and TP, achieved at a reflux ratio of 0.75. This study provides a proof-in-concept demonstration that software modeling can be a useful tool for assisting the optimization of the design and operation of sewage treatment processes. Keywords: biological trickling filter; A2O; dissolved oxygen; temperature; reflux ratio 1. Introduction Biological methods are widely used for wastewater treatment processes (WWTPs) [1,2]. As biological reinforcement is a simple and effective technology, it is widely used in wastewater treatment at present [3]. In the cold northern region, the low temperature in winter and temperature difference throughout the year leads to great changes in the activity of microorganisms in the different seasons [4]. Therefore, it is of particular importance to maintain the treatment effect of microorganisms in different climatic conditions. In particular, ordinary heterotrophic organisms (OHOs), ammonia-oxidizing bacteria (AOB), nitrite-oxidizing bacteria (NOB), and phosphorus-accumulating organisms (PAOs) play an important role in the process of denitrification and phosphorus removal [3,5–8]. WWTPs refer to the establishment of an effective wastewater treatment method based on related technologies [9]. Anaerobic–anoxic–oxic (A2O) [10,11], sequence batch reactor (SBR) [12,13], moving bed biofilm reactor (MBBR) [14,15], and integrated fixed-film activated sludge (IFAS) [14] are the commonly used WWTPs. Among them, A2O is the most popular process for nitrogen and phosphorus removal. It operates alternately through anaerobic, anoxic, and aerobic reactions by returning the mixture of liquid and sludge through reflux to achieve the removal of COD, nitrogen, and phosphorus. Biological trickling filters (BTFs) are a kind of artificial biological treatment technology developed using an intermittent sand filter and a contact filter based on the principle of soil Water 2021, 13, 1152. https://doi.org/10.3390/w13091152 https://www.mdpi.com/journal/water
-
Upload
khangminh22 -
Category
Documents
-
view
4 -
download
0
Transcript of Modeling a Three-Stage Biological Trickling Filter Based on ...
water
Article
Modeling a Three-Stage Biological Trickling Filter Based on theA2O Process for Sewage Treatment
Jiabin Liang 1,*, Yuan Yuan 2,*, Zimeng Zhang 1, Shijie You 1 and Yixing Yuan 1
�����������������
Citation: Liang, J.; Yuan, Y.; Zhang,
Z.; You, S.; Yuan, Y. Modeling a
Three-Stage Biological Trickling Filter
Based on the A2O Process for Sewage
Treatment. Water 2021, 13, 1152.
https://doi.org/10.3390/
w13091152
Academic Editor: Luiza Campos
Received: 13 March 2021
Accepted: 19 April 2021
Published: 22 April 2021
Publisher’s Note: MDPI stays neutral
with regard to jurisdictional claims in
published maps and institutional affil-
iations.
Copyright: © 2021 by the authors.
Licensee MDPI, Basel, Switzerland.
This article is an open access article
distributed under the terms and
conditions of the Creative Commons
Attribution (CC BY) license (https://
creativecommons.org/licenses/by/
4.0/).
1 State Key Laboratory of Urban Water Resource and Environment, School of Environment,Harbin Institute of Technology, Harbin 150090, China; [email protected] (Z.Z.); [email protected] (S.Y.);[email protected] (Y.Y.)
2 School of Biological Engineering, Beijing Polytechnic, Beijing 100176, China* Correspondence: [email protected] (J.L.); [email protected] (Y.Y.)
Abstract: Biological trickling filters are widely used for sewage treatment. This study models abiological trickling filter based on an anaerobic–anoxic–oxic process (A2O–BTF), established by acombination of aerobic and anaerobic technology. The performance and operational parameters wereanalyzed using Sumo, a commercially available wastewater treatment process (WWTP) simulationsoftware. The wastewater treatment performance of the anaerobic–anoxic–oxic process biologicaltrickling filter (A2O–BTF), the conventional three-stage biological trickling filter (Three-Stage–BTF),and the single-stage biological trickling filter (Single–BTF) was compared, which indicated the higherperformance of A2O–BTF in terms of COD, TN, NH3-N, and TP removal. The operational parametersof A2O–BTF were optimized by Sumo simulation software, and the results showed that the removalefficiency of pollutants was increased by raising the temperature to the range of 13.94–21.60 ◦C.The dissolved oxygen (DO) in the aerobic reactor enhanced removal efficiency under a saturationconcentration of 2.2–2.6 g O2/m3. In addition, the optimization of the reflux ratio promoted theremoval efficiency of the pollutants, indicated by the maximum removal efficiency of COD and TN,achieved at the reflux ratio of 2.25, and that of NH3-N and TP, achieved at a reflux ratio of 0.75. Thisstudy provides a proof-in-concept demonstration that software modeling can be a useful tool forassisting the optimization of the design and operation of sewage treatment processes.
Keywords: biological trickling filter; A2O; dissolved oxygen; temperature; reflux ratio
1. Introduction
Biological methods are widely used for wastewater treatment processes (WWTPs) [1,2].As biological reinforcement is a simple and effective technology, it is widely used inwastewater treatment at present [3]. In the cold northern region, the low temperature inwinter and temperature difference throughout the year leads to great changes in the activityof microorganisms in the different seasons [4]. Therefore, it is of particular importanceto maintain the treatment effect of microorganisms in different climatic conditions. Inparticular, ordinary heterotrophic organisms (OHOs), ammonia-oxidizing bacteria (AOB),nitrite-oxidizing bacteria (NOB), and phosphorus-accumulating organisms (PAOs) play animportant role in the process of denitrification and phosphorus removal [3,5–8].
WWTPs refer to the establishment of an effective wastewater treatment methodbased on related technologies [9]. Anaerobic–anoxic–oxic (A2O) [10,11], sequence batchreactor (SBR) [12,13], moving bed biofilm reactor (MBBR) [14,15], and integrated fixed-filmactivated sludge (IFAS) [14] are the commonly used WWTPs. Among them, A2O is themost popular process for nitrogen and phosphorus removal. It operates alternately throughanaerobic, anoxic, and aerobic reactions by returning the mixture of liquid and sludgethrough reflux to achieve the removal of COD, nitrogen, and phosphorus.
Biological trickling filters (BTFs) are a kind of artificial biological treatment technologydeveloped using an intermittent sand filter and a contact filter based on the principle of soil
Water 2021, 13, 1152. https://doi.org/10.3390/w13091152 https://www.mdpi.com/journal/water
Water 2021, 13, 1152 2 of 19
self-purification and the practice of sewage irrigation [16]. The BTF is a new type of biofilmtechnology that integrates biodegradation and solid–liquid separation. The BTF allowslong periods of starvation without rinsing out the biomass, which has the advantages oflower energy consumption and lower biomass production compared with an activatedsludge system [17,18]. This makes it effective for the treatment of winery wastewater [19],sewage treatment [20], dairy wastewaters [21], and textile wastewater [22].
In the BTF process, several factors such as temperature, dissolved oxygen (DO), and re-flux ratio (RR) can have impacts on treatment performance [23–25]. Therefore, the reliabilityof the system can be increased by a multistage BTF based on the A2O process (A2O–BTF).However, there is a need for the optimization of parameters relevant to design and opera-tion. For example, temperature can exert a major influence on physiological characteristics,microbial growth rate, microbial activity, and microbial community structure [26–28]. Oxy-gen serves as the electron acceptor, and there is a definite relationship between organicdegradation and oxygen demand [29,30]. Watari [31] reported a significant impact of DOconcentrations on microbial community and biomass in BTFs. Abou-Elela [32] investigatedthe effect of media depth, hydraulic retention time (HRT), DO, and surface area of themedia on the removal efficiency of pollutants. The reflux ratio (RR) is an important pa-rameter that affects both hydraulic and sludge retention times of the process, providingthe backflow of nitrification liquid [33]. Besides that, RR also has a close connection withenergy consumption.
Numerical simulations and experimental research are both effective strategies forstudying WWTPs. At present, experimental studies on sewage treatment are mostly doneon the structural transformation and process upgrades of WWTPs [34]. For example,Cao et al. [35] applied an improved four-stage segmented process to treat low C/N ur-ban sewage, and they found that the flow distribution ratio of the four-stage A/O was20:35:35:10. At this time, the average effluent COD, NH3-N, TN, and TP concentrationsof the system were 33.05, 0.58, 9.26, and 0.46 mg·L−1, respectively. Peng et al. [36] alsoachieved deep denitrification and phosphorus removal in a three-stage segmented process.However, it should be realized that experimental studies are labor- and time-consuming;most of the current experimental studies are based on the impact of a single factor. Thereare relatively few systematic studies performed on the impact of multiple factors such astemperature, DO, and reflux ratio in integrated reactor systems.
Numerical simulation offers a theoretical manner to optimize the operating parame-ters of a complex WWTP system. The widely used models include the activated sludgemodels (ASMs) [37,38] and the anaerobic digestion models (ADMs) [39,40] developedby International Water Association (IWA). The ASMs can simulate organic degradation,nitrification, and denitrification, as well as biological phosphorus removal. Baek et al. [41]studied the performance of the aerobic membrane bioreactor (MBR) process in terms ofCOD removal and ammonia–nitrogen nitrification. Tao et al. [14] simulated the partial ni-trification anammox (PN/A) process of moving bed biofilm reactor (MBBR) and integratedfixed-film activated sludge (IFAS). Cramer et al. [16] investigated the decay of heterotrophicbiomass in biofilms of trickling filters. To simulate the WWTP more effectively, the ASMsand ADMs are integrated into the software package that includes Biowin, Gps-x, West,and Sumo, among others. Among them, Sumo is a newly explored platform that has theadvantages of high simulation efficiency and open source code, making it available forwide range of applications in the simulation of sewage treatment [14,42,43]. However,there are few studies on the multiple-stage biological filter treatment system based on theA2O process (A2O–BTF).
Owing to the hydraulic load of BTF, the cultivation of relevant bacteria in the nitri-fication process is limited in steady-state simulation [44–46]. In this context, dynamicsimulation can be used to analyze the change in the effluent when the influent hydraulicload and the organic load are varied. To address the issues of optimal scheduling of BTFsunder dynamic conditions and low treatment efficiency in cold regions, a three-stage BTFwas employed to verify the feasibility of the models developed by Sumo software. The
Water 2021, 13, 1152 3 of 19
full-field simulation models of A2O–BTF were established by changing the form of aera-tion and adding reflux units. The sewage treatment of A2O–BTF, Three-stage–BTF, andSingle–BTF was compared. The simulated parameters were set by temperature in the rangeof 13.95–21.60 ◦C, DO in an aerobic aeration tank of 0.2–4 g O2/m3, and a mixed liquidreflux ratio of 0.5–2.5, respectively. The impacts of the operating parameters on COD, TN,NH3-N, and TP removal were analyzed, and the content of major microorganisms such asOHO, AOB, NOB, and PAO in the sludge was compared under different conditions. Themodeled results were validated by experimental data.
2. Materials and Methods2.1. Experimental Setup
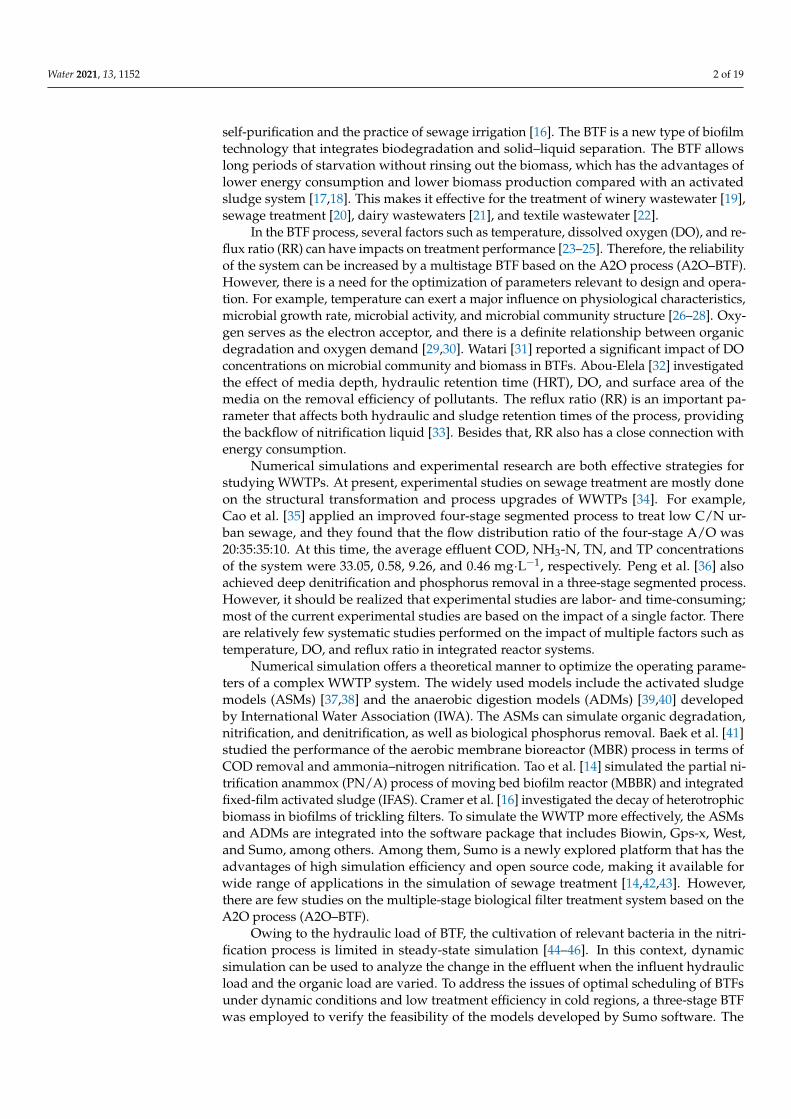
This experiment device is shown in Figure 1. The length and width of the reactorwere 16 × 17 cm. Each trickling filter reactor was divided into three layers; the height ofthe upper layer was 15 cm, and the height of the middle and bottom layers were 15 and30 cm, respectively. The filler in the upper, middle, and bottom layers of the No. 1 reactorwas clinoptilolite, biological ceramsite, and coke. Similarly, the filler’s combination inthe No. 2 and No. 3 reactors was clinoptilolite, coke, and sponge iron. We set up amixed liquid return device and a sludge return device after the No. 3 reactor and returnedthe liquid through a peristaltic pump. Additionally, we set up an aeration device inthe No. 3 reactor to construct an A2O–BTF process. At the same time, the single-stagetrickling filter wastewater treatment process (Single–BTF) and the three-stage trickling filterprocess (Three-Stage–BTF) were used as two comparative processes. The Three-Stage–BTFdismantles the reflux device and simultaneously aerates the No. 1 and No. 3 reactors.The process is similar to the process in the literature [47]. The Single-BTF dismantles theNo. 1 and No. 2 reactors and operates the No. 3 reactor separately. The experimentalwater was simulated domestic sewage, constructed from glucose, ammonium chloride,potassium dihydrogen phosphate, and magnesium sulfate. The influent parameters of thesimulated sewage are shown in Table 1. The measurement of COD, TN, NH3-N, and TPwere all determined by the standard method. Hach reagent tube was employed for CODand TN measurement. NH3-N was measured by Nessler’s reagent colorimetry, and TP wasmeasured by molybdenum antimony spectrophotometry. All experiments were conductedwith at least two parallel samples.
Figure 1. Experiment device.
Water 2021, 13, 1152 4 of 19
Table 1. Influent parameters.
Name Value SI Unit
Total COD 310–807 g COD/m3
TKN 31.00–46.50 g N/m3
Total Phosphorus 3.46–4.56 g P/m3
Fraction of NH3 in TKN 88.00–93.50 %PH 6 -
Influent cBOD 200 mg BOD/LFlow Rate 0.027 m3/d
PO4 Fraction of TP 58.14 %
2.2. Models
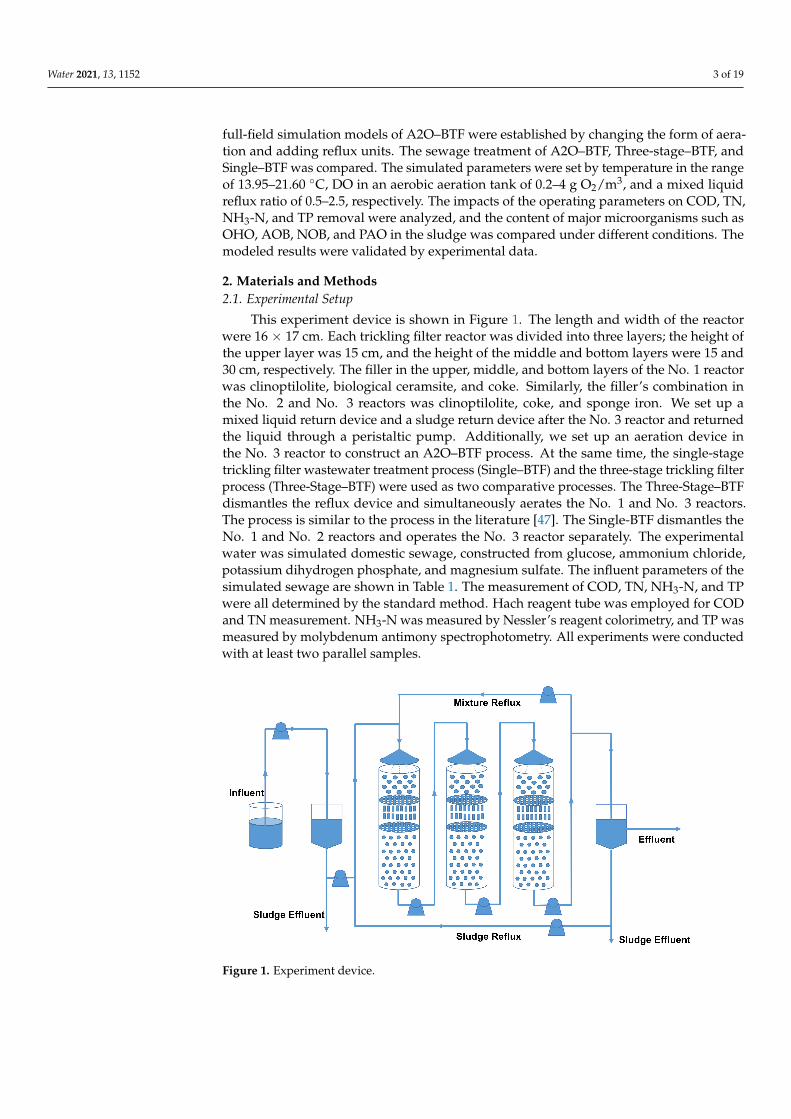
In this paper, the treatment effect of the sewage treatment plant was simulated throughthe wastewater treatment process (WWTP) simulation software Sumo. The whole simula-tion route is shown in Figure 2. The modeling process includes the establishment of theprocess flow sheet, the selection of the model, the setting of water inlet parameters, and thesetting of wastewater treatment plant operating parameters.
Figure 2. Simulation route map.
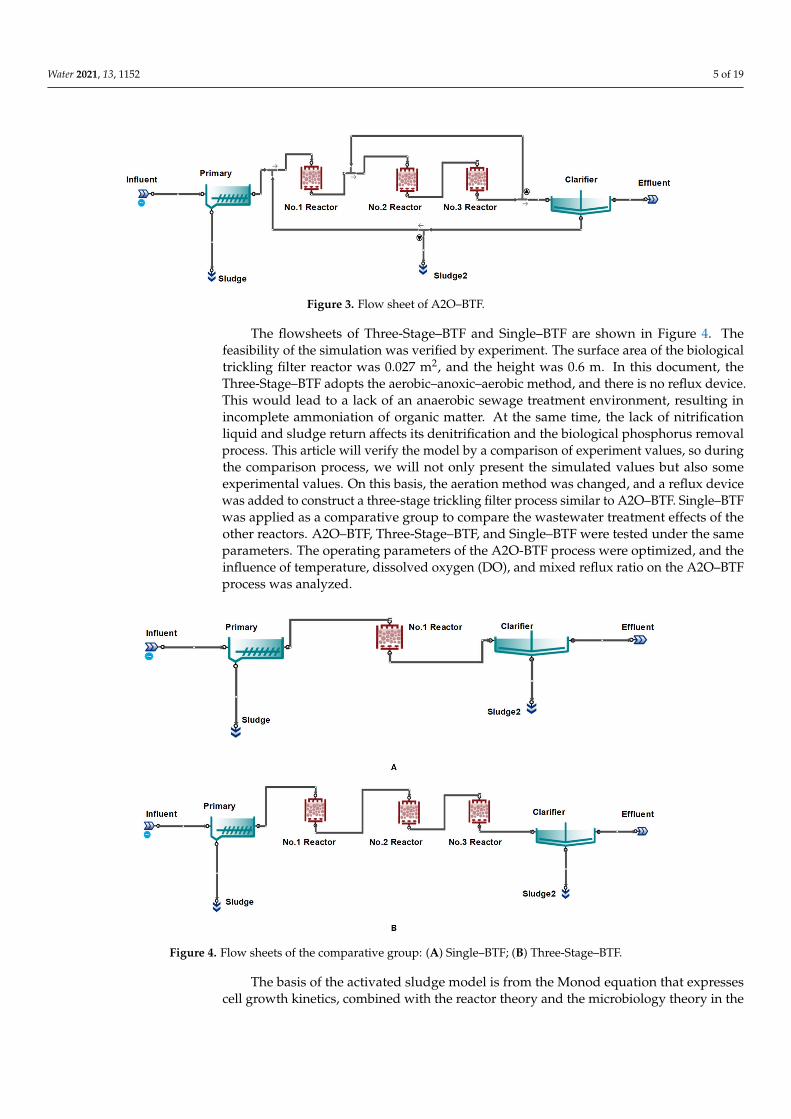
The flow sheet of the trickling filter based on the A2O process (A2O–BTF) is shownin Figure 3. The first reactor uses an anaerobic trickling filter, the second reactor usesan anoxic trickling filter, and the third trickling filter adopts the method of calculatingdissolved oxygen; oxygen is introduced into the trickling filter. A primary sedimentationtank was arranged in front of the anaerobic reactor, a secondary sedimentation tank wasarranged behind the reactor. Further more, a mixed-liquid reflux device and a sludge refluxdevice were arranged in this system.
Water 2021, 13, 1152 5 of 19
Figure 3. Flow sheet of A2O–BTF.
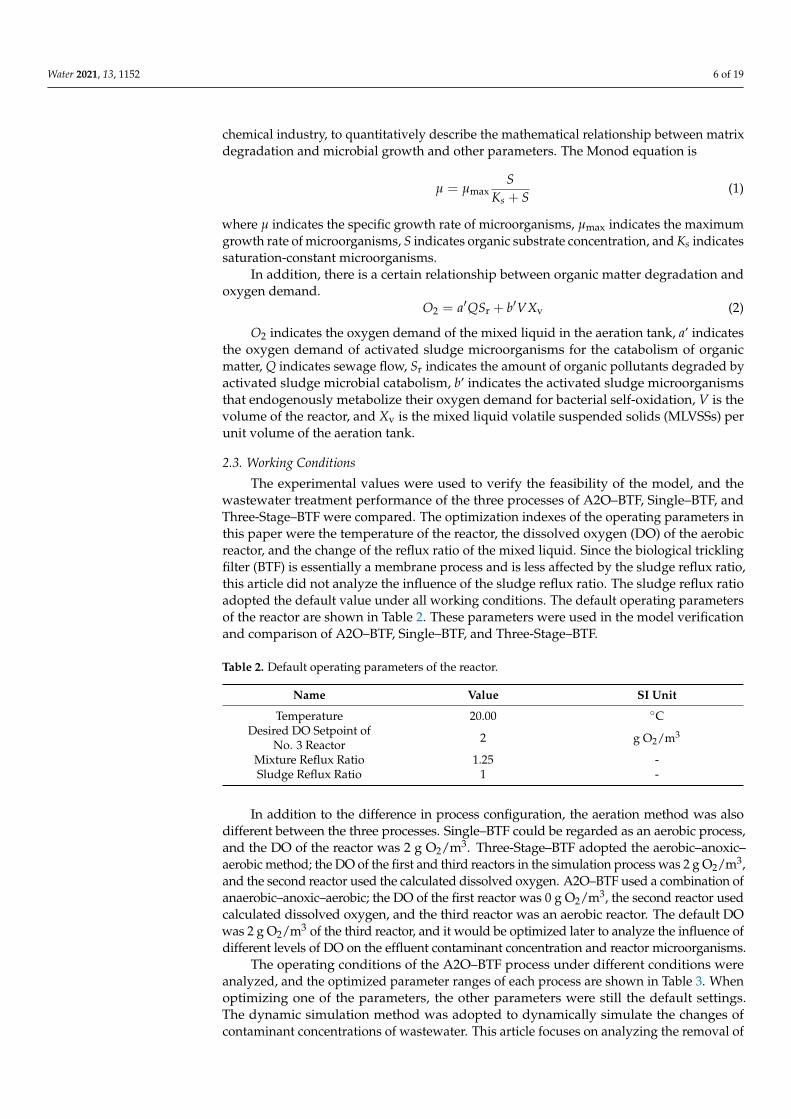
The flowsheets of Three-Stage–BTF and Single–BTF are shown in Figure 4. Thefeasibility of the simulation was verified by experiment. The surface area of the biologicaltrickling filter reactor was 0.027 m2, and the height was 0.6 m. In this document, theThree-Stage–BTF adopts the aerobic–anoxic–aerobic method, and there is no reflux device.This would lead to a lack of an anaerobic sewage treatment environment, resulting inincomplete ammoniation of organic matter. At the same time, the lack of nitrificationliquid and sludge return affects its denitrification and the biological phosphorus removalprocess. This article will verify the model by a comparison of experiment values, so duringthe comparison process, we will not only present the simulated values but also someexperimental values. On this basis, the aeration method was changed, and a reflux devicewas added to construct a three-stage trickling filter process similar to A2O–BTF. Single–BTFwas applied as a comparative group to compare the wastewater treatment effects of theother reactors. A2O–BTF, Three-Stage–BTF, and Single–BTF were tested under the sameparameters. The operating parameters of the A2O-BTF process were optimized, and theinfluence of temperature, dissolved oxygen (DO), and mixed reflux ratio on the A2O–BTFprocess was analyzed.
Figure 4. Flow sheets of the comparative group: (A) Single–BTF; (B) Three-Stage–BTF.
The basis of the activated sludge model is from the Monod equation that expressescell growth kinetics, combined with the reactor theory and the microbiology theory in the
Water 2021, 13, 1152 6 of 19
chemical industry, to quantitatively describe the mathematical relationship between matrixdegradation and microbial growth and other parameters. The Monod equation is
µ = µmaxS
Ks + S(1)
where µ indicates the specific growth rate of microorganisms, µmax indicates the maximumgrowth rate of microorganisms, S indicates organic substrate concentration, and Ks indicatessaturation-constant microorganisms.
In addition, there is a certain relationship between organic matter degradation andoxygen demand.
O2 = a′QSr + b′VXv (2)
O2 indicates the oxygen demand of the mixed liquid in the aeration tank, a’ indicatesthe oxygen demand of activated sludge microorganisms for the catabolism of organicmatter, Q indicates sewage flow, Sr indicates the amount of organic pollutants degraded byactivated sludge microbial catabolism, b’ indicates the activated sludge microorganismsthat endogenously metabolize their oxygen demand for bacterial self-oxidation, V is thevolume of the reactor, and Xv is the mixed liquid volatile suspended solids (MLVSSs) perunit volume of the aeration tank.
2.3. Working Conditions
The experimental values were used to verify the feasibility of the model, and thewastewater treatment performance of the three processes of A2O–BTF, Single–BTF, andThree-Stage–BTF were compared. The optimization indexes of the operating parameters inthis paper were the temperature of the reactor, the dissolved oxygen (DO) of the aerobicreactor, and the change of the reflux ratio of the mixed liquid. Since the biological tricklingfilter (BTF) is essentially a membrane process and is less affected by the sludge reflux ratio,this article did not analyze the influence of the sludge reflux ratio. The sludge reflux ratioadopted the default value under all working conditions. The default operating parametersof the reactor are shown in Table 2. These parameters were used in the model verificationand comparison of A2O–BTF, Single–BTF, and Three-Stage–BTF.
Table 2. Default operating parameters of the reactor.
Name Value SI Unit
Temperature 20.00 ◦CDesired DO Setpoint of
No. 3 Reactor 2 g O2/m3
Mixture Reflux Ratio 1.25 -Sludge Reflux Ratio 1 -
In addition to the difference in process configuration, the aeration method was alsodifferent between the three processes. Single–BTF could be regarded as an aerobic process,and the DO of the reactor was 2 g O2/m3. Three-Stage–BTF adopted the aerobic–anoxic–aerobic method; the DO of the first and third reactors in the simulation process was 2 g O2/m3,and the second reactor used the calculated dissolved oxygen. A2O–BTF used a combination ofanaerobic–anoxic–aerobic; the DO of the first reactor was 0 g O2/m3, the second reactor usedcalculated dissolved oxygen, and the third reactor was an aerobic reactor. The default DOwas 2 g O2/m3 of the third reactor, and it would be optimized later to analyze the influence ofdifferent levels of DO on the effluent contaminant concentration and reactor microorganisms.
The operating conditions of the A2O–BTF process under different conditions wereanalyzed, and the optimized parameter ranges of each process are shown in Table 3. Whenoptimizing one of the parameters, the other parameters were still the default settings.The dynamic simulation method was adopted to dynamically simulate the changes ofcontaminant concentrations of wastewater. This article focuses on analyzing the removal of
Water 2021, 13, 1152 7 of 19
COD, NH3-N, TN, and TP. Since microorganisms have a greater impact on treatment effect,the biomass of OHOs, AOB, NOB, and PAOs in each reactor should be analyzed duringthe optimization process. The reaction process was optimized by analyzing the pollutantremoval rate under the action of various operating parameters.
Table 3. Optimized parameters of the A2O–BTF process.
Name Value SI Unit
Temperature 13.95–21.60 ◦CDesired DO Setpoint of
No. 3 Reactor 0.2–4 g O2/m3
Mixture Reflux Ratio 0.50–2.50 -
2.4. Operating Parameters
This paper adopts the 2-step nitrification/denitrification model in Sumo software,which simplifies the process of nitrogen and phosphorus removal, focusing on the inter-mediate product in the reaction process—NO2
−-N. The optimized operating parametersthat are mainly analyzed in this paper include temperature, dissolved oxygen (DO), andthe reflux ratio of the mixed liquor. Changing the dissolved oxygen (DO) and reflux ratiowould not affect the reaction kinetic parameters, but with the changing of temperature,the reaction kinetic parameters would be varied. The reaction kinetic parameters of themodel at 20 ◦C are shown in Table 4. The reaction kinetic parameters were used for modelverification, comparison of A2O–BTF, Single–BTF, Three-Stage–BTF, and the optimizationof dissolved oxygen (DO) and mixed reflux ratio in the A2O–BTF process.
Table 4. Main kinetic parameters of the reaction.
Name Value Unit
COD of biodegradable substrate in volatile solids 1.60 g COD.g VSS−1
COD of particulate unbiodegradable organics in volatile solids 1.30 g COD.g VSS−1
COD of biomass in volatile solids 1.42 g COD.g VSS−1
COD of endogenous products in volatile solids 1.42 g COD.g VSS−1
Maximum specific growth rate of AOBs 0.85 1/dHalf-saturation of O2 for AOBs (AS) 0.25 g O2/m3
Half-saturation of O2 for NOBs (AS) 0.25 g O2/m3
Half-saturation of NH3 for AOBs (AS) 0.50 g N/m3
Maximum specific growth rate of NOBs 0.65 1/dMaximum specific growth rate of OHOs 4.00 1/dHalf-saturation of NO2 for NOBs (AS) 0.10 g N/m3
Half-saturation of readily biodegradable substrate for OHOs (AS) 5.00 g COD/m3
Half-saturation of O2 for OHOs (AS) 0.15 g O2/m3
Maximum specific growth rate of PAOs 1.00 1/dHalf-saturation of PO4 for PAOs (AS) 0.50 g P/m3
Rate of hydrolysis 2.00 1/d
The treatment effect of A2O–BTF under different temperature conditions would havea certain impact, which is mainly reflected in the growth rate and decay rate of bacteria,so its kinetic parameters need to be adjusted. The study [48] has corrected the sensitivekinetic parameters at different temperatures based on the data provided by a wastewatertreatment plant. The correction parameters were used in this paper, as shown in Table 5.
Water 2021, 13, 1152 8 of 19
Table 5. Adjustment of the main parameters at different temperatures [48].
Temp Parameter Default Value Unit
13.94 ◦CMaximum specific growth rate of AOBs 0.85 0.71 1/dMaximum specific growth rate of OHOs 4.00 4.40 1/d
21.60 ◦C
Maximum specific growth rate of AOBs 0.85 0.62 1/dDecay rate of AOBS 0.17 0.20 1/d
Maximum specific growth rate of OHOs 3.20 5.00 1/dHalf-saturation of O2 for OHOs 5.00 2.00 g O2/m3
Reduction factor for anoxic growth of OHOs 0.60 0.65
16.60 ◦C
Maximum specific growth rate of AOBs 0.90 0.66 1/dDecay rate of AOBS 0.17 0.20 1/d
Maximum specific growth rate of OHOs 3.20 4.60 1/dReduction factor for anoxic growth of OHOs 0.60 0.65
The application of different fillers has a great impact on the treatment effect of thetrickling filter. The biological trickling filter (BTF) reactor in Sumo is based on the biofilmmethod and provides several common filler parameters. By adjusting the filler parameters,the wastewater treatment effect can be affected. This study used the same volume of thetrickling filter reactor as in the literature [47], and the trickling filter reactor was dividedinto three layers. By adjusting the filler parameters, the simulated values were as close tothe experimental values as possible.
3. Results and Discussion3.1. Modeling Verification and Process Comparison
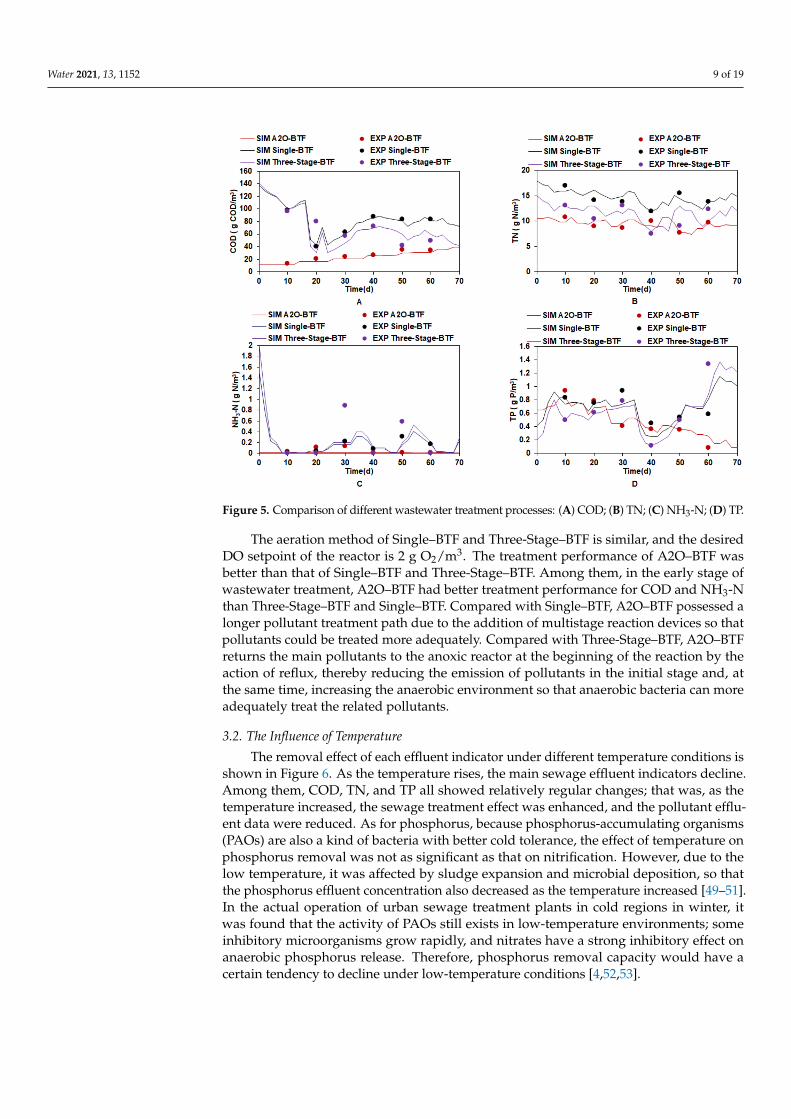
The comparison of the treatment effects of different processes is shown in Figure 5.The wastewater treatment performances of Single–BTF, Three-Stage–BTF, and A2O–BTFwere compared, and the simulation results were compared with the experiment results.Under normal circumstances, an error within 20% between the experimental values andthe simulated values is considered a reasonable result. It can be seen from Figure 5 that byadjusting the main reaction kinetic parameters and the combination of biological trickling filter(BTF) fillers, the simulation results were basically consistent with the experimental results,and wastewater treatment performance could be basically reflected by the simulation results.It can be seen from Figure 5 that the simulated values of COD, TN, and TP are basically thesame as the experimental values, and the experimental values were almost within ±20% ofthe simulated value. For NH3-N, because of the magnitude of the effluent pollutant, which isgenerally less than 0.3 g N/m3, there would be a bit of error in the measurement process of theexperiment. In the simulation process, due to dynamic simulation, the initial value and relatedparameters of process simulation can cause differences in the simulation values and actualvalues. However, there is still a bit of deviation between the simulation and the experiment.From the description of the equation, we know that the growth rate of microorganisms, thehalf-saturation constant, and the rate of metabolism of organic matter are the main factors thataffect the accuracy of the simulation. The commercial software Sumo completes the relatedmodels and integrates more parameters to better ensure the accuracy of the simulation. Takinginto account different experimental environments, these parameters need to be calibratedmanually. The variation of temperature would affect the growth rate of microorganisms;meanwhile, the application of different fillers would affect the half-saturation constant ofthe microorganisms in the reactor. The adjusted parameters are shown in Tables 4 and 5.However, the above calibrated parameters cannot be completely consistent with the actualconditions of microbial growth and metabolism, which leads to simulation deviations fromthe experiment.
Water 2021, 13, 1152 9 of 19
Figure 5. Comparison of different wastewater treatment processes: (A) COD; (B) TN; (C) NH3-N; (D) TP.
The aeration method of Single–BTF and Three-Stage–BTF is similar, and the desiredDO setpoint of the reactor is 2 g O2/m3. The treatment performance of A2O–BTF wasbetter than that of Single–BTF and Three-Stage–BTF. Among them, in the early stage ofwastewater treatment, A2O–BTF had better treatment performance for COD and NH3-Nthan Three-Stage–BTF and Single–BTF. Compared with Single–BTF, A2O–BTF possessed alonger pollutant treatment path due to the addition of multistage reaction devices so thatpollutants could be treated more adequately. Compared with Three-Stage–BTF, A2O–BTFreturns the main pollutants to the anoxic reactor at the beginning of the reaction by theaction of reflux, thereby reducing the emission of pollutants in the initial stage and, atthe same time, increasing the anaerobic environment so that anaerobic bacteria can moreadequately treat the related pollutants.
3.2. The Influence of Temperature
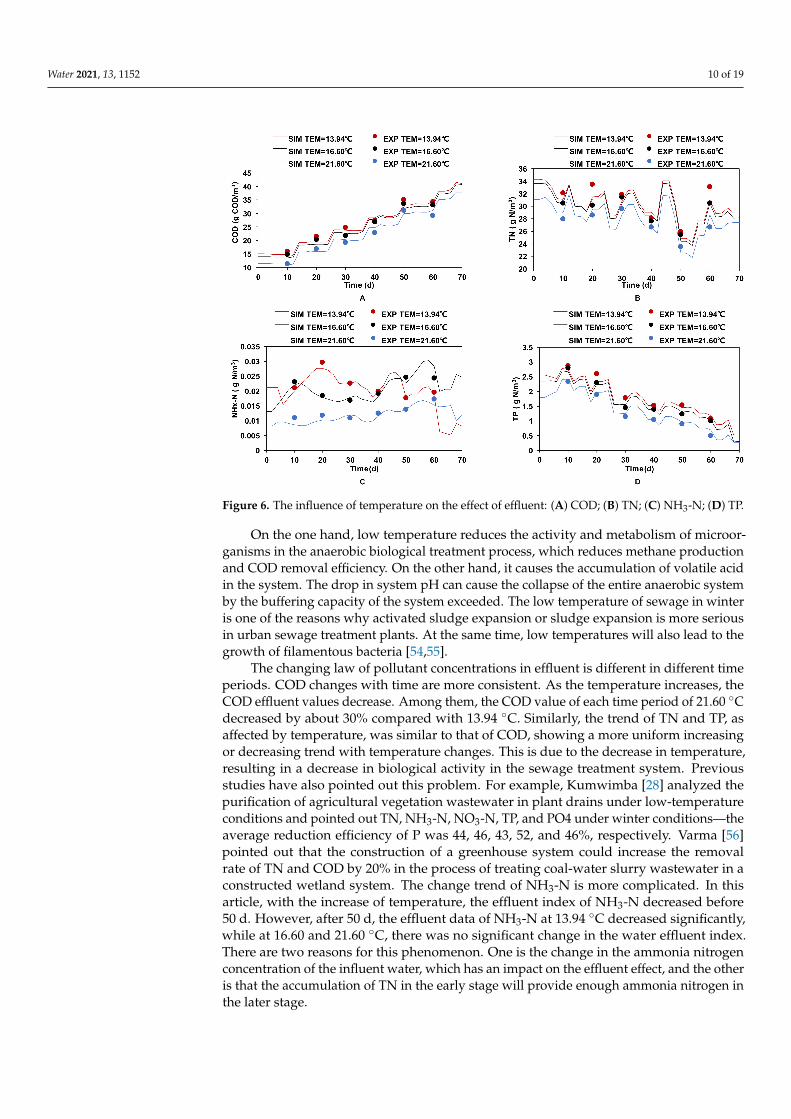
The removal effect of each effluent indicator under different temperature conditions isshown in Figure 6. As the temperature rises, the main sewage effluent indicators decline.Among them, COD, TN, and TP all showed relatively regular changes; that was, as thetemperature increased, the sewage treatment effect was enhanced, and the pollutant efflu-ent data were reduced. As for phosphorus, because phosphorus-accumulating organisms(PAOs) are also a kind of bacteria with better cold tolerance, the effect of temperature onphosphorus removal was not as significant as that on nitrification. However, due to thelow temperature, it was affected by sludge expansion and microbial deposition, so thatthe phosphorus effluent concentration also decreased as the temperature increased [49–51].In the actual operation of urban sewage treatment plants in cold regions in winter, itwas found that the activity of PAOs still exists in low-temperature environments; someinhibitory microorganisms grow rapidly, and nitrates have a strong inhibitory effect onanaerobic phosphorus release. Therefore, phosphorus removal capacity would have acertain tendency to decline under low-temperature conditions [4,52,53].
Water 2021, 13, 1152 10 of 19
Figure 6. The influence of temperature on the effect of effluent: (A) COD; (B) TN; (C) NH3-N; (D) TP.
On the one hand, low temperature reduces the activity and metabolism of microor-ganisms in the anaerobic biological treatment process, which reduces methane productionand COD removal efficiency. On the other hand, it causes the accumulation of volatile acidin the system. The drop in system pH can cause the collapse of the entire anaerobic systemby the buffering capacity of the system exceeded. The low temperature of sewage in winteris one of the reasons why activated sludge expansion or sludge expansion is more seriousin urban sewage treatment plants. At the same time, low temperatures will also lead to thegrowth of filamentous bacteria [54,55].
The changing law of pollutant concentrations in effluent is different in different timeperiods. COD changes with time are more consistent. As the temperature increases, theCOD effluent values decrease. Among them, the COD value of each time period of 21.60 ◦Cdecreased by about 30% compared with 13.94 ◦C. Similarly, the trend of TN and TP, asaffected by temperature, was similar to that of COD, showing a more uniform increasingor decreasing trend with temperature changes. This is due to the decrease in temperature,resulting in a decrease in biological activity in the sewage treatment system. Previousstudies have also pointed out this problem. For example, Kumwimba [28] analyzed thepurification of agricultural vegetation wastewater in plant drains under low-temperatureconditions and pointed out TN, NH3-N, NO3-N, TP, and PO4 under winter conditions—theaverage reduction efficiency of P was 44, 46, 43, 52, and 46%, respectively. Varma [56]pointed out that the construction of a greenhouse system could increase the removalrate of TN and COD by 20% in the process of treating coal-water slurry wastewater in aconstructed wetland system. The change trend of NH3-N is more complicated. In thisarticle, with the increase of temperature, the effluent index of NH3-N decreased before50 d. However, after 50 d, the effluent data of NH3-N at 13.94 ◦C decreased significantly,while at 16.60 and 21.60 ◦C, there was no significant change in the water effluent index.There are two reasons for this phenomenon. One is the change in the ammonia nitrogenconcentration of the influent water, which has an impact on the effluent effect, and the otheris that the accumulation of TN in the early stage will provide enough ammonia nitrogen inthe later stage.
Water 2021, 13, 1152 11 of 19
3.3. The Influence of Dissolved Oxygen3.3.1. The Influence of Dissolved Oxygen on the Effluent
During the operation of the A2O–BTF process, different microorganisms will have acorresponding impact on the effect of sewage treatment. Since the BTF process is essentiallya membrane treatment process, its impact on the pollutant treatment effect is similar to otherstudies on MBBR. Aeration is the main factor affecting pollutant treatment efficiency [57]. Ithas a greater impact on the treatment of the aerobic section, with emphasis on the removalof COD, phosphorus absorption, and nitrification processes.
In this research, a three-stage A2O reaction device was established. The first stagereaction device was anaerobic, the desired DO setpoint was zero, and the second stageused the calculation of dissolved oxygen. The third stage adopted aerobic aeration, and thedesired DO setpoint was 0.2–4 g O2/m3.
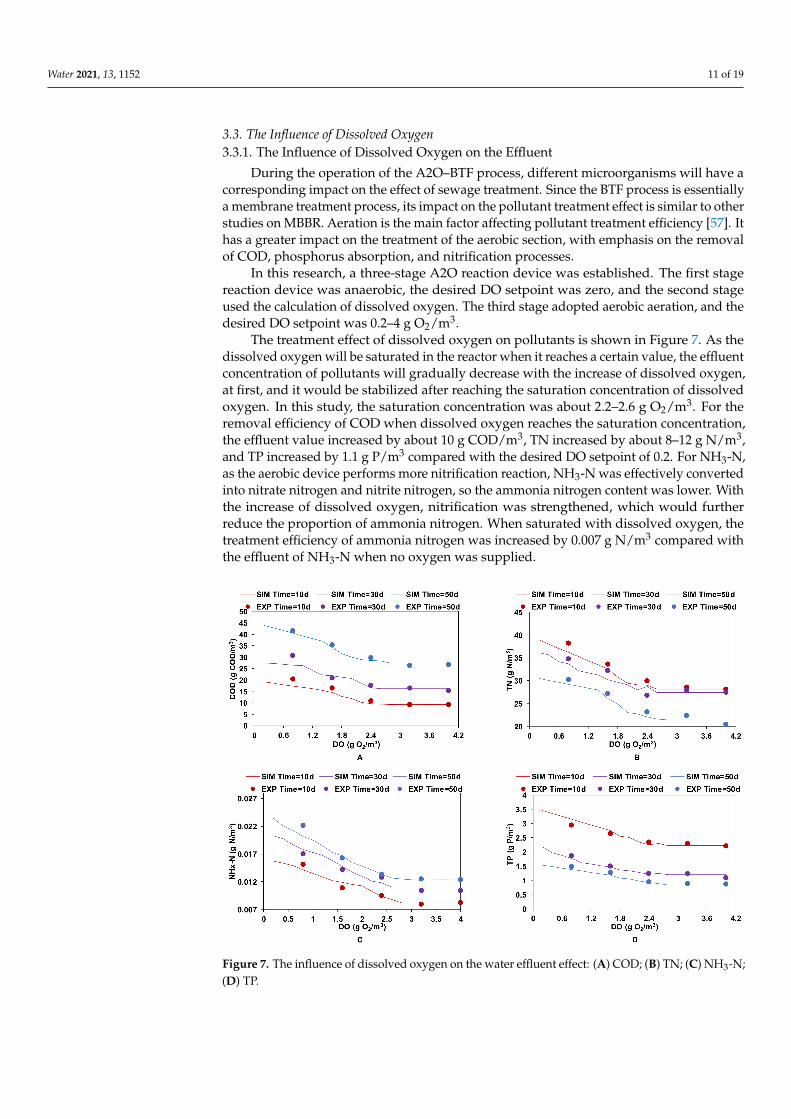
The treatment effect of dissolved oxygen on pollutants is shown in Figure 7. As thedissolved oxygen will be saturated in the reactor when it reaches a certain value, the effluentconcentration of pollutants will gradually decrease with the increase of dissolved oxygen,at first, and it would be stabilized after reaching the saturation concentration of dissolvedoxygen. In this study, the saturation concentration was about 2.2–2.6 g O2/m3. For theremoval efficiency of COD when dissolved oxygen reaches the saturation concentration,the effluent value increased by about 10 g COD/m3, TN increased by about 8–12 g N/m3,and TP increased by 1.1 g P/m3 compared with the desired DO setpoint of 0.2. For NH3-N,as the aerobic device performs more nitrification reaction, NH3-N was effectively convertedinto nitrate nitrogen and nitrite nitrogen, so the ammonia nitrogen content was lower. Withthe increase of dissolved oxygen, nitrification was strengthened, which would furtherreduce the proportion of ammonia nitrogen. When saturated with dissolved oxygen, thetreatment efficiency of ammonia nitrogen was increased by 0.007 g N/m3 compared withthe effluent of NH3-N when no oxygen was supplied.
Figure 7. The influence of dissolved oxygen on the water effluent effect: (A) COD; (B) TN; (C) NH3-N;(D) TP.
Water 2021, 13, 1152 12 of 19
3.3.2. The Effect of Dissolved Oxygen on Biomass
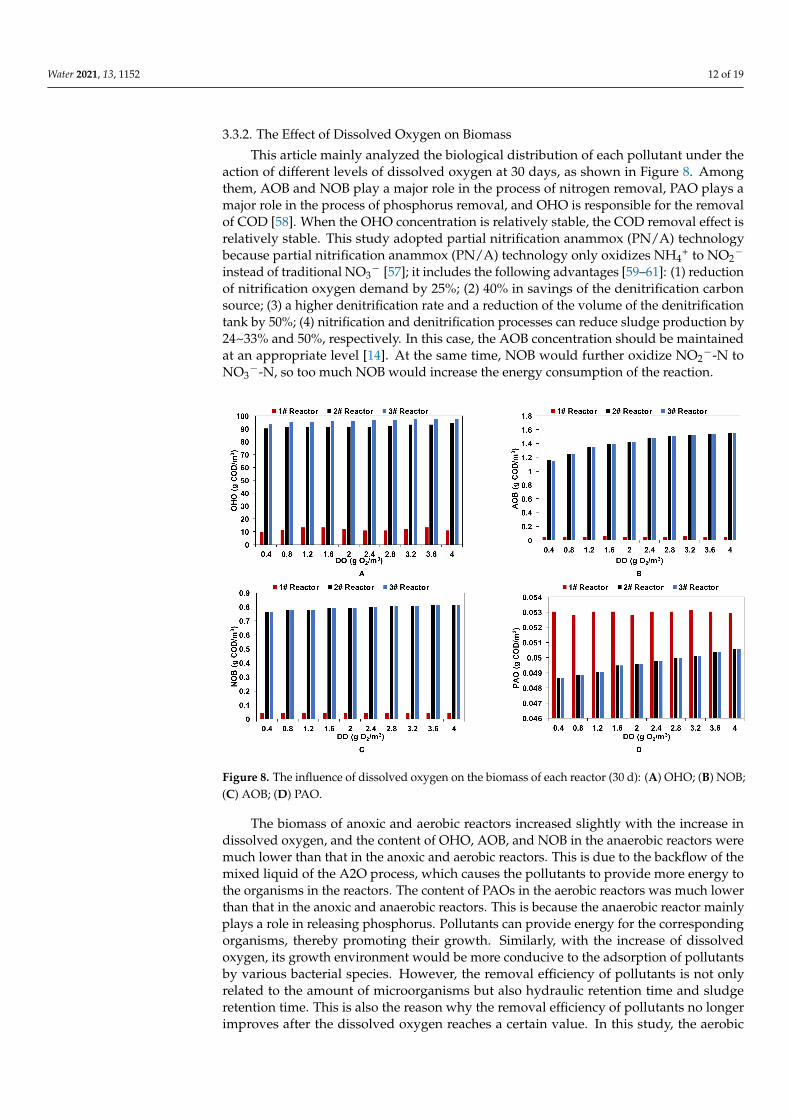
This article mainly analyzed the biological distribution of each pollutant under theaction of different levels of dissolved oxygen at 30 days, as shown in Figure 8. Amongthem, AOB and NOB play a major role in the process of nitrogen removal, PAO plays amajor role in the process of phosphorus removal, and OHO is responsible for the removalof COD [58]. When the OHO concentration is relatively stable, the COD removal effect isrelatively stable. This study adopted partial nitrification anammox (PN/A) technologybecause partial nitrification anammox (PN/A) technology only oxidizes NH4
+ to NO2−
instead of traditional NO3− [57]; it includes the following advantages [59–61]: (1) reduction
of nitrification oxygen demand by 25%; (2) 40% in savings of the denitrification carbonsource; (3) a higher denitrification rate and a reduction of the volume of the denitrificationtank by 50%; (4) nitrification and denitrification processes can reduce sludge production by24~33% and 50%, respectively. In this case, the AOB concentration should be maintainedat an appropriate level [14]. At the same time, NOB would further oxidize NO2
−-N toNO3
−-N, so too much NOB would increase the energy consumption of the reaction.
Figure 8. The influence of dissolved oxygen on the biomass of each reactor (30 d): (A) OHO; (B) NOB;(C) AOB; (D) PAO.
The biomass of anoxic and aerobic reactors increased slightly with the increase indissolved oxygen, and the content of OHO, AOB, and NOB in the anaerobic reactors weremuch lower than that in the anoxic and aerobic reactors. This is due to the backflow of themixed liquid of the A2O process, which causes the pollutants to provide more energy tothe organisms in the reactors. The content of PAOs in the aerobic reactors was much lowerthan that in the anoxic and anaerobic reactors. This is because the anaerobic reactor mainlyplays a role in releasing phosphorus. Pollutants can provide energy for the correspondingorganisms, thereby promoting their growth. Similarly, with the increase of dissolvedoxygen, its growth environment would be more conducive to the adsorption of pollutantsby various bacterial species. However, the removal efficiency of pollutants is not onlyrelated to the amount of microorganisms but also hydraulic retention time and sludgeretention time. This is also the reason why the removal efficiency of pollutants no longerimproves after the dissolved oxygen reaches a certain value. In this study, the aerobic
Water 2021, 13, 1152 13 of 19
reactor at the desired DO setpoint was 4 g O2/m3 compared with 0.2 g O2/m3, the amountof OHO increased by 5%, PAOs increased by 4%, NOB increased by 6%, and AOB increasedby 35%. Since AOB should be effectively promoted and NOB should be suppressed inpartial nitrification anammox (PN/A) [14], the improvement of AOB was greater than thatof NOB, which could effectively improve wastewater treatment efficiency.
3.4. The Influence of the Reflux Ratio3.4.1. The Influence of the Reflux Ratio on the Effluent
Different from Single–BTF and Three-stage–BTF, with the construction of the A2Oprocess, the reflow device would influence the sewage treatment effect. Among them, themixed liquor reflux ratio (RR) mainly affects the denitrification removal effect, and thesludge reflux ratio mainly affects the microbial concentration in the system and biologicalphosphorus removal [62–64]. This is because the oxygen in the nitrate in the reflux liquidcan be used as an electron donor, and the denitrification bacteria in the denitrificationprocess use the organic matter in sewage as a carbon source. However, excessive refluxwould increase the operating cost, and, at the same time, due to an insufficient carbonsource in the reactor, it will also affect the reaction effect. In this article, the A2O process isbased on the biological trickling filter (BTF), and the amount of sludge produced by thebiological trickling filter (BTF) was less than that of the traditional activated sludge system,so the mixed liquid reflux ratio (RR) was focused on.
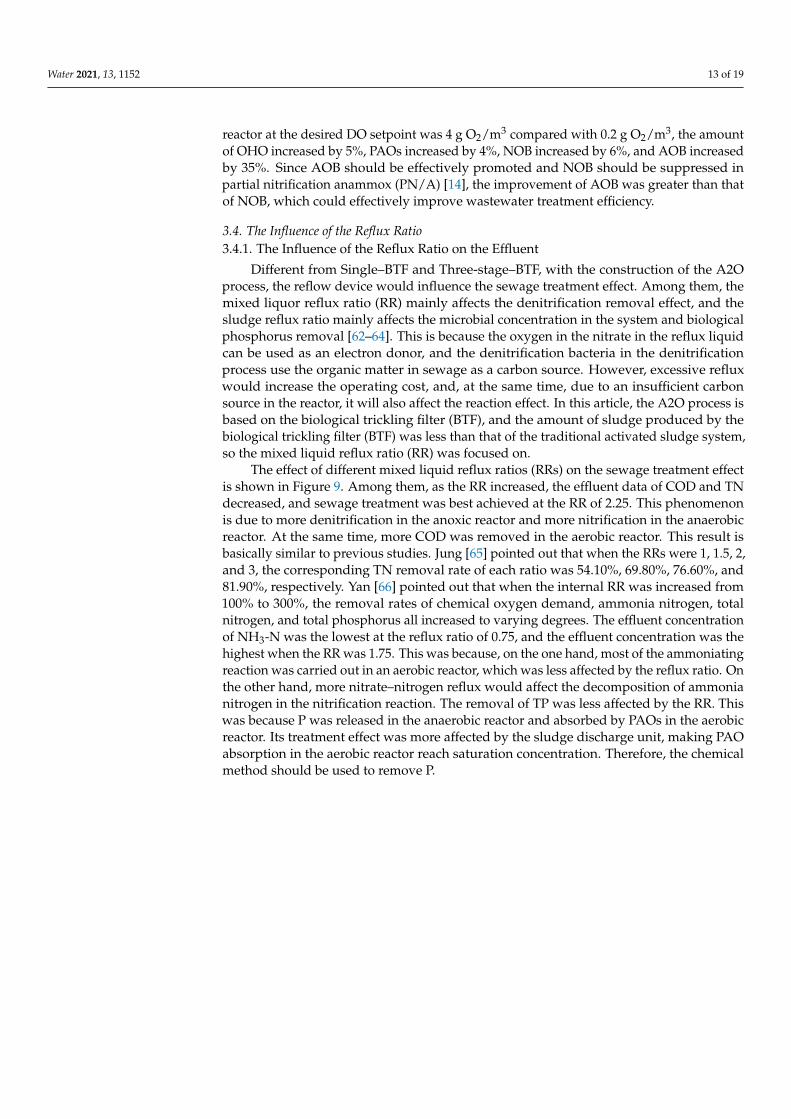
The effect of different mixed liquid reflux ratios (RRs) on the sewage treatment effectis shown in Figure 9. Among them, as the RR increased, the effluent data of COD and TNdecreased, and sewage treatment was best achieved at the RR of 2.25. This phenomenonis due to more denitrification in the anoxic reactor and more nitrification in the anaerobicreactor. At the same time, more COD was removed in the aerobic reactor. This result isbasically similar to previous studies. Jung [65] pointed out that when the RRs were 1, 1.5, 2,and 3, the corresponding TN removal rate of each ratio was 54.10%, 69.80%, 76.60%, and81.90%, respectively. Yan [66] pointed out that when the internal RR was increased from100% to 300%, the removal rates of chemical oxygen demand, ammonia nitrogen, totalnitrogen, and total phosphorus all increased to varying degrees. The effluent concentrationof NH3-N was the lowest at the reflux ratio of 0.75, and the effluent concentration was thehighest when the RR was 1.75. This was because, on the one hand, most of the ammoniatingreaction was carried out in an aerobic reactor, which was less affected by the reflux ratio. Onthe other hand, more nitrate–nitrogen reflux would affect the decomposition of ammonianitrogen in the nitrification reaction. The removal of TP was less affected by the RR. Thiswas because P was released in the anaerobic reactor and absorbed by PAOs in the aerobicreactor. Its treatment effect was more affected by the sludge discharge unit, making PAOabsorption in the aerobic reactor reach saturation concentration. Therefore, the chemicalmethod should be used to remove P.
Water 2021, 13, 1152 14 of 19
Figure 9. The influence of different mixed liquid RRs on the pollutant effluent effect: (A) COD;(B) TN; (C) NH3-N; (D) TP.
3.4.2. The Effect of the Mixed Liquor Reflux Ratio on Biomass
There are two main challenges in the partial nitrification anammox (PN/A) process.One is to inhibit the role of nitrite-oxidizing bacteria (NOB) in the short-cut nitrificationprocess, and the other is to increase the residence time of AOB (ammonia-oxidizing bacteria)in the anaerobic ammonia oxidation process to promote the role of AOB [14].
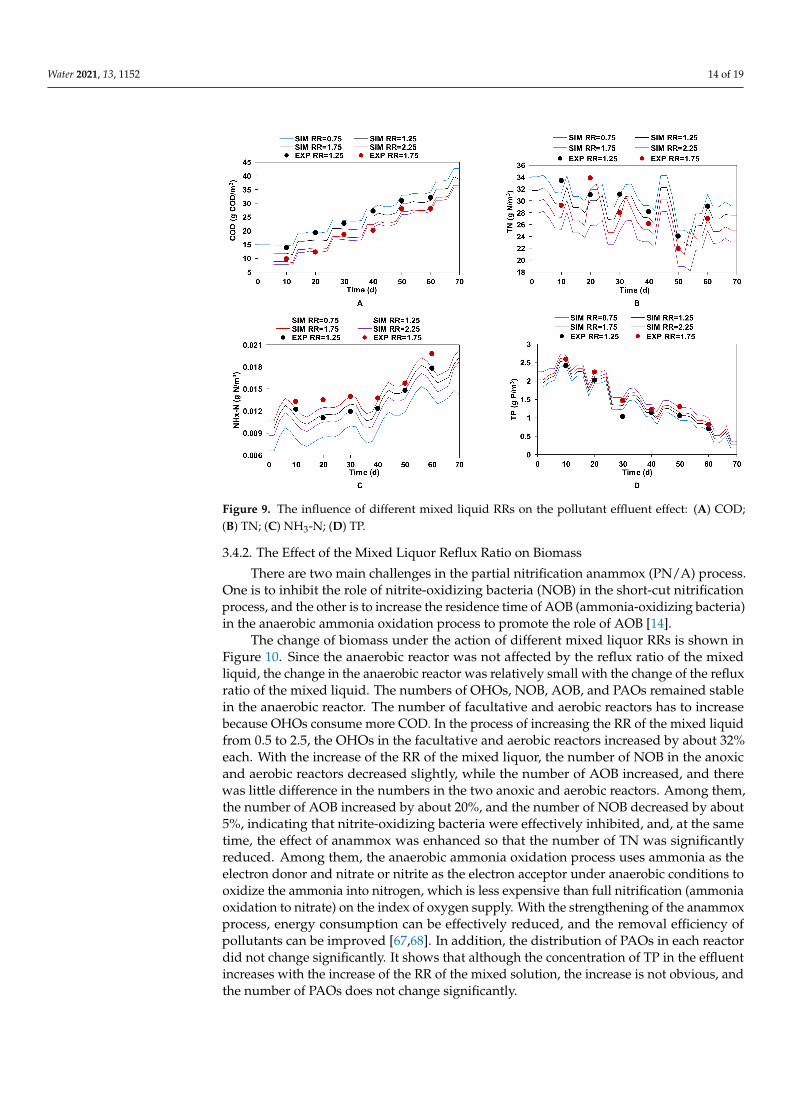
The change of biomass under the action of different mixed liquor RRs is shown inFigure 10. Since the anaerobic reactor was not affected by the reflux ratio of the mixedliquid, the change in the anaerobic reactor was relatively small with the change of the refluxratio of the mixed liquid. The numbers of OHOs, NOB, AOB, and PAOs remained stablein the anaerobic reactor. The number of facultative and aerobic reactors has to increasebecause OHOs consume more COD. In the process of increasing the RR of the mixed liquidfrom 0.5 to 2.5, the OHOs in the facultative and aerobic reactors increased by about 32%each. With the increase of the RR of the mixed liquor, the number of NOB in the anoxicand aerobic reactors decreased slightly, while the number of AOB increased, and therewas little difference in the numbers in the two anoxic and aerobic reactors. Among them,the number of AOB increased by about 20%, and the number of NOB decreased by about5%, indicating that nitrite-oxidizing bacteria were effectively inhibited, and, at the sametime, the effect of anammox was enhanced so that the number of TN was significantlyreduced. Among them, the anaerobic ammonia oxidation process uses ammonia as theelectron donor and nitrate or nitrite as the electron acceptor under anaerobic conditions tooxidize the ammonia into nitrogen, which is less expensive than full nitrification (ammoniaoxidation to nitrate) on the index of oxygen supply. With the strengthening of the anammoxprocess, energy consumption can be effectively reduced, and the removal efficiency ofpollutants can be improved [67,68]. In addition, the distribution of PAOs in each reactordid not change significantly. It shows that although the concentration of TP in the effluentincreases with the increase of the RR of the mixed solution, the increase is not obvious, andthe number of PAOs does not change significantly.
Water 2021, 13, 1152 15 of 19
Figure 10. Changes of biomass in each reactor under different RRs (30 d): (A) OHO; (B) NOB;(C) AOB; (D) PAO.
4. Conclusions
The wastewater treatment performances of the three-stage biological trickling filterbased on A2O (A2O–BTF), the ordinary three-stage biological trickling filter (Three-Stage–BTF), and the single biological trickling filter (Single–BTF) were modeled, and the operatingparameters of A2O–BTF, such as temperature, dissolved oxygen, and reflux ratio, wereoptimized. As the temperature increased to the range of 13.94–21.6 ◦C, the pollutantconcentration in the effluent decreased. The increase of dissolved oxygen (DO) in theaerobic pool reduced the effluent concentration of pollutants, but when the dissolvedoxygen reached a certain value, the effluent concentration would no longer decrease.Appropriately increasing the reflux ratio of the mixed solution within a certain range couldeffectively improve the removal effect of COD and TN, but it will make the removal of TPdrop slightly.
Author Contributions: Conceptualization, J.L. and Z.Z.; methodology, S.Y.; software, J.L.; datacuration, Y.Y. (Yixing Yuan); writing—original draft preparation, Y.Y. (Yuan Yuan); writing—reviewand editing, J.L.; project administration, S.Y.; funding acquisition, Y.Y. (Yixing Yuan) All authors haveread and agreed to the published version of the manuscript.
Funding: This research received no external funding.
Institutional Review Board Statement: Not applicable.
Informed Consent Statement: Not applicable.
Data Availability Statement: Not applicable.
Acknowledgments: We would like to thank the professional reviewers and the editors.
Conflicts of Interest: The authors declare no conflict of interest.
Water 2021, 13, 1152 16 of 19
Abbreviations
A2O anaerobic–anoxic–oxicADM anaerobic digestion modelAOB ammonia-oxidizing bacteriaAS activated sludgeASM activated sludge modelBOD biochemical oxygen demandBTF biological trickling filterCOD chemical oxygen demandDO dissolved oxygenIFAS integrated fixed-film activated sludgeIWA International Water AssociationMBBR moving bed biofilm reactorMLVSS mixed liquid volatile suspended solidsNOB nitrite-oxidizing bacteriaOHO ordinary heterotrophic organismPAO polyphosphate accumulating bacteriaPN/A partial nitrification anammoxRR reflux ratioSBR sequence batch reactorTN total nitrogenTP total phosphorusTKN total Kjeldahl nitrogenWWTP wastewater treatment process
References1. Ahn, J.H.; Kwan, T.; Chandran, K. Comparison of partial and full nitrification processes applied for treating high-strength
nitrogen wastewaters: Microbial ecology through nitrous oxide production. Environ. Sci. Technol. 2011, 45, 2734–2740. [CrossRef]2. Gullicks, H.; Hasan, H.; Das, D.; Morretti, C.; Hung, Y.T. Biofilm Fixed Film Systems. Water 2011, 3, 843–868. [CrossRef]3. Ibrahim, S.; El-Liethy, M.A.; Abia, A.L.K.; Abdel-Gabbar, M.; Al-Zananty, A.M.; Kamel, M.M. Design of a bioaugmented
multistage biofilter for accelerated municipal wastewater treatment and deactivation of pathogenic microorganisms. Sci. TotalEnviron. 2020, 703, 134786. [CrossRef]
4. Li, J.; Jin, Y.; Guo, Y.; He, J. Enhancement of phosphorus removal in a low temperature A2/O process by anaerobic phosphorusrelease of activated sludge. Water Sci. Technol. 2013, 67, 2437–2443. [CrossRef] [PubMed]
5. Pan, Z.; Zhou, J.; Lin, Z.; Wang, Y.; Zhao, P.; Zhou, J.; Liu, S.; He, X. Effects of COD/TN ratio on nitrogen removal efficiency,microbial community for high saline wastewater treatment based on heterotrophic nitrification-aerobic denitrification process.Bioresour. Technol. 2020, 301. [CrossRef] [PubMed]
6. Golshan, M.; Jorfi, S.; Haghighifard, N.J.; Takdastan, A.; Ghafari, S.; Rostami, S.; Ahmadi, M. Development of salt-tolerantmicrobial consortium during the treatment of saline bisphenol A-containing wastewater: Removal mechanisms and microbialcharacterization. J. Water Process Eng. 2019, 32. [CrossRef]
7. Ghosh, S.; Chakraborty, S. Influence of inoculum variation on formation and stability of aerobic granules in oily wastewatertreatment. J. Environ. Manage. 2019, 248. [CrossRef] [PubMed]
8. Ahmadi, M.; Ahmadmoazzam, M.; Saeedi, R.; Abtahi, M.; Ghafari, S.; Jorfi, S. Biological treatment of a saline and recalcitrantpetrochemical wastewater by using a newly isolated halo-tolerant bacterial consortium in MBBR. Desalin. Water Treat. 2019,167, 84–95. [CrossRef]
9. Hodgson, B.; Sharvelle, S. Development of generalized empirical models for comparing effectiveness of wastewater nutrientremoval technologies. Environ. Sci. Pollut. Res. 2019, 26, 27915–27929. [CrossRef]
10. Ravishankar, H.; Moazzem, S.; Jegatheesan, V. Performance evaluation of A2O MBR system with graphene oxide (GO) blendedpolysulfone (PSf) composite membrane for treatment of high strength synthetic wastewater containing lead. Chemosphere 2019,234, 148–161. [CrossRef]
11. Yang, C.C.; Lu, M.S.; Dao, K.C.; Lin, J.W.; Chou, Y.H.; Tsai, Y.P. Comparison of the Influences of Cadmium Toxicity to PhosphateRemoval in Activated Sludge Separately Fed by Glucose and Acetic Acid as Carbon Sources. Water 2020, 12, 1205. [CrossRef]
12. Qian, M.; Yang, L.; Chen, X.; Li, K.; Xue, W.; Li, Y.; Zhao, H.; Cao, G.; Guan, X.; Shen, G. The treatment of veterinary antibiotics inswine wastewater by biodegradation and Fenton-like oxidation. Sci. Total Environ. 2020, 710, 136299. [CrossRef]
13. Park, J.; Kim, C.; Hong, Y.; Lee, W.; Chung, H.; Jeong, D.H.; Kim, H. Distribution and Removal of Pharmaceuticals in Liquid andSolid Phases in the Unit Processes of Sewage Treatment Plants. Int. J. Env. Res. Public Health 2020, 17, 687. [CrossRef]
Water 2021, 13, 1152 17 of 19
14. Tao, C.; Hamouda, M.A. Steady-state modeling and evaluation of partial nitrification-anammox (PNA) for moving bed biofilmreactor and integrated fixed-film activated sludge processes treating municipal wastewater. J. Water Process Eng. 2019, 31, 100854.[CrossRef]
15. Leyva-Diaz, J.C.; Monteoliva-Garcia, A.; Martin-Pascual, J.; Munio, M.M.; Garcia-Mesa, J.J.; Poyatos, J.M. Moving bed biofilmreactor as an alternative wastewater treatment process for nutrient removal and recovery in the circular economy model. Bioresour.Technol. 2020, 299. [CrossRef]
16. Cramer, M.; Traenckner, J. Development of Decay in Biofilms under Starvation Conditions-Rethinking of the Biomass Model.Water 2020, 12, 1249. [CrossRef]
17. Cramer, M.; Tranckner, J.; Kotzbauer, U. Kinetic of denitrification and enhanced biological phosphorous removal (EBPR) of atrickling filter operated in a sequence-batch-reactor-mode (SBR-TF). Environ. Technol. 2019, 10. [CrossRef]
18. Naz, I.; Saroj, D.P.; Mumtaz, S.; Ali, N.; Ahmed, S. Assessment of biological trickling filter systems with various packing materialsfor improved wastewater treatment. Environ. Technol. 2015, 36, 424–434. [CrossRef]
19. Akratos, C.S.; Tatoulis, T.I.; Tekerlekopoulou, A.G. Biotreatment of Winery Wastewater Using a Hybrid System CombiningBiological Trickling Filters and Constructed Wetlands. Appl. Sci. 2020, 10, 619. [CrossRef]
20. Diez-Montero, R.; Castrillo, M.; Casao, M.; Tejero, I. Model-based evaluation of a trickling filter facility upgrade to biologicalnutrient removal. Sci. Total Environ. 2019, 661, 187–195. [CrossRef]
21. Aziz, S.Q.; Ali, S.M. Characterization of municipal and dairy wastewaters with 30 quality parameters and potential wastewatertreatment by biological trickling filters. Int. J. Green Energy 2017, 14, 1156–1162. [CrossRef]
22. Shahriari, T.; Shokouhi, M. Textile wastewater treatment using biological trickling filter with natural media in cold weather (casestudy: Motahari textile factory). Fresenius Environ. Bull. 2018, 27, 779–786.
23. Zhang, X.; Wang, Y.; Zhong, Z.; Shao, Q.; Wang, Y.; Li, W. Bacterial complexes of Bacillus subtilis and Pseudomonas stutzeri alterthe microbial composition in grass carp water. Aquacult. Int. 2019, 27, 303–312. [CrossRef]
24. Yu, D.; Yang, J.; Fang, X.; Ren, H. Simultaneous efficient removal of high-strength ammonia nitrogen and chemical oxygendemand from landfill leachate by using an extremely high ammonia nitrogen-resistant strain. Biotechnol. Appl. Biochem. 2015,62, 357–368. [CrossRef]
25. Sekar, S.; Sivaprakasam, S.; Mahadevan, S. Investigations on ultraviolet light and nitrous acid induced mutations of halotolerantbacterial strains for the treatment of tannery soak liquor. Int. Biodeterior. Biodegrad. 2009, 63, 176–181. [CrossRef]
26. Zhou, H.; Li, X.; Xu, G.; Yu, H. Overview of strategies for enhanced treatment of municipal/domestic wastewater at lowtemperature. Sci. Total Environ. 2018, 643, 225–237. [CrossRef]
27. Gomez-Rios, D.; Ramirez-Malule, H.; Neubauer, P.; Junne, S.; Rios-Estepa, R. Degradation Kinetics of Clavulanic Acid inFermentation Broths at Low Temperatures. Antibiotics 2019, 8, 6. [CrossRef]
28. Kumwimba, M.N.; Zhu, B.; Wang, T.; Dzakpasu, M.; Li, X. Nutrient dynamics and retention in a vegetated drainage ditchreceiving nutrient-rich sewage at low temperatures. Sci. Total Environ. 2020, 741. [CrossRef]
29. Maurer, M.; Gujer, W. Dynamic modelling of enhanced biological phosphorus and nitrogen removal in activated sludge systems.Water Sci. Technol. 1998, 38, 203–210. [CrossRef]
30. Gujer, W.; Henze, M.; Mino, T.; van Loosdrecht, M. Activated Sludge Model No. 3. Water Sci. Technol. 1999, 39, 183–193. [CrossRef]31. Watari, T.; Hata, Y.; Hirakata, Y.; Nguyet, P.N.; Nguyen, T.H.; Maki, S.; Hatamoto, M.; Sutani, D.; Setia, T.; Yamaguch, T.
Performance evaluation of down-flow hanging sponge reactor for direct treatment of actual textile wastewater; Effect of effluentrecirculation to performance and microbial community. J. Water Process Eng. 2021, 39, 8. [CrossRef]
32. Abou-Elela, S.I.; Hellal, M.S.; Aly, O.H.; Abo-Elenin, S.A. Decentralized wastewater treatment using passively aerated biologicalfilter. Environ. Technol. 2019, 40, 250–260. [CrossRef] [PubMed]
33. Zeng, W.; Li, L.; Yang, Y.; Zhang, Y.; Peng, Y. Effect of nitrite accumulation on enhanced biological phosphorus removal (EBPR) inA2O process treating domestic wastewater. Huan Jing Ke Xue 2010, 31, 2105–2112. [PubMed]
34. Makuwa, S.; Tlou, M.; Fosso-Kankeu, E.; Green, E. Evaluation of Fecal Coliform Prevalence and Physicochemical Indicators in theEffluent from a Wastewater Treatment Plant in the North-West Province, South Africa. Int. J. Env. Res. Public Health 2020, 17, 6381.[CrossRef]
35. Cao, G.; Wang, S.; Peng, Y.; Miao, Z. Biological nutrient removal by applying modified four step-feed technology to treat weakwastewater. Bioresour. Technol. 2013, 128, 604–611. [CrossRef]
36. Peng, Y.; Ge, S. Enhanced nutrient removal in three types of step feeding process from municipal wastewater. Bioresour. Technol.2011, 102, 6405–6413. [CrossRef]
37. Huisman, J.L.; Gujer, W. Modelling wastewater transformation in sewers based on ASM3. Water Sci. Technol. 2002, 45, 51–60.[CrossRef]
38. Elawwad, A.; Zaghloul, M.; Abdel-Halim, H. Simulation of municipal-industrial full scale WWTP in an arid climate by applicationof ASM3. J. Water Reuse Desalin. 2017, 7, 37–44. [CrossRef]
39. Otuzalti, M.M.; Perendeci, N.A. Modeling of real scale waste activated sludge anaerobic digestion process by Anaerobic DigestionModel 1 (ADM1). Int. J. Green Energy 2018, 15, 454–464. [CrossRef]
40. Dereli, R.K.; Ersahin, M.E.; Ozgun, H.; Ozturk, I.; Aydin, A.F. Applicability of Anaerobic Digestion Model No. 1 (ADM1) for aspecific industrial wastewater: Opium alkaloid effluents. Chem. Eng. J. 2010, 165, 89–94. [CrossRef]
Water 2021, 13, 1152 18 of 19
41. Baeten, J.E.; Batstone, D.J.; Schraa, O.J.; van Loosdrecht, M.C.M.; Volcke, E.I.P. Modelling anaerobic, aerobic and partial nitritation-anammox granular sludge reactors—A review. Water Res. 2019, 149, 322–341. [CrossRef]
42. Seuntjens, D.; Han, M.; Kerckhof, F.M.; Boon, N.; Al-Omari, A.; Takacs, I.; Meerburg, F.; De Mulder, C.; Wett, B.; Boot, C.; et al.Pinpointing wastewater and process parameters controlling the AOB to NOB activity ratio in sewage treatment plants. Water Res.2018, 138, 37–46. [CrossRef]
43. Gazsó, Z.; Házi, F.; Kenyeres, I.; Váci, L. Full-scale wastewater treatment plant simulation for real-time optimization. Water Pract.Technol. 2017, 12, 848–856. [CrossRef]
44. Chuang, H.; Ohashi, A.; Imachi, H.; Tandukar, M.; Harada, H. Effective partial nitrification to nitrite by down-flow hangingsponge reactor under limited oxygen condition. Water Res. 2007, 41, 295–302. [CrossRef]
45. Watari, T.; Vazquez, C.L.; Hatamoto, M.; Yamaguchi, T.; van Lier, J.B. Development of a single-stage mainstream anammoxprocess using a sponge-bed trickling filter. Environ. Technol. 2020. [CrossRef]
46. Guillen, J.A.S.; Jayawardana, L.K.M.C.B.; Vazquez, C.M.L.; Cruz, L.M.O.; Brdjanovic, D.; van Lier, J.B. Autotrophic nitrogenremoval over nitrite in a sponge-bed trickling filter. Bioresour. Technol. 2015, 187, 314–325. [CrossRef]
47. Tian, X.; Guo, X.; Yuan, X. Effects of Influent Organic Loading on Removal of Nitrogen and Phosphorus from the Three StageBio-Trickling Filters. Environ. Engineer. 2017, 35, 29–34.
48. Bai, X. The Optimization Research about the Operation of Wastewater Treatment Plant by Biowin Simulation Model. Master’sThesis, Kunming University of Science and Technology, Kunming, China, 2016.
49. Ge, S.; Wang, S.; Yang, X.; Qiu, S.; Li, B.; Peng, Y. Detection of nitrifiers and evaluation of partial nitrification for wastewatertreatment: A review. Chemosphere 2015, 140, 85–98. [CrossRef]
50. Onwosi, C.O.; Igbokwe, V.C.; Odimba, J.N.; Eke, I.E.; Nwankwoala, M.O.; Iroh, I.N.; Ezeogu, L.I. Composting technology inwaste stabilization: On the methods, challenges and future prospects. J. Environ. Manag. 2017, 190, 140–157. [CrossRef]
51. Chang, Y.; Lai, J.-Y.; Lee, D.-J. Thermodynamic parameters for adsorption equilibrium of heavy metals and dyes from wastewaters:Research updated. Bioresour. Technol. 2016, 222, 513–516. [CrossRef]
52. Brown, E.V.; Enzminger, J.D. Temperature profile and heat-transfer model for a chemical waste-water treatment-plant. Environ.Prog. 1991, 10, 159–168. [CrossRef]
53. Kanda, R.; Kishimoto, N.; Hinobayashi, J.; Hashimoto, T. Effects of recirculation rate of nitrified liquor and temperature onbiological nitrification-denitrification process using a trickling filter. Water Environ. J. 2016, 30, 190–196. [CrossRef]
54. Chen, Y.; Lan, S.; Wang, L.; Dong, S.; Zhou, H.; Tan, Z.; Li, X. A review: Driving factors and regulation strategies of microbialcommunity structure and dynamics in wastewater treatment systems. Chemosphere 2017, 174, 173–182. [CrossRef]
55. Sankaran, S.; Khanal, S.K.; Jasti, N.; Jin, B.; Pometto, A.L.; van Leeuwen, J. Use of Filamentous Fungi for Wastewater Treatmentand Production of High Value Fungal Byproducts: A Review. Crit. Rev. Environ. Sci. Technol. 2010, 40, 400–449. [CrossRef]
56. Varma, M.; Gupta, A.K.; Ghosal, P.S.; Majumder, A. A review on performance of constructed wetlands in tropical and coldclimate: Insights of mechanism, role of influencing factors, and system modification in low temperature. Sci. Total Environ. 2020,755, 142540. [CrossRef]
57. Lotti, T.; Kleerebezem, R.; Hu, Z.; Kartal, B.; Jetten, M.S.M.; van Loosdrecht, M.C.M. Simultaneous partial nitritation andanammox at low temperature with granular sludge. Water Res. 2014, 66, 111–121. [CrossRef]
58. Li, J.; Zhang, L.; Peng, Y.; Zhang, Q. Effect of low COD/N ratios on stability of single-stage partial nitritation/anammox (SPN/A)process in a long-term operation. Bioresour. Technol. 2017, 244. [CrossRef]
59. Gani, K.M.; Awolusi, O.O.; Khan, A.A.; Kumari, S.; Bux, F. Potential strategies for the mainstream application of anammox intreatment of anaerobic effluents—A review. Crit. Rev. Environ. Sci. Technol. 2020. [CrossRef]
60. Cao, S.; Du, R.; Zhou, Y. Coupling anammox with heterotrophic denitrification for enhanced nitrogen removal: A review. Crit.Rev. Environ. Sci. Technol. 2020. [CrossRef]
61. Kunapongkiti, P.; Rongsayamanont, C.; Nayranritsattha, P.; Limpiyakorn, T. Application of cell immobilization technology topromote nitritation: A review. Environ. Eng. Res. 2020, 25, 807–818. [CrossRef]
62. Wang, L.; Shen, H.; Zhang, H.; Wu, X.; Wang, X. Experimental Studies on The Effects of Different Carbon Sources on PhosphorusRemoval During Denitrifying Process in the Parallel A(2)O-Mbr System. Environ. Eng. Manag. J. 2013, 12, 1833–1836. [CrossRef]
63. Peng, S.; Kong, Q.; Deng, S.; Xie, B.; Yang, X.; Li, D.; Hu, Z.; Sun, S. Application potential of simultaneous nitrification/Fe-0-supported autotrophic denitrification (SNAD) based on iron-scraps and micro electrolysis. Sci. Total Environ. 2020, 711.[CrossRef]
64. Wang, Y.; Liu, B.; Zhang, K.; Liu, Y.; Xu, X.; Wang, H. In-situ sludge reduction and simultaneous phosphorus removal in A(2)Oand side-stream induced crystallization coupling system for treating domestic wastewater. Desalin. Water Treat. 2019, 146, 165–175.[CrossRef]
65. Jung, J.; Cho, Y.; Kim, Y. Efficiencies of Organic Matters and Nitrogen Removal at Different Recycle Ratios in a SMBR System.Ksce J. Civil Eng. 2019, 23, 985–991. [CrossRef]

Water 2021, 13, 1152 19 of 19
66. Yan, X.; Zheng, J.; Han, Y.; Eiu, J.; Sun, J. Experimental studies on the effects of different carbon sources on phosphorus removalduring denitrifying process in the parallel A(2)O-mbr system. Environ. Prot. Eng. 2019, 45, 87–101.
67. Li, J.; Li, J.; Peng, Y.; Wang, S.; Zhang, L.; Yang, S.; Li, S. Insight into the impacts of organics on anammox and their potentiallinking to system performance of sewage partial nitrification-anammox (PN/A): A critical review. Bioresour. Technol. 2020, 300.[CrossRef] [PubMed]
68. Zhang, M.; Wang, S.; Ji, B.; Lin, Y. Towards mainstream deammonification of municipal wastewater: Partial nitrification-anammoxversus partial denitrification-anammox. Sci. Total Environ. 2019, 692, 393–401. [CrossRef]