Environmentally sustainable practices and motivations of ...
Upload
independentCategory
view
1download
0
Int. J. Environment and Pollution, Vol. 30, No. 1, 2007 75
Copyright © 2007 Inderscience Enterprises Ltd.
Model calculation of environmentally friendly traffic flows in a rapidly growing urban centre in India
Y. Anjaneyulu* TLGVRC, Jackson State University, Jackson, Mississippi-39217, USA Fax: 601-979-1625 E-mail: [email protected] *Corresponding author
I. Jayakumar, V. Hima Bindu, G. Sagareswar and P.V. Mukunda Rao Center for Environment, Institute of Science and Technology, Jawaharlal Nehru Technological University, Kukatpally, Hyderabad – 500 072, Andhra Pradesh, India E-mail: [email protected] E-mail: [email protected] E-mail: [email protected] E-mail: [email protected]
K.V. Ramani Andhra Pradesh Pollution Control Board, Paryavaran Bhavan, Sanathnagar, Hyderabad – 500 032, India E-mail: [email protected]
Abstract: The paper highlights the application of an integrated decision support system for calculation of environmental friendly traffic flows in urban networks under different management strategies. Each proposed alternative is evaluated using a GIS and GPS environment that may, on a local basis, affect the environmental burden and contribute to pollution load in the region. For each link of the network an environmental capacity is calculated, taking into consideration the hydrodynamic theory based traffic flow dependent on the length of the road network and the average traffic volume and speed. The studied management options include
• modifying the existing road network • road widening activities • bus bay relocation • construction of RUB/ROBs • rescheduling the work activities • parking management.

76 Y. Anjaneyulu et al.
The integrated transportation decision support system offers entirely new way of using the GIS, GPS and field survey data for model calculation of pollution load from road traffic to devise environmentally friendly traffic flows.
Keywords: transportation decision support system; GIS; GPS; environmental capacity; hydrodynamic theory; road capacity.
Reference to this paper should be made as follows: Anjaneyulu, Y., Jayakumar, I., Bindu, V.H., Sagareswar, G., Rao, P.V.M. and Ramani, K.V. (2007) ‘Model calculation of environmentally friendly traffic flows in a rapidly growing urban centre in India’, Int. J. Environment and Pollution, Vol. 30, No. 1, pp.75–89.
Biographical notes: Yerramilli Anjaneyulu is former Director, Institute of Science, Jawaharlal Nehru Technological University, Hyderabad, AP, India. He is presently a Visiting Professor in Environment and Chemistry and Director Trent Lott Geospatial Research Visualization centre, Jackson state University, MS, USA. He has contributed to nearly 150 papers of national and international repute. He has guided 28 PhD scholars to date. He has authored a number of books covering air pollution control technologies, environmental impact assessment, and analytical chemistry. His active research areas include air pollution control technologies, water and waste water treatment technologies, non-conventional energy sources, carbon nanotube production, and bioremediation of contaminated sites. He is currently working on development of Nanosensors, Multiscale air pollution dispersion modeling and GIS assisted Dam break & Flood disaster assessment.
I. Jayakumar did his PhD on Innovative Approaches for Assessment of Ambient Air Quality in Fast Growing Urban Centres; Use of Online Air Quality Monitoring and GIS Tools. He presently works as Post Doctoral Research Associate, Jackson State University, MS, USA. He has carried out air pollution monitoring, Environmental impact assessment, GIS and remote sensing for environmental applications. He has published nearly five papers in International and National journals. His areas of interest include air pollution, EIA/EMP, sensors, pollution monitoring and GIS. He is currently working on Mesoscale Air pollution Dispersion modeling using CMAQ, WRF and WRF-CHEM.
V. Hima Bindu is an Assistant Professor at JNT University. She has published nine papers and made a number of conference presentations. Her active areas of research include wastewater treatment, environmental analysis, and application development for analytical techniques.
G. Sagareswar, MTech, is a junior research fellow at JNT University and is working on Heavy Metals and VOC Characterisation and Apportionment Studies at Hyderabad. His areas of interest include air pollution monitoring, GC, HPLC and AAS/ICP for pollution monitoring.
P.V. Mukunda Rao, MTech, is a junior research fellow at JNT University and is working for his thesis under the supervision of Professor Y. Anjaneyulu. His areas of interest include air pollution monitoring, health studies, environmental impact assessment, water quality assessment, and environmental applications of HPLC.

Model calculation of environmentally friendly traffic flows 77
K.V. Ramani is Joint Chief Environmental Scientist with the Andhra Pradesh Pollution Control Board, Hyderabad. Her research interests include source apportionment, pollution monitoring and biomedical treatment systems.
1 Introduction
The environmental pollution caused by motor vehicles has increased substantially as a result of the continual rise in the use of vehicles (UNEP/WHO, 1992). The problem is compounded by the fact that the vehicles emit pollutants in the close proximity of the breathing zones of people, putting commuters and pedestrians at high risk. A reliable environmental decision support system (EDSS) for environmentally friendly traffic flows under suggested management options is of great help, given the advantages of DSSs in environmental management (Poch et al., 2004; Reboji and Sturm, 1999).
An EDSS for urban road traffic management, urban road traffic emission assessment and management (URTEAM), is designed and developed for evaluation of the environmental effects of road traffic under different management options and to model the receptor level air pollution concentrations. The model uses the available traffic inventory database, (Hyderabad Area Transportation Survey – II), speed specific emission factor database, traffic junction information, length and width of the links, average vehicular speed in different links and vehicular growth factors.
The present paper highlights a brief summary of the tool and then critically examines the implementation of the computer application with emphasis on the generation of pollution load in Hyderabad. The major management options analysed include:
• strengthening public transport to reduce urban congestion
• intersection geometry improvement
• road widening
• grade separations
• parallel roads
• railway barriers RUB/ROBs (rail under bridge or rail over bridge) at major river and railway crossings
• promoting cleaner and alternative fuels and improved engine technologies
• bus bay relocation
• rescheduling work activities.
2 Materials and methods
Study area
The study area of Hyderabad city and its environs extend from 17010°N–17050°N and 78010°E–78050°E. The total number of vehicles plying in the city increased by 273.9%

78 Y. Anjaneyulu et al.
during 2003 compared to 1987. The number of motor vehicles registered in Hyderabad over the years is shown in Figure 1. It can be observed that during the last decade there has been a phenomenal increase in registration of two-wheelers followed by four-wheelers. The compound growth rate of all vehicles in Hyderabad stands at an average value of 10%, though the relative growth of all vehicles differs widely. The highest growth rate of 24.61% has been shown for motorcars for the whole period of 16 years even though their share in total vehicle population has increased only 0.7% (from 3.9% in 1987–1988 to 4.69% in 2002–2003) and the contribution of four-wheelers is predicted to increase phenomenally over the years.
Figure 1 Vehicular growth scenario in Hyderabad
3 Generation of geo-coded road network
A balanced geo-coded road network with assigned road and road traffic data is prepared using the remote sensing data in the digital mode obtained from NRSA (National Remote Sensing Agency, 2001), Hyderabad. The LISS III (light imaging and scanner) and PAN (panchromatic aerial network) of IRS ID (Indian remote sensing series 1D) are used for the mosaicing and delineation and demarcation of the road network for the present study. A map of 1 : 50,000 scale, obtained from Survey of India Topo sheets and covering the entire study area, is used to extract the ground control points (GCPs) and to demarcate the boundary of study area. This information is then used for image registration of merged imagery of LISS III and PAN digitally using EASI/PACE digital image processing software.
Road segments are uniquely defined by their road codes and the nearby road segments. The road network has 373 road codes and 1,907 road segments corresponding to an average of nearly five road segments per road code. In order to display street names, a database with road codes and street names was established, based on the address database as suggested by Bachmann et al. (2000). Figure 2 shows a close-up of the geo-coded road network with street names for Hyderabad city. The spreadsheet with road and traffic data included street width, travel speed and traffic load of the various categories such as passenger cars, vans, lorries and buses.

Model calculation of environmentally friendly traffic flows 79
Figure 3 shows a broad methodological framework adopted for the calculation of emission loads. Table 1 shows various input–output relations of the sub modules. A simple but tedious approach was used to assign traffic data to the road network. A road intersection in the spreadsheet is defined as the road section between two major intersections named as to and from specific roads. These road sections were given unique segment numbers. The digital road network was then manually edited to exactly match the way the spreadsheet was organised.
Figure 2 Process of the road grid-based road length calculation
Figure 3 Methodological frameworks for pollution management
80 Y. Anjaneyulu et al.
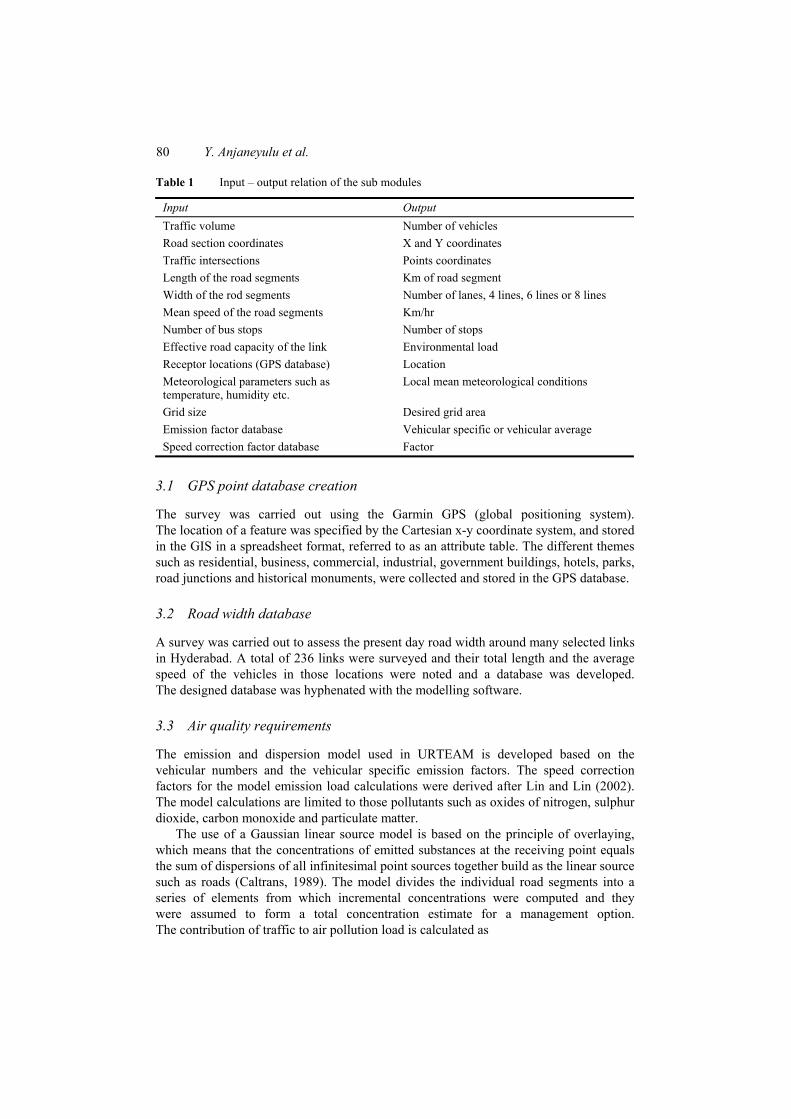
Table 1 Input – output relation of the sub modules
Input Output Traffic volume Number of vehicles Road section coordinates X and Y coordinates Traffic intersections Points coordinates Length of the road segments Km of road segment Width of the rod segments Number of lanes, 4 lines, 6 lines or 8 lines Mean speed of the road segments Km/hr Number of bus stops Number of stops Effective road capacity of the link Environmental load Receptor locations (GPS database) Location Meteorological parameters such as temperature, humidity etc.
Local mean meteorological conditions
Grid size Desired grid area Emission factor database Vehicular specific or vehicular average Speed correction factor database Factor
3.1 GPS point database creation
The survey was carried out using the Garmin GPS (global positioning system). The location of a feature was specified by the Cartesian x-y coordinate system, and stored in the GIS in a spreadsheet format, referred to as an attribute table. The different themes such as residential, business, commercial, industrial, government buildings, hotels, parks, road junctions and historical monuments, were collected and stored in the GPS database.
3.2 Road width database
A survey was carried out to assess the present day road width around many selected links in Hyderabad. A total of 236 links were surveyed and their total length and the average speed of the vehicles in those locations were noted and a database was developed. The designed database was hyphenated with the modelling software.
3.3 Air quality requirements
The emission and dispersion model used in URTEAM is developed based on the vehicular numbers and the vehicular specific emission factors. The speed correction factors for the model emission load calculations were derived after Lin and Lin (2002). The model calculations are limited to those pollutants such as oxides of nitrogen, sulphur dioxide, carbon monoxide and particulate matter.
The use of a Gaussian linear source model is based on the principle of overlaying, which means that the concentrations of emitted substances at the receiving point equals the sum of dispersions of all infinitesimal point sources together build as the linear source such as roads (Caltrans, 1989). The model divides the individual road segments into a series of elements from which incremental concentrations were computed and they were assumed to form a total concentration estimate for a management option. The contribution of traffic to air pollution load is calculated as
Model calculation of environmentally friendly traffic flows 81
3region ( ) µg/mgPL N Eb EF O F AP b= × × × × +
where PL is the pollution load, N is the number of vehicles per 24 hour, O is the dilution factor, Fregion is a meteorological correction factor with respect to regional differences in wind velocity, EF is vehicular group specific emission factor, Eb is a correction factor with respect to the type Ib of the street in relation to the presence of trees, and APbg is the background concentration of air pollutants (Immers and Oosterbaan, 1991).
3.4 Travel time/travel speed calculation
Traffic flow models are an approximated description of specific phenomenon within the traffic flow operations, normally based on a set of mathematical equations. The concept, based on hydrodynamic theory, is considered in the present work. The model assumes the traffic as a compressed medium and uses aggregate variables such as traffic density, mean speed and volume to describe the traffic flow. The travel speed for a road length L is determined by the presence of the number of road users and travel speed of the vehicular category and the length of the road segment.
addresscap ( ( / ) (1/ ))B C t Nv L Vv L= × ∆ × × ×
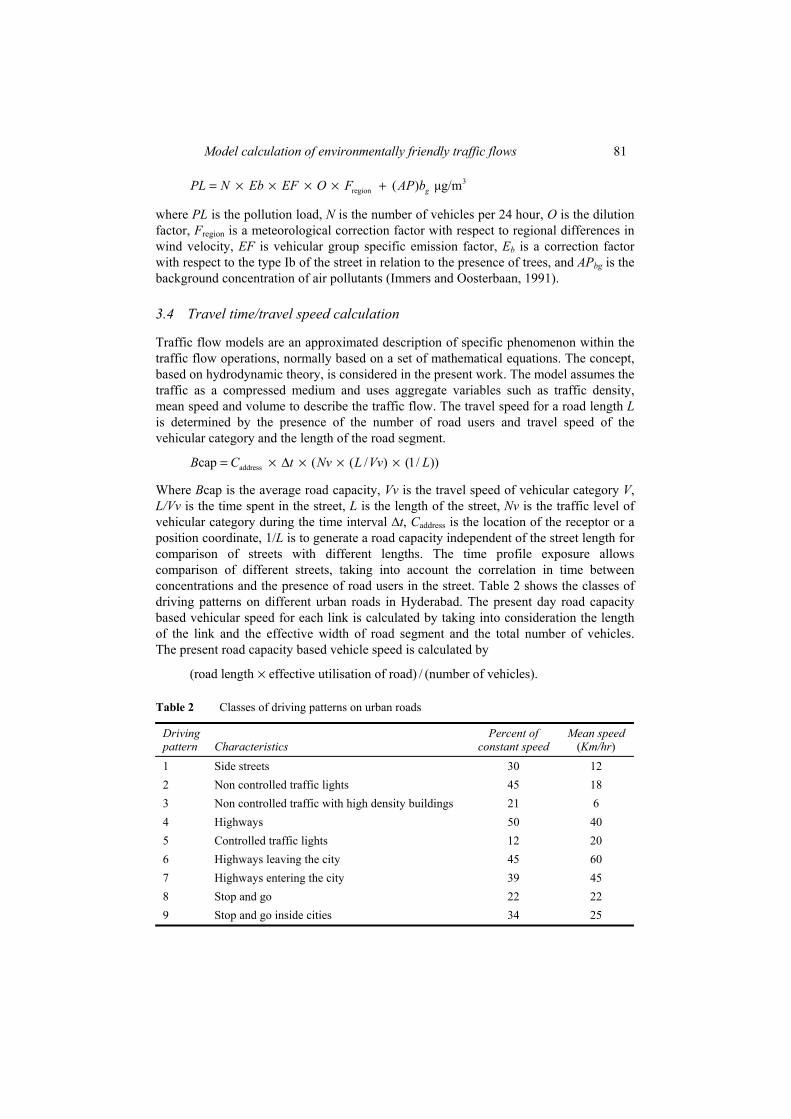
Where Bcap is the average road capacity, Vv is the travel speed of vehicular category V, L/Vv is the time spent in the street, L is the length of the street, Nv is the traffic level of vehicular category during the time interval ∆t, Caddress is the location of the receptor or a position coordinate, 1/L is to generate a road capacity independent of the street length for comparison of streets with different lengths. The time profile exposure allows comparison of different streets, taking into account the correlation in time between concentrations and the presence of road users in the street. Table 2 shows the classes of driving patterns on different urban roads in Hyderabad. The present day road capacity based vehicular speed for each link is calculated by taking into consideration the length of the link and the effective width of road segment and the total number of vehicles. The present road capacity based vehicle speed is calculated by
(road length effective utilisation of road) / (number of vehicles).×
Table 2 Classes of driving patterns on urban roads
Driving pattern Characteristics
Percent of constant speed
Mean speed (Km/hr)
1 Side streets 30 12 2 Non controlled traffic lights 45 18 3 Non controlled traffic with high density buildings 21 6 4 Highways 50 40 5 Controlled traffic lights 12 20 6 Highways leaving the city 45 60 7 Highways entering the city 39 45 8 Stop and go 22 22 9 Stop and go inside cities 34 25

82 Y. Anjaneyulu et al.
The significance of management activities is considered taking into account the proposed action and the corresponding increase in the effective road capacity and the corresponding increase in the vehicle speed and corresponding emission load.
3.5 GIS, graphical user interface and object oriented programming
GIS elements and functions are good candidates for the object and component technology. Basic objects like point collection, polygons and labels can be integrated into a more complex structure like a map, which is available in the programming environment as a component. This concept was first used in a GIS software called Prime Meridian, which also introduced the spatial SQL. The next GIS components appeared in 1995 and were already much further developed. One of them, Map Objects (ESRI, 1996), was actually a collection of objects packed as a standard Active X component. Active X is based on the COM component model and can be used in many different programming environments.
3.6 Urban road transportation emission assessment and management tool (URTEAM)
URTEAM is a Microsoft WindowsTM executable program that generates emission load and dispersion statistics and plots emission load maps for selected links and receptor locations for user-selected pollutants at varying spatial and temporal scales. An emission load depicts the gm/hr at selected locations whereas the receptor levels are denoted as µg/m3 or ppm for a given location and time. Figure 4 shows the graphical user interface of the URTEAM and the availability of different modules.
Figure 4 Map object component map in visual basic environment and availability of different modules in URTEAM

Model calculation of environmentally friendly traffic flows 83
URTEAM consists of different modules linked through a common graphical user interface. The ‘Visual Basic’ interface allows the user to insert data in a very simple manner. One merely puts the data into the ‘boxes’ of a series of input screens and selects the options. The model contains six main input screens such as:
• show emission factors
• show grid level emission load
• calculate link wise pollution load
• run dispersion model
• apply speed correction factors
• calculate emission load at traffic junctions.
The model uses default emission factors for the calculation of emission load, which can be viewed and changed to user-defined values using the change in the emission factors module.
The main screen asks the user to select the option such as the run dispersion model to show a series of subsidiary screens for calculation of the receptor levels of pollution levels using meteorological and receptor selection windows. The model contains a default emission factor for computation of emission load. The default emission factors can be overwritten if the user has vehicular specific or vehicular, model year based information or speed correction factor information on the emission load. The model applies the default or user specified emission factors data to the specified number of vehicular data to estimate the quantity of each pollutant load component flowing through the selected road segment under a suggested management system.
4 Results and discussion
Figure 5 shows the modelled particulate emissions in different road segments in Hyderabad. The present day air pollution load in Hyderabad is observed to be 1246 tons/day. Figure 6 shows the links with one-way or two-way travel in different road segments in Hyderabad. The width of the roads in many areas of Hyderabad is four laned and at very few corridors it was charged to eight laned. The average speed of the vehicles in Hyderabad is observed to be 11 km, and during peak periods the speed is observed to decrease to 6 km/h. The impact of management action on environmental load is calculated assuming that the same pollution potential can be curtailed by increasing the average traffic speed.

84 Y. Anjaneyulu et al.
Figure 5 Modelled particulate matter emission in different road links in Hyderabad
Figure 6 Road types (One way/two ways) in the network on selected road links
Model calculation of environmentally friendly traffic flows 85
4.1 Strengthening public transport system and construction of new roadways
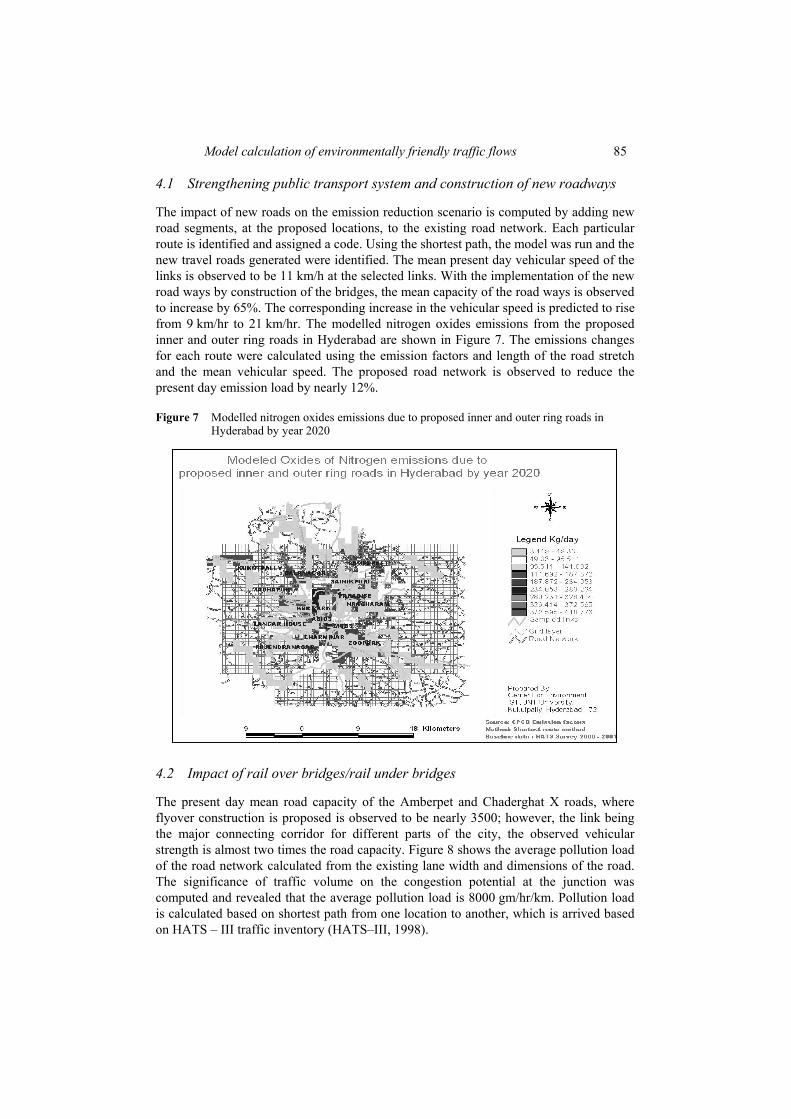
The impact of new roads on the emission reduction scenario is computed by adding new road segments, at the proposed locations, to the existing road network. Each particular route is identified and assigned a code. Using the shortest path, the model was run and the new travel roads generated were identified. The mean present day vehicular speed of the links is observed to be 11 km/h at the selected links. With the implementation of the new road ways by construction of the bridges, the mean capacity of the road ways is observed to increase by 65%. The corresponding increase in the vehicular speed is predicted to rise from 9 km/hr to 21 km/hr. The modelled nitrogen oxides emissions from the proposed inner and outer ring roads in Hyderabad are shown in Figure 7. The emissions changes for each route were calculated using the emission factors and length of the road stretch and the mean vehicular speed. The proposed road network is observed to reduce the present day emission load by nearly 12%.
Figure 7 Modelled nitrogen oxides emissions due to proposed inner and outer ring roads in Hyderabad by year 2020
4.2 Impact of rail over bridges/rail under bridges
The present day mean road capacity of the Amberpet and Chaderghat X roads, where flyover construction is proposed is observed to be nearly 3500; however, the link being the major connecting corridor for different parts of the city, the observed vehicular strength is almost two times the road capacity. Figure 8 shows the average pollution load of the road network calculated from the existing lane width and dimensions of the road. The significance of traffic volume on the congestion potential at the junction was computed and revealed that the average pollution load is 8000 gm/hr/km. Pollution load is calculated based on shortest path from one location to another, which is arrived based on HATS – III traffic inventory (HATS–III, 1998).

86 Y. Anjaneyulu et al.
Figure 8 Significance of proposed bridges over river on pollution load (NOx)
It is observed that developments around the river will reduce the pollution load by nearly 40–70% at Chader Ghat area with the thickening of traffic along the link during the peak periods of the day. The predicted traffic speeds at the junction are predicted to increase by 46% with the proposed bridges. The corresponding peak hour pollution load calculated using hydrodynamic theory shows that the present day pollution at the junction of 8000 g/h is reduced to 6000 g/h.
4.3 Bus bays and pedestrian crossings
Frequent weaving movements of buses in busy corridors have a significant effect on the speed of traffic. Further, stopping buses in the face of traffic at bus stops tends to block the traffic moving on the left lane. Since most of the roads in the city have four lanes with an un-mountable central divider, the problem traffic blockade becomes even more acute on such occasions. The encroachment of the roads by the bus bays is assessed by buffering the road network with the corresponding road width and studying the bus stops, which are located within the buffer area.
It is observed that major bus bays at locations such as Masabtank, Sadan College, Lakdika Pool towards Koti at Dwaraka Hotel, Chaderghat stop do not have proper bus bays; the proper identification for provision of convenient stoppages for buses without inconveniencing the traffic following will be a major factor in facilitating smooth transport. Figure 9 shows the location of different bus stops and their significance on the pollution load. The buffered areas are the locations, which are posing problems for the free flow of traffic during peak periods of the day.

Model calculation of environmentally friendly traffic flows 87
Figure 9 List of bus bays which need to relocated for free passage of vehicles during peak periods of the day
The average traffic speed is observed to reduce to a standstill for several minutes (nearly 15 minutes) at these links, increasing the heavy pollution load. The effective road capacity is observed to decrease by nearly 75% with the presence of the bus stops. The significance of bus stop relocation to other places is observed to increase the effective vehicular speed by 5 km from the present day mean speed of 13–19 km/h at the selected locations. Further the pollution load is observed to decrease by 75% with the bus stop relocation.
4.4 Parking management in Hyderabad
Hyderabad, like other cities is confronted with a downtown-parking problem. This problem is aggravated by excessive population densities, large number of pavement hawkers, side walk encroachments and the heterogeneous nature of traffic and commercial area development along all the major roads. Off-street parking complexes for private vehicles at 22 important nodal points in the city are required to ease traffic congestion by releasing precious carriage way. Similarly, there is a need for providing parking spaces for private bus operators. Ten such locations on all major arterial roads are identified for this purpose. The use of government and educational institutions are identified as parking lots during emergency and evening periods. The impact of parking management studied for a typical area at Maitrivanam, Ameerpet revealed that peak hour parking related pollution could be reduced to 34% (650–280 g/h), if the existing government building of BSNL office is used.

88 Y. Anjaneyulu et al.
4.5 Rescheduling of work activities
Rescheduling of work activities can accommodate the sudden increments of traffic on the roads; for example, it has been observed that at many places in Hyderabad the closure of schools and the end of cinema shows coincide, releasing more traffic on the roads and causing traffic congestions. The extent of road congestion during those periods depends on the length of the road, intersection dimensions and the average speed on the roadways i.e., road capacity. A model has been developed to study the areas where rescheduling of work is needed under HUDA limits. The mean capacity of the theatres in Hyderabad is found to be 250 persons with the total number of theatres amounting to nearly 120. Similarly the total number of educational institutions such as schools and colleges in Hyderabad are more than 520 with the total student capacity of 35000. Their combined effect on the traffic intensity is shown in Figure 10.
Figure 10 Areas where work rescheduling is needed to reduce traffic pollution – Intensity of problem
The relative rescheduling factor is identified using the combination of road length, number of educational centres and cinema theatres around 1 km2 areas. The corresponding peak hour pollution load due to the funnelling effect predicted to be 3200 g/h is reduced to 160 g/h at the link if different time periods are allocated for different work activities. Rescheduling the work activities at places such as Nampally, Abids and Narayanaguda, RTC X Roads, and Secunderabad paradise area will be highly useful to reduce the unnecessary traffic congestions.
Model calculation of environmentally friendly traffic flows 89
5 Conclusions
This paper has described the applications of a GIS-based integrated urban road transport assessment and management tool. Simulation studies presented in the present paper will help the planners and transportation engineers and environmentalists in providing the methodology for calculation of environmental pollution burden and the effects of each proposed alternative. Further simulation studies on the formulation of green corridors at selected locations in the city, generation of city specific speed corrected emission factors and model evaluation studies are being evaluated at our centres.
ReferencesBachmann, W., Sarasua, W., Hallmark, S. and Guensler, R. (2000) ‘Modeling regional mobile
source emissions in a geographic information system framework’, Transportation Research Part C: Emerging Technologies, Vol. 8, Nos. 1–6, pp.205–229.
Caltrans (1989) CALINE4 – A Dispersion Model for Predicting Air Pollutant concentrations Near Roadways, Final Report prepared by the Caltrans Division of New Technology and Research (Report No. FHWA/CA/TL-84/15).
Environmental systems Research Institute (ESRI) (1996) www.esri.com. HATS–III (1998), Hyderabad Area Transportation Study, Hyderabad Urban Development
Authority, Hyderabad. Immers, B.H. and Oosterbaan, N.G.J. (1991) ‘Model calculation of environment-friendly traffic
flows in urban networks: transportation research record 1312’, Energy and Environmental Issues, Washington DC, pp.33–41.
Lin, M-D. and Lin, Y-C. (2002) ‘The application of GIS to air quality analysis in Taichung City, Taiwan, ROC’, Environmental Modeling and Software, Vol. 17, pp.11–19.
National Remote Sensing Agency (2001) Manual of Landuse/Land Cover Mapping Using Satellite Imagery, National Remote Sensing Agency, Balanagar, Hyderabad – 500037, AP, India.
Poch, M., Comas, J., Rodriguez-Roda, I., Sanchez-Marre, M. and Cortes, U. (2004) ‘Designing and building real environmental decision support systems’, Environmental Modeling and Software, Vol. 19, pp.857–873.
Reboji, D. and Sturm, P.J. (1999) ‘A GIS based component – oriented integrated system for estimation, visualization and analysis of road traffic air pollution’, Environmental Modeling and Software, Vol. 14, pp.531–539.
UNEP/WHO (1992) Urban Pollution in Megacities of the World, Blackwell, Oxford, UK.
Copyright © 2022 FDOKUMEN