Using Flexible Taste Distributions to Value Collective Reputation for Environmentally Friendly...
25
1 UNIVERSITY OF WAIKATO Hamilton New Zealand Using flexible taste distributions to value collective reputation for environmentally-friendly production methods Riccardo Scarpa Mara Thiene Francesco Marangon Department of Economics Working Paper in Economics 24/07 November 2007 Riccardo Scarpa Economics Department University of Waikato Private Bag 3105 Hamilton, New Zealand Tel: +64 (0) 7-838-4045 Fax: +64 (0) 7-838-4331 Email: [email protected] Web: http://www.mngt.waikato.ac.nz Mara Thiene Department of Land and Agriculture-Forestry Systems University of Padua Legnaro, Padova Tel: +39049-827-2760 Fax: +39049-827-2703 Email: [email protected] Web: http://www.agraria.unipd.it Francesco Marangon Department of Economics University of Udine Via Tomadini, 30A 33100 Udine Tel: +390432-249338 Fax: +390432-249229 Email: [email protected] Web: http://web.uniud.it/dse/
Transcript of Using Flexible Taste Distributions to Value Collective Reputation for Environmentally Friendly...
1
UNIVERSITY OF WAIKATO
Hamilton
New Zealand
Using flexible taste distributions to value
collective reputation for
environmentally-friendly production methods
Riccardo Scarpa
Mara Thiene
Francesco Marangon
Department of Economics
Working Paper in Economics 24/07
November 2007
Riccardo Scarpa Economics Department University of Waikato
Private Bag 3105 Hamilton, New Zealand
Tel: +64 (0) 7-838-4045 Fax: +64 (0) 7-838-4331
Email: [email protected]
Web: http://www.mngt.waikato.ac.nz
Mara Thiene Department of Land and
Agriculture-Forestry Systems University of Padua
Legnaro, Padova
Tel: +39049-827-2760 Fax: +39049-827-2703
Email: [email protected]
Web: http://www.agraria.unipd.it
Francesco Marangon Department of Economics
University of Udine Via Tomadini, 30A
33100 Udine
Tel: +390432-249338 Fax: +390432-249229
Email: [email protected]
Web: http://web.uniud.it/dse/

2
Abstract
In this paper we investigate consumer preferences for various environmentally-
friendly production systems for carrots. We use discrete-choice multi-attribute stated-
preference data to explore the effect of the collective reputation of growers from an
Alpine valley with an established reputation for its environmentally-friendly
production: Val di Gresta “the valley of organic orchards”. Data analysis of the panel
of discrete responses identifies unobserved taste heterogeneity for organic,
biodynamic and place of origin along with extra variance associated with
experimentally designed alternatives. The assumed parametric taste distributions are
each tested using the semi-nonparametric specification proposed by Fosgerau and
Bierlaire (2007), while the null of normality cannot be rejected for organic and
biodynamic production methods, it is rejected for the place of origin. The latter is
found to be bi-modal, with modes at each side of zero. The use of a flexible taste
distribution increases the plausibility of this form of heterogeneity and it appears
promising for future applied studies.
Keywords
Mixed logit Flexible taste distributions Random utility parameters
Collective reputation Sustainable agriculture
Choice modeling Environmentally-friendly methods
JEL Classification
C15; C25; Q26
Acknowledgements
The authors would like to express their thanks to Pietro Bertanza for able research assistance, and Mogens Fosgerau and Michel Bierlaire for guidance and helpful discussion. The usual disclaimer applies.
1 Introduction
Qualitative choice models of food choice have recently attracted much attention and have con-tributed to casting light on consumer preferences. A reviewof the international literature showsfood related applications investigating a variety of issues. These range from stated choice dataanalysis of GM food in Europe (Rigby & Burton 2005) to revealed preference data analysisof ethical food marketing systems in Canada (Arnot et al. 2006). Few studies, however, havefocussed on the interactions between place of origin, production methods and collective repu-tation. This is despite evidence that each of these food attributes are of interest to consumers.
Yet, in some disadvantaged regions, the collective reputation of farmers from one locationis often built on production methods and is what makes local agriculture economically viable.This is the case in our study area, which is a small valley in the Italian Alps called ‘Val diGresta’ (VdG) renown for the organic production of carrots and other vegetables.
Consumers increasingly associate the quality of a given method of production with certifi-cation mechanisms (e.g. traceability programmes) based onthe product’s place of origin (Qua-graine et al. 1998, Thomas et al. 2001, Hobbs et al. 2005). Over the last 30 years producers inthis valley have invested and gained a solid reputation amongst local consumers for high qualityenvironmentally-friendly products, especially organic.They now enjoy a well-established repu-tation as organic producers, which is supported by a trademark and trading symbol (a ladybird).However, other environmentally-friendly production methods (EFPMs), such as biodynamicand integrated pest management, could be usefully implemented by these farmers. Our mainobjective is to explore whether these lesser known EFPMs forvegetables would enjoy the samereputation as the organic method. This requires an understanding of consumer recognition inthe market place for new credence attributes. Properly functioning markets have existed for awhile for organic products, but this is not so for vegetablesproduced by integrated pest manage-ment (IPM) and biodynamic (BD) (Steiner 1993) methods. These lesser known methods couldbe viably used to provide vegetables with intermediate degrees of environmental-friendliness,at an intermediate price between food produced with conventional methods and organic food.What is the adequate premium price will depend on the consumer’s willingness to pay for them.This is vital information for farmers who intend to diversify their supply on the basis of EF-PMs. In addition to this, we explore the link between such methods and the place of origin ofthe product. In particular, whether consumers are willing to pay for the reputation of the area ofproduction on top of what they are willing to pay for EFPMs.1
There is a mounting body of evidence that European consumershave clear preferences overplaces of origin for foods. Examples can be found in the meat markets which were examined,amongst others, byRoosen et al.(2003), Loureiro & McCluskey(2000). Such preferences arenot independent of EFPMs, as shown for oranges, grapes and olive oil by Scarpa, Philippidis &
1For studies of IPM on the production and consumption side seeCuyno et al.(2001), Govindasamy & Italia(1998) respectively.
1

Spalatro(2005), and again for olive oil byVan der Lans et al.(2001) andScarpa & Del Giudice(2004).2
Furthermore, there is theoretical evidence that supports eating quality standards as a meansof preventing the dilution of quality amongst groups of farmers enjoying a collective reputation(see the work byWinfree & McCluskey 2005, on Washington apples). In the latter stages of thephase during which collective reputation is being built it is important to identify and measurethe magnitude of the premium that consumers are willing to pay for such a reputation. AsWinfree & McCluskey(2005) argue, the number of farms sharing such a reputation increasesthe incentive to depart from the cooperative behavior. In our empirical study in VdG the numberof farmers is relatively low so, now that a reputation for quality has been attained, it might besustained over a long time period.
Because of a lack of existing data from market transactions the data used in our empiricalstudy consist of responses to hypothetical questions aboutpurchasing decisions. The productof reference we chose to study is carrots, which is a common vegetable in the Italian diet, andthe place of production is an Alpine valley with the rare characteristic of being totally dedicatedto EFPMs: Val di Gresta.3 All the produce from this valley is strictly produced by means ofEFPMs, and certified as such.
Our objective is to try and provide answers to two basic research questions. As describedabove, the first is whether data from stated choice studies can be used to estimate the ‘collectivereputation for EFPM’ premium. A secondary objective is a methodological one, and it is ofpotentially wider interest to stated choice practitioners. Since the advent of mixed logit models,food choice analysts have paid increasing attention to the detection, modeling and interpretationof taste variation across people. However, taste variationis often implemented with relativelyrigid parametric distributions, typically based on the normal family (normal, log-normal, trun-cated and SB transformations). So far, computational convenience has been the main reasonfor such a choice. Yet, it is somewhat worrying that very few studies report sensitivity analyseson the choice of taste distributions. Especially considering that distributional assumptions areknown to imply very different population inferences on WTP distributions in discrete choicemodeling. In this study we apply a recently proposed semi-parametric approach (Fosgerau &Bierlaire 2007) to the generalization of any parametric base distribution. The proposed gen-eralization gives rise to an easily testable hypothesis within the familiar maximum (simulated)likelihood. It is also conceptually appealing as it allows for multi-modal distributions, whichhave been found to be behaviorally consistent in other choice contexts (seeScarpa & Thiene2005, Scarpa, Willis & Acutt 2005, for some examples based on conditional WTP distribu-
2We refer the reader to these studies for references about thetheoretical basis of production of origin labeling,such as protected designation of origin (PDO), protected geographical indications (PGI), and certificate of specificcharacter (CSC), as defined by EU legislation (EC Regulations 208192 and 208292), which provides protection offood names on a geographical or traditional basis.
3The interested reader is referred to www.val-di-gresta.it/ to learn more about this group of producers.
2
tions). We use the Fosgerau-Bierlaire test to assess the suitability of our assumed parametricdistributions in the data.
The remainder of the paper is organized as follows. The following section (2) provides theItalian background to this local applied study, while the local issues are presented in section3along with a description of the EFPMs, the survey design and the data. Section4 describes themethods of data analysis and the hypotheses tested in model estimation. Estimation and resultsare illustrated in section5, while section6 concludes.
2 Low environmental impact agriculture in Italy
In the past ten years environmentally-friendly productionmethods have experienced rapid de-velopment in the EU. Politicians who are engaged in designing policies to jointly deliverfarm income security and enhanced environmental standardsare interested in the potential fordouble-dividends, i.e. the scope to jointly improve environmental conditions and produce foodsthat can command a premium in the market place, so as to make the production of such productsself-sustaining.
Amongst EFPMs organic farming is the method that has been most successful in Italy, whileBD and IPM are still quite uncommon. The recent growth in organic farming in Italy is due toseveral factors. From the supply side the dominant one is widely agreed to be the substantialflow of subsidies used to create incentives for organic food production. From the domesticdemand side there is increasing consumer recognition andWTP for organic products, in theaftermath of various food scares which have afflicted Europe(Santucci & Pignataro 2002).
In 2001, Italian organic agriculture covered 1,240,000 hectares and more than 60,000 farmswere involved making it the third country in the world and thefirst in Europe in terms of valueof organic produce. More recently the growth trend seems to be reversed, as in 2002 bothnumber of farms and area cultivated decreased by 7.6% and 5.6%, respectively. This reversal ispartly due to loss of subsidies and other incentives broughtabout by the new agri-environmentalmeasures of the EU Common Agricultural Policy.
Most of the Italian land used for organic production is used for permanent pastures or fod-der crops (54%) and is concentrated in a few districts (regions), located in the major islands(Sardinia and Sicily) and the South of Italy, which account for almost 58% of the total organicagricultural area and host the majority of organic farms (61%). Since 2002 these regions havewitnessed the strongest decrease. In the Center-North, instead, land use for organic productionhas increased, but only slightly. Perhaps this is due to the higher value-added of organic prod-ucts since, especially in the North, many organic farms showa sophisticated degree of verticalintegration (i.e. many transform and market their produce collectively and/or directly). Also,produce from farms in the North travels a shorter distance tomarket since most of the demandfor organic is also located in this area of the country (Marino 2004). Now that the concept of
3

‘food miles’ has been embraced by many environmentally inclined consumers, as an indicatorof the carbon cost of food, more people favor local produce.
2.1 Consumer perception of quality and purchase behavior
It is estimated that only 5% of Italian consumers regularly purchase organic food, but at leastone consumer out of three does so occasionally (Torjusen et al. 2004). In 2003 the expenditurefor organic food in Italy was estimated to be 1.3 billion $US,or about 1.5% of householdexpenditure on food (ISMEA 2004).
But what is the perception of quality in organic food in Italy? In the last decade organicproducts have received greater attention from Italian consumers. There is a growing demandfor food produced with environmentally-friendly techniques, which can be linked to a numberof factors:
• an increased consumer awareness about human health and environmental issues,
• the development of rural communities as a consequence of a return to the countryside bya section of previously urban population (especially retired people)
• and the concern for food safety.
Added to these, an increasing concern for the greater mileage associated with food imports,especially for out-of-season fruit, and its repercussionson green-house emissions, drives a pref-erence for locally grown food.
Since the end of the ’90s, several studies have investigatedhousehold preferences for envi-ronmentally friendly production, focusing on those qualitative and quantitative attributes drivingorganic products sales in Italy (Canavari et al. 2002). Despite much empirical work, the struc-ture of household preferences is still poorly understood. In the beginning Italian consumers oforganic products were mostly motivated by ecological awareness. They were simply looking forfood derived from lower-impact agriculture. More recently, in addition to these environmentalconcerns, consumers also focus on food safety and security.According to a nation-wide survey(ISMEA 2002), the main reason for purchase seems to be linked to the absence of chemicalsharmful to health; secondly organic products are perceivedto be better monitored by regulatingauthorities; thirdly there is the ‘in-any-case-they-won’t-do-any-harm’ attitude. Environment-related motivations were quoted only fourth, this ranking being shared with other Europeanconsumers (Zanoli et al. 2001). At present it would appear that health motivations are thelead-ing ones for both regular and occasional organic consumers.The latter seem more concernedwith personal satisfaction derived from organic food consumption, while regular consumersseem to show more altruistic values, associated to children’s welfare and the rural environment(Zanoli & Naspetti 2002).
4
Official statistics on consumer expenditure on environmentally-friendly products show thatthis is distributed over almost all categories of products.Amongst them, dairy products accountfor 25%, fruits and vegetables and bread and biscuits both 14%, beverages 10% and eggs 6%.Not surprisingly, organic meat is still almost absent, because this sub-sector still needs to beproperly organized. Although all sectors showed very strong growth in past years (+80% in2001-2000), 2002 signalled a trend reversal, as mentioned above, with a substantial standstill(ISMEA 2004).
According to a recent study (ISMEA 2002), organic consumers in Italy can be divided intofive groups. For identification purposes these have been labeled as: ‘historical’, ‘supermarket’,‘occasional’, ‘taster’ and ‘I wish, but I can’t’ consumers.The first group accounts for 30%of Italian organic consumers, but generates 60% of total expenditure. The ‘supermarket’ con-sumers are as numerous as the previous group but account for alower share of expenditures(30%) and mostly live in Northern Italy. They represent a very interesting segment in termsof marketing strategy since their supermarket purchases are usually impulse-driven. ‘I wish Icould’ is an emerging segment, with a limited economic weight (6%) but much promise. Theyare mostly young people living in the Center and South of Italy. Finally, the ‘taster’ segmentis a very small one (1%) with medium-high income, very low information about organic, whobuy organic food only very occasionally.
On the demand side price remains a crucial factor as the retail price difference betweenconventional and organic is still quite high (Zanoli & Naspetti 2002). Heterogenous reliabilityof supply is still an obstacle to consumption growth throughthe large distribution channels.Finally, according toZanoli & Marino (2002) satisfying the need for ancillary information—about place of origin, methods of production and modes of monitoring—are other importantissues for developing demand.
3 Collective reputation of Val di Gresta’s growers
It is with this backdrop that we engaged in the study of VdG produce. This valley is located inthe mountains of the Trentino region, in the North East of Italy. It is located between 400 to1,300 meters above sea level. The hill slopes are terraced and tend to have a South-Westerlyaspect, thereby receiving a long daily exposure to solar radiation. Because of this and its prox-imity to Garda Lake—Italy’s largest lake—the valley enjoysa warm micro-climate, particularlysuitable for growing vegetables that can be placed in the market early on in the season, therebycapturing a premium over the produce marketed in full season.
Vegetables—mainly cabbages and potatoes—have been grown in the valley since the be-ginning of the last century. Cultivation of carrots was introduced during the ’40s, while at thebeginning of the ’70s several other kinds of vegetables wereintroduced. More than 20 types ofvegetable are currently grown in the valley. The particularvocation of the area to vegetable cul-
5

tivation is due to the good differentiation of soils along the valley. Agricultural products fromVdG have a reputation that goes beyond the local markets in the Trentino Region, as 80% ofthe products are marketed outside of this Region. The area ofthe valley destined to vegetablesexceeds 100 hectares, which is quite surprising when considering that it is organized in terracedplots with each terrace occupying 1,000 square meters, or less.
The VdG Fruit and Vegetable Producers’ Association is a farmers’ cooperative founded in1969, on the basis of an pre-existent association founded inthe ’40s. This farmers’ cooperativeis the largest in the area and it supplies an average of 2-2.2 thousand metric tons of fruitsand vegetables per year.Other produce includes cucumbers,onions, beans, salads, apples, andkiwis. Produce grown using organic methods accounts for 70%of all environmentally-friendlyproduce, the remaining fraction being grown using IPM and BDmethods.
Carrots represent one of the most important products of the VdG and are mostly producedby organic farming, and in a much smaller quantity by IPM. This vegetable is available fromJuly till March and production in 2003 was 25 metric tons for organic carrots, and 5.5 for IPM.With such small scale production it is difficult to measure consumer recognition of the collectivereputation for the VdG origin starting from market transactions. Furthermore, although the BDmethods are just as applicable to farming carrots as to otherproduce in the valley, they are notused for this crop.
3.1 Description of production methods
Apart from the main question of how consumers reward producers for their collective reputa-tion, our objective is to explore whether less common forms of environmentally-friendly pro-duction methods (BD and IPM methods) are distinctly recognized by consumers and may hencecommand a price differential. Because they are both lesser known environmentally friendlymethods we relate them both to organic production. It is reasonable to expect that the reputa-tion currently enjoyed by farmers in organic production amongst consumers may extend to thetwo lesser known environmentally friendly methods in the case they were adopted as subsidiarymethods.
3.1.1 Biodynamic production
Biodynamics (BD) was defined in 1924 by Dr. Rudolf Steiner a Yugoslavian brought up in theAustro-Hungarian empire who pioneered a philosophical approach to science called anthropos-ophy. According to the Biodynamic Farming and Gardening Association:
’Biodynamics is a science of life-forces, a recognition of the basic principles atwork in nature, and an approach to agriculture which takes these principles intoaccount to bring about balance and healing,..., an on-goingpath of knowledge ratherthan an assemblage of methods and techniques’.
6

Dr. Steiner emphasized the importance of the many forces within living nature, identifyingmany of the factors and describing specific practices and preparations that enable the farmer orgardener to work in concert with these forces. Central to thebiodynamic method are certainherbal preparations that guide the decomposition processes in manures and compost.4
3.1.2 Integrated pest management production
The Council Directive 91/414/EEC of 15 July 1991 (and following amendments) concerningthe placing of plant protection products on the market (article 2), defines ‘integrated control’(IPM) as:
‘the rational application of a combination of biological, biotechnological, chemical,cultural or plant-breeding measures whereby the use of plant protection products islimited to the strict minimum necessary to maintain the pestpopulation at levelsbelow those causing economically unacceptable damage or loss’.
IPM emphasizes the growth of a healthy crop with the least possible disruption to agro-ecosystems and encourages natural pest control mechanisms. It focuses on a careful considera-tion of all available pest control techniques and subsequent integration of appropriate measuresthat discourage the development of pest populations and keep plant protection products andother interventions to levels that are economically justified in order to reduce or minimize risksto human health and the environment.
The three EFPMs can be placed in a gradient of ‘environmental-friendliness’ which goesfrom organic, as the most friendly, to BD, which is the least well known, to IPM, the leastfriendly. This gradient might be expected to be reflected in the meanWTPfor each method, sothat conditional on consumer knowledge of the production method, meanWTP for organic isexpected to be higher than that for BD, and this in turn is expected to be higher than IPM.
Because environmentally-friendly carrots are also produced outside VdG, to identify thespecific combined effect of being from Val Di Gresta and produced with each of these methodswe used interaction effects between each EFPMandVdG origin. Such effects, if present, willconstitute our measure of the acquired reputation for thesemethods by the farmers of the valley.In particular, while there is a well established certification process for organic and IPM producefor VdG products, the certification process for BD produce isonly very recent (2003) and doesnot have a clearly established reputation. The short history for this attribute makes it difficultto use revealed preference data to determine such an effect,hence our reliance on data from astated preference survey.
4More information can be obtained at: Biodynamic Farming andGardening Association(www.biodynamics.com); and Biodynamic Agriculture/Biodynamic Farming, Sustainable Agriculture: Def-initions and Terms, USDA (http://www.nal.usda.gov/afsic/AFSIC pubs/srb9902.htm)
7

3.2 Survey and data
The survey instrument was calibrated via focus groups and a pilot study in early summer 2004,while the final survey data were collected through face-to-face interviews during summer andautumn 2004. Respondents were randomly selected from buyers of carrots at supermarkets andgrocery shops in the region of Trentino Alto Adige (North-East of Italy). Eventually a total of240 completed surveys were collected.
In the creation of the choice-tasks used in the survey attributes and attribute levels werearranged according to an experimental design that guaranteed the identification of the effectsof interest in an efficient way. The complete experimental design was a fractional factorial thatidentified main effects and 2-way interactions. It was derived using theD-optimality criterionusing Design Expert v. 6. It consisted of 41 choice tasks. Each choice task comprised theno-buy option and two experimentally designed alternatives. Choice tasks were divided in fiveseparate blocks withD-optimal properties.5 Respondents performed either 8 (blocks 1-4) or 9(block 5) choice tasks. There were five product attributes including certification of productionmethod (conventional, BD, IPM and organic), certification of origin (VdG, elsewhere), skinimperfections (absent, ‘some’ e.g. less than 10% of the skin, ‘ a lot’ e.g. more than 10% of theskin), packaging (pre-packaged or loose) and finally, retail price per kg (e1.3,e1.5 ande2.2).An example of choice task is reported in table1. The experimental design included carrotprofiles in which each production method was not associated with VdG, so as to isolate theeffect of place of origin. This included conventionally produced carrots from VdG as this is arealistic option since farmers are voluntarily adhering tothe cooperative of producers, but mightchoose to switch to conventional production if they so wished. Information on the definitionof the various EFPMs was not provided to respondents, the observed choices were thereforecontingent on previous knowledge.
In the second section of the questionnaire, we collected socio-economic data and asked someinformation about the respondent’s attitude towards organic product consumption. Looking atthe sample characteristics, the average age of the respondents is 50 years old. 66% of thoseinterviewed are women and 34% are man. 19.5% of the sample hasa university degree, whichis definitely a large fraction for Italian standards. The average family size is 2.8 members and40% of the respondents have children aged under 12. 88% of respondents were usually incharge of grocery shopping.
5Interactions between attribute levels can be identified with adequate designs and allow the estimation of utilityfunctions with 2-way interactions—i.e. those between eachpair of attributes.D-optimality refers to the maxi-mization of the information content as measured by the information matrix.
8

4 Method
4.1 The basic RUM model with random taste and error components
Consider the utility definition for a typical choice-task amongst three alternatives, one of whichis the no purchase alternative:
U(int) =
V (xint, βn, β, εn) + ǫint, if i = 1;
V (xint, βn, β, εn) + ǫint, if i = 2;
V (ASC) + ǫint, if i = no-buy;
(1)
wheren denotes the individual,i the alternative andt the choice-occasion.Vint is indirect utility,which is a function of a vector of variables explaining choice xjnt, and suitably chosen vectorsof individual-specificβn and fixedβ parameter to estimate, whileεn is an error component(Brownstone & Train 1999, Train 2003) associated with each of the experimentally designedalternatives involving purchase in each choice set (i.e.εn = 0 for the no-purchase option).This is an additional error component to the conventional Gumbel-distributed errorǫnit of themultinomial logit model. The additional flexibility that error-components can induce in thecovariance structure of choice models is illustrated in detail by Herriges & Phaneuf(2002).In this case it is meant to capture additional variance associated with the cognitive effort ofevaluating a hypothetical purchase as suggested inScarpa, Ferrini & Willis(2005) andFerrini& Scarpa(2007).
The basic specification for the choice probability is conditional logit. That is, conditional onthe individual-specific random tastesβn and error-componentsεn, the probability of selectionby respondentn of a specific alternativei in choicet of the sequence〈t = 1, . . . , T 〉 from thechoice-set containing the generic alternativej is logit:
Pr(int|βn, β, εn) =eV (xint,βn,β)+εn
∑j=3j=1 eV (xjnt,βn,β)+εn
. (2)
Assuming independence across theT choices by the same individualn, the joint probability ofa sequence of choices〈it=1, it=2, . . . , it=T (n)〉 by one individual is:
Pr(〈it=1, it=2, . . . , it=T 〉n|βn, β, εn) = Pr(n|βn, β, εn) =
t=T (n)∏
t=1
eV (xint,βn,β)+εn
∑j=3j=1 eV (xjnt,βn,β)+εn
. (3)
Notice that although independent the choice-probabilities all share the same draw for the ran-dom taste parameterβn or/and error componentεn, thereby accounting for stability of prefer-ences across a sequence of choices by the same individualn, and inducing correlation amongst
9
probabilities of choice by the same individual. The sample likelihood will simply be the productof each respondents’ choice probabilities:
L =
N∏
n=1
Pr(n|βn, β, εn). (4)
Randomness of taste-intensities is represented by the choice of one appropriate distributiongk(·) for each elementk of βn whose dimension isK. Eachgk(·) is completely defined bythe combination of location (µk) and scale (σk) parameters.6 The additional alternative-specificerror-componentεn is assumed to be (normally distributed) white noise and therefore is centeredon zero, but with a varianceσ2. So, one can writeεn ∼ N (0, σ2) or justεn ∼ φ(σ2).
The probability of choice unconditional on the error-component is obtained by integratingequation6 over the error-component space:
Pr(n, εn|βn) =
∫∞
−∞
Pr(n|εn, βn)φ(σ2)dεn, (5)
while, the marginal probability of choice is derived by further integrating expression2 over theappropriate distribution functions for theK random parameters:
Pr(n, βn, εn) =
∫∞
−∞k=1
. . .
∫∞
−∞k=K
Pr(n, εn|βn)g1(θ1|·) . . . gK(θK |·)dθ1 . . . dθK , (6)
where we ignoreβ as this is fixed and need not integration over any density. Finally, the samplelog-likelihood lnL is given by the sum across respondents of the log of the probability ofsequences:
lnL =N∑
n=1
ln Pr(n) =N∑
n=1
ln[Pr(n, βn, εn)
]. (7)
Because equations6 and 5 have no closed-form in estimation they are simulated (Train2003) by averaging the probabilities computed at a sufficiently high number of draws with goodequidispersion properties, so as to practically reduce estimation time, without compromisingaccuracy.7
6We intentionally borrow the notation of the normal distribution, althoughgk(·) need not be normal.7(Hess et al. 2006) reports that Latin Hypercube sampling has more desirable properties than Halton draws,
and we employed 350 Latin Hypercube draws in our estimation.
10
4.2 Testing the suitability of the assumed distribution of tastes
The decision of what product attributes to associate with random coefficients and hence givingrise to a randomWTP is based on the model performance on the available data. We tested aseries of models allowing each taste parameter to be variable according to a chosen distribution.For practicality we kept the marginal utility of income non-random. This is commonly assumedin the literature.
A potentially crucial assumptions is that of the choice of mixing distribution for taste acrossrespondents. Yet, testing this assumption has been seen as so problematic that most papersthat have dealt with distribution choices have focussed on developing expedients to obtain be-haviorally more plausible results than with the fitting of more flexible, and hence better fittingdistributions.8 In this paper we adopt a recently introduced method byFosgerau & Bierlaire(2007). The test is based on a mixing (cumulative) distributionG(βn), which represents a semi-parametric generalization of the base parametric distribution F (βn) obtained by means of amonotone function mapping from [0,1] into [0,1] and based onorthogonal Legendre polynomi-als. Using this approach the generalized density can be written as:
g(βn) = q(F (βn))f(βn), (8)
whereq(x) ≈ K−1q2N(x), qN = 1 +
∑N
k=1 δkLk(x), andK =∑N
k=1 δ2k, so as to allow the
cdf integral to equal 1.Fosgerau & Bierlaire(2007) show that even with few (i.e. 2-3) polyno-mial terms this specification allows for great flexibility and becauseG(βn) equalsF (βn) whenall δk = 0∀k, the testing of the null is simple in the context of (simulated) maximum likeli-hood estimation as it only requires a likelihood ratio test.Furthermore, the polynomials have arecursive formula that facilitates their implementation:
Ln(x) =
√4n2 − 1
n(2x − 1)Ln−1(x) − (n − 1)
√2n + 1
n√
2n − 3Ln−2(x), (9)
wheren denotes the order of the polynomial. In our case we assume thebase distribution tobe normal, so that we can write it asF (βn|µ, σ), and hence the generalised one is denoted byG(βn|µ, σ, δk).
4.3 Error component for the purchase alternatives
The presence of a no-buy option is known to modify the substitution patterns within the alter-natives of even relatively simple choice situations, thereby undermining the logit assumption of
8Amongst the various alternative approaches put forward to mitigate such negative effects we mention the workby Train & Sonnier(2005) based on bounded transformations of normal variates, already employed in food choicestudy byRigby & Burton(2006), and the work byHensher & Greene(2003) on bounded triangular distributions.
11
independence of irrelevant alternatives. The simple inclusion of an alternative-specific constant(ASC) for the no-price option cannot account for such a violation. Previous attempts to addressthis issue used the nested logit model (Haaijer et al. 2001), which is not a panel estimator. Somemore recent Monte Carlo results (Scarpa, Ferrini & Willis 2005) suggest that error-componentmodels show robustness to mis-specification. An additionaladvantage of these is that they alsoaccount for the panel nature of the choice experiment data. This latter feature makes thempreferable to the widely used nested logit models, which also share the advantage of account-ing for a different covariance structure across utilities of experimentally designed alternativesand those of the no-buy option. We build on this result and note that results on our data can-not refute the presence of extra variance from a zero-mean normal error component associatedwith the two alternatives involving purchase in each choice-set. This is the case for both thepreference-space andWTP-space specifications.
4.4 WTP estimation
We focus on marginalWTP for attributes. With the conventional approach of linear-in-the-parameter indirect utility in the preference space we have:
V (xjnt, βn, β, εn) =
K∑
k=1
βknxk
jnt +
M∑
m=1
βmxmjt + αcost + εn, (10)
wherek denotes random taste intensities andm denotes fixed ones. With a fixed cost coeffi-cientα conditional on the individual-specific random parametersβn, the marginalWTP for achoice attributexk can be shown to be equal toE[WTP |βn] = −βn/α, whereβ indicates thegeneric taste-intensity parameter andα the non-random cost-coefficient.9 Whenβ is assumedto be random (β ∈ βn) according to the semi-parametric mixing distributiong(βn|µ, σ, δk) theestimator must be changed accordingly:
E[WTP ] =
∫−∞
+∞
−βn
αdβng(βn|µ, σ, δk) = α−1
∫−∞
+∞
−βndβng(βn|µ, σ, δk). (11)
Similarly, one can derive by numerical approximation the integral for the variance and theinverse cumulative distribution function for the quantiles.
In the remainder of this section we explain how we tackle eachof the important modellingdecisions involved in the specification testing of complex mixed logit models with continuousmixtures. The decisions we focus on are the selection of variables with heterogeneity, the choiceof mixing distributions, and the error component variables.
9We note that with interaction terms the numerator will include more than one term.
12
4.5 Hypotheses
The hypotheses to be tested concern the following:
1. relevance of environmentally-friendly production methods (EFPMs) in consumer choice,and—importantly for our measure of collective reputation—their interactions with placeof origin (VdG);
2. the presence of unobserved heterogeneity or randomness in parameters of taste intensity,which can be identified by a significant dispersion parameterestimateσβ ;
3. the presence of extra variance in experimentally designed alternatives involving purchase,which can be identified by a significant dispersion parameterestimate for the error com-ponentσε. This makes the variance of utilities associated with purchase substantiallyhigher than the variance of no-purchase utility. For example, with normally distributedtastes and error components we have:
V ar [Uint] =∑
k
V ar(βn) + V ar(εn) + V ar(ǫit) =∑
k
(σk)2 + σ2ε + π2/6; (12)
4. the improvement of the generalized mixing distribution over the hypothesized normalfor taste intensities, which can be identified by the significance of the inclusion of first,second an third order Legendre polynomials.10
Throughout we use the maximum simulated likelihood estimator as implemented in BIO-GEME v1.5 (Bierlaire 2003) using the CFSQP algorithm for non-linear models developedbyLawrence et al.(1997).
5 Model evaluation and testing of hypotheses
5.1 Deriving a base model specification
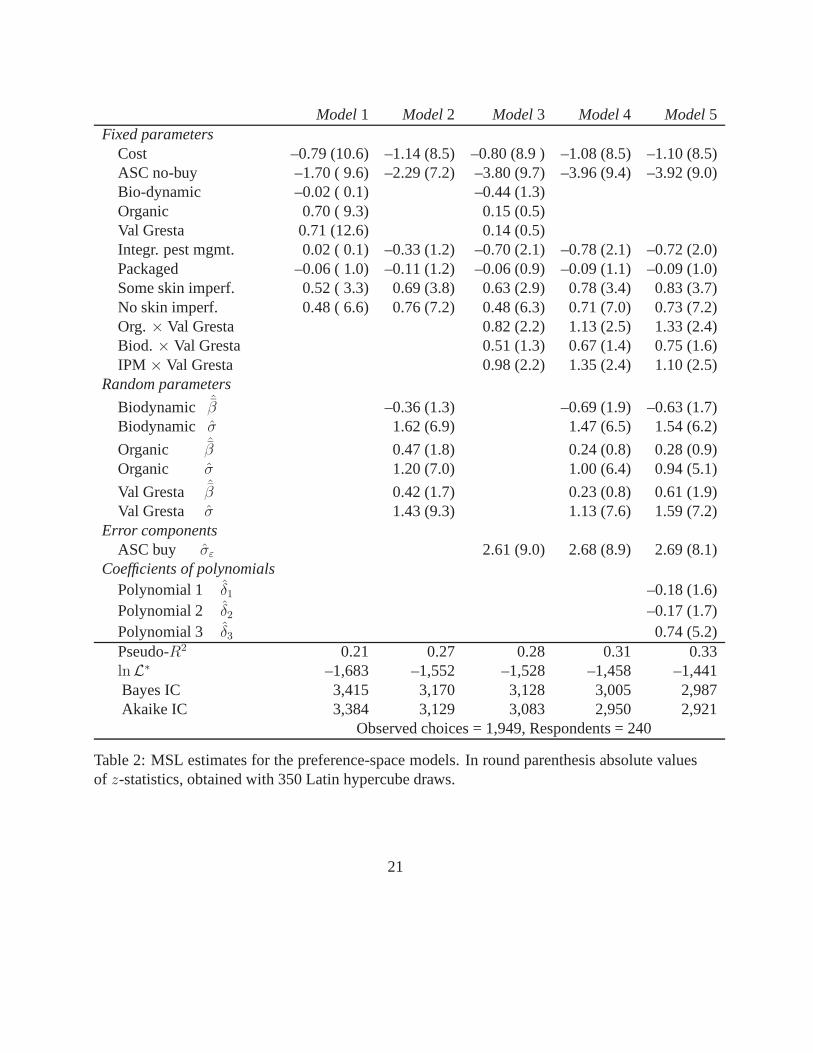
The method of investigation follows the typical steps of a modern qualitative choice analysis ofpreferred choices amongst systematically varied alternatives. We start with a basic multinomiallogit model specified on the main attributes (Model 1 in Table2) which does not account forcorrelation across choices by the same respondent, nor doesit include interaction effects be-tween EFPMs and place of origin while it does impose the restrictive I.I.A. assumption. Thismodel is reported as a benchmark that incorporates restrictions on all other models. We note,
10Because of the Monte Carlo results reported inFosgerau & Bierlaire(2007), we hold 0.01 as a significancelevel.
13

however, that in this model the estimate of taste intensity of the ‘VdG’ variable is positive andmore significant even than cost. This is consistent with evidence in favor of a consumer’s rep-utation of carrots with this origin. Taste intensity for ‘Organic’ is also strongly significant andpositive, and so are the coefficients for skin imperfections, which are visual indications of trueEFPMs production methods, as consumers know that absence ofskin imperfection in carrotscan only be uniformly achieved via conventional practices based on pesticide use. Neither IPMnor biodynamic production show significance in this model.
We then proceed, using a bottom-up approach, by gradually testing the introduction of acategory of parameters associated with the various hypotheses surrounding two separate issues:(a) taste heterogeneity and (b) the correlation of utilities via the presence of an additional errorcomponent for the ‘buy’ alternatives.
The specification search for the first issue identified Model 2as the best fitting specification,which identifies as significant the taste heterogeneity for BD, organic and VdG origin, but notfor IPM. The second issue was addressed simultaneously withthe significance of interactionvariables between EFPMs and place of origin. This last issueconstitutes a core hypothesisin support of the collective reputation of the VdG producers. The specification search led toa series of models from which we chose to present Model 3, the best fitting one. We notethat addressing these two issues separately produces an increase in the pseudo-R2 from 0.21 inModel 1 to 0.27 in Model 2 and 0.28 in Model 3. We interpret thisas strong evidence in favorof both issues. The results so far show that we cannot rejectshypotheses 1-3 as stated in section4.5.
Model 4 simply addresses issues (a) and (b) jointly, and produces a further increase inpseudo-R2 to 0.31. With these results we can conclude that the data support the presence (1) ofa positive ‘reputation effect’ of EFPM products from VdG; (2) a covariance between utilitiesrelated to purchasing options, and (3) the presence of substantial taste heterogeneity for organic,biodynamic and place of production.
5.2 Testing the appropriateness of taste distributions
Model 4 represents the final model in a conventional search, but this model is reliant on theadequateness of the normal distributions to describe the randomness of taste for biodynamic,organic and the VdG attributes.
To test our fourth hypothesis, i.e. whether our data is consistent with null of the distributionsof taste intensities being normal, we use the test describedin section4.3. We test the null that aflexible (or ‘generalized’) taste distributionG(βn|.) produces a significant improvement in themodel fit. That is, we introduce first, second and third order polynomial effects in turn. Then2 at a time, and finally all 3 for each attribute. These should capture most of the functionalflexibility afforded by such a generalization. If an addition proves to be significant in termsof an increased fit as measured by a formal likelihood ratio test at 0.01 significance, then the
14
random taste is deemed to be distributedg(βn|µ, σ, δ1, δ2, δ3) instead ofφ(βn|µ, σ) for theWTPestimation.
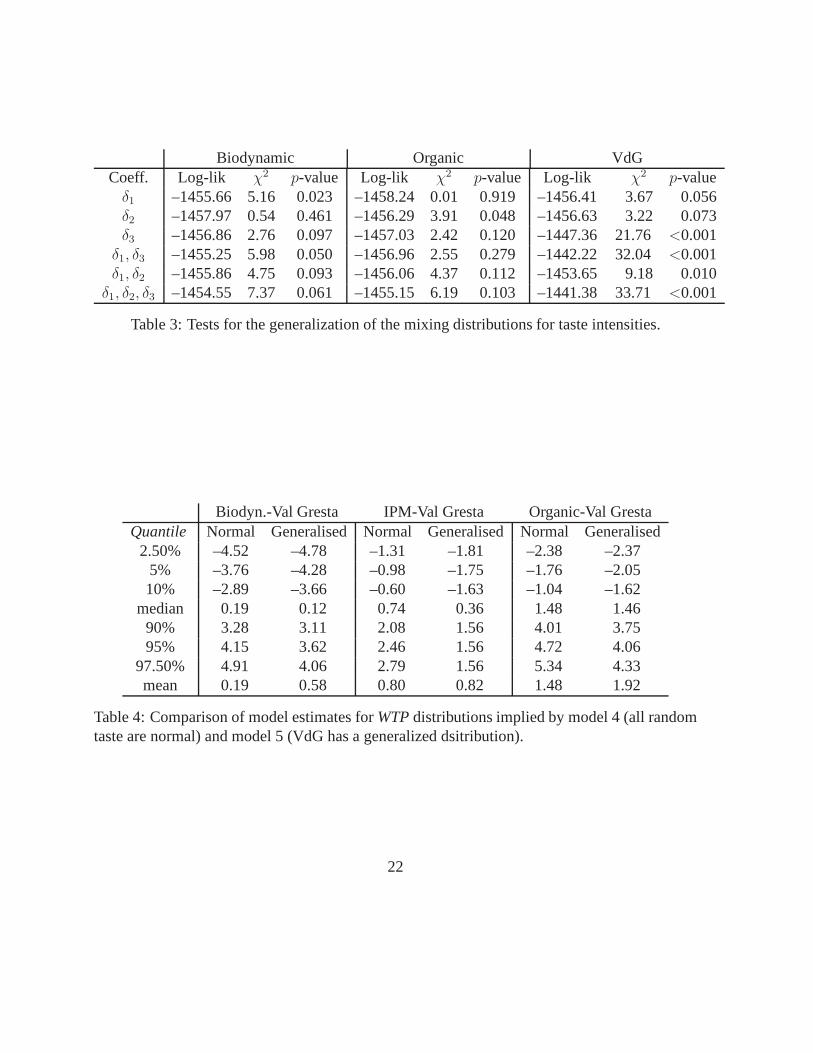
The test statistics and relativep-values for this search are reported in Table 3. As can beseen only for the VdG attribute do we find significance of the generalized flexible distributionsince the fitting of the 3 polynomials of the series results inap-value of less than 0.001. Model5 in Table 2 reports the estimates of such generalization. Wenote how the pseudo-R2 is highestfor this model, with a value of 0.33.
In Figure 1 we plot the estimated densities for VdG from Model4 and Model 5 as a compar-ison. The polynomial generalized distribution implies a bi-modality which is behaviorally quiteplausible, but fails to be captured by the normal. Allowing for extra flexibility than the one nat-urally accommodated by the normal reveals there is a bi-polar structure in the taste distributionfor VdG origin, most people like it, but a minority dislikes it. Such a preference structure hasrepercussion in the distribution ofWTPvia the interaction terms with VdG, as is exemplified bythe comparison of the statistics for theWTPdistributions (quantiles and meanWTP) in Table4. Focussing only on the mean, it is evident that Model 5 implies a value ofe0.44 more fororganic carrots from VdG than Model 4, biodynamic from the valley is valuede0.39 more,while there is little difference in IPM.
6 Conclusions
We developed a choice-experiment to investigate consumer preferences over environmentally-friendly production methods (EFPMs) in carrots produced ina distinctive Alpine valley (VdG)where producers have been investing in building a collective reputation for the last threedecades. To address unobserved taste heterogeneity we investigate the consequences of dif-ferent specifications of mixed logit models. The results show significant interaction effectsbetween place of origin and EFPMs thus providing evidence infavor of collective reputationand substantial taste heterogeneity for EFPMs and place of origin.
Further investigation of the nature of taste distribution by means of the test proposed byFosgerau & Bierlaire(2007) results in rejection of normality for the attribute VdG origin in favorof a generalized semi-parametric distribution which implies bi-modality of taste intensities.The results from the best fitting model imply that VdG carrotsproduced using integrated pestmanagement practices can fetch a meanWTP of e0.82/kg (mediane0.36/kg). Biodynamiccarrots from VdG—instead—command a meanWTPof onlye0.58/kg (mediane0.12/kg). Interms of policy direction it is clear that the indication from this study is toward favoring IPMproduction rather than biodynamic. The best EFPM is confirmed to be the organic with a meanWTPpremium ofe1.92/kg (mediane1.46/kg).
The use of a more flexible distribution than the normal to describe taste heterogeneity provedto be valuable. It improved model fit and captured significantdifferences in the key attribute of
15

place of origin. This enters, via interaction terms, the structure of indirect utility used in thisstudy to describe the premium for collective reputation in EFPMs. So, features of its distribu-tions are reflected in distributions ofWTPderived from its interactions with other attributes. Forexample, allWTPdistributions derived from the model with the generalized distribution of tastefor VdG origin are skewed with a median much smaller than the mean. More attention shouldbe directed towards the effects of distributional assumptions and their substantive consequencesin choice modeling studies. For example, in this study the difference in estimated medianWTPfor IPM from VdG obtained by incorrectly imposing normalityis more than twice that obtainedby allowing for a more flexible distributional assumption.
Investment on collective reputation is an avenue through which producers located inmarginal areas can secure customer loyalty and increase their revenues, thereby decreasingreliance on external subsidies. Stated choice methods onceagain seem to produce valid andreliable estimates that can be used to direct policy.
16

7 Tables
Attribute AlternativeA AlternativeB Buy neitherProduction method Organic ConventionalOrigin VdG Yes NoSkin imperfection more than 10% of the skin absentPackaged Yes loose productPrice in Euro 1.30 2.22
Table 1: Example of choice task in choice experiment.
References
Arnot, C., Boxall, P. C. & Cash, S. B. (2006), ‘Do ethical consumers care about price? arevealed preference analysis of fair trade coffee purchases’, Canadian Journal of AgriculturalEconomics54, 555–565.
Bierlaire, M. (2003), ‘BIOGEME: a free package for the estimation of discrete choice models’.
Brownstone, D. & Train, K. (1999), ‘Forecasting new productpenetration with flexible substi-tution patterns’,Journal of Econometrics89, 109–129.
Canavari, M., Bazzani, G. M. & Regazzi, D. (2002), ‘Food safety and organic fruit demand inItaly: a survey’,British Food Journal3/4/5, 220–232.
Cuyno, L., Norton, G. & Rola, A. (2001), ‘Economic analysis of environmental benefits ofintegrated pest management: a Philippine case study’,Agricultural Economics25, 227–233.
Ferrini, S. & Scarpa, R. (2007), ‘Designs with a-priori information for nonmarket valuationwith choice-experiments: a Monte Carlo study’,Journal of Environmental Economics andManagement53(3), 342–363.
Fosgerau, M. & Bierlaire, M. (2007), ‘A practical test for the choice of mixing distribution indiscrete choice models’,Transportation Research Part B41(7), 784–794.
Govindasamy, R. & Italia, J. (1998), ‘A willingness-to-purchase comparison of integrated pestmanagement and conventional produce’,Agricultural Economics14(5), 403–414.
17

Haaijer, M. E., Kamakura, W. & Wedel, M. (2001), ‘The no-choice alternative in conjointchoice’,International Journal of Market Research43(1), 93–106.
Hensher, D. & Greene, W. H. (2003), ‘The Mixed Logit Model: The State of Practice’,Trans-portation30(2), 133–176.
Herriges, J. A. & Phaneuf, D. J. (2002), ‘Inducing patterns of correlation and substitution inrepeated logit models of recreation demand’,American Journal of Agricultural Economics84, 1076–1090.
Hess, S., Train, K. E. & Polak, J. W. (2006), ‘On the use of a modified Latin hypercube sampling(MLHS) method in the estimation of a mixed logit model for vehicle choice’,TransportationResearch B40, 147–167.
Hobbs, J., Bailey, D., Dickinson, D. & Haghiri, M. (2005), ‘Traceability in the canadian redmeat sector: Do consumers care?’,Canadian Journal of Agricultural Economics53, 47–65.
ISMEA (2002), Il consumatore di prodotti biologici in Italia, focus su ortofrutta e olio ex-travergine di oliva, ISMEA, Italy.
ISMEA (2004), Il consumo di prodotti biologici,in ISMEA, ed., ‘Lo Scenario Economicodell’Agricoltura Biologica’, Italy, pp. 178–202.
Lawrence, C., Zhou, J. & Tits, A. (1997), User’s guide for CFSQP version 2.5: A C code forsolving (large scale) constrained nonlinear (minimax) optimization problems, generating iter-ates satisfying all inequality constraints, Technical Report TR-94-16r1, Institute for SystemsResearch, University of Maryland, College Park, MD 20742, 1997.
Loureiro, M. L. & McCluskey, J. J. (2000), ‘Assessing consumer response to protected geo-graphical identification labeling’,Agribusiness16(3), 309–320.
Marino, D. (2004), I principali prodotti, in ISMEA, ed., ‘Lo Scenario Economicodell’Agricoltura Biologica’, Italy, pp. 102–127.
Quagraine, K., Unterschultz, J. & Veeman, M. (1998), ‘Effects of product origin and selecteddemographics on consumer choice of red meats’,Canadian Journal of Agricultural Eco-nomics46, 201–219.
Rigby, D. & Burton, M. (2005), ‘Preference heterogeneity and GM Food in the UK’,EuropeanReview of Agricultural Economics32(2), 269–288.
Rigby, D. & Burton, M. (2006), ‘Modeling disinterest and dislike: A bounded Bayesianmixed logit model of the UK market for GM food’,Environmental and Resource Economics33, 485–509.
18
Roosen, J., Lusk, J. L. & Fox, J. (2003), ‘Consumer demand forand attitudes toward alternativebeef labeling strategies in France, Germany, and the UK’,Agribusiness19(1), 77–90.
Santucci, F. & Pignataro, F. (2002), ‘Organic farming in Italy’, Paper presented at the OECDworkshop on organic agriculture, Washington D.C., September 23-26 2002, OECD, WorldBank.
Scarpa, R. & Del Giudice, T. (2004), ‘Preference-based segmentation via mixed logit: The caseof extra-virgin olive oil across urban markets’,Journal of Agricultural and Food IndustrialOrganization2, Article 7.
Scarpa, R., Ferrini, S. & Willis, K. G. (2005), Performance of error component models forstatus-quo effects in choice experiments,in ‘Applications of simulation methods in environ-mental and resource economics’, Springer, chapter 13, pp. 247–274.
Scarpa, R., Philippidis, G. & Spalatro, F. (2005), ‘Estimating patriotic preferences for Mediter-ranean products under taste heterogeneity: a nation-wide survey of Italian households’,Agribusiness21, 329–349.
Scarpa, R. & Thiene, M. (2005), ‘Destination choice models for rock climbing in the North-eastern Alps: a latent-class approach based on intensity ofpreference’,Land Economics85(3), 426–44.
Scarpa, R., Willis, K. G. & Acutt, M. (2005), Individual-specific welfare measures for publicgoods: a latent class approach to residential customers of Yorkshire Water,in P. Koundouri,ed., ‘Econometrics Informing Natural Resource Management’, Edward Elgar Publisher,Cheltenham, U.K. and Nottingham, MA, U.S.A.
Steiner, R. (1993),Agriculture: Spiritual Foundations for the Renewal of Agriculture, Bio-Dynamic Farming and Gardening.
Thomas, L., Sporleder, P. & Goldsmith, D. (2001), ‘Alternative firm strategies for signalingquality in the food system’,Canadian Journal of Agricultural Economics49, 591–604.
Torjusen, H., Sangstad, L., Jensen, K. O. & Kiaernes, U. (2004), European consumers’ concep-tion of organic food: a review of available research, Technical report, National Institute forConsumer Research, Norway.
Train, K. (2003),Discrete Choice Methods with Simulation, Cambridge University Press, NewYork.
19
Train, K. & Sonnier, G. (2005), Mixed logit with bounded distributions of correlated partworths,in R. Scarpa & A. Alberini, eds, ‘Applications of simulation methods in environmental andresource economics’, Springer Publisher, Dordrecht, The Netherlands, chapter 7, pp. 117–134.
Van der Lans, I., Van Ittersum, K., De Cicco, A. & Loseby, M. (2001), ‘The role of the regionof origin and EU certificates of origin in consumer evaluation of food products’,EuropeanReview of Agricultural Economics28(1), 451–477.
Winfree, J. A. & McCluskey, J. J. (2005), ‘Collective reputation and quality’,American Journalof Agricultural Economics87, 206–213.
Zanoli, R. & Marino, D. (2002), Distribuzione consumi e mercato,in INIPA-AGER, ed., ‘Agri-coltura ed ecoambiente: indagine sui nuovi fabbisogni formativi del settore’, Ministero delLavoro e delle Politiche Sociali, Italy.
Zanoli, R. & Naspetti, S. (2002), ‘Consumer motivation in the purchase of organic food: ameans-end approach’,British Food Journal104(8), 643–653.
Zanoli, R., Vairo, D. & Midmore, P. (2001), The organic consumer in the EU: what we knowand what we don’t know, Technical Report D1, OMIARD, Aberystwyth.
20
Model1 Model2 Model3 Model4 Model5Fixed parameters
Cost –0.79 (10.6) –1.14 (8.5) –0.80 (8.9 ) –1.08 (8.5) –1.10 (8.5)ASC no-buy –1.70 ( 9.6) –2.29 (7.2) –3.80 (9.7) –3.96 (9.4) –3.92 (9.0)Bio-dynamic –0.02 ( 0.1) –0.44 (1.3)Organic 0.70 ( 9.3) 0.15 (0.5)Val Gresta 0.71 (12.6) 0.14 (0.5)Integr. pest mgmt. 0.02 ( 0.1) –0.33 (1.2) –0.70 (2.1) –0.78 (2.1) –0.72 (2.0)Packaged –0.06 ( 1.0) –0.11 (1.2) –0.06 (0.9) –0.09 (1.1) –0.09 (1.0)Some skin imperf. 0.52 ( 3.3) 0.69 (3.8) 0.63 (2.9) 0.78 (3.4)0.83 (3.7)No skin imperf. 0.48 ( 6.6) 0.76 (7.2) 0.48 (6.3) 0.71 (7.0) 0.73 (7.2)Org.× Val Gresta 0.82 (2.2) 1.13 (2.5) 1.33 (2.4)Biod. × Val Gresta 0.51 (1.3) 0.67 (1.4) 0.75 (1.6)IPM × Val Gresta 0.98 (2.2) 1.35 (2.4) 1.10 (2.5)
Random parameters
Biodynamic ˆβ –0.36 (1.3) –0.69 (1.9) –0.63 (1.7)Biodynamic σ 1.62 (6.9) 1.47 (6.5) 1.54 (6.2)
Organic ˆβ 0.47 (1.8) 0.24 (0.8) 0.28 (0.9)Organic σ 1.20 (7.0) 1.00 (6.4) 0.94 (5.1)
Val Gresta ˆβ 0.42 (1.7) 0.23 (0.8) 0.61 (1.9)Val Gresta σ 1.43 (9.3) 1.13 (7.6) 1.59 (7.2)
Error componentsASC buy σε 2.61 (9.0) 2.68 (8.9) 2.69 (8.1)
Coefficients of polynomialsPolynomial 1 δ1 –0.18 (1.6)Polynomial 2 δ2 –0.17 (1.7)Polynomial 3 δ3 0.74 (5.2)Pseudo-R2 0.21 0.27 0.28 0.31 0.33lnL∗ –1,683 –1,552 –1,528 –1,458 –1,441Bayes IC 3,415 3,170 3,128 3,005 2,987Akaike IC 3,384 3,129 3,083 2,950 2,921
Observed choices = 1,949, Respondents = 240
Table 2: MSL estimates for the preference-space models. In round parenthesis absolute valuesof z-statistics, obtained with 350 Latin hypercube draws.
21
Biodynamic Organic VdGCoeff. Log-lik χ2 p-value Log-lik χ2 p-value Log-lik χ2 p-value
δ1 –1455.66 5.16 0.023 –1458.24 0.01 0.919 –1456.41 3.67 0.056δ2 –1457.97 0.54 0.461 –1456.29 3.91 0.048 –1456.63 3.22 0.073δ3 –1456.86 2.76 0.097 –1457.03 2.42 0.120 –1447.36 21.76 <0.001
δ1, δ3 –1455.25 5.98 0.050 –1456.96 2.55 0.279 –1442.22 32.04 <0.001δ1, δ2 –1455.86 4.75 0.093 –1456.06 4.37 0.112 –1453.65 9.18 0.010
δ1, δ2, δ3 –1454.55 7.37 0.061 –1455.15 6.19 0.103 –1441.38 33.71 <0.001
Table 3: Tests for the generalization of the mixing distributions for taste intensities.
Biodyn.-Val Gresta IPM-Val Gresta Organic-Val GrestaQuantile Normal Generalised Normal Generalised Normal Generalised
2.50% –4.52 –4.78 –1.31 –1.81 –2.38 –2.375% –3.76 –4.28 –0.98 –1.75 –1.76 –2.0510% –2.89 –3.66 –0.60 –1.63 –1.04 –1.62
median 0.19 0.12 0.74 0.36 1.48 1.4690% 3.28 3.11 2.08 1.56 4.01 3.7595% 4.15 3.62 2.46 1.56 4.72 4.06
97.50% 4.91 4.06 2.79 1.56 5.34 4.33mean 0.19 0.58 0.80 0.82 1.48 1.92
Table 4: Comparison of model estimates forWTPdistributions implied by model 4 (all randomtaste are normal) and model 5 (VdG has a generalized dsitribution).
22
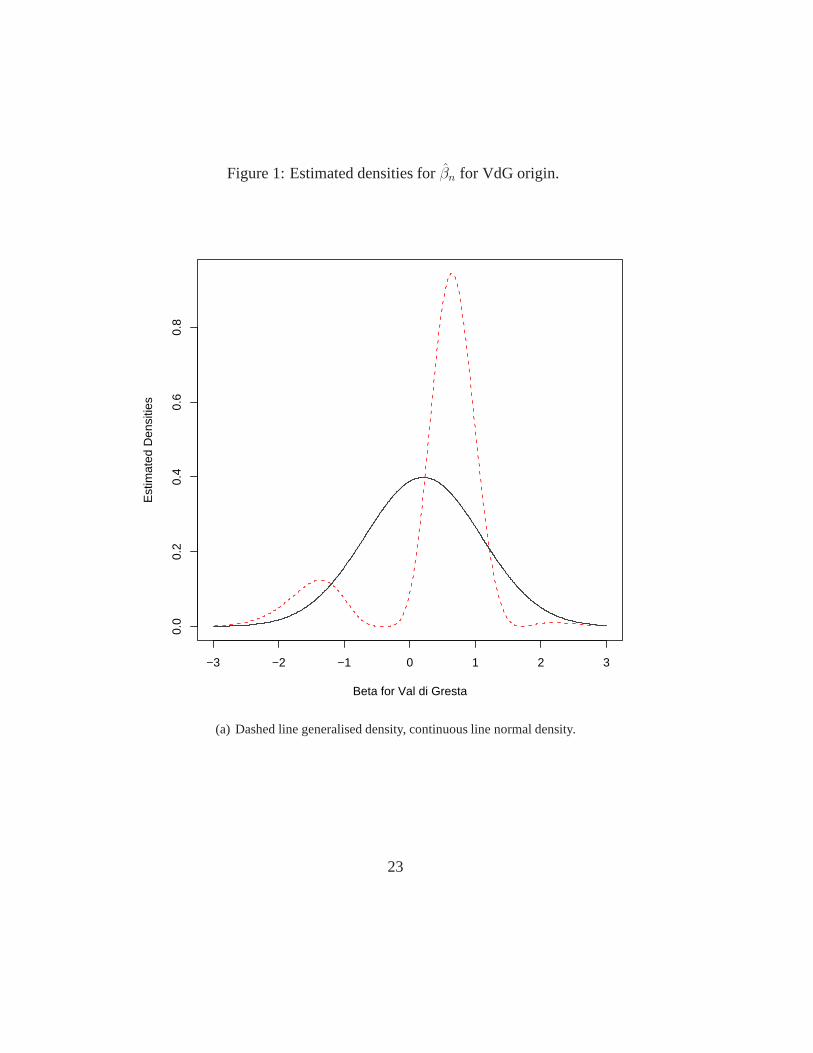
Figure 1: Estimated densities forβn for VdG origin.
−3 −2 −1 0 1 2 3
0.0
0.2
0.4
0.6
0.8
Beta for Val di Gresta
Est
imat
ed D
ensi
ties
(a) Dashed line generalised density, continuous line normal density.
23