Environmentally Responsible Behavior and the Application of ...
117
Environmentally Responsible Behavior and the Application of Leave No Trace Beyond the Backcountry A thesis presented to the faculty of The Gladys W. and David H. Patton College of Education and Human Services of Ohio University in partial fulfillment of the requirements for the degree Master of Science Janene M. Giuseffi March 2011 © 2011 Janene M. Giuseffi. All Rights Reserved.
-
Upload
khangminh22 -
Category
Documents
-
view
3 -
download
0
Transcript of Environmentally Responsible Behavior and the Application of ...

Environmentally Responsible Behavior and the Application of Leave No Trace
Beyond the Backcountry
A thesis presented to
the faculty of
The Gladys W. and David H. Patton College of Education and Human Services
of Ohio University
in partial fulfillment
of the requirements for the degree
Master of Science
Janene M. Giuseffi
March 2011
© 2011 Janene M. Giuseffi. All Rights Reserved.

2
This thesis titled
Environmentally Responsible Behavior and the Application of Leave No Trace Beyond
the Backcountry
by
JANENE M. GIUSEFFI
has been approved for
the Department of Recreation and Sport Pedagogy
and The Gladys W. and David H. Patton College of Education and Human Services
of Ohio University by
________________________________________
Bruce Martin
Assistant Professor of Recreation and Sport Pedagogy
_____________________________________________
Renée A. Middleton
Dean, The Gladys W. and David H. Patton College of Education and Human Services

3
ABSTRACT
GIUSEFFI, JANENE M., M.S., March 2011, Recreation and Sport Sciences
Environmentally Responsible Behavior and the Application of Leave No Trace Beyond
the Backcountry (117 pp.)
Director of Thesis: Bruce Martin
This study serves as a pilot study in the development of the Environmentally
Responsible Behavior (ERB) Predictor Scale. Additionally, it examines the application of
the Leave No Trace concept in everyday environmental behavior and the program’s
ability to transcend its backcountry focus. The sample included a treatment group of
those with three varying levels of Leave No Trace training and a control group of college
students with no previous Leave No Trace training. The scale was shown to be internally
reliable, though results of Exploratory Factor Analysis led to recommendations to revise
some items for future administration. Multiple statistic analyses reveal a moderate
correlation between intentions and level of Leave No Trace training, and give a direction
to further investigate the application of Leave No Trace to every day environmental
behavior. As such, this study serves as a platform for myriad new avenues of research on
this timely area of discourse.
Approved:
____________________________________________________________________
Bruce Martin
Assistant Professor of Recreation and Sport Pedagogy

4
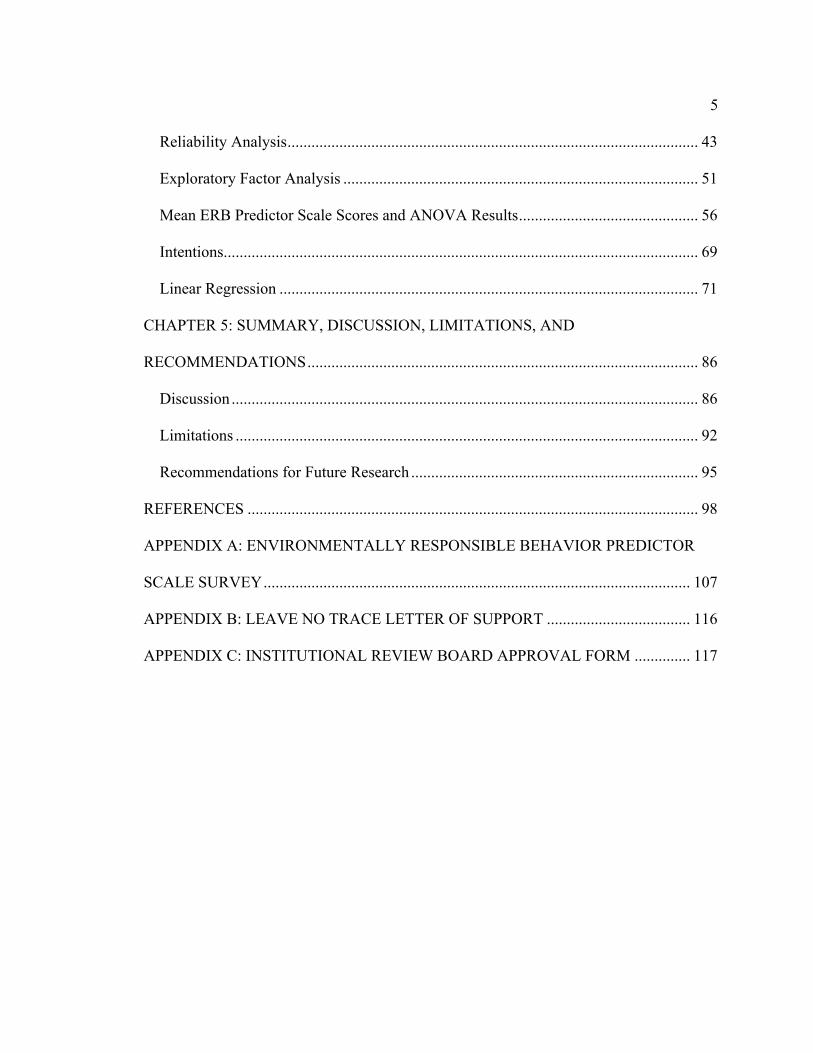
TABLE OF CONTENTS Page
ABSTRACT........................................................................................................................ 3
LIST OF FIGURES ............................................................................................................ 8
CHAPTER 1: INTRODUCTION....................................................................................... 9
Background of the Study ................................................................................................ 9
Significance of the Study .............................................................................................. 10
CHAPTER 2: REVIEW OF THE LITERATURE ........................................................... 12
Introduction................................................................................................................... 12
Theory of Planned Behavior (TPB) .............................................................................. 12
Environmentally Responsible Behavior (ERB) ............................................................ 20
Leave No Trace Center for Outdoor Ethics (LNT)....................................................... 25
Research Questions....................................................................................................... 31
CHAPTER 3: METHODOLOGY .................................................................................... 32
Introduction................................................................................................................... 32
Site & Sample ............................................................................................................... 32
Variable Description ..................................................................................................... 32
Instrumentation ............................................................................................................. 33
Data Collection Procedures........................................................................................... 35
Data Analysis Procedures ............................................................................................. 35
CHAPTER 4: RESULTS.................................................................................................. 38
Introduction................................................................................................................... 38
Participant Demographics............................................................................................. 38
5
Reliability Analysis....................................................................................................... 43
Exploratory Factor Analysis ......................................................................................... 51
Mean ERB Predictor Scale Scores and ANOVA Results............................................. 56
Intentions....................................................................................................................... 69
Linear Regression ......................................................................................................... 71
CHAPTER 5: SUMMARY, DISCUSSION, LIMITATIONS, AND
RECOMMENDATIONS.................................................................................................. 86
Discussion ..................................................................................................................... 86
Limitations .................................................................................................................... 92
Recommendations for Future Research ........................................................................ 95
REFERENCES ................................................................................................................. 98
APPENDIX A: ENVIRONMENTALLY RESPONSIBLE BEHAVIOR PREDICTOR
SCALE SURVEY........................................................................................................... 107
APPENDIX B: LEAVE NO TRACE LETTER OF SUPPORT .................................... 116
APPENDIX C: INSTITUTIONAL REVIEW BOARD APPROVAL FORM .............. 117

6
LIST OF TABLES
Page
Table 1: Reliability Analysis for All Respondents …….……………………….…….... 45
Table 2: Reliability Analysis for Those With Leave No Trace Training …...….……… 47
Table 3: Reliability Analysis for Those With No Leave No Trace Training ………….. 49
Table 4: Eigenvalues for ERB Predictor Scale Items ……………………………….…. 52
Table 5: Pattern Matrix ……………………………………………………………….... 54
Table 6: Factor Correlation Matrix ……………………………………………….……. 55
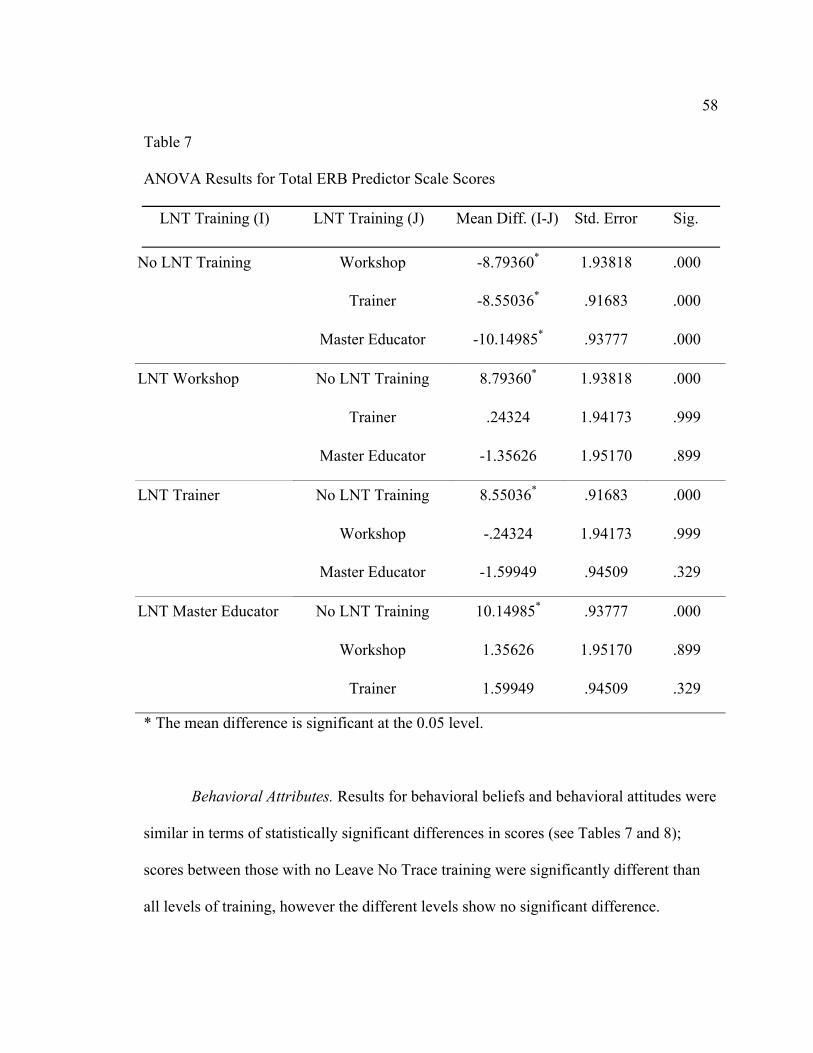
Table 7: ANOVA Results for Total ERB Predictor Scale Score …………………….… 58
Table 8: ANOVA Results for Behavioral Belief ERB Predictor Scale Score ……….… 59
Table 9: ANOVA Results for Behavioral Attitude ERB Predictor Scale Score ……..… 60
Table 10: ANOVA Results for Normative Belief ERB Predictor Scale Score ……...… 62
Table 11: ANOVA Results for Subjective Norm ERB Predictor Scale Score ………… 63
Table 12: ANOVA Results for Self-Efficacy ERB Predictor Scale Score ……….….… 66
Table 13: ANOVA Results for Controllability ERB Predictor Scale Score …………… 67
Table 14: Behavioral Inventory Responses ……………………………………………. 70
Table 15: Nested Model Correlations ………………………………………………….. 74
Table 16: Intentions Regression ……………………………………………………….. 78
Table 17: Intentions Regression (Leave No Trace Training) …………….……………. 79
Table 18: Intentions Regression (No Leave No Trace Training) ……………………… 80
Table 19: Control Attributes Regression ………………………………...…………….. 83
Table 20: Control Attributes (Leave No Trace Training) ……………………..……..… 84

7
Page
Table 21: Control Attributes (No Leave No Trace Training) ………………….………. 85
8
LIST OF FIGURES
Page
Figure 1: Theory of Planned Behavior…………………………………………………..13
Figure 2: Respondent Age ……………………………………………………………... 39
Figure 3: Respondent Sex: ……………………………………………………………... 40
Figure 4: Respondent Education Level ………………………………………………… 42
Figure 5: Mean ERB Predictor Scale Scores by Level of Leave No Trace …………..... 56
Figure 6: Mean Behavioral Belief Scores by Leave No Trace Level ………...…..……. 61
Figure 7: Mean Normative Belief Scores by Leave No Trace Level …...…………...… 64

9
CHAPTER 1: INTRODUCTION
Background of the Study
In the mid 20th century, it came to the attention of the U.S. Forest Service and
National Park Service that their public lands were experiencing increasingly detrimental
impacts from the millions of visitors who came to the parks to experience and reconnect
with nature. It became clear that the nation’s public lands were being “loved to death”
(Nash, 1967), and the ecosystems protected “for the benefit and enjoyment of the people”
were hanging in the balance, in serious danger of collapse. In the convening 60 years,
great strides have been made to restore and protect all parks from being used
irresponsibly. The fundamental work of the Leave No Trace Center for Outdoor Ethics is
to educate and encourage responsible backcountry etiquette and behavior. Its seven
principles serve as handrails on the map of ecologically friendly behavior for the trails,
rivers, lakes, and peaks of the United States.
As attention turns from parks to the greater world, this same issue is abundantly
apparent. Talk of environmental crisis is not new. Authors, scientists, and ecologists have
been warning the public of ecological problems since the late 19th century. A host of
environmental issues from littering to oil scarcity to global climate change have plagued
news and politics for decades, yet scientists and laymen alike agree that these tremendous
challenges persist. “We work hard to ‘leave no trace’ on the trail. Isn’t it about time we
give the same attention to the larger world?” (Van Horn, 2009). While Leave No Trace
owes much of its success to its well-defined goal, the underlying ethics and values of its
curriculum provide a useful framework for Environmentally Responsible Behavior in

10
everyday life. Environmentally Responsible Behavior (ERB) is a specific term referring
to “any action, individual or group, directed toward remediation of environmental
issues/problems" (Sivek & Hungerford, 1990). The question persists: Can Leave No
Trace apply to ethical day-to-day environmental behavior, just as it does to backcountry
behavior?
Significance of the Study
The extension of Leave No Trace outdoor ethics to everyday life is a topic of
interest in current research. Simon’s and Alagona’s (2009) Beyond Leave No Trace
model proposes a new curriculum that encompasses a broader spectrum of ERB,
incorporating day-to-day ERB with ethical backcountry use. While Leave No Trace
recognizes the application of their curriculum beyond backcountry recreational use, it is
also explicit in stating that they do not intend to alter their curriculum in any way, owing
much of their success to the narrow focus of their current seven principles (Personal
Conversation, Ben Lawhon, February 3, 2010). Along these lines, this study attempted to
neither encourage nor discourage the alteration of the current curriculum; instead, it
assessed the influence of the current curriculum on daily ERB in addition to its celebrated
ability to influence responsible recreational use.
Research has identified and discussed antecedents to ERB (Bamberg & Moser,
2007; Caltabiano & Caltabiano, 1995; De Young, 2000; Hines, Hungerford, & Tomera,
1986; Hungerford & Volk, 1990; Hwang et al, 2001; Iwata, 2001; Mobley, Vagias, &
DeWard, 2010; Oskamp, 2002; Sivek & Hungerford, 1991). While knowledge is
imparted through environmental education, it has been noted that mere knowledge does

11
not translate well into behavior (Bamberg & Moser, 2007; Vaske & Kobrin, 2001). While
many other scales have been produced to quantify or measures ERB (Smith-Sebasto &
D’Acosta, 1995; Vaske & Donnelly, 1999), this study applied Theory of Planned
Behavior (TPB) to the model of ERB put forth by Hines, Hungerford, & Tomera (1986),
serving as a pilot for the development of the Environmentally Responsible Behavior
Predictor Scale (ERBP Scale). This study therefore focused on assessing behavioral
beliefs and attitudes; normative beliefs and subjective norms; control beliefs and
Perceived Behavioral Control; and intentions and likelihood of behaving in
environmentally responsible ways. Additionally, it attempted to answer questions related
to the application of Leave No Trace to everyday environmental behavior using the
ERBP Scale.
12
CHAPTER 2: REVIEW OF THE LITERATURE
Introduction
The primary objective of Chapter 2 is to clearly define concepts related to the
environmental behavior and Leave No Trace programming. Chapter 2 addresses the
following: the Theory of Planned Behavior, and the Leave No Trace Center for Outdoor
Ethics.
Theory of Planned Behavior (TPB)
The Theory of Planned Behavior (TPB) is a well-known model applied in various
fields to understand and predict behavior; its predecessor, The Theory of Reasoned
Action (TRA), posits that an individual’s behavioral intention is the function of attitudes
and beliefs (Ajzen & Fishbein, 1980; Miller 2005). In other words, a behavior is the sum
of an individual’s own beliefs about the behavior and the opinion of those in the
individual’s social circle, resulting in higher motivation, or intention to act. In TRA,
behavioral intention is the direct precursor to behavior (Fishbein & Ajzen, 1975). Both
TRA and TPB have previously been used to explain health related behaviors such as
dieting and exercise (Baer, 1966) and voting behavior (Fishbein & Ajzen, 1975; Ajzen &
Fishbein, 1980; Gotch & Hall, 2004).
TRA assumes that behavior is completely under volitional control. TPB is a
response to criticism that TRA does not account for circumstantial events or factors that
prevent action (Ajzen, 1985; Ajzen, 1991). The addition of Perceived Behavioral Control
accounts for situations in which there is some other factor intervening when intention
makes behavior seem likely, but actual behavior does not develop, i.e. when behavior is

13
outside of volitional control (Ajzen, 1991, Ajzen, 2002). As seen in Figure 2, TPB
addresses behavior in terms of beliefs, attitudes, and intention and posits that behavior is
influenced by three types of beliefs & attitudes: behavioral, normative, and control, and
additionally intention (Ajzen, 1985).
Figure 1. Theory of Planned Behavior. Reproduced from Ajzen, 1991.
Belief is defined by Fishbein & Ajzen (1975) as the likelihood of a relationship
existing between the object of the belief and another value, concept, or attribute. These
beliefs form the basis from which attitude toward the behavior in question develops,
therefore an individual’s attitude can be measured by assessing their beliefs toward a
given concept (Fishbein & Ajzen, 1975). Descriptive beliefs are those that are directly
observable, such as the belief that the grass is green or the sky is blue (Fishbein & Ajzen,
1975). While beliefs are held toward directly observable relationships, individuals also
develop beliefs about unobservable relationships, such as a peer’s personality traits.
These beliefs are known as inferential beliefs, and develop from previously known

14
relationships (e.g., a person crying is sad or a person laughing is happy) or a formal
coding system (e.g., Matt is older than Mark who is older than Mike, therefore Mike is
younger than Matt) (Fishbein & Ajzen, 1975; Bruner, 1957). Additionally, people form
beliefs based on outside sources of information such as television, magazines, books,
music, friends, co-workers, etc. Whether a person accepts information from outside
sources as their own belief involves a number of different factors, including those dealing
with the source of information, e.g., dependability, trustworthiness, expertise, race,
gender, etc; the message itself, e.g., order of arguments, type of appeal; or the audience,
e.g., ease of persuasion, intelligence, personality, and self esteem (Fishbein & Ajzen,
1975).
While belief describes a person’s thoughts on the relationship between an object
and its attributes, attitude represents a generally favorable or unfavorable opinion about
this relationship and is synonymous with attribute evaluation. As beliefs are formed, so
too are attitudes (Fishbein & Ajzen, 1975) and in most circumstances, attitudes are
mediated by a few salient beliefs; they are typically neutral at first and then change upon
assimilation of new information. Fishbein & Ajzen (1975) give the example of a person’s
attitude toward a stranger. Upon initial meeting, the individual’s attitude may be neutral.
New information that this unknown person is a member of the Republican Party forms a
positive attitude towards the stranger, since the person is also a Republican. Subsequent
information shifts the attitude either positively or negatively depending on the person’s
beliefs (Fishbein & Ajzen, 1975). It follows that an individual’s attitude toward a given
object is not constant; rather, it fluctuates throughout life, ebbing and flowing in time

15
with an individual’s changing belief system. Some beliefs & attitudes hold relatively
steady throughout life, while others fluctuate greatly (Fishbein & Ajzen, 1975). Given
this fluidity, attitude can be succinctly described as a “function of salient beliefs at a
given point in time” (Fishbein & Ajzen, 1975).
As stated before, TPB posits that behavior is influenced by three types of beliefs &
attitudes: behavioral, normative, and control. Behavioral elements include the beliefs
about the likely outcome of a behavior and the evaluations of these outcomes. Normative
beliefs include both beliefs about social normative expectations of others and motivation
to comply with these beliefs. Control beliefs and attitudes address factors that facilitate or
preclude action and the perceived power of these attitudes and beliefs. The last element is
intention, or the subjective probability of performing a behavior (Ajzen, 1991).
Behavioral Beliefs & Attitudes
The first component of TPB speaks to beliefs and attitudes correlated with specific
behaviors. Behavioral beliefs are those that an individual holds about the consequences
of a given behavior. These beliefs address the subjective probability that a behavior will
produce a desired outcome, and can be closely linked to an individual’s general
knowledge of environmental issues, knowledge and skill in action strategies, and control
beliefs and Perceived Behavioral Control (Ajzen, 1991). Attitudes then stem from these
beliefs and can be either positive or negative; however both a positive attitude toward a
behavior and the belief that the behavior will produce the desire outcome must be
present. For example, if one believes that conserving natural resources is effective in
minimizing negative environmental impacts and that minimizing negative impacts is

16
desirable, they will have a positive attitude towards behaviors that do so. However, if one
believes that turning off lights or using compact fluorescent light bulbs is ineffective at
conserving energy, they will not engage in these behaviors, even though they hold a
positive attitude towards environmental responsibility. Similarly, one might hold a
negative attitude towards environmentally responsibility because they do not feel capable
of producing a desired outcome through their behavior and therefore become frustrated
by attempts to do so, eventually ceasing the behavior altogether. This phenomenon will
be discussed in more detail with regard to Perceived Behavioral Control and
controllability.
Normative Beliefs & Attitudes
This component of TPB assesses beliefs and their corresponding attitudes of an
individual toward perceived pressures from various referent groups, including peers,
mentors, family members, or society at large (Ajzen 1991; Fishbein & Ajzen, 1975).
Normative beliefs are the perceptions an individual has of a behavior, and is influenced
by the opinion of others significant in the life of the individual. The subjective norm is an
individual’s perception of pressure from referent groups to perform or not perform a
given behavior (Ajzen, 1991). Several factors may sway a subject’s end behavior, such as
the referent’s level of influence in the eyes of the subject; the referent’s opinion; size of
referent group; and the threat of repercussions of engaging in a behavior that defies the
opinions of the referent (Fishbein & Ajzen, 1975). The strength of association with the
subjective norm depends both on the individual and the situation; for example, for a
subject whose social group includes peers who hold positive attitudes toward
17
environmentalism, pressure to conform to certain behaviors viewed as environmentally
responsible, such as refraining from littering, will be much higher than pressure coming
from a group with ambivalent or negative attitudes toward the environment.
Control Beliefs & Attitudes
Control beliefs consist of beliefs about the presence of factors that may facilitate or
impede performance of the behavior and the perceived power of these factors. In TPB,
the addition of Perceived Behavioral Control (PBC) to the Theory of Reasoned Action
accounts for times when people have good intentions, but translating intentions into
behavior is thwarted because they lack confidence or feel they lack control over the
behavior (Ajzen, 1985). To the extent that it is an accurate reflection of actual behavioral
control, PBC combined with intent can be used to predict behavior (Ajzen, 1980). The
notion of PBC originates from Bandura’s Self Efficacy Theory in the field of social
psychology and can be thought of in two parts: perceived self efficacy and controllability,
which is very similar to the Locus of Control element in ERB(Ajzen, 2002; Hines,
Hungerford, & Tomera, 1986). An individual’s personal estimation of their ability in a
given situation, or perceived self-efficacy, holds a strong influence on behavior; it
represents an individual’s confidence in their ability to perform that behavior and to
produce a desired outcome (Bandura, Adams, Hardy, & Howells, 1980).
Self-efficacy is considered the most important antecedent for behavioral change,
and in its application to physical activity, mental health, and exercise, it has contributed
to the explanation of relationships between beliefs, attitudes, intentions, and behavior
(Bandura, et al., 1980). Individuals with high self-efficacy believe they are capable of

18
producing positive results; it follows that those with high self-efficacy with regard to
either general or specific behaviors are more likely to engage in those behaviors,
anticipating success. Conversely, individuals with low self-efficacy in a behavior are
more likely to avoid situations involving the behavior, thereby circumventing
opportunities to gain mastery of the behavior (Bandura, 1997, Bandura, et al., 1980).
Similarly, those with a high degree of controllability (internal LOC) believe that their
actions have the potential to affect change or influence events; those who possess low
controllability (external LOC) feel that events are not within their control and are
unlikely to participate in the behavior in question (Ajzen, 2002; Hines et al, 1986).
As stated before, one’s behavioral beliefs and attitudes are closely tied to self-
efficacy; in the example given earlier, an individual may develop negative attitude toward
a given behavior due to repeated failures in producing the desired outcome (Ajzen, 1991;
Ajzen, 2002; Fishbein & Ajzen, 1975). This leads to feelings of frustration, low self-
efficacy with regard to that behavior, and the cessation of the behavior. The subject feels
incapable of performing the behavior adequately, perhaps due to circumstance outside of
their control, and no longer engages in the behavior.
Intention
The final element of TPB is intention, which is assumed to be the immediate
antecedent of behavior. Intention is defined as the subjective probability or readiness to
perform a given behavior, and can be predicted by combining behavior, normative and
control beliefs and attitudes, each associated with a weighted value specific to the subject
and correlated behavior (Ajzen, 1991; Fishbein & Ajzen, 1975). Intention is the
19
amalgamation of four separate elements: the behavior, the target object at which it is
directed, the situation in which the behavior is to be performed, and the time in which it
is to be completed (Ajzen, 1991; Fishbein & Ajzen, 1975). Each of these elements lies at
a separate point along a continuum of specificity, from extremely specific to very
general. For example, one might intend to purchase an Energy Star refrigerator to replace
a less efficient one by the end of the year; this intention has moderately specific behavior,
target, situation and time. Alternatively, one might merely intend to be more conscious
about energy consumption; this intention has no reference to specific behavior, target,
situation, or time. Ultimately, it is important to recognize that behavioral intention is not
tantamount to behavior, but rather serves as an indicator of the likelihood of engaging in
a given behavior.
The study of the reliability of both TRA and TPB in predicting nature-related or
Environmentally Responsible Behaviors has resulted in a few observations. Gotch and
Hall (2004) used TRA to understand nature-related behaviors in children. They assert that
environmental education programs assume that by influencing beliefs, they can change
the behaviors of heir young participants in pro-environment ways, and found tentative
support for the TRA approach in accounting for nature-related behaviors in children
(Gotch & Hall, 2004). However, the extent to which programs can influence attitudes in
terms of magnitude & longevity remains uncertain. While the importance of attitude in
TRA seems to best predict behavior in children and adolescents, TPB is thought to more
accurately describe adult behaviors where Perceived Behavioral Control is of more
importance (Madden, Ellen, & Ajzen, 1992; Netemeyer, Burton, & Johnston, 1991).
20
Furthermore, it seems that TPB shows better correspondence between intention and
behavior in more difficult or complex behaviors than easier behaviors under complete
volitional control; this is due mostly to the PBC component that is notably absent in TRA
(Madden, et al., 1992; Netemeyer, et al., 1991).
Environmentally Responsible Behavior (ERB)
Environmentally Responsible Behavior (ERB) is a specific term describing “any
action, individual or group, directed toward remediation of environmental
issues/problems" (Sivek & Hungerford, 1990). ERB is characterized by a combination of
self interest and concern for other people, species, or ecosystems (Bamberg & Moser,
2007). It includes both general actions (talking with others about environmental issues;
encouraging family and friends to behave in environmentally responsible ways) and
specific actions (recycling; purchasing environmentally friendly & sustainable goods;
conservation of energy by turning off lights and using alternate sources of energy, such as
solar, hydro, or wind energy; and reduction in fossil fuel dependence by utilizing
alternative means of transportation) (Cottrell, 2003; Thogerson, 2007; Vaske and Kobrin,
2007).
Encouraging ERB is the fundamental goal of the discipline of environmental
education (Hines, Hungerford, & Tomera, 1986); as such, research has focused on the
precursors of environmentally responsible behaviors in order to successfully cultivate
desired behaviors through environmental education programming. By influencing values,
attitudes, and behaviors of individuals in positive ways, environmental education
ultimately seeks to minimize negative environmental impacts (Hines, Hungerford, &

21
Tomera, 1986). In fact, according to Matre “Environmental education that just educates
people about the environment without asking them to make changes in their own lives is
not environmental education – it’s natural science” (1990, p. 27). Generally speaking,
however, the effectiveness of environmental education in influencing behavior is of some
debate, and depends on a number of variables, including the setting, duration, affective
components, and practical implications. Overall, researchers suggest that longer programs
tend to influence behavior more strongly than short programs, and that practical field-
based programs have a more positive effect than similar classroom components (Bogner,
1998; Daniels and Marion 2005; Metzger & McEwen, 1999; Zelezny, 1999, Zint,
Kraemer, Northway, & Lim 2002.)
In a meta-analysis of research in environmental education up to that point, Hines,
Hungerford, & Tomera (1986) proposed a model of ERB that addresses both cognitive
and affective variables. The key components of the Hines model include general
knowledge of environmental issues, knowledge in action strategies, skill in action
strategies, attitudes, locus of control, and intention to act.
Cognitive Variables
Knowledge of environmental issues as well as knowledge of and skill in
environmental action strategies are considered cognitive variables, meaning that they
describe an individual’s awareness levels of the issues at hand (Hines et al., 1986).
Hungerford and Volk (1990) further identified three variable levels: entry-level
(knowledge of a general concept); ownership level (in-depth knowledge); and
empowerment level (knowledge about action skills and strategies) that can be used to

22
further describe the relationship of variables in influencing and predicting
environmentally responsible behavior. Knowledge is considered an entry-level variable,
in that it is not a strong predictor of behavior itself, but serves as a prerequisite to other
variables, allowing an individual to develop necessary precursors such as personal
investment and acquisition of action skills that result in intention to act in
environmentally responsible ways (Hines, Hungerford, & Tomera, 1986; Hungerford &
Volk, 1990).
Studies have found that general knowledge of environmental issues had a much
smaller effect on environmentally responsible behavior than knowledge of action skills
(Hwang, et al., 2000; Siemer & Knuth, 2001) A study of the “Hooked on Fishing-Not on
Drugs” (HOF-NOD) program for 6th to 8th graders found that fully implemented
programs stimulated interest in fishing, increased fishing participation, and developed
general entry-level knowledge (Hwang, et al., 2000; Siemer & Knuth, 2001). The results
of such studies suggest that in order to stimulate environmentally responsible behavior,
environmental educators must seek to instill knowledge beyond the entry-level to
ownership- and empowerment-level knowledge that contributes to the development of
personal investment in the issues (Siemer & Knuth, 2001; Hines et al., 1986). The
traditional assumption is that increased knowledge of environmental issues leads to ERB
(Hungerford & Volk, 1990); however, most research has turned up little support for this
assumption. While knowledge is prerequisite to other attributes that result in making
choices with the environment in mind, knowledge itself does not directly lead to those
behaviors.

23
Affective Variables
Affective or psychosocial variables are those that contend with feelings or
emotions associated with an object or concept, and include attitude, locus of control, and
intention to act. While cognitive variables provide a working knowledge of how to
behave in an environmentally responsible manner, affective variables provide the
necessary aspiration, or lack thereof, to apply knowledge and action skills.
According to Newhouse (1990), attitude is considered one of the most powerful
variables contributing to ERB and a more positive attitude toward the environment is a
strong precursor to ERB (Bamberg & Moser, 2007; Hines, Hungerford, & Tomera,
1986). Attitude is defined as either positive or negative feelings regarding environment.
Attitude can also be further demarcated into attitudes toward ecological and
environmental concepts in general, or attitudes toward taking environmental actions, such
as recycling or conserving water for example Favorable attitudes toward action were
found to have a stronger correlation with environmentally responsible behavior than
favorable attitudes toward general environmental concepts (Hines et al., 1986).
In 1978, Dunlap and Van Liere proposed the New Environmental Paradigm
(NEP). This new theory differed from previous hypotheses of attitudinal behavior in that
it is an eco- or biocentric paradigm, describing humans as innately wanting to help
nature, and as a part of nature rather than outside of it. The NEP uses a series of 12
questions that evaluate an individual’s attitudes about the environment. A score of 12 on
the NEP questionnaire indicates that a person entirely rejects the NEP and has an
unfavorable attitude toward the environment. A score of 48 indicates that a person wholly

24
accepts the NEP, and has a favorable attitude toward the environment. While the NEP
served as a novel tool for assessing attitudes on the environment in the late 70s and early
80s, researchers now question the validity of the measurement, citing increased
knowledge and awareness of the environment as reasons to re-evaluate the questions
posed (Bechtel, 1997; Thogerson, 2007).
Locus of control (LOC) is another important affective antecedent to ERB. Locus
of control is “an individual’s belief in whether or not he or she has the ability to bring
about change through his/her behavior” (Hwang, et al., 2000). Those individuals with
high perceived external locus of control view events as outside of their control, rather
than outside factors like God, luck, chance, or other intervening factors determine the
course of events more so than the individual (Hines, Hungerford, & Tomera, 1986;
Hungerford & Volk, 1990). Those with a high degree of internal locus of control, on the
other hand, believe that their own actions exert influence over occurrences and result in
changes in the course of events (Sia, et al., 1985; Sivek & Hungerford, 1988). Individuals
with an external locus of control are unlikely to participate in activities promoting ERB
because they do not foresee their actions causing change, and therefore see taking action
as a fruitless endeavor. It follows that individuals or groups with an internal locus of
control are much more likely to act in responsible ways because they see their actions as
having the potential to create worthwhile change (Hines, Hungerford, & Tomera, 1986;
Sivek & Hungerford, 1988).
An individual’s intent to act, or willingness to act upon a specified behavior, is the
strongest predictor of ERB, the direct antecedent to behavior (Ajzen, 1980; Ajzen, 2002)
25
and stems from a variety of cognitive and affective variables (Hines et al., 1986).
Research shows that a substantial correlation exists between intention and environmental
behavior, as shown by a Bayesian meta-analysis of studies on environmental action
(Schwenk & Moser, 2008). Locus of control is a strong predictor for intent to act, and
had substantial direct effects on attitude, which in turn affects intent to act. Therefore, it
can be said that by creating or encouraging internal locus of control, one can increase
intent to act in environmentally responsible ways (Hwang, et al., 2000).
Both Hines et al. (1986) and Bamberg & Moser (2007) purport that knowledge is a
prerequisite to environmental attitude and environmental sensitivity, which are direct
precursors to intention. However, while general knowledge is not a direct antecedent, it
does indirectly influence responsible environmental behavior. Hwang’s research (Hwang,
et al., 2000) suggests that knowledge of action skills affects locus of control more greatly
than general knowledge. Furthermore, both ability and desire to act are necessary for
ERB; while knowledge of action skills and strategies show that the ability is present in an
individual, intent to act represents the presence of desire (Hines et al., 1986; Hwang et al.,
2000).
Leave No Trace Center for Outdoor Ethics (LNT)
As automobile travel became more available in the mid 20th century, tourism to
National Parks and Forests boomed, leaving a trail of destruction in its wake (Lewis,
2007). Joseph Saks claimed, “the most serious problem of parks is that they risk being
loved to death” (Foresta, 1985). Seeing the destruction of its forests, the US Forest
Service (USFS) began incorporating the essence of “leave no trace” in its educational

26
displays and interpretive programs since the early1960s (Marion & Reid, 2001). By the
1980s, the Forest Service was implementing “No-Trace” programs extolling a new
wilderness ethic and educating visitors about how to minimize their impact on public
lands; the success of these programs then spurred collaboration with other federal land
agencies like the Bureau of Land Management and the National Park Service (Leave No
Trace History, n.d., ¶ 1). Early preservation efforts were aimed largely at visitor impact
problems themselves, rather than informing and educating users who underestimated or
failed to recognize the damage they were inflicting (Marion & Reid, 2001).
The failure of these early regulations in preserving wilderness led to the creation of
educational efforts to inform wilderness users (Marion & Reid, 2001). In 1990, the USFS
commissioned The National Outdoor Leadership School, NOLS, to create an educational
program promoting the leave no trace wilderness ethic (Marion & Reid 2007). NOLS
developed a curriculum for teaching Leave No Trace in all aspects of wilderness travel
and in varying environments, including alpine tundra, deserts, coastal waterways, and
caves (Marion & Reid, 2001). This curriculum was based largely on experiential models
from Hampton and Cole’s 1988 book, Soft Paths.
In 1991, NOLS and USFS signed a Memorandum of Understanding to formally
recognize their partnership (Marion & Reid, 2001); the Leave No Trace Center for
Outdoor Ethics was finally incorporated as a 501(c)(3) non-profit educational agency in
1994, and is now considered the foremost in international curriculum as well as an ethical
framework (Marion & Reid, 2001). The Leave No Trace curriculum consists of seven
principles as follows:

27
1. Plan Ahead and Prepare: Become familiar with the area of intended travel,
including regulations, group limits, terrain, expected weather, and potential
hazards;
2. Travel and Camp on Durable Surfaces: Avoid erosion and other damaging
impacts by treading and camping on areas of greatest resiliency;
3. Dispose of Waste Properly: Mitigate impacts of various human wastes by
employing appropriate methods of disposal;
4. Leave What You Find: Enjoy cultural, natural, and/or historic artifacts in a
way that preserves them for others to enjoy;
5. Minimize Campfire Impacts: Fires not only mar landscapes, but can
drastically change the ecology of large areas - employ proper, safe fire
building techniques through the use of fire rings or other containment
methods or refrain from fire use altogether.
6. Respect Wildlife: Wildlife should be kept so; this requires that humans do not
disrupt their normal and natural routines and habits by maintaining safe
distances and refraining from providing unnatural sources of food to wildlife.
7. Be Considerate of Other Visitors: Wilderness is a shared resource. Being
mindful of one’s physical and psychological impact greatly reduces conflict
in the backcountry. (Leave No Trace Programs, n.d., ¶2).
Based on these seven principles, Leave No Trace offers various outreach programs
as well as several levels of training (Leave No Trace Training, n.d., ¶2). The Traveling
Trainer program consists of teams of professional outdoor educators who spend one year

28
on the road, leading workshops, facilitating school programs, and providing public
displays and discussions on Leave No Trace. The Teen and Promoting Environmental
Awareness in Kids (PEAK) programs target youth and provide teachers and educators
with valuable resources to further interest and knowledge in Leave No Trace and related
issues. The training courses offered by Leave No Trace operate at three tiers. In Tier 1,
the 5-day experiential Master Educator course prepares professionals to become
comprehensive experts on all things Leave No Trace. In turn, they instruct the 2-day
Trainer courses designed for guides, agency employees, and other outdoor professionals
providing information to the public as part of Tier 2. In Tier 3, graduates of Trainer
courses can then facilitate Awareness Workshops, which vary in length from 30 minutes
to one full day, and are intended to introduce and educate the general public on the
principles of Leave No Trace (Leave No Trace Training, n.d., ¶1).
With concern to the efficacy of environmental education programs in general,
longer programs with a field-based component tend to result in the most measurable
changes in environmentally responsible behaviors. In 2005, Daniels and Marion
conducted a study investigating the efficacy of Leave No Trace 2-day Trainer courses. In
assessing knowledge, ethics, behavior and outreach, they demonstrated that the Trainer
courses were indeed effective in promoting short and long term ERB in terms of
backcountry use. Measures of environmental knowledge and ethics showed great
improvement immediately upon completion, followed by a small drop upon follow-up,
for an overall significant net increase. Ethics also experienced a statistically significant
increase, and 91% of respondents reported that they planned to teach Leave No Trace

29
concepts in the future. In terms of correlation among these 4 items, no significant
correlation was found between knowledge and behavior, while a significant correlation
was found between ethics and behavior, suggesting that ethical appeals may be more
crucial in promoting ERB, an idea in line with Hines’ previously stated model of ERB.
The Leave No Trace Center for Outdoor Ethics focuses on “the responsible
enjoyment and active stewardship of the outdoors by all people, worldwide” (Leave No
Trace About Us, n.d., ¶1). Beyond responsible recreational use, Leave No Trace
recognizes the need for sustainability and environmental responsibility in all areas of life.
In their stated Sustainability Ethos, Leave No Trace “acknowledge(s) the need for ethical
and sustainable practices that transcend our organizational mission, which become
inherent parts of the way we manage our organization and our daily lives” (Leave No
Trace Sustainability Ethos, n.d. ¶1). Furthermore, Leave No Trace also acknowledges the
applicability of the Leave No Trace concept to more sweeping environmentally
responsible behaviors, and provides resources on recycling, home energy conservation,
carbon offsets, individual environmental footprint audits, renewable energy, sustainable
travel, alternative transportation, water conservation, waste reduction, and eating local
and organic foods among others (Leave No Trace Sustainability Ethos, n.d., ¶3).
Some in the outdoor recreation and education field are calling for this wider
approach to be incorporated into the Leave No Trace curriculum. Simon & Alagona
(2009) propose a “Beyond Leave No Trace” model, in which the Leave No Trace
curriculum is revamped to address what the researchers view as shortcomings of the
Leave No Trace curriculum. Rather than replacing the current 7 principles, Simon and
30
Alagona supplement them in order to incorporate a more holistic practice of
environmental awareness and ethic.
“Beyond Leave No Trace focuses on choices and activities that transcend the
boundaries of wilderness areas, and that connect recreation to the global chains of
production and consumption that make the contemporary American wilderness
experience possible” (Simon and Alagona, 2009).
The proposed 7 principles of Beyond Leave No Trace are as follows:
1. Educate yourself and others about the places you visit
2. Purchase only the equipment and clothing you need
3. Take care of the equipment and clothing you have
4. Make conscientious food, equipment, and clothing consumption choices
5. Minimize waste production
6. Reduce energy consumption
7. Get involved by conserving and restoring the places you visit
(Simon & Alagona, 2009)
This new set of principles may address the fundamental ethical system to which
Daniel and Marion refer in their study. According to Ben Lawhon, Leave No Trace’s
education director, here the Leave No Trace Center for Outdoor Ethics is explicit in its
intention to remain true to its current curriculum and focus on recreational impacts
(Personal Communication, February 3, 2010). This study will in no way address this
debate, but rather questions the applicability of the current Leave No Trace curriculum to
daily life as an unintended benefit of the program.

31
Research Questions
By applying Ajzen’s TPB to the model of ERB put forth by Hines, Hungerford, &
Tomera (1986), this study served as a pilot for the development of the Environmentally
Responsible Behavior Predictor Scale (ERBP Scale) and focused on assessing behavioral
attitudes and beliefs and their evaluations; normative attitudes and beliefs; control
attitudes and beliefs; and behavioral intentions and likelihood of behaving in
environmentally responsible ways. Additionally, the researcher attempted to answer the
following questions related to the application of Leave No Trace backcountry programs
to everyday life.
1. Is the ERB Predictor Scale a reliable instrument?
2. Do higher levels of Leave No Trace training correspond with higher ERB
scores?
3. To what extent do Leave No Trace Principles apply to environmentally
responsible decision making in everyday life?
4. Do those with higher levels of Leave No Trace training also exhibit higher
Perceived Behavioral Control with regard to everyday environmental
behavior?

32
CHAPTER 3: METHODOLOGY
Introduction
Chapter 3 explains the methodology of the study including scale development,
research design, sample, data collection procedures, data analysis procedures, and
limitations.
Site & Sample
A sample of Leave No Trace participants of varying levels served as a treatment
group for this study in addition to a sample of Ohio University students, which was used
as a control group who do not necessarily have any pre-disposed environmental attitudes
or beliefs and have had no Leave No Trace training. Leave No Trace Awareness
Workshop participants, Leave No Trace Trainer participants, and Leave No Trace Master
Educator participants were chosen at random by the Leave No Trace Center for Outdoor
Ethics; approximately 10,500 individuals were contacted. Of these 10,500, 629 responded
for a response rate of 5.9%. Of these 629 responses, 554 were valid, representing 5.2% of
the population that was contacted. Responses that did not give their level of Leave No
Trace training were not included in the study.
Variable Description
This study addresses a variety of important variables. The independent variable is
level of Leave No Trace training: none, Awareness Workshop, Trainer, or Master
Educator. Dependent variables measured are behavioral beliefs and attitudes, normative
beliefs and attitudes, control beliefs and attitudes, and intentions.

33
Instrumentation
The instrument in this study was influenced by both the Hines et al. (1986) model
of ERB and Ajzen’s TPB (Ajzen, 1991; Hines et al., 1986). Key variables in the scale are
Behavioral attributes, Normative attributes, Control attributes, and intention, each
measured on a 6-point Likert-type scale (1 = strongly disagree, 2 = disagree, 3 =
somewhat disagree, 4 = somewhat agree, 5 = agree, 6 = strongly agree), as well as an
inventory of Environmentally Responsible Behaviors. As previously stated in Chapter 2,
ERB is defined as any behavior that conserves resources and/or mitigates negative
environmental impacts.
Scale Development
In developing the ERB scale, this study followed the basic steps of scale
development as outlined in Worthington & Whittaker 2006, as listed:
1. Determine what the scale intends to measure.
2. Generate items.
3. Determine the format of the items.
4. Have the scale reviewed by experts.
5. Consider including validation items.
6. Administer the scale to a sample.
7. Evaluate the items based on the data returned.
8. Optimize scale length.
The scale intends to measure attitudes and beliefs about environmental behavior,
as well as intention, based on TPB (Ajzen, 1985; Ajzen, 1991). Each survey item was

34
carefully chosen and worded to clearly reflect the construct of interest. The end goal for
each item is to be concise, clear, and distinct (Anastasi, 1988; DeVellis, 2003), with
every attempt made in the initial drafting of the survey to do just that.
The instrument was devised based on previous TPB scales and in accordance with
TPB theory and consists of 7 sections, the first of which obtains informed consent.
Sections 2 through 4 measure beliefs and attitudes. Rather than directly measuring
attitude, beliefs and their evaluations (attitudes) are evaluated separately to calculate
attitude in accordance with the conceptualization of TPB. A statement of belief will be
tempered with a behavioral evaluation (attitude) statement to discern a subject’s attitude
toward ERB in general. Section 2 of the survey addresses the participant’s behavioral
beliefs and attitudes. Section 3 speaks to normative beliefs and attitudes. Section 4 speaks
to control beliefs and attitudes. In this section, PBC is measured based on questions
addressing both self-efficacy and Locus of Control/controllability. Section 5 speaks to
intention by asking the participant to check all behaviors that they intend to participate in
within the next 6 months. Section 6 includes questions related to the applicability of
Leave No Trace to ERB in daily life. Ohio University students did not answer this
section, only Leave No Trace participants. Finally, section 7 gathers demographic data
including sex, age, city & state of residence, level of Leave No Trace training, Leave No
Trace course location, and highest level of education achieved. Refer to Appendix A for a
document of the survey, and see http://www.survey monkey.com/s/X7HK85T for an on-
line version.

35
The survey was then reviewed by the thesis research committee as well as staff
members of Leave No Trace and revised accordingly before implementation. Chapters 4
and 5 discuss the evaluation of the items and recommendations for future
implementation.
Data Collection Procedures
Data were collected via on-line survey administered using Survey Monkey. In
collaboration with Leave No Trace Education Director, Ben Lawhon, the survey was e-
mailed through Leave No Trace to 10,000 Awareness Workshop, Trainer, and Master
Educator participants in the database. This was done to avoid oversaturation of
communication by Leave No Trace and to ensure anonymity of the respondents. Leave
No Trace reserved the right to review the survey before implementation. Invitations to the
survey were also made available to 500 undergraduate students in a number of
classrooms at Ohio University, representing the control group for the study.
Data Analysis Procedures
The two-part nature of this study necessitated the separate treatments of two sets
of data. All data was entered into SPSS 17.0 for Windows. Demographic variables were
included for possible future research, and each item of the scale was evaluated using
Exploratory Factor Analysis (EFA) to determine the factors underlying each construct.
There is much debate over the differences between the many different types of factor
analysis and data reduction methods. While Principal Components Analysis (PCA) with
varimax (orthogonal) rotation is both the simplest and most popular method, it was not

36
particularly well-suited to this study; PCA is a method of data reduction, not technically
EFA, and an orthogonal rotation is intended for factors that are thought not to be related.
Common-Factors Analysis (FA) was more in line with the theoretical basis of this
study, and was thus used as the extraction method in order to understand underlying
factors that could possibly account for shared variance (Costello & Osborne, 2005;
Gorsuch, 1983; Tabachnick & Fidell, 2001; Thompson, 2004; Worthington & Whittaker,
2006). This extraction method seeks the least number of factors that account for the
common variance of variables. Additionally, an oblique rotation, direct oblimin, the
results of which are slightly more difficult to interpret, was used instead of the orthogonal
varimax rotation, as this rotation allows and accounts for factors that may be correlated,
as is thought to be the case in the scale (Costello & Osborne, 2005; Tabachnick & Fidell,
2001). Due to the nature of EFA, the results are tentative rather than confirmatory.
However, future analysis of the data that repeats EFA or employs Confirmatory Factor
Analysis (CFA) can provide increasingly concrete results as the scale continues to be
refined. In addition to EFA, reliability of each item was calculated to reveal internal
consistency, and recommendations for the following version of the scale are made.
ANOVA comparison of ERB Predictor Scale scores was made between all four
groups in order to address Leave No Trace research questions. Linear regression was
used to examine the relationship between level of Leave No Trace training and ERB
Predictor Scale scores and intentions and to elucidate the amount of variation between
groups that can be explained by level of Leave No Trace training. Additionally,

37
descriptive statistics characterizing age, sex, and education level provided summary of
demographic variables. Significance was set at .05 for all statistical analyses.

38
CHAPTER 4: RESULTS
Introduction
Chapter 4 presents the results of this study. Survey response rate, descriptive
statistics for demographics, scale reliability, results of Exploratory Factor Analysis,
Analysis of Variance (ANOVA) of the ERB Predictor Scale as a whole, ANOVA of
behavioral attributes, normative beliefs and subjective norm, and self-efficacy and
controllability are provided, as is linear regression. Open-ended qualitative responses are
also addressed briefly.
Participant Demographics
While demographic information was collected, only basic descriptive statistics on
age, sex, and highest education level attained were executed for the purposes of this
research. The data collected in this study may potentially be put to use in future tests
regarding demographic variables and their relationship to environmental behavior or
Leave No Trace training.
Age. 213 respondents, 38.4% of valid respondents, were aged 20-29, a number that
was likely influenced by the baseline group of Ohio University students. 109 respondents
(17.4%) were 50-59; 72 respondents (13.0%) were 40-49; 59 respondents (10.6%) were
10-19; 54 (9.7%) were 30-39; 40 respondents (7.2%) were 60-69; and 3 respondents
(.5%) were 70-79. 4 respondents, or .7%, did not respond.
Among those with Leave No Trace training, 107 respondents ( 29.1%) were 50-59;
88 respondents (23.9%) were 20-29; 71 respondents (19.2%) were 40-49;54 respondents
(14.7%) were 30-39; 38 respondents (10.3%) were 60-69; 4 respondents (1%) were 10-

39
19; 3 respondents (<1%)were 70-79; and 3 respondents (<1%) gave no response.
Among those with no Leave No Trace training, there was considerably less
variation in age. 125 respondents (67%) were 20-29; 55 respondents (30%) were 10-19; 2
respondents (<1%) were 50-59; 2 respondents (<1%) were 60-69); and 1 respondent
(<1%) gave no response.
Figure 2. Respondent Ages. All respondents, n = 554; Leave No Trace training, n = 368;
No Leave No Trace Training, n = 186.
Sex. Out of a total of 554 respondents, 303, or 54.6% of the sample, identified
themselves as male, while 246 respondents (44.3%) identified female, 5 respondents
0
25
50
75
100
125
150
175
200
225
All
LNT Training
No LNT Training

40
(.9%) identified with another sex, and 1 (.2%) respondent did not respond.
Among those with Leave No Trace training, 142 (38.6%) were female; 222
respondents (60.3%) were male; 3 respondents (<1%) identified as another sex; and 1
respondent (<1%) gave no response.
Among those with no Leave No Trace Training, 104 (55.9%) were female; 80
respondents (43.0%) were male; and 2 (<1%) identified with another sex.
Figure 3. Respondent sex. All respondents, n = 554; Leave No Trace training, n = 368;
No Leave No Trace Training, n = 186.
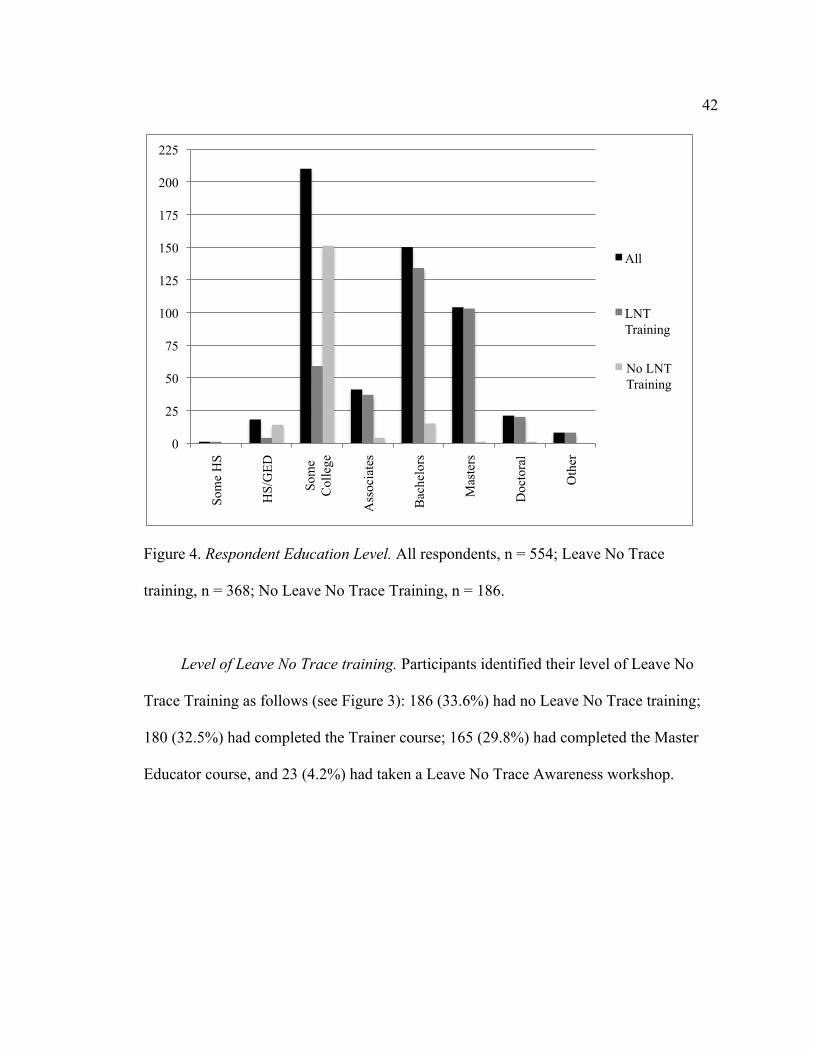
Education. 210 respondents (37.8%) reported that they have finished some college;
similar to the high frequency of 20-29 year-olds, this number is also likely due to the
0
25
50
75
100
125
150
175
200
225
250
275
300
325
Female Male Other No Response
All
LNT Training
No LNT Training

41
baseline university students. 150 respondents (27.0%) have completed a Bachelors
degree. 104 respondents hold a Masters degree (18.7%). 41 respondents (7.4%) hold an
Associates degree. 21 (3.8%) respondents had completed a doctoral degree. 18
respondents (3.2%) had completed high school. 8 respondents (1.4%) have completed
other education, and 1 (.2%) respondent has completed some high school.
Among those with Leave No Trace training, 134 respondents (36.4%) have a
Bachelors degree; 103 respondents (27.0%) have a Masters degree; 59 respondents
(16.0%) have completed some college; 37 respondents (10.1%) have an Associates
degree; 20 respondents (5.4%) have a Doctoral degree; 8 respondents (2.2%) have
completed some other type education; 4 respondents (1%) have a high school degree or
the equivalent; and 1 respondent (<1%) has completed some high school.
Again, education among those with no Leave No Trace training was considerably
more homogenous. 151 respondents (81%) have completed some college; 15 respondents
(8.1%) have a Bachelors degree; 14 respondents (7.5%) have a high school diploma or
equivalent; 4 respondents have an Associates degree (1%); 1 respondent (<1%)has a
Masters degree; and 1 respondent has a doctoral degree (<1%).
42
Figure 4. Respondent Education Level. All respondents, n = 554; Leave No Trace
training, n = 368; No Leave No Trace Training, n = 186.
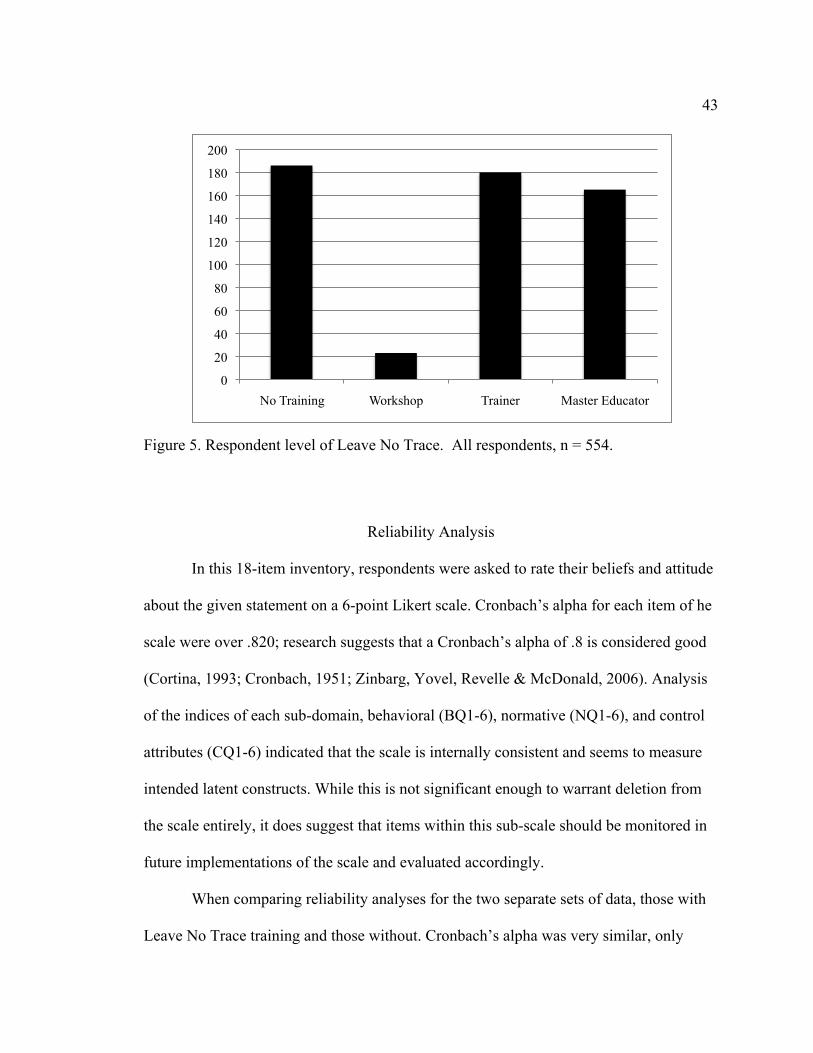
Level of Leave No Trace training. Participants identified their level of Leave No
Trace Training as follows (see Figure 3): 186 (33.6%) had no Leave No Trace training;
180 (32.5%) had completed the Trainer course; 165 (29.8%) had completed the Master
Educator course, and 23 (4.2%) had taken a Leave No Trace Awareness workshop.
0
25
50
75
100
125
150
175
200
225
Som
e H
S
HS/
GED
Som
e C
olle
ge
Ass
ocia
tes
Bac
helo
rs
Mas
ters
Doc
tora
l
Oth
er
All
LNT Training
No LNT Training
43
Figure 5. Respondent level of Leave No Trace. All respondents, n = 554.
Reliability Analysis
In this 18-item inventory, respondents were asked to rate their beliefs and attitude
about the given statement on a 6-point Likert scale. Cronbach’s alpha for each item of he
scale were over .820; research suggests that a Cronbach’s alpha of .8 is considered good
(Cortina, 1993; Cronbach, 1951; Zinbarg, Yovel, Revelle & McDonald, 2006). Analysis
of the indices of each sub-domain, behavioral (BQ1-6), normative (NQ1-6), and control
attributes (CQ1-6) indicated that the scale is internally consistent and seems to measure
intended latent constructs. While this is not significant enough to warrant deletion from
the scale entirely, it does suggest that items within this sub-scale should be monitored in
future implementations of the scale and evaluated accordingly.
When comparing reliability analyses for the two separate sets of data, those with
Leave No Trace training and those without. Cronbach’s alpha was very similar, only
0
20
40
60
80
100
120
140
160
180
200
No Training Workshop Trainer Master Educator

44
slightly lower than the alphas calculated for the whole sample. This is to be expected, as
the sample size is reduced by separating the control group from the treatment group, but
even alphas calculated on the smaller groups were all above .8

45
Table 1
Reliability Analyses of Environmentally Responsible Behavior Predictor Scale (ERB Predictor Scale)
Component Item Total Correlation
Alpha if Item
Deleted
Cronbach’s Alpha
Behavioral Attributes .844
BQ1: Conserving resources and reducing negative environmental impacts is important.
.636 .854
BQ2: Using alternative transportation helps to conserve resources and minimize negative impacts on the environment.
.543 .854
BQ3: Responsible environmental behavior is not important. .455 .855
BQ4: Reducing waste contributes to minimizing environmental problems. .587 .853
BQ5: Using fewer resources puts less of a strain on the environment. .568 .853
BQ6: The environment is of high priority in my day-to-day behavior. .640 .851
Normative Attributes .853
NQ1: What my friends think is important to me. .213 .860
NQ2: Minimizing environmental impacts is important to my family. .572 .852
NQ3: Turning off unused lights is not something that those around me do or thinks is
important.
.356 .856
46
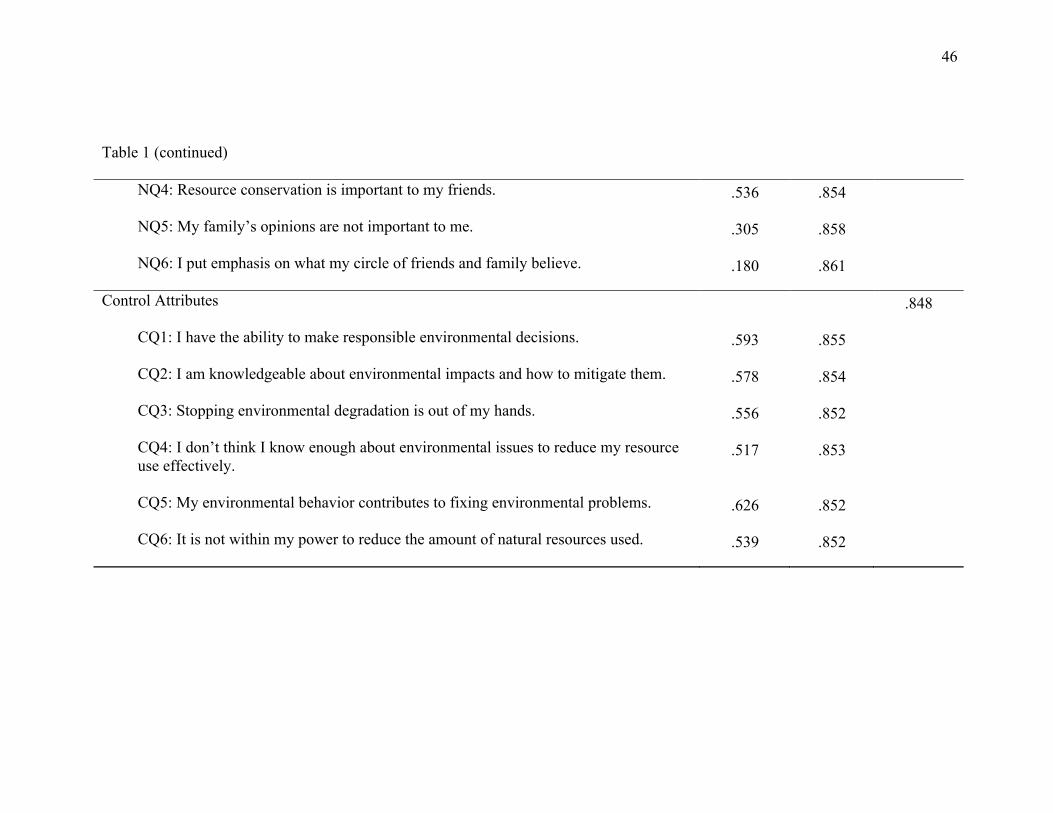
Table 1 (continued)
NQ4: Resource conservation is important to my friends. .536 .854
NQ5: My family’s opinions are not important to me. .305 .858
NQ6: I put emphasis on what my circle of friends and family believe. .180 .861
Control Attributes .848
CQ1: I have the ability to make responsible environmental decisions. .593 .855
CQ2: I am knowledgeable about environmental impacts and how to mitigate them. .578 .854
CQ3: Stopping environmental degradation is out of my hands. .556 .852
CQ4: I don’t think I know enough about environmental issues to reduce my resource use effectively.
.517 .853
CQ5: My environmental behavior contributes to fixing environmental problems. .626 .852
CQ6: It is not within my power to reduce the amount of natural resources used. .539 .852

47
Table 2
Reliability Analysis for Those With Leave No Trace Training
Component Item Total Correlation
Alpha if Item
Deleted
Cronbach’s Alpha
Behavioral Attributes .825
BQ1: Conserving resources and reducing negative environmental impacts is important. .476 .836
BQ2: Using alternative transportation helps to conserve resources and minimize negative impacts on the environment.
.457 .834
BQ3: Responsible environmental behavior is not important. .363 .836
BQ4: Reducing waste contributes to minimizing environmental problems. .516 .832
BQ5: Using fewer resources puts less of a strain on the environment. .524 .832
BQ6: The environment is of high priority in my day-to-day behavior. .604 .831
Normative Attributes .832
NQ1: What my friends think is important to me. .317 .837
NQ2: Minimizing environmental impacts is important to my family. .509 .832
NQ3: Turning off unused lights is not something that those around me do or thinks is
important.
.401 .833

48
Table 2 (continued)
NQ4: Resource conservation is important to my friends. .535 .833
NQ5: My family’s opinions are not important to me. .364 .835
NQ6: I put emphasis on what my circle of friends and family believe. .279 .838
Control Attributes .827
CQ1: I have the ability to make responsible environmental decisions. .527 .834
CQ2: I am knowledgeable about environmental impacts and how to mitigate them. .488 .834
CQ3: Stopping environmental degradation is out of my hands. .517 .831
CQ4: I don’t think I know enough about environmental issues to reduce my resource use effectively.
.430 .834
CQ5: My environmental behavior contributes to fixing environmental problems. .563 .832
CQ6: It is not within my power to reduce the amount of natural resources used. .519 .830

49
Table 3
Reliability Analysis for Those With No Leave No Trace Training
Component Item Total Correlation
Alpha if Item
Deleted
Cronbach’s Alpha
Behavioral Attributes .828
BQ1: Conserving resources and reducing negative environmental impacts is important.
.670 .837
BQ2: Using alternative transportation helps to conserve resources and minimize negative impacts on the environment.
.623 .838
BQ3: Responsible environmental behavior is not important. .401 .842
BQ4: Reducing waste contributes to minimizing environmental problems. .617 .838
BQ5: Using fewer resources puts less of a strain on the environment. .563 .839
BQ6: The environment is of high priority in my day-to-day behavior. .494 .840
Normative Attributes .837
NQ1: What my friends think is important to me. .400 .843
NQ2: Minimizing environmental impacts is important to my family. .488 .840
NQ3: Turning off unused lights is not something that those around me do or thinks is
important.
.137 .850

50
Table 3 (continued)
NQ4: Resource conservation is important to my friends. .329 .844
NQ5: My family’s opinions are not important to me. .326 .844
NQ6: I put emphasis on what my circle of friends and family believe. .250 .846
Control Attributes .831
CQ1: I have the ability to make responsible environmental decisions. .561 .841
CQ2: I am knowledgeable about environmental impacts and how to mitigate them. .503 .841
CQ3: Stopping environmental degradation is out of my hands. .465 .840
CQ4: I don’t think I know enough about environmental issues to reduce my resource use effectively.
.398 .842
CQ5: My environmental behavior contributes to fixing environmental problems. .572 .839
CQ6: It is not within my power to reduce the amount of natural resources used. .428 .841

51
Exploratory Factor Analysis
EFA is, generally speaking, a process subject to much interpretation by the
researcher. While it does not provide results that are absolute or entirely concrete, it
allows the researcher to explore the underlying structure of a phenomenon. Tests for
sufficiency indicated that this data set was appropriate for factor analysis. A large Kaiser-
Meyer-Olkin value (KMO = .876) and highly significant Bartlett’s test of sphericity (p <
.001) indicated “that the patterns of correlation should yield distinct & reliable factors”
(Field, 2005). KMO values over .5 are acceptable (Costello & Osborne, 2005; Tabachnik
& Fidell, 2001), and according to Hutcheson and Sofroniou (1999), a KMO value above
.8 is considered very good.
In accordance with Kaiser’s criterion, all factors with Eigenvalues over 1 were
retained. These 5 factors, before rotation, explained 63.34% of the variance within the
scale (see Table 3). Following best practices for EFA (Costello & Osborne, 2005), these
5 factors were then organized into a pattern matrix, with values under .32 suppressed and
listed in order of greatest to least for ease of interpretation (see Table 4). From this
pattern matrix, all values over .32 are accepted (Tabachnick & Fidell, 2001).

52
Table 4
Eigenvalues for ERB Predictor Scale Items
Initial Eigenvalues Sums of Squared Loadings
Factor Total % of Variance Cumulative % Total % of Variance
1 5.743 31.905 31.905 5.263 29.239
2 1.871 10.394 42.299 1.403 7.796
3 1.397 7.760 50.059 .894 4.966
4 1.352 7.513 57.572 .837 4.651
5 1.038 5.767 63.339 .453 2.518
6 .853 4.742 68.081
7 .723 4.018 72.099
8 .679 3.770 75.868
9 .630 3.500 79.368
10 .563 3.130 82.498
11 .488 2.713 85.211
12 .444 2.468 87.678
13 .436 2.420 90.098
14 .406 2.258 92.355
15 .399 2.215 94.571
16 .360 1.999 96.570
17 .337 1.872 98.443
18 .280 1.557 100.000

53
Only one item cross-loaded on Factors 1 and 3 (BQ6: “the environment is of high
priority in my day-to-day behavior”), and two items did not load over .32 on any factor
(CQ4: “I don’t think I know enough about environmental issues to reduce my resource
use effectively” and CQ1: “I have the ability to make responsible environmental
decisions”). Each factor had at least 2 items loading on it, with Factors 1 and 3 loaded 5
items. Generally, factors that load 3 to 5 items are considered stable, while those loading
less than 3 are not (Costello & Osborne, 2005; Tabachnick & Fidell, 2001).
Each item was compared to the other items that loaded on the same factor and
patterns were established at the researcher’s discretion as follows:
• Factor 1: Attitude Toward the Environment
• Factor 2: The Influence of Significant Others
• Factor 3: Certainty that Behavior is Effective
• Factor 4: Opinions of Others are Not Important
• Factor 5: Locus of Control
Factor 1, Attitude Toward the Environment accounted for 29% of the variance, but it is
worth noting that items are not necessarily loading on factors in the way one might
predict based on the underlying theory of the scale. For example, one would expect NQ1,
NQ5, and NQ6 to load on the same factor, as they all address normative belief. However,
NQ1 and NQ 6 both loaded on Factor 2 (The Influence of Significant Others), NQ5
loaded on Factor 4 (Opinions of Others are Not Important). This indicates that, perhaps,
items are not measuring the intended constructs, however, this is not the intent of EFA.
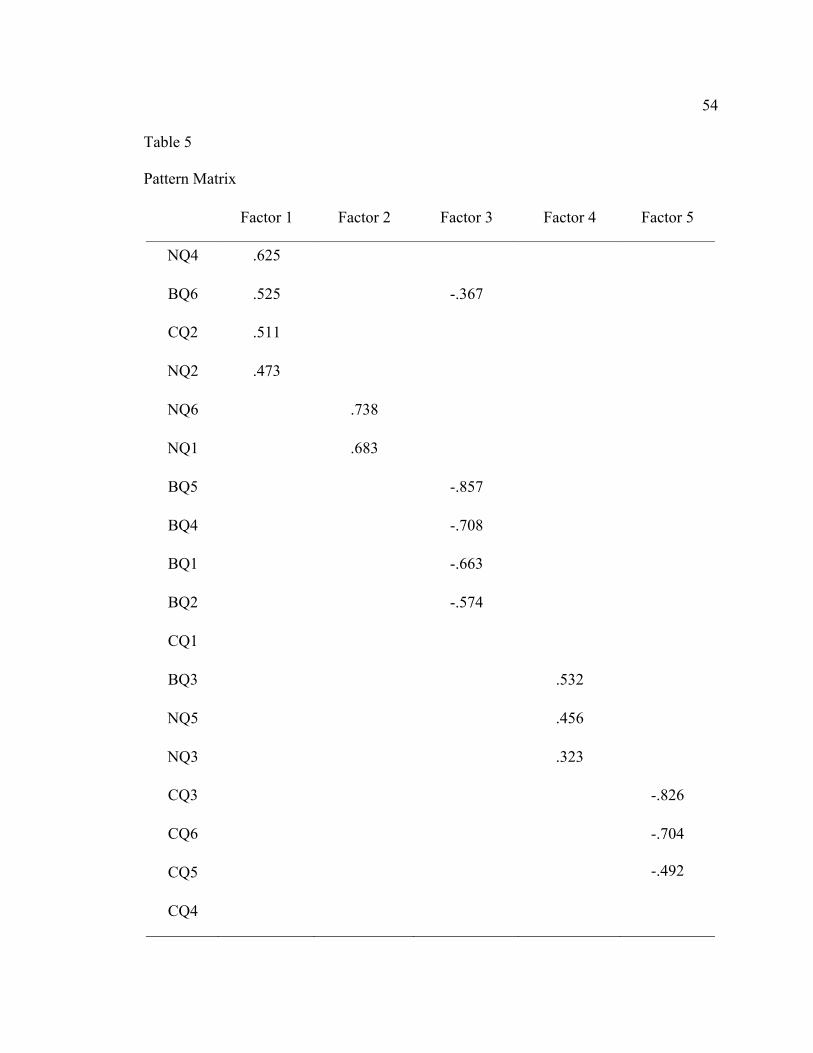
54
Table 5
Pattern Matrix
Factor 1 Factor 2 Factor 3 Factor 4 Factor 5
NQ4 .625
BQ6 .525 -.367
CQ2 .511
NQ2 .473
NQ6 .738
NQ1 .683
BQ5 -.857
BQ4 -.708
BQ1 -.663
BQ2 -.574
CQ1
BQ3 .532
NQ5 .456
NQ3 .323
CQ3 -.826
CQ6 -.704
CQ5 -.492
CQ4

55
When comparing correlation between the most stable factors, factors 1, 3, and 5
all exhibited correlation coefficients of at least .41. This suggests that all factors are
moderately correlated, either positively or negatively, while factors 2 and 4 are only
slightly correlated.
Table 6
Factor Correlation Matrix
Factor 1 2 3 4 5
1 1.000 .042 -.412 .137 -.426
2 .042 1.000 -.123 .064 .068
3 -.412 -.123 1.000 -.182 .420
4 .137 .064 -.182 1.000 -.297
5 -.426 .068 .420 -.297 1.000
Factor analysis extracted five initial factors. Upon closer examination of the
pattern matrix produced by oblimin rotation, factors 1, 3 and 5 all loaded over three
items, and thus were considered to be stable. Each of the items making up this matrix
loaded at least .32 on only one factor. The two items that didn’t load on any factor and
the item that cross-loaded on two factors are questions that warrant further investigation.
These should be reworked before the next implementation of the survey in the hopes that
they can contribute more strongly to the scale.
56
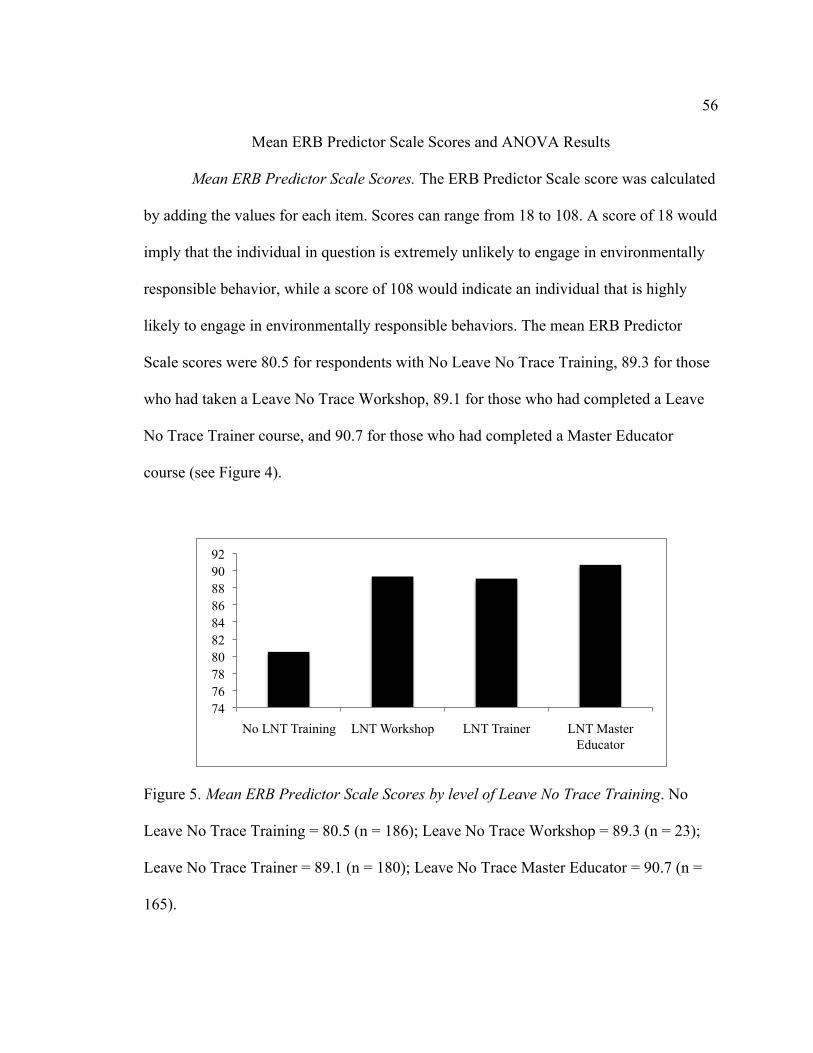
Mean ERB Predictor Scale Scores and ANOVA Results
Mean ERB Predictor Scale Scores. The ERB Predictor Scale score was calculated
by adding the values for each item. Scores can range from 18 to 108. A score of 18 would
imply that the individual in question is extremely unlikely to engage in environmentally
responsible behavior, while a score of 108 would indicate an individual that is highly
likely to engage in environmentally responsible behaviors. The mean ERB Predictor
Scale scores were 80.5 for respondents with No Leave No Trace Training, 89.3 for those
who had taken a Leave No Trace Workshop, 89.1 for those who had completed a Leave
No Trace Trainer course, and 90.7 for those who had completed a Master Educator
course (see Figure 4).
Figure 5. Mean ERB Predictor Scale Scores by level of Leave No Trace Training. No
Leave No Trace Training = 80.5 (n = 186); Leave No Trace Workshop = 89.3 (n = 23);
Leave No Trace Trainer = 89.1 (n = 180); Leave No Trace Master Educator = 90.7 (n =
165).
74 76 78 80 82 84 86 88 90 92
No LNT Training LNT Workshop LNT Trainer LNT Master Educator

57
ANOVA Results. ANOVA results show a p value of .000, indicating significant
differences in ERB Predictor Scale scores between those with no Leave No Trace
training and all other levels of training; however, there was no statistically significant
difference among workshop participants, Trainers, and Master Educators in terms of
overall ERB Predictor Scale scores (see Table 6). However, when ANOVA was
conducted on each section separately, interesting and more detailed relationships were
illuminated.
58
Table 7
ANOVA Results for Total ERB Predictor Scale Scores
LNT Training (I) LNT Training (J) Mean Diff. (I-J) Std. Error Sig.
Workshop -8.79360* 1.93818 .000
Trainer -8.55036* .91683 .000
No LNT Training
Master Educator -10.14985* .93777 .000
No LNT Training 8.79360* 1.93818 .000
Trainer .24324 1.94173 .999
LNT Workshop
Master Educator -1.35626 1.95170 .899
No LNT Training 8.55036* .91683 .000
Workshop -.24324 1.94173 .999
LNT Trainer
Master Educator -1.59949 .94509 .329
No LNT Training 10.14985* .93777 .000
Workshop 1.35626 1.95170 .899
LNT Master Educator
Trainer 1.59949 .94509 .329
* The mean difference is significant at the 0.05 level.
Behavioral Attributes. Results for behavioral beliefs and behavioral attitudes were
similar in terms of statistically significant differences in scores (see Tables 7 and 8);
scores between those with no Leave No Trace training were significantly different than
all levels of training, however the different levels show no significant difference.
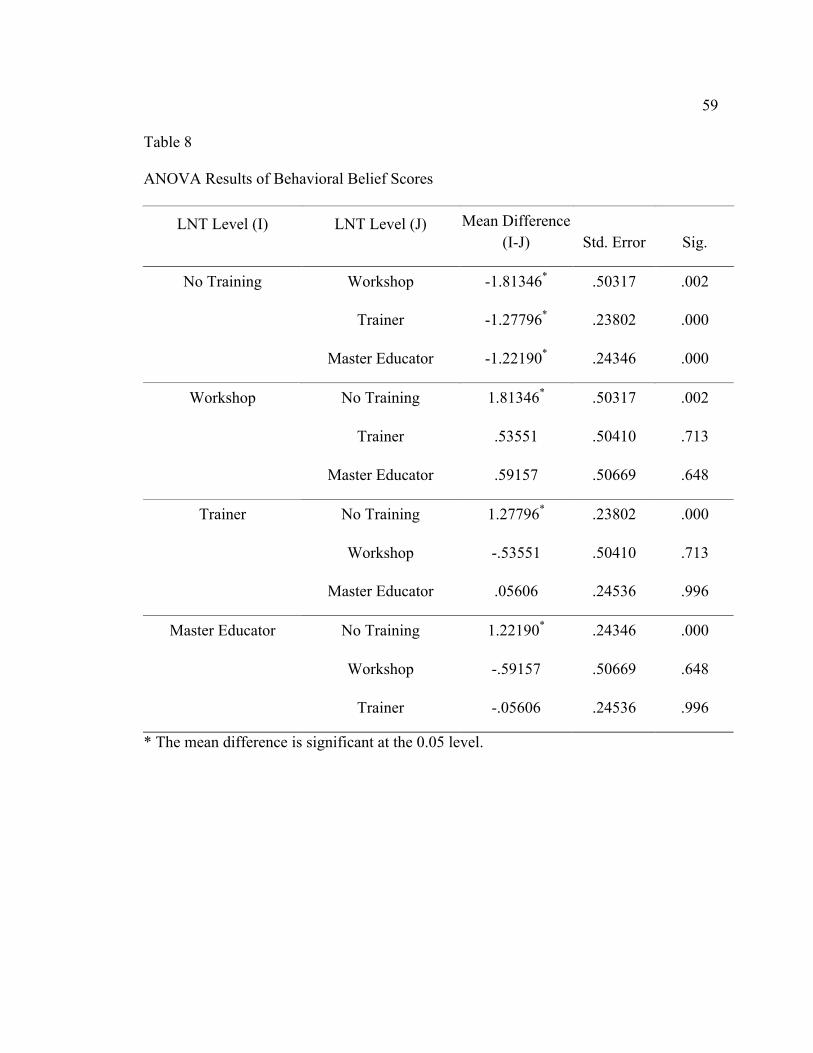
59
Table 8
ANOVA Results of Behavioral Belief Scores
LNT Level (I) LNT Level (J) Mean Difference (I-J) Std. Error Sig.
Workshop -1.81346* .50317 .002
Trainer -1.27796* .23802 .000
No Training
Master Educator -1.22190* .24346 .000
No Training 1.81346* .50317 .002
Trainer .53551 .50410 .713
Workshop
Master Educator .59157 .50669 .648
No Training 1.27796* .23802 .000
Workshop -.53551 .50410 .713
Trainer
Master Educator .05606 .24536 .996
No Training 1.22190* .24346 .000
Workshop -.59157 .50669 .648
Master Educator
Trainer -.05606 .24536 .996
* The mean difference is significant at the 0.05 level.

60
Table 9
ANOVA Results of Behavioral Attitude Scores
LNT Level (I) LNT Level (J) Mean Difference (I-J) Std. Error Sig.
Workshop -2.21038* .42655 .000
Trainer -2.35072* .20177 .000
No Training
Master Educator -2.31183* .20638 .000
No Training 2.21038* .42655 .000
Trainer -.14034 .42733 .988
Workshop
Master Educator -.10145 .42952 .995
No Training 2.35072* .20177 .000
Workshop .14034 .42733 .988
Trainer
Master Educator .03889 .20799 .998
No Training 2.31183* .20638 .000
Workshop .10145 .42952 .995
Master Educator
Trainer -.03889 .20799 .998
* The mean difference is significant at the 0.05 level.

61
Figure 6. Mean Behavior Belief ERB Predictor Scale Scores by Leave No Trace Level.
(No Leave No Trace Training = 14.84; Leave No Trace Workshop = 16.65; Leave No
Trace Trainer = 16.1; Leave No Trace Master Educator = 16.06)
* Scores calculated by adding each item score for BQ2, BQ4, and BQ5. The highest
possible score is 18.
Normative Attributes. When comparing results of normative belief questions,
statistically significant differences in score among groups was observed between those
with no Leave No Trace training and Trainers and Master Educators, but not between
those with no training and workshop participants. Also, there was no significant
difference in score between workshop participants, Trainers and Master Educators. In
terms of subjective norm scores, there was a significant difference in scores between
workshop participants and those with no training, but not between the varying levels of
Leave No Trace training (see Tables 9 and 10).
0
2
4
6
8
10
12
14
16
18
No Training Workshop Trainer Master Educator

62
Table 10
ANOVA Results of Normative Belief Scores
LNT Level (I) LNT Level (J) Mean Difference (I-J) Std. Error Sig.
Workshop .48060 .51264 .785
Trainer .72939* .24250 .015
No Training
Master Educator .66979* .24803 .036
No Training -.48060 .51264 .785
Trainer .24879 .51358 .963
Workshop
Master Educator .18920 .51621 .983
No Training -.72939* .24250 .015
Workshop -.24879 .51358 .963
Trainer
Master Educator -.05960 .24997 .995
No Training -.66979* .24803 .036
Workshop -.18920 .51621 .983
Master Educator
Trainer .05960 .24997 .995
* The mean difference is significant at the 0.05 level.
Table 11
ANOVA Results of Subjective Norm Scores

63
LNT Level (I) LNT Level (J) Mean Difference (I-J) Std. Error Sig.
Workshop -1.93291* .52705 .002
Trainer -1.86649* .24931 .000
No Training
Master Educator -2.62356* .25501 .000
No Training 1.93291* .52705 .002
Trainer .06643 .52802 .999
Workshop
Master Educator -.69065 .53073 .562
No Training 1.86649* .24931 .000
Workshop -.06643 .52802 .999
Trainer
Master Educator -.75707* .25700 .018
No Training 2.62356* .25501 .000
Workshop .69065 .53073 .562
Master Educator
Trainer .75707* .25700 .018
* The mean difference is significant at the 0.05 level.
Those with no training exhibited the highest mean score of normative beliefs,
while Master Educators held the highest mean score for subjective norm. See Figure 5 for
more detailed information. This interesting trend will be discussed in further detail in
Chapter 5.

64
Figure 7. Mean Normative Belief ERB Predictor Scale Scores by Leave No Trace Level.
(No Leave No Trace Training = 13.78; Leave No Trace Workshop = 13.30; Leave No
Trace Trainer = 13.05; Leave No Trace Master Educator = 13.12)
* Scores calculated by adding each item score for NQ1, NQ5, and NQ6. The highest
possible score is 18.
Control Attributes. The only statistically significant difference among Trainers
and Master Educators was found in self-efficacy scores. There was still a significant
difference in scores between those with no training and all levels of training, but there
was no significant difference in score between workshop participants and Master
Educators. Furthermore, the only significant difference in controllability scores was
found between those with no training and Trainers or Master Educators, but not between
those with no training and workshop participants. See Tables 11 and 12 for more detailed
information. Master Educators exhibited the highest scores overall in terms of both self-
0
2
4
6
8
10
12
14
16
18
No Training Workshop Trainer Master Educator

65
efficacy and controllability (16.06 and 14.81). Those with no training exhibited lowest
scores in terms of both self-efficacy and controllability (13.66 and 12.54). This
significant difference in self-efficacy scores between Trainers and Master Educators is
interesting, especially in that it is the only significant difference that was found between
Trainer and Master Educator scores.

66
Table 12
ANOVA Results of Self-Efficacy Scores
LNT Level (I) LNT Level (J) Mean Difference (I-J) Std. Error Sig.
Workshop -2.08322* .42617 .000
Trainer -1.81631* .20159 .000
No Training
Master Educator -2.40469* .20620 .000
No Training 2.08322* .42617 .000
Trainer .26691 .42695 .924
Workshop
Master Educator -.32148 .42914 .877
No Training 1.81631* .20159 .000
Workshop -.26691 .42695 .924
Trainer
Master Educator -.58838* .20781 .025
No Training 2.40469* .20620 .000
Workshop .32148 .42914 .877
Master Educator
Trainer .58838* .20781 .025
* The mean difference is significant at the 0.05 level.

67
Table 13
ANOVA Results of Controllability Scores
LNT Level (I) LNT Level (J) Mean Difference (I-J) Std. Error Sig.
Workshop -1.23422 .56129 .125
Trainer -1.96828* .26551 .000
No Training
Master Educator -2.25767* .27157 .000
No Training 1.23422 .56129 .125
Trainer -.73406 .56232 .560
Workshop
Master Educator -1.02345 .56520 .269
No Training 1.96828* .26551 .000
Workshop .73406 .56232 .560
Trainer
Master Educator -.28939 .27369 .716
No Training 2.25767* .27157 .000
Workshop 1.02345 .56520 .269
Master Educator
Trainer .28939 .27369 .716
* The mean difference is significant at the 0.05 level.
Results of ANOVA analyses indicate that although the difference in score
between those with no Leave No Trace training and all three levels of Leave No Trace
trainings was statistically significant, the differences in score among the various levels
was not significant. It was expected that there would be no significant difference between

68
Trainer and Master Educator scores, but there would be a statistically significant
difference between workshop participants and Trainers and/or Master Educators. Due to
the in-depth nature of Trainer and Master Educator courses and the corresponding
mastery involved, one would expect little to no difference in the scores of the two groups.
Even though there was no significant difference associated with varying levels of
training, there was a significant difference in the overall scores of those with Leave No
Trace training and those without, with Leave No Trace participants exhibiting higher
ERB Predictor Scale scores as predicted.
When each construct was measured separately, more interesting patterns emerged.
The most interesting trend occurred in normative belief scores. This score was the only
one measured in which those with Leave No Trace training exhibited lower scores than
those with no training at all. The questions included in this attribute were:
• NQ1: What my friends think is important to me.
• NQ5: My family’s opinions are not important to me.
• NQ6: I put emphasis on what my circle of friends and family believe.
This construct measures the strength of influence of peers on individual beliefs as
opposed the actual belief an individual possesses. The subjective norm measures the
positive or negative attitude toward a given behavior; these scores showed that those with
some level of Leave No Trace training exhibit a more positive attitude toward
environmental behavior as prescribed by their peers or significant others. While this is to
be expected, since theoretically, those who engage in training like Leave No Trace are in
closer contact with those who also exhibit environmentally responsible behavior, it is

69
curious that these same groups claim to put less emphasis on the beliefs of those around
them.
Intentions
Section 5 of the survey asked respondents to mark each behavior they intend to do
in the next 6 months. While this list was by no means exhaustive, it contained both
general and specific behaviors, as well as some that are available to nearly all the general
public and others that are only possible for a select few. The number of behaviors marked
by respondents was tabulated and used to represent intentions. See Table 19 for a
breakdown of inventory responses.
Interestingly, the number of behaviors marked by each group actually decreased
with each step up in training, as was indicated by the correlations in Table 13. Those with
no Leave No Trace training marked a mean of 16 behaviors; workshop participants
marked 12 behaviors; Trainers marked a mean of 10 behaviors, and Master Educators
marked mean of 9 behaviors. This is not what one would expect to see, however, there
are two possible explanations. One is that this reflects a more realistic vision of intended
behaviors as Leave No Trace training increases. Another is that there was some confusion
on whether the respondents were to mark all behaviors they intend to do, or only new
behaviors they intend to do. From comments the researcher received, most respondents
who expressed this confusion were either Trainers or Master Educators, although this fact
is purely anecdotal.

70
Table 14
Behavioral Inventory Results
Answer Options Response
Count Response Percent
Recycle 554 99.80%
Turn water off when not in use 549 98.90%
Reduce 535 96.40%
Reuse 535 96.40%
Buy less, or only what you need 485 87.50%
Buy local food & products 462 83.20%
Buy reusable instead of disposable 460 82.90%
Bike, walk, or carpool 434 78.20%
Talk to others about the environment 416 74.90%
Set thermostat or purchase programmable thermostat to reduce energy use 384 69.10%
Buy used instead of new 368 66.30%
Use CFLs or other energy saving devices 366 65.90%
Avoid using pesticides on my landscaping/garden 336 60.50%
Buy organic food & products 314 56.60%
Vote for environmentally friendly politicians 313 56.40%
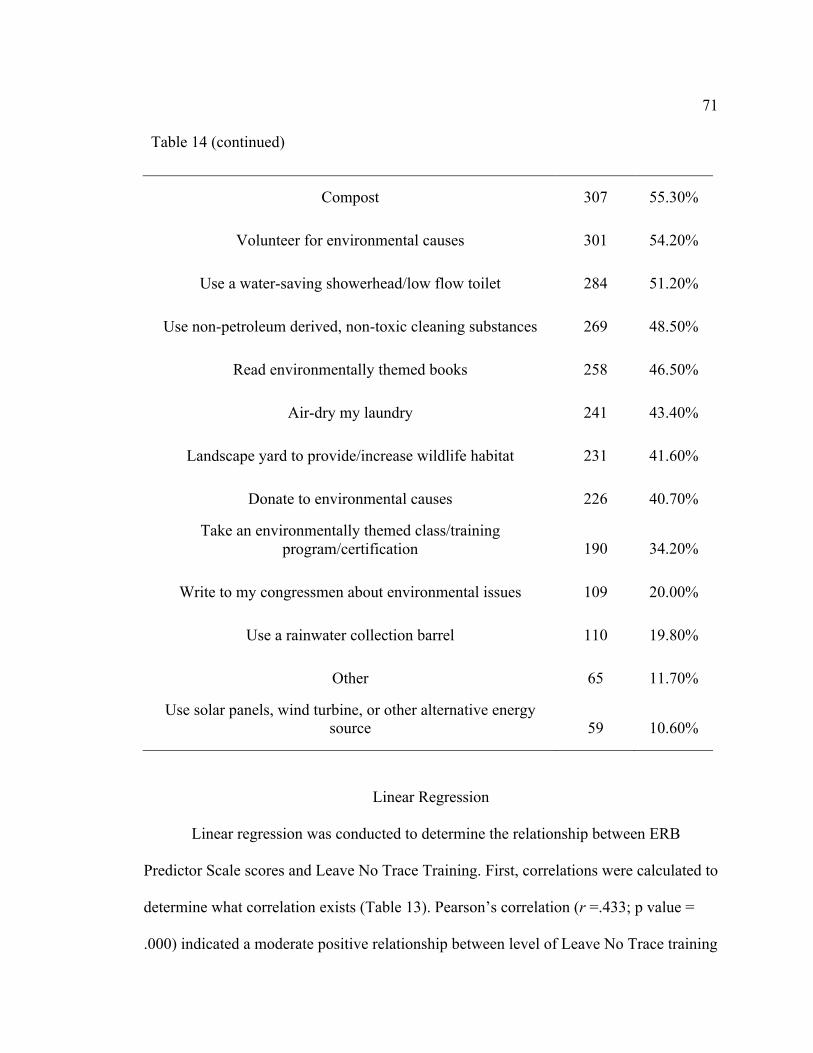
71
Table 14 (continued)
Compost 307 55.30%
Volunteer for environmental causes 301 54.20%
Use a water-saving showerhead/low flow toilet 284 51.20%
Use non-petroleum derived, non-toxic cleaning substances 269 48.50%
Read environmentally themed books 258 46.50%
Air-dry my laundry 241 43.40%
Landscape yard to provide/increase wildlife habitat 231 41.60%
Donate to environmental causes 226 40.70%
Take an environmentally themed class/training program/certification 190 34.20%
Write to my congressmen about environmental issues 109 20.00%
Use a rainwater collection barrel 110 19.80%
Other 65 11.70%
Use solar panels, wind turbine, or other alternative energy source 59 10.60%
Linear Regression
Linear regression was conducted to determine the relationship between ERB
Predictor Scale scores and Leave No Trace Training. First, correlations were calculated to
determine what correlation exists (Table 13). Pearson’s correlation (r =.433; p value =
.000) indicated a moderate positive relationship between level of Leave No Trace training

72
and ERBP Score. Furthermore, the B coefficient of 3.453 compared to the standard error
of .306 indicates that Leave No Trace training explains 10 times the variability than the
standard error. The equation established by coefficient B and its constant is: ERB
Predictor Scale Score = 77.76 +3.45(Level of Leave No Trace). According to confidence
intervals of 95%, one can expect the ERB Predictor Scale Score to increase by 2.85 to
4.05 points with each level of Leave No Trace training.
This simple linear regression analysis showed that there is a moderate positive
correlation between ERB Predictor Scale Score and level of Leave No Trace training. In
fact, according to the coefficient of determination (r2 = .188), 18.8% of the variation in
ERB Predictor Scale scores can be attributed to varying levels of Leave No Trace
training. With 95% confidence, one can expect the ERB Predictor Scale Score to increase
by 2.85 to 4.05 points with each level of Leave No Trace training. This indicates that
there are certainly other factors at play, however Leave No Trace does have an impact on
scores, and presumably the likelihood that someone will engage in Environmentally
responsible behaviors. Analyzing separate data of those who are newer to the Leave No
Trace programs or who have just been introduced to the concepts of Leave No Trace may
reveal a higher correlation.
Using nested models, further regressions illuminated the role that Leave No Trace
and other factors play in an individual’s intentions, as tabulated from the behavior
inventory in Section 5 of the survey. In the first set of nested models, level of Leave No
Trace is included in Model 2 (see Tables 15 and 16). The following nested models did
not use varying levels of Leave No Trace, only whether the respondent had participated
73
in any level of Leave No Trace or not (see Tables 17, 18, 19 and 20). Thus, in Table 14
below, “LNT Training” indicates those who have completed any level of Leave No Trace
training.
These correlations indicate that level of Leave No Trace training has strong
positive correlations with age and education (r = .448 and r = .614 respectively), a weak
positive correlation with sex (r =.161), and strong negative correlation with intentions (r
= -.505). This implies that as levels of Leave No Trace increase, participants are likely to
be older and have higher levels of education, are slightly more likely to be male, and are
less likely to express environmentally responsible intentions, as previously mentioned.
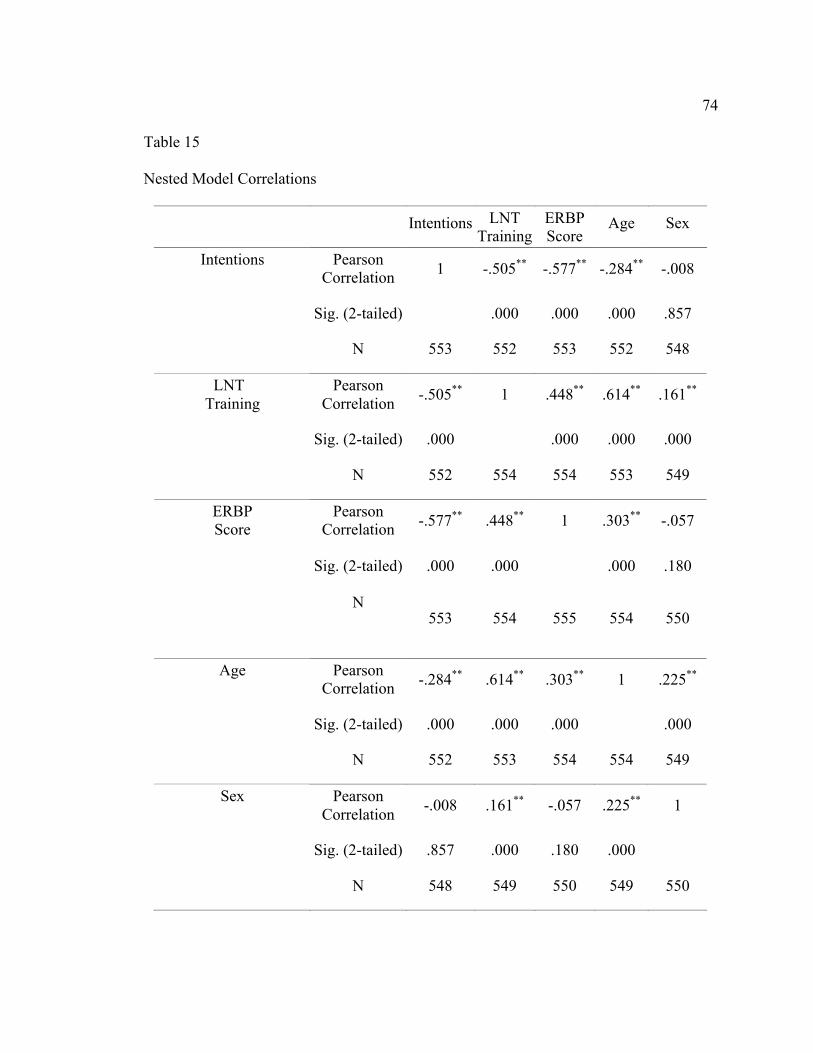
74
Table 15
Nested Model Correlations
Intentions LNT Training
ERBP Score
Age Sex
Pearson Correlation 1 -.505** -.577** -.284** -.008
Sig. (2-tailed) .000 .000 .000 .857
Intentions
N 553 552 553 552 548
Pearson Correlation -.505** 1 .448** .614** .161**
Sig. (2-tailed) .000 .000 .000 .000
LNT Training
N 552 554 554 553 549
Pearson Correlation -.577** .448** 1 .303** -.057
Sig. (2-tailed) .000 .000 .000 .180
ERBP Score
N
553 554 555 554 550
Pearson Correlation -.284** .614** .303** 1 .225**
Sig. (2-tailed) .000 .000 .000 .000
Age
N 552 553 554 554 549
Pearson Correlation -.008 .161** -.057 .225** 1
Sig. (2-tailed) .857 .000 .180 .000
Sex
N 548 549 550 549 550

75
Table 15 (continued)
Pearson Correlation -.193** .319** .145** .177** .070
Sig. (2-tailed) .000 .000 .001 .000 .103
Education
N 552 553 554 553 549
Pearson Correlation -.568** .416** .838** .259** -.064
Sig. (2-tailed) .000 .000 .000 .000 .133
Behavioral Attributes
N 553 554 555 554 550
Pearson Correlation -.282** .189** .729** .103* -.012
Sig. (2-tailed) .000 .000 .000 .015 .788
Normative Attributes
N 553 554 555 554 550
Pearson Correlation -.522** .453** .830** .352** -.059
Sig. (2-tailed) .000 .000 .000 .000 .170
Control Attributes
N 553 554 555 554 550
** Correlation is significant at the 0.01 level (2-tailed). * Correlation is significant at the 0.05 level (2-tailed).
In the first nested model regression, run on both data sets combined, the
dependent variable was intentions. Model 1 consisted of Leave No Trace training, and
Model 2 consisted of age, sex, and education. Models 3, 4, and 5 consist of normative
attributes, behavioral attributes, and control attributes respectively. Results showed that
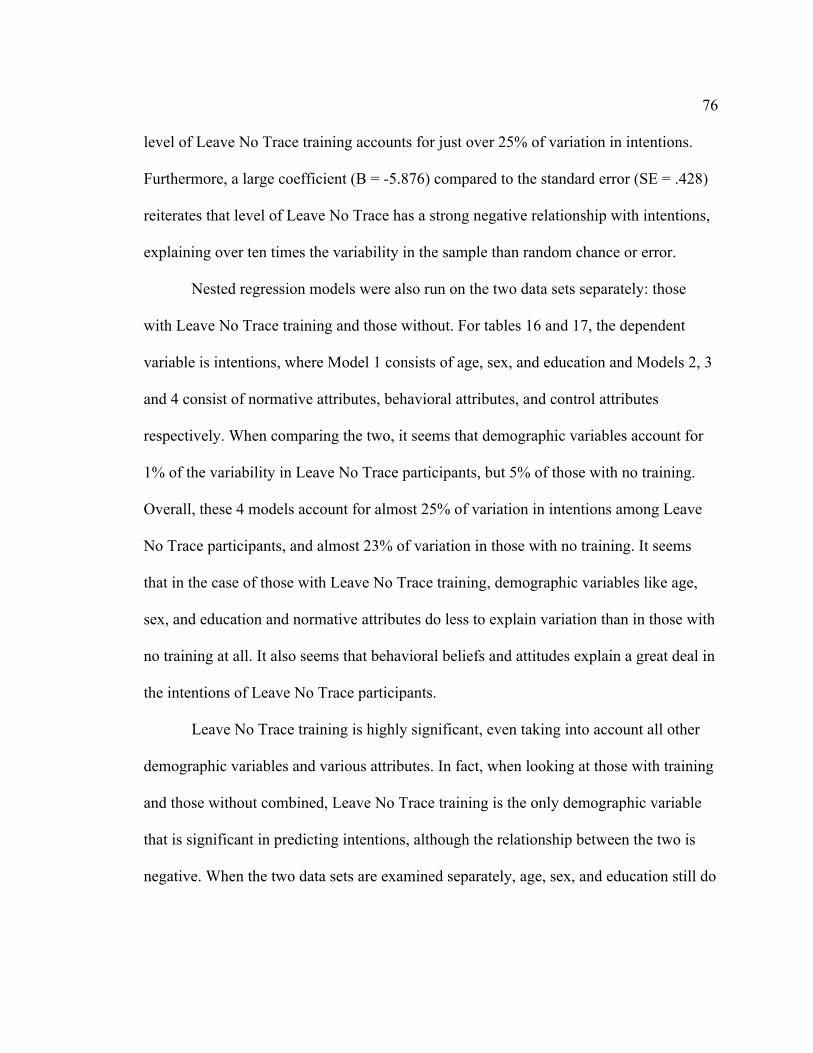
76
level of Leave No Trace training accounts for just over 25% of variation in intentions.
Furthermore, a large coefficient (B = -5.876) compared to the standard error (SE = .428)
reiterates that level of Leave No Trace has a strong negative relationship with intentions,
explaining over ten times the variability in the sample than random chance or error.
Nested regression models were also run on the two data sets separately: those
with Leave No Trace training and those without. For tables 16 and 17, the dependent
variable is intentions, where Model 1 consists of age, sex, and education and Models 2, 3
and 4 consist of normative attributes, behavioral attributes, and control attributes
respectively. When comparing the two, it seems that demographic variables account for
1% of the variability in Leave No Trace participants, but 5% of those with no training.
Overall, these 4 models account for almost 25% of variation in intentions among Leave
No Trace participants, and almost 23% of variation in those with no training. It seems
that in the case of those with Leave No Trace training, demographic variables like age,
sex, and education and normative attributes do less to explain variation than in those with
no training at all. It also seems that behavioral beliefs and attitudes explain a great deal in
the intentions of Leave No Trace participants.
Leave No Trace training is highly significant, even taking into account all other
demographic variables and various attributes. In fact, when looking at those with training
and those without combined, Leave No Trace training is the only demographic variable
that is significant in predicting intentions, although the relationship between the two is
negative. When the two data sets are examined separately, age, sex, and education still do

77
not significantly predict intentions, although they do explain more variation in intentions
in those with no training than those with any level of Leave No Trace training.
Normative attributes, in all sets of regression models, are initially significant in
predicting intentions. However, this significance disappears once behavioral and control
beliefs are accounted for. Behavioral and control beliefs are both significant in predicting
intentions and are negatively associated, indicating that higher behavioral and control
attribute scores correlate with lower levels of intentions. Normative attributes are also
negatively associated, except in those with Leave No Trace training as examined
separately, and only when behavioral and control attributes are included. This supports
the idea that for those with Leave No Trace training, normative beliefs play a much
smaller role in their behavioral intentions overall.
However the absence of significance associated with normative attributes across
all 3 nested models suggests that normative attributes play a smaller role overall than
both behavioral and control attributes. In other words, the opinions of friends and family
are not as important in an individual’s behavioral intentions as behavioral and control
attributes. Of course, normative attributes can also affect behavioral beliefs and attitudes,
and because all of these constructs are self-reported, the level of self-awareness an
individual possesses about how their peers truly affect their behavior and associated
beliefs and attitudes is difficult, if not impossible, to separate and assess.

78
Table 16
Intentions Regression
Model 1 Model 2 Model 3 Model 4 Model 5
Variable
Intercept 16.124*** 14.852*** 21.130*** 32.313*** 34.782***
LNT Training -5.876*** -6.244*** -5.832*** -4.273*** -3.802***
Age .164 .151 .169 .252
Sex .838 .753 .217 .010
Education -.069 -.075 -.053 -.054
Normative Attrib. .242*** -.058 -.013
Behavioral Attrib. -.518*** -.415***
Control Attrib. -.247***
R2 25.6% 27.2% 29.9% 40.1% 42.3%
Adjusted R2 .254 .266 .292 .401 .415
n = 554 * p < .05 ** p < .01 *** p < .001

79
Table 17
Intentions Regression (Leave No Trace Training)
Model 1 Model 2 Model 3 Model 4
Variable
Intercept 8.774*** 14.152*** 30.158*** 33.211***
Age .263 .244 .192 .288
Sex .486 .514 .048 -.100
Education -.045 -.048 -.028 .030
Normative Attrib. -.239*** -.043 .016
Behavioral Attrib. -.607*** -.499***
Control Attrib. -.275***
R2 1.1% 4.6% 21.0% 24.5%
Adjusted R2 .003 .037 .199 .232
n = 368 * p < .05 ** p < .01 *** p < .001

80
Table 18
Intentions Regression (No Leave No Trace Training)
Model 1 Model 2 Model 3 Model 4
Variable
Intercept 16.314*** 23.540*** 31.465*** 33.749***
Age -.351 -.273 .110 .114
Sex 1.763 1.436 .756 .458
Education -.666 -.823 -.791 -.721
Normative Attrib. -.255 -.080 -.058
Behavioral Attrib. -.414*** -.319**
Control Attrib. -.207
R2 5.0% 9.0% 20.5% 22.7%
Adjusted R2 .033 .069 .183 .201
n = 168 * p < .05 ** p < .01 *** p < .001
Nested models were also used to determine the strength of the relationship
between control attributes, or perceived behavioral control, in all respondents, Leave No
Trace participants, and those with no training. In the case of all respondents, Model 1 was
Leave No Trace training and Model 2 was age, sex, and education. Models 3 and 4 were
normative attributes, and behavioral attributes respectively. Regression results indicated
that just over 20% of the variability in control attributes can be explained by level of
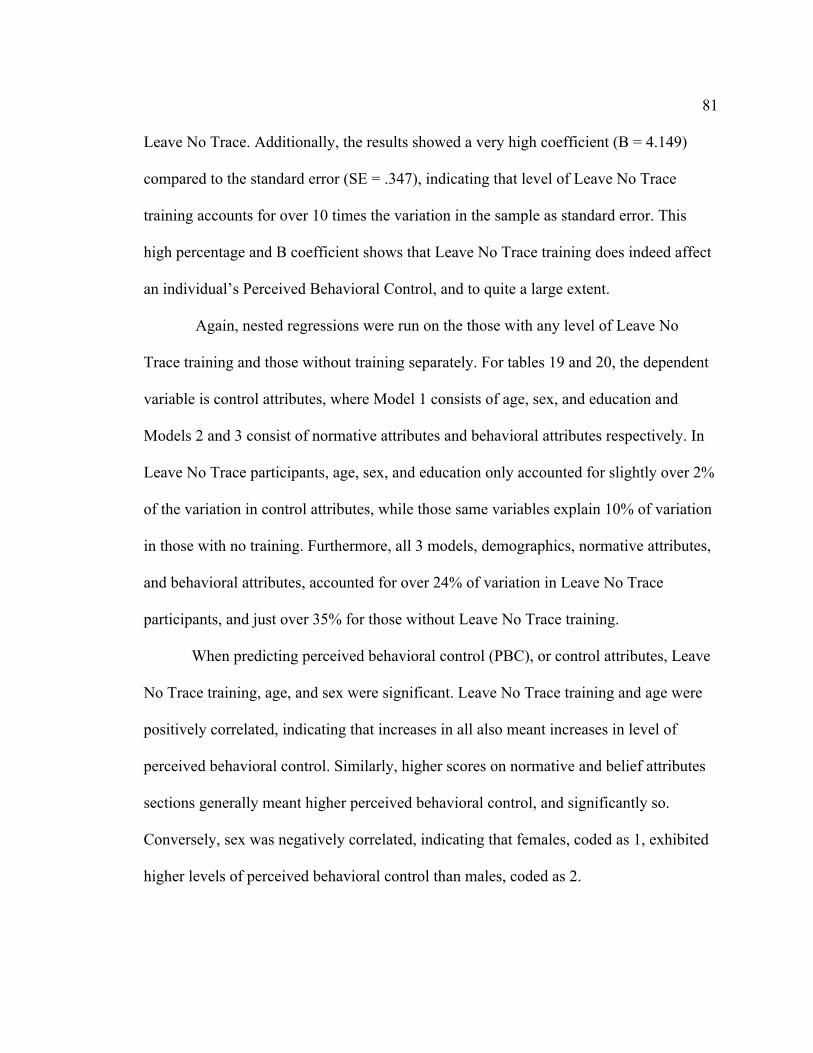
81
Leave No Trace. Additionally, the results showed a very high coefficient (B = 4.149)
compared to the standard error (SE = .347), indicating that level of Leave No Trace
training accounts for over 10 times the variation in the sample as standard error. This
high percentage and B coefficient shows that Leave No Trace training does indeed affect
an individual’s Perceived Behavioral Control, and to quite a large extent.
Again, nested regressions were run on the those with any level of Leave No
Trace training and those without training separately. For tables 19 and 20, the dependent
variable is control attributes, where Model 1 consists of age, sex, and education and
Models 2 and 3 consist of normative attributes and behavioral attributes respectively. In
Leave No Trace participants, age, sex, and education only accounted for slightly over 2%
of the variation in control attributes, while those same variables explain 10% of variation
in those with no training. Furthermore, all 3 models, demographics, normative attributes,
and behavioral attributes, accounted for over 24% of variation in Leave No Trace
participants, and just over 35% for those without Leave No Trace training.
When predicting perceived behavioral control (PBC), or control attributes, Leave
No Trace training, age, and sex were significant. Leave No Trace training and age were
positively correlated, indicating that increases in all also meant increases in level of
perceived behavioral control. Similarly, higher scores on normative and belief attributes
sections generally meant higher perceived behavioral control, and significantly so.
Conversely, sex was negatively correlated, indicating that females, coded as 1, exhibited
higher levels of perceived behavioral control than males, coded as 2.

82
Although education was not a significant predictor in any of the regression models, it is
noteworthy that it had a negative association with perceived behavioral control overall, in
that higher levels of education meant lower perceived behavioral control scores. This
held true for the entire data set (both those with training and those without), and for those
with Leave No Trace training separately, but not for those with no training, for whom
higher education levels meant higher perceived behavioral control.
When the data sets were analyzed separately, sex became an important predictor.
In those with Leave No Training, females still exhibited higher levels of perceived
behavioral control, although sex was not a significant predictor. However, in those with
no training at all, sex was a significant predictor, with females continuing to exhibit
higher levels of perceived behavioral control.

83
Table 19
Control Attributes Regression
Model 1 Model 2 Model 3 Model 4
Variable
Intercept 26.204 27.570 19.108 10.101
LNT Training 4.149** 3.725** 3.178** 1.759**
Age .333** .352*** .387**
Sex -1.384*** 1.282*** -1.087***
Education .007 -.014 -.004
Normative Attrib. .329*** .180***
Belief Attrib. .417***
R2 20.5% 24.4% 32.5% 43.3%
Adjusted R2 .204 .239 .319 .427
n = 554 * p < .05 ** p < .01 *** p < .001
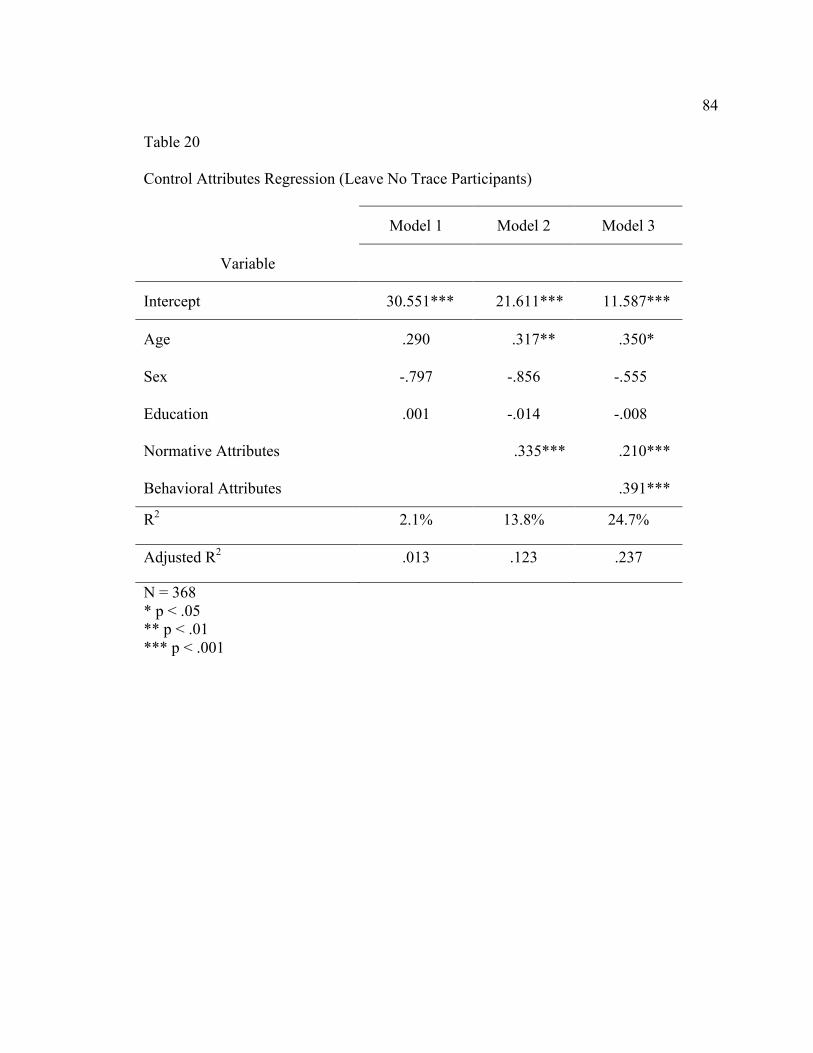
84
Table 20
Control Attributes Regression (Leave No Trace Participants)
Model 1 Model 2 Model 3
Variable
Intercept 30.551*** 21.611*** 11.587***
Age .290 .317** .350*
Sex -.797 -.856 -.555
Education .001 -.014 -.008
Normative Attributes .335*** .210***
Behavioral Attributes .391***
R2 2.1% 13.8% 24.7%
Adjusted R2 .013 .123 .237
N = 368 * p < .05 ** p < .01 *** p < .001

85
Table 21
Control Attributes Regression (No Leave No Trace Training)
Model 1 Model 2 Model 3
Variable
Intercept 28.367*** 19.891*** 11.108***
Age .534 .447 .006
Sex -2.588*** -2.201*** -1.459**
Education .188 .372 .340
Normative Attributes .298*** .105
Behavioral Attributes .460***
R2 10.1% 17.1% 35.2%
Adjusted R2 .086 .153 .334
n = 168 * p < .05 ** p < .01 *** p < .001
Overall, it seems that Leave No Trace accounts for a fairly large part of variation
within the data collected. While the relationship between intentions and Leave No Trace
is curious, it is still clear that a relationship does exist between Leave No Trace training
and intentions as well as ERB Predictor score and Perceived Behavioral Control.

86
CHAPTER 5: SUMMARY, DISCUSSION, LIMITATIONS, AND
RECOMMENDATIONS
The Leave No Trace curriculum is focused solely on conveying information
related to reducing the impact of backcountry recreation. While the limited scope of this
curriculum has certainly contributed to the spread and success of the Leave No Trace
message, the question of the program’s ability to transcend the backcountry is of great
interest. It stands to be reiterated that the intent of this study was in no way to encourage
Leave No Trace to alter its curriculum or focus in any way, or suggest changes, but rather
to evaluate the current program or idea of Leave No Trace as it exists. The notion of
expanding the current curriculum to address everyday behaviors is of great interest in
research and dialogue, and certainly will be of great debate in the years to come.
Discussion
1. Is the ERB Predictor Scale a reliable tool?
Reliability analysis of the scale by each sub-domain revealed a Cronbach’s alpha
of .719, an acceptable measure of internal reliability. Deletion of either the behavioral
attribute or normative attribute section would bring Cronbach’s alpha down to about .54
and .59 respectively, while deletion of control attributes would raise the Cronbach’s alpha
by .17. While this is not enough to consider dropping the section altogether, it does
indicate that perhaps this section deserves a second look before the scale is implemented
again. This is supported by EFA results, which indicated that two control attribute items,
both designed to address self-efficacy, did not load on any of the five factors extracted
and rotated.
87
Factor analysis further indicates that the scale seems to address each of the 3 sub-
domains fairly well, as the three strongest factors extracted represent each of the three
sub-domains (behavioral, normative, and control attributes). However, this analysis also
provided some room for improvement. While it seems that the scale measures
controllability and behavioral belief effectively, with all items loaded onto one stable
factor, it scale does not seem to address self-efficacy, as indicated by those items not
loading onto any factors. These items (BQ6, CQ1, and CQ4) are ones that should perhaps
be reevaluated before the scale is implemented again.
Based on the results of reliability and factor analysis, the scale seems to be
moderately reliable, and with the suggested changes, implementation, and further
revision, this reliability can be improved even further.
2. Do higher levels of Leave No Trace training correspond with higher ERB
scores?
Results of ANOVA analyses indicate that although the difference in score
between those with no Leave No Trace training and all three levels of Leave No Trace
trainings was statistically significant, the differences in score among the various levels
was not. It was expected that there would be no significant difference between Trainer
and Master Educator scores, but there would be a statistically significant difference
between workshop participants and Trainers or Master Educators. This may be due to the
low response rate of workshop participants; additionally, those workshop who did
respond are likely those who had the most invested in the program or who got the most

88
out of it, so scores could be slightly inflated from this group. Due to the in-depth nature
of Trainer and Master Educator courses and the corresponding mastery involved, one
would expect little to no difference in the scores of the two groups. Even though there
was no significant difference associated with varying levels of training, there was a
significant difference in the overall scores of those with Leave No Trace training and
those without, with Leave No Trace participants exhibiting higher ERB Predictor Scale
scores as predicted.
When each construct was measured separately, more interesting patterns emerged.
The most interesting trend occurred in normative belief scores. This score was the only
one measured in which those with Leave No Trace training exhibited lower scores than
those with no Leave No Trace training. At first glance it is curious that Trainers and
Master Educators seem to put less emphasis on the beliefs of those around them,
however, they also tend to be the oldest and most educated groups; therefore, it can be
surmised that their beliefs and attitudes are already well-conceptualized, and the opinions
of others will have a smaller effect on their own beliefs and attitudes. In this case, the
effect of age and education level is clearly at play, in addition to Leave No Trace training.
Behavioral beliefs, defined as those an individual holds with regard to the
consequences of a given behavior and the probability that a given behavior can affect
change, were significantly higher in workshop participants than those with no training.
This is to be expected, as, in accordance with the Hines et al. (1986) model of ERB,
increased knowledge of environmental issues can affect beliefs, although it does not
necessarily increase intention. However, it is also interesting to note that although the

89
differences in mean scores for Trainers and Master Educators were not necessarily
statistically significant, they were actually lower than the mean score of workshop
participants. This could be attributed, again, to the low turnout of workshop participants
and the likelihood that those who did respond are those who gained the most out of the
experience. It could also be picking up on another interesting phenomenon. Because
environmental issues are extremely complex and exceedingly large, more knowledge can
sometimes lead to a drop in an individual’s feeling that a given behavior is effective. This
is not to be confused with an individual’s feeling that they themselves are capable of
change, but rather that the behavior itself is ineffective, not that they themselves are
incapable. For example, recycling is arguably one of the most common environmental
behaviors. Certainly it is much better the recycle a plastic bottle or aluminum can than to
throw it away, however, as one learns more about the process of recycling, it becomes
apparent that recycling has it limits and may not be as effective as one had originally
thought. While this new knowledge may not stop an individual from recycling, it could
have an impact on their belief that it is an effective way to reduce resource use.
Linear regression analysis showed that level of Leave No Trace training
accounted for a rather large amount of the variability in ERB Predictor Scale scores. This
indicates that there are certainly other factors at play, but also that Leave No Trace may
indeed have a measurable impact on ERB. More detailed regressions indicated that there
was also a relationship between taking any Leave No Trace course and both intentions
and control attributes (see Research Question 3 below).

90
3. To what extent do Leave No Trace Principles apply to environmentally
responsible decision making in everyday life?
While ANOVA results showed that there were statistically significant differences
between those with training and those without in terms of ERB Predictor Scores, linear
regression uncovered a negative correlation between Leave No Trace training and
behavioral intentions; this, however, is a curious outcome, possibly due either to
confusion about the survey or indicative of a sense of realism on the part of older, more
educated Trainers and Master Educators, or a sense of inflated intentions and naïveté on
the part of those with no training, who happen to be younger and less educated. At this
time, it is difficult to ascertain the extent of the relationship between Leave No Trace
training and everyday behavior. Further clarification of the scale and survey will be able
to elucidate this relationship and determine how to control for the sense of realism or
naïveté in the sample.
4. Do those with higher levels of Leave No Trace training also exhibit higher
Perceived Behavioral Control with regard to everyday environmental behavior?
ANOVA results of the total ERB Predictor Scale score did not indicate significant
differences over all among varying levels of Leave No Trace training. However, the only
statistically significant difference between Trainers (mean score =15.47) and Master
Educator (mean score = 16.06) scores occurred in self-efficacy. This, perhaps, is due to
the more in-depth nature of the 5-day field-based Master Educator course, although it
could also be indicative of a generally older, more educated, and more experienced
population. However, there was no significant difference in scores between workshop

91
participants and Master Educators, with the workshop participants exhibiting a higher
mean score than the Trainer group. This could also be attributed to the poor response rate
of workshop participants.
Regression results indicated that Leave No Trace programs explained over 20%
of the variation in control attributes among all respondents independently of age, sex, and
education, and had a moderately strong correlation. This supports the ANOVA results
that indicated that higher levels of Leave No Trace training do indeed result in higher
feelings of self-efficacy with regard to environmental behavior. Additionally, Leave No
Trace was a significant predictor in Perceived Behavioral Control when accounting for
other demographic variables and attributes. Interestingly, however, increasing levels of
education in those with Leave No Trace training resulted in lower feelings of perceived
behavioral control; this, again, could be touching on an element of realism in
environmental behavior that increases with more knowledge of general environmental
issues.
In summary, this study showed moderate to strong correlations between Leave No
Trace training of any level and ERB Predictor Scores, Intentions, and self-efficacy. While
it did not capture significant difference between levels of Leave No Trace outside of self-
efficacy, it did show that Leave No Trace programs have the potential to affect change in
everyday behavior in addition to backcountry behavior. Although the data collected on
intentions in this study were not entirely helpful or useful in answering to what extent
Leave No Trace applies to everyday life, it is clear that a relationship exists, and future
research can clarify the survey in order to capture a more clear picture on whether this

92
was anomaly, or whether age, education, and Leave No Trace training instill a sense of
realism in an individual’s perception of behavioral intentions. Regardless, this study
affirms that there is indeed a relationship between Leave No Trace principles and
everyday environmental behavior.
Limitations
The primary intent of this study is to serve as a pilot study for the
Environmentally Responsible Behavior Predictor Scale (ERB Predictor Scale); as such,
the actual scores reported by the four groups may not be statistically reliable. However,
the researcher still holds that the information gained about Leave No Trace will add to
the literature and provide a good base for further study in this line of research. In the
future, pre/post/follow-up studies using the ERB Predictor Scale could provide a clearer
picture of the factors at play in Leave No Trace programming and elucidate confounding
factors. Limitations for this study are:
1. Only Ohio University students in those classrooms chosen were able to
participate.
2. Researchers were not present at the time of administering to field questions or
provide instruction; however, the primary investigator was be available via e-
mail to answer potential questions.
3. Survey fatigue could have affect responses.
4. All behavior beliefs, attitudes, and intentions were self-reported.
5. The response rate for Leave No Trace workshop participants was very low.
6. Confusion in the intentions sections of the survey may have led to misleading

93
data.
7. Because many participants have registered for the Leave No Trace training of
their own volition, the scores reported may not necessarily reflect the training
itself in isolation, but other compounding variables in the individuals’ lives.
Nested regression models helped to reduce this to a certain extent, but
certainly not fully.
Because the primary intent of this study was to serve as a pilot study for the
Environmentally Responsible Behavior Predictor Scale, the actual scores reported by the
four groups may not be statistically reliable; with this in mind, the researcher still holds
that the information gained about Leave No Trace will provide a good base for further
study in this line of research. Additionally, the results cannot answer questions related to
the impact of Leave No Trace training on everyday environmental behavior. Use of
Exploratory Factor Analysis, by its very nature, did not provide confirmatory results.
EFA results are notoriously subject to heavy interpretation by the researcher, especially
those obtained by Principal Axis Factoring. Because of this, these results are exploratory
only, however they did help to elucidate the underlying factors of the survey items, as
previously discussed. Further studies using various types of extraction and rotation or
Confirmatory Factor Analysis can further describe the factors involved in Leave No
Trace and every day environmental behavior.
The lack of response on the part of Awareness workshop participants and the
small sample size of the group made it difficult to accurately compare it to the other
groups. This response was a surprise to the researcher, who had expected the smallest

94
turn-out from Master Educators; generally speaking, Master Educators comprise the
smallest group overall of those with Leave No Trace training, with only 2500 worldwide.
However, Master Educators represented almost 30% of the sample. Additionally, all
respondents with no Leave No Trace training were students at Ohio University; a more
diverse baseline group will assist in providing a more thorough and representative picture
in the future.
The behavioral inventory in Section 7 of the survey also raised some concern.
There seemed to be some confusion as to whether the section intended for the
respondents to mark all behaviors in which they intend to engage, or only new behaviors
they plan to add to their current behaviors; this could explain why intentions seem to
decrease with increasing level of Leave No Trace training. The list provided is by no
means comprehensive, as listing every environmentally responsible behavior is difficult,
if not impossible. Furthermore, some behaviors that are deemed “responsible” by one
individual may not be considered “responsible” according to another individual’s
environmental beliefs.
Additionally, the behavioral inventory portion of the survey requested a self-
report of the respondents’ behaviors, which, in accordance with TPB, does not
necessarily equate to actual behavior. In order to gain a clearer picture of changes in
behavior, a follow up study in conjunction with a pre-course study could be beneficial;
additionally, long-term behavior logs, much like food or waste logs, could allow for more
detailed analysis pre- and post- Leave No Trace course, as well as follow-up.

95
Recommendations for Future Research
While this study did not necessarily provide a full answer with regard to the
applicability of Leave No Trace to everyday life, it provides a solid starting point from
which future research can choose from many opportunities to follow. Multiple
possibilities can be explored in order to elucidate the factors and variables at play in the
relationship between Leave No Trace principles and daily life. Further administrations of
the survey to a wider variety of individuals will also assist in refining the scale itself and
eliminating redundancy within the tool, and clarification of the intentions section should
clear up confusion, allowing a more clear story of the relationship between Leave No
Trace training and behavioral intentions to surface.
In order to replicate the study to further elucidate factors involved in the
application of Leave No Trace to everyday behavior, three items (BQ1, CQ4, CQ6) will
be revised. Also, the intentions section will be revised to include scalar responses rather
than a yes-no dichotomy. This will provide a more complete continuum of behavior for
each activity listed and a better spectrum of environmental behavioral intentions.
Respondents will be asked to mark how frequently they intend to engage in the listed
behaviors in the next 6 months, where 1 = Never, 2 = Very Rarely, 3 = Rarely, 4 =
Occasionally, 5 = Frequently, and 6 = Very Frequently. The revised survey will be
administered to the general population at Ohio University, to catch any glaring issues
before being administered again to Leave No Trace participants.
A summary of the findings of this study will be sent to Leave No Trace and with
their permission, the next study will move forward. Another important factor to address is

96
the response rate of workshop participants. Seeking the advice of Leave No Trace on this
is key, and with their suggestions, hopefully this response can be increased. A question
regarding the duration of the workshop will be included for these participants; because
the format for workshops is not as consistent from course to course, as it is with Trainer
and Master Educator training, this will provide a more detailed picture of Leave No Trace
workshops and their ability to affect behavioral change. Of course, the quality of
instruction also varies from course to course, across all levels of training, but cannot be
controlled for and should not pose significant issues.
Once the internal and external reliability of the scale is stable, the researcher
hopes that the scale can be administered to each level of training before, after, and 6
months following their course, in order to more precisely capture the effect of Leave No
Trace on their everyday behavior. Additionally, the effect of Leave No Trace can be
difficult to extrapolate out of individuals who have been involved in outdoor recreation
for many years and have been attuned to environmental issues. For this reason, another
demographic variable will be included to ascertain the years of outdoor recreation
experience a respondent possesses. By comparing the effect of a Leave No Trace on new
outdoor recreationalists and veteran outdoorsmen and women, this next study can provide
a clear picture on who is most affected by Leave No Trace programs.
An entire set of qualitative data on the applicability of Leave No Trace principles
was obtained through this study that was not analyzed. As an ongoing project, this data
will be analyzed to gain insight on what principles may be most applicable to everyday
behavior, and to gain an overall picture on how Leave No Trace participants have used

97
their Leave No Trace education to increase other behaviors, if at all. Once this data is
analyzed, and missing factors and further questions are identified, the researcher will
proceed with other qualitative methods accordingly.
Another interesting avenue for future study involves a closer look at the
curriculum of each level of Leave No Trace training. Analysis of these curricula and their
specific learning outcomes, objectives, teaching methods, and philosophical
underpinnings could shed light on what aspects of daily life the programs are most likely
to influence behavior, both in the backcountry and every day life.

REFERENCES
Ajzen, I. (1985). From intentions to actions: A theory of planned behavior. In J. Kuhl &
J. Beckman (Eds.), Action-control: From cognition to behavior (pp. 11- 39).
Heidelberg, Germany: Springer.
Ajzen, I. (1991). The Theory of Planned Behavior. Organizational Behavior and Human
Decision Processes, 50, 179-211.
Ajzen, I. (2002). Perceived behavioral control, self-efficacy, locus of control, and the
theory of planned behavior. Journal of Applied Social Psychology, 32, 665-683.
Ajzen, I., & Fishbein, M. (1980). Understanding attitudes and predicting social behavior.
Englewood Cliffs, NJ: Prentice-Hall.
Anastasi, A. (1988). Psychological testing (6th ed.). New York: Macmillan.
Baer, D.J., Smoking attitude, behavior, and beliefs of college males. Journal of Social
Psychology. 68: 65-78.
Bamberg, S., & Moser, G. (2007). Twenty years after Hines, Hungerford, and Tomera: A
new meta-analysis and psycho-social determinants of pro-environmental
behavior. Journal of Environmental Psychology, 27. 14-25.
Bandura, A. (1977). Self-efficacy: Toward a unifying theory of behavioral change.
Psychological Review, 84, 191-212.
Bandura, A. (1997). Self-efficacy: The exercise of control. New York: Freeman.
Bandura, A., Adams, N. E., Hardy, A. B., & Howells, G. N. (1980). Tests of the
generality of self-efficacy theory. Cognitive Theory and Research, 4, 39-66.
99
Bechtel, R.B. (1997). Environment & Behavior: An introduction. Thousand Oaks, CA:
SAGE Publications, 107-127.
Boerschig, S. & DeYoung, R. (1993). Evaluation of selected recycling curricula.
Educating the green citizen. The Journal of Environmental Education, 24(3). 17-
22.
Bogner, F.X. (1998). The influence of short-term outdoor ecology education on long-
term variables of environmental perspective. The Journal of Environmental
Education, 29(4), 17-29.
Bruner, J.S., (1957). On perceptual readiness. Psychological Review, 64, 123-152.
Caltabiano, N. J., & Caltabiano, M. L. (1995). Assessing environmentally responsible
behaviour. Psychological Reports, 76(3), 1080.
Cortina, J. M. (1993). What is coefficient alpha? An examination of theory and
applications. Journal of Applied Psychology, 78, 98- 104.
Costello, A.B., & Osborne, J.W. (2005). Best practices in Exploratory Factor Analysis:
Four recommendations for getting the most out of your analysis. Practical
Assessment, Research and Evaluation, 10(7), 1-9.
Cottrell, S. P. (2003). Influence of sociodemograhics and environmental attitudes on
general responsible environmental behavior among recreational
boaters. Environment & Behavior, 35(3), 347.
100
Cronbach, L. J. (1951). Coefficient alpha and the internal structure of tests.
Psychometrika, 16(3), 297-334.
Daniels, M.L., & Marion, J.L. (2005). Communicating Leave No Trace ethics and
practices: Efficacy of two-day trainer courses. Journal and Park and Recreation
Administration, (23)4. 1-19.
DeVellis, R. F. (2003). Scale development: Theory and applications (2nd ed.). Thousand
Oaks, CA: Sage.
De Young, R. (2000). Expanding and evaluating motives for environmentally responsible
behavior. Journal of Social Issues, 56(3), 509-526.
Dunlap, R.E., & Van Liere, K.D. (1978). The “new environmental paradigm.” Journal of
Environmental Education, 9(4), 10-19.
Field, A. (2005). Discovering statistics using SPSS, 2nd Edition. Thousand Oaks, CA:
SAGE Publications.
Fishbein, M., & Ajzen, I. (1975). Belief, attitude, intention, and behavior: An
introduction to theory and research. Reading, MA: Addison-Wesley.
Foresta, R.A. (1985). America's National Parks and Their Keepers. Washington:
Resources for the Future.
Gorsuch, R. L. (1983). Factor analysis (2nd ed.). Hillsdale, NJ: Lawrence Erlbaum.

101
Gotch, C. & Hall, T., (2004). Understanding nature-related behaviors among children
through a Theory of Reasoned Action approach. Environmental Education
Research: 10(2). 157-177.
Hines, J. M., Hungerford, H. R., & Tomera, A. N. (1986). Analysis and synthesis of
research on responsible environmental behavior: A meta-analysis. Journal of
Environmental Education, 18(2),1.
Hungerford, H.R., & Volk, T.L. (1990). Changing learner behavior through
environmental education. The Journal of Environmental Education, 21(3), 8-21.
Hutcheson, G., & Sofroniou, N. (1999). The multivariate social scientist: Introductory
statistics using generalized linear models. Thousand Oaks, CA: Sage
Publications.
Hwang, Y.H., Kim, S. & Jeng, J. (2000). Examining the causal relationships among
selected antecedents of responsible environmental behavior. The Journal of
Environmental Education, 31(4), 19-25.
Iwata, O. (2001). Attitudinal determinants of environmentally responsible behavior.
Social Behavior & Personality: An International Journal, 29(2), 183.
Leave No Trace About Us. (n.d.). Mission Statement. Retrieved on October 12, 2009
from http://www.lnt.org/aboutUs/index.php
Leave No Trace About Us. (n.d.). Sustainability Ethos. Retrieved on October 12, 2009
102
from http://www.lnt.org/aboutUs/sustainability.php
Leave No Trace Programs (n.d.). Principles. Retrieved on October 12, 2009 from
http://www.lnt.org/programs/principles.php
Leave No Trace Training. (n.d.). Training. Retrieved on October 12, 2009 from
http://www.lnt.org/training/index.php
Ledesma, R.D. & Valero-Mora, P. (2007). Determining the Number of Factors to Retain
in EFA: An easy-to-use computer program for carrying out Parallel Analysis.
Practical Assessment Research & Evaluation, 12(2).
Lewis, M. (2007). American wilderness: A new history. New York, NY: Oxford
University Press. 6-10, 35-51.
Madden, T.J., Ellen P.S., & Ajzen, I. (1992). A comparison of the Theory of Planned
Behavior and the Theory of Reasoned Behavior and the Theory of Reasoned
Action. Personality and Social Psychology Bulletin, 18, 3-9.
Marion, J. L., & Reid, S. E. (2001). Development of the United States Leave No Trace
programme: A historical perspective. In: Usher, M.B. (ed.), Enjoyment and
Understanding of the Natural Heritage. Scottish Natural Heritage, Edinburgh: The
Stationery Office Ltd., Scotland. 81-92.
Marion, J.L., & Reid, S.E. (2007). Minimizing visitor impacts to protected areas: The
efficacy of low impact education programmes. Journal of Sustainable Tourism,

103
15(1).
Martin, B., Cashel, C., Wagstaff, M., & Breunig, M. (2006). Outdoor leadership: Theory
and practice. Champaign, IL: Human Kinetics.
Matre, S. (1990). Earth education: A new beginning. Greenville, WV: Institute for Earth
Education. 317 pp.
Metzger, T., & McEwen, D. (1999). Measurement of environmental sensitivity. The
Journal of Environmental Education, 30(4), 38-39.
Mobley, C., Vagias, W. M., & DeWard, S. L. (2010). Exploring additional determinants
of environmentally responsible behavior: The influence of environmental
literature and environmental attitudes. Environment & Behavior, 42(4), 420-447.
Nash, R. (1967) Wilderness and the American mind. New Haven, CT: Yale University
Press.
Netemeyer, R.G., Burton, S., & Johnston, M. (1991). A comparison of two models for the
prediction of violitional and goal-directed behaviors: a confirmatory analysis
approach, Social Psychology Quarterly, 54, 87-100.
Newhouse, N. (1990) Implication of attitude and behavior research for environmental
conservation. The Journal of Environmental Education, 22(1), 26-32.
Oskamp, S. (2002). Environmentally responsible behavior: Teaching and promoting it
effectively. Analyses of Social Issues & Public Policy, 2(1), 173-182.
Priest, S. & Gass, M. (1997). Effective leadership in adventure programming.
Champaign, IL: Human Kinetics.

104
Schwenk, G. & Moser, G. (2008). Intention & behavior: a Bayesian meta-analysis with
focus on the Ajzen-Fishbein model in the field of environmental behavior. Qual
Quant, 43, 743-755.
Sia, A. P., Hungerford, H. R., & Tomera, A. N., (1985). Selected predictors of
responsible environmental behavior: An analysis. Journal of Environmental
Education, 17(2), 31.
Siemer, W. F., & Knuth, B. A. (2001). Effects of fishing education programs on
antecedents of responsible environmental behavior. Journal of Environmental
Education, 32(4), 23.
Simon, G.L., & Alagona, P.S. (2009). Beyond Leave No Trace. Ethics, Place &
Environment, 12(1), 17-34.
Sivek, D. J., & Hungerford, H. (1989) Predictors of responsible behavior in three
Wisconsin conservation organizations. The Journal of Environmental Education,
17(2), 31-40.
Smith-Sebasto, N., & D'Acosta, A. (1995). Designing a likert-type scale to predict
environmentally responsible behavior in undergraduate students: A multistep
process. Journal of Environmental Education, 27(1), 14.
Tabachnick, B. G., & Fidell, L. S. (2001). Using Multivariate Statistics. Boston, MA:
Allyn and Bacon.
Tarrant, M. A., & Green, G.T. (1999). Outdoor recreation and the predictive validity of

105
environmental attitudes. Leisure Sciences, 21, 17-30.
Thøgersen, J. (2006). Norms for environmentally responsible behaviour: An extended
taxonomy. Journal of Environmental Psychology, 26(4), 247-261.
Thompson, B. (2004). Exploratory and confirmatory factor analysis: Understanding
concepts and applications. Washington, DC: American Psychological
Association.
Van Horn, P. (2009). Towards true sustainability: Overcoming the effects of
consumerism in the outdoor field, part III. Journal of the Wilderness Education
Association, 21.
Vaske, J. J., & Donnelly, M. P. (1999). A value-attitude-behavior model predicting
wildland preservations voting intentions. Society & Natural Resources, 12(6),
523.
Vaske, J. J., & Kobrin, K. C. (2001). Place attachment and environmentally responsible
behavior. Journal of Environmental Education, 32(4), 16.
Worthington, R.L., & Whittaker, T.A. (2006). Scale development research: A content
analysis and recommendations for best practices. The Counseling Psychologist,
34. 806-838.
Zelezny, L.C. (1999). Educational interventions that improve environmental behaviors: A
meta-analysis. The Journal of Environmental Education, 31(1), 5-14.

106
Zinbarg, R., Yovel, I., Revelle, W. & McDonald, R. (2006). Estimating generalizability
to a universe of indicators that all have an attribute in common: A comparison of
estimators for ωh. Applied Psychological Measurement, 30, 121-144.
Zint, M., Kraemer, A., Northway, H., & Lim, M. (2002). Evaluation of the Chesapeake
Bay Foundation’s conservation education programs. Conservation Biology, 16,
641-649.

APPENDIX A: ENVIRONMENTALLY RESPONSIBLE BEHAVIOR
PREDICTOR SCALE SURVEY
Section 1: Informed Consent
Ohio University Consent Form
Title of Research: Environmentally Responsible Behavior and Leave No Trace
Researchers: Janene Giuseffi, Graduate Student; Dr. Bruce Martin, Assistant Professor.
You are being asked to participate in research. For you to be able to decide whether you
want to participate in this project, you should understand what the project is about, as
well as the possible risks and benefits in order to make an informed decision. This
process is known as informed consent. This form describes the purpose, procedures,
possible benefits, and risks. It also explains how your personal information will be used
and protected. Once you have read this form and your questions about the study are
answered, you may continue on to complete the survey. This will allow your participation
in this study.
Explanation of Study:
This study is being done because environmentally responsible behavior is still not well
understood, and the ability to predict and explain behavior that reduces environmental
impacts can help to educate the public more appropriately on how their behavior can help
to restore and protect the environment.

108
If you agree to participate, you will be asked to answer an on-line survey. The questions
will address various aspects of your every-day environmental behavior, and any Leave
No Trace training you may have taken. If you have not taken any Leave No Trace
courses, you can answer all other questions, and simply skip Section 6, moving straight
on to Section 7.
Your participation in the study will last approximately 20-40 minutes.
Risks and Discomforts:
No risks or discomforts are anticipated.
Benefits:
This study will enrich previous research on environmental behavior and contribute new
information that could help organizations, educators, and others to improve their
programs. You may not benefit, personally by participating in this study.
Confidentiality and Records:
Your study information will be kept confidential and you will not be asked for any
identifying information such as name or contact information.
Additionally, while every effort will be made to keep your study-related information

109
confidential, there may be circumstances where this information must be shared with:
• Federal agencies, for example the Office of Human Research Protections, whose
responsibility is to protect human subjects in research;
• Representatives of Ohio University (OU), including the Institutional Review Board, a
committee that oversees the research at OU
Contact Information:
If you have any questions regarding this study, please contact Janene Giuseffi
([email protected]) or Bruce Martin ([email protected]).
If you have any questions regarding your rights as a research participant, please contact
Jo Ellen Sherow, Director of Research Compliance, Ohio University, (740)593-0664.
Section 1: Informed Consent
By clicking the button below marked "Yes, I agree to participate in this study" you are
agreeing that:
• you have read this consent form (or it has been read to you) and have been given the
opportunity to ask questions and have them answered
• you have been informed of potential risks and they have been explained to your
satisfaction.
• you understand Ohio University has no funds set aside for any injuries you might
receive as a result of participating in this study

110
• you are 18 years of age or older
• your participation in this research is completely voluntary
• you may leave the study at any time. If you decide to stop participating in the study,
there will be no penalty to you and you will not lose any benefits to which you are
otherwise entitled.
Section 2: Behavioral Attributes
Mark the response that most accurately reflects you.
(1 = Strongly Disagree, 6 = Strongly Agree)
1. Conserving resources and reducing negative environmental impacts is important.
2. Using alternative transportation helps to conserve resources and minimize negative
impacts on the environment.
3. Responsible environmental behavior is not important.
4. Reducing waste contributes to minimizing environmental problems.
5. Using fewer resources puts less of a strain on the environment.
6. The environment is of high priority in my day-to-day behavior.
Section 3: Normative Attributes
Mark the response that most accurately reflects you.
(1 = Strongly Disagree, 6 = Strongly Agree)
1. What my friends think is important to me.

111
2. Minimizing environmental impacts is important to my family.
3. Turning off unused lights is not something that those around me do or thinks is
important.
4. Resource conservation is important to my friends.
5. My family’s opinions are not important to me.
6. I put emphasis on what my circle of friends and family believe.
Section 4: Control Attributes
Mark the response that most accurately reflects you.
(1 = Strongly Disagree, 6 = Strongly Agree)
1. I have the ability to make responsible environmental decisions.
2. I am knowledgeable about environmental impacts and how to mitigate them.
3. Stopping environmental degradation is out of my hands.
4. I don’t think I know enough about environmental issues to reduce my resource use
effectively.
5. My environmental behavior contributes to fixing environmental problems.
6. It is not within my power to reduce the amount of natural resources used.
Section 5: Intentions
Indicate behaviors that you intend to pursue in the next year. Mark all that apply.
I intend to…
Reduce

112
Reuse
Recycle
Compost
Use CFLs or other energy saving devices
Use solar panels, wind turbine, or other alternative energy sources
Set thermostat or purchase programmable thermostat to reduce energy use
Air-dry my laundry
Turn water off when not in use
Use a rainwater collection barrel
Use a water-saving showerhead/low flow toilet or other water saving technique
Purchase non-petroleum derived, non-toxic cleaning substances
Bike, walk, or carpool
Buy used instead of new
Buy reusable instead of disposable
Avoid using pesticides on my landscaping/garden
Landscape yard to provide/increase wildlife habitat
Buy less, or only what you need
Buy local food & products
Buy organic food & products
Take an environmentally themed class/training program/certification
Read environmentally themed books
Talk to others about the environment

113
Volunteer for environmental causes
Donate to environmental causes
Vote for environmentally friendly politicians
Write to your congressmen about environmental issues
Other
Section 6: Leave No Trace
Answer the following questions to the best as thoroughly as possible.
1. Do you feel that the Leave No Trace principles can be applied to environmentally
responsible behaviors in your everyday life? Explain.
2. Which of the 7 principles do you feel most directly apply to everyday living and
why?
3. Have you noticed an increase in everyday environmental behaviors since
completing your Leave No Trace training? Please elaborate.
4. Do you feel more confident in your knowledge of environmental issues after your
Leave No Trace course?

114
5. Do you feel more capable of acting in ways that reduce negative environmental
impacts and conserve resources, not only in the wilderness, but in everyday life as
well?
6. Do you intend to engage in other behaviors in the future based on your Leave No
Trace experience?
7. Did your Leave No Trace experience inspire you to learn more about
environmental issues not related to recreation impacts?
Section 7: Demographic Information
1. Gender:
• Man
• Woman
• Other
2. Age:
• 10 – 19
• 20 – 29
• 30 – 39
• 40 – 49
• 50 – 59

115
• 60 or above
3. City/State of Residence:
4. Level of Leave No Trace Training:
• None
• Awareness Workshop
• Leave No Trace Trainer
• Leave No Trace Master Educator
5. Leave No Trace Course Location:
6. Highest Level of Education Completed:
• Some High School
• High School Diploma or Equivalent
• Some College
• Associate or Bachelor Degree
• Some Graduate School
• Graduate Degree
116
APPENDIX B: LEAVE NO TRACE LETTER OF SUPPORT

117
APPENDIX C: INSTITUTIONAL REVIEW BOARD APPROVAL FORM