Modaraba & NBFCs Sector Overview - pacra
28
Modaraba & NBFCs Sector Overview March 2020
-
Upload
khangminh22 -
Category
Documents
-
view
7 -
download
0
Transcript of Modaraba & NBFCs Sector Overview - pacra
Modaraba & NBFCs
Sector Overview
March 2020
TABLE OF CONTENTS NBFI Sector
• Breakup of Assets
• Trend in Assets
• Breakup of Deposits
Modarabas
• Assets | Active
• Assets | Passive
• Equity | Active
• Equity | Passive
• Profitability | Active
• Profitability | Passive
Investment Finance and Leasing Companies
• Assets
• Equity
• Profitability
Sector Developments
Bibliography
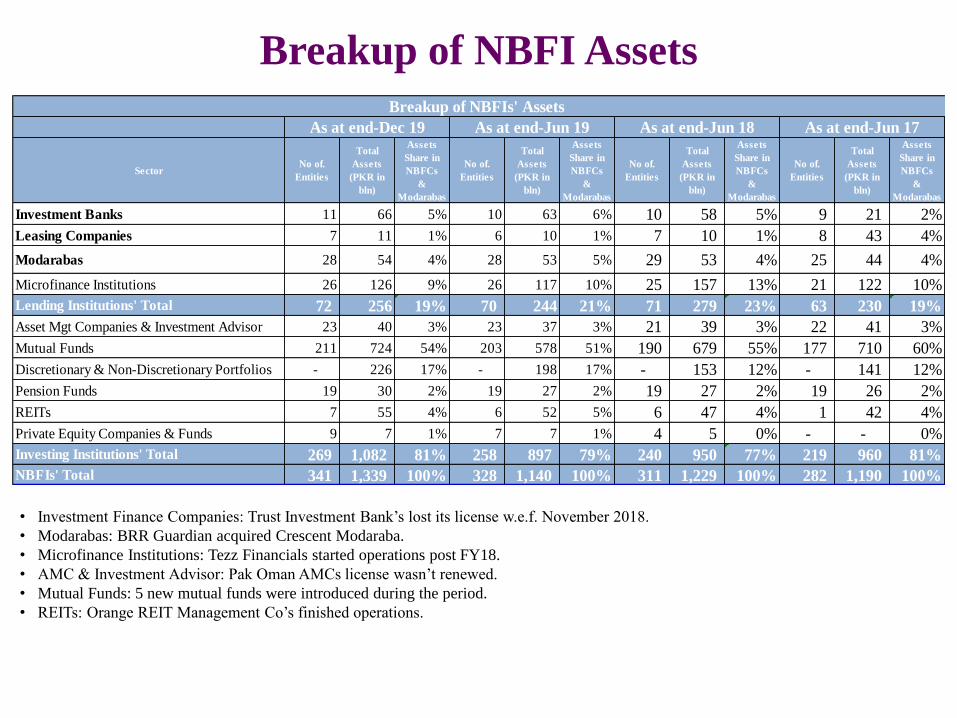
Breakup of NBFI Assets
• Investment Finance Companies: Trust Investment Bank’s lost its license w.e.f. November 2018.
• Modarabas: BRR Guardian acquired Crescent Modaraba.
• Microfinance Institutions: Tezz Financials started operations post FY18.
• AMC & Investment Advisor: Pak Oman AMCs license wasn’t renewed.
• Mutual Funds: 5 new mutual funds were introduced during the period.
• REITs: Orange REIT Management Co’s finished operations.
SectorNo of.
Entities
Total
Assets
(PKR in
bln)
Assets
Share in
NBFCs
&
Modarabas
No of.
Entities
Total
Assets
(PKR in
bln)
Assets
Share in
NBFCs
&
Modarabas
No of.
Entities
Total
Assets
(PKR in
bln)
Assets
Share in
NBFCs
&
Modarabas
No of.
Entities
Total
Assets
(PKR in
bln)
Assets
Share in
NBFCs
&
Modarabas
Investment Banks 11 66 5% 10 63 6% 10 58 5% 9 21 2%
Leasing Companies 7 11 1% 6 10 1% 7 10 1% 8 43 4%
Modarabas 28 54 4% 28 53 5% 29 53 4% 25 44 4%
Microfinance Institutions 26 126 9% 26 117 10% 25 157 13% 21 122 10%
Lending Institutions' Total 72 256 19% 70 244 21% 71 279 23% 63 230 19%
Asset Mgt Companies & Investment Advisor 23 40 3% 23 37 3% 21 39 3% 22 41 3%
Mutual Funds 211 724 54% 203 578 51% 190 679 55% 177 710 60%
Discretionary & Non-Discretionary Portfolios - 226 17% - 198 17% - 153 12% - 141 12%
Pension Funds 19 30 2% 19 27 2% 19 27 2% 19 26 2%
REITs 7 55 4% 6 52 5% 6 47 4% 1 42 4%
Private Equity Companies & Funds 9 7 1% 7 7 1% 4 5 0% - - 0%
Investing Institutions' Total 269 1,082 81% 258 897 79% 240 950 77% 219 960 81%
NBFIs' Total 341 1,339 100% 328 1,140 100% 311 1,229 100% 282 1,190 100%
Breakup of NBFIs' Assets
As at end-Jun 18 As at end-Jun 17As at end-Jun 19As at end-Dec 19
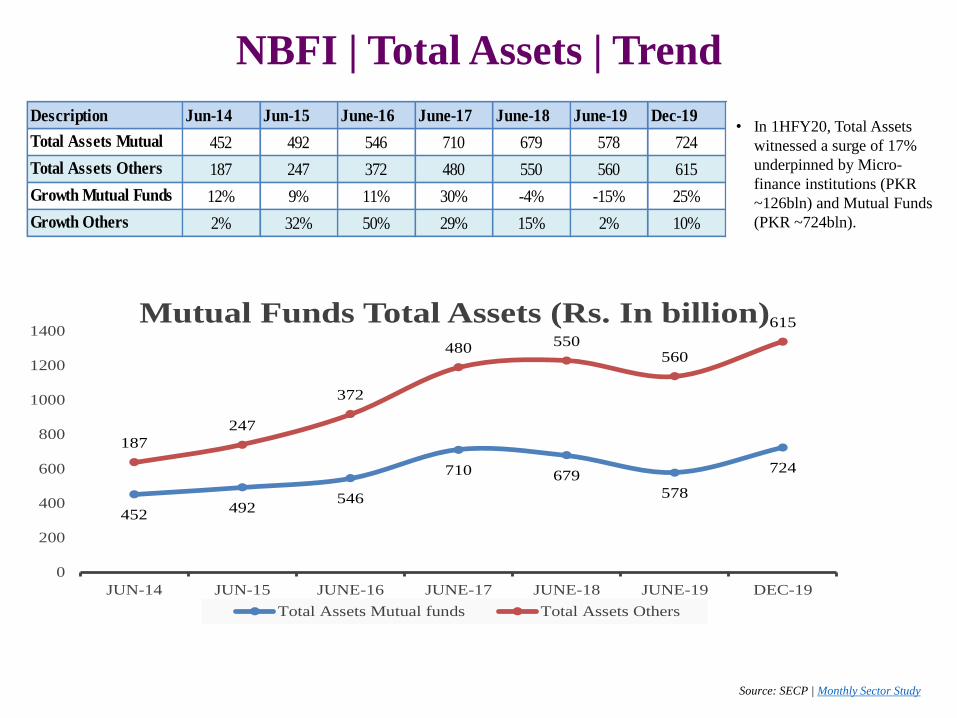
NBFI | Total Assets | Trend
• In 1HFY20, Total Assets
witnessed a surge of 17%
underpinned by Micro-
finance institutions (PKR
~126bln) and Mutual Funds
(PKR ~724bln).
Source: SECP | Monthly Sector Study
Jun-14 Jun-15 June-16 June-17 June-18 June-19 Dec-19
452 492 546 710 679 578 724
187 247 372 480 550 560 615
12% 9% 11% 30% -4% -15% 25%
2% 32% 50% 29% 15% 2% 10%Growth Others
Description
Total Assets Mutual
funds
Growth Mutual Funds
Total Assets Others
452492
546
710 679
578
724
187
247
372
480 550560
615
0
200
400
600
800
1000
1200
1400
JUN-14 JUN-15 JUNE-16 JUNE-17 JUNE-18 JUNE-19 DEC-19
Mutual Funds Total Assets (Rs. In billion)
Total Assets Mutual funds Total Assets Others
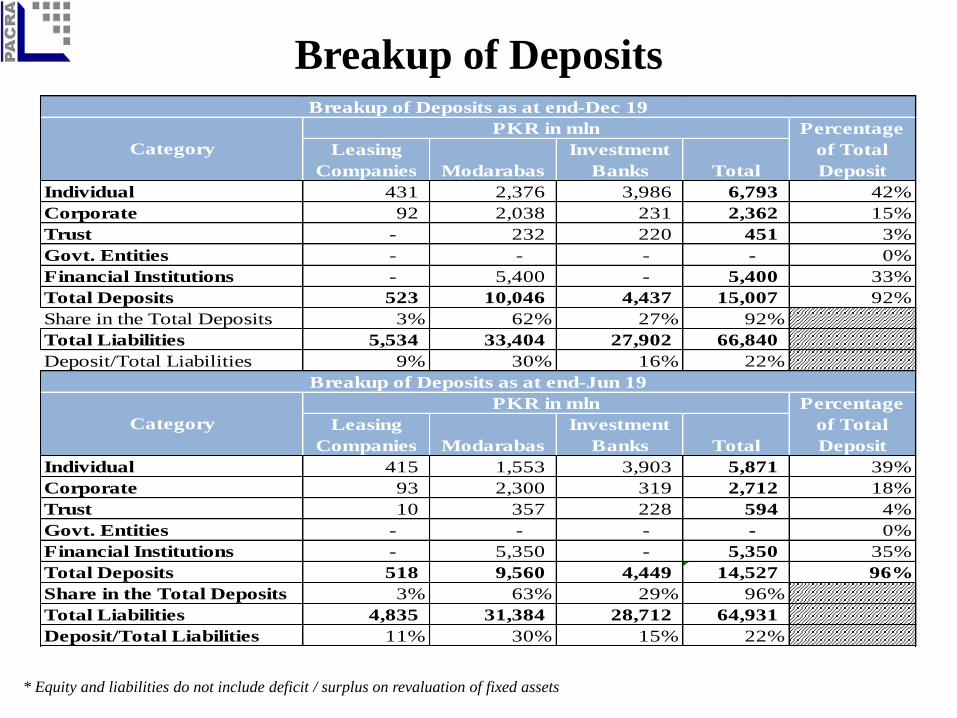
Breakup of Deposits
* Equity and liabilities do not include deficit / surplus on revaluation of fixed assets
Leasing
Companies Modarabas
Investment
Banks Total
Individual 431 2,376 3,986 6,793 42%
Corporate 92 2,038 231 2,362 15%
Trust - 232 220 451 3%
Govt. Entities - - - - 0%
Financial Institutions - 5,400 - 5,400 33%
Total Deposits 523 10,046 4,437 15,007 92%
Share in the Total Deposits 3% 62% 27% 92%
Total Liabilities 5,534 33,404 27,902 66,840
Deposit/Total Liabilities 9% 30% 16% 22%
Leasing
Companies Modarabas
Investment
Banks Total
Individual 415 1,553 3,903 5,871 39%
Corporate 93 2,300 319 2,712 18%
Trust 10 357 228 594 4%
Govt. Entities - - - - 0%
Financial Institutions - 5,350 - 5,350 35%
Total Deposits 518 9,560 4,449 14,527 96%
Share in the Total Deposits 3% 63% 29% 96%
Total Liabilities 4,835 31,384 28,712 64,931
Deposit/Total Liabilities 11% 30% 15% 22%
PKR in mln Percentage
of Total
Deposit
Breakup of Deposits as at end-Jun 19
Category
PKR in mln Percentage
of Total
Deposit
Breakup of Deposits as at end-Dec 19
Category
Modarabas
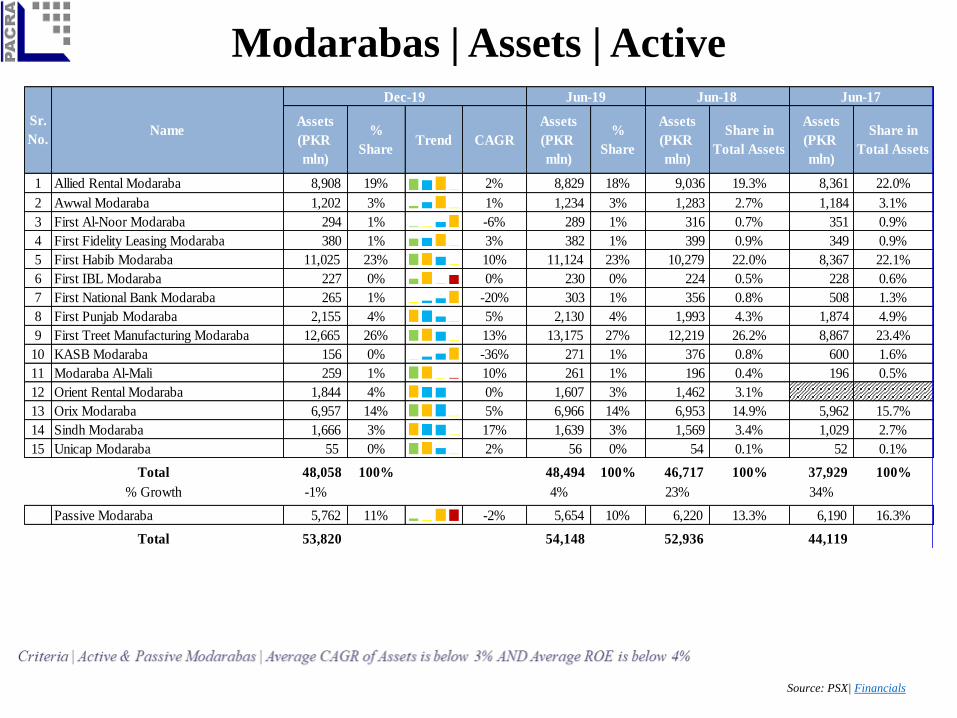
Modarabas | Assets | Active
Source: PSX| Financials
Assets
(PKR
mln)
%
ShareTrend CAGR
Assets
(PKR
mln)
%
Share
Assets
(PKR
mln)
Share in
Total Assets
Assets
(PKR
mln)
Share in
Total Assets
1 Allied Rental Modaraba 8,908 19% 2% 8,829 18% 9,036 19.3% 8,361 22.0%
2 Awwal Modaraba 1,202 3% 1% 1,234 3% 1,283 2.7% 1,184 3.1%
3 First Al-Noor Modaraba 294 1% -6% 289 1% 316 0.7% 351 0.9%
4 First Fidelity Leasing Modaraba 380 1% 3% 382 1% 399 0.9% 349 0.9%
5 First Habib Modaraba 11,025 23% 10% 11,124 23% 10,279 22.0% 8,367 22.1%
6 First IBL Modaraba 227 0% 0% 230 0% 224 0.5% 228 0.6%
7 First National Bank Modaraba 265 1% -20% 303 1% 356 0.8% 508 1.3%
8 First Punjab Modaraba 2,155 4% 5% 2,130 4% 1,993 4.3% 1,874 4.9%
9 First Treet Manufacturing Modaraba 12,665 26% 13% 13,175 27% 12,219 26.2% 8,867 23.4%
10 KASB Modaraba 156 0% -36% 271 1% 376 0.8% 600 1.6%
11 Modaraba Al-Mali 259 1% 10% 261 1% 196 0.4% 196 0.5%
12 Orient Rental Modaraba 1,844 4% 0% 1,607 3% 1,462 3.1%
13 Orix Modaraba 6,957 14% 5% 6,966 14% 6,953 14.9% 5,962 15.7%
14 Sindh Modaraba 1,666 3% 17% 1,639 3% 1,569 3.4% 1,029 2.7%
15 Unicap Modaraba 55 0% 2% 56 0% 54 0.1% 52 0.1%
48,058 100% 48,494 100% 46,717 100% 37,929 100%
-1% 4% 23% 34%
Passive Modaraba 5,762 11% -2% 5,654 10% 6,220 13.3% 6,190 16.3%
53,820 54,148 52,936 44,119 Total
Total
% Growth
Jun-19Dec-19 Jun-17
Sr.
No.Name
Jun-18
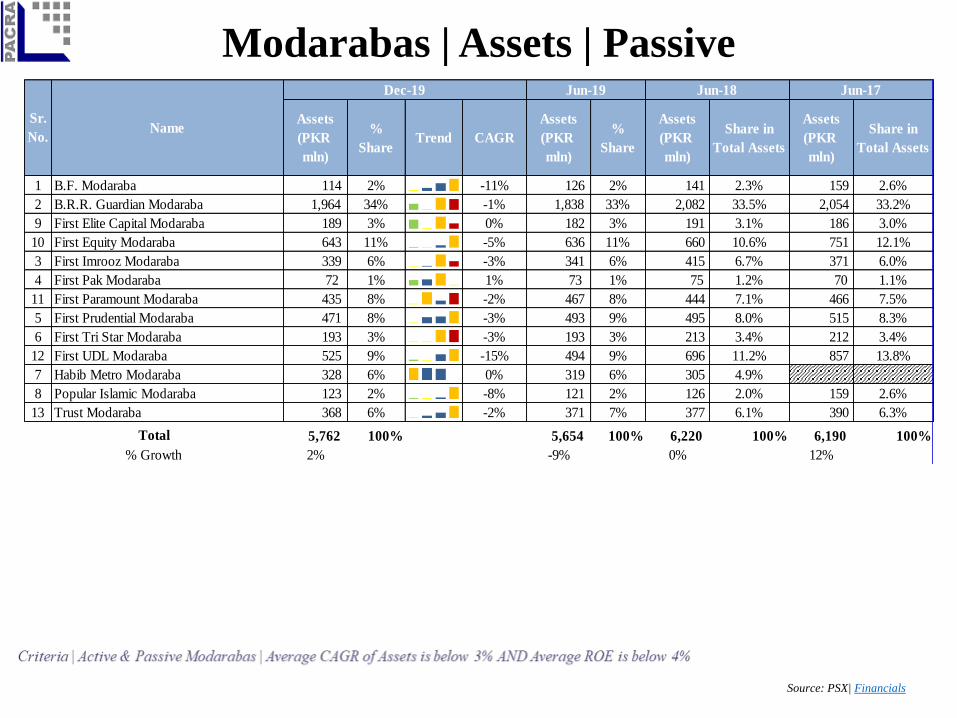
Modarabas | Assets | Passive
Source: PSX| Financials
Assets
(PKR
mln)
%
ShareTrend CAGR
Assets
(PKR
mln)
%
Share
Assets
(PKR
mln)
Share in
Total Assets
Assets
(PKR
mln)
Share in
Total Assets
1 B.F. Modaraba 114 2% -11% 126 2% 141 2.3% 159 2.6%
2 B.R.R. Guardian Modaraba 1,964 34% -1% 1,838 33% 2,082 33.5% 2,054 33.2%
9 First Elite Capital Modaraba 189 3% 0% 182 3% 191 3.1% 186 3.0%
10 First Equity Modaraba 643 11% -5% 636 11% 660 10.6% 751 12.1%
3 First Imrooz Modaraba 339 6% -3% 341 6% 415 6.7% 371 6.0%
4 First Pak Modaraba 72 1% 1% 73 1% 75 1.2% 70 1.1%
11 First Paramount Modaraba 435 8% -2% 467 8% 444 7.1% 466 7.5%
5 First Prudential Modaraba 471 8% -3% 493 9% 495 8.0% 515 8.3%
6 First Tri Star Modaraba 193 3% -3% 193 3% 213 3.4% 212 3.4%
12 First UDL Modaraba 525 9% -15% 494 9% 696 11.2% 857 13.8%
7 Habib Metro Modaraba 328 6% 0% 319 6% 305 4.9%
8 Popular Islamic Modaraba 123 2% -8% 121 2% 126 2.0% 159 2.6%
13 Trust Modaraba 368 6% -2% 371 7% 377 6.1% 390 6.3%
5,762 100% 5,654 100% 6,220 100% 6,190 100%
2% -9% 0% 12%
Total
% Growth
Jun-18 Jun-17
Sr.
No.Name
Dec-19 Jun-19
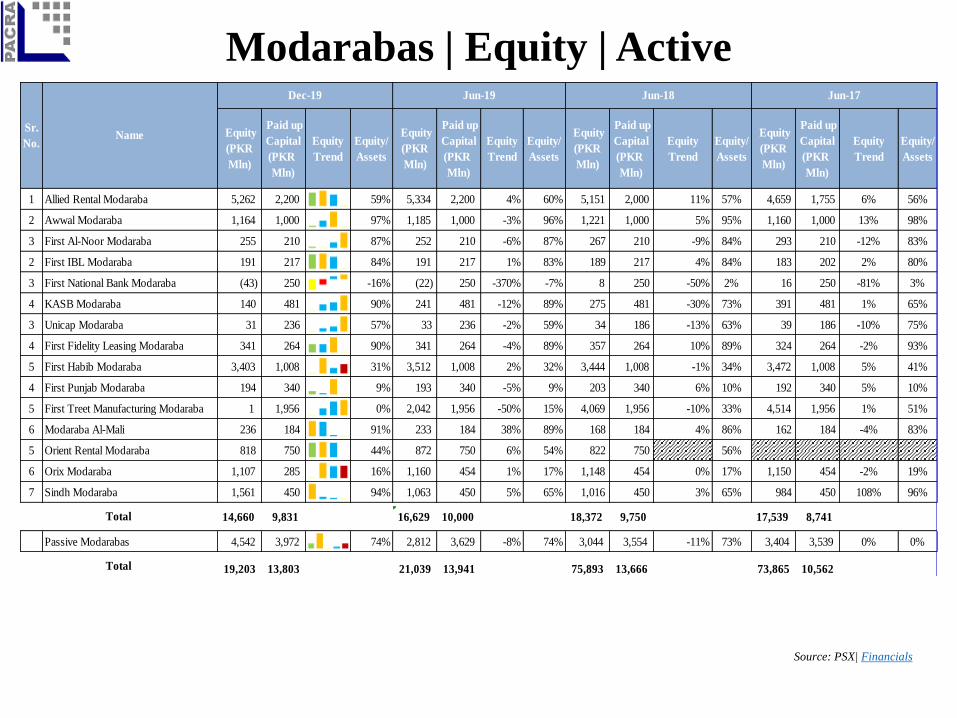
Modarabas | Equity | Active
Source: PSX| Financials
Equity
(PKR
Mln)
Paid up
Capital
(PKR
Mln)
Equity
Trend
Equity/
Assets
Equity
(PKR
Mln)
Paid up
Capital
(PKR
Mln)
Equity
Trend
Equity/
Assets
Equity
(PKR
Mln)
Paid up
Capital
(PKR
Mln)
Equity
Trend
Equity/
Assets
Equity
(PKR
Mln)
Paid up
Capital
(PKR
Mln)
Equity
Trend
Equity/
Assets
1 Allied Rental Modaraba 5,262 2,200 59% 5,334 2,200 4% 60% 5,151 2,000 11% 57% 4,659 1,755 6% 56%
2 Awwal Modaraba 1,164 1,000 97% 1,185 1,000 -3% 96% 1,221 1,000 5% 95% 1,160 1,000 13% 98%
3 First Al-Noor Modaraba 255 210 87% 252 210 -6% 87% 267 210 -9% 84% 293 210 -12% 83%
2 First IBL Modaraba 191 217 84% 191 217 1% 83% 189 217 4% 84% 183 202 2% 80%
3 First National Bank Modaraba (43) 250 -16% (22) 250 -370% -7% 8 250 -50% 2% 16 250 -81% 3%
4 KASB Modaraba 140 481 90% 241 481 -12% 89% 275 481 -30% 73% 391 481 1% 65%
3 Unicap Modaraba 31 236 57% 33 236 -2% 59% 34 186 -13% 63% 39 186 -10% 75%
4 First Fidelity Leasing Modaraba 341 264 90% 341 264 -4% 89% 357 264 10% 89% 324 264 -2% 93%
5 First Habib Modaraba 3,403 1,008 31% 3,512 1,008 2% 32% 3,444 1,008 -1% 34% 3,472 1,008 5% 41%
4 First Punjab Modaraba 194 340 9% 193 340 -5% 9% 203 340 6% 10% 192 340 5% 10%
5 First Treet Manufacturing Modaraba 1 1,956 0% 2,042 1,956 -50% 15% 4,069 1,956 -10% 33% 4,514 1,956 1% 51%
6 Modaraba Al-Mali 236 184 91% 233 184 38% 89% 168 184 4% 86% 162 184 -4% 83%
5 Orient Rental Modaraba 818 750 44% 872 750 6% 54% 822 750 56%
6 Orix Modaraba 1,107 285 16% 1,160 454 1% 17% 1,148 454 0% 17% 1,150 454 -2% 19%
7 Sindh Modaraba 1,561 450 94% 1,063 450 5% 65% 1,016 450 3% 65% 984 450 108% 96%
14,660 9,831 16,629 10,000 18,372 9,750 17,539 8,741
Passive Modarabas 4,542 3,972 74% 2,812 3,629 -8% 74% 3,044 3,554 -11% 73% 3,404 3,539 0% 0%
19,203 13,803 21,039 13,941 75,893 13,666 73,865 10,562
Total
Total
Sr.
No.Name
Jun-19Dec-19 Jun-17Jun-18
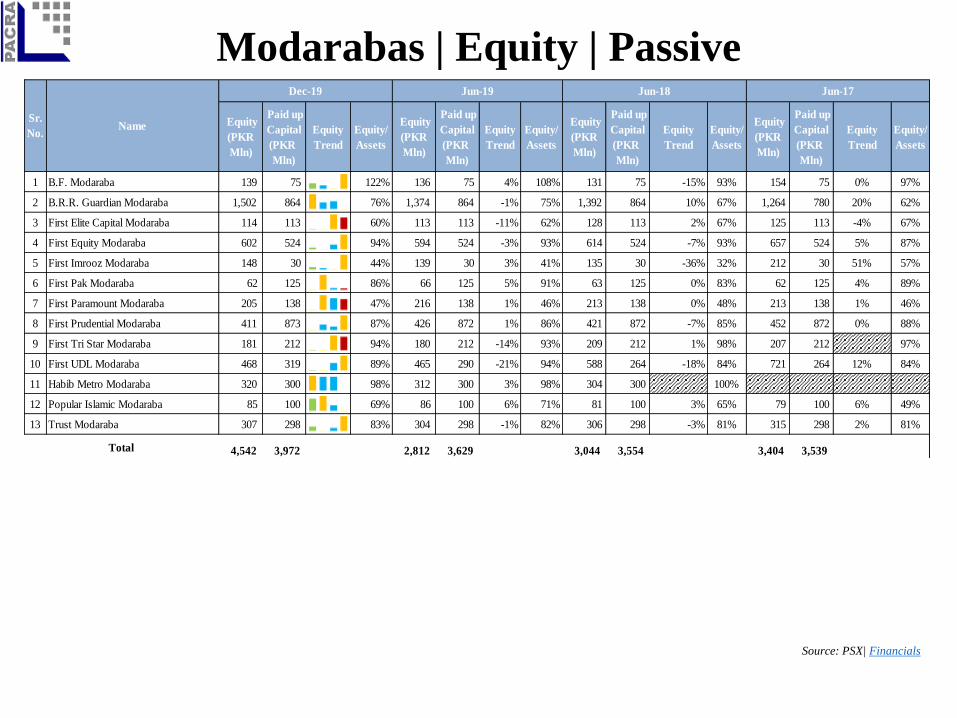
Modarabas | Equity | Passive
Source: PSX| Financials
Equity
(PKR
Mln)
Paid up
Capital
(PKR
Mln)
Equity
Trend
Equity/
Assets
Equity
(PKR
Mln)
Paid up
Capital
(PKR
Mln)
Equity
Trend
Equity/
Assets
Equity
(PKR
Mln)
Paid up
Capital
(PKR
Mln)
Equity
Trend
Equity/
Assets
Equity
(PKR
Mln)
Paid up
Capital
(PKR
Mln)
Equity
Trend
Equity/
Assets
1 B.F. Modaraba 139 75 122% 136 75 4% 108% 131 75 -15% 93% 154 75 0% 97%
2 B.R.R. Guardian Modaraba 1,502 864 76% 1,374 864 -1% 75% 1,392 864 10% 67% 1,264 780 20% 62%
3 First Elite Capital Modaraba 114 113 60% 113 113 -11% 62% 128 113 2% 67% 125 113 -4% 67%
4 First Equity Modaraba 602 524 94% 594 524 -3% 93% 614 524 -7% 93% 657 524 5% 87%
5 First Imrooz Modaraba 148 30 44% 139 30 3% 41% 135 30 -36% 32% 212 30 51% 57%
6 First Pak Modaraba 62 125 86% 66 125 5% 91% 63 125 0% 83% 62 125 4% 89%
7 First Paramount Modaraba 205 138 47% 216 138 1% 46% 213 138 0% 48% 213 138 1% 46%
8 First Prudential Modaraba 411 873 87% 426 872 1% 86% 421 872 -7% 85% 452 872 0% 88%
9 First Tri Star Modaraba 181 212 94% 180 212 -14% 93% 209 212 1% 98% 207 212 97%
10 First UDL Modaraba 468 319 89% 465 290 -21% 94% 588 264 -18% 84% 721 264 12% 84%
11 Habib Metro Modaraba 320 300 98% 312 300 3% 98% 304 300 100%
12 Popular Islamic Modaraba 85 100 69% 86 100 6% 71% 81 100 3% 65% 79 100 6% 49%
13 Trust Modaraba 307 298 83% 304 298 -1% 82% 306 298 -3% 81% 315 298 2% 81%
4,542 3,972 2,812 3,629 3,044 3,554 3,404 3,539
Jun-18 Jun-17Dec-19 Jun-19
Total
Sr.
No.Name
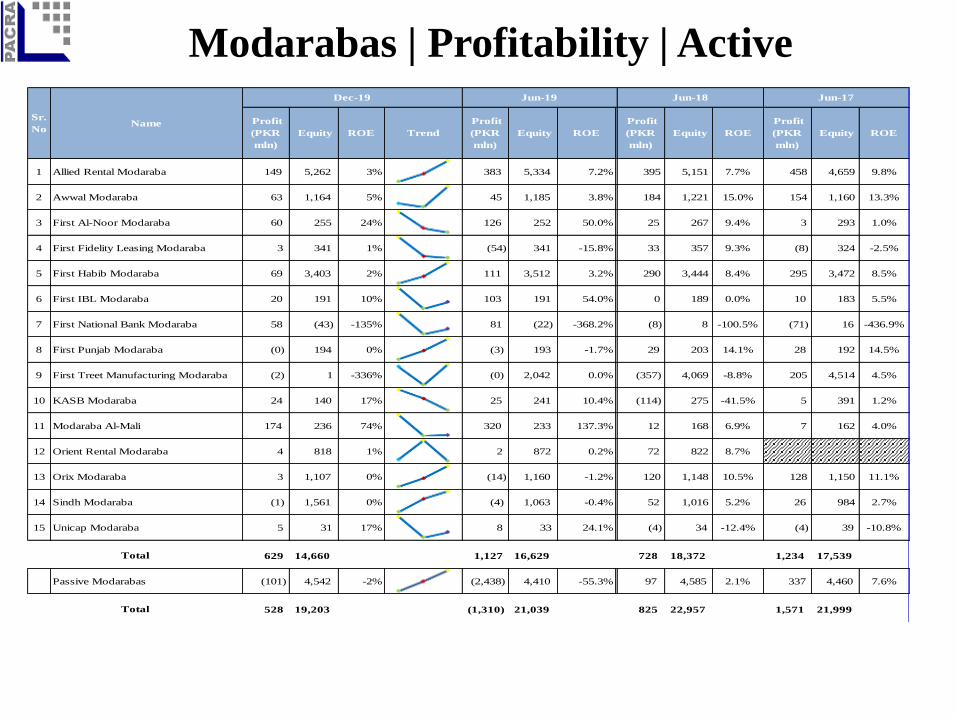
Modarabas | Profitability | Active
Profit
(PKR
mln)
Equity ROE Trend
Profit
(PKR
mln)
Equity ROE
T
r
e
n
d
Profit
(PKR
mln)
Equity ROE
Profit
(PKR
mln)
Equity ROE
1 Allied Rental Modaraba 149 5,262 3% 383 5,334 7.2% 395 5,151 7.7% 458 4,659 9.8%
2 Awwal Modaraba 63 1,164 5% 45 1,185 3.8% 184 1,221 15.0% 154 1,160 13.3%
3 First Al-Noor Modaraba 60 255 24% 126 252 50.0% 25 267 9.4% 3 293 1.0%
4 First Fidelity Leasing Modaraba 3 341 1% (54) 341 -15.8% 33 357 9.3% (8) 324 -2.5%
5 First Habib Modaraba 69 3,403 2% 111 3,512 3.2% 290 3,444 8.4% 295 3,472 8.5%
6 First IBL Modaraba 20 191 10% 103 191 54.0% 0 189 0.0% 10 183 5.5%
7 First National Bank Modaraba 58 (43) -135% 81 (22) -368.2% (8) 8 -100.5% (71) 16 -436.9%
8 First Punjab Modaraba (0) 194 0% (3) 193 -1.7% 29 203 14.1% 28 192 14.5%
9 First Treet Manufacturing Modaraba (2) 1 -336% (0) 2,042 0.0% (357) 4,069 -8.8% 205 4,514 4.5%
10 KASB Modaraba 24 140 17% 25 241 10.4% (114) 275 -41.5% 5 391 1.2%
11 Modaraba Al-Mali 174 236 74% 320 233 137.3% 12 168 6.9% 7 162 4.0%
12 Orient Rental Modaraba 4 818 1% 2 872 0.2% 72 822 8.7%
13 Orix Modaraba 3 1,107 0% (14) 1,160 -1.2% 120 1,148 10.5% 128 1,150 11.1%
14 Sindh Modaraba (1) 1,561 0% (4) 1,063 -0.4% 52 1,016 5.2% 26 984 2.7%
15 Unicap Modaraba 5 31 17% 8 33 24.1% (4) 34 -12.4% (4) 39 -10.8%
629 14,660 1,127 16,629 728 18,372 1,234 17,539
Passive Modarabas (101) 4,542 -2% (2,438) 4,410 -55.3% 97 4,585 2.1% 337 4,460 7.6%
528 19,203 (1,310) 21,039 825 22,957 1,571 21,999
Dec-19
Total
Total
Sr.
NoName
Jun-18Jun-19 Jun-17
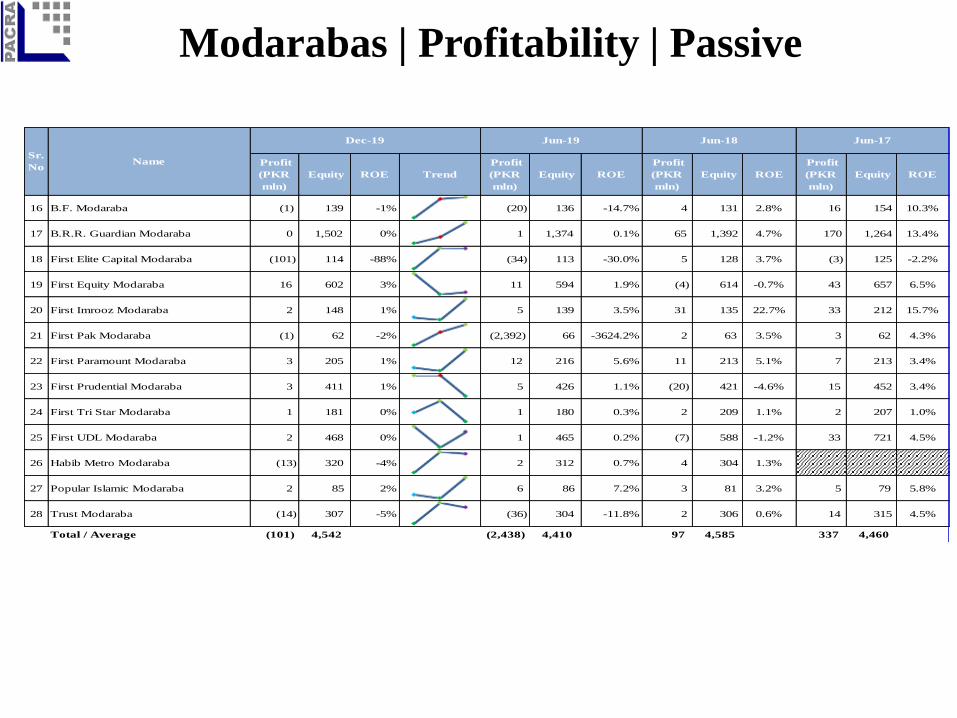
Modarabas | Profitability | Passive
Profit
(PKR
mln)
Equity ROE Trend
Profit
(PKR
mln)
Equity ROE
Profit
(PKR
mln)
Equity ROE
Profit
(PKR
mln)
Equity ROE
16 B.F. Modaraba (1) 139 -1% (20) 136 -14.7% 4 131 2.8% 16 154 10.3%
17 B.R.R. Guardian Modaraba 0 1,502 0% 1 1,374 0.1% 65 1,392 4.7% 170 1,264 13.4%
18 First Elite Capital Modaraba (101) 114 -88% (34) 113 -30.0% 5 128 3.7% (3) 125 -2.2%
19 First Equity Modaraba 16 602 3% 11 594 1.9% (4) 614 -0.7% 43 657 6.5%
20 First Imrooz Modaraba 2 148 1% 5 139 3.5% 31 135 22.7% 33 212 15.7%
21 First Pak Modaraba (1) 62 -2% (2,392) 66 -3624.2% 2 63 3.5% 3 62 4.3%
22 First Paramount Modaraba 3 205 1% 12 216 5.6% 11 213 5.1% 7 213 3.4%
23 First Prudential Modaraba 3 411 1% 5 426 1.1% (20) 421 -4.6% 15 452 3.4%
24 First Tri Star Modaraba 1 181 0% 1 180 0.3% 2 209 1.1% 2 207 1.0%
25 First UDL Modaraba 2 468 0% 1 465 0.2% (7) 588 -1.2% 33 721 4.5%
26 Habib Metro Modaraba (13) 320 -4% 2 312 0.7% 4 304 1.3%
27 Popular Islamic Modaraba 2 85 2% 6 86 7.2% 3 81 3.2% 5 79 5.8%
28 Trust Modaraba (14) 307 -5% (36) 304 -11.8% 2 306 0.6% 14 315 4.5%
Total / Average (101) 4,542 (2,438) 4,410 97 4,585 337 4,460
Jun-18 Jun-17Dec-19 Jun-19
Sr.
NoName
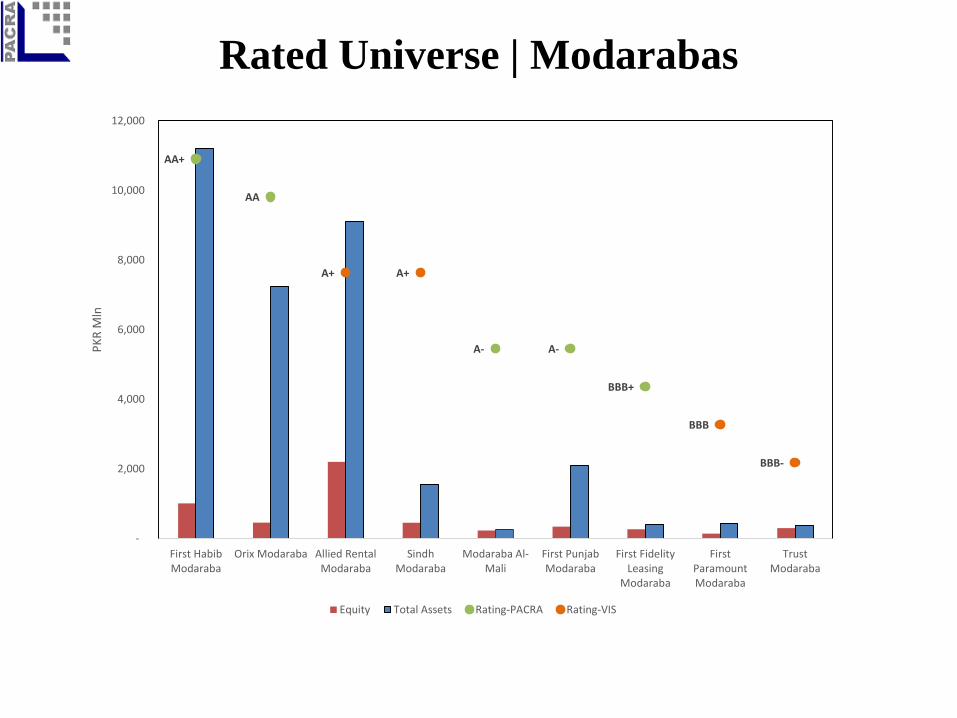
Rated Universe | Modarabas
AA+
AA
A- A-
BBB+
A+ A+
BBB
BBB-
2
3
4
5
6
7
8
9
10
11
12
13
-
2,000
4,000
6,000
8,000
10,000
12,000
First HabibModaraba
Orix Modaraba Allied RentalModaraba
SindhModaraba
Modaraba Al-Mali
First PunjabModaraba
First FidelityLeasing
Modaraba
FirstParamountModaraba
TrustModaraba
PK
R M
ln
Equity Total Assets Rating-PACRA Rating-VIS
Investment Finance andLeasing Companies
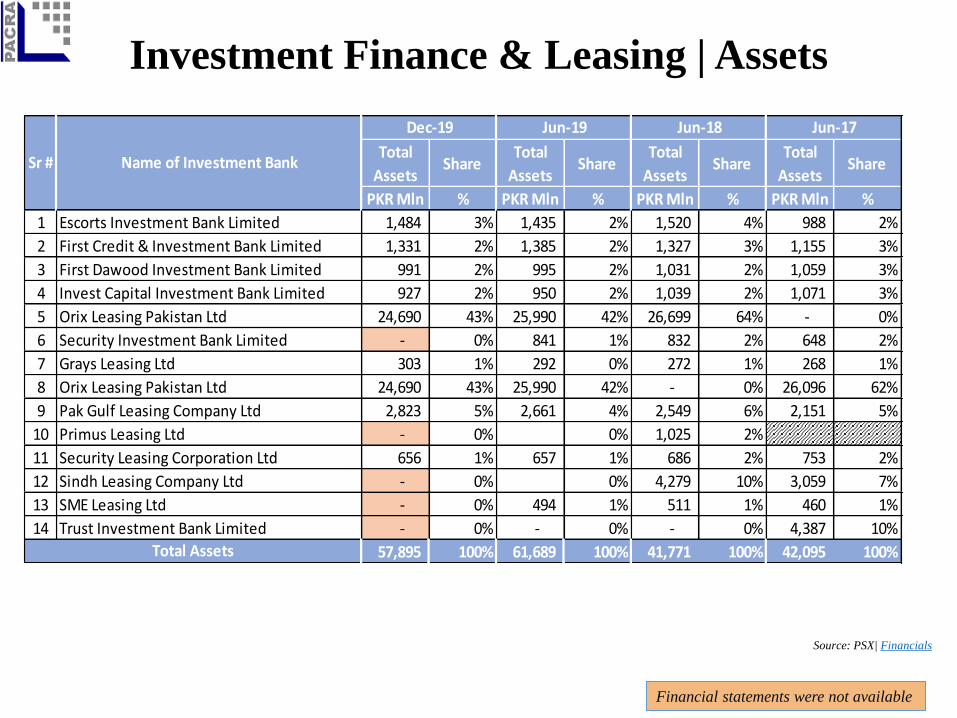
Investment Finance & Leasing | Assets
Financial statements were not available
Source: PSX| Financials
Total
AssetsShare
Total
AssetsShare
Total
AssetsShare
Total
AssetsShare
PKR Mln % PKR Mln % PKR Mln % PKR Mln %
1 Escorts Investment Bank Limited 1,484 3% 1,435 2% 1,520 4% 988 2%
2 First Credit & Investment Bank Limited 1,331 2% 1,385 2% 1,327 3% 1,155 3%
3 First Dawood Investment Bank Limited 991 2% 995 2% 1,031 2% 1,059 3%
4 Invest Capital Investment Bank Limited 927 2% 950 2% 1,039 2% 1,071 3%
5 Orix Leasing Pakistan Ltd 24,690 43% 25,990 42% 26,699 64% - 0%
6 Security Investment Bank Limited - 0% 841 1% 832 2% 648 2%
7 Grays Leasing Ltd 303 1% 292 0% 272 1% 268 1%
8 Orix Leasing Pakistan Ltd 24,690 43% 25,990 42% - 0% 26,096 62%
9 Pak Gulf Leasing Company Ltd 2,823 5% 2,661 4% 2,549 6% 2,151 5%
10 Primus Leasing Ltd - 0% 0% 1,025 2%
11 Security Leasing Corporation Ltd 656 1% 657 1% 686 2% 753 2%
12 Sindh Leasing Company Ltd - 0% 0% 4,279 10% 3,059 7%
13 SME Leasing Ltd - 0% 494 1% 511 1% 460 1%
14 Trust Investment Bank Limited - 0% - 0% - 0% 4,387 10%
57,895 100% 61,689 100% 41,771 100% 42,095 100%
Name of Investment BankSr #
Total Assets
Jun-18 Jun-17Jun-19Dec-19
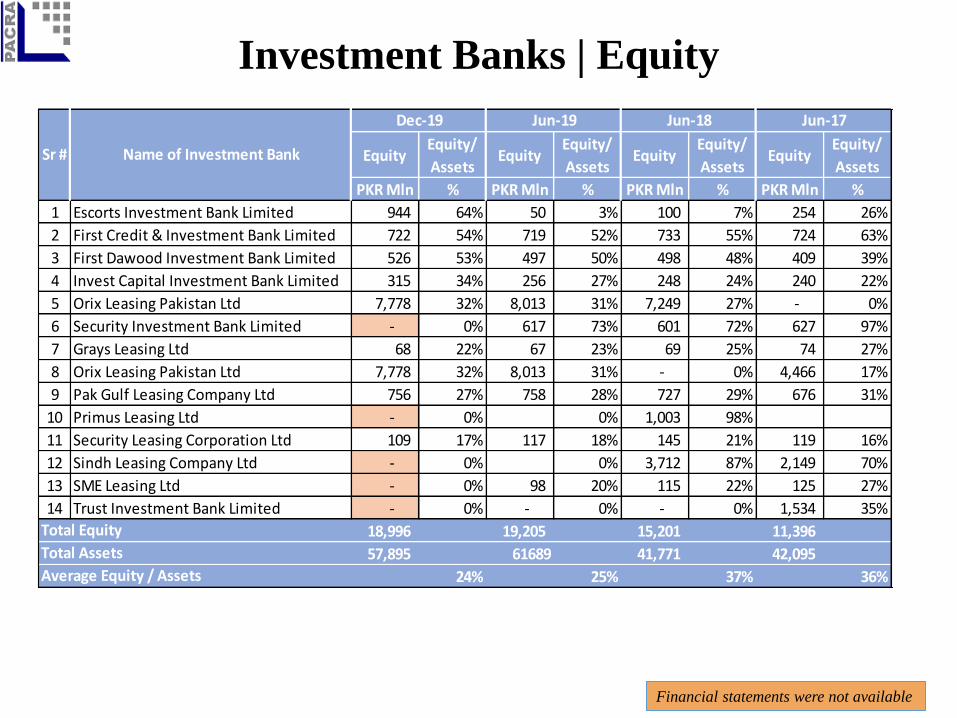
Investment Banks | Equity
Financial statements were not available
EquityEquity/
AssetsEquity
Equity/
AssetsEquity
Equity/
AssetsEquity
Equity/
Assets
PKR Mln % PKR Mln % PKR Mln % PKR Mln %
1 Escorts Investment Bank Limited 944 64% 50 3% 100 7% 254 26%
2 First Credit & Investment Bank Limited 722 54% 719 52% 733 55% 724 63%
3 First Dawood Investment Bank Limited 526 53% 497 50% 498 48% 409 39%
4 Invest Capital Investment Bank Limited 315 34% 256 27% 248 24% 240 22%
5 Orix Leasing Pakistan Ltd 7,778 32% 8,013 31% 7,249 27% - 0%
6 Security Investment Bank Limited - 0% 617 73% 601 72% 627 97%
7 Grays Leasing Ltd 68 22% 67 23% 69 25% 74 27%
8 Orix Leasing Pakistan Ltd 7,778 32% 8,013 31% - 0% 4,466 17%
9 Pak Gulf Leasing Company Ltd 756 27% 758 28% 727 29% 676 31%
10 Primus Leasing Ltd - 0% 0% 1,003 98%
11 Security Leasing Corporation Ltd 109 17% 117 18% 145 21% 119 16%
12 Sindh Leasing Company Ltd - 0% 0% 3,712 87% 2,149 70%
13 SME Leasing Ltd - 0% 98 20% 115 22% 125 27%
14 Trust Investment Bank Limited - 0% - 0% - 0% 1,534 35%
18,996 19,205 15,201 11,396
57,895 61689 41,771 42,095
24% 25% 37% 36%
Total Equity
Total Assets
Average Equity / Assets
Sr # Name of Investment Bank
Jun-18 Jun-17Dec-19 Jun-19
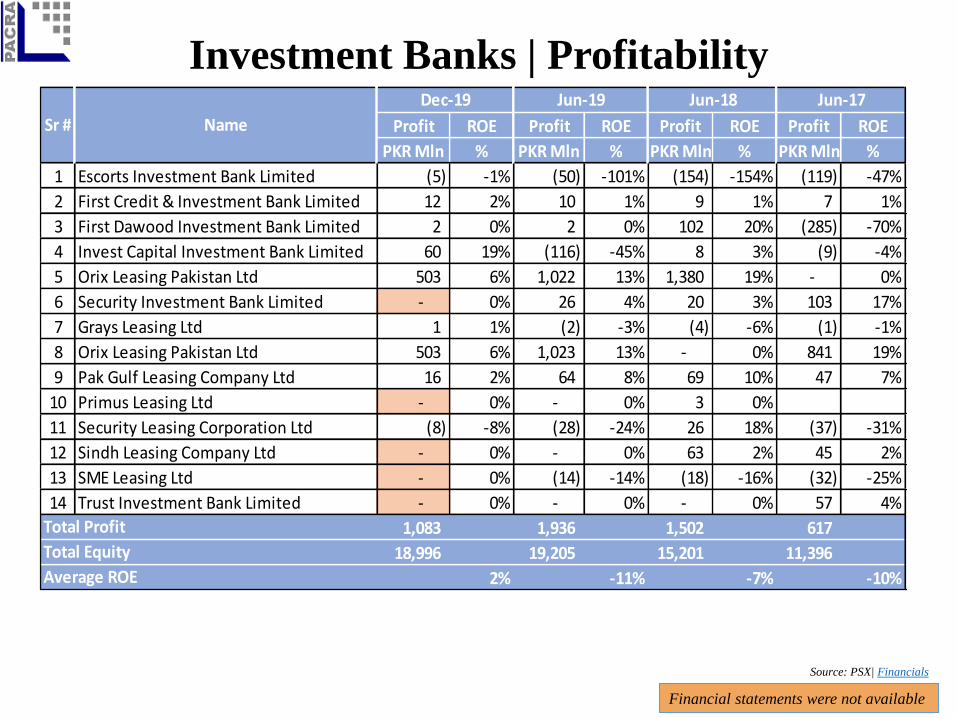
Investment Banks | Profitability
Financial statements were not available
Source: PSX| Financials
Profit ROE Profit ROE Profit ROE Profit ROE
PKR Mln % PKR Mln % PKR Mln % PKR Mln %
1 Escorts Investment Bank Limited (5) -1% (50) -101% (154) -154% (119) -47%
2 First Credit & Investment Bank Limited 12 2% 10 1% 9 1% 7 1%
3 First Dawood Investment Bank Limited 2 0% 2 0% 102 20% (285) -70%
4 Invest Capital Investment Bank Limited 60 19% (116) -45% 8 3% (9) -4%
5 Orix Leasing Pakistan Ltd 503 6% 1,022 13% 1,380 19% - 0%
6 Security Investment Bank Limited - 0% 26 4% 20 3% 103 17%
7 Grays Leasing Ltd 1 1% (2) -3% (4) -6% (1) -1%
8 Orix Leasing Pakistan Ltd 503 6% 1,023 13% - 0% 841 19%
9 Pak Gulf Leasing Company Ltd 16 2% 64 8% 69 10% 47 7%
10 Primus Leasing Ltd - 0% - 0% 3 0%
11 Security Leasing Corporation Ltd (8) -8% (28) -24% 26 18% (37) -31%
12 Sindh Leasing Company Ltd - 0% - 0% 63 2% 45 2%
13 SME Leasing Ltd - 0% (14) -14% (18) -16% (32) -25%
14 Trust Investment Bank Limited - 0% - 0% - 0% 57 4%
1,083 1,936 1,502 617
18,996 19,205 15,201 11,396
2% -11% -7% -10%
Total Profit
Total Equity
Average ROE
Sr # Name
Jun-18 Jun-17Dec-19 Jun-19

Industry
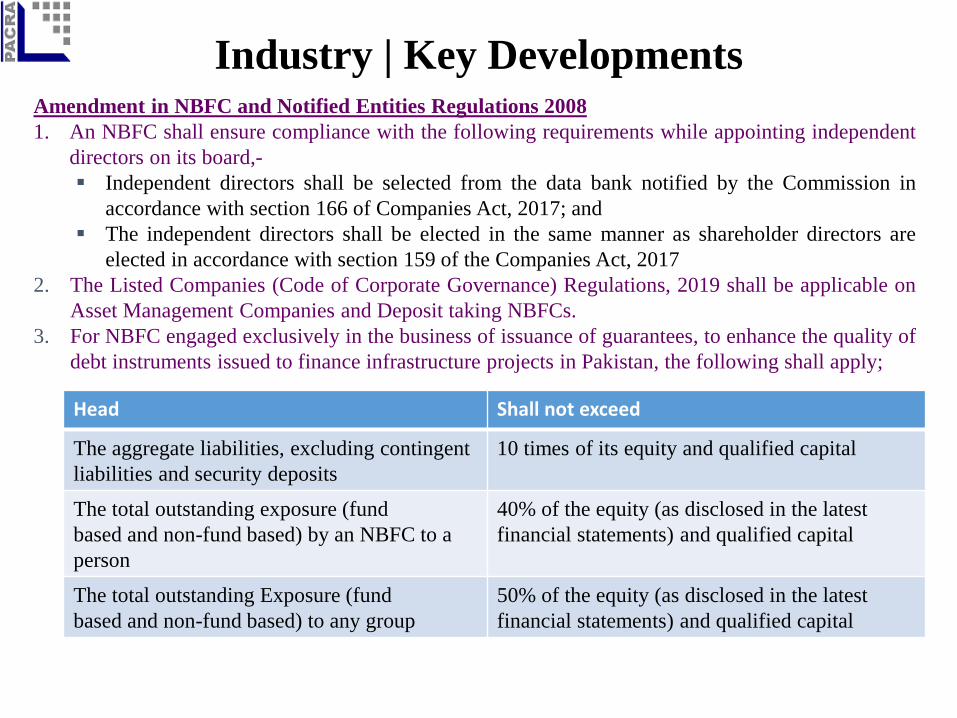
Industry | Key DevelopmentsAmendment in NBFC and Notified Entities Regulations 2008
1. An NBFC shall ensure compliance with the following requirements while appointing independent
directors on its board,-
Independent directors shall be selected from the data bank notified by the Commission in
accordance with section 166 of Companies Act, 2017; and
The independent directors shall be elected in the same manner as shareholder directors are
elected in accordance with section 159 of the Companies Act, 2017
2. The Listed Companies (Code of Corporate Governance) Regulations, 2019 shall be applicable on
Asset Management Companies and Deposit taking NBFCs.
3. For NBFC engaged exclusively in the business of issuance of guarantees, to enhance the quality of
debt instruments issued to finance infrastructure projects in Pakistan, the following shall apply;
Head Shall not exceed
The aggregate liabilities, excluding contingent
liabilities and security deposits
10 times of its equity and qualified capital
The total outstanding exposure (fund
based and non-fund based) by an NBFC to a
person
40% of the equity (as disclosed in the latest
financial statements) and qualified capital
The total outstanding Exposure (fund
based and non-fund based) to any group
50% of the equity (as disclosed in the latest
financial statements) and qualified capital
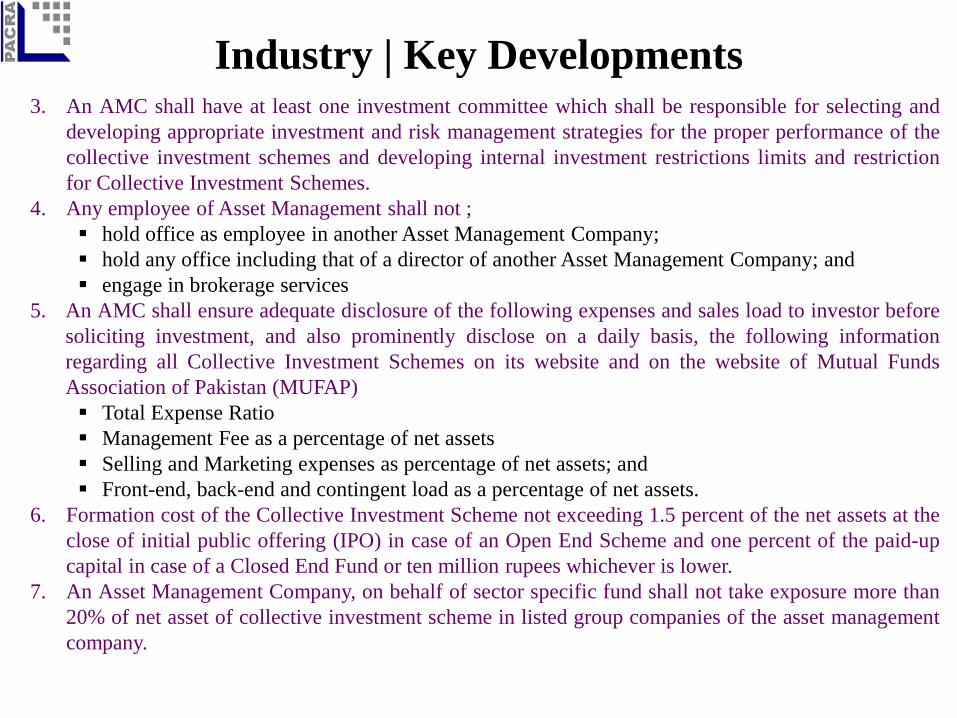
Industry | Key Developments3. An AMC shall have at least one investment committee which shall be responsible for selecting and
developing appropriate investment and risk management strategies for the proper performance of the
collective investment schemes and developing internal investment restrictions limits and restriction
for Collective Investment Schemes.
4. Any employee of Asset Management shall not ;
hold office as employee in another Asset Management Company;
hold any office including that of a director of another Asset Management Company; and
engage in brokerage services
5. An AMC shall ensure adequate disclosure of the following expenses and sales load to investor before
soliciting investment, and also prominently disclose on a daily basis, the following information
regarding all Collective Investment Schemes on its website and on the website of Mutual Funds
Association of Pakistan (MUFAP)
Total Expense Ratio
Management Fee as a percentage of net assets
Selling and Marketing expenses as percentage of net assets; and
Front-end, back-end and contingent load as a percentage of net assets.
6. Formation cost of the Collective Investment Scheme not exceeding 1.5 percent of the net assets at the
close of initial public offering (IPO) in case of an Open End Scheme and one percent of the paid-up
capital in case of a Closed End Fund or ten million rupees whichever is lower.
7. An Asset Management Company, on behalf of sector specific fund shall not take exposure more than
20% of net asset of collective investment scheme in listed group companies of the asset management
company.
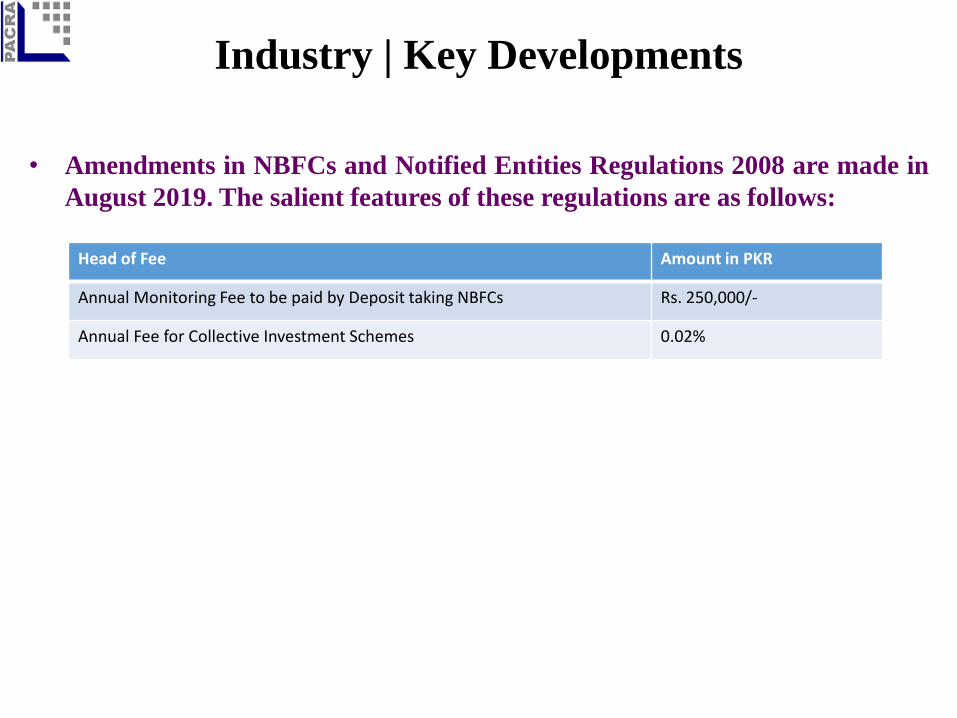
Industry | Key Developments
• Amendments in NBFCs and Notified Entities Regulations 2008 are made in
August 2019. The salient features of these regulations are as follows:
Head of Fee Amount in PKR
Annual Monitoring Fee to be paid by Deposit taking NBFCs Rs. 250,000/-
Annual Fee for Collective Investment Schemes 0.02%
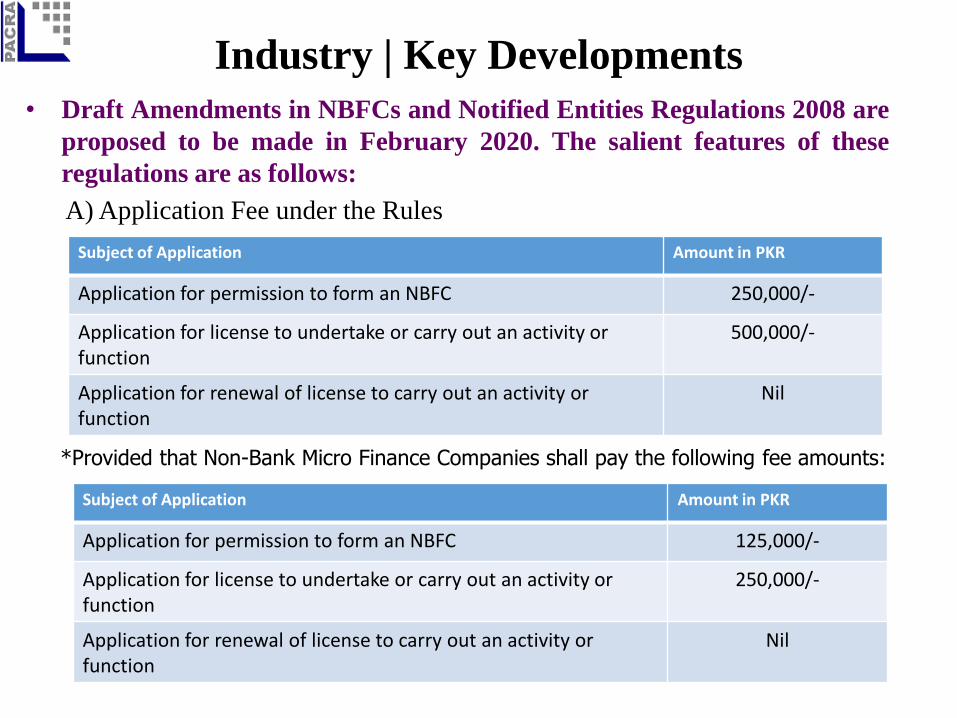
Industry | Key Developments
• Draft Amendments in NBFCs and Notified Entities Regulations 2008 are
proposed to be made in February 2020. The salient features of these
regulations are as follows:
A) Application Fee under the Rules
Subject of Application Amount in PKR
Application for permission to form an NBFC 250,000/-
Application for license to undertake or carry out an activity or function
500,000/-
Application for renewal of license to carry out an activity or function
Nil
*Provided that Non-Bank Micro Finance Companies shall pay the following fee amounts:
Subject of Application Amount in PKR
Application for permission to form an NBFC 125,000/-
Application for license to undertake or carry out an activity or function
250,000/-
Application for renewal of license to carry out an activity or function
Nil
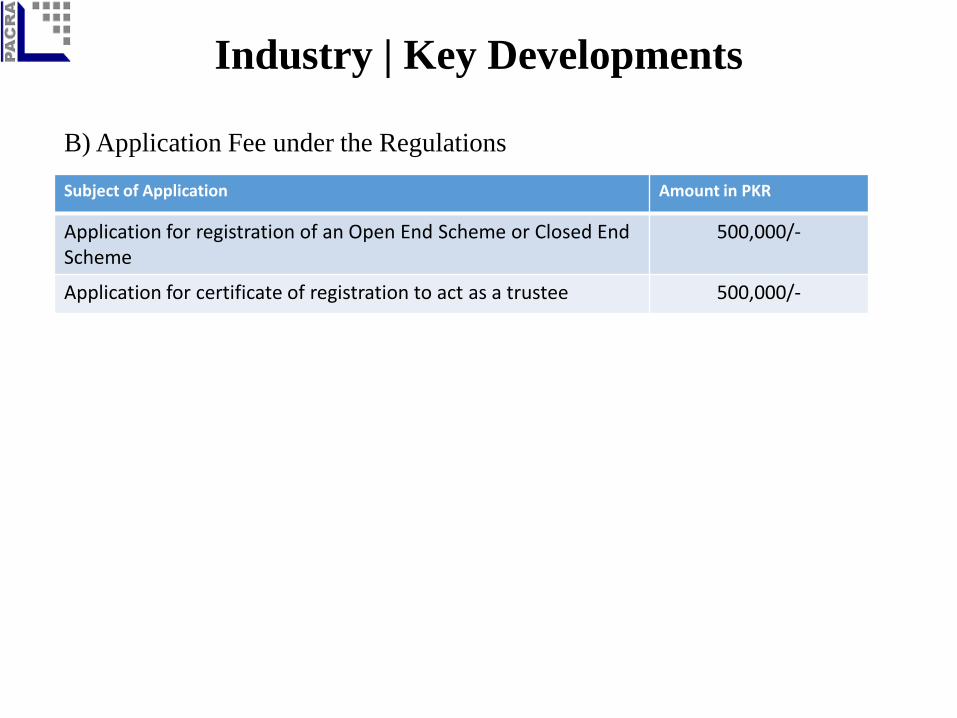
Industry | Key Developments
B) Application Fee under the Regulations
Subject of Application Amount in PKR
Application for registration of an Open End Scheme or Closed End Scheme
500,000/-
Application for certificate of registration to act as a trustee 500,000/-
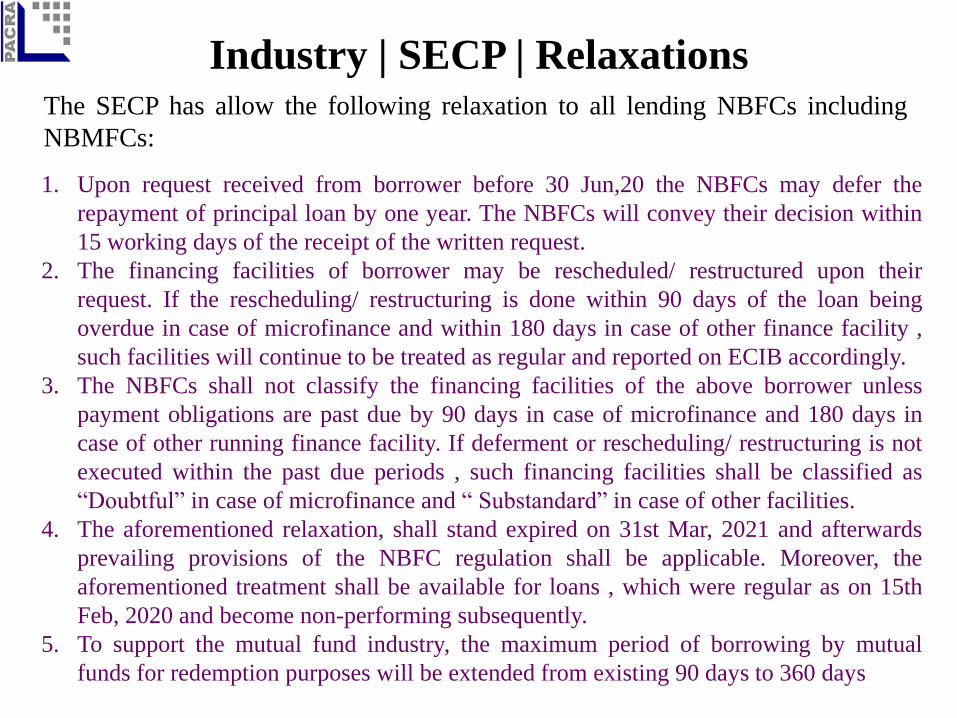
Industry | SECP | RelaxationsThe SECP has allow the following relaxation to all lending NBFCs including
NBMFCs:
1. Upon request received from borrower before 30 Jun,20 the NBFCs may defer the
repayment of principal loan by one year. The NBFCs will convey their decision within
15 working days of the receipt of the written request.
2. The financing facilities of borrower may be rescheduled/ restructured upon their
request. If the rescheduling/ restructuring is done within 90 days of the loan being
overdue in case of microfinance and within 180 days in case of other finance facility ,
such facilities will continue to be treated as regular and reported on ECIB accordingly.
3. The NBFCs shall not classify the financing facilities of the above borrower unless
payment obligations are past due by 90 days in case of microfinance and 180 days in
case of other running finance facility. If deferment or rescheduling/ restructuring is not
executed within the past due periods , such financing facilities shall be classified as
“Doubtful” in case of microfinance and “ Substandard” in case of other facilities.
4. The aforementioned relaxation, shall stand expired on 31st Mar, 2021 and afterwards
prevailing provisions of the NBFC regulation shall be applicable. Moreover, the
aforementioned treatment shall be available for loans , which were regular as on 15th
Feb, 2020 and become non-performing subsequently.
5. To support the mutual fund industry, the maximum period of borrowing by mutual
funds for redemption purposes will be extended from existing 90 days to 360 days
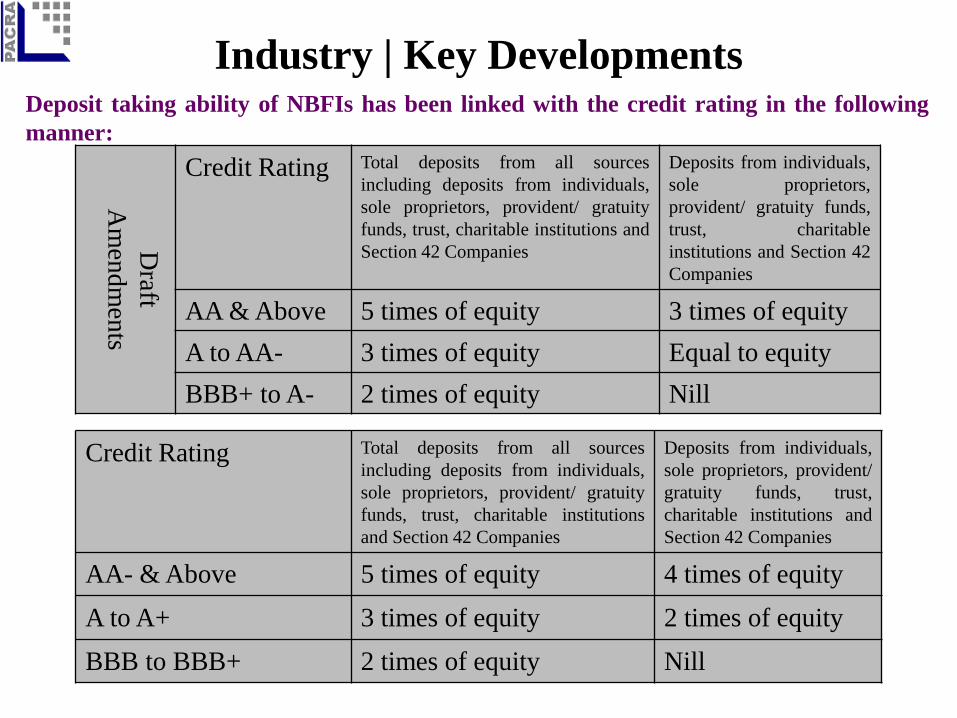
Industry | Key DevelopmentsDeposit taking ability of NBFIs has been linked with the credit rating in the following
manner:
Credit Rating Total deposits from all sources
including deposits from individuals,
sole proprietors, provident/ gratuity
funds, trust, charitable institutions
and Section 42 Companies
Deposits from individuals,
sole proprietors, provident/
gratuity funds, trust,
charitable institutions and
Section 42 Companies
AA- & Above 5 times of equity 4 times of equity
A to A+ 3 times of equity 2 times of equity
BBB to BBB+ 2 times of equity Nill
Draft
Am
end
men
ts
Credit Rating Total deposits from all sources
including deposits from individuals,
sole proprietors, provident/ gratuity
funds, trust, charitable institutions and
Section 42 Companies
Deposits from individuals,
sole proprietors,
provident/ gratuity funds,
trust, charitable
institutions and Section 42
Companies
AA & Above 5 times of equity 3 times of equity
A to AA- 3 times of equity Equal to equity
BBB+ to A- 2 times of equity Nill
Sector Recent Developments
Need to be updated
Two new Modaraba’s floated - Habib Metro Modaraba and Orient Rental
Modaraba.
Modaraba Act 2017 is under deliberation.
Pak Burnei Investment Limited has established a leasing Company in the name
of Primus Leasing Limited.
Challenges
Current Challenges:
Limited product menu on Funding and Lending side which
increases concentration of risks and earnings. Meanwhile, limited
network as compared to banks.
Minimal access to cheaper funds, for resource mobilization.
industry depends on borrowings from banks and DFIs
Inadequate resource mobilization capacity, only few Modarabas
are allowed to accept deposits from public rest are dependent on
equity.
Lack of financial literacy in the country and low savings rate
Lack of depth in the domestic securities market especially bond
market
Bibliography
1. SECP Monthly Sector Summary report - https://www.secp.gov.pk/data-and-statistics/nbfcs/
2. Credit Ratings - https://www.psx.com.pk/psx/resources-and-tools/investors/credit-rating-report
3. SECP Regulation - https://www.secp.gov.pk/laws/regulations
4. Financial Statements - https://financials.psx.com.pk/
5. SECP Press Release - https://www.secp.gov.pk/document/secp-linked-short-selling-with-uptick-rule-in-future-market/?wpdmdl=38884&refresh=5e8a3fd62195f1586118614
6.
Analysts
Jhangeer Hanif
Unit Head Ratings
Usama Liaquat
Assistant Manager Ratings
Bazah Tul Qamar
Financial Analyst
Contact Number: +92 42 3586 9504
DISCLAIMERPACRA has used due care in preparation of this document. Our information has been obtained from sources we
consider to be reliable but its accuracy or completeness is not guaranteed. The information in this document may
be copied or otherwise reproduced, in whole or in part, provided the source is duly acknowledged. The
presentation should not be relied upon as professional advice.