Mobile Operators - Q2 Qo S Report (2012)
16
QUARTER TWO 2012 QUALITY OF SERVICE REPORT FOR MOBILE NETWORK OPERATORS (TNM/AIRTEL) 1.0 INTRODUCTION The quarter two (April, May and June) 2012 report analyses the Key Performance Indicators which have been achieved by the GSM Service providers namely TNM and Airtel. The Key Performance Indicators (KPI)under consideration are Radio Network Availability, Call Set up Success Rate, SDCCH Congestion, Traffic Channel Congestion, Call Drop Rate, Handover Success Rate, GPRS Context Activation Success Rate, SMS Success Rate, Trunk Congestion, MSC Availability and IN Platform Availability. All the graphs in this report were plotted using already analyzed data which was submitted by both Airtel and Telekom Networks Malawi Limited. It must be noted that MACRA currently does not have proper tools to independently verify what has been submitted by the operators. Quarter Two 2012 - Quality of Service Report Page 1
-
Upload
independent -
Category
Documents
-
view
0 -
download
0
Transcript of Mobile Operators - Q2 Qo S Report (2012)
QUARTER TWO 2012 QUALITY OF SERVICE REPORT FOR MOBILE NETWORKOPERATORS (TNM/AIRTEL)
1.0INTRODUCTION
The quarter two (April, May and June) 2012 report analyses theKey Performance Indicators which have been achieved by the GSMService providers namely TNM and Airtel.
The Key Performance Indicators (KPI)under consideration areRadio Network Availability, Call Set up Success Rate, SDCCHCongestion, Traffic Channel Congestion, Call Drop Rate,Handover Success Rate, GPRS Context Activation Success Rate,SMS Success Rate, Trunk Congestion, MSC Availability and INPlatform Availability.
All the graphs in this report were plotted using already analyzed data whichwas submitted by both Airtel and Telekom Networks Malawi Limited. It mustbe noted that MACRA currently does not have proper tools to independentlyverify what has been submitted by the operators.
Quarter Two 2012 - Quality of Service Report Page 1

2.0 KEY PERFORMANCE INDICATORS
2.1 CALL SET UP SUCCESS RATE
The Call Set up Success Rate assesses the percentage oforiginating calls that were successfully established bycustomers. In any GSM network, not all call attempts made bycustomers are successfully established.
The target set by MACRA for this KPI is 98.0%, meaning only 2%percent of the calls may experience Call Setup failure beyondwhich the quality of service will decline.
Graph 1 showing Call Set Up Success Rate
Quarter Two 2012 - Quality of Service Report Page 2

NOTES:
TNM failed to meet the target during the entire period under review as shown in the graph above.
Airtel managed to meet the target during the entire period under review.
2.2 PERCENTAGE OF CONNECTIONS WITH GOOD VOICE QUALITY (SIGNALLING AND TRAFFIC CHANNEL CONGESTION)
This Key Performance Indicator measures the Percentage of callconnections with good voice quality. Percentage of connectionswith good voice quality is made up of two components namelyTraffic Channel (TCH) congestion and signalling (SDCCH)congestion. The implication of this congestion is that anycustomer establishing a call will not be able to successfullymake that call. He or She is likely to encounter messages suchas network busy or circuit congestion if using smart phones ora busy tone if using ordinary phones.
2.2.1 SIGNALLING (SDCCH) CONGESTION
The target for this Key Performance Indicator (SignallingChannel Congestion) set by MACRA is 0.5%. This means 99.5% ofthe calls should be established at any particular time withoutexperiencing signalling channel congestion. The signallingchannels facilitate easy establishment of a call.
Quarter Two 2012 - Quality of Service Report Page 3

Graph 2 Showing SDCCH Congestion
NOTES:
TNM failed to meet the target during the entire periodunder review as indicated in the graph above.
Airtel managed to meet the target during the entireperiod under review.
The graph includes Q1 statistics because the graph in theQ1 report had some anomalies especially with Airtel
2.2.2 TRAFFIC CHANNEL (TCH) CONGESTION
This Key Performance Indicator directly relates to SDCCHCongestion in as far as Voice quality is concerned. TheQuarter Two 2012 - Quality of Service Report Page 4

Traffic congestion comes into play when the number ofcustomers are increasing in a particular area or network andthis is usually resolved by adding software or hardwarecapacity, especially voice channels, in the affected node ofthe network inorder to increase capacity.
The target for this Key Performance Indicator is 2% meaningonly 2% of the calls are allowed to failed due to this type ofcongestion.
Graph 3 Showing Traffic Channel Conhgestion
NOTES:
TNM failed to meet the target during the entire period under review.
Airtel managed to meet the target during the entire period under review.
Quarter Two 2012 - Quality of Service Report Page 5

2.3 CALL DROP RATE
This Key Performance Indicator (Call drop rate) is a measureof calls that are prematurely disconnected before end ofconversation against the number of all successfullyestablished calls. Call drops may be experienced due tonetwork problems such as handover failure or equipment faults.
The target for this Key Performance Indicator is 2% meaningonly 2% of the calls are allowed to drop during conversation.
Graph 4 Showing Call Drop Rate
NOTES:
Quarter Two 2012 - Quality of Service Report Page 6

TNM managed to meet the target during the entire periodunder review as indicated in the graph above.
Airtel managed to meet the target during the entireperiod under review.
The graph includes Q1 statistics because the graph in theQ1 report had some anomalies especially with Airtel
2.4 HANDOVER SUCCESS RATE
This Key Performance Indicator (Handover Success Rate)measures the ability of a customer to talk on the cell phonefor a long distance without getting disconnected. It is theability of a call connection to be handed over from one cellto another without losing the connection. This Key PerformanceIndicator is directly linked to call drop rate because ahandover failure normally results into a dropped call.
The target for this Key Performance Indicator set by MACRA is90%, meaning only 10% percent of the calls may experienceHandover failure beyond which the grade of service willdecline.
Quarter Two 2012 - Quality of Service Report Page 7

Graph 5 Showing Handover Success Rate
NOTES:
TNM failed to meet the target during the entire periodunder review as indicated in the graphs above.
Airtel managed to meet the target during the entireperiod under review.
2.5 GPRS CONTEXT ACTIVATION SUCCESS RATE
GPRS context activation success rate is a measure of datarelated services that were successfully accessed by customers.One typical example of data related service is the Internet.
The target for this Key Performance Indicator set by MACRA is90%, meaning only 10% percent of the users may experience GPRSContext Activation failure beyond which the grade of servicewill decline.
Quarter Two 2012 - Quality of Service Report Page 8
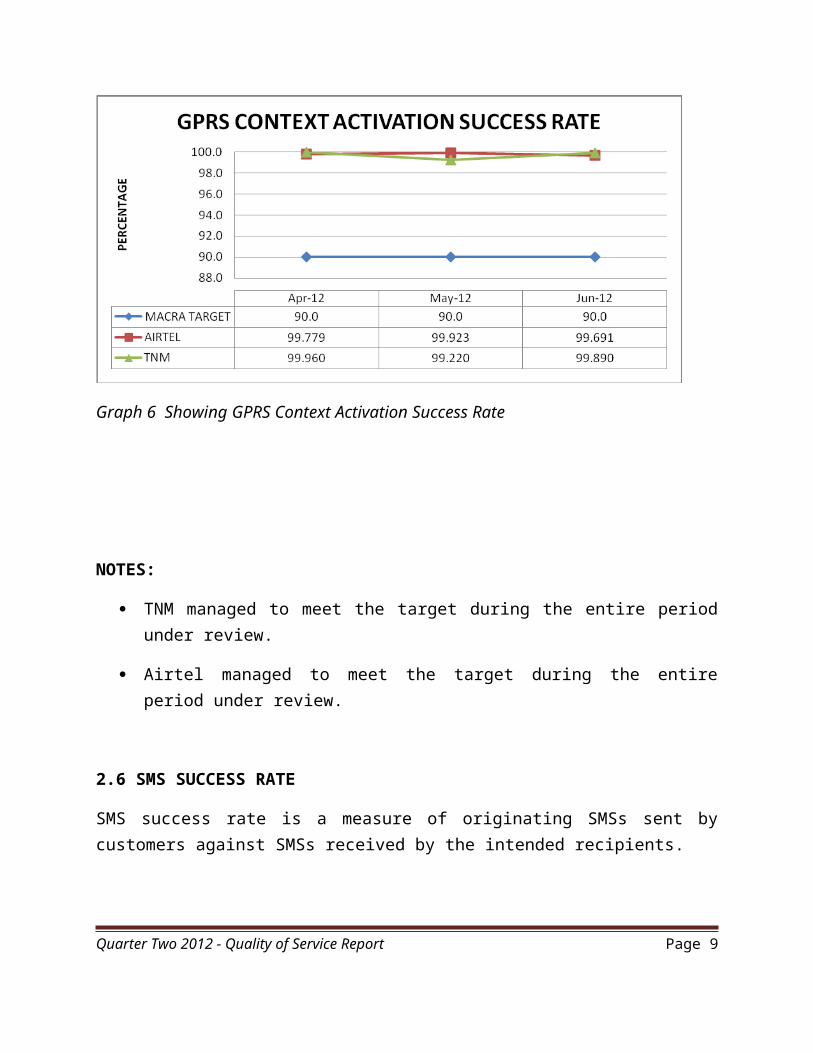
Graph 6 Showing GPRS Context Activation Success Rate
NOTES:
TNM managed to meet the target during the entire periodunder review.
Airtel managed to meet the target during the entireperiod under review.
2.6 SMS SUCCESS RATE
SMS success rate is a measure of originating SMSs sent bycustomers against SMSs received by the intended recipients.
Quarter Two 2012 - Quality of Service Report Page 9

The target for this Key Performance Indicator set by MACRA is90% meaning only 10 out of 100 SMSs may be allowed to fail.
SMS Success rate is affected by a number of factors. Forexample when customer’s SMS inbox is full this may prohibitincoming of new SMSs. Also when customers attempt to send anSMS when they don’t have credit in their cell phones , asignal of SMS delivery failure is sent back to the SMSserver.
SMS failure can also be caused by faulty equipment liketransmission, Base Transceiver Station, Base StationController, Mobile Switching Center, SMS server etc.
Graph 7 Showing SMS Success Rate
NOTES:
TNM managed to meet the target during the entire periodunder review as shown in the graph above.
Quarter Two 2012 - Quality of Service Report Page 10

Airtel managed to meet the target during the entireperiod under review.
2.7 TRUNK CONGESTION
Trunk congestion is a measure of traffic congestion betweenMobile Switching Center (MSC) and the various routes likeinterconnection to other network operators (MTL/ACL) includingInternational traffic.
The target for this Key Performance Indicator set by MACRA is2%, meaning only 2% percent of the calls may experience trunkcongestion beyond which the grade of service will decline.
When there is congestion in a particular route customers willnot be able to access services in that route. One typicalexample of such congestion is the call centre route wherebycustomers cannot easily access the Customer Care Centre.Customers may simply be told by the recorded message thatall the customer agents are busy and please hold the line.
Quarter Two 2012 - Quality of Service Report Page 11

Graph 8 Showing Trunk Congestion
NOTES:
Both TNM and Airtel managed to meet the target during theentire period under review as shown in the graph above.
2.8 MOBILE SWITCHING CENTRE (MSC) AVAILABILITY
Mobile Switching Centre availability is the time in minutesper month when the MSC’s were up and running. If MSC fails,there can be no network availability in the whole country orparticular regions served by the affected MSC.
Mobile Switching Centre is the core equipment that controlsthe entire GSM network and the target for this Key PerformanceIndicator set by MACRA is 99.999%.
Quarter Two 2012 - Quality of Service Report Page 12

Graph 9 Showing MSC Availability
NOTES:
Both TNM and Airtel managed to meet the target during theentire period under review as shown in the graph above.
2.9 IN PLATFORM AVAILABILITY
Intelligent Network (IN) platform is a network architecturethat separates service logic from switching equipment,allowing new services to be added without having to redesignswitches to support new services. It encourages competitionamong service providers since it makes it easier for aprovider to add services and it offers customers more servicechoices.
Quarter Two 2012 - Quality of Service Report Page 13

Like MSC availability, the target for this Key PerformanceIndicator set by MACRA is 99.999%. IN platform availability isthe time in minutes per month when the Intelligent NetworkPlatform was up and running. When IN platform is out of order,customers cannot be billed correctly.
Graph 10 Showing IN Platform availability
NOTES:
Both TNM and Airtel managed to meet the target during theentire period under review as shown in the graph above.
2.10 RADIO NETWORK AVAILABILITY
Quarter Two 2012 - Quality of Service Report Page 14

This Key Performance Indicator measures Radio NetworkAvailability. Radio Network Availability is the time inminutes per month when Base Transceiver Stations were up andrunning.
The target for Radio Network Availability set by MACRA is99.8%, meaning only 0.2% percent of the time, users withinnetwork coverage area may experience unavailability of networksignal beyond which the grade of service is consideredunacceptable.
When a Base Transceiver Station is down, customers surroundingthat Base Transceiver Station will not be able to make orreceive calls since there will be no network signal on theircell phones during the outage time.
Graph 11 Showing Radio Network Availability
NOTES:
Quarter Two 2012 - Quality of Service Report Page 15

Both TNM and Airtel failed to meet the target during the entire period under review.
3.0 CONCLUSION
Both operator need to be commended for all the key performanceIndicators targets they managed to beat.
TNM must improve its Call setup Success Rate, SDCCHcongestion, Traffic Channel Congestion, Hand Over Success Rateand Radio Network Availability as its performance in these Keyperformance Indicators was below acceptable levels.
Airtel must improve its Radio Network Availability as itsperformance in this Key performance Indicator was belowacceptable levels.
The achieved KPIs may look good probably because they aremonthly averages. However MACRA is aware that customers areexperiencing poor quality of services as evidenced by droppedcalls, congestion, poor voice quality, echos, one waytransmission (where you are able to hear the called or thecalling person but she or he can not hear you) and so on.
Quarter Two 2012 - Quality of Service Report Page 16