
MMST16-1093.pdf - Landtag NRW
101
Uni KiD - Universiläts-Frauenklinik - Moorenslrasse 5 - 0-40225 Oüsseldorf Per email als PDF an [email protected] Kinderwunsch-Anhörung A 04-10.10.2013 Ansprechpartner: Prof. Dr. med. J.-$. Krüssel Durchwahl: (0211) 81-04062 Kinderwunsch-Anhörung A 04-10.10.2013 Sehr geehrte Damen und Herren, E-Mail: [email protected] Datum: 20.09.2013 vielen Dank für die Gelegenheit, als reproduktionsmedizinischer Sachverständiger zu den Fragen des Kataloges vom 29.07.2013, sowie zu dem Antrag der Fraktion der CDU und der Fraktion der FDP (Drucksache 16/2624) Stellung nehmen zu dürfen! Die Originale der zitierten Veröffentlichungen sind als PDF-Dateien beigefügt. Wie Sie meinem beigefügten Lebenslauf entnehmen können, bin ich sowohl als Leiter des größten universitären Kinderwunschzentrums Deutschlands UniKiD als auch in meinen Funktionen als Mitglied des Wissenschaftlichen Beirates der Bundesärztekammer, als Vorstand des Deutschen IVF-Registers (D.I.R) und als Vorstandsmitglied der Deutschen Gesellschaft für Reproduktionsmedizin in klinischer, wissenschaftlicher und berufspolitischer Hinsicht tief in die Materie eingearbeitet. Der Antrag (Drucksache 16/2624) ist aus meiner Sicht uneingeschränkt zu unterstützen, die dort genannten Fakten sind korrekt und die emotionale Belastung der Kinderwunschpaare ist treffend dargestellt. Die finanzielle Belastung der gesetzlich versicherten Kinderwunschpaare hat tatsächlich mit Inkrafttreten des GMG am 01.01.2004 zu einem Rückgang der in vitro Fertilisationsbehandlungen (IVF) und Behandlungen mittels intrai'ytoplasmatischer Spermiuminjektion (lCSI) in Deutschland um >50% geführt (Abb. 1). (. '.' .. Universitäres Interdisziplinäres Kinderwunschzentrum Düsseldorf Webseiten des Zentrums www.unikid.de, www.unikid.eu Frauenheilkunde Direktorin: Univ.-Prof. Dr. T. Fehm Prof. Dr. med. Jan-S. KlÜssel Koordinator Arzt für Frauenheilkunde und Geburtshilfe Gynäkologische Endokrinologie und Reproduktionsmedizin Priv.-Doz. Dr. med. Alexandra Hess Dr. med. Barbara Mikal-Drozdzynski Dr. med. Andrea Schanz Ärztinnen für Frauenheilkunde und Geburtshilfe Gynäkologische Endokrinologie und Reproduktionsmedizin Dr. med. Nina Bachmann Dr. med. Tanja Freundl-Schüll Sonja Schu Ärztinnen für Frauenheilkunde und Geburtshilfe Dr. med. Daniel Fehr. M.Sc. Arzt für Frauenheilkunde und Geburtshilfe Tel.: (0211) 81-04060 Fax: (0211) 81-16787 Dr. rer. nat. Jens Hirchenhain Leiter IVF-Labor Tel.: (0211) 81-04067 Dr. rer. nal. Ounja Baslon-Büst Forschungslabor UniKiD Tel.: (0211) 81-17532 Abteilung für Andrologie der Universitäts-Hautklinik Direktor: Univ,·Prof. Dr, med. S. Homey Dr. med. Norbert J. Neumann Arzt für Haut- und Geschlechtskrankheiten Tel.: (0211) 81-04525 (Mo. - 00., 08:00-11:00) Urologische Klinik Direktor: Univ.-Prof. Dr. med. Peter Albers Dr. med. Volker Müller-Mattheis Arzt für Urologie Tel.: (0211) 81·16274 Institut für Humangenetik und Anthropologie Direktorin: Univ,·Prof. Dr. rer, nat. S, Royer-Pokora Prof. Or. med. Harald Rieder Tel.: (0211) 81-12355 (Sekretariat) Klinisches Institut für psychosomatische Medizin und Psychotherapie Direktor: Univ.·Prof, Dr. med. Dr. phil, W, Tress Univ.-Prof. Dr. med. M. Franz Stellv. Instilutsdirektor Tel.: (0211) 81-18855 (Sekretariat) 16 STELLUNGNAHME 16/1093 Alle Abg Uni KiD - Universiläts-Frauenklinik - Moorenslrasse 5 - 0-40225 Oüsseldorf LANDTAG NORDRHEIN-WESTFALEN . WAHLPERIODE Per email als PDF an [email protected] Kinderwunsch-Anhörung A 04-10.10.2013 Ansprechpartner: Prof. Dr. med. J.-$. Krüssel Durchwahl: (0211) 81-04062 Kinderwunsch-Anhörung A 04-10.10.2013 Sehr geehrte Damen und Herren, E-Mail: [email protected] Datum: 20.09.2013 vielen Dank für die Gelegenheit, als reproduktionsmedizinischer Sachverständiger zu den Fragen des Kataloges vom 29.07.2013, sowie zu dem Antrag der Fraktion der CDU und der Fraktion der FDP (Drucksache 16/2624) Stellung nehmen zu dürfen! Die Originale der zitierten Veröffentlichungen sind als PDF-Dateien beigefügt. Wie Sie meinem beigefügten Lebenslauf entnehmen können, bin ich sowohl als Leiter des größten universitären Kinderwunschzentrums Deutschlands UniKiD als auch in meinen Funktionen als Mitglied des Wissenschaftlichen Beirates der Bundesärztekammer, als Vorstand des Deutschen IVF-Registers (D.I.R) und als Vorstandsmitglied der Deutschen Gesellschaft für Reproduktionsmedizin in klinischer, wissenschaftlicher und berufspolitischer Hinsicht tief in die Materie eingearbeitet. Der Antrag (Drucksache 16/2624) ist aus meiner Sicht uneingeschränkt zu unterstützen, die dort genannten Fakten sind korrekt und die emotionale Belastung der Kinderwunschpaare ist treffend dargestellt. Die finanzielle Relastung der gesetzlich versicherten Kinderwunschpaare hat tatsächlich mit Inkrafttreten des GMG am 01.01.2004 zu einem Rückgang der in vitro Fertilisationsbehandlungen (IVF) und Behandlungen mittels intrai'ytoplasmatischer Spermiuminjektion (iCSI) in Deutschland um >50% geführt (Abb. 1). ( '.' L" Universitäres Interdisziplinäres Kinderwunschzentrum Düsseldorf Webseiten des Zentrums www.unikid.de, www.unikid.eu Frauenheilkunde Direktorin: Univ.-Prof. Dr. T. Fehm Prof. Dr. med. Jan-S. KlÜssel Koordinator Arzt für Frauenheilkunde und Geburtshilfe Gynäkobgische Endokrinobgie und Reproduktionsmedizin Priv.-Doz. Dr. med. Alexandra Hess Dr. med. Barbara Mikal-Drozdzynski Dr. med. Andrea Schanz Ärztinnen für Frauenheilkunde und Geburtshilfe Gynäkologische Endokrinologie und Reproduktionsmedizin Dr. med. Nina Bachmann Dr. med. Tanja Freundl-Schüll Sonja Schu Ärztinnen für Frauenheilkunde und Geburtshilfe Dr. med. Daniel Fehr. M.Sc. Arzt fü" Frauenheilkunde und Geburtshilfe Tel.: (0211) 81-04060 Fax: (0211) 81-16787 Dr. rer. nat. Jens Hirchenhain Leiter IVF-Labor Tel.: (0211) 81-04067 Dr. rer. nal. Ounja Baslon-Büst Forschungslabor UniKiD Tel.: (0211) 81-17532 Abteilung für Andrologie der Universitäts-Hautklinik Direktor: Univ.·Prof. Dr. med. B. Homey Dr. med. Norbert J. Neumann Arzt für Haut- ufld Geschlechtskrankheiten Tel.: (0211) 81-04525 (Mo. - 00., 08:00-11:00) Urologische Klinik Direktor: Univ.-Prof. Dr. med. Peter Albers Dr. med. Volker Müller-Mattheis Arzt für Urologie Tel.: (0211) 81·16274 Institut für Humangenetik und Anthropologie Direktorin: Univ.·Prof. Dr. rer. nat. B. Royer-Pokora Prof. Or. med. Harald Rieder Tel.: (0211) 81-12355 (Sekretariat) Klinisches Institut für psychosomatische Medizin und Psychotherapie Direktor: Univ.·Prof. Dr. med. Dr. phil. W. Tress Univ.-Prof. Dr. med. M. Franz Stellv. Instilutsdirektor Tel.: (0211) 81-18855 (Sekretariat)
-
Upload
khangminh22 -
Category
Documents
-
view
0 -
download
0
Transcript of MMST16-1093.pdf - Landtag NRW

Uni KiD - Universiläts-Frauenklinik - Moorenslrasse 5 - 0-40225 Oüsseldorf
Per email als PDF an
Kinderwunsch-Anhörung A 04-10.10.2013
Ansprechpartner:
Prof. Dr. med. J.-$. Krüssel
Durchwahl:
(0211) 81-04062
Kinderwunsch-Anhörung A 04-10.10.2013
Sehr geehrte Damen und Herren,
E-Mail:
Datum:
20.09.2013
vielen Dank für die Gelegenheit, als reproduktionsmedizinischer Sachverständiger zu den Fragen des Kataloges vom 29.07.2013, sowie zu dem Antrag der Fraktion der CDU und der Fraktion der FDP (Drucksache 16/2624) Stellung nehmen zu dürfen! Die Originale der zitierten Veröffentlichungen sind als PDF-Dateien beigefügt.
Wie Sie meinem beigefügten Lebenslauf entnehmen können, bin ich sowohl als Leiter des größten universitären Kinderwunschzentrums Deutschlands UniKiD als auch in meinen Funktionen als Mitglied des Wissenschaftlichen Beirates der Bundesärztekammer, als Vorstand des Deutschen IVF-Registers (D.I.R) und als Vorstandsmitglied der Deutschen Gesellschaft für Reproduktionsmedizin in klinischer, wissenschaftlicher und berufspolitischer Hinsicht tief in die Materie
eingearbeitet.
Der Antrag (Drucksache 16/2624) ist aus meiner Sicht uneingeschränkt zu unterstützen, die dort genannten Fakten sind korrekt und die emotionale Belastung der Kinderwunschpaare ist treffend dargestellt. Die finanzielle Belastung der gesetzlich versicherten Kinderwunschpaare hat tatsächlich mit Inkrafttreten des GMG am 01.01.2004 zu einem Rückgang der in vitro Fertilisationsbehandlungen (IVF) und Behandlungen mittels intrai'ytoplasmatischer Spermiuminjektion (lCSI) in Deutschland um >50% geführt (Abb. 1).
(. '.' ..
Universitäres Interdisziplinäres Kinderwunschzentrum Düsseldorf
Webseiten des Zentrums www.unikid.de, www.unikid.eu
Frauenheilkunde Direktorin: Univ.-Prof. Dr. T. Fehm
Prof. Dr. med. Jan-S. KlÜssel Koordinator Arzt für Frauenheilkunde und Geburtshilfe Gynäkologische Endokrinologie und Reproduktionsmedizin Priv.-Doz. Dr. med. Alexandra Hess Dr. med. Barbara Mikal-Drozdzynski Dr. med. Andrea Schanz Ärztinnen für Frauenheilkunde und Geburtshilfe Gynäkologische Endokrinologie und Reproduktionsmedizin Dr. med. Nina Bachmann Dr. med. Tanja Freundl-Schüll Sonja Schu Ärztinnen für Frauenheilkunde und Geburtshilfe Dr. med. Daniel Fehr. M.Sc. Arzt für Frauenheilkunde und Geburtshilfe Tel.: (0211) 81-04060 Fax: (0211) 81-16787
Dr. rer. nat. Jens Hirchenhain Leiter IVF-Labor Tel.: (0211) 81-04067
Dr. rer. nal. Ounja Baslon-Büst Forschungslabor UniKiD Tel.: (0211) 81-17532
Abteilung für Andrologie der Universitäts-Hautklinik Direktor: Univ,·Prof. Dr, med. S. Homey Dr. med. Norbert J. Neumann Arzt für Haut- und Geschlechtskrankheiten Tel.: (0211) 81-04525 (Mo. - 00., 08:00-11:00)
Urologische Klinik Direktor: Univ.-Prof. Dr. med. Peter Albers Dr. med. Volker Müller-Mattheis Arzt für Urologie Tel.: (0211) 81·16274
Institut für Humangenetik und Anthropologie Direktorin: Univ,·Prof. Dr. rer, nat. S, Royer-Pokora Prof. Or. med. Harald Rieder Tel.: (0211) 81-12355 (Sekretariat)
Klinisches Institut für psychosomatische Medizin und Psychotherapie Direktor: Univ.·Prof, Dr. med. Dr. phil, W, Tress Univ.-Prof. Dr. med. M. Franz Stellv. Instilutsdirektor Tel.: (0211) 81-18855 (Sekretariat)
16
STELLUNGNAHME
16/1093Alle Abg
Uni KiD - Universiläts-Frauenklinik - Moorenslrasse 5 - 0-40225 Oüsseldorf LANDTAG NORDRHEIN-WESTFALEN
. WAHLPERIODE Per email als PDF an
Kinderwunsch-Anhörung A 04-10.10.2013
Ansprechpartner:
Prof. Dr. med. J.-$. Krüssel
Durchwahl:
(0211) 81-04062
Kinderwunsch-Anhörung A 04-10.10.2013
Sehr geehrte Damen und Herren,
E-Mail:
Datum:
20.09.2013
vielen Dank für die Gelegenheit, als reproduktionsmedizinischer Sachverständiger zu den Fragen des Kataloges vom 29.07.2013, sowie zu dem Antrag der Fraktion der CDU und der Fraktion der FDP (Drucksache 16/2624) Stellung nehmen zu dürfen! Die Originale der zitierten Veröffentlichungen sind als PDF-Dateien beigefügt.
Wie Sie meinem beigefügten Lebenslauf entnehmen können, bin ich sowohl als Leiter des größten universitären Kinderwunschzentrums Deutschlands UniKiD als auch in meinen Funktionen als Mitglied des Wissenschaftlichen Beirates der Bundesärztekammer, als Vorstand des Deutschen IVF-Registers (D.I.R) und als Vorstandsmitglied der Deutschen Gesellschaft für Reproduktionsmedizin in klinischer, wissenschaftlicher und berufspolitischer Hinsicht tief in die Materie
eingearbeitet.
Der Antrag (Drucksache 16/2624) ist aus meiner Sicht uneingeschränkt zu unterstützen, die dort genannten Fakten sind korrekt und die emotionale Belastung der Kinderwunschpaare ist treffend dargestellt. Die finanzielle Relastung der gesetzlich versicherten Kinderwunschpaare hat tatsächlich mit Inkrafttreten des GMG am 01.01.2004 zu einem Rückgang der in vitro Fertilisationsbehandlungen (IVF) und Behandlungen mittels intrai'ytoplasmatischer Spermiuminjektion (iCSI) in Deutschland um >50% geführt (Abb. 1).
( '.' L"
Universitäres Interdisziplinäres Kinderwunschzentrum Düsseldorf
Webseiten des Zentrums www.unikid.de, www.unikid.eu
Frauenheilkunde Direktorin: Univ.-Prof. Dr. T. Fehm
Prof. Dr. med. Jan-S. KlÜssel Koordinator Arzt für Frauenheilkunde und Geburtshilfe Gynäkobgische Endokrinobgie und Reproduktionsmedizin Priv.-Doz. Dr. med. Alexandra Hess Dr. med. Barbara Mikal-Drozdzynski Dr. med. Andrea Schanz Ärztinnen für Frauenheilkunde und Geburtshilfe Gynäkologische Endokrinologie und Reproduktionsmedizin Dr. med. Nina Bachmann Dr. med. Tanja Freundl-Schüll Sonja Schu Ärztinnen für Frauenheilkunde und Geburtshilfe Dr. med. Daniel Fehr. M.Sc. Arzt fü" Frauenheilkunde und Geburtshilfe Tel.: (0211) 81-04060 Fax: (0211) 81-16787
Dr. rer. nat. Jens Hirchenhain Leiter IVF-Labor Tel.: (0211) 81-04067
Dr. rer. nal. Ounja Baslon-Büst Forschungslabor UniKiD Tel.: (0211) 81-17532
Abteilung für Andrologie der Universitäts-Hautklinik Direktor: Univ.·Prof. Dr. med. B. Homey Dr. med. Norbert J. Neumann Arzt für Haut- ufld Geschlechtskrankheiten Tel.: (0211) 81-04525 (Mo. - 00., 08:00-11:00)
Urologische Klinik Direktor: Univ.-Prof. Dr. med. Peter Albers Dr. med. Volker Müller-Mattheis Arzt für Urologie Tel.: (0211) 81·16274
Institut für Humangenetik und Anthropologie Direktorin: Univ.·Prof. Dr. rer. nat. B. Royer-Pokora Prof. Or. med. Harald Rieder Tel.: (0211) 81-12355 (Sekretariat)
Klinisches Institut für psychosomatische Medizin und Psychotherapie Direktor: Univ.·Prof. Dr. med. Dr. phil. W. Tress Univ.-Prof. Dr. med. M. Franz Stellv. Instilutsdirektor Tel.: (0211) 81-18855 (Sekretariat)

Stellungnahme zu Drucksache 16/2624 Prof. Dr. med. Jan-S. Krüssel, UniKiD Seite 2 von 12
Abb.1: Fallzahlen IVF und I(SI pro Jahr anhand des D.I.R. Rückgang der Zahlen von 80434 in 2003 auf 37633 in 2004. Aus: J Reproduktionsmed Endokrinol 2012: 9(6)15
Weiterhin lässt sich anhand der Daten des Deutschen IVF-Registers (D.I.R) klar belegen, dass die Zahl der nach Inkrafttreten des GMG am 01.01.2004 durch IVF oder 1(51 geborenen Kinder in Deutschland im Jahr 2004 um 8735 (=51,05%) im Vergleich zum Vorjahr zurückgegangen ist (Abb. 2).
Abb.2: Geborene Kinder nach lVF und leSI pro Jahr aus an hand des D.I.R. Rückgang der Zahlen von 17111 in 2003 auf 8376 in 2004. Aus: J Reproduktionsmed Endokrinol 2012: 9(6)29
Ein weiterer negativer Effekt der Gesundheitsreform und der damit verbundenen Einschränkung der leistungen für gesetzlich Krankenversicherte ist der nachweisbare Anstieg des Alters der Patientinnen und Patienten bei Behandlung in einem Kinderwunschzentrum (Abb. 3).

Stellungnahme zu Drucksache 16/2624 Prof. Dr. med. Jan-S. Krüssel, UniKiD Seite 3 von 12
Abb.3: Anstieg des durchschnittlichen Alters der Behandelten. Nach Inkrafttreten des GMG ist das Alter sprunghaft angestiegen. Aus: J Reproduktionsmed Endokrinol 2012: 9(6)26
Dieser Altersanstieg wiederum hat unmittelbare negative Auswirkungen auf den möglichen Behandlungserfolg, da die Schwangerschaftswahrscheinlichkeit nach reproduktionsmedizinischer Behandlung mit zunehmendem Alter der Patientin dramatisch abnimmt (Abb. 4). Der negative Effekt des Alters der Frau ist hierbei sowohl auf die abnehmende Anzahl der Eizellen (Verminderung der ovariellen Reserve), als auch auf die Zunahme von genetischen Störungen während der meiotischen Reifeteilung der Eizellen zurückzuführen.
Abb.4: Abnahme der Schwangerschaftswahrscheinlichkeit und Zunahme des Fehfgeburtrisikos abhängig vom Alter der Patientin. Aus: J Reproduktionsmed Endokrinol 2012: 9(6)22
Der Fragenkatalog enthält einige Fragen, welche sich offensichtlich an Sachverständige aus anderen Gebieten richten. Die Fragen, zu denen ich in meiner Funktion als Reproduktionsmediziner fundiert Stellung nehmen kann, beantworte ich wie folgt:

Stellungnahme zu Drucksache 16/2624 Prof. Dr. med. Jan-S. Krüssel, Uni KiD Seite 4 von 12
Frage 1:
Frage 2:
Frage 3:
Frage 4:
Welche Unterstützung brauchen Menschen mit unerfülltem Kinderwunsch? In welcher Form und von welcher Seite sollte Ihnen Beratung und Unterstützung gegeben werden?
Paare mit unerfülltem Kinderwunsch sind häufig in einer emotional, finanziell, sozial und logistisch stark belastenden Situation. Der Wunsch nach einem Kind ist sehr intensiv und dominant. Andererseits ist die ungewollte Kinderlosigkeit in Deutschland ein Tabuthema, über das kaum offen gesprochen wird. Kinderwunschpaare fürchten eine Stigmatisierung, wenn Sie sich anderen Menschen anvertrauen. Dies betrifft sowohl die
Familie und Freunde, als auch die Arbeitskolleginnen und Kollegen. Kinderwunschpaare brauchen Unterstützung auf allen Ebenen. Hilfreich wären z.B.:
Kampagnen zur Enttabuisierung des unerfüllten Kinderwunsches analog z.B. zur Darmkrebsvorsorge
Finanzierung der Kinderwunschbehandlung aus öffentlichen Mitteln, um den Paaren zumindest die finanzielle Belastung zu nehmen
Unterstützung von Selbsthilfegruppen, psychosozialen Beratungsstellen
Wie bewerten Sie das Angebot an Beratung und Betreuung im Rahmen der Behandlung derzeit?
Das Angebot ist formal ausreichend, wird aber von den Patientinnen häufig nicht wahrgenommen oder nicht in Anspruch genommen. Auch kommen hier unter Umständen weitere finanzielle Belastungen auf die Paare zu.
Der Bekanntheitsgrad der Angebote müsste gesteigert werden.
Welches sind in der Beratungspraxis die größten Probleme der von unerfüfftem Kinderwunsch betroffenen Paare? Wie bewerten Sie die psychische Belastung der Frauen, welche durch eine IVF/ICSI-Behandlung besteht?
Die größten Probleme sind:
Angst davor, dass Arbeitgeber oder Kollegen (m/w) von der Erkrankung "unerfüllter Kinderwunsch" erfahren
Finanzielle Belastung durch die Behandlungskosten
Das Ausmaß der psychischen Belastung ist individuell stark abhängig von Faktoren wie Leidensdruck, Erfolg/Misserfolg der Behandlung, ausreichende Möglichkeit für Fragen und Arztkontakt, Empathie des betreuenden Fachpersonals etc ..
Welche grundsätzliche Haltung haben die christfichen Kirchen zur künstlichen Befruchtung und den unterschiedlichen Verfahren in diesem Bereich?
Ich betrachte mich nicht als kompetenten Ansprechpartner für diese Frage.
Meines Wissens nach lehnt die römisch-katholische Kirche die Maßnahmen der assistierten Fortpflanzung strikt ab, die evangelische Kirche nicht.

Stellungnahme zu Drucksache 16/2624 Prof. Dr. med. Jan-S. Krüssel, UniKiD Seite 5 von 12
Frage 5: Gibt es gesundheitliche Probleme bzw. Risiken bei künstlichen Befruchtungen für Frauen und Kinder, falls ja, welche (evtl. vorhandene statistische Daten bitte anfügen)?
Risiken für Kinder:
Eine aktuelle Metaanalyse aus 2013, welche systematische Übersichtsarbeiten und große Populationsstudien zwischen 2004 und 2010 untersuchte, fand eine leichte Häufung von Auffälligkeiten im Schwangerschaftsverlauf (z.B. Gestationsdiabetes, leichte Erniedrigung des Geburtsgewichtes, Entbindung vor der 38.
Schwangerschaftswoche), jedoch sind die absoluten Zahlen sehr gering (Talaulikar, Eur J Obst Gynecol Reprod Biol 2013(170): 13-19).
Eine große Metaanalyse aus 2011 (vorangegangen war eine ebensolche Analyse aus 2006), welche die weltweite Literatur in Bezug auf die nach IVF und ICSI geborenen Kinder systematisch untersuchte, fand in der großen Majorität der Studien "keine offensichtlichen Probleme der Kinder nach IVF oder ICSI". Allerdings wurde eine methoden bedingte Häufung von Mehrlingsschwangerschaften beobachtet. Damit assoziiert fanden sich gehäuft Komplikationen wie Frühgeburtlichkeit und niedriges Geburtsgewicht. Die Studie untersuchte weiterhin auf Risiken assoziiert mit der ICSI-Behandlung, Erkrankungen der geborenen Kinder inkl. Fehlbildungen, Krebserkrankungen im Kindesalter, seltene Syndrome und psychologische Auffälligkeiten. Nachdem die Studie aus 2006 zu dem Schluss gekommen war, dass es neben den o.g. Komplikationen bedingt durch Mehrlingsschwangerschaften keine Risiken aus der IVF für die Mütter und Kinder ergeben, fanden sich auch in der aktuellen Auswertung weiterer Daten allenfalls einzelne Fälle von Auffälligkeiten (cose reports) oder von seltenen Syndromen (Fortunato, Eur J Obst Gynecol Reprod Biol 2011 (154) 125-129). Die Autoren dieser Metaanalysen diskutieren aber auch, dass diese seltenen Auffälligkeiten vermutlich auch durch die der Sterilität zugrundeliegenden Erkrankungen der Eltern verursacht worden sein könnten.
Eine sehr aktuelle Studie aus Dänemark hat die geburtshilflichen Daten und die Daten der Neugeborenenperiode von 63.854 nach natürlicher Empfängnis geborenen Kindern mit denen von 17.592 Kindern nach IVF, 8.967 Kindern nach ICSI mit ejakulierten Spermien und 466 Kindern nach ICSI mit Spermien aus Hoden- oder Nebenhodenproben verglichen. Diese umfangreiche Studie kam zu dem Schluss, dass die Schwangerschaften, welche mittels der untersuchten Techniken der assistierten Reproduktion entstanden waren, in Hinblick auf die Gesundheit der neugeborenen Kinder und die Rate an Fehlbildungen die gleiche Sicherheit aufweisen, wie Schwangerschaften, welche nach natürlicher Empfängnis entstanden waren (Fedder, Hum Reprod 2013(28)230-240).
Risiken für Frauen:
Nach derzeitigem Wissenstand gibt es keine erwiesenen Spätfolgen. Es findet sich z.B. keine signifikante Häufung von Krebserkrankungen irgend einer Form bei Frauen, welche eine oder mehrere IVF- oder ICSI- Behandlungen mit derzeit üblichen Stimulationsprotokollen durchgeführt haben (Brinton, Reprod Biomed
Online 2007 (15): 138-44).
Die Entnahme der Eizellen im Rahmen der IVF oder ICSI erfolgt mittels transvaginaler Punktion. Hierbei werden die Eibläschen (Follikel) innerhalb der Eierstöcke unter Ultraschall kontrolle gezielt punktiert, die Follikelflüssigkeit mit den darin befindlichen Eizellen wird abgesaugt. Bei diesem operativen Eingriff sind

Stellungnahme zu Drucksache 16/2624 Prof. Dr. med. Jan-S. Krüssel, UniKiD Seite 6 von 12
Komplikationen sehr selten. Laut D.I.R kam es in 2011 bei 46.583 Eizellentnahmen nur in 306 Fällen (= 0,66%) zu einer Komplikation, wobei diese meistens (ca. 60% der gemeldeten Komplikationen) in einer Blutung aus den Einstichstellen bestand. Diese lässt sich durch einfache Kompression (ca. 5 Minuten Druck mit einem Tupfer) beherrschen. Ernste Komplikationen, welche eine stationäre Versorgung notwendig werden ließen, kamen nur in 16/46.583 (0,03%) Fällen vor (5. Abb. 5).
Abb.5: Komplikationen bei der Eizellentnahme. Aus: 1 Reproduktionsmed Endokrinol 2012: 9(6)31
Im Rahmen der hormonellen Stimulationsbehandlung, welche in den ca. 2 Wochen vor der Eizellentnahme dieser voraus geht, kann es zu einer überschießenden Reaktion der Eierstöcke kommen, dem Überstimulationssyndrom (ovarian hyperstimulation syndrome, OHSS). Dabei können die Eierstöcke deutlich an Größe zunehmen. Bei einem OHSS °111 können unter Umständen Flüssigkeitsansammlungen im Bauchraum (Aszites), Atemnot (Dyspnoe, Orthopnoe), Flüssigkeitsansammlungen im Brustraum (Pleuraergüsse), Übelkeit, Erbrechen und eine Konzentration der festen Blutbestandteile eintreten. In Einzelfällen sind Thrombembolien beschrieben worden, welche lebensbedrohlich sein können. Laut D.I.R handelt es sich dabei aber um ein seltenes Krankheitsbild, in 2011 wurden bei 45.078 Stimulationen in 137 Fällen ein OHSS °111 beobachtet (0,3%, vgl. Abb. 6). Seit einigen Jahren ist zur Vermeidung des höhergradigen OHSS ein spezielles Stimulationsprotokoll beschrieben worden (so. Agonist-triggering im Antagonistenprotokoll), welches die Entstehung eines höhergradigen OHSS komplett verhindert, so dass in Zukunft diese ohnehin seltene Komplikation noch weiter in den Hintergrund treten wird.
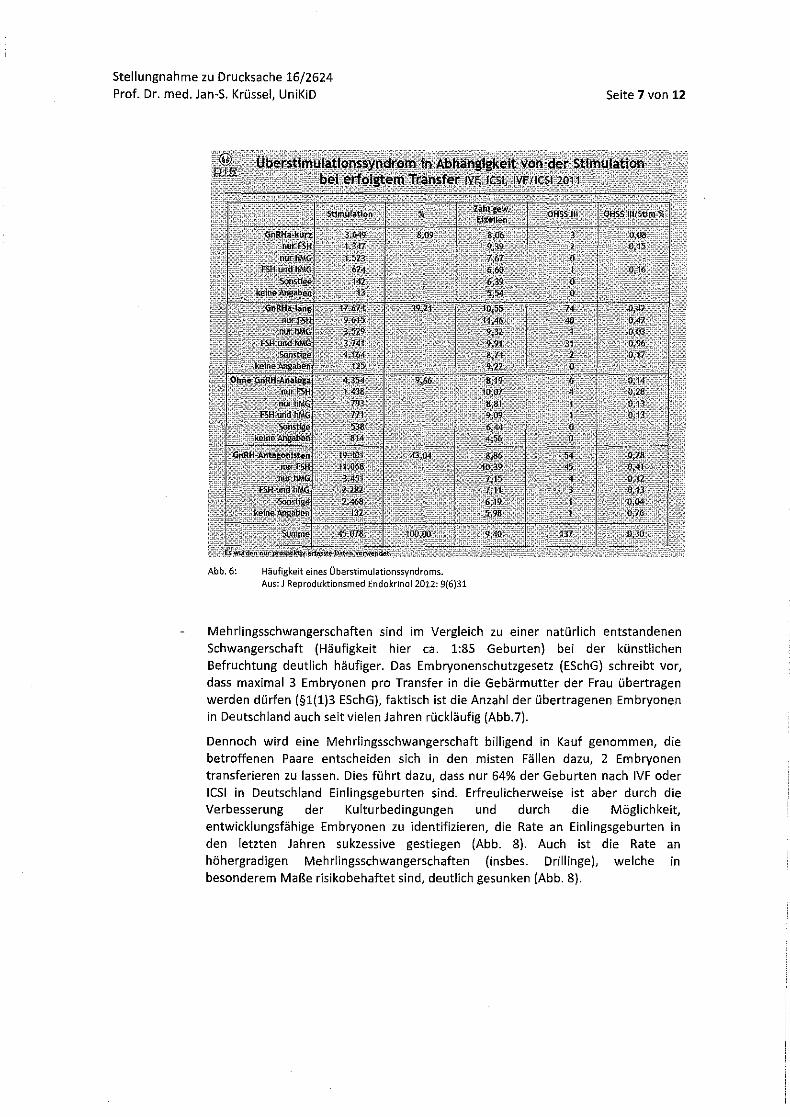
Stellungnahme zu Drucksache 16/2624 Prof. Dr. med. Jan-S. Krüssel, UniKiD
Abb.6: Häufigkeit eines Überstimulationssyndroms. Aus: J Reproduktionsmed Endokrinol 2012: 9(6)31
Seite 7 von 12
Mehrlingsschwangerschaften sind im Vergleich zu einer natürlich entstandenen Schwangerschaft (Häufigkeit hier ca. 1:85 Geburten) bei der künstlichen Befruchtung deutlich häufiger. Das Embryonenschutzgesetz (ESchG) schreibt vor, dass maximal 3 Embryonen pro Transfer in die Gebärmutter der Frau übertragen werden dürfen (§1(1)3 ESchG), faktisch ist die Anzahl der übertragenen Embryonen in Deutschland auch seit vielen Jahren rückläufig (Abb.7).
Dennoch wird eine Mehrlingsschwangerschaft billigend in Kauf genommen, die betroffenen Paare entscheiden sich in den misten Fällen dazu, 2 Embryonen transferieren zu lassen. Dies führt dazu, dass nur 64% der Geburten nach IVF oder lesl in Deutschland Einlingsgeburten sind. Erfreulicherweise ist aber durch die Verbesserung der Kulturbedingungen und durch die Möglichkeit, entwicklungsfähige Embryonen zu identifizieren, die Rate an Einlingsgeburten in den letzten Jahren sukzessive gestiegen (Abb. 8). Auch ist die Rate an höhergradigen Mehrlingsschwangerschaften (insbes. Drillinge), welche in besonderem Maße risikobehaftet sind, deutlich gesunken (Abb. 8).

Stellungnahme zu Drucksache 16/2624 Prof. Dr. med. Jan-S. Krüssel, UniKiD Seite 8 von 12
Frage 6:
Abb.7:
Abb.8:
Rückgang der Anzahl übertragener Embryonen seit 1997. Aus: J Reproduktionsmed Endokrinol 2012: 9(6)20
Häufigkeit von Mehrlingsgeburten nach IVF und le51 Aus: J Reproduktionsmed Endokrinol 2012: 9[6)29
Gibt es Gründe für eine Beschränkung auf verheiratete Paare? Wenn ja, welche wären das? Welche medizinischen Gründe gibt es, Reproduktionsmedizin auf bestimmte Paare zu beschränken?
Ein grundsätzlicher Ausschluss von Männern und Frauen unter 25 Jahren sowie von Frauen über 40 Jahren und Männern über 50 Jahren zur Bezahlung von Maßnahmen der künstlichen Befruchtung erscheint medizinisch und sozial nicht zeitgemäß.
Eine Begrenzung des Bezahlungsmodus auf den Ehestatus ist politisch und sozial ebenfalls nicht zeitgemäß.
Aus medizinischer Sicht gibt es keinerlei Gründe, eine reproduktionsmedizinische Behandlung auf verheiratete Paare zu beschränken.

Stellungnahme zu Drucksache 16/2624 Prof. Dr. med. Jan-S. Krüssel, UniKiD Seite 9 von 12
Frage 7:
Frage 8:
Frage 9:
Wie stellt sich die Situation für gleichgeschlechtliche Paare dar, die sich ein Kind wünschen und dazu auf künstliche Befruchtung angewiesen sind? Erhalten sie eine finanzielle Unterstützung seitens der GKVoder aus dem Bundesprogramm?
Nein. Auch wenn die heterologe Insemination oder IVF, also die Behandlung mit Fremdsperma, in Deutschland prinzipiell erlaubt ist, erhalten diese Paare keinerlei finanzielle Unterstützung seitens der GKV oder aus dem Bundesprogramm. Eine Behandlung gleichgeschlechtlicher Paare wäre in Deutschland aufgrund des Verbotes der Eizellspende und der Leihmutterschaft aber nur bei lesbischen Partnerschaften möglich.
Wie stehen Sie zu einer Ausweitung der Regelung unter Einbeziehung unverheirateter und gleichgeschlechtlicher Paare?
Uneingeschränkt positiv bei Anwendung innerhalb der legalen Möglichkeiten!
Allerdings wären familienrechtliche Fragen zu klären, so dass dem geborenen Kind später auf Wunsch die genetische Herkunft bekannt gemacht werden kann, ohne dass es zu einer möglichen Unterhalts- und Erbschaftspflicht kommen kann.
Wie erfolgreich ist die Behandlung im Vergleich mit dem natürlichen Weg für ein Paar schwanger zu werden?
Dieser Vergleich ist nicht ganz einfach. Die Behandlungsdaten jeder einzelnen IVF und leSI in Deutschland werden dem Deutschen IVF-Register prospektiv übermittelt und dort auf Plausibilität überprüft und ausgewertet. Für natürlich entstehende Schwangerschaften gibt es zwar naturgemäß keine Datenbanken in diesem Umfang, aber einzelne Studien zu dieser Fragestellung erreichen auch eine repräsentative Zahl an überwachten Zyklen. Eine deutsche Arbeitsgruppe, welche sich mit natürlicher Familienplanung beschäftigt, hat in 2003 eine Auswertung von 346 Paaren mit bis zu 21 Zyklen publiziert (Gnoth, Hum Reprod 2003(18)1959-166). Hierbei zeigten die in Abb. 9 demonstrierten Schwa ngerschaftswa h rsche i n lieh keite n:
···n~~~ ~. • M
i!l" r: jl""' ,~~ §u u
D,i , ..... ~26 yeafa. ...... 2i1-3CJyearo
~, ..... ;3-1...aayoot~
n' __ ~--__ ----__ ~--__ ~ ______ ----____ ----__ -----4
• • , • " " " Number cf C)'CIO$
Abb.9: Kumulative Schwangerschaftsrate abhängig von der Anzahl der Zyklen und Alter der Frauen. Aus: Hum Reprod 2003 (18) 1963

Stellungnahme zu Drucksache 16/2624 Prof. Dr. med. Jan-S. Krüssel, UniKiD Seite 10 von 12
Die Wahrscheinlichkeit einer reproduktiv gesunden Frau im Alter zwischen 31 und 35 Jahren innerhalb von 4 Zyklen, in denen das Paar zum optimalen Zeitpunkt Verkehr hat, schwanger zu werden, liegt danach bei ca. 60%, nach 6 Zyklen bei ca. 75%.
Die gleiche Arbeitsgruppe konnte 2011 zeigen, dass die kumulative Lebendgeburtrate nach künstlicher Befruchtung in derselben Altersgruppe nach 4 Zyklen bei ebenfalls ca 60% lag (Abb. 10). Die Schwangerschaftsrate nach 6 Zyklen assistierter Reproduktion wird von den Autoren dieser Studie mit 79% angegeben (Gnoth, Hum Reprod 2011)
1.orTT~n::Fl=CP::::;::::::::::;::::q-T~~l 0.9
0.8
0.7
! 1°·6 .. ~. 0.5
i :; 0.4 E E 00.3
0,2,
0.1
6 9 12
Numbl!rof-cyde
15
\ " ~,'''-r _.(WWT
-<>- $25 veors -111- 26-:10 years .......... 31-3S years --- 36-40 year> -0->40 years
18 21
Abb. 10: Kumulative Schwangerschaftsrate abhängig von der Anzahl der Zyklen und Alter der Frauen. Aus: Hum Reprod 2011 (26) 2242
Damit sind die Schwangerschaftsraten annähernd vergleichbar.
, .
24
Frage 10: Warum ist die Zahl der von der Gesetzlichen Krankenversicherung anteilig finanzierten assistierten Reproduktionen auf 3 begrenzt? Wie hat sich die Zahl der Behandlungen seit der Kappung der Finanzierung durch die GKV von 4 auf 3 Behandlungen entwickelt?
Es gibt, gerade auch bei Kenntnis der Daten aus Abb. 10 keinerlei medizinische Gründe für eine Beschränkung der von der Gesetzlichen Krankenversicherung anteilig finanzierten assistierten Reproduktionen auf 3 Behandlungen. Wenn eine Patientin nach 3 Behandlungen ohne Eintritt einer Schwangerschaft die Behandlung beendet, wird ihr dadurch die weiterhin hohe Chance auf eine Schwangerschaft genommen.
Die Anzahl der Behandlungen insgesamt hat seit 2004, also auch seit der Kappung der Finanzierung durch die GKV von 4 auf 3 Behandlungen, deutlich (vgl. Abb. 1, anfänglich um mehr als 50%) verringert.

Stellungnahme zu Drucksache 16/2624 Prof. Dr. med. Jan-S. Krüssel, UniKiD Seite 11 von 12
Frage 11: Die hier diskutierte Unterstützung der ungewollt kinderlosen Paare aus Steuermitteln ist mit Kosten für das Land Nordrhein-Westfalen verbunden. Wie bewerten Sie das?
Die Kosten für die diskutierten Maßnahmen sind vergleichsweise gering und daher aus meiner Sicht absolut vertretbar. Schließlich ist es aus demografischer Sicht zwingend geboten, die Bevölkerungszahl durch eine Steigerung der Geburtenrate zu erhöhen. Eine Studie aus den U.S.A. (Connolly, Am J Manag Care 2008 (14) 598-604), in denen die reproduktionsmedizinische Behandlung deutlich (bis zu 5x) teurer ist als in Deutschland konnte zeigen, dass der Staat über Steuereinnahmen selbst in der ungünstigsten Konstellation eine deutlich positive Bilanz erreicht (Abb. 11) .
• TabJ .. '\. Discount .. <! Lilotime NetTax Contributlons amI Breakeven Ages aase<! on Average Ernploym"nt ancl on Full Employment'
Abb. 11: Aus: Am J Manag Care 2008 (14) 589-604
Frage 12: Wie sind die Erfahrungen in anderen Bundesländern mit dem Bundesprogramm zur künstlichen Befruchtung?
Zu dieser Frage kann ich keine fundierte Auskunft geben.
Frage 13: Wie hoch sind die Kosten der Behandlung und können sich ärmere Paare die auf sie entfallende anteilige Finanzierung leisten?
Der 50% Eigenanteil der gesetzlich versicherten Paare, welche die Leistungsvoraussetzungen erfüllen, beträgt - abhängig von der benötigten Dosis der Medikamente für die ovarielle Stimulationsbehandlung - ca. 1.500€ für eine ICSIBehandlung. Dies liegt in vielen Fällen weit oberhalb der finanziellen Möglichkeiten der Paare, wodurch ein großer zusätzlicher Druck aufgebaut wird.

Stellungnahme zu Drucksache 16/2624 Prof. Dr. med. Jan-S. Krüssel, UniKiD Seite 12 von 12
Frage 14: Aus welchen Gründen haben Bundesregierung und Bundestagsmehrheit das vom Bundesrat 2012 beschlossene Kinderwunsch!örderungsgesetz (Bundesrats-Drucksache 478/11) zu einer bundesgesetzlich verbindlichen finanziellen Entlastung von einkommensschwachen Paaren mit uner!ülltem Kinderwunsch abgelehnt?
Zu dieser Frage kann ich keine fundierte Auskunft geben.
Für Rückfragen stehe ich gerne zur Verfügung!
Mit freundlichen Grüßen
ilj (j '"--,,
Professor Dr. med. Jan-Steffen Krüssel
Prof. Dr. ;1" Digitalunterschriebenvon Prof. Dr. med.Jan·Steffen
1i Krüssel
med Jan:!\ ,DN;cn=prof.Dr,med.Jan-• " Steffen Kn1ssel,
. . äts-Frauenklinik
Steffeni Krüssef,',
ou=UniKiD, ~sel@unl
duesseldoif.d"e: c"DE Datum: 2013.09.20 22:47:27 +02'00'
'Cf
European Journal of Obstetrics & Gynecology and Reproductive Biology 170 (2013) 13–19
Review
Maternal, perinatal and long-term outcomes after assistedreproductive techniques (ART): implications for clinical practice
Vikram Sinai Talaulikar *, Sabaratnam Arulkumaran
Department of Obstetrics and Gynaecology, St. George’s Hospital and University of London, Cranmer Terrace, Tooting, London SW17 0RE, United Kingdom
Contents
1. Introduction . . . . . . . . . . . . . . . . . . . . . . . . . . . . . . . . . . . . . . . . . . . . . . . . . . . . . . . . . . . . . . . . . . . . . . . . . . . . . . . . . . . . . . . . . . . . . . . . . . . . . . 14
2. Maternal outcomes . . . . . . . . . . . . . . . . . . . . . . . . . . . . . . . . . . . . . . . . . . . . . . . . . . . . . . . . . . . . . . . . . . . . . . . . . . . . . . . . . . . . . . . . . . . . . . . . 14
2.1. First trimester . . . . . . . . . . . . . . . . . . . . . . . . . . . . . . . . . . . . . . . . . . . . . . . . . . . . . . . . . . . . . . . . . . . . . . . . . . . . . . . . . . . . . . . . . . . . . . . 14
2.2. Second and third trimesters . . . . . . . . . . . . . . . . . . . . . . . . . . . . . . . . . . . . . . . . . . . . . . . . . . . . . . . . . . . . . . . . . . . . . . . . . . . . . . . . . . . . 14
2.2.1. Gestational diabetes and hypertension in pregnancy . . . . . . . . . . . . . . . . . . . . . . . . . . . . . . . . . . . . . . . . . . . . . . . . . . . . . . . . 14
2.3. Low lying placenta . . . . . . . . . . . . . . . . . . . . . . . . . . . . . . . . . . . . . . . . . . . . . . . . . . . . . . . . . . . . . . . . . . . . . . . . . . . . . . . . . . . . . . . . . . . 14
2.4. Obstetric interventions . . . . . . . . . . . . . . . . . . . . . . . . . . . . . . . . . . . . . . . . . . . . . . . . . . . . . . . . . . . . . . . . . . . . . . . . . . . . . . . . . . . . . . . . 14
3. Perinatal outcomes . . . . . . . . . . . . . . . . . . . . . . . . . . . . . . . . . . . . . . . . . . . . . . . . . . . . . . . . . . . . . . . . . . . . . . . . . . . . . . . . . . . . . . . . . . . . . . . . 14
3.1. Low birth weight and preterm birth . . . . . . . . . . . . . . . . . . . . . . . . . . . . . . . . . . . . . . . . . . . . . . . . . . . . . . . . . . . . . . . . . . . . . . . . . . . . . 14
3.2. Congenital birth defects . . . . . . . . . . . . . . . . . . . . . . . . . . . . . . . . . . . . . . . . . . . . . . . . . . . . . . . . . . . . . . . . . . . . . . . . . . . . . . . . . . . . . . . 14
3.3. Multiple pregnancy. . . . . . . . . . . . . . . . . . . . . . . . . . . . . . . . . . . . . . . . . . . . . . . . . . . . . . . . . . . . . . . . . . . . . . . . . . . . . . . . . . . . . . . . . . . 15
4. Long-term outcomes . . . . . . . . . . . . . . . . . . . . . . . . . . . . . . . . . . . . . . . . . . . . . . . . . . . . . . . . . . . . . . . . . . . . . . . . . . . . . . . . . . . . . . . . . . . . . . . 15
4.1. Cerebral palsy . . . . . . . . . . . . . . . . . . . . . . . . . . . . . . . . . . . . . . . . . . . . . . . . . . . . . . . . . . . . . . . . . . . . . . . . . . . . . . . . . . . . . . . . . . . . . . . 15
4.2. Childhood malignancies . . . . . . . . . . . . . . . . . . . . . . . . . . . . . . . . . . . . . . . . . . . . . . . . . . . . . . . . . . . . . . . . . . . . . . . . . . . . . . . . . . . . . . . 16
4.3. Epigenetics and imprinting disorders . . . . . . . . . . . . . . . . . . . . . . . . . . . . . . . . . . . . . . . . . . . . . . . . . . . . . . . . . . . . . . . . . . . . . . . . . . . . 16
4.4. Growth characteristics and cardiovascular health. . . . . . . . . . . . . . . . . . . . . . . . . . . . . . . . . . . . . . . . . . . . . . . . . . . . . . . . . . . . . . . . . . . 16
5. Recommendations for clinical practice . . . . . . . . . . . . . . . . . . . . . . . . . . . . . . . . . . . . . . . . . . . . . . . . . . . . . . . . . . . . . . . . . . . . . . . . . . . . . . . . . 16
5.1. Periconceptional period . . . . . . . . . . . . . . . . . . . . . . . . . . . . . . . . . . . . . . . . . . . . . . . . . . . . . . . . . . . . . . . . . . . . . . . . . . . . . . . . . . . . . . . 16
5.1.1. Counselling, ovulation induction and embryo transfer . . . . . . . . . . . . . . . . . . . . . . . . . . . . . . . . . . . . . . . . . . . . . . . . . . . . . . . 16
5.1.2. Optimising maternal health . . . . . . . . . . . . . . . . . . . . . . . . . . . . . . . . . . . . . . . . . . . . . . . . . . . . . . . . . . . . . . . . . . . . . . . . . . . . 16
5.2. Early pregnancy . . . . . . . . . . . . . . . . . . . . . . . . . . . . . . . . . . . . . . . . . . . . . . . . . . . . . . . . . . . . . . . . . . . . . . . . . . . . . . . . . . . . . . . . . . . . . 17
5.2.1. Risk assessment at beginning of pregnancy . . . . . . . . . . . . . . . . . . . . . . . . . . . . . . . . . . . . . . . . . . . . . . . . . . . . . . . . . . . . . . . . 17
5.2.2. Prenatal screening and diagnosis . . . . . . . . . . . . . . . . . . . . . . . . . . . . . . . . . . . . . . . . . . . . . . . . . . . . . . . . . . . . . . . . . . . . . . . . 17
A R T I C L E I N F O
Article history:
Received 7 November 2012
Received in revised form 1 April 2013
Accepted 30 April 2013
Keywords:
ART
IVF
ICSI
Maternal
Perinatal
Reproductive
Outcomes
A B S T R A C T
The use of assisted reproductive techniques (ART) is on the rise throughout the world and the number of
babies born as a result of ART has reached an estimated total of 5 million since the world’s first, Louise
Brown, was born in 1978. Data from many prospective and retrospective studies have suggested
increased risks of adverse maternal, perinatal and long-term outcomes after ART compared to natural
conception. Recent research suggests that underlying maternal factors rather than ART methods
themselves play a significant role in causing such outcomes. Couples attempting ART need to be provided
with accurate and reliable information on risks of adverse reproductive outcomes and reassured that
absolute risks appear small. Clinicians need to remain vigilant about increased risk of pregnancy
complications and formulate a plan of care for the woman, from periconception to the puerperium,
which aims to prevent or minimise maternal and perinatal morbidity. This review attempts to
summarise the available data on reproductive outcomes after ART and provide guidance to the
obstetricians and primary care physicians about management of ART pregnancies.
� 2013 Elsevier Ireland Ltd. All rights reserved.
Contents lists available at SciVerse ScienceDirect
European Journal of Obstetrics & Gynecology andReproductive Biology
jou r nal h o mep ag e: w ww .e lsev ier . co m / loc ate /e jo g rb
* Corresponding author at: Department of Obstetrics and Gynaecology, Corridor 1, Jenner Wing, St. George’s Hospital and University of London, Cranmer Terrace, Tooting,
London SW17 0RE, United Kingdom. Tel.: +44 02087253695; fax: +44 02087252858.
E-mail addresses: [email protected], [email protected], [email protected] (V.S. Talaulikar).
0301-2115/$ – see front matter � 2013 Elsevier Ireland Ltd. All rights reserved.
http://dx.doi.org/10.1016/j.ejogrb.2013.04.014

V.S. Talaulikar, S. Arulkumaran / European Journal of Obstetrics & Gynecology and Reproductive Biology 170 (2013) 13–1914
5.3. Second and third trimesters of pregnancy. . . . . . . . . . . . . . . . . . . . . . . . . . . . . . . . . . . . . . . . . . . . . . . . . . . . . . . . . . . . . . . . . . . . . . . . . 17
5.3.1. Monitoring of blood pressure . . . . . . . . . . . . . . . . . . . . . . . . . . . . . . . . . . . . . . . . . . . . . . . . . . . . . . . . . . . . . . . . . . . . . . . . . . . 17
5.3.2. Assessment of fetal growth . . . . . . . . . . . . . . . . . . . . . . . . . . . . . . . . . . . . . . . . . . . . . . . . . . . . . . . . . . . . . . . . . . . . . . . . . . . . . 17
5.3.3. Screening for gestational diabetes and pre-eclampsia . . . . . . . . . . . . . . . . . . . . . . . . . . . . . . . . . . . . . . . . . . . . . . . . . . . . . . . . 17
5.3.4. Ultrasound and Doppler in ART pregnancies . . . . . . . . . . . . . . . . . . . . . . . . . . . . . . . . . . . . . . . . . . . . . . . . . . . . . . . . . . . . . . . 18
5.3.5. Cervical length screening . . . . . . . . . . . . . . . . . . . . . . . . . . . . . . . . . . . . . . . . . . . . . . . . . . . . . . . . . . . . . . . . . . . . . . . . . . . . . . 18
5.4. Labour and delivery . . . . . . . . . . . . . . . . . . . . . . . . . . . . . . . . . . . . . . . . . . . . . . . . . . . . . . . . . . . . . . . . . . . . . . . . . . . . . . . . . . . . . . . . . . 18
5.5. Postnatal period . . . . . . . . . . . . . . . . . . . . . . . . . . . . . . . . . . . . . . . . . . . . . . . . . . . . . . . . . . . . . . . . . . . . . . . . . . . . . . . . . . . . . . . . . . . . . 18
6. Summary . . . . . . . . . . . . . . . . . . . . . . . . . . . . . . . . . . . . . . . . . . . . . . . . . . . . . . . . . . . . . . . . . . . . . . . . . . . . . . . . . . . . . . . . . . . . . . . . . . . . . . . . 18
References . . . . . . . . . . . . . . . . . . . . . . . . . . . . . . . . . . . . . . . . . . . . . . . . . . . . . . . . . . . . . . . . . . . . . . . . . . . . . . . . . . . . . . . . . . . . . . . . . . . . . . . 18
1. Introduction
Assisted reproductive techniques (ART) include all fertilitytreatments in which the gametes (egg and sperm) are handledoutside the human body with the aim of achieving a healthyconception. Common ART procedures include in vitro fertilisation(IVF) with or without intracytoplasmic sperm injection (ICSI), freshor frozen embryo transfer, and IVF with donor oocytes. Since thebirth of the first IVF baby in 1978, the use of ART has increasedtremendously and 1.7–4.0% of all children born today in developedcountries are conceived through the use of ART [1–3]. Advances inART procedures, increased access to fertility services and delayedchild bearing are all factors contributing to a rise in the use of ARTservices.
Since the early reports in 1985, several cohort and case controlstudies have reported increased risks of pregnancy complicationssuch as miscarriage, ectopic pregnancy, congenital anomalies,preterm birth, low birth weight, gestational diabetes and pre-eclampsia in ART pregnancies compared to naturally conceivedpregnancies [4–13]. A number of systematic reviews, meta-analyses and large population-based studies have also supportedfindings of an increased risk of adverse obstetric outcomes fromART conceptions, especially for singleton pregnancies compared totwin pregnancies (Table 1) [14–20]. It is important, however, toremember that the absolute risks appear small and the majority ofbirths after ART are uncomplicated.
The reasons for this observed increase in the risk of adversereproductive outcomes are unclear. It is not know whether it is thetechnology (hormonal stimulation, gamete manipulation, cryo-preservation and in vitro culture) or the underlying maternalfactors which play a greater role in causing adverse outcomes.While some studies have pointed out a role for controlled ovarianhyperstimulation or cryopreservation in altering pregnancyoutcome [21–23], others have suggested that maternal factorssuch as age, ethnicity, medical conditions or cause of subfertilityare more important determinants [24,25].
2. Maternal outcomes
2.1. First trimester
Several studies have reported a higher incidence of ectopicpregnancies and spontaneous miscarriage (17–32.6%) in ARTpregnancies compared to naturally conceived pregnancies, withpossible causes being tubal disease, uterine anomalies, increasingmaternal age and chromosomal abnormalities in the conceptus[5,26,27].
2.2. Second and third trimesters
2.2.1. Gestational diabetes and hypertension in pregnancy
Studies have reported an increased risk of gestationalhypertension, pre-eclampsia, gestational diabetes and abruption
in ART conceptions [5,14,27–30]. A significantly increased risk ofpre-eclampsia in singleton pregnancies after single embryotransfer (SET) and double embryo transfer (DET) including freshand cryopreserved cycles has been reported when compared withsingleton pregnancies in the general population. Maternal age,subfertility, underlying chronic conditions or abnormal placenta-tion may contribute towards the increased risks.
2.3. Low lying placenta
A three- to six-fold increased risk of placenta praevia has beenreported in ART pregnancies [31] and it has been suggested thatthis may be related to embryo transfer into the lower part ofuterine cavity.
2.4. Obstetric interventions
Many authors have reported an increased rate of caesareandelivery rate in IVF pregnancies [5,32]. The increased rates may beattributed to patient anxiety and physician preference regardingthe mode of delivery rather than an increase due to obstetricindications alone.
3. Perinatal outcomes
3.1. Low birth weight and preterm birth
Several systematic reviews and meta-analyses have repeatedlyreported higher rates of low birth weight, preterm birth andperinatal mortality in ART pregnancies compared to spontaneousconceptions (Table 1). This excess risk of adverse outcomes stemsnot only from higher rates of multiple pregnancies in ART births,but it is noted even when singleton ART pregnancies are comparedwith natural ones.
3.2. Congenital birth defects
In ART children the risk of congenital anomalies is slightlyincreased (by 15–40%) compared with spontaneously conceivedchildren after adjustments for relevant confounders. Conflictingevidence exists, however, and the absolute numbers remain small.The scientific paper by Royal College of Obstetricians andGynaecologists (RCOG) in United Kingdom (UK) has suggestedthat IVF is associated with a 30–40% increased risk of majorcongenital anomalies compared with natural conceptions [33]. Thepossible increase in birth defects after ART may be related to thehormonal treatment or the techniques, but subfertility or parentalfactors may also play a role. A recent large Australian study foundthat the increased risk of birth defects associated with IVF was nolonger significant after adjustment for parental factors. The risk ofbirth defects associated with ICSI remained increased aftermultivariate adjustment, although the possibility of residualconfounding still could not be excluded [34].

Table 1Systematic reviews and large population based studies comparing reproductive outcomes between ART and natural conceptions.
Study Study population/s and sample size Findings
Jackson et al. [14] Meta-analysis involving studies which compared singleton
pregnancies following IVF with spontaneous conceptions.
Fifteen studies comprising 12,283 IVF and 1.9 million
spontaneously conceived singletons.
Significantly higher odds of each of the perinatal outcomes in ART group:
perinatal mortality (OR 2.2, 95% CI 1.6–3.0), preterm delivery (OR 2.0,
95% CI 1.7–2.2), low birth weight (OR 1.8, 95% CI 1.4–2.2), very low birth
weight (OR 2.7, 95% CI 2.3–3.1) and small for gestational age (OR 1.6, 95%
CI 1.3–2.0).
Helmerhorst et al. [15] Systematic review on perinatal outcomes in singleton and twin
pregnancies comparing natural and assisted conceptions
including IVF and IUI (studies between 1985–2002).
Twenty-five studies were included of which 17 had matched
and 8 had non-matched controls.
For singletons, studies with matched controls indicated a relative risk
(RR) of 3.27 (95% CI 2.03–5.28) for very preterm and 2.04 (1.80–2.32) for
preterm birth in pregnancies after ART. Relative risks were 3.00 (2.07
–4.36) for very low birth weight, 1.70 (1.50–1.92) for low birth weight,
1.40 (1.15–1.71) for small for gestational age, 1.54 (1.44–1.66) for
caesarean section, 1.27 (1.16–1.40) for admission to a neonatal intensive
care unit and 1.68 (1.11–2.55) for perinatal mortality.
In matched studies of twin gestations, relative risks were 0.95 (0.78–1.15)
for very preterm birth, 1.07 (1.02–1.13) for preterm birth, 0.89 (0.74–1.07)
for very low birth weight, 1.03 (0.99–1.08) for low birth weight, 1.27
(0.97–1.65) for small for gestational age, 1.21 (1.11–1.32) for caesarean
section, 1.05 (1.01–1.09) for admission to a neonatal intensive care unit
and 0.58 (0.44–0.77) for perinatal mortality.
Schieve et al. [16] Perinatal outcomes among singleton infants conceived with ART
in the US.
62551 infants born after ART treatments performed in 1996–2000.
ART infants had elevated risks for all outcomes in comparison with
the general population of US singletons: low birth weight standardised
risk ratio 1.62 (95% CI 1.49–1.75), very low birth weight 1.79
(1.45–2.12), preterm delivery 1.41 (1.32–1.51), preterm low birth
weight 1.74 (1.57–1.90) and term low birth weight 1.39 (1.19–1.59).
McDonald et al. [17] Systematic review including case-control and cohort studies that
compared singleton pregnancies conceived by IVF or ICSI with
spontaneously conceived singletons.
Singleton pregnancies resulting from IVF had increased rates of poor
obstetric outcome, compared with spontaneously conceived singletons
with increases in perinatal mortality (OR 2.40, 95% CI 1.59–3.63),
preterm birth at <33 weeks (OR 2.99, 95% CI 1.54–5.80), preterm
birth at <37 weeks gestation (OR 1.93, 95% CI 1.36–2.74), very low
birth weight (<1500 g) (OR 3.78, 95% CI 4.29–5.75), small for
gestational age (OR 1.59, 95% CI 1.20–2.11) and congenital
malformations (OR 1.41, CI 1.06–1.88).
Boulet et al. [18] Perinatal outcomes of twin births conceived using ART (in
Massachusetts live birth-infant death records from 1997 to 2000).
1446 ART and 2729 non-ART twin deliveries.
ART twin deliveries were less likely than non-ART to be very preterm
(adjusted OR 0.75, 95% CI 0.58–0.97), include a very low birth weight
(<1500 g) infant (0.75, 95% CI 0.58–0.95) or infant death (0.55, 95%
CI 0.35–0.88).
McDonald et al. [19] Systematic review of seventeen studies with 31,032 singletons
conceived through IVF (�ICSI) and 81,119 spontaneously
conceived singletons.
IVF singletons had increased risks of preterm birth (RR 1.84, 95%
CI 1.54–2.21) and low birth weight <2500 g (RR 1.60, 95% CI 1.29–1.98).
Singletons conceived through IVF or IVF/ICSI also were at increased risk
for late preterm birth, moderate preterm birth <32–33 weeks, very low
birth weight and intrauterine growth restriction.
McDonald et al. [20] Systematic review of twelve studies with a total of 4385 twins
conceived after IVF or IVF/ICSI and 11,793 spontaneously
conceived twins.
IVF twins had increased risks of both preterm birth (RR 1.23, 95%
CI 1.09–1.41) and low birth weight <2500 g (RR 1.14, 95% CI 1.06–1.22).
They were at increased risk for preterm birth <32–33 weeks, although
the risks of late preterm birth, very low birth weight, extremely low
birth weight and intrauterine growth restriction were not statistically
significantly increased compared to spontaneously conceived twins.
V.S. Talaulikar, S. Arulkumaran / European Journal of Obstetrics & Gynecology and Reproductive Biology 170 (2013) 13–19 15
3.3. Multiple pregnancy
Multiple pregnancies are associated with significant maternaland perinatal risks, and there is a substantial increase in multiplebirths after IVF compared with natural conception. Single embryotransfer is becoming increasingly recommended in ART clinics toreduce the adverse outcomes associated with multiple pregnan-cies. In UK, the Human Fertilisation and Embryology (HEFA) reportindicates that the overall multiple pregnancy rate decreasedbetween 2009 and 2010. The figures show that in 2008, 23.6% offresh and frozen IVF and ICSI cycles resulted in a multiple birth, butsince then clinics have been working hard to reduce this number.Data for the first half of 2009 show the figure dropped to 22.0%[3,35]. The decrease is most pronounced in women aged 18–34years, who saw the greatest increase in elective single embryotransfer over the same period. The scientific opinion paper fromthe RCOG suggests that although multiple pregnancy per se is a riskfactor for preterm birth; there is an additional small butstatistically significant 23% increase in the relative risk of preterm
birth in IVF twins compared with natural twins and that therelative contribution of spontaneous or elective preterm birth hasnot been identified [33]. Most data from systematic reviews andlarge studies (Table 1) suggest relatively better outcomes for ARTtwins than natural twins, in contrast to comparison of ARTsingletons with natural singletons. This may be due to the variationin relative proportion of dichorionic versus monochorionic twinsin ART populations or simply to an effect of smaller sample sizes intwin comparison studies.
4. Long-term outcomes
4.1. Cerebral palsy
A number of studies have reported increased risks of cerebralpalsy with ART [34,36], but the majority of studies reviewingneurocognitive outcomes in ART children do not suggest that ARTitself leads to adverse neurological outcomes after adjustment forconfounding factors such as low birth weight and prematurity.

V.S. Talaulikar, S. Arulkumaran / European Journal of Obstetrics & Gynecology and Reproductive Biology 170 (2013) 13–1916
4.2. Childhood malignancies
An increased risk of malignancies has been suggested in ARTpopulations due to increased prevalence of structural chromo-somal abnormalities in infertile men and women, and exposure toART techniques. Confounders, however, such as increased mater-nal age and underlying parental factors, may play a significant role.The literature reveals conflicting reports: some studies reportincreased incidence of neuroblastoma, retinoblastoma, histiocy-tosis, acute lymphocytic leukaemia and non-Hodgkin’s lymphomawhile others have failed to demonstrate an increased risk [37–40].The current evidence therefore remains inconclusive and largelong-term follow-up studies are necessary to clearly define therisks of childhood cancer in the ART population and whether thisrisk persists or increases with age.
4.3. Epigenetics and imprinting disorders
There is evidence suggesting a link between ART and epigeneticalterations leading to DNA modifications and imprinting disorders[41,42]. Imprinting is an epigenetic modification of the genome bywhich genes in only one of the parental alleles are expressed.Several reports have suggested a possible link between ART andvarious imprinting disorders including Beckwith–WiedemannSyndrome (BWS), Angelman Syndrome (AS) and maternalhypomethylation syndrome [43]. The cardinal features of BWSare pre- and post-natal overgrowth, abdominal wall defects,visceromegaly, macroglossia and neoplasias. The typical featuresof AS comprise microcephaly with mental/motor retardation,epilepsy, ataxic gait or complete inability to walk, musclehypotonia, protruding jaw and tongue, occipital depression andhypopigmented eyes. Based on current evidence however, theabsolute risk of imprinting disorders after ART remains small anddoes not warrant routine screening. Large prospective, multi-centre studies are necessary to ascertain whether this associationis definitive.
4.4. Growth characteristics and cardiovascular health
As regards patterns of growth in ART children, the majority ofstudies evaluating height, weight, and body mass index have notfound significant differences between ART and naturally conceivedchildren but some studies have indicated differences in adiposityby measuring skinfolds and dual X-ray absorptiometry [44].
It has been hypothesised that epigenetic mechanisms in earlypregnancy, as well as higher rates of low birth weight and pretermbirth in ART babies, may predispose them to cardiovascular andmetabolic problems in future life. While some studies haveprovided evidence for increased blood pressure among childrenconceived by IVF/ICSI [45–47], conflicting data exist and long-termstudies with large sample sizes are needed to explore thesefindings further.
5. Recommendations for clinical practice
5.1. Periconceptional period
5.1.1. Counselling, ovulation induction and embryo transfer
From a clinician’s point of view, it is very important thatappropriate information is provided to the patients about thebenefits and adverse effects of different ART treatments. Thisshould assist the couple in making informed decisions about thevarious ART treatments available to them. A thorough historyshould be obtained to recognise any pre-existing medicalconditions or fetal abnormalities in the family in order to facilitatereferral to appropriate medical team or genetic counselling. All
men with severe oligozoospermia or azoospermia should beoffered genetic counselling and karyotyping for chromosomalabnormalities and cystic fibrosis before attempting IVF–ICSI. Theyshould be made aware of the availability of tests for Y chromosomemicro-deletions. Couples considering IVF–ICSI for male factorinfertility should receive information, and if necessary geneticcounselling, about the increased risk of chromosomal abnormali-ties associated with their condition. Prenatal diagnosis bychorionic villus sampling (CVS) or amniocentesis should be offeredto these couples if they conceive [48].
Ovulation induction in the woman should be monitoredcarefully in order to achieve monofollicular stimulation. Theovarian stimulation strategies should avoid maximising oocyteyield (avoid hyperstimulation), but aim to generate a sufficientnumber of chromosomally normal embryos by reduced interfer-ence with ovarian physiology. Many clinics now recommend low-dose gonadotrophin protocols to achieve this. A recent studysuggested that elective cryopreservation of all embryos in patientswith elevated peak serum oestradiol, for subsequent cryothawembryo transfer in cycles with a better physiologic hormonalmilieu, may reduce the odds of small for gestational age babies andpre-eclampsia in IVF singleton deliveries [49]. Greater emphasisshould be placed on single embryo transfer. The use of electivesingle embryo transfer combined with cryopreservation of spareembryos can minimise multiple pregnancies.
5.1.2. Optimising maternal health
Opportunity should be taken to optimise the woman’s healthand control preventable risk factors before embarking on apregnancy.
Diet and supplementation: Women should be given informationon the benefits of a healthy diet before and during pregnancy. Theadvice must be based on individual woman’s circumstances butshould include the following if possible: five portions of fruit andvegetables a day and one portion of oily fish (for example,mackerel, sardines, pilchards, herring, trout or salmon) a week[50]. Dietary advice should also include avoidance of raw orpartially cooked eggs, meat and pate, to avoid food borneinfections. Folic acid reduces the risk of neural tube defects inthe fetus by up to 75%, and 400 micrograms daily is recommendedfor all women from 12 weeks prior to conception until 12 weeks ofpregnancy. A higher dose of 5 mg per day may be necessary inwomen with history of neural tube defects in the past or the family,obesity, diabetes, anticonvulsant therapy, alcohol abuse andmalabsorption. National Institute for Health and Clinical excel-lence (NICE, UK) guidelines recommend vitamin D supplementa-tion (10 micrograms per day) for all women during pregnancy andwhile breastfeeding. Those at particular risk include women whoare obese, have limited skin exposure to sunlight or who are ofSouth Asian, African, Caribbean or Middle Eastern descent [51].
Lifestyle modifications should be advised, to control risk factorssuch as obesity, smoking and alcohol abuse. Pregnant womenshould avoid smoking or drinking because of their association withadverse pregnancy outcomes. Women who choose to drink alcoholduring pregnancy are advised not to drink more than 1–2 UK unitsonce or twice a week (1 unit equals half a pint of ordinary strengthlager or beer, or one shot [25 ml] of spirits. One small [125 ml] glassof wine is equal to 1.5 UK units) [51].
Woman’s rubella status also should be checked before thepregnancy. Most women are now immunised in childhood or havenatural antibodies due to prior infection. Vaccination should beoffered to those who are non-immune. Good control of chronicmedical conditions such as diabetes, anaemia, epilepsy andhypertension should be achieved. In diabetic women, goodglycemic control reduces the incidence of fetal abnormalitiesand other complications. Retinopathy and nephropathy screening

V.S. Talaulikar, S. Arulkumaran / European Journal of Obstetrics & Gynecology and Reproductive Biology 170 (2013) 13–19 17
and, if required, treatment of retinopathy should be completedbefore conception to reduce risk of deterioration. Drug therapy forepileptic patients should be optimised so as to utilise the minimumnumber of drugs required to achieve a good seizure control.
5.2. Early pregnancy
One of the key features of caring for women with pregnanciesafter ART is developing an effective care plan during the antenatalperiod.
5.2.1. Risk assessment at beginning of pregnancy
An assessment of risk factors for venous thromboembolismshould be undertaken early in pregnancy. Thromboprophylaxiswith low molecular weight heparin should be considered for thoseat high risk, based on scoring as per the RCOG guidelines [52]. NICEguidelines in UK recommend aspirin therapy for women at highrisk of pre-eclampsia to prevent or reduce the severity of thecondition [51]. As ART pregnancies are at a high risk of pre-eclampsia, women should be advised to take 75 mg of aspirin dailyfrom 12 weeks until the birth of the baby.
5.2.2. Prenatal screening and diagnosis
All women should be offered an ultrasound scan between 10and 14 weeks of pregnancy to establish viability, check nuchaltranslucency and for dating of pregnancy. In cases of multiplegestation, the chorionicity and amniocity should be established.The UK National Screening Committee and NICE recommend adating scan and an 18–20 + 6 weeks fetal structural anomalyultrasound scan for all pregnant women [51]. Screening for Down’ssyndrome should be performed by the end of the first trimester butprovision should be made to allow later screening for womenbooking later in pregnancy. NICE recommends the ‘combined test’(nuchal translucency, beta-human chorionic gonadotrophin, preg-nancy-associated plasma protein-A) for Down’s syndrome screen-ing between 11 and 13 + 6 weeks. For women who book later inpregnancy the most clinically- and cost-effective serum screeningtest (triple or quadruple test) should be offered between 15 and 20weeks [51].
If the prenatal tests suggest a significant risk of Down’ssyndrome, the woman should be referred to a fetal medicine unitfor diagnostic tests such as amniocentesis or CVS. Such screeningneeds to be particularly emphasised in low-resource settingswhere ART pregnancies should be identified as a group who have aslightly increased risk of congenital anomalies and are therefore inneed of these tests.
5.3. Second and third trimesters of pregnancy
Weight should be monitored in the antenatal period in thosewomen with a booking body mass index (BMI) below 20 or above30 kg/m2 to assess progress in weight management. Obesity is anincreasing problem in obstetrics and needs multidisciplinary inputfrom dietician, anaesthetic, neonatal and the midwifery teams toensure optimum care.
Multiple pregnancies after ART are particularly at risk ofanaemia and should have a full blood count at 20–24 weeks inaddition to booking bloods to identify a need for early supplemen-tation with iron or folic acid. Screening should be repeated at 28weeks as in routine antenatal care.
5.3.1. Monitoring of blood pressure
Keeping in mind the high risk of hypertensive disease in ARTpregnancies, blood pressure (BP) should be closely monitoredthroughout the pregnancy. BP should be measured and urinalysisfor proteinuria undertaken routinely at each antenatal visit. BP
should ideally be measured in a sitting position with the arm at thelevel of the heart and a correct size cuff. Hypertension in pregnancyis defined as two readings of 140/90 mmHg or more taken at least4 h apart, using Korotkoff V for the diastolic sound.
5.3.2. Assessment of fetal growth
The two clinical methods used to assess fetal growth aresymphysis-fundal height (SFH) measurement and abdominalpalpation. SFH measurements (in centimetres) give a moreobjective assessment of uterine size and serial measurementsgive an indication of the fetal growth rate. A discrepancy of 3 ormore centimetres from the gestational age in weeks is consideredabnormal between 24 and 34 weeks. Although the sensitivity ofSFH is low, it is a useful tool requiring minimal equipment, trainingand time [53]. Both NICE and RCOG guidelines recommend thatSFH should be routinely measured from 24 weeks. SFH should beplotted on a customised chart rather than a population-based chartas this may improve prediction of a small for gestational ageneonate. Women with a single SFH which plots below the 10thcentile or serial measurements which demonstrate slow or staticgrowth by crossing centiles should be referred for ultrasoundmeasurement of fetal size [51,54]. Women in whom measurementof SFH is inaccurate (for example; BMI > 35, large fibroids,hydramnios) should be referred for serial assessment of fetal sizeusing ultrasound [54].
5.3.3. Screening for gestational diabetes and pre-eclampsia
NICE recommends that at the booking appointment, risk factorsfor gestational diabetes should be determined, including: BMIabove 30, previous macrosomic baby weighing 4.5 kg or above,previous gestational diabetes, family history of diabetes (first-degree relative with diabetes, family origin with a high prevalenceof diabetes, South Asian (specifically women whose country offamily origin is India, Pakistan or Bangladesh), Black Caribbean andMiddle Eastern (specifically women whose country of family originis Saudi Arabia, UAE, Iraq, Jordan, Syria, Oman, Qatar, Kuwait,Lebanon or Egypt) [51]. A 2 h 75 g oral glucose tolerance test(OGTT) should be offered at 16–18 weeks to test for gestationaldiabetes if the woman has had gestational diabetes previously,followed by an OGTT at 28 weeks if the first test is normal. NICEadvises that an OGTT should be offered at 24–28 weeks if thewoman has any other risk factor [51] but given the high risk ofdiabetes in the ART population, all ART pregnancies should bescreened for gestational diabetes with an OGTT at 24–28 weekseven if they do not have any of the above risk factors. If diabetes isdetected, the pregnancy should be managed in a joint diabeticclinic with multidisciplinary support.
Although there is a great deal of literature on screeningmethods for pre-eclampsia, none of these have satisfactorysensitivity and specificity, and therefore they are not currentlyrecommended by NICE. Given the high risk developing hyperten-sion in ART pregnancy, however, screening for pre-eclampsia mayhelp identify women who are potentially high risk of developingsevere disease, and they can be offered close blood pressuremonitoring and fetal growth surveillance throughout the preg-nancy. Abnormal waveforms in the uterine artery, such asincreased pulsatility index (PI) with notching on Doppler ultra-sound, have been reported to be a good predictor of pre-eclampsiaand growth restriction in high risk women (positive likelihoodratio 21) [55,56]. Bilateral uterine artery notching or a mean PIabove the 95th centile of the normal range indicates increasedimpedance of blood flow. It is known that the presence of either ofthese two factors at 23–24 weeks’ gestation in a routine antenatalpopulation identifies 40% of women who later develop pre-eclampsia [57]. Second trimester uterine Doppler screening aloneor in combination with pregnancy-associated protein A (PAPP A)

V.S. Talaulikar, S. Arulkumaran / European Journal of Obstetrics & Gynecology and Reproductive Biology 170 (2013) 13–1918
levels is now being offered in many obstetric units as a screeningtest for pre-eclampsia. The addition of angiogenic factors (sFlt- 1/PIGF ratio) to Doppler ultrasound analysis further improves thepower to predict pre-eclampsia in the second trimester, with asensitivity and specificity of 98% and 95% respectively [58].
5.3.4. Ultrasound and Doppler in ART pregnancies
A second trimester detailed anomaly scan with fetal echocar-diography (four-chamber and outflow tract view) is recommendedin all patients at 18–24 weeks to rule out any structural anomaliesand also to identify any markers of chromosomal abnormalities. Ifanomalies are detected, woman should be referred to the fetalmedicine unit which could provide expert multidisciplinary careand arrange delivery in a unit with specialised neonatal care. Theplacental site should be established at this scan and if the placentaappears low lying, a rescan should be arranged at 34 weeks tofacilitate the planning of mode of delivery. Further ultrasoundscans in pregnancy may be performed only if indicated for a clinicalreason such as suspected fetal growth restriction (decreased SFHon palpation), abnormal liquor volume or to undertake studies ofumbilical artery Doppler and biophysical profile. A low thresholdshould be maintained for growth scans for suspected fetal growthrestriction in view of the higher risk of low birth weight in ARTpregnancies. The presence of multiple risk factors besides ART orany clinical suspicion should be followed by serial ultrasoundmeasurement of fetal size and assessment of wellbeing withumbilical artery Doppler from 26 to 28 weeks of pregnancy.
Recent RCOG guidelines suggest that a low level (<0.415 MoM)of the 1st trimester marker PAPP A should be considered a majorrisk factor for delivery of a small for gestational age neonate [54].
Monitoring for intrauterine growth restriction in multiple
pregnancy: Serial ultrasound biometry of twins with adjunctiveuse of Doppler is necessary to detect abnormal growth ordiscrepant growth between twins and abnormalities of placenta-tion. Fetal weight discordance should be estimated using two ormore biometric parameters at each ultrasound scan from 20 weeksas per NICE guidelines [59]. Scans should be undertaken atintervals of less than 28 days. A 25% or greater difference in sizebetween twins or triplets should be considered a clinicallyimportant indicator of growth restriction and the woman shouldbe referred to a tertiary level fetal medicine centre [59].
5.3.5. Cervical length screening
Given the increased incidence of preterm labour in the ARTgroup, cervical length screening may be recommended for highrisk women if they have a previous history of late miscarriagebefore ART. Sonographic assessment of the cervix is usuallyperformed between 14 and 24 weeks of gestation. Selectivecervical cerclage and vaginal progesterone therapy (200 mg/day)from the second trimester may be recommended in women withmultiple risk factors for preterm birth or where ultrasoundassessment suggests a high risk (cervix is 25 mm or less before24 weeks of gestation).
5.4. Labour and delivery
Intrapartum electronic fetal heart rate monitoring should berecommended to all women who conceived after ART with the aimof early detection and prevention of potential hypoxia duringlabour. Due to the inherent precious nature of ART pregnancies,both obstetricians and parents often choose caesarean section as asafer approach where the timing and events can be controlled toensure safe delivery of the baby. In terms of clinical outcomes,however, there is no advantage in doing a caesarean without amedical indication and the decision should be taken only afterthrough discussion of risks and benefits with the patient, especially
in relation to future pregnancies. The decision should be based onthe woman’s individual circumstance and her wishes should berespected as long as clinically reasonable.
5.5. Postnatal period
Breast feeding should be actively encouraged and supported.Careful attention should be paid to ongoing thromboprophylaxis.Many of the long-term outcomes of assisted reproduction aredifficult to evaluate due to the variability in ART methods as well asdata reporting and there is a need for a standardised methodologyfor follow-up of children born after ART. Every clinic shouldtherefore strive to continue collecting data in the immediatepostnatal period as well as the long-term outcomes of childrenborn from ART pregnancies.
6. Summary
As the use of ART rises across the world, obstetricians will haveto care for increasing numbers of women who have conceived afterassisted conception. Present data suggest an increased risk ofadverse maternal and perinatal outcomes for ART pregnancies butthe absolute risks appear small. The current evidence regardingchildhood outcomes is inadequate and prospective long-termstudies are needed to eliminate the effect of confounders and drawdefinite conclusions about long-term outcomes after ART. Clin-icians need to be aware of the increased complications in ARTpregnancies and provide appropriate counselling and care forthese women, starting from prior to conception until after delivery.All men with severe oligozoospermia or azoospermia should beoffered genetic counselling and karyotyping for chromosomalabnormalities and cystic fibrosis before attempting IVF–ICSI. ARTpregnancies are at a high risk of developing gestational diabetesand pre-eclampsia, and therefore screening should be undertakenfor these conditions and aspirin treatment should be started from12 weeks until the end of pregnancy. Due to the increased risk ofstructural and chromosomal fetal anomalies, both serum andultrasound screening should be offered to these women. Closemonitoring of fetal growth is necessary throughout pregnancywith serial biometry and, if required, Doppler ultrasound once fetalgrowth restriction is suspected. Couples conceiving through ARTalready have to deal with a considerable amount of stress arisingout of the management of their subfertility. It is importanttherefore that obstetricians and primary care physicians providethem with accurate counselling and an effective plan of carethroughout the pregnancy so as to ensure the best possibleoutcomes for the mother and the baby.
Conflict of interest
Neither of the authors has any conflicts of interest to declare.
References
[1] Klemetti R, Gissler M, Hemminki E. Comparison of perinatal health of childrenborn from IVF in Finland in the early and late 1990. Hum Reprod 2002;17:2192–8.
[2] Williams C, Sutcliffe A. Infant outcomes of assisted reproduction. Early HumDev 2009;85:673–7.
[3] Human fertilisation and embryology authority fertility treatment in 2010.Trends and figures. United Kingdom: HFEA; 2011, www.hfea.gov.uk.
[4] Australian In Vitro Fertilisation Collaborative Group. High incidence of pre-term births and early losses in pregnancy after in vitro fertilisation. BMJ1985;291:1160–3.
[5] Talaulikar VS, Arulkumaran S. Reproductive outcomes after assisted concep-tion. Obstet Gynecol Surv 2012;67:566–83.
[6] Tallo CP, Vohr B, Oh W, Rubin LP, Seifer DB, Haning Jr RV. Maternal andneonatal morbidity associated with in vitro fertilisation. J Pediatr1995;127:794–800.

V.S. Talaulikar, S. Arulkumaran / European Journal of Obstetrics & Gynecology and Reproductive Biology 170 (2013) 13–19 19
[7] Dhont M, De Sutter P, Ruyssinck G, Martens G, Bekaert A. Perinatal outcome ofpregnancies after assisted reproduction: a case–control study. Am J ObstetGynecol 1999;181:688–95.
[8] Tan SL, Doyle P, Campbell S, et al. Obstetric outcome of in vitro fertilizationpregnancies compared with normally conceived pregnancies. Am J ObstetGynecol 1992;167:778–84.
[9] Verlaenen H, Cammu H, Derde MP, Amy JJ. Singleton pregnancy after invitro fertilization: expectations and outcome. Obstet Gynecol1995;86:906–10.
[10] Reubinoff BE, Samueloff A, Ben-Haim M, Friedler S, Schenker JG, Lewin A. Is theobstetric outcome of in vitro fertilized singleton gestations different fromnatural ones. A controlled study. Fertil Steril 1997;67:1077–83.
[11] Koudstaal J, Braat DD, Bruinse HW, Naaktgeboren N, Vermeiden JP, Visser GH.Obstetric outcome of singleton pregnancies after IVF: a matched control studyin four Dutch university hospitals. Hum Reprod 2000;15:1819–25.
[12] Dhont M, De Neubourg F, Van der Elst J, De Sutter P. Perinatal outcome ofpregnancies after assisted reproduction: a case control study. J Assist ReprodGenet 1997;14:575–80.
[13] Isaksson R, Gissler M, Tiitinen A. Obstetric outcome among women withunexplained infertility after IVF: a matched case control study. Hum Reprod2002;17:1755–61.
[14] Jackson RA, Gibson KA, Wu YW, Croughan MS. Perinatal outcomes in single-tons following in vitro fertilization: a meta-analysis. Obstet Gynecol2004;103:551–63.
[15] Helmerhorst FM, Perquin DA, Donker D, Keirse MJ. Perinatal outcome ofsingletons and twins after assisted conception: a systematic review of con-trolled studies. BMJ 2004;328:261.
[16] Schieve LA, Ferre C, Peterson HB, Macaluso M, Reynolds MA, Wright VC.Perinatal outcome among singleton infants conceived through assistedreproductive technology in the United States. Obstet Gynecol2004;103:1144–53.
[17] McDonald SD, Murphy K, Beyene J, Ohlsson A. Perinatal outcomes of singletonpregnancies achieved by in vitro fertilization: a systematic review and meta-analysis. J Obstet Gynaecol Can 2005;27:449–59.
[18] Boulet SL, Schieve LA, Nannini A, et al. Perinatal outcomes of twin birthsconceived using assisted reproduction technology: a population-based study.Hum Reprod 2008;23:1941–8.
[19] McDonald SD, Han Z, Mulla S, et al. Preterm birth and low birth weight amongin vitro fertilization singletons: a systematic review and meta-analyses. Eur JObstet Gynecol Reprod Biol 2009;146:138–48 [review].
[20] McDonald SD, Han Z, Mulla S, et al. Preterm birth and low birth weight amongin vitro fertilization twins: a systematic review and meta-analyses. Eur J ObstGynecol Reprod Biol 2010;148:105–13.
[21] Maheshwari A, Pandey S, Shetty A, Hamilton M, Bhattacharya S. Obstetric andperinatal outcomes in singleton pregnancies resulting from the transfer offrozen thawed versus fresh embryos generated through in vitro fertilizationtreatment: a systematic review and meta-analysis. Fertil Steril 2012;98(Au-gust (2)):368–77. e1-9.
[22] Kapiteijn K, de Bruijn CS, de Boer E, et al. Does subfertility explain the risk ofpoor perinatal outcome after IVF and ovarian hyperstimulation. Hum Reprod2006;21:3228–34.
[23] Kalra SK, Ratcliffe SJ, Coutifaris C, Molinaro T, Barnhart KT. Ovarian stimulationand low birth weight in newborns conceived through in vitro fertilization.Obstet Gynecol 2011;118:863–71.
[24] Romundstad LB, Romundstad PR, Sunde A, et al. Effects of technology ormaternal factors on perinatal outcome after assisted fertilisation: a popula-tion-based cohort study. Lancet 2008;372:737–43.
[25] Raatikainen K, Kuivasaari-Pirinen P, Hippelainen M, Heinonen S. Comparisonof the pregnancy outcomes of subfertile women after infertility treatment andin naturally conceived pregnancies. Hum Reprod 2012;27:1162–9.
[26] Mukhopadhaya N, Arulkumaran S. Reproductive outcomes after in-vitrofertilization. Curr Opin Obstet Gynecol 2007;19:113–9.
[27] Grady R, Alavi N, Vale R, Khandwala M, McDonald SD. Elective single embryotransfer and perinatal outcomes: a systematic review and metaanalysis. FertilSteril 2012;97:324–31.
[28] Sazonova A, Kallen K, Thurin-Kjellberg A, Wennerholm UB, Bergh C. Factorsaffecting obstetric outcome of singletons born after IVF. Hum Reprod2011;26:2878–86.
[29] Sazonova A, Kallen K, Thurin-Kjellberg A, Wennerholm UB, Bergh C. Obstetricoutcome after in vitro fertilization with single or double embryo transfer. HumReprod 2011;26:442–50.
[30] Sazonova A, Kallen K, Thurin-Kjellberg A, Wennerholm UB, Bergh C. Obstetricoutcome in singletons after in vitro fertilization with cryopreserved/thawedembryos. Hum Reprod 2012;27:1343–50.
[31] Romundstad LB, Romundstad PR, Sunde A, von During V, Skjaerven R, VattenLJ. Increased risk of placenta previa in pregnancies following IVF/ICSI: acomparison of ART and non-ART pregnancies in the same mother. Hum Reprod2006;21:2353–8.
[32] Kallen B, Finnstrom O, Nygren KG, Otterblad Olausson P, Wennerholm UB. Invitro fertilization in Sweden: obstetric characteristics and maternal morbidityand mortality. BJOG 2005;112:529–35.
[33] In vitro fertilisation: perinatal risks and early childhood outcomes scientificimpact paper 8. UK: Royal College of Obstetricians and Gynaecologists. RCOG;2012.
[34] Davies MJ, Moore VM, Willson KJ, et al. Reproductive technologies and the riskof birth defects. N Engl J Med 2012;366(19):1803–13.
[35] Human Fertilisation and Embryology Authority. Fertility Facts and Figures2008. Version 1.0. United Kingdom: HFEA; 2010, www.hfea.gov.uk.
[36] Stromberg B, Dahlquist G, Ericson A, Finnstrom O, Koster M, Stjernqvist K.Neurological sequelae in children born after in-vitro fertilisation: a populationbased study. Lancet 2002;359:461–5.
[37] Ericson A, Nygren KG, Olausson PO, Kallen B. Hospital care utilization of infantsborn after IVF. Hum Reprod 2002;17:929–32.
[38] Moll AC, Imhof SM, Cruysberg JR, Schouten-van Meeteren AY, Boers M, vanLeeuwen FE. Incidence of retinoblastoma in children born after in-vitrofertilisation. Lancet 2003;361:309–10.
[39] Bruinsma F, Venn A, Lancaster P, Speirs A, Healy D. Incidence of cancer inchildren born after in-vitro fertilization. Hum Reprod 2000;15:604–7.
[40] Kallen B, Finnstrom O, Lindam A, Nilsson E, Nygren KG, Olausson PO. Cancerrisk in children and young adults conceived by in vitro fertilization. Pediatrics2010;126:270–6.
[41] Niemitz EL, Feinberg AP. Epigenetics and assisted reproductive technology: acall for investigation. Am J Hum Genet 2004;74:599–609.
[42] Clayton-Smith J. Genomic imprinting as a cause of disease. BMJ2003;327:1121–2.
[43] Maher ER, Brueton LA, Bowdin SC, et al. Beckwith-Wiedemann syndrome anassisted reproduction technology (ART). J Med Genet 2003;40:62–4.
[44] Yeung EH, Druschel C. Cardiometabolic health of children conceived byassisted reproductive technologies. Fertil Steril 2013;99(2):318–26.
[45] Belva F, Henriet S, Liebaers I, Van Steirteghem A, Celestin-Westreich S,Bonduelle M. Medical outcome of 8-year-old singleton ICSI children (born�32 weeks’ gestation) and a spontaneously conceived comparison group.Hum Reprod 2007;22:506–15.
[46] Ceelen M, van Weissenbruch MM, Vermeiden JP, van Leeuwen FE, Delemarre-van de Waal HA. Growth and development of children born after in vitrofertilization. Fertil Steril 2008;90:1662–73.
[47] Ceelen M, van Weissenbruch MM, Vermeiden JP, van Leeuwen FE, Delemarre-van de Waal HA. Cardiometabolic differences in children born after in vitrofertilization: follow-up study. J Clin Endocrinol Metab 2008;93:1682–8.
[48] Allen VM, Wilson RD, Cheung A, Genetics Committee of the Society ofObstetricians and Gynaecologists of Canada (SOGC), Reproductive Endocri-nology Infertility Committee of the Society of Obstetricians and Gynaecolo-gists of Canada (SOGC). Pregnancy outcomes after assisted reproductivetechnology. J Obstet Gynaecol Can 2006;28:220–50.
[49] Imudia AN, Awonuga AO, Kaimal AJ, Wright DL, Styer AK, Toth TL. Electivecryopreservation of all embryos with subsequent cryothaw embryo transfer inpatients at risk for ovarian hyperstimulation syndrome reduces the risk ofadverse obstetric outcomes: a preliminary study. Fertil Steril 2013;99:168–73.
[50] Dhange P, Breeze AC, Kean LH. Routine antenatal management at the bookingclinic. Obstet Gynaecol Reprod Med 2013;23(2):45–52.
[51] NICE Clinical Guideline 62. Antenatal care. UK: National Institute for Healthand Clinical Excellence; 2010, Issued: March 2008 last modified: June 2010,www.guidance.nice.org.uk/cg62.
[52] RCOG Green-top Guideline No. 37a. Reducing the risk of thrombosis andembolism during pregnancy and the puerperium. London, UK: Royal Collegeof Obstetricians and Gynaecologists; 2009.
[53] Kean LH, Breeze AC. Routine antenatal management later in pregnancy. ObstetGynaecol Reprod Med 2010;20(3):69–74.
[54] RCOG Green-top Guideline No. 31. The investigation and management of thesmall–for–gestational–age fetus. 2nd ed. UK: Royal College of Obstetriciansand Gynaecologists; 2013.
[55] Cnossen JS, Morris RK, ter Riet G, et al. Use of uterine artery Doppler ultraso-nography to predict pre-eclampsia and intrauterine growth restriction: asystematic review and bivariable meta-analysis. Can Med Assoc J2008;178:701–11.
[56] Alberry M, Bills V, Soothill P. An update on pre-eclampsia prediction research.The Obstetrician & Gynaecologist 2011;13:79–85.
[57] Papageorghiou AT, Yu CK, Cicero S, Bower S, Nicolaides KH. Second trimesteruterine artery Doppler screening in unselected populations: a review. J MaternFetal Neonatal Med 2002;12:78–88.
[58] Diab AE, El-Behery MM, Ebrahiem MA, Shehata AE. Angiogenic factors for theprediction of pre-eclampsia in women with abnormal midtrimester uterineartery Doppler velocimetry. Int J Gynaecol Obstet 2008;102:146–51.
[59] NICE Clinical Guideline. Multiple pregnancy: the management of twin andtriplet pregnancies in the antenatal period. UK: National Institute for Healthand Clinical Excellence; 2011.


9. Jahrgang 2012 // Modifizierter Nachdruck aus Nummer 6 // ISSN 1810-2107
Offizielles Organ: AGRBM, BRZ, DVR, DGA, DGGEF, DGRM, DIR, EFA, OEGRM, SRBM/DGE
Krause & Pachernegg GmbH, Verlag für Medizin und Wirtschaft, A-3003 Gablitz
www.kup.at/repromedizin Vertriebskennzeichen der Deutschen Post: Y-64238 Preis: EUR 20,– Indexed in EMBASE/Excerpta Medica/Scopus
Journal für
Reproduktionsmedizinund Endokrinologie
2012
– Journal of Reproductive Medicine and Endocrinology –
Andrologie • Embryologie & Biologie • Endokrinologie • Ethik & Recht • GenetikGynäkologie • Kontrazeption • Psychosomatik • Reproduktionsmedizin • Urologie
No.6
JJJJJAHRBUCHAHRBUCHAHRBUCHAHRBUCHAHRBUCH 2011 2011 2011 2011 2011
Modifizierter Nachdruck aus: J Reproduktionsmed Endokrinol 2012; 9 (6): 453–84.
Member of the


Modifizierter Nachdruck aus J Reproduktionsmed Endokrinol 2012; 9 (6) 5
Editorial
Verantwortlich für diese Ausgabe:
Deutsches IVF-Register e. V.
Vorstandsvorsitzender
Dr. med. K. Bühler
Vorstand
Prof. Dr. med. M. Bals-Pratsch (bis Februar 2012)Dr. med. K. Bühler
Prof. Dr. med. M. S. KupkaProf. Dr. med. J.-S. Krüssel
Bisherige Vorsitzende
Prof. Dr. med. R. Felberbaum (1995–2007)Prof. Dr. med. H.-K. Rjosk (1992–1995)Prof. Dr. med. F. Lehmann (1982–1992)
Kuratorium
Verona BlumenauerDr. med. K. Fiedler
PD Dr. med. C. GnothDr. med. L. Happel
Prof. Dr. med. J.-S. Krüsselkooptiertes Mitglied: Prof. Dr. med. R. Felberbaum
Deutsche Gesellschaft für Gynäkologische Endokrinologie und Fortpflanzungsmedizin e.V.
Präsident: Prof. Dr. med. Dr. h. c. mult. T. Rabe
Bundesverband Reproduktionsmedizinischer Zentren Deutschlands e.V.
1. Vorsitzender: Dr. med. U. Hilland
Deutsche Gesellschaft für Reproduktionsmedizin e. V.
Vorstandsvorsitzender: Prof. Dr. med. C. J. Thaler
D·I·R-Datenmanagement
bei der Ärztekammer Schleswig-HolsteinWolfgang Dahncke, Manja Hückstedt, Mirja Wendelken
Bismarckallee 8–12 • 23795 Bad SegebergTel. 04551/803-147 • Fax 04551/803-180 • E-Mail: [email protected]
D·I·R-Geschäftsstelle
Monika Uszkoreit • MRU-Consulting GbRTorstraße 140 • 10119 Berlin
Tel. 030/39 800 743 • E-Mail: [email protected]
www.deutsches-ivf-register.de
@ D·I·R DI!:UT.C H ~. IV" II~CI . TII!II

Modifizierter Nachdruck aus J Reproduktionsmed Endokrinol 2012; 9 (6)6
Editorial
Inhalt Vorwort 9
Aktuelle Themen 10
Allgemeiner Überblick zur Assistierten Reproduktion
in Deutschland
Behandlungsergebnisse 2011 14
Anzahl der Zentren 1982–2011 14
Anzahl der Behandlungen 1982–2011 (plausible Zyklen) 14
Anzahl aller Behandlungen 2011 (prospektive Zyklen) 15
Anzahl der Follikelpunktionen 2011 15
Zusammenfassung der Kurzstatistik 2011 für IVF, ICSI und IVF/ICSI 15
D·I·R-Kurzstatistik 2011 16
D·I·R-Kurzstatistik 2010 17
Klinische SS, Aborte, EUs und Totgeburten 2010 18
Mehrlingsgeburten 2010 18
Geburten in Abhängigkeit von der Anzahl übertragener Embryonen undAltersgruppen (2000–2010) 19
Geburten in Abhängigkeit von der Anzahl übertragener Embryonen– IVF, ICSI, Kryotransfer (2000–2010) 19
Fertilisationsrate IVF und ICSI 2011 20
Indikationsverteilung IVF und ICSI 2011 20
Ergebnisse der In-vitro-Fertilisation, der intracytoplasmatischen
Spermieninjektion und der Kryokonservierung
Behandlungsergebnisse IVF, ICSI, Kryotransfer 2011 21
Behandlungsergebnisse in Abhängigkeit vom Alter der Frau – IVF 2011 22
Behandlungsergebnisse in Abhängigkeit vom Alter der Frau – ICSI 2011 22
Klin. SS/ET in Abhängigkeit von der Anzahl übertragener Embryonen undAltersgruppen 2011 23
Klin. SS/ET in Abhängigkeit von der Embryonenqualität – IVF, ICSI,IVF/ICSI 2011 23
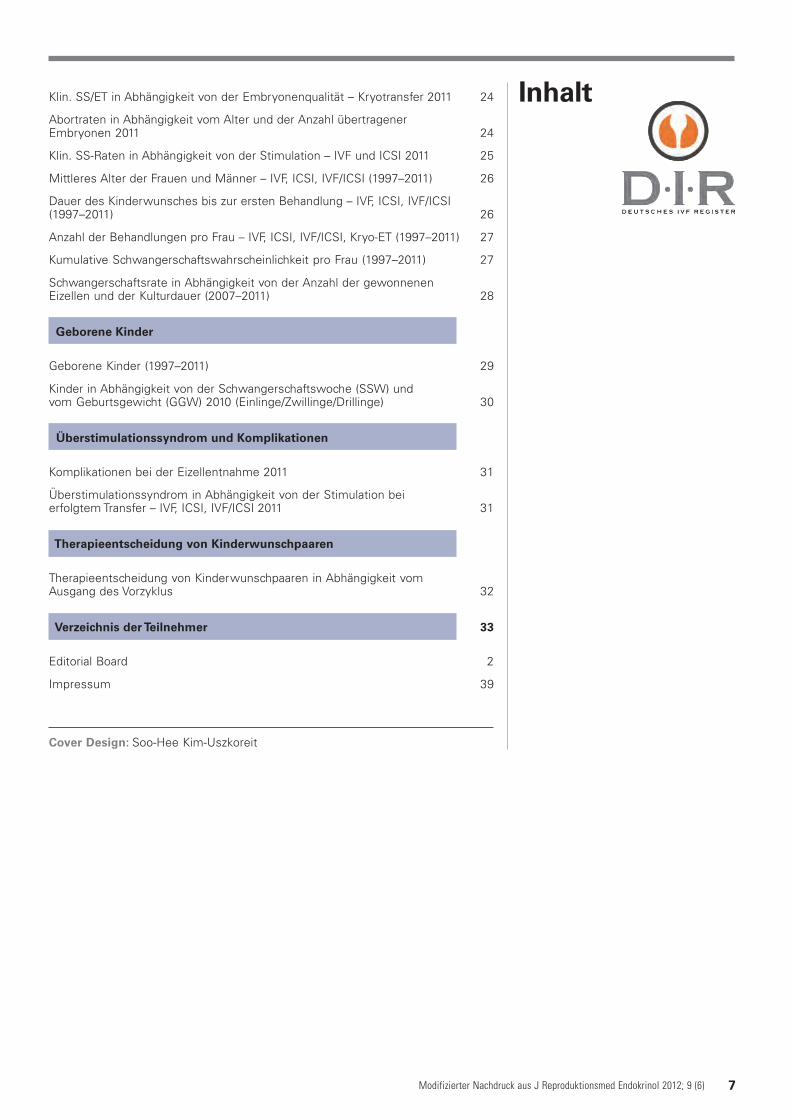
Modifizierter Nachdruck aus J Reproduktionsmed Endokrinol 2012; 9 (6) 7
Editorial
Klin. SS/ET in Abhängigkeit von der Embryonenqualität – Kryotransfer 2011 24
Abortraten in Abhängigkeit vom Alter und der Anzahl übertragenerEmbryonen 2011 24
Klin. SS-Raten in Abhängigkeit von der Stimulation – IVF und ICSI 2011 25
Mittleres Alter der Frauen und Männer – IVF, ICSI, IVF/ICSI (1997–2011) 26
Dauer des Kinderwunsches bis zur ersten Behandlung – IVF, ICSI, IVF/ICSI(1997–2011) 26
Anzahl der Behandlungen pro Frau – IVF, ICSI, IVF/ICSI, Kryo-ET (1997–2011) 27
Kumulative Schwangerschaftswahrscheinlichkeit pro Frau (1997–2011) 27
Schwangerschaftsrate in Abhängigkeit von der Anzahl der gewonnenenEizellen und der Kulturdauer (2007–2011) 28
Geborene Kinder
Geborene Kinder (1997–2011) 29
Kinder in Abhängigkeit von der Schwangerschaftswoche (SSW) undvom Geburtsgewicht (GGW) 2010 (Einlinge/Zwillinge/Drillinge) 30
Überstimulationssyndrom und Komplikationen
Komplikationen bei der Eizellentnahme 2011 31
Überstimulationssyndrom in Abhängigkeit von der Stimulation beierfolgtem Transfer – IVF, ICSI, IVF/ICSI 2011 31
Therapieentscheidung von Kinderwunschpaaren
Therapieentscheidung von Kinderwunschpaaren in Abhängigkeit vomAusgang des Vorzyklus 32
Verzeichnis der Teilnehmer 33
Editorial Board 2
Impressum 39
Cover Design: Soo-Hee Kim-Uszkoreit
Inhalt

Rasterelektronenmikroskopische Aufnahme einer Eizelle mit Cumuluszellen vor derReifung, Blick auf die Zona pellucida (Tiermodell, 2200-fache Vergrößerung).[Quelle: Prof. Dr. med. vet. Sabine Kölle, München]

Vorwort
Modifizierter Nachdruck aus J Reproduktionsmed Endokrinol 2011; 8 (4) 9
Sehr geehrte Damen und Herren, liebe Kolleginnen und Kollegen,das Deutsche IVF-Register wird 30!
Keine vier Jahre nach der ersten Geburt nach einer IVF-Behandlung und in dem Jahr der Geburt desersten „IVF-Babys“ in Deutschland haben sich 1982 die damals fünf aktiven Zentren zusammenge-schlossen, um gemeinsam ihre Tätigkeit auf diesem Gebiet und die Ergebnisse dieser damals so neuenund für viele revolutionären Behandlung zu dokumentieren und der Öffentlichkeit zugänglich zu ma-chen. Mit dem Register ist es uns aber nicht nur gelungen, die Ergebnisse unserer Arbeit der Wissen-schaft und interessierten Öffentlichkeit darzustellen, sondern wir konnten und können zeigen, dass wirnicht im Hinterzimmer an faustischen Homunkuli experimentieren. Seit 1996 die Auswertungen ingebundener Form veröffentlicht werden, ist dieses jährlich erscheinende Jahrbuch zu einem wichtigenNachschlagewerk für Patienten, die Ärzteschaft, Politiker und Journalisten geworden. Höchste deut-sche Gerichte stützen sich in ihren Entscheidungen auf die Auswertungen. Mehr als 1,2 Millionen Zy-klen wurden seit 1982 in unserem Register dokumentiert, seit 1997 wurden mehr als eine Million Zy-klen elektronisch erfasst – weiterhin einzigartig in der Welt. Waren es 1982 742 Behandlungszyklen,über die berichtet wurde, so sind es im vorliegenden Jahrbuch 2011 80.943 Behandlungszyklen. LassenSie uns daran erinnern, dass es vor Einführung des GMG (Gesundheitsmodernisierungsgesetz) sogar105.854 waren! Lag die durchschnittliche klinische Schwangerschaftsrate pro Transfer im Jahr 1982bei 7 %, so beträgt sie 2010 nach durchgeführter IVF- oder ICSI-Behandlung 29,3 %. Die natürlicheFruchtbarkeitsrate beim Menschen liegt zwischen 27 und 30 % pro Zyklus – der Vergleich ist ein klaresIndiz für die hervorragende Qualität der Reproduktionsmedizin in Deutschland, bedenkt man, dass jabei den behandelten Paaren eine nachgewiesene Fortpflanzungsstörung vorliegt.Bedingt durch eine Vielzahl gesellschaftlicher Veränderungen ist der Anteil der mit IVF oder ICSI be-handelten Frauen in der Altersgruppe 35 und älter in den letzten 16 Jahren von 38,7 % auf 54,4 % ge-stiegen. Es ist aber festzuhalten, und die immens große Fallzahl des Deutschen IVF-Register erlaubtsolche statischen Betrachtungen, dass, bei guter Eierstockreaktion, Frauen zwischen 40 und 42 Jahrenin Deutschland Schwangerschaftschancen haben, die im Mittel zwischen 22 % und 23 % liegen. Einganz wesentliches und ebenfalls politisch relevantes Ergebnis ist der Nachweis, dass sich die Schwan-gerschaftschance einer Frau bis 35 Jahre im sechsten Behandlungszyklus nicht wesentlich von der inden drei ersten Behandlungszyklen unterscheidet. Die Annahmen aus dem Jahr 1990 und 2003 sindalso nicht zutreffend und die Politik ist aufgerufen, zu handeln.Noch immer warten die betroffenen Paare darauf, dass die vielen Ankündigungen der Politik, mehr fürdie Paare mit Störungen der Fortpflanzungsfähigkeit zu tun, endlich realisiert werden. In einem so rei-chen, aber kinderarmen Land werden die Betroffenen zwischen den verschiedenen politischen Ebenenzerrieben – beschämend. Lediglich die Länder der „Sachsenschiene“, Sachsen, Sachsen-Anhalt und ab2013 auch Niedersachsen sehen sich in der Lage, dort wohnhafte Paare bei der Finanzierung derKinderwunschbehandlung zu unterstützen, vorausgesetzt, sie lassen sich auch in diesem Bundeslandbehandeln. Der Wohnort entscheidet also über sozialpolitische Leistungen und wie hoch der durch dasPaar aufzubringende Eigenanteil ist. Das darf nicht sein.Einige gesetzliche Krankenkassen machen sich inzwischen die Möglichkeiten des GKV-Versorgungs-strukturgesetzes zunutze und bieten Paaren Satzungsleistungen an, die die enorme finanzielle Belas-tung der Paare durch den 50%igen Eigenanteil reduzieren und in manchen Fällen sogar die Vorgabendes §27a SGB V umgehen. Zusammen mit den Patientenpaaren begrüßen wir diese Erleichterungen.Allen, die dazu beigetragen haben, dass das Deutsche IVF-Register in den letzten 30 Jahren seine vor-zügliche Reputation in der ganzen Welt erworben hat, ist an dieser Stelle ausdrücklich zu danken. DerDank gilt an erster Stelle allen Mitarbeiterinnen und Mitarbeitern in den reproduktionsmedizinischenZentren. Nur durch ihr kontinuierliches und oft mühsames Zusammentragen aller relevanten Datenkann ein solches Register leben und kann die herausragende Qualität dieses Registers hochgehaltenwerden. Der Dank gilt auch den Mitarbeiterinnen und Mitarbeitern der Ärztekammer Schleswig-Hol-stein, wo in den letzten 17 Jahren die Datenauswertung erfolgte und bis zum letzten Jahr auch die Ge-schäftsführung. Ebenso gilt unser Dank MRU-Consulting, die jetzt die Geschäftsstelle führt und uns inder Erstellung der englischen Texte hervorragend unterstützt hat. Das Register zollt auch den bisherigenVorsitzenden Herrn Prof. F. Lehmann, der das Register 1982 ins Leben gerufen hat, Herrn Prof. H. Rjoskund Herrn Prof. R. Felberbaum Dank. Anerkennung und Dank geht auch an alle bisherigen Mitgliederdes Vorstands, des Beirats und des Kuratoriums, die alle in diesen 30 Jahren sehr viel Freizeit geopferthaben, um mit ihrem großen Engagement das Register zu dem zu machen, was es heute ist.
Ihr
Dr. med. K. BühlerVorstandsvorsitzender D·I·R e.V.
@ D·I·R DE U TSCHES IVF REGISTER

Modifizierter Nachdruck aus J Reproduktionsmed Endokrinol 2012; 9 (6)10
Aktuelle Themen
Aktuelle Themen
Reproduktionsmedizin
2011 in Deutschland:
Sicher und erfolgreich
Auch im 30. Jahr nach seiner Gründungveröffentlicht das Deutsche IVF-Regis-ter (D·I·R) wieder umfassend die Daten,die mit den im Jahre 2011 in Deutsch-land erbrachten reproduktionsmedizini-schen Leistungen in Zusammenhang ste-hen. Im Jahr 2011 wurden 49.696 Frau-en mit extrakorporaler Fertilisation, alsoBefruchtung außerhalb des Körpers (As-sisted Reproductive Technique [ART])behandelt. Im Vergleich dazu waren esim Jahr 2010 47.159 Frauen. Als die(Muster-)Richtlinie Assistierte Repro-duktion der Bundesärztekammer im Jahr2000 bundesweit umgesetzt und damitdie Teilnahme am Register für alle Zen-tren verpflichtend war, wurde für nur38.442 Frauen eine Behandlung doku-mentiert; 2003, im Jahr vor Einführungdes Gesundheitssystem-Modernisierungs-gesetzes (GMG), waren es sogar 63.111.Im Durchschnitt unterzog sich jede die-ser Frauen 1,63 (idem) Behandlungs-zyklen.
Plausibilität und Prospektivitätsind hoch2011 wurden 80.943 Behandlungs-zyklen im D.I.R dokumentiert. 97,5 %dieser Datensätze wurden schon auf-grund der Kontrolle während der Daten-eingabe als „plausibel“ klassifiziert. Dasbedeutet, alle im Fragenkatalog desD·I·R erhobenen Informationen wurdenvollständig angegeben und erscheinen insich „stimmig“. Natürlich können mitder Plausibilitätskontrolle nicht alle Da-ten umfassend überprüft und alle Ein-gabefehler ausgeschlossen werden. Füreinen Großteil kann aber dadurch dieLogik, insbesondere zu anderen Items,überprüft werden. Ein weiteres, dasDeutsche IVF-Register auszeichnendeMerkmal, ist die „prospektive“ Daten-eingabe: Der jeweilige Behandlungs-zyklus wird innerhalb der ersten achtTage nach Behandlungsbeginn im Sys-tem angemeldet – zu einem Zeitpunktalso, wenn im Allgemeinen der Zyklus-ausgang noch nicht bekannt ist. DiesesVerfahren der kontinuierlichen und pro-spektiven Datenerfassung trägt erheb-lich zur Datenqualität bei und erlaubt
handlungszyklen) solcher Zyklen durch-geführt. 2011 waren es 16.958 ( ^= 25 %).
Sinkende MehrlingszahlenDas Risiko einer Drillingsgeburt hatüber all die Jahre deutlich abgenommen.Wurden 1997 noch durchschnittlich2,49–2,56 Embryonen transferiert, sosanken diese Zahlen 2011 auf 1,99 bzw.2,02. Diese Abnahme um etwa 20 %führt dazu, dass der Anteil der gebore-nen Drillingskinder an der Gesamtzahlder nach reproduktionsmedizinischenMaßnahmen geborenen Kinder um 80 %abgenommen hat. Der Vergleich derZahl der Mehrlingsgeburten nach ARTmit den Gesamtzahlen des StatistischenBundesamtes zeigt, dass die in Deutsch-land durchgeführten reproduktionsme-dizinischen Maßnahmen für 17,7 % derMehrlingsgeburten verantwortlich sind(2101 von 11.838).
Rolle des Alters wird immernoch verkanntDie Darstellung der altersabhängigenSchwangerschafts- und Fehlgeburten-raten ist seit Jahren ein wertvolles Instru-ment bei der individuellen Aufklärungder Paare. In unseren Gesprächen stellenwir fest, dass die Begrenztheit des repro-duktiven Fensters – die kontinuierlicheAbnahme der monatlichen Schwanger-schaftschance ab dem 32./33. Lebens-jahr der Frau – nach wie vor zu wenigbekannt ist. War 1996 nur jede dritteFrau bei der Behandlung 35 Jahre undälter, so waren es 2011 mehr als dieHälfte.
Embryoqualität ist entschei-dendWie zu erwarten, kann auch dieses Jahrwieder eindrücklich dargestellt werden,dass die individuellen Schwangerschafts-chancen neben dem Alter in hohemMaße von der zu beobachtenden Em-bryoqualität abhängen. Bei einer als„ideal“ eingestuften Qualität birgt biszum Alter von 40 Jahren der Transfervon mehr als zwei Embryonen keinerleiVorteil. Er erhöht vielmehr das Risikoeiner höhergradigen Mehrlingsschwan-gerschaft – und diese gilt es mit allenMitteln zu vermeiden. Obwohl der elek-tive „Single-Embryo-Transfer“ aufgrundder rechtlichen Rahmenbedingungen in
durch die Auswertung der großen Fall-zahlen, dass verlässliche Schlüsse gezo-gen und Behandlungsstrategien vergli-chen werden können. Waren in den Vor-jahren wegen der damaligen Implemen-tierung neuer Erfassungssoftware-Lö-sungen die Raten gesunken, so könnenwir für 2011 wieder ein Ansteigen derPlausibilitäts- und Prospektivitätsratenauf 97,5 % respektive 86,1 % feststellen.Zu diesem Anstieg tragen auch die neu-en Softwarelösungen bei, da sie den Zen-tren die Einhaltung der Kriterien erleich-tern.
Flächendeckende Versorgungist gewährleistetDie Zahl der in Deutschland die Befruch-tung außerhalb des Körpers durchführen-den Zentren ist 2011 auf 128 angestiegen.Auch wenn wir eine Konzentration derZentren für diese hochspezialisierten Be-handlungen in den Städten sehen, ist dieflächendeckende Versorgung gewährleis-tet. Das Teilnehmerverzeichnis am Endesdes Jahrbuchs zeigt die bundesweite, be-darfsgerechte Verteilung.
Behandlungszahlen steigenallmählich wiederDie stetige Zunahme der Behandlungennach dem dramatischen Abfall 2004 istzum einen auf die deutliche Zunahmebei den Behandlungen mittels intracyto-plasmatischer Spermieninjektion (ICSI)zurückzuführen. Im Beitrag über dieSpermienparameter (S. 11) werden dieGründe hierfür aufgezeigt. Bei der Be-trachtung der gesamteuropäischen Da-ten wird offensichtlich, dass es sichdabei nicht um eine auf Deutschlandbeschränkte Entwicklung handelt. DieBehandlungsmethode ICSI zeigt sichzunehmend als das Verfahren der Wahl.Die durchschnittliche Schwangerschafts-rate bei den sog. „Frisch-Zyklen“ von28,7 % (30,2 %/Transfer im IVF-Verfah-ren; 28,3 %/Transfer bei dem Einsatzvon ICSI) entspricht der natürlichenmonatlichen Fruchtbarkeitsrate. Wirstellen aber auch fest, dass das Verfahrender Gefrierkonservierung von Eizellenim Pronukleus-Stadium mit einem nach-folgenden Auftau- und Übertragungs-zyklus nominell und relativ in den letztenfünf Jahren deutlich zugenommen hat.2006 wurden 9983 ( ^= 19,9 % aller Be-

Aktuelle Themen
Modifizierter Nachdruck aus J Reproduktionsmed Endokrinol 2012; 9 (6) 11
Deutschland nicht möglich ist, werdenwir daran arbeiten, die Rate der Mehr-lingsschwangerschaften noch weiter zusenken.
Extrakorporale Befruchtungensind sicherDas Geburtsgewicht der nach ART gebo-renen Kinder unterscheidet sich nicht si-gnifikant von dem der Kinder, die ohneden Einsatz von ART empfangen wur-den.
Im Jahr 2011 wurden in 0,27 % allerBehandlungen schwerwiegende Kom-plikationen bei der Eizellentnahme do-kumentiert. Bei der extrakorporalen Be-fruchtung handelt es sich daher um einesichere Methode.
Daten- und Ergebnisqualitätnehmen stetig weiter zuWie eingangs schon dargestellt, über-prüft das Deutsche IVF-Register konti-nuierlich die Datenqualität der über-mittelten Informationen. Dies geschiehthinsichtlich Prospektivität und Plausibi-lität bereits bei der Dateneingabe. Aberauch viele andere Parameter aus jedemZentrum werden einer Prüfung unter-zogen: die Anzahl der angemeldeten undspäter wieder gelöschten Zyklen, dasVerhältnis der Kryo-Auftauzyklen zurGesamtzahl der Frisch-Zyklen, das An-meldedatum der Zyklen und ggf. eineauffällige Häufung an Tag 7 oder 8,die Normalverteilung der angegebenenSchwangerschaftsdauer, u. v. m.
Natürlich erfolgt auch eine Überprüfungder Ergebnisqualität der einzelnen Zen-tren. Jedem Zentrum wird auf der Basisvon 47 Items ein sogenanntes „Zen-trumsprofil“ erstellt und übermittelt. An-hand der grafischen Darstellung derPerzentilenkurven, in die die Ergebnissealler Zentren eingehen, wird jedes Zen-trum in die Lage versetzt, die eigene Po-sition im Vergleich zu den anderen Zen-tren (diese sind pseudonymisiert) zu er-kennen. Dieses Verfahren hat sich schonvor Jahrzehnten im Rahmen derPerinatalerhebung bewährt. Bei extre-men Abweichungen kann das Zentrumseitens des D·I·R um eine Stellungnah-me gebeten werden. Auch die IVF-Kom-mission der jeweiligen Landesärztekam-mer erhält diese Profile, so dass die Qua-litätssicherung entsprechend der gesetz-lichen Bestimmungen auch regional vor-genommen werden kann.
Mit all diesen Maßnahmen wird diehohe Ergebnisqualität der Reproduk-tionsmedizin in Deutschland und diesehr gute Datenqualität unseres Regis-ters ständig verbessert.
♦ ♦ ♦
Überlegungen zur Indika-
tion reproduktionsmedi-
zinischer Therapien bei
männlicher Subfertilität
Seit einigen Jahren nimmt der Anteil dersog. ICSI-Zyklen an den extrakorpora-len Therapien kontinuierlich zu und hatmittlerweile die 75 % überschritten(S. 16). Dieser Trend ist nicht mit einermethodisch bedingten, grundsätzlichbesseren Fertilisationsrate, höherenTransferrate oder höheren Schwan-gerschaftsrate in einem sog. ICSI-Zy-klus im Vergleich zur richtig indiziertenkonventionellen IVF zu erklären.
Fertilisationsversagen ist derschlechteste Ausgang einerBehandlungBereits im Jahrbuch 2009 wurden Datengezeigt, die belegen, dass ab einer Sper-miendichte von < 25×106/ml im Nativ-ejakulat und < 15×106/ml nach Sperma-aufbereitung und/oder einer Spermien-progressivmotilität < 20 % nativ und< 10 % nach Aufbereitung und/odereiner Gesamtmotilität < 40 % nativ und< 65 % nach Aufbereitung ein Fertilisa-tionsversagen bei einer klassischen IVFbei bis zu 40 % der Behandlungen droht.Ein Fertilisationsversagen ist der schlech-teste Ausgang eines Behandlungszyklus,da das betroffene Paar keine Chance aufeine Schwangerschaft hatte und bei derbegrenzten Anzahl von Versuchen zuLasten der Kostenträger ein Versuch ver-geben wurde. Deshalb gilt es, ein Fertili-sationsversagen mit allen Mitteln zu ver-meiden. Die Veröffentlichung der neuenunteren Referenzwerte im Laborhand-buch der Weltgesundheitsorganisation(WHO) 2010 hat hier zu großer Verunsi-
Unter dem Strich – das Jahr 2011
– Von 1997 bis 2011 sind im Register insgesamt 172.993 geborene Kinder doku-mentiert
– Bei ungestörter Eierstockfunktion kam es im Jahr 2011 – gemittelt über alleAltersklassen – in 36,1 % aller Embryotransfers zu einer Schwangerschaft nachkonventioneller IVF
– Bei einer Therapie mit ICSI betrug diese Wahrscheinlichkeit 33,6 %
– In Kryozyklen (Transfer nach zuvor eingefrorenen und wieder aufgetauten Ei-zellen im Vorkernstadium) lag die Wahrscheinlichkeit bei 19,7 %
– Bei ungestörter Eierstockfunktion zeigen die Daten für 2010, dass von 23,7 %aller Embryotransfers eine Geburt gemeldet wurde
– 2011 waren mehr als die Hälfte aller behandelten Frauen 35 Jahre und älter.1996 – vor nur 15 Jahren – war lediglich jede dritte Frau älter als 35
– Mit zunehmendem Alter der Frau steigt die Wahrscheinlichkeit einer Fehlgeburtstark an, während sich die Eizellreserve und -qualität verringern.
– Die Gesamtschwangerschaftswahrscheinlichkeit steigt mit der Zahl der durch-geführten Behandlungen bzw. der transferierten Embryonen stetig an
– Die Mehrlingsrate hat sich gegenüber den vergangenen Jahren weiter verringert.Die in Deutschland durchgeführten reproduktionsmedizinischen Maßnahmensind nur für 17,7 % der Mehrlingsgeburten verantwortlich (2101 [D.I.R] von11.838 [Quelle: Statistisches Bundesamt]).
– Patientenpaare werden auch im Jahr 2011 in Deutschland im internationalenVergleich hervorragend behandelt
– Wichtig für die Patientenpaare ist• die Folgen des Alters auf die Entwicklung der natürlichen Fruchtbarkeit zu
kennen• die rechtzeitige Entscheidung zur angebrachten Therapie• nicht zu schnell aufzugeben

Modifizierter Nachdruck aus J Reproduktionsmed Endokrinol 2012; 9 (6)12
Aktuelle Themen
cherung geführt, da auf der 5. Perzentileliegende Parameter oft als „Normal-werte“ missverstanden werden.
Neue WHO-Referenzwerte sa-gen nur bedingt etwas überdie Fertilität ausDie Referenzwerte in dieser aktuellen5. Auflage des WHO-Handbuches zurUntersuchung und Aufbereitung desmenschlichen Ejakulates (WHO 2010)eignen sich aber nicht zur Indikations-stellung einer reproduktionsmedizini-schen Therapie oder Auswahl einer re-produktionsmedizinischen Methode, daes sich um Referenzwerte für fertileMänner handelt, deren Partnerinnen imLaufe eines Jahres spontan schwangerwurden.
Üblicherweise überstreicht bei Labor-parametern der Referenzbereich 95 %aller Werte. Jenseits dieser Grenzen lie-gen die Werte einer signifikant unter-schiedlichen Population. Für Spermio-grammparameter ist jedoch ein einseiti-ges Referenzintervall sinnvoller, da sehrhohe Werte die Fertilität nicht beein-trächtigen werden. Insofern wurde ausstatistischen Gründen die 5-%-Perzen-tile als unterer Referenzwert definiert;das heißt: 95 % der Väter gewordenenMänner hatten Spermiogramme mit ei-nem Samenvolumen von > 1,5 ml, einerGesamtspermienzahl von > 39×106/ml,einer Spermienkonzentration > 15×106/ml, einer Progressivmotilität über 32 %bei einer Gesamtmotilität > 40 %. DieNormalformen lagen oberhalb von 4 %.Insofern hat diese Grenzziehung derWHO nur systematisch-methodischeGründe und sagt, wie die WHO selbstanmerkt, nur sehr bedingt etwas über dieFertilität aus. Zudem werden Ejakulat-analysen meistens nicht bei gerade Vatergewordenen Männern durchgeführt,sondern bei Männern aus Partnerschaf-ten mit unerfülltem Kinderwunsch.
Normale Spermiogramme be-weisen nicht die männlicheFertilitätHier kann eine prospektive, niederländi-sche Multicenter-Studie zur spontanenKonzeptionsaussicht von 3345 subferti-len Paaren ohne relevanten weiblichenSterilitätsfaktor herangezogen werden,deren Datenbasis damit fast an die desWHO-Kollektivs heranreicht. Aus einererweiterten Analyse dieser Studie wis-sen wir, dass selbst bei Spermiogramm-
konzentrationen oberhalb von 40×106/ml und einer schnellen Progressivmotili-tät von idealen 50 %, die Aussicht inner-halb eines Jahres spontan zu konzipie-ren, bestenfalls 65 % beträgt. Trotzscheinbar „normaler Spermiogramm-parameter“ ist im Vergleich zu nach-weislich fertilen Männern die Fertilitätnicht einmal halb so hoch. Mit den altenWHO-Mindestwerten von 1999 (Sper-mienkonzentration von 20×106/ml, An-teil schnell progressiver motiler Spermi-en von 25 %) ist die Fertilität auf < 1/4reduziert. Bezogen auf die 5. Perzentileder Referenzwerte der WHO 2010 liegtdie Wahrscheinlichkeit auf eine fortlau-fende Schwangerschaft in einem Jahrnur bei 31,53 %, d. h. für 70 % der Män-ner mit Frauen ohne relevanten Sterili-tätsfaktor wird es auch in einem weite-ren Jahr nicht zu einer Schwangerschaftkommen. Pro Zyklus beträgt die Spon-tankonzeptionsrate lediglich 3,11 %. DieFertilität bei den Männern ist damit auf
weniger als 1/8 der normalen Fertilitätreduziert.
Dauer des unerfüllten Kinder-wunsches indiziert reproduk-tionsmedizinische MaßnahmeAus Spermiogrammen lässt sich also derGrad der Fertilitätsminderung von Män-nern aus subfertilen Partnerschaftenohne relevanten weiblichen Sterilitäts-faktor ablesen. Da auch „ideale Werte“in diesem Kollektiv eine männliche Sub-fertilität nicht ausschließen, besteht dieIndikation zu reproduktionsmedizini-schen Maßnahmen. Diese kann sich da-her alleine aus der Zeitdauer des uner-füllten Kinderwunsches ergeben. Wel-che reproduktionsmedizinische Technikzum Einsatz kommt, richtet sich im Wei-teren wesentlichen nach den Resultatender Spermaaufbereitung und der Aus-beute an progressiv motilen Spermien.Nur so lässt sich das Risiko eines kom-pletten und inkompletten Fertilisations-versagens auf ein Minimum reduzieren.Das ist den deutschen IVF-Zentren inder Vergangenheit vorbildlich gelungen,wie die Zahlen des aktuellen Jahrbuchesund auch vergangener Jahre zeigen.
Literatur: bei der Geschäftsstelle des D·I·R
♦ ♦ ♦
Zukunft im IVF-Labor
Gastbeitrag von Prof. Dr. rer. nat. MarkusMontag, Heidelberg
Eine Betrachtung der Frage nach derZukunft im IVF-Labor kann von ver-schiedenen Seiten erfolgen: Zukunft imSinne von was kommt an Neuem auf unszu, aber auch Zukunft in Hinblick aufwie geht es weiter.
Vor dem Blick in die Zukunft einBlick zurückWas hat die jüngste Vergangenheit imIVF-Labor gebracht: Neue Kulturmedi-en insbesondere für die Kultur bis zumTag 5, optimierte Einfrierverfahren fürEizellen und Embryonen mittels derVitrifikation, kleinere Inkubatoren undreduzierte Sauerstoffatmosphäre, Quali-tätsmanagement wie Zertifizierung undAkkreditierung. Auch wenn das eineoder andere die Schwangerschaftsratepositiv verändert haben mag: Der großeDurchbruch war noch nicht dabei.
Variabilität im Erscheinungsbild menschlicher Spermi-en (Normalform oben, auffällige Morphologien Mitteund unten. [Quelle: Prof. Dr. Dr. h.c. Hans WilhelmMichelmann und Dr. Peter Schwartz, Göttingen.]

Aktuelle Themen
Modifizierter Nachdruck aus J Reproduktionsmed Endokrinol 2012; 9 (6) 13
Wenn man die Zukunft unter dem As-pekt einer Steigerung der Erfolgsratensieht, dann liegt der größte Nutzen ausSicht der Patienten zukünftig sicherdarin, die Behandlungs- und Laborqua-lität in Zentren mit niedrigen Erfolgs-raten zu verbessern. Dies vor dem Hin-tergrund von globalen Schwanger-schaftsraten die bei 20–25 % pro Be-handlungszyklus liegen und der Tat-sache, dass laut D.I.R im Jahr 2010 un-ter den 100 größten IVF-Zentrenimmerhin 40 Zentren eine Schwanger-schaftsrate pro Transfer von unter 25 %aufwiesen. Dies muss auch bei neuenLabormethoden und Vorgehensweisenberücksichtigt werden, setzen diesedoch eine gewisse Grundqualität vor-aus, um mit neuen, technisch an-spruchsvollen Verfahren den Erfolgszu-gewinn in der Routine zu bekommen,den man erwartet.
Morphokinetik gewinnt an Be-deutungGanz oben auf der Liste der zukünftigenAspekte, die von Bedeutung sein werden,steht die nach wie vor größte Herausfor-derung im IVF-Labor: die Identifikationder Embryonen eines Behandlungszy-klus, die eine hohe Implantationsrate be-sitzen. Hier wird in den nächsten Jahrendie Morphokinetik, d. h. die morphologi-sche Beurteilung von Embryonen überdie Zeit, zunehmend eine dominierendeRolle spielen. Wird die Morphokinetikum einfache und physiologisch bedeut-same diagnostische Methoden ergänzt– hier wären neben der array-CGH vor al-lem verbesserte metabolische Konzeptezu nennen – dann kann sich in Verbin-dung mit der Vitrifikation zwangsläufigder elektive „Single-Embryo-Transfer“durchsetzen und damit eine weitere Re-duzierung der Mehrlingsrate.
Ökonomie hält Einzug ins IVF-LaborEin völlig anderer Aspekt, der die Zu-kunft im IVF-Labor bestimmt, ist dieÖkonomie. International sind Labor-verbünde verstärkt im Kommen und dieÜbernahme von IVF-Zentren durch In-vestoren ist nichts Neues. Dies wird un-weigerlich zu neuen Konzepten führen,von zentralen IVF-Laboratorien bis hinzur Nutzung von elektronischen Kom-munikationssystemen zur standardisier-ten Beurteilung von Embryonen und de-ren Auswahl für den Transfer.
Insofern birgt die Zukunft viele interes-sante Herausforderungen, aber sie setztauch eine gewisse Offenheit voraus, sichmit Veränderungen auseinanderzusetzenund Altes und Gewohntes zu überden-ken.

Registerteilnehmer n = 128
Daten zum Stichtag (21.08.2012) exportiert n = 128
dokumentierte Behandlungszyklen n = 80.943 (100,00 %)
plausibel n = 78.922 (97,50 %)
prospektiv (alle Behandlungen) n = 67.935 (86,08 %)
prospektiv (IVF, ICSI, IVF/ICSI) n = 45.078 (84,93 %)
Anzahl der behandelten Frauen* n = 49.696
Behandlungszyklen/Frau (Mittelwert) 1,63
Ab 1999 werden alle begonnene Behandlungen dokumentiert. *) Keine Behandlung: abgebrochene Behandlungen vor durchgeführter Eizellbehandlung.
**) Der Wert “Gesamt” enthält auch GIFT-Fälle. Da diese seit 2005 nur noch in nicht mehr dokumentationswürdigem Ausmaß auftraten, wird auf eineeinzelne Darstellung verzichtet.
1982 1986 1990 1994 1998 2000 2001 2002 2003 2004 2005 2006 2007 2008 2009 2010 2011
IVF
ICSI
IVF/ICSI
Kryo
Keine *
742 3.806 7.343 16.175
5.856
499
16.763
23.578
424
4.616
67
28.945
15.752
790
9.457
6.562
28.506
24.897
695
12.195
7.507
23.936
37.692
678
14.923
9.802
28.058
51.389
987
14.265
11.133
11.848
25.339
446
16.883
4.928
11.098
25.532
590
14.471
4.539
11.082
28.015
672
14.926
4.600
11.362
31.452
798
16.566
5.137
11.264
34.333
834
17.646
5.825
11.585
36.712
873
17.866
5.946
11.346
38.463
989
17.969
6.289
11.341
40.641
1.094
19.228
6.618
Gesamt** 742 4.201 8.653 23.684 45.459 61.531 73.819 87.044 105.854 59.448 56.232 59.295 65.316 69.902 72.984 76.072 78.922
1982 1986 1990 1994 1996 1998 2000 2001 2002 2003 2004 2005 2006 2007 2008 2009 2010 2011
IVF
ICSI
Kryo
5
0
0
28
0
0
53
0
0
66
32
19
66
59
35
86
85
63
100
98
77
107
108
95
112
112
97
114
116
101
118
120
112
117
117
109
120
120
109
118
118
112
117
120
112
119
119
117
121
124
120
124
128
125
Gesamt* 71 86 102 108 112 116 120 117 121 118 120 121 124 128
*) Basismenge: alle Frauen mit Altersangabe; unplausible Zyklen werden auch gezählt
*) Für die Jahre vor 1996 (Einführung der elektronischen Datenverarbeitung im DIR) können hierzu keine Angaben gemacht werden.
Anzahl der Zentren 1982 - 2011für IVF-, ICSI- und Kryotransfer-Behandlungen
Anzahl der Behandlungen 1982 - 2011 (plausible Zyklen)IVF, ICSI, IVF/ICSI, Kryotransfer
Behandlungsergebnisse 2011Arbeitsgruppen für IVF-, ICSI-, GIFT- und Kryotransfer-Behandlungen
Modifizierter Nachdruck aus J Reproduktionsmed Endokrinol 2012; 9 (6)14

Anzahl aller Behandlungen 2011 (prospektive Zyklen)IVF, ICSI, IVF/ICSI, Kryotransfer
IVF ICSI IVF/ICSI Kryo Keine Beh. Summe
Anzahl 9.524 34.637 917 16.958 5.899 67.935
in % 14,02 50,99 1,35 24,96 8,68 100,00
Anzahl der Follikelpunktionen 2011IVF, ICSI*
*) Follikelpunktionen, die zu einer Eizellbehandlung mit IVF und/oder ICSI geführt haben.
**) In der Gesamtsumme ist jeweils auch der Wert für IVF/ICSI enthalten, für 2011 waren dies z. B. 1.094 Punktionen.
Es wurden prospektiv und retrospektiv erfasste Daten verwendet.
n 55.000
50.000
45.000
40.000
35.000
30.000
25.000
20.000
15.000
10.000
5.000
0
1982 1986 1990 1996 1998 2000 2001 2002 2003 2004 2005 2006 2007 2008 2009 2010 2011
IVF
ICSI
742 3.806 7.343 14.344
16.108
14.024
22.420
28.945
15.752
28.506
24.897
23.936
37.692
28.058
51.389
11.848
25.339
11.410
26.370
11.082
28.015
11.362
31.452
11.264
34.333
11.585
36.712
11.346
38.463
11.341
40.641
Gesamt** 742 3.806 7.343 30.452 37.933 45.487 54.098 62.306 80.434 37.633 38.382 39.769 43.612 46.431 49.170 50.798 53.076
Zusammenfassung der Kurzstatistik 2011 für IVF, ICSI und IVF/ICSIDeutsches IVF-Register Stand: 21.08.2012
IVF-, ICSI-,IVF/ICSI-Be-handlungen
53.076100,00 %
Fertilisation
50.61495,36 %
Transfer
48.166 95,16 %
Klin. SS/ET
13.84128,74 %
Geburt
5.810 41,98 %
Abort2.564 18,52 %
EU219 1,58 %
Noch nicht erfasst5.248 37,92 %
Zwilling
1.222 21,03 %
Drilling
54 0,93 %
Einling
4.534 78,04 %
Anmerkung zur loss for follow up-Rate (“noch nicht erfasst”):Hier schlägt sich der frühe Annahmeschluss der Daten nieder.
Es wurden prospektiv und retrospektiv erfasste Daten verwendet.
IVF
ICSI
1982
1983
1984
1985
1986
1987
1988
1989
1990
1991
1992
1993
1994
1995
1996
1997
1998
1999
2000
2001
2002
2003
2004
2005
2006
2007
2008
2009
2010
2011
Modifizierter Nachdruck aus J Reproduktionsmed Endokrinol 2012; 9 (6) 15

IVF
11.341 21,37 %
D.I.R.-Kurzstatistik 2011Deutsches IVF-Register
Stand: 21.08.2012
Erfasste Zyklen 2011
80.943 100,00 %
plausible Zyklen 2011 (prospektiv und nicht prospektiv)
78.922 97,50 %
Stimulation zur Eizellentnahme
58.250 73,81 %
Vorbehandlung zum Kryotransfer-Zyklus
20.672 26,19 %
Follikelpunktion
54.817 94,11 %
Eizellen gewonnen
53.743 98,04 %
ICSI
40.641 76,57 %
IVF/ICSI
1.094 2,06 %
Kryo-Auftau durchgeführt
19.228 93,01 %
Fertilisation
38.929 95,79 %
Fertilisation
1.083 98,99 %
Transfer10.096 95,23 %
(pro IVF-Behandlung: 89,02 %)
Transfer37.084 95,26 %
(pro ICSI-Behandlung: 91,25 %)
Transfer986 91,04 %
(pro IVF/ICSI-Behandlung: 90,13 %)
Kryotransfer18.307 95,21 %
Klin SS/ET
3.050 30,21 %
Klin SS/ET
10.490 28,29 %
Klin SS/ET
301 30,53 %
Klin SS/ET
3.597 19,65 %
Geburt Abort EU1.197 575 6439,25 % 18,85 % 2,10 %
Einling
3.530 78,94 %
Zwilling
902 20,17 %
Drilling
40 0,89 %
Geburt Abort EU4.472 1.933 14842,63 % 18,43 % 1,41 %
Geburt Abort EU141 56 7
46,84 % 18,60 % 2,33 %
Geburt Abort EU1.593 803 74
44,29 % 22,32 % 2,06 %
Eizellbehandlung
53.076 98,76 %
Fertilisation
10.602 93,48 %
Keine Eizellen gewonnen
1.074 1,96 %
Keine Eizellbehandlung
667 1,24 %
Keine Follikelpunktion
3.433 5,89 %
Kryo-Auftau nichtdurchgeführt
1.444 6,99 %
Noch nicht erfasst1.214 39,80 %
Noch nicht erfasst3.937 37,53 %
Noch nicht erfasst97 32,23 %
Noch nicht erfasst1.127 31,33 %
Einling
902 75,36 %
Zwilling
281 23,48 %
Drilling
14 1,17 %
Einling
102 72,34 %
Zwilling
39 27,66 %
Drilling
0 0 %
Einling
1.333 83,68 %
Zwilling
243 15,25 %
Drilling
17 1,07 %
Modifizierter Nachdruck aus J Reproduktionsmed Endokrinol 2012; 9 (6)16
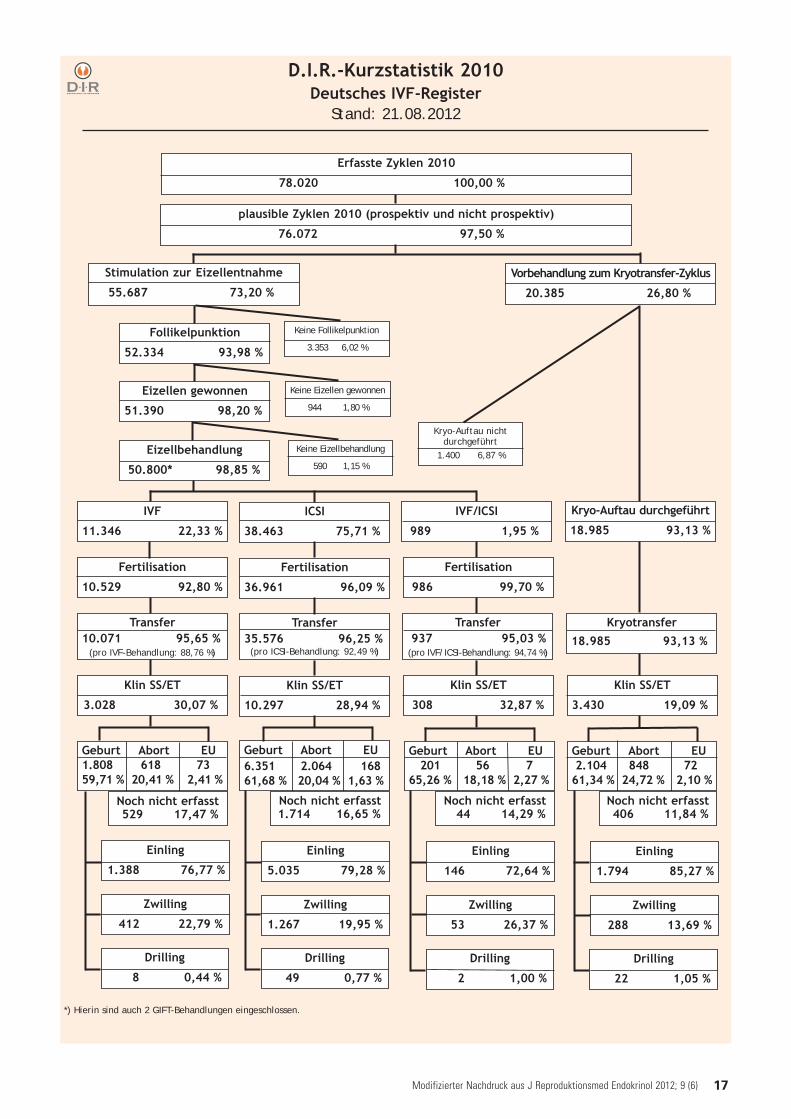
D.I.R.-Kurzstatistik 2010Deutsches IVF-Register
Stand: 21.08.2012
*) Hierin sind auch 2 GIFT-Behandlungen eingeschlossen.
IVF
11.346 22,33 %
Erfasste Zyklen 2010
78.020 100,00 %
plausible Zyklen 2010 (prospektiv und nicht prospektiv)
76.072 97,50 %
Stimulation zur Eizellentnahme
55.687 73,20 %
Vorbehandlung zum Kryotransfer-Zyklus
20.385 26,80 %
Follikelpunktion
52.334 93,98 %
Eizellen gewonnen
51.390 98,20 %
ICSI
38.463 75,71 %
IVF/ICSI
989 1,95 %
Kryo-Auftau durchgeführt
18.985 93,13 %
Fertilisation
36.961 96,09 %
Fertilisation
986 99,70 %
Transfer10.071 95,65 %
(pro IVF-Behandlung: 88,76 %)
Transfer35.576 96,25 %
(pro ICSI-Behandlung: 92,49 %)
Transfer937 95,03 %
(pro IVF/ICSI-Behandlung: 94,74 %)
Kryotransfer18.985 93,13 %
Klin SS/ET
3.028 30,07 %
Klin SS/ET
10.297 28,94 %
Klin SS/ET
308 32,87 %
Klin SS/ET
3.430 19,09 %
Geburt Abort EU1.808 618 7359,71 % 20,41 % 2,41 %
Einling
5.035 79,28 %
Zwilling
1.267 19,95 %
Drilling
49 0,77 %
Geburt Abort EU6.351 2.064 16861,68 % 20,04 % 1,63 %
Geburt Abort EU201 56 7
65,26 % 18,18 % 2,27 %
Geburt Abort EU2.104 848 72
61,34 % 24,72 % 2,10 %
Eizellbehandlung
50.800* 98,85 %
Fertilisation
10.529 92,80 %
Keine Eizellen gewonnen
944 1,80 %
Keine Eizellbehandlung
590 1,15 %
Keine Follikelpunktion
3.353 6,02 %
Kryo-Auftau nichtdurchgeführt
1.400 6,87 %
Noch nicht erfasst529 17,47 %
Noch nicht erfasst1.714 16,65 %
Noch nicht erfasst44 14,29 %
Noch nicht erfasst406 11,84 %
Einling
1.388 76,77 %
Zwilling
412 22,79 %
Drilling
8 0,44 %
Einling
146 72,64 %
Zwilling
53 26,37 %
Drilling
2 1,00 %
Einling
1.794 85,27 %
Zwilling
288 13,69 %
Drilling
22 1,05 %
Modifizierter Nachdruck aus J Reproduktionsmed Endokrinol 2012; 9 (6) 17
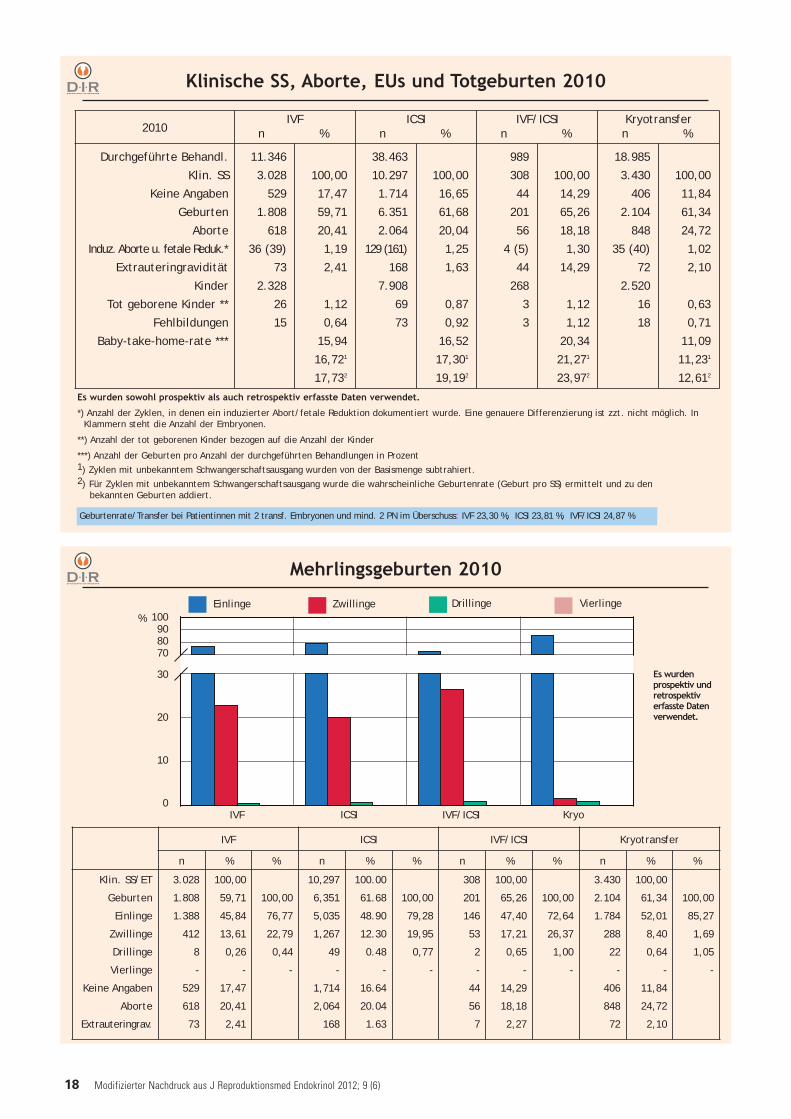
Klinische SS, Aborte, EUs und Totgeburten 2010
Es wurden sowohl prospektiv als auch retrospektiv erfasste Daten verwendet.
*) Anzahl der Zyklen, in denen ein induzierter Abort/fetale Reduktion dokumentiert wurde. Eine genauere Differenzierung ist zzt. nicht möglich. In Klammern steht die Anzahl der Embryonen.
**) Anzahl der tot geborenen Kinder bezogen auf die Anzahl der Kinder
***) Anzahl der Geburten pro Anzahl der durchgeführten Behandlungen in Prozent 1) Zyklen mit unbekanntem Schwangerschaftsausgang wurden von der Basismenge subtrahiert.2) Für Zyklen mit unbekanntem Schwangerschaftsausgang wurde die wahrscheinliche Geburtenrate (Geburt pro SS) ermittelt und zu den
bekannten Geburten addiert.
2010IVF
n %ICSI
n %IVF/ICSI
n %Kryotransfern %
Durchgeführte Behandl.
Klin. SS
Keine Angaben
Geburten
Aborte
Induz. Aborte u. fetale Reduk.*
Extrauteringravidität
Kinder
Tot geborene Kinder **
Fehlbildungen
Baby-take-home-rate ***
11.346
3.028
529
1.808
618
36 (39)
73
2.328
26
15
100,00
17,47
59,71
20,41
1,19
2,41
1,12
0,64
15,94
16,721
17,732
38.463
10.297
1.714
6.351
2.064
129 (161)
168
7.908
69
73
100,00
16,65
61,68
20,04
1,25
1,63
0,87
0,92
16,52
17,301
19,192
989
308
44
201
56
4 (5)
44
268
3
3
100,00
14,29
65,26
18,18
1,30
14,29
1,12
1,12
20,34
21,271
23,972
18.985
3.430
406
2.104
848
35 (40)
72
2.520
16
18
100,00
11,84
61,34
24,72
1,02
2,10
0,63
0,71
11,09
11,231
12,612
Mehrlingsgeburten 2010
IVF ICSI IVF/ICSI
100908070
30
20
10
0Kryo
%ZwillingeEinlinge Drillinge
Es wurdenprospektiv undretrospektiverfasste Datenverwendet.
Vierlinge
Geburtenrate/Transfer bei Patientinnen mit 2 transf. Embryonen und mind. 2 PN im Überschuss: IVF 23,30 %, ICSI 23,81 %, IVF/ICSI 24,87 %
IVF ICSI IVF/ICSI Kryotransfer
n % % n % % n % % n % %
Klin. SS/ET
Geburten
Einlinge
Zwillinge
Drillinge
Vierlinge
Keine Angaben
Aborte
Extrauteringrav.
3.028
1.808
1.388
412
8
-
529
618
73
100,00
59,71
45,84
13,61
0,26
-
17,47
20,41
2,41
100,00
76,77
22,79
0,44
-
10,297
6,351
5,035
1,267
49
-
1,714
2,064
168
100.00
61.68
48.90
12.30
0.48
-
16.64
20.04
1.63
100,00
79,28
19,95
0,77
-
308
201
146
53
2
-
44
56
7
100,00
65,26
47,40
17,21
0,65
-
14,29
18,18
2,27
100,00
72,64
26,37
1,00
-
3.430
2.104
1.784
288
22
-
406
848
72
100,00
61,34
52,01
8,40
0,64
-
11,84
24,72
2,10
100,00
85,27
1,69
1,05
-
Modifizierter Nachdruck aus J Reproduktionsmed Endokrinol 2012; 9 (6)18

IVF Einlingn %
Zwillingn %
Drillingn %
Vierlingn %
Gesamtn
1 Embryo2 Embryonen3 Embryonen
1.724
16.223
5.588
98,51
76,56
71,12
26
4.888
1.916
1,49
23,07
24,39
0
78
347
-
0,37
4,42
0
1
6
-
0,00
0,08
1.750
21.190
7.857
Summe 23.535 76,42 6.830 22,18 425 1,38 7 0,02 30.797
ICSI Einlingn %
Zwillingn %
Drillingn %
Vierlingn %
Gesamtn
1 Embryo2 Embryonen3 Embryonen
3.206
37.034
11.174
98,56
79,21
74,59
47
9.558
3.354
1,44
20,44
22,39
0
157
446
-
0,34
2,98
0
3
6
-
0,01
0,04
3.253
46.752
14.980
Summe 51.414 79,12 12.959 19,94 603 0,93 9 0,01 64.985
Geburten in Abhängigkeit von der Anzahlübertragener Embryonen 2000 - 2010 - IVF, ICSI, Kryotransfer
Es wurden prospektiv und retrospektiv erfasste Daten verwendet.
Geburten in Abhängigkeit von der Anzahl übertragener Embryonenund Altersgruppen 2000 - 2010 - IVF, ICSI, IVF/ICSI, Kryotransfer
Gesamtzahl der Geburten 2000 - 2010: 116.610
Alterder Frau
Einling Zwilling Drilling Vierling Gesamt
n % n % n % n % n
bis 24Jahre
1 Embryo2 Embryonen3 Embryonen
1191.517
269
100,0077,2068,45
0440103
-22,3926,21
08
19
-0,414,83
002
--
0,51
1191.965
393
Summe 1.905 76,91 543 21,92 27 1,09 2 0,08 2.477
25 - 29Jahre
1 Embryo2 Embryonen3 Embryonen
1.04113.7372.543
98,3075,9269,03
184.282
934
1,7023,6725,35
073
204
-0,405,54
023
-0,010,08
1.05918.0943.684
Summe 17.321 75,85 5.234 22,92 277 1,21 5 0,02 22.837
30 - 34Jahre
1 Embryo2 Embryonen3 Embryonen
2.42727.4817.098
98,1477,8770,92
467.6672.508
1,8621,7325,06
0141396
-0,403,96
016
-0,000,06
2.47335.29010.008
Summe 37.006 77,47 10.221 21,40 537 1,12 7 0,01 47.771
35 - 39Jahre
1 Embryo2 Embryonen3 Embryonen
2.57419.6549.443
98,2483,6476,83
463.7882.577
1,7616,1220,97
055
268
-0,232,18
012
-0,00
-
2.62023.49812.290
Summe 31.671 82,46 6.411 16,69 323 0,84 3 0,01 38.408
40 undälter
1 Embryo2 Embryonen3 Embryonen
4422.0322.148
98,4492,1587,21
7169305
1,567,66
12,38
03
10
-0,140,41
010
-0,05
-
4492.2052.463
Summe 4.622 90,33 481 9,40 13 0,25 1 0,02 5.117
Kryotransfer Einlingn %
Zwillingn %
Drillingn %
Vierlingn %
Gesamtn
1 Embryo2 Embryonen3 Embryonen
1.609
10.136
4.491
97,52
86,19
79,26
41
1.584
1.077
2,48
13,47
19,01
0
40
97
-
0,34
1,71
0
0
1
-
-
0,02
1.650
11.760
5.666
Summe 16.236 85,11 2.702 14,16 137 0,72 1 0,01 19.076
Es wurden prospektiv und retrospektiv erfasste Daten verwendet.
Modifizierter Nachdruck aus J Reproduktionsmed Endokrinol 2012; 9 (6) 19
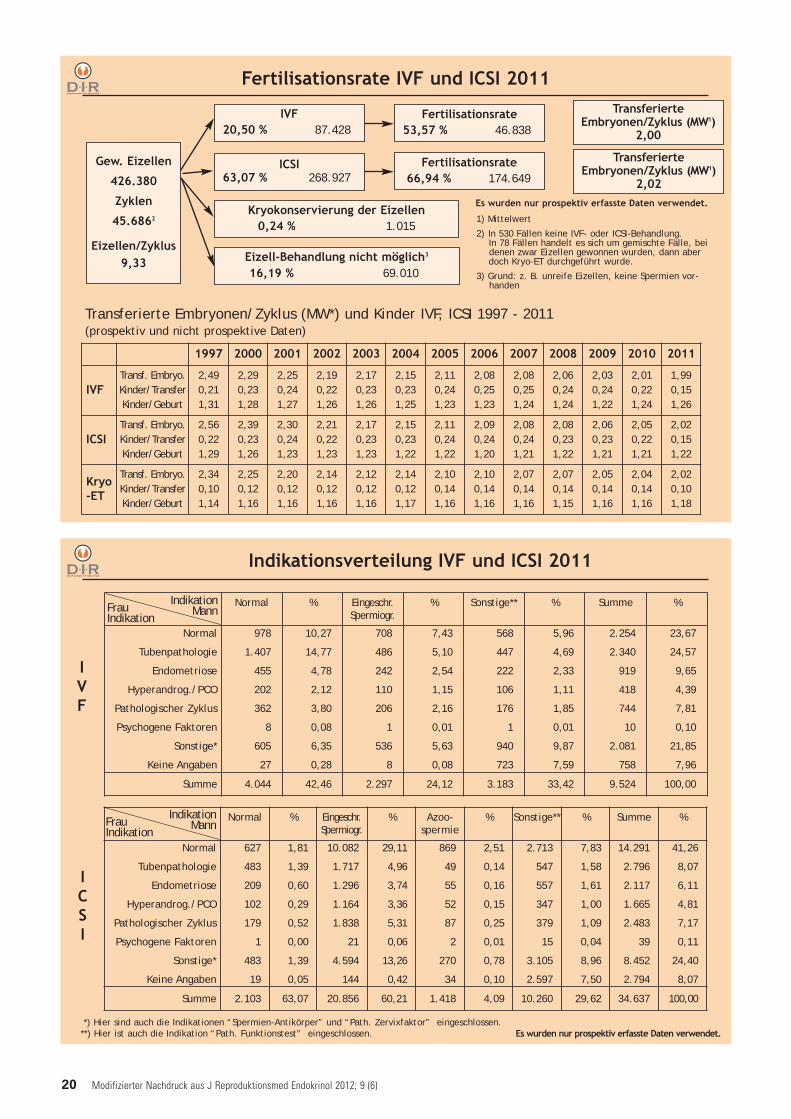
Indikationsverteilung IVF und ICSI 2011
Normal % Eingeschr.Spermiogr.
% Sonstige** % Summe %
Normal
Tubenpathologie
Endometriose
Hyperandrog./PCO
Pathologischer Zyklus
Psychogene Faktoren
Sonstige*
Keine Angaben
978
1.407
455
202
362
8
605
27
10,27
14,77
4,78
2,12
3,80
0,08
6,35
0,28
708
486
242
110
206
1
536
8
7,43
5,10
2,54
1,15
2,16
0,01
5,63
0,08
568
447
222
106
176
1
940
723
5,96
4,69
2,33
1,11
1,85
0,01
9,87
7,59
2.254
2.340
919
418
744
10
2.081
758
23,67
24,57
9,65
4,39
7,81
0,10
21,85
7,96
Summe 4.044 42,46 2.297 24,12 3.183 33,42 9.524 100,00
Normal % Eingeschr.Spermiogr.
% Azoo-spermie
% Sonstige** % Summe %
Normal
Tubenpathologie
Endometriose
Hyperandrog./PCO
Pathologischer Zyklus
Psychogene Faktoren
Sonstige*
Keine Angaben
627
483
209
102
179
1
483
19
1,81
1,39
0,60
0,29
0,52
0,00
1,39
0,05
10.082
1.717
1.296
1.164
1.838
21
4.594
144
29,11
4,96
3,74
3,36
5,31
0,06
13,26
0,42
869
49
55
52
87
2
270
34
2,51
0,14
0,16
0,15
0,25
0,01
0,78
0,10
2.713
547
557
347
379
15
3.105
2.597
7,83
1,58
1,61
1,00
1,09
0,04
8,96
7,50
14.291
2.796
2.117
1.665
2.483
39
8.452
2.794
41,26
8,07
6,11
4,81
7,17
0,11
24,40
8,07
Summe 2.103 63,07 20.856 60,21 1.418 4,09 10.260 29,62 34.637 100,00
*) Hier sind auch die Indikationen “Spermien-Antikörper” und “Path. Zervixfaktor” eingeschlossen.**) Hier ist auch die Indikation “Path. Funktionstest” eingeschlossen.
IVF
ICSI
Es wurden nur prospektiv erfasste Daten verwendet.
FrauIndikation
IndikationMann
FrauIndikation
IndikationMann
Fertilisationsrate IVF und ICSI 2011
Fertilisationsrate53,57 % 46.838
TransferierteEmbryonen/Zyklus (MW1)
2,00
TransferierteEmbryonen/Zyklus (MW1)
2,02
ICSI63,07 % 268.927
Eizell-Behandlung nicht möglich3
16,19 % 69.010
IVF20,50 % 87.428
Fertilisationsrate66,94 % 174.649
Gew. Eizellen
426.380
Zyklen
45.6862
Eizellen/Zyklus9,33
1) Mittelwert
2) In 530 Fällen keine IVF- oder ICSI-Behandlung.In 78 Fällen handelt es sich um gemischte Fälle, bei denen zwar Eizellen gewonnen wurden, dann aber doch Kryo-ET durchgeführt wurde.
3) Grund: z. B. unreife Eizellen, keine Spermien vor-handen
Transferierte Embryonen/Zyklus (MW*) und Kinder IVF, ICSI 1997 - 2011(prospektiv und nicht prospektive Daten)
Kryokonservierung der Eizellen0,24 % 1.015
Es wurden nur prospektiv erfasste Daten verwendet.
1997 2000 2001 2002 2003 2004 2005 2006 2007 2008 2009 2010 2011
IVFTransf. Embryo.Kinder/TransferKinder/Geburt
2,490,211,31
2,290,231,28
2,250,241,27
2,190,221,26
2,170,231,26
2,150,231,25
2,110,241,23
2,080,251,23
2,080,251,24
2,060,241,24
2,030,241,22
2,010,221,24
1,990,151,26
ICSITransf. Embryo.Kinder/TransferKinder/Geburt
2,560,221,29
2,390,231,26
2,300,241,23
2,210,221,23
2,170,231,23
2,150,231,22
2,110,241,22
2,090,241,20
2,080,241,21
2,080,231,22
2,060,231,21
2,050,221,21
2,020,151,22
Kryo-ET
Transf. Embryo.Kinder/TransferKinder/Geburt
2,340,101,14
2,250,121,16
2,200,121,16
2,140,121,16
2,120,121,16
2,140,121,17
2,100,141,16
2,100,141,16
2,070,141,16
2,070,141,15
2,050,141,16
2,040,141,16
2,020,101,18
Modifizierter Nachdruck aus J Reproduktionsmed Endokrinol 2012; 9 (6)20

Behandlungsergebnisse IVF, ICSI, Kryotransfer 2011prospektive Zyklen
ICSI 2011
Kryotransfer 2011
*) Erfolgreiche Fertilisierung mindestens einer Eizelle pro Zyklus
IVF 2011n % Fertilisier. % Embryo. vorh. % Transfer % Klin. SS %
IVF
Erfolgreiche Fertilisier. *
Mind. 1 Embryo vorh.
Transfer durchgeführt
Klin. SS
Geburt
Abort
Extrauteringravidität
Keine Angaben
9.524
8.904
8.472
8.470
2.582
1.027
485
58
1.012
100,00
93,49
88,95
88,93
27,11
100,00
95,15
95,13
29,00
100,00
99,98
30,48
100,00
30,48 100,00
39,78
18,78
2,25
39,19
n % Fertilisier. % Embryo. vorh. % Transfer % Klin. SS %
ICSI
Erfolgreiche Fertilisier. *
Mind. 1 Embryo vorh.
Transfer durchgeführt
Klin. SS
Geburt
Abort
Extrauteringravidität
Keine Angaben
34.637
33.170
31.560
31.551
8.937
3.877
1.681
125
3.254
100,00
95,76
91,12
91,09
25,87
100,00
95,15
95,12
26,94
100,00
99,97
28,32
100,00
28,33 100,00
43,38
18,81
1,40
36,41
n % PN % Transfer % Klin. SS %
Kryotransferzyklen
Aufgetaute PN vorh.
Transfer durchgeführt
Klin. SS
Geburt
Abort
Extrauteringravidität
Keine Angaben
16.958
15.843
15.581
3.105
1.385
702
65
953
100,00
93,42
91,88
18,31
100,00
98,35
19,60
100,00
19,93 100,00
44,61
22,61
2,09
30,69
ICSI 2011 - Spermagewinnung TESE und Kryo-TESE
n % Fertilisier. % Embryo. vorh. % Transfer % Klin. SS %
ICSIErfolgreiche Fertilisier. *Mind. 1 Embryo vorh.
Transfer durchgeführtKlin. SS Geburt
AbortExtrauteringrav.
Keine Angaben
2.1431.9711.8661.866
449182942
171
100,0091,9787,0787,0720,95
100,0094,6794,6722,78
100,00100,0024,06
100,0024,06 100,00
40,5320,940,45
38,08
Modifizierter Nachdruck aus J Reproduktionsmed Endokrinol 2012; 9 (6) 21

Behandlungsergebnisse in Abhängigkeit vom Alter der Frau
IVF - 2011
Behandlungsergebnisse in Abhängigkeit vom Alter der Frau
ICSI - 2011
Klin. SS/ET%
Klin. SS/ET%
Alter inJahren
Punktion Gew. Eizellen(MW)
Insemin.(MW)
Transf. Transf./Pkt.%
Transf. Emb.(MW)
Klin. SS Klin. SS/Pkt. %
Klin. SS/ET%
Klin.SS/ET bei2 transf. Emb.u. mind. 2 PNim Überschuss
<= 29
30 - 34
35 - 39
>= 40
1.255
2.813
3.841
1.614
11,21
10,14
8,16
5,97
11,01
9,93
7,98
5,86
1.116
2.551
3.432
1.370
88,92
90,69
89,35
84,88
1,95
1,97
2,01
2,06
434
934
995
218
34,58
33,20
25,90
13,51
38,8936,6128,9915,91
42,64
40,35
33,73
21,71
Gesamt* 9.524 8,78 8,59 8.470 88,93 2,00 2.582 27,11 30,48 36,14
Alter inJahren
Punktion Gew. Eizellen(MW)
Injektion(MW)
Transf. Transf./Pkt.%
Transf. Emb.(MW)
Klin. SS Klin. SS/Pkt. %
Klin. SS/ET%
Klin.SS/ET bei2 transf. Emb.u. mind. 2 PNim Überschuss
<= 29
30 - 34
35 - 39
>= 40
4.821
10.860
13.327
5.628
12,22
10,89
8,62
6,35
9,73
8,74
6,92
5,11
4.480
10.102
12.124
4.844
92,93
93,02
90,97
86,07
1,99
2,00
2,03
2,05
1.619
3.468
3.171
678
33,58
31,93
23,79
12,05
36,1434,3326,1514,00
39,07
38,00
30,72
19,48
Gesamt* 34.637 9,46 7,59 31.551 91,09 2,00 8.937 25,80 28,33 33,66
Jahre
Jahre
n [ET]
n [ET]
Es wurden nur prospektiv erfasste Daten verwendet.
<=24 25 26 27 28 29 30 31 32 33 34 35 36 37 38 39 40 41 42 43 >=44
(62) (108) (140) (174) (277) (355) (430) (455) (569) (552) (545) (645) (626) (631) (629) (901) (454) (337) (264) (164) (152)27,42 40,74 35,71 37,93 37,55 43,10 36,05 39,12 36,73 34,78 36,70 33,64 29,23 31,06 28,46 24,42 17,84 17,51 17,42 10,37 10,53
(265) (430) (596) (777) (1.036) (1.376) (1.627) (1.924) (2.024) (2.218) (2.309) (2.410) (2.273) (2.201) (2.195) (3.045) (1.610)(1.212) (888) (556) (579)35,85 36,74 37,75 36,04 37,26 34,52 38,05 36,23 34,44 33,18 31,14 30,21 30,05 26,81 23,92 21,18 18,51 16,34 11,71 10,07 3,97
50
45
40
35
30
25
20
15
10
5
0
Es wurden nur prospektiv erfasste Daten verwendet.
<=24 25 26 27 28 29 30 31 32 33 34 35 36 37 38 39 40 41 42 43 >=44
Klin. SS/ETin %
Klin. SS/ETin %
Klin. SS/ET [%]
Klin. SS/ET [%]
Aborte/Klin. SSin %
50
45
40
35
30
25
20
15
10
5
0
100 %
90
80
70
60
50
40
30
20
10
0
Aborte/Klin. SS
100 %
90
80
70
60
50
40
30
20
10
0
Aborte/Klin. SSin %
Aborte/Klin. SS
*) In der Menge gesamt ist ein Fall mit unbekannter Altersangabe enthalten (4 gew. Eizellen, 4 insem., 1 Klin. SS).
*) In der Menge gesamt ist ein Fall mit unbekannter Altersangabe enthalten (4 gew. Eizellen, 3 inj., 1 Klin. SS).
Modifizierter Nachdruck aus J Reproduktionsmed Endokrinol 2012; 9 (6)22

Klin. SS/ET in Abhängigkeit von der Embryonenqualität 2011IVF, ICSI, IVF/ICSI
Qualität <= 29 Jahre 30 - 34 Jahre 35 - 39 Jahre >= 40 Jahre Gesamt
ideal nichtideal ET Klin. SS/ET
% ET Klin. SS/ET% ET Klin. SS/ET
% ET Klin. SS/ET% ET Klin. SS/ET
%
0
0
0
1
1
1
2
2
3
1
2
3
0
1
2
0
1
0
85
337
30
424
588
30
3.758
63
277
7,06
23,44
16,67
23,82
34,18
20,00
40,39
34,92
41,52
255
794
114
1.178
1.253
118
7.835
218
882
7,84
16,25
12,28
23,51
30,65
27,97
40,11
38,53
35,83
480
926
238
2.094
1.400
244
7.639
466
2.056
5,42
13,61
9,24
17,10
25,86
22,95
37,71
27,68
32,20
299
279
144
1.329
452
165
1.903
321
1.315
2,34
7,89
10,42
7,67
11,50
13,94
17,66
19,00
21,14
1.119
2.336
526
5.025
3.693
557
21.135
1.068
4.530
5,27
15,24
10,65
16,68
27,05
21,19
37,27
27,71
30,31
Summe 5.596 36,68 12.653 34,79 15.556 27,97 6.214 14,42 40.019* 29,24
*) In 30 Fällen ist die Qualität unbekannt. Es wurden nur prospektiv erfasste Daten verwendet.
Klin. SS/ET in Abhängigkeit von der Anzahl übertragener Embryonen und Altersgruppen 2011
IVF1 Embryo
ET Klin. SS/ET %2 EmbryonenET Klin. SS/ET %
3 EmbryonenET Klin. SS/ET %
GesamtET Klin. SS/ET %
bis 24 Jahre
25 - 29 Jahre
30 - 34 Jahre
35 - 39 Jahre
40 - 44 Jahre
45 Jahre und älter
5
108
306
560
317
21
0,00
22,22
21,24
17,68
6,62
4,76
55
890
2.027
2.286
603
15
29,09
41,69
38,83
31,06
15,09
6,67
2
56
218
586
401
13
50,00
39,29
37,61
31,74
25,44
15,38
62
1.054
2.551
3.432
1.321
49
27,42
39,56
36,61
28,99
16,20
8,16
Gesamt 1.317 15,95 5.876 33,63 1.277 31,01 8.470* 30,48
ICSI 1 EmbryoET Klin. SS/ET %
2 EmbryonenET Klin. SS/ET %
3 EmbryonenET Klin. SS/ET %
GesamtET Klin. SS/ET %
bis 24 Jahre
25 - 29 Jahre
30 - 34 Jahre
35 - 39 Jahre
40 - 44 Jahre
45 Jahre und älter
25
368
1.119
2.010
1.183
106
20,00
21,20
20,73
14,03
7,19
1,89
222
3.520
7.866
7.689
1.934
88
38,29
37,67
36,50
28,66
16,39
1,14
18
327
1.117
2.425
1.450
83
27,78
36,70
32,68
28,25
18,62
3,61
265
4.215
10.102
12.124
4.567
277
35,85
36,16
34,33
26,15
14,71
2,17
Gesamt 4.811 14,22 21.320 31,92 5.420 26,72 31.551* 28,32
Kryo-ET1 Embryo
ET Klin. SS/ET %2 EmbryonenET Klin. SS/ET %
3 EmbryonenET Klin. SS/ET %
GesamtET Klin. SS/ET %
bis 24 Jahre
25 - 29 Jahre
30 - 34 Jahre
35 - 39 Jahre
40 - 44 Jahre
45 Jahre und älter
21
313
921
1.114
417
11
9,52
13,10
13,14
10,68
9,35
0,00
100
1.405
3.500
3.419
1.006
27
12,00
24,48
23,00
20,47
16,90
14,81
20
417
1.094
1.183
493
21
35,00
22,06
25,32
23,84
16,63
4,76
141
2.161
5.558
5.740
1.922
59
14,89
22,12
21,72
19,20
15,19
8,47
Gesamt 2.797 11,51 9.457 21,52 3.228 22,96 15.680** 19,85
Es wurden nur prospektiv erfasste Daten verwendet.*) In jeweils 1 Fall ist das Alter unbekannt.**) Transferierte Embryonen plus PN; in 99 Fällen nicht berechenbar.
Modifizierter Nachdruck aus J Reproduktionsmed Endokrinol 2012; 9 (6) 23
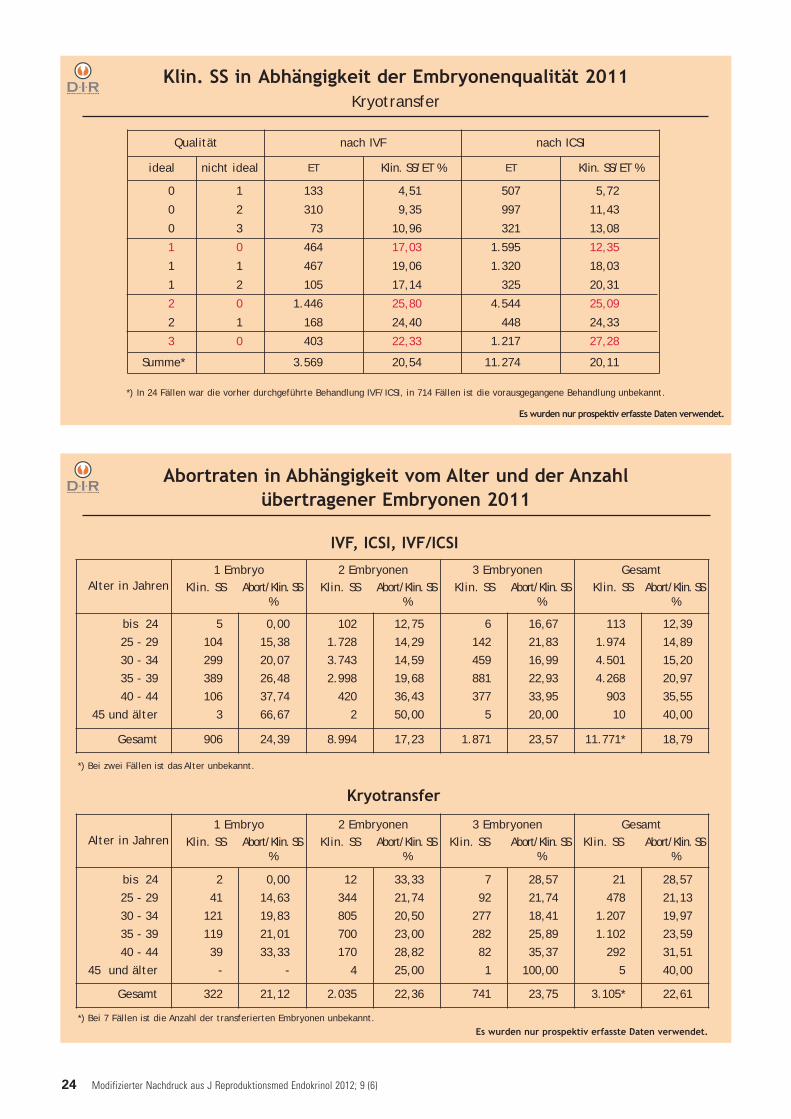
Abortraten in Abhängigkeit vom Alter und der Anzahl übertragener Embryonen 2011
Alter in Jahren1 Embryo
Klin. SS Abort/Klin. SS%
2 EmbryonenKlin. SS Abort/Klin. SS
%
3 EmbryonenKlin. SS Abort/Klin. SS
%
GesamtKlin. SS Abort/Klin. SS
%
bis 24
25 - 29
30 - 34
35 - 39
40 - 44
45 und älter
2
41
121
119
39
-
0,00
14,63
19,83
21,01
33,33
-
12
344
805
700
170
4
33,33
21,74
20,50
23,00
28,82
25,00
7
92
277
282
82
1
28,57
21,74
18,41
25,89
35,37
100,00
21
478
1.207
1.102
292
5
28,57
21,13
19,97
23,59
31,51
40,00
Gesamt 322 21,12 2.035 22,36 741 23,75 3.105* 22,61
Kryotransfer
Es wurden nur prospektiv erfasste Daten verwendet.
Alter in Jahren1 Embryo
Klin. SS Abort/Klin. SS%
2 EmbryonenKlin. SS Abort/Klin. SS
%
3 EmbryonenKlin. SS Abort/Klin. SS
%
GesamtKlin. SS Abort/Klin. SS
%
bis 24
25 - 29
30 - 34
35 - 39
40 - 44
45 und älter
5
104
299
389
106
3
0,00
15,38
20,07
26,48
37,74
66,67
102
1.728
3.743
2.998
420
2
12,75
14,29
14,59
19,68
36,43
50,00
6
142
459
881
377
5
16,67
21,83
16,99
22,93
33,95
20,00
113
1.974
4.501
4.268
903
10
12,39
14,89
15,20
20,97
35,55
40,00
Gesamt 906 24,39 8.994 17,23 1.871 23,57 11.771* 18,79
IVF, ICSI, IVF/ICSI
Klin. SS in Abhängigkeit der Embryonenqualität 2011Kryotransfer
*) In 24 Fällen war die vorher durchgeführte Behandlung IVF/ICSI, in 714 Fällen ist die vorausgegangene Behandlung unbekannt.
Es wurden nur prospektiv erfasste Daten verwendet.
Qualität nach IVF nach ICSI
ideal nicht ideal ET Klin. SS/ET % ET Klin. SS/ET %
0
0
0
1
1
1
2
2
3
1
2
3
0
1
2
0
1
0
133
310
73
464
467
105
1.446
168
403
4,51
9,35
10,96
17,03
19,06
17,14
25,80
24,40
22,33
507
997
321
1.595
1.320
325
4.544
448
1.217
5,72
11,43
13,08
12,35
18,03
20,31
25,09
24,33
27,28
Summe* 3.569 20,54 11.274 20,11
*) Bei 7 Fällen ist die Anzahl der transferierten Embryonen unbekannt.
*) Bei zwei Fällen ist das Alter unbekannt.
Modifizierter Nachdruck aus J Reproduktionsmed Endokrinol 2012; 9 (6)24

*) Z. B. u-FSH u. hMG, Clomifen/rec-FSH, Clomifen/hMG etc. Es wurden nur prospektiv erfasste Daten verwendet.
Klin. SS-Raten in Abhängigkeit von der StimulationIVF, ICSI 2011
u-FSH rec-FSH hMG recLH u.recFSH
rec-FSH u.hMG
Sonstige* KeineAngaben
Summe
GnRHa-kurz
Transferrate (%)
Klin. SS/Transfer (%)
4
25,00
0,00
283
92,23
28,35
453
93,82
29,18
17
88,24
20,00
143
89,51
20,31
10
90,00
22,22
4
100,00
25,00
914
92,23
27,28
GnRHa-lang
Transferrate (%)
Klin. SS/Transfer (%)
63
87,30
27,27
1.907
89,88
35,47
788
88,07
28,67
219
81,28
30,34
591
91,37
30,37
46
89,13
34,15
31
93,55
48,28
3.645
89,19
32,85
Ohne GnRH-Analoga
Transferrate (%)
Klin. SS/Transfer (%)
13
92,31
33,33
279
88,53
33,20
219
93,61
32,68
46
89,13
34,15
126
91,27
24,35
65
80,00
21,15
153
77,12
27,12
901
88,90
30,13
GnRH-Antagonisten
Transferrate (%)
Klin. SS/Transfer (%)
39
89,74
25,71
2.282
90,32
33,77
798
87,59
26,47
252
79,37
24,50
339
85,84
20,27
326
84,97
16,25
28
82,14
13,04
4.064
88,24
29,17
Summe 119 4.751 2.258 534 1.199 447 216 9.524
- IVF -
- ICSI -
u-FSH rec-FSH hMG recLH u.recFSH
rec-FSH u.hMG
Sonstige* KeineAngaben
Summe
GnRHa-kurz
Transferrate (%)
Klin. SS/Transfer (%)
66
90,91
13,33
984
94,41
22,93
1.061
92,27
20,53
82
87,80
18,06
386
90,16
15,23
118
92,37
10,09
9
88,89
25,00
2.706
92,50
20,00
GnRHa-lang
Transferrate (%)
Klin. SS/Transfer (%)
179
96,09
27,33
7.193
93,67
33,51
2.674
92,93
27,89
880
88,98
28,10
2.435
94,37
29,55
190
92,63
22,16
89
95,51
16,47
13.640
93,39
31,01
Ohne GnRH-Analoga
Transferrate (%)
Klin. SS/Transfer (%)
32
93,75
23,33
1.097
91,70
32,50
567
89,95
31,37
178
85,96
25,49
597
90,62
26,80
287
83,28
14,64
657
74,73
18,94
3.415
87,37
27,13
GnRH-Antagonisten
Transferrate (%)
Klin. SS/Transfer (%)
138
90,58
21,60
8.210
91,08
31,17
2.614
87,95
25,18
1.018
85,66
26,72
1.668
90,77
22,72
1.125
85,42
15,71
103
87,38
16,67
14.876
89,62
27,59
Summe 415 17.484 6.916 2.158 5.068 1.720 858 34.637
Modifizierter Nachdruck aus J Reproduktionsmed Endokrinol 2012; 9 (6) 25
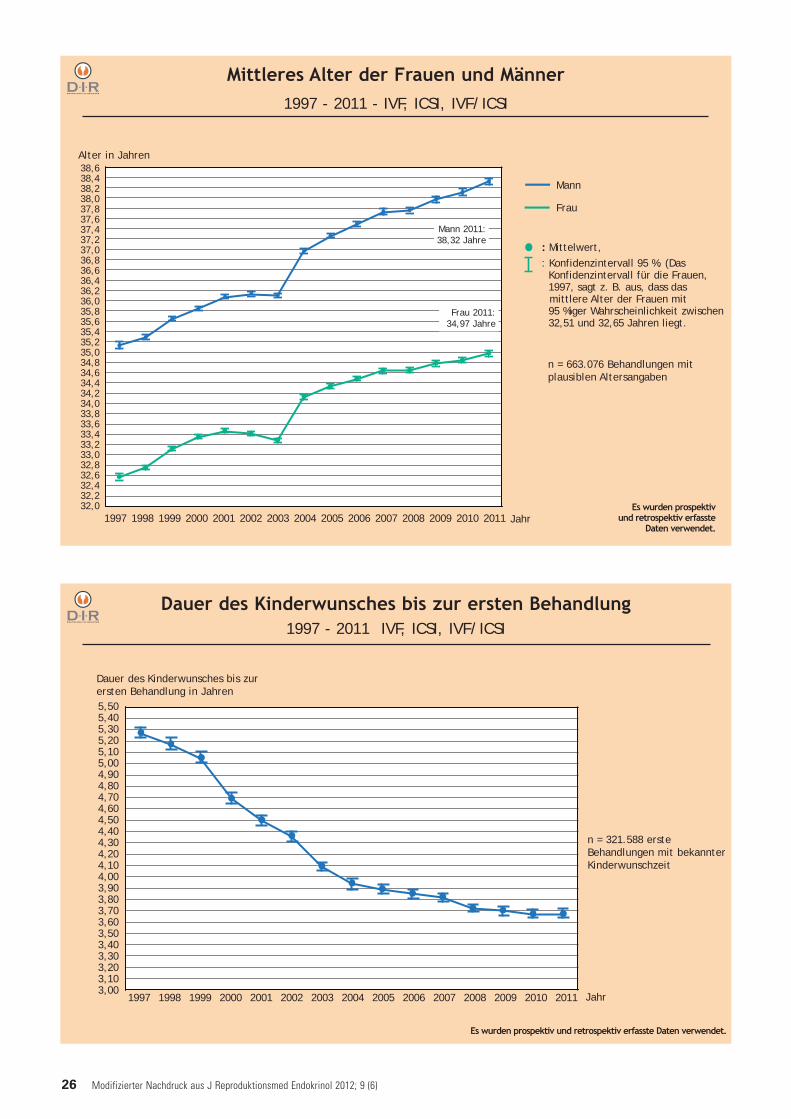
Mittleres Alter der Frauen und Männer1997 - 2011 - IVF, ICSI, IVF/ICSI
Alter in Jahren
: Mittelwert, : Konfidenzintervall 95 %. (Das
Konfidenzintervall für die Frauen, 1997, sagt z. B. aus, dass das mittlere Alter der Frauen mit 95 %iger Wahrscheinlichkeit zwischen32,51 und 32,65 Jahren liegt.
Es wurden prospektivund retrospektiv erfasste
Daten verwendet.1997 1998 1999 2000 2001 2002 2003 2004 2005 2006 2007 2008 2009 2010 2011
38,638,438,238,037,837,637,437,237,036,836,636,436,236,035,835,635,435,235,034,834,634,434,234,033,833,633,433,233,032,832,632,432,232,0
Mann
Frau
Mann 2011:38,32 Jahre
Frau 2011:34,97 Jahre
Jahr
n = 663.076 Behandlungen mitplausiblen Altersangaben
Dauer des Kinderwunsches bis zur ersten Behandlung1997 - 2011 IVF, ICSI, IVF/ICSI
1997 1998 1999 2000 2001 2002 2003 2004 2005 2006 2007 2008 2009 2010 2011 Jahr
5,505,405,305,205,105,004,904,804,704,604,504,404,304,204,104,003,903,803,703,603,503,403,303,203,103,00
Dauer des Kinderwunsches bis zurersten Behandlung in Jahren
Es wurden prospektiv und retrospektiv erfasste Daten verwendet.
n = 321.588 ersteBehandlungen mit bekannterKinderwunschzeit
Modifizierter Nachdruck aus J Reproduktionsmed Endokrinol 2012; 9 (6)26

Anzahl der Behandlungen pro Frau1997 - 2011 IVF, ICSI, IVF/ICSI, Kryo-ET
1 2 3 4 5 6 7 8 9 10*
% 8280787674727068666462605856545250484644
n [Behandlungen pro Patientin]
Es wurden prospektiv undretrospektiv erfasste Daten
verwendet.
Es wurden prospektiv und retrospektiv erfasste Daten verwendet.
1 - 2 5 - 6 9 - 10 13 - 14 17 - 18 21 - 22 25 - 26 29 - 30*
n = 376.303 Frauen
n [transferierte Embryonen]
Gesamtschwangerschafts-wahrscheinlichkeit pro Frau inAbhängigkeit von der Summeder transferierten Embryonen
Gesamtschwangerschafts-wahrscheinlichkeit pro Frau inAbhängigkeit von der Anzahl derdurchgeführten Behandlungen
Gesamtschwangerschaftswahrscheinlichkeit pro Frau1997 - 2011 IVF, ICSI, IVF/ICSI inklusive Kryo-ET
1 2 3 4 5 6 7 8 9 10
% 363432302826242220181614121086420
n [Behandlungen pro Patientin]
[Anteil derFrauen mit n
Behandlungen]
n = 376.303 Frauen
3 - 4 7 - 8 11 - 12 15 - 16 19 - 20 23 - 24 27 - 28
% 88868482807876747270686664626058565452504846
*) Eine Patientin, welche 10 Behandlungszyklendurchlaufen hat (n = 1.755), ist im Verlaufdieser Zyklen zu 80 % einmal schwangergeworden.
*) Eine Patientin, welche insgesamt 29-30Embryonen (n = 213) transferiert bekam, ist im Verlauf dieser Behandlungszyklen zu 81 %mindestens einmal schwanger geworden.
n = 376.303 Frauen
Modifizierter Nachdruck aus J Reproduktionsmed Endokrinol 2012; 9 (6) 27

Schwangerschaftsrate in Abhängigkeit von der Anzahl dergewonnenen Eizellen und der Kulturdauer
2007 - 2011 IVF, ICSI, IVF/ICSI
Es wurden prospektiv und retrospektiv erfasste Daten verwendet.
Jahre [Alter der Frau]<= 25 26-27 28-29 30-31 32-33 34-35 36-37 38-39 40-41 42-43 >=44
4644424038363432302826242220181614121086420
%[Klin. SS/ET]
Anzahl der gewonnenen Eizellen
Jahre [Alter der Frau]<= 25 26-27 28-29 30-31 32-33 34-35 36-37 38-39 40-41 42-43 >=44
Schwangerschaftsrate (Klin. SS/ET)
15,014,514,013,513,012,512,011,511,010,510,09,59,08,58,07,57,06,56,05,55,04,54,0
n [gewonnene
Eizellen]
Kulturdauer2 - 3 Tage
Kulturdauer5 Tage
Fazit: Die höhere Schwangerschaftsrate bei 5 Tagen Kulturdauer lässt sich auch durch die besserenVoraussetzungen bei einer höheren Anzahl gewonnener Eizellen erklären.
n = 208.620 Behandlungen (Der Anteil der 5tägigen Kulturdauer ist im betrachteten Zeitraum von 15 % auf 21 % gestiegen.)
Kulturdauer2 - 3 Tage
Kulturdauer5 Tage
Modifizierter Nachdruck aus J Reproduktionsmed Endokrinol 2012; 9 (6)28

Geborene Kinder 1997 - 2011prospektive und retrospektive Daten
Einlingen %
Zwillingen %
Drillingen %
Vierlingen %
Gesamt n
2001*
7.795(7.764)
62,20(62,33)
4.288(4.248)
34,21(34,10)
450(444)
3,59(3,56)
0(0)
--
12.533(12.456)
2002*
8.930(8.902)
63,84(64,02)
4.662(4.615)
33,33(33,19)
387(382)
2,77(2,75)
8(7)
0,06(0,05)
13.987(13.906)
2003*
11.922(11.887)
63,16(63,48)
6.334(6.237)
33,55(33,31)
597(578)
3,16(3,09)
24(24)
0,13(0,13)
18.877(18.726)
2004*
6.891(6.869)
65,63(65,81)
3.336(3.306)
31,77(31,68)
273(262)
2,6(2,51)
0(0)
--
10.500(10.437)
2005*
7.038(7.020)
65,76(65,93)
3.440(3.408)
32,14(32,01)
213(209)
1,99(1,96)
12(11)
0,11(0,10)
10.703(10.648)
2006*
7.419(7.402)
66,87(67,14)
3.450(3.417)
31,10(30,99)
222(202)
2,00(1,83)
4(4)
0,04(0,04)
11.095(11.025)
2007*
8.407(8.364)
66,35(66,45)
4.076(4.043)
32,17(32,12)
183(176)
1,44(1,40)
4(4)
0,03(0,03)
12.670(12.587)
2008*
8.444(8.416)
65,79(66,07)
4.142(4.084)
32,27(32,06)
240(230)
1,87(1,81)
8(8)
0,06(0,06)
12.834(12.738)
2009*
9.016(8.969)
67,32(67,42)
4.152(4.114)
31,00(30,92)
216(213)
1,61(1,60)
8(8)
0,06(0,06)
13.392(13.304)
2010*
8.619(8.566)
66,18(66,35)
4.156(4.105)
31,91(31,80)
249(239)
1,91(1,85)
0(0)
--
13.024(12.910)
2011*
6.054(6.022)
65,34(65,61)
2.990(2.943)
32,27(32,07)
222(213)
2,40(2,32)
0(0)
--
9.266(9.178)
*) Die Werte in Klammern geben die Lebendgeburten an. Als Summen über alle Jahre (1997 - 2011) ergeben sich folgende Werte:Einlinge 110.920 (110.472), Zwillinge 56.506 (55.855), Drillinge 5.475 (5.306), Vierlinge 92 (89); gesamt: 172.993 (171.722)
Einlingen %
Zwillingen %
Drillingen %
Vierlingen %
Gesamt n
2001*
6.798(6.774)
60,89(61,04)
3.956(3.919)
35,43(35,31)
411(405)
3,68(3,65)
0(0)
--
11.165(11.098)
2002*
7.746(7.724)
62,59(62,78)
4.256(4.210)
34,39(34,22)
366(362)
2,96(2,94)
8(7)
0,06(0,06)
12.376(12.303)
2003*
10.723(10.688)
62,13(62,78)
5.960(5.866)
34,53(34,22)
552(533)
3,20(2,94)
24(24)
0,14(0,14)
17.259(17.111)
2004*
5.368(5.352)
63,69(62,46)
2.826(2.801)
33,53(34,28)
234(223)
2,78(3,11)
0(0)
--
8.428(8.376)
2005*
5.527(5.515)
63,84(63,90)
2.936(2.906)
33,91(33,44)
183(179)
2,11(2,66)
12(11)
0,14(0,13)
8.658(8.611)
2006*
5.906(5.894)
65,50(64,05)
2.922(2.890)
32,41(33,75)
189(174)
2,10(2,08)
0 (0)
--
9.017(8.958)
2007*
6.663(6.628)
65,45(64,69)
3.504(3.471)
33,95(33,88)
150(143)
1,45(1,40)
4(4)
0,04(0,04)
10.321(10.246)
2008*
6.696(6.672)
64,09(64,34)
3.528(3.481)
33,77(33,57)
216(209)
2,07(2,02)
8(8)
0,08(0,08)
10.448(10.370)
2009*
7.253(7.217)
65,89(66,02)
3.560(3.523)
32,34(32,23)
186(183)
1,69(1,67)
8(8)
0,07(0,07)
11.007(10.931)
2010*
6.767(6.724)
64,42(64,62)
3.554(3.507)
33,83(33,70)
183(175)
1,74(1,68)
0(0)
--
10.504(10.406)
2011*
4.671(4.645)
63,64(63,95)
2.498(2.457)
34,03(33,82)
171(162)
2,33(2,23)
0(0)
--
7.340(7.264)
*) Die Werte in Klammern geben die Lebendgeburten an. Als Summen über alle Jahre (1997 - 2011) ergeben sich folgende Werte:Einlinge 92.314 (88.946), Zwillinge 50.242 (49.637), Drillinge 5.074 (4.818), Vierlinge 88 (85); gesamt: 147.618 (146.486)
Gesamt (IVF, ICSI, IVF/ICSI, Kryotransfer)
IVF, ICSI, IVF/ICSI
Modifizierter Nachdruck aus J Reproduktionsmed Endokrinol 2012; 9 (6) 29

4.5004.2504.0003.7503.5003.2503.0002.7502.5002.2502.0001.7501.5001.2501.000
750500250
0
2.1002.0001.9001.8001.7001.6001.5001.4001.3001.2001.1001.000
900800700600500400300200100
0
**) In der Summe sind 11 Fälle enthalten, bei denen SSW > 40 ist
Perzentilen 2010: p25 = 38. SSW, p50 = 39. SSW, p75 = 40. SSW; Perzentilen 1997 - 2010: p25 = 38. SSW, p50 = 39. SSW, p75 = 40. SSW
Anteil der vor der abgeschlossenen 37. SSW geborenen Kinder: 18,37 %
GGW in g
GGW in g
n
n 1.000
900
800
700
600
500
400
300
200
100
0
Einlinge 2010
SSW < 25 25 26 27 28 29 30 31 32 33 34 35 36 37 38 39 40 41 > 41 Gesamt
n 12 7 12 16 31 15 19 27 49 60 121 174 311 618 1.470 1.949 2.078 963 83 8.015GGW Q 25 568 580 667 745 820 1.080 1.250 1.360 1.610 1.745 2.060 2.270 2.410 2.710 2.950 3.100 3.220 3.320 3.300 2.980
GW Median 635 730 855 905 980 1.240 1.440 1.490 1.835 1.990 2.290 2.557 2.750 3.000 3.212 3.380 3.500 3.600 3.610 3.320
GGW Q 75 815 860 1.010 990 1.330 1.510 1.620 1.770 2.060 2.195 2.500 2.890 3.020 3.300 3.500 3.650 3.660 3.770 3.890 3.650
Drillinge 2010
SSW <25 25 26 27 28 29 30 31 32 33 34 35 36 37 38 39 40 Gesamt**
n 46 22 28 35 38 70 79 120 142 217 385 445 628 897 509 105 36 3.813
GGW Q 25 520 670 797 920 1.040 1.170 1.320 1.400 1.490 1.710 1.920 2.150 2.240 2.420 2.550 2.730 2.555 1.990
GGW Median 590 752 855 990 1.103 1.240 1.475 1.620 1.735 1.906 2.090 2.310 2.470 2.620 2.810 2.870 2.980 2.400
GGW Q 75 700 830 967 1.080 1.235 1.370 1.620 1.745 1.940 2.100 2.300 2.500 2.700 2.840 3.020 3.100 3.397 2.720
SSW 24 25 26 27 28 29 30 31 32 33 34 35 Gesamt**
n 7 0 6 9 18 9 15 17 43 27 40 20 214GGW Q 25 470 - 890 950 840 1.200 1.240 1.390 1.460 1.780 1.800 1.900 1.320
GGW Median 570 - 1.150 950 1.027 1.560 1.455 1.490 1.675 2.150 1.967 2.018 1.672
GGW Q 75 600 - 1.870 990 1.240 1.670 1.560 1.610 1.784 2.370 2.105 2.330 1.975
Zwillinge 2010
Anteil der vor der abgeschlossenen 37. SSW geborenen Kinder: 82,66 %
Anteil der vor der abgeschlossenen 37. SSW geborenen Kinder: 98,60 %
Kinder in Abhängigkeit von der Schwangerschaftswoche (SSW)und vom Geburtsgewicht (GGW) 2010*
*) Kinder mit plausiblem Geburtsgewicht und SSW; prospektive und retrospektive Daten
<25 25 26 27 28 29 30 31 32 33 34 35 36 37 38 39 40 SSW
4.5004.2504.0003.7503.5003.2503.0002.7502.5002.2502.0001.7501.5001.2501.000
750500250
0
25er-, 50er-und 75er-Perzentile
des durchschnitt-lichen Geburtsge-wichts 1997 - 2010
25er-, 50er-und 75er-Perzentile
des durchschnitt-lichen Geburtsge-wichts 2010
Perzentilen 2010: p25 = 34. SSW, p50 = 36. SSW, p75 = 37. SSW; Perzentilen 1997 - 2010: p25 = 34. SSW, p50 = 36. SSW, p75 = 37. SSW
Perzentilen 2010: p25 = 30. SSW, p50 = 32. SSW, p75 = 34. SSW; Perzentilen 1997 - 2010: p25 = 30. SSW, p50 = 32. SSW, p75 = 33. SSW
25er-, 50er-und 75er-Perzentile
des durchschnitt-lichen Geburtsge-wichts 1997 - 2010
25er-, 50er-und 75er-Perzentile
des durchschnitt-lichen Geburtsge-wichts 2010
<25 25 26 27 28 29 30 31 32 33 34 35 36 37 38 39 40 41>41 SSW<25 25 26 27 28 29 30 31 32 33 34 35 36 37 38 39 40 41>41SSW
<25 25 26 27 28 29 30 31 32 33 34 35 36 37 38 39 40 SSW
**) In der Summe sind 3 Fälle enthalten, bei denen SSW > 35 ist
Modifizierter Nachdruck aus J Reproduktionsmed Endokrinol 2012; 9 (6)30

Überstimulationssyndrom in Abhängigkeit von der Stimulation bei erfolgtem Transfer IVF, ICSI, IVF/ICSI 2011
Komplikationen bei der Eizellentnahme 2011
Sonstige
stationäre Behandlung notwendig
intraabdominelleBlutung
vaginale Blutung Eizellentnahmen gesamt 46.583 100,00 %
Keine Angaben
Keine Komplikationen
Komplikationen
0
46.277
306
-
99,34
0,66
Komplikation n %
vaginale Blutungenintraabdom. Blutung
DarmverletzungPeritonitis
stat. Behandl. notwendigop. Versorgung notwendig
Sonstige
1835921
161530
59,8019,280,650,335,234,909,80
Gesamt 306 100,00Es wurden nur prospektiv erfasste Daten verwendet.
Es wurden nur prospektiv erfasste Daten verwendet.
Darmverletzung
op. Versorgungnotwendig
Stimulation % Zahl gew.Eizellen OHSS III OHSS III/Stim %
GnRHa-kurznur FSHnur hMG
FSH und hMGSonstige
keine Angaben
3.6491.3471.523
62414213
8,09 8,069,397,676,606,395,54
320100
0,080,15
-0,16
--
GnRHa-langnur FSHnur hMG
FSH und hMGSonstige
keine Angaben
17.6749.6153.5293.2411.164
125
39,21 10,5511,469,329,918,749,22
74401
3120
0,420,420,030,960,17
-
Ohne GnRH-Analoga nur FSHnur hMG
FSH und hMGSonstige
keine Angaben
4.3541.438
793771538814
9,66 8,1910,078,819,096,444,56
641100
0,140,280,130,13
--
GnRH-Antagonistennur FSHnur hMG
FSH und hMGSonstige
keine Angaben
19.40111.0683.4512.2822.468
132
43,04 8,8610,397,157,116,195,98
54454311
0,280,410,120,130,040,76
Summe 45.078 100,00 9,40 137 0,30
Peritonitis
Modifizierter Nachdruck aus J Reproduktionsmed Endokrinol 2012; 9 (6) 31

Therapieentscheidungen von Kinderwunschpaaren in A
bhängigkeit vom A
usgang des vorherigen Zyklus1997 - 2011, IVF, ICSI, IVF/ICSI,
Kryo-ET
Frauen866
(8,70 %)schw
anger
Frauen2.122
(21,31 %) nichtschw
anger
Frauen6.969 (69,99 %)
ARTabge-
schlossen
Frauen5.001
(19,38 %)schw
anger
Frauen14.259
(55,25 %) nichtschw
anger
Frauen6.549 (25,37 %)
ARTabge-
schlossen
Frauen4.398
(10,20 %)schw
anger
Frauen12.296
(28,51 %) nichtschw
anger
Frauen26.436 (61,29 %)
ARTabge-
schlossen
Frauen21.943
(12,68 %)schw
anger
Frauen100.075
(57,82 %) nichtschw
anger
Frauen51.059 (29,50 %)
ARTabge-
schlossen
Frauen9.957
(10,39 %)schw
anger
Frauen25.809
(26,93 %) nichtschw
anger
Frauen60.079 (62,68 %)
ARTabge-
schlossen
Frauen43.130
(15,19 %)schw
anger
Frauen173.078
(60,96 %) nichtschw
anger
Frauen67.705 (25,85 %)
ARTabge-
schlossen
Frauen379.759
Frauen95.845
(25,24 %)schw
anger
Frauen283.914
(74,76 %) nichtschw
anger
Start
1.Behandlung
2.Behandlung
3.Behandlung
Frauen, die in der n. Behandlung schwanger gew
orden sind
Frauen, die in der n. Behandlung nicht schwanger gew
orden sind
Frauen, die keine weitere Behandlung gem
acht haben ( Endpunkt)
Fazit: Eine vorausgehende Schwangerschaft durch eine ART-Behandlung erhöht die
Wahrscheinlichkeit erneut durch eine ART-Behandlung schw
anger zu werden.
Schwanger-
schaft/Behand-lung: 26,34 %
Schwanger-
schaft/Behand-lung:
19,95 %
Schwanger-
schaft/Behand-lung: 17,98 %
Schwanger-
schaft/Behand-lung: 25,24 %
Schwanger-
schaft/Behand-lung: 27,84 %
Schwanger-
schaft/Behand-lung: 28,98 %
Schwanger-
schaft/Behand-lung: 25,97 %
Modifizierter Nachdruck aus J Reproduktionsmed Endokrinol 2012; 9 (6)32

Kinderwunschzentrum DresdenPraxisklinik Dr. med. H.-J. HeldDr. med. Hans-Jürgen HeldPrager Straße 8 a01069 DresdenTel. 0351/50 14 00-0, Fax -50 14 [email protected]
Gynäkologische Endokrinologie undReproduktionsmedizin derUniversitätsfrauenklinik DresdenDr. med. Constanze Reisenbüchler,Dr. med. Katja Keller,Dr. med. Jennifer-Lucia Wacker,Prof. Dr. med. Wolfgang Distler,Dr. rer. nat. Gudrun KeckFetscherstraße 7401307 DresdenTel. 0351/458-3491, Fax -458-5351wolfgang.distler@uniklinikum-dresden.dewww.uniklinikum-dresden.de/gyn
Zentrum für Reproduktionsmedizin,Gynäkologische Endokrinologie undSexualmedizin, UFK LeipzigProf. Dr. med. Henry Alexander,Dr. med. Gabriele Pretzsch,Dr. med. D. Marx, Dipl.-Biol. Wolfgang WeberLiebigstraße 20 a04103 Leipzig
Kinderwunschzentrum Leipzig-ChemnitzDr. med. Fayez Abu Hmeidan,Dr. med. Petra Jogschies,Dörte Geistert,Laila ShugairGoldschmidtstraße 3004103 LeipzigTel. 0341/141 200, Fax -141 [email protected]
Kinderwunschzentrum Praxisklinik CityLeipzig, Überörtliche BAGDr. med. Astrid Gabert,Dr. med. Katharina Bauer,Dr. med. Georg Saager,Petersstraße 104109 LeipzigTel. 0341/215 855-0, Fax -215 [email protected]
Universitätsklinikum Halle (Saale)Zentrum für Reproduktionsmedizin undAndrologieUniv.-Prof. Dr. med. Hermann M. Behre,Dr. med. Petra Kaltwaßer,Dr. med. Solveig Köller,Dr. rer. nat. Ewald SeligerErnst-Grube-Straße 4006120 Halle/SaaleTel. 0345/557-2747, Fax [email protected]/zra/
Reproduktionsmedizinisches ZentrumJena/ErfurtPD Dr. med. habil. Heidi Fritzsche,Dipl. med. Jens-Peter Reiher,Dr. med. Angela HoffmannMarkt 407743 JenaTel. 03641/829 610, Fax -829 [email protected]
Universitätsfrauenklinik JenaProf. Dr. med. Jürgen Weiss,Dr. rer. nat. Ines HoppeBachstraße 1807743 JenaTel. 03641/933 529, Fax -933 [email protected]/ufk
Kinderwunschzentrum Leipzig-ChemnitzDr. med. Fayez Abu Hmeidan,Dr. med. Petra Jogschies,Dörte Geistert, Laila ShugairJakobikirchplatz 409111 ChemnitzTel. 0371/503 4980, Fax -503 [email protected]
Kinderwunschzentrum Praxisklinik CityLeipzig, Überörtliche BAGDr. med. Astrid Gabert,Dr. med. Katharina Bauer,Dr. med. Georg SaagerFlemmingstraße 2 a09116 ChemnitzTel. 037/433 130-0, Fax -433 130-17info@kinderwunschzentrum-chemnitz.dewww.kinderwunschzentrum-chemnitz.de
Praxis für FertilitätKinderwunsch- und Endometriose-ZentrumBerlinDr. med. Gülden Halis, Dr. med. David J. PeetFriedrichstraße 7910117 BerlinTel. 030/8321 190-0, Fax -8321 [email protected]
Kinderwunschzentrum am Potsdamer PlatzDr. med. Hanadi Awwadeh,Dr. med. Anja MutzLeipziger Platz 710117 BerlinTel. 030/200 89 50-0, Fax -200 89 50-99info@Kinderwunsch-potsdamerplatz.dewww.kinderwunsch-potsdamerplatz.de
Praxisklinik Sydow am GendarmenmarktDr. med. Peter Sydow, Dr. med. Carmen Sydow,Dr. med. Ulrike Bergmann-HenselKronenstraße 55 - 5810117 BerlinTel. 030/206 267 20, Fax -206 267 [email protected]
GLC - Reproduktionsmedizin im Lützow CenterDr. med. Detlef H. G. Temme & KollegenWichmannstraße 510787 BerlinTel. 030/230 998 0, Fax -230 998 [email protected]
Kinderwunschzentrum BerlinEndometriosezentrum BerlinAkademische Lehrpraxis der CharitéUniversitätsmedizinFrauenärztliche GemeinschaftspraxisDr. med. Reinhard Hannen,Dr. med. Christian F. StollLandgrafenstraße 1410787 BerlinTel. 030/263 983-0, Fax -263 [email protected]
Kinderwunschzentrum an der GedächtniskircheDr. med. Matthias Bloechle,Dr. med. Silke MarrRankestraße 3410789 BerlinTel. 030/219 092-0, Fax -219 [email protected]
Kinderwunschzentrum FERA im Wenckebach-KlinikumDr. med. Andreas Jantke,Dr. med. Anna StegelmannWenckebachstraße 2312099 BerlinTel. 030/76 00 701 30, Fax -76 00 701 [email protected]
Kinderwunschzentrum am Innsbrucker PlatzBerlinBabette Remberg,Dr. med. Susanne Tewordt-Thyselius,Dr. rer. nat. Thomas JeziorowskiHauptstraße 6512159 BerlinTel. 030/857 579 30, Fax -857 579 35praxis@kinderwunschpraxis-berlin.dewww.kinderwunschpraxis-berlin.de
Zentrum für Reproduktionsmedizin Helle-MitteDr. med. Muna Zaghloul-Abu Dakah,Dr. med. Swetlana HoffmannStendaler Straße 2412627 BerlinTel. 030/992 779-0, Fax -992 779 [email protected]/
Fertility Center BerlinAuf dem Gelände der DRK Kliniken WestendProf. Dr. med. Heribert Kentenich,Dr. med. Gabriele Stief,Dr. med. Andreas Tandler-Schneider,Dr. med. Anette Siemann,Dr. med. Marina WerlingSpandauer Damm 13014050 BerlinTel. 030/233 208 110, Fax -233 208 [email protected]
Teilnehmerverzeichnisder ans DIR meldenden Zentren
Modifizierter Nachdruck aus J Reproduktionsmed Endokrinol 2012; 9 (6) 33

Kinderwunschzentrum PotsdamDr. med. Kay-Thomas Moeller,Dr. med. Kathleen Linca,Dr. med. Manzoor NowshariBabelsberger Straße 814473 PotsdamTel. 0331/231 892 92, Fax -231 892 [email protected]
Praxis für Fertilität RostockPD Dr. med. Heiner Müller,Annette Busecke, Anja BossowSüdring 8118059 RostockTel. 0381/4401-2030, Fax [email protected]
MVZ Fertility Center Hamburg GmbHProf. Dr. med. Klaus Rudolf,Dr. med. (IL) Robert Fischer,Dr. med. Olaf G. J. Naether,Dr. med. Kay Christian LöbbeckeSpeersort 420095 HamburgTel. 040/308 044 00, Fax -308 049 [email protected]
Kinderwunschzentrum Altonaer Straße imGynaekologicum HamburgDr. med. Gerd Bispink,Dr. med. Annick Horn,Dr. med. Wolf Michel und PartnerAltonaer Straße 5920357 HamburgTel. 040/306 836-0, Fax -306 [email protected]
Kinderwunschzentrum Fleetinsel HamburgDr. univ. Semsettin E. Koçak,Dr. med. Peter ListAdmiralitätsstraße 420459 HamburgTel. 040-38605550, Fax -3860541info@kinderwunschzentrum-hamburg.dewww.kinderwunschzentrum-hamburg.de
Endokrinologikum HamburgProf. Dr. C. Keck,PD Dr. M. Graf,PD Dr. U. Knuth, Dr. M. MotamediLornsenstraße 4 - 622767 HamburgTel. 040/306 28-200, Fax -306 [email protected]
Universitäres Kinderwunschzentrum LübeckAmbulanzzentrum des UKSH gGmbHProf. Dr. med. Dr. h. c. mult. Klaus Diedrich,Prof. Dr. med. Georg Griesinger, M.Sc.,PD Dr. med. Askan Schultze-MosgauRatzeburger Allee 16023538 LübeckTel. 0451/500-4418, Fax [email protected]
fertilitycenterkielPD Dr. med. Sören von Otte,Dr. med. Martin Völckers,Dr. rer. nat. Heike EckelPrüner Gang 1524103 KielTel. 0431/974 1333, Fax -974 [email protected]
gyn-medicum Kinderwunschzentrum im UK-SHDr. Andreas Schmutzler,Prof. Dr. Ali SalmassiArnold-Heller-Straße 3, Haus 2424105 KielTel. 0431/597-2083, Fax [email protected]
Kinderwunsch KielDr. med. Kurt Brandenburg,Dr. med. Angela CarstensenIm Brauereiviertel 524118 KielTel. 0431/553 433, Fax -519 [email protected]
Team Kinderwunsch OldenburgDr. med. Saif ed-Din Jibril,Dr. med. Gerhard PohligWilhelmstr. 526121 OldenburgTel. 0441/248 9091, Fax -248 [email protected]
Tagesklinik OldenburgZentrum für KinderwunschbehandlungDr. med. Jörg Hennefründ,Dr. med. Heike Boppert,Dr. med. Michael HeederAchternstraße 2126122 OldenburgTel. 0441/922 700, Fax -922 [email protected]
Zentrum für Fortpflanzungsmedizin LeerDr. med. Wolfgang von der BurgHafenstraße 6 d, Haus Singapore26789 LeerTel. 0491/454 25-0, Fax -454 [email protected]
Kinderwunsch BremenDr. med. Achim von Stutterheim,Tanja Finger,Dr. Anjarasoa JungEmmastraße 22028213 BremenTel. 0421/224 910, Fax -224 [email protected]
BZF - Bremer Zentrum fürFortpflanzungsmedizinDr. med. Olaf Drost,Prof. Dr. med. Ernst Heinrich Schmidt,Dr. sc. Hum. Martin PintericGröpelinger Heerstraße 406 - 40828239 BremenTel. 0421/6102-1212, Fax [email protected]
Team Kinderwunsch HannoverDr. med. Nabil Saymé,Dipl.-Biol. T. KrebsBrühlstraße 1930169 HannoverTel. 0511/313 095, Fax -313 096info@team-kinderwunsch-hannover.dewww.team-kinderwunsch-hannover.de
Medizinische Hochschule HannoverBereich Gynäkologische Endokrinologie undReproduktionsmedizin, OE 6410OÄ Dr. med. Cordula Schippert,OA Dr. med. Guillermo-José Garcia-Rocha,FÄ Dr. med. Christina Baßler,AssÄ Dr. med. Wiebke ZempelCarl-Neuberg-Straße 130625 HannoverTel. 0511/532-6099, Fax [email protected]/11327.html
Kinderwunschzentrum Langenhagen-WolfsburgDr. med. Martina Müseler-Albers,Dr. med. Klaus Bühler,Horst Peter Arendt, Dr. med. Thilo SchillOstpassage 930853 LangenhagenTel. 0511/972 300, Fax -972 3018praxis@kinderwunsch-langenhagen.dewww.kinderwunsch-langenhagen.de
Zentrum für Reproduktionsmedizin undHumangenetikDr. med. Franz-J. Algermissen,Dr. med. Peter F. Justus,Dr. med. Georg Wilke,Dr. med. Notker GrafGartenstraße 18 - 2031141 HildesheimTel. 05121/206 79-0, Fax -206 79-11praxis@kinderwunsch-hildesheim.dewww.kinderwunsch-hildesheim.de
Deutsche Klinik Bad MünderZentrum für ReproduktionsmedizinMVZ wagnerstibbe GmbHDr. med. Elmar Breitbach,Dr. med. Arvind Chandra,Dr. med. Grita Hasselbach,Dr. med. Natascha PeperHannoversche Straße 2431848 Bad MünderTel. 05042/940-360, Fax [email protected]
Zentrum für Kinderwunschbehandlung undpränatale MedizinDr. med. Dipl.-Biochem. Onno Buurman,Dr. med. Michael Dumschat,Dr. med. Ralf MenkhausSimeonsplatz 1732423 MindenTel. 0571/972 60-0, Fax -972 [email protected]
BIF - Bielefelder Institut fürFortpflanzungsmedizinProf. Dr. med. Joachim Volz,Dr. med. Beate HarmsTeutoburger Straße 5033604 Bielefeld
Bielefeld Fertility CenterZentrum für Reproduktionsmedizin undGynäkologische EndokrinologiePaul A.Ebert,Dr. med. Karl Völklein, Beata Szypajlo, Dr. med. Wiebke Rübberdt, Dr. med. Beate HarmsWerther Straße 26633619 BielefeldTel. 0521/101 005, Fax -101 [email protected] www.kinderwunsch-bielefeld.de
Modifizierter Nachdruck aus J Reproduktionsmed Endokrinol 2012; 9 (6)34

MVZ für Reproduktionsmedizin am Klinikum KasselDr. med. Marc Janos Willi,Dr. med. Oswald SchmidtProf. Dr. (UBsAs) Miguel HinrichsenMönchebergstraße 41 - 4334125 KasselTel. 0561/980-2980, Fax [email protected]
RepKo – ReproduktionsmedizinischesKompetenzzentrum am Universitäts-klinikum Gießen & Marburg GmbHProf. Dr. med. Peyman Hadji,Dr. med. Volker Ziller,Dr. med. Berna Seker-Pektas,Dr. med. Christina KliebeBaldingerstraße35043 MarburgTel. 06421/5861330, Fax -5867070Haus 40 – Klinikstr. 3335392 GießenTel. 0641/98545207, Fax -98557099www.repko-ukgm.de
Kinderwunschzentrum MittelhessenDr. med. Amir Hajimohammad,Berthold OelsSportparkstraße 935578 WetzlarTel. 06441/200 2020, Fax -200 [email protected]
gyn-medicumZentrum für KinderwunschDr. med. Monica Tobler,Jana RostekWaldweg 537073 GöttingenTel. 0551/413 37, Fax -417 22www.gyn-medicum.de
Kinderwunschzentrum GöttingenDr. med. Rüdiger Moltrecht,Dr. med. Sabine Hübner, Dr. med. Thomas Welcker,Dr. med. Filiz Sakin-Kaindl,Dr. med. Stephanie Mittmann,Dr. med. Peter SchulzeckKasseler Landstraße 25 a37081 GöttingenTel. 0551/998 88-0, Fax -998 [email protected]
Kinderwunschzentrum MagdeburgDr. med. Ingrid Nickel,Dr. med. Evelyn Richter,Dipl.-Biol. Katrin PribbernowUlrichplatz 139104 MagdeburgTel. 0391/811 4090, Fax -852 [email protected]
Universitätsklinik für Reproduktionsmedizinund Gynäkologische EndokrinologieProf. Dr. med. Jürgen Kleinstein,Dr. med. Anke Britta BrössnerGerhart-Hauptmann-Straße 3539108 MagdeburgTel. 0391/671 7390, Fax -671 [email protected]/krep.html
Kinderwunsch-KöDr. Martina Behler, Fr. Tanja EmdeDr. Suna Cukrucam, Dr. Giesa RosiepenKönigsallee 63-6540215 DüsseldorfTel. 0211/311 355-0, Fax -311 [email protected]
Interdisziplinäres KinderwunschzentrumDüsseldorfDr. med. Michael C. W. Scholtes,Dipl. med. Kersten Marx, PD Dr. med. Stefan Kißler,Dr. med. Petra Hubert,Dr. med. Selma Yildirim-AssafVölklinger Straße 440219 DüsseldorfTel. 0211/901 97-0, Fax -901 [email protected]
UniKiD Universitäres interdisziplinäresKinderwunschzentrum DüsseldorfProf. Dr. med. Jan-Steffen Krüssel,PD Dr. med. Alexandra Hess,Dres. med. Barbara Mikat-Drozdzynski,Daniel Fehr, Tanja Freundl-Schütt,Andrea Schanz, Sonja Schu,Dres. rer. nat. Dunja Baston-Büst,Jens HirchenhainMoorenstraße 540225 DüsseldorfTel. 0211/810-4060, Fax [email protected]
pro-KindwunschKinderwunschzentrum NiederrheinDr. med. Georg M. Döhmen,Dr. med. Thomas SchalkVon-Groote-Straße 17541066 MönchengladbachTel. 02161/496 86-0, Fax -496 [email protected]
green-ivf - Grevenbroicher Endokrino-logikum & IVF-ZentrumDr. med. Jürgen Tigges,Dr. med. Kerstin Friol,PD Dr. med. Christian GnothRheydter Straße 14341515 GrevenbroichTel. 02181/4915-13, Fax [email protected]
Bergisches Kinderwunschzentrum RemscheidDr. med. Johannes Luckhaus,Dr. med. Anke BeerkotteElberfelder Straße 4942853 RemscheidTel. 02191/791 92-0, Fax -791 [email protected]
Kinderwunschzentrum Dortmund und SiegenMVZ Ärzte PartnerschaftProf. Dr. med. Stefan Dieterle,Dr. med. Andreas Neuer, Prof. Dr. med. Robert GrebOlpe 1944135 DortmundTel. 0231-557545-0, Fax [email protected] Weg 4157072 SiegenTel. 0271/770 1810, Fax -770 [email protected]
Vitro-Med Kinderwunschzentrum BochumYvonne GiesnerHellweg 244787 BochumTel. 0234/610 654 03, Fax -685 [email protected]
novum - Zentrum für ReproduktionsmedizinEssen - DuisburgProf. Dr. med. Thomas Katzorke,Dr. med. Susanne Wohlers, Najib N. R. Nassar,Prof. Dr. med. Peter BielfeldAkazienallee 8 - 1245127 EssenTel. 0201/294 29-0, Fax -294 29-14Ärzteforum in der TonhallenpassageFriedrich-Wilhelm-Straße 7147051 DuisburgTel. 0203/713 958-0, Fax -713 [email protected]
Reprovita - KinderwunschzentrumRecklinghausenDr. med. Cordula PitoneHertener Straße 2945657 RecklinghausenTel. 02361/904 188-0, Fax -904 [email protected]
Kinderwunschpraxis GelsenkirchenDr. med. Ute Czeromin,Dr. med. Ina Walter-Göbel,Dr. med. Kathrin FißelerMunscheidstraße 1445886 GelsenkirchenTel. 0209/167-1470, Fax -167-1471info@kinderwunsch-gelsenkirchen.dewww.kinderwunsch-gelsenkirchen.de
Fertility Center MünsterlandDr. med. Ulrich HillandCrispinusstraße 1246399 BocholtTel. 02871/239 43-43, Fax -239 [email protected]
Kinderwunschpraxis an der PromenadeMempel & StratmannDr. med. Andrea Mempel, Susanne Stratmann,Dr. rer. nat. Melanie Rickert-FöhringVon-Vincke-Straße 1448143 MünsterTel. 0251/414 312-0, Fax -414 312-20willkommen@kinderwunsch-promenade.dewww.kinderwunsch-promenade.de
MVZ Kinderwunsch- und HormonzentrumMünster GmbHDr. med. Dr. rer. nat. Lutz Belkien,Dr. med. Caroline Niehoff,Prof. Dr. med. Axel KamischkeHötteweg 5 - 748143 MünsterTel. 0251/482 67-0, Fax -482 [email protected]
Modifizierter Nachdruck aus J Reproduktionsmed Endokrinol 2012; 9 (6) 35
Universitäres Kinderwunschzentrum MünsterPD Dr. med. Andreas SchüringKlinik für Frauenheilkunde und GeburtshilfeUniv.-Prof. Dr. med. Ludwig KieselCentrum für Reproduktionsmedizin undAndrologieProf. Dr. med. Sabine KlieschAlbert-Schweitzer-Campus 1, Gebäude D1148149 MünsterTel. 0251/8358 [email protected]
Zentrum für KinderwunschbehandlungOsnabrückIrene Coordes,Dr. med. Manfred SchneiderRheiner Landstraße 93 - 9549078 OsnabrückTel. 0541/404 500, Fax -404 [email protected]
GMP Frauenheilkunde &ReproduktionsmedizinDr. med. Dieter Struller,Dr. med. Christof EtienGraf-Salm-Straße 1050181 Bedburg, ErftTel. 02272/7778, Fax [email protected]
MVZ PAN Institut für Endokrinologie undReproduktionsmedizinDr. med. Stefan Palm,Dr. med. Dipl.-Biol. Irene Pütz,Dr. med. Mirko Dannhof,PD Dr. med. Dolores FothZeppelinstraße 1c/o PAN Klinik50667 KölnTel. 0221/2776-229, Fax [email protected]
Kinderwunschzentrum KölnPraxis und Klinik SchönhauserstraßeDr. med. Markus MerzenichSchönhauser Straße 350968 KölnTel. 0221-3403070mmerzenich@kinderwunschzentrum-koeln.deKinderwunschzentrumEva SchwahnSchönhauser Straße 350968 KölnTel. 0221/340 2280, Fax -340 [email protected]
Universitäts-Frauenklinik für GynäkologischeEndokrinologie und ReproduktionsmedizinMedizinische Fakultät der RWTH AachenProf. Dr. med. Joseph Neulen,Dr. med. Benjamin RösingPauwelsstraße 3052074 AachenTel. 0241/808 8971, Fax -808 2518gyn-endokrinologie@ukaachen.dewww.gyn-endokrinologie.ukaachen.de
Frauenarztpraxis mit SchwerpunktGynäkologische Endokrinologie undReproduktionsmedizin an der ItertalklinikDr. med. Klaus GrunwaldEisenhütte 23 - 2552076 AachenTel. 02408/958 499, Fax -958 [email protected]
Universitätsfrauenklinik BonnAbteilung für Gynäkologische Endokrinologieund ReproduktionsmedizinProf. H. van der Ven,Prof. K. van der Ven,Dr. U. Bohlen, Prof. Dr. rer. nat. M. Montag,Dr. M. KösterSigmund-Freud-Straße 2553105 BonnTel. 0228/287-19186 od. -19187, Fax -287-15795Daniela.von_Kospoth@ukb.uni-bonn.dewww.kinderwunsch-uni-bonn.de
Praxisklinik für GynäkologischeEndokrinologie und ReproduktionsmedizinPriv.-Doz. Dr. Dr. med. Gernot PrietlTheaterplatz 1853177 Bonn-Bad GodesbergTel. 0228/35 039 10, Fax -364 [email protected]
Praxisklinik Trier – Zentrum fürGynäkologische Endokrinologie &ReproduktionsmedizinDr. med. Mohsen Satari,Prof. Dr. med. Jürgen P. HankerWissenschaftspark (WIP)Max-Planck-Straße 1554296 TrierTel. 0651/979 06-0, Fax -979 [email protected]
Kinderwunschzentrum - UniversitätsmedizinMainzUniv.-Prof. Dr. med. Rudolf Seufert M.Sc.,Fr. Priv.- Doz. Dr. C. Skala,Fr. Dr. R. Gomez,Fr. Dr. C. HeidnerLangenbeckstraße 155101 MainzTel. 06131/173 929, Fax -176 [email protected]
Kinderwunsch Zentrum MainzDr. med. Robert Emig,Dr. med. Silke MettlinRheinstraße 4Fort Malakoff Park55116 MainzTel. 06131/603 020, Fax -603 0210arzt@kinderwunschzentrum-mainz.dewww.kinderwunschzentrum-mainz.de
Kinderwunschzentrum MittelrheinDr. med. Josef Beran,Dr. med. Birgit Müller,Dr. med. Sebastian HagelauerMarktstraße 8356564 NeuwiedNeustadt 856068 KoblenzTel. 02631/3968-0, Fax -3968-29info@kinderwunsch-mittelrhein.dewww.kinderwunsch-mittelrhein.de
Zentrum für ReproduktionsmedizinProf. Dr. med. Dr. med. habil. ErnstSiebzehnrübl,Dr. med. Anja WeidnerHanauer Landstraße 328 - 33060314 Frankfurt am MainTel. 069/426 077-0, Fax -426 [email protected]
Kinderwunschzentrum Frankfurt am MainProf. Dr. med. Prof. h.c. Eberhard Merz,Dr. med. Christine Molitor,Dr. med. Marie-Theres Swayze,Frau Ines BoehnischSteinbacher Hohl 2 - 2660488 FrankfurtTel. 069/7601-3611, Fax -7601-3321info@kinderwunschzentrum-frankfurt.dewww.kinderwunschzentrumfrankfurt.de
Fertilitätszentrum und GynäkologischeEndokrinologieKlinik für Frauenheilkunde und GeburtshilfeJohann-Wolfgang-Goethe-UniversitätProf. Dr. med. Inka Wiegratz,Dr. med. Nicole Sänger,Dr. med. Annette Bachmann,Dr. Anna MichaelisTheodor-Stern-Kai 760590 Frankfurt am MainTel. 069/6301-5518, Fax [email protected]/zfg/gyn
Kinderwunsch- und Endometriosezentrumam Büsing ParkDr. med. Konstantin Manolopoulos,Dr. med. Nadja NajjariHerrnstraße 5163065 OffenbachTel. 069/809 075 71, Fax -809 075 73dr-manolopoulos@offenbach-kinderwunsch.dewww.offenbach-kinderwunsch.de
Kinderwunschzentrum DarmstadtProf. Dr. med. G. Leyendecker,Dr. med. A. Bilgicyildirim,Dr. med. M. Inacker,Dr. med. J. Bratengeier,Dr med. H Engelskirchen-Amran,A. Weber-Lohrum,Dr. rer. nat. Th. Stalf, Dr. rer. nat. U. Mischeck,Dr. rer. medic. B. Jackisch Bratustraße 964293 DarmstadtTel. 06151/500 98-0, Fax -500 [email protected]
MVZ Kinderwunschzentrum Wiesbaden GmbHDr. med. Martin Schorsch,Dr. med. Thomas Hahn,Dr. med. Geza Adasz,Karin Schilberz,Dr. med. Michael AmraniMainzer Straße 98 - 10265189 WiesbadenTel. 0611/976 32-0, Fax -976 32-10info@kinderwunschzentrum-wiesbaden.dewww.kinderwunschzentrum-wiesbaden.de
Überregionales Kinderwunschzentrum IVF-Saar Saarbrücken-KaiserslauternDr. med. Lars Happel,Andreas Giebel,Dr. med. Anette Russu,Dr. med. Marika OtteDr. med. rer. medic. Martin GreunerEuropaallee 1566113 SaarbrückenTel. 0681-93632-0, Fax -93632-10Maxstraße 1367659 KaiserslauternTel. 0631/936 32-0, Fax: -936 [email protected]
Modifizierter Nachdruck aus J Reproduktionsmed Endokrinol 2012; 9 (6)36

Klinik für Frauenheilkunde, Geburtshilfe undReproduktionsmedizinUniversitätskliniken des SaarlandesProf. Dr. med. E.-F. Solomayer,OA Peter Rosenbaum, Prof. Dr. Dr. ME Hammadeh,Dr. med. Kathrin Abel,Dr. med. Michaela von BlohnKirrbergstraße 166421 HomburgTel. 06841/162 8213, Fax -162 [email protected]/einrichtun-gen/kliniken_institute/frauenklinik/
Kinderwunschzentrum LudwigshafenDr. med. Tobias Schmidt,Dr. med. Elena Hartschuh,Dr. med. Claudia Schmidt,Dr. rer. nat. Nicole MotzkusLudwigstraße 54 b67059 LudwigshafenTel. 0621/592 986 88, Fax -592 986 90kontakt@kinderwunsch-lu.dewww.kinderwunschzentrum-ludwigshafen.de
Kinderwunschzentrum MannheimProf. Dr. med. Marc Sütterlin,Dr. med. Regine Schaffelder,Dr. med. Julia Rehnitz,Dr. med. Jade MayerDr. sc. hum. Monika GentiliTheodor-Kutzer-Ufer 1 - 368167 MannheimTel. 0621/383-3638, Fax [email protected]/64.0.html
Viernheimer Institut für FertilitätPD Dr. med. Stefanie Volz-Köster,Dr. med. Christina Nell,Dr. sc. Hum. Brigitte HauffKarl-Marx-Straße 4368519 ViernheimTel. 06204/703 600, Fax -703 [email protected]
Abt. für Gynäkologische Endokrinologie undFertilitätsstörungenUniversitätsklinikum HeidelbergProf. Dr. med. Thomas Strowitzki, Prof. Dr. med. Bettina Toth,Dr. med. Sabine Rösner,PD Dr. med. Adriane Germeyer,Dr. med. Maren Goeckenjan, Dr. med. Lisa-Maria Wallwiener,Prof. Dr. rer. Nat Markus MontagVoßstraße 969115 HeidelbergTel. 06221/567 910, Fax -564 099thomas.strowitzki@med.uni-heidelberg.dewww.klinikum.uni-heidelberg.de/Kinderwunschambulanz.583.0.html
Kinderwunschzentrum HeidelbergDr. med. Waltraud Parta-Kehry,Dr. sc. hum. Suat Parta,Friederike Tesarz,Dr. med. Daniela Seehaus,Dr. med. Christina ThöneRömerstraße 369115 HeidelbergTel. 06221/893 00-0, Fax -893 [email protected]
Kinderwunsch-Zentrum StuttgartProf. Dr. med. Dieter H. A. Maas,Dr. med. Friedrich Gagsteiger,Dr. med. Christine Eberle,Dr. med. Anja Bock-Skupin,Dr. med. Nina KircherFriedrichstraße 4570174 StuttgartTel. 0711/997 806-0, Fax -997 [email protected]
Kinderwunsch-Zentrum StuttgartPraxis Villa HaagDr. med. Dieter B. Mayer-EichbergerHerdweg 6970174 StuttgartTel. 0711/221 084, Fax -221 [email protected]
Gynäkologie und ReproduktionsmedizinDr. med. Fred MaleikaLessingstr. 970174 Stuttgart
Frauenarztpraxis mit TagesklinikReproduktionsmedizinUniv.-Prof. Dr. med. Ute FuchsDr. rer. nat. Silvia HarrerKornbergstraße 2370176 StuttgartTel. 0711/226 2728, Fax -226 [email protected]
Kinderwunschzentrum LudwigsburgDr. med. Andreas OttPflugfelder Straße 2271636 LudwigsburgTel. 07141/688 76-0, Fax -688 [email protected]
Praxis Dres. med. GöhringHerr Dr. med. U. Göhring,Frau Dr. med. I. Göhring,Frau Dr. med. J. RattenhuberHagellocher Weg 6372070 TübingenTel. 07071/946 63-0, Fax -946 [email protected]
IVF-Zentrum der UniversitätsfrauenklinikTübingenDr. med. Barbara LawrenzCalwerstraße 772076 TübingenTel. 07071/298 3117 , Fax -292 250barbara.lawrenz@med.uni-tuebingen.dewww.uni-frauenklinik-tuebingen.de
Kinderwunschzentrum AalenDr. med. Rainer Rau,Dr. med. Birgit Schröppel,Dr. rer. nat. Roland Eid (Labor)Weidenfelder Straße 173430 AalenTel. 07361/620 21, Fax -620 [email protected]
IVF-Zentrum EsslingenDr. med. Johann Emil CosteaDipl. Ing. Luminitza CosteaDr. rer. nat. Michael TrogeMarktplatz 5/173728 EsslingenTel. 0711/310 591 60, Fax -310 591 [email protected]
Centrum für Kinderwunsch PforzheimVerena PeutenZerrenner Straße 22 - 2475172 PforzheimTel. 07231/280 8280, Fax -280 [email protected]
Kinderwunschzentrum KarlsruheKarlsruher IVF-ProgrammArbeitsgemeinschaft für FortpflanzungsmedizinHans-Jürgen Gräber,Dr. Frank Tetens, Dr. med. Daniela Plathow,Laborärzte Dr. Ehrfeld + Kollegen,Humangenetik Dr. Schlüter, Dr. SchülerWaldstraße 1476133 KarlsruheTel. 0721/824 6700, Fax -295 [email protected]
Kinderwunschzentrum Klinikum MittelbadenMVZ GmbHProf. Dr. med. Wolfgang Küpker,Dr. med. Peter Hartmann,Dr. med. Markus Knoll,Dr. s.c. hum. Wolfgang Bernart (Dipl.-Biol.)Engelstraße 3976437 RastattTel. 07222/596 0282, Fax -596 0284info@kinderwunschzentrum-mittelbaden.dewww.kinderwunschzentrum-mittelbaden.de
Kinderwunsch BodenseeDr. med. Andreas Heine, Dr. med. Antje Hiemer, Dr. Angela PanhansMaggistraße 578224 SingenTel. 07731/912 999-0, Fax -912 [email protected]
Centrum für gynäkologische Endokrinologieund Reproduktionsmedizin Freiburg (CERF)-Dr. med. Rudolf Weitzell,Dr. med. Maria Thiemann,PD Dr. med. Birgit Wetzka,Prof. Dr. med. Franz GeisthövelBismarckallee 7 f79098 FreiburgTel. 0761/207 43-0, Fax -321 [email protected]
Universitäts-Frauenklinik FreiburgEndokrinologie und ReproduktionsmedizinDr. med. Stephanie Friebel,Dr. med. Aida Hanjalic-Beck,Dipl.-Biol. Elisabeth HalbeHugstetter Straße 5579106 FreiburgTel. 0761/270-31500, Fax -270-29120stephanie.friebel@uniklinik-freiburg.dewww.uniklinik-freiburg.de/frauenklinik/live/endokrinologie.html
Zentrum für Reproduktionsmedizin MünchenGemeinschaftspraxis für Frauenheilkundeund GeburtshilfeDr. med. Walter Bollmann,Dr. med. Thomas Brückner, Dr. med. Ulrich NossTal 1180331 MünchenTel. 089/242 295-0, Fax -242 [email protected]
Modifizierter Nachdruck aus J Reproduktionsmed Endokrinol 2012; 9 (6) 37

Gynäkologische Endokrinologie undReproduktionsmedizin der Uni München –InnenstadtLudwig-Maximilians-UniversitätKlinik und Poliklinik für Frauenheilkunde undGeburtshilfe, Klinikum der Universität MünchenProf. Dr. med. Markus S. KupkaMaistraße 1180337 MünchenTel. 089/5160-4214, Fax [email protected]
Hormonzentrum MünchenDr. med. Helmut Lacher,Dr. med. Jörg Puchta,Dr. med. Silke Michna,PD Dr. med. Hans-Ulrich PauerWestendstraße 193 - 19580686 MünchenTel. 089/547 041-0, Fax -547 [email protected]
Kinderwunsch Centrum München-PasingDr. med. Klaus Fiedler,Dr. med. Irene von Hertwig,Dr. med. Gottfried Krüsmann,Prof. Dr. Dr. med. habil. Wolfgang Würfel, Ina Laubert, Dr. med. Claudia Santjohanser,Sabine Völker, Osama Meri,Dr. med. Jan KrüsmannLortzingstraße 2681241 MünchenTel. 089/244 144-0, Fax -244 [email protected]
Hormon- und Kinderwunsch-Zentrum derLMU München-GroßhardernLeiter: Prof. Dr. Christian J. ThalerLeitende Embryologin:Dr. rer. nat. Viktoria von SchönfeldtKlinik und Poliklinik der Frauenheilkundeund GeburtshilfeDirektor: Prof. Dr. med. Klaus FrieseMarchioninistraße 1581377 MünchenTel. 089/7095-6825, Fax -7095-3844www.kinderwunsch-uni-muenchen.de
A.R.T. BogenhausenProf. Dr. med. Dieter Berg,Dr. med. Bernd Lesoine, Dr. rer. nat. Ulrike BergPrinzregentenstraße 6981675 MünchenTel. 089/414 240-0, Fax -414 [email protected]
Kinderwunsch Centrum ChiemseeDr. med. Susann Böhm,Dr. med. Matthias Lehnert,Dr. med. Angelika StahlHochriesstraße 2183209 Prien am ChiemseeTel. 08051/5050, Fax [email protected]
Kinderwunschzentrum AugsburgDr. med. Klaus-Friedrich Hiller,Dr. med. Thomas Bauer,Dr. med. Harald Kraus,Prinzregentenstraße 25/III86150 AugsburgTel. 0821/502 7888, Fax -502 [email protected]
KWK – KinderWunschKemptenZentrum für ReproduktionsmedizinKlinik für Frauenheilkunde und Geburtshilfe- Klinikum Kempten Oberallgäu gGmbHProf. Dr. med. Ricardo Felberbaum,OA Gerhard Allgayer,Dr. med. Bettina Kollmannsberger,Dipl.-Biol. Mohammad KousehlarRobert-Weixler-Straße 5087439 KemptenTel. 0831/530-3393, Fax -530-3457ricardo.felberbaum@klinikum-kempten.dewww.kinderwunsch-kempten.de
Praxis Frauenstraße Ulm GbRProf. Dr. med. Karl Sterzik,Dr. med. Erwin StrehlerFrauenstraße 5189073 UlmTel. 0731/966 51-0, Fax -966 [email protected]
Universitätsfrauenklinik und Poliklinik UlmZentrum für Reproduktionsmedizin undGynäkologische EndokrinologiePD Dr. med. Katharina HanckePrittwitzstraße 4389075 UlmTel. 0731/5005 8663, Fax -5005 [email protected]/klinik/ufk/
Kinderwunsch-Zentrum UlmDr. med. Friedrich Gagsteiger,Dr. med. Natalie Reeka,Dr. med. Kerstin Eibner,Dr. med. Nilofar HuzurudinEinsteinstraße 5989077 UlmTel. 0731/151 590, Fax 0731-151 [email protected]
Kinderwunsch und Frauen-Hormon CentrumDr. med. Joachim Neuwinger,Dr. med. Barbara Munzer-Neuwinger,Prof. Dr. med. Peter LichtAgnesgasse 2-490403 NürnbergTel. 0911/235 5500, Fax -235 5516aerzte@kinderwunschcentrum-nuernberg.dewww.kinderwunschzentrum-nuernberg.de
Kinderwunschzentrum ErlangenDr. med. Jan van Uem,Dr. med. Madeleine HaasMichael-Vogel-Straße 1 e91052 ErlangenTel. 09131/8095-0, Fax [email protected]
Gemeinschaftspraxis der FrauenärzteDres. Hamori, Behrens, HammelDr. med. Miklos Hamori,Dr. med. Rolf Behrens,Dr. med. Andreas HammelNürnberger Straße 3591052 ErlangenTel. 09131/895 20, Fax -205 [email protected]
Universitäts-Fortpflanzungszentrum Franken(UFF) des Univ.-Klinikums ErlangenProf. Dr. med. Matthias W. BeckmannPD Dr. med. Andreas Müller,Prof. Dr. rer. nat. Ralf Dittrich (Biologe)Universitätsstraße 21 - 2391054 ErlangenTel. 09131/85-33553, Fax -85-33552fk-uff@uk-erlangen.dewww.reproduktionsmedizin.uk-erlangen.de
Kinderwunschzentrum AmbergDr. med. Jürgen KriegProf. Dr. med. Anton ScharlMariahilfbergweg 792224 AmbergTel. 09621/381 519, Fax -381 941info@kinderwunschzentrum-amberg.dewww.kinderwunschzentrum-amberg.de
KITZ Regensburg – KinderwunschTherapie imZentrum RegensburgProf. Dr. med. Bernd Seifert,Dr. med. Claudia GaßnerHemauerstraße 193047 RegensburgTel. 0941/992 577-0, Fax -992 [email protected]
Kinderwunschzentrum ProfertilitaProf. Bals-Pratsch, M. Sc.Dr. Eder, M. Sc.Hildegard-von-Bingen-Straße 193053 RegensburgTel. 0941/898 499 44, Fax -898 499 [email protected]
Kinderwunschzentrum NiederbayernDr. med. Hans-Joachim Kroiss,Dr. med. Samuel Dadze-Arthur,Dr. IM Tem. Elfriede BernhardtStadtfeldstraße 5094469 DeggendorfTel. 0991/297 993 32, Fax -297 993 [email protected]@ivf-bayern.dewww.kinderwunsch-niederbayern.de/
Klinik am HofgartenDr. med. Stefan Todorow,Dr. med. Erika SchwarzRichard-Wagner-Straße 34 - 3695444 BayreuthTel. 0921/745 4440, Fax -745 [email protected]
Zentrum für Reproduktionsmedizin, Medizinische Genetik und PränataldiagnostikDr. med. Reinhard Mai,Dr. med. Wolfgang Schmitt,Dr. med. Lore MulfingerJuliuspromenade 797070 WürzburgTel. 0931/321 230, Fax -321 23-77kontakt@drs-mai-schmitt-mulfinger.dewww.drs-mai-schmitt-mulfinger.de
Universitäts-Frauenklinik WürzburgZentrum für gynäkologische Endokrinologieund ReproduktionsmedizinProf. Dr. med. Ursula Zollner,Dr. med. Michael Schwab,Dr. rer. nat. Claudia StaibJosef-Schneider-Straße 497080 WürzburgTel. 0931/201-25619, Fax -201-25406kinderwunsch@klinik.uni-wuerzburg.dewww.frauenklinik.uni-wuerzburg.de
Modifizierter Nachdruck aus J Reproduktionsmed Endokrinol 2012; 9 (6)38

Aktuelle Themen
Modifizierter Nachdruck aus J Reproduktionsmed Endokrinol 2012; 9 (6) 39
Die Drucklegung dieses Jahrbuchs wurde ermöglicht durch die freundliche und großzügige Unterstützung
der
FERRING Arzneimittel GmbH, Kiel
Merck Serono GmbH, Darmstadt
MSD Sharp & Dohme GmbH, Haar bei München
Impressum
Offizielles Organ folgender Gesellschaften:• Arbeitsgemeinschaft Reproduktionsbiologiedes Menschen (AGRBM) • BundesverbandReproduktionsmedizinischer Zentren Deutsch-lands (BRZ) • Dachverband Reproduktions-biologie und -medizin (DVR) • Deutsche Ge-sellschaft für Andrologie (DGA) • DeutscheGesellschaft für Gynäkologische Endokrino-logie und Fortpflanzungsmedizin (DGGEF)• Deutsche Gesellschaft für Reproduktionsme-dizin (DGRM) • Deutsches IVF-Register (DIR)• Embryologenforum Austria (EFA) • SektionReproduktionsbiologie und -medizin der Deut-schen Gesellschaft für Endokrinologie (SRBM/DGE)
Schriftleitung:Prof. Dr. med. Hermann M. BehreZentrum f. Reproduktionsmedizin u. AndrologieUniversitätsklinikum HalleMartin-Luther-Universität Halle-WittenbergErnst-Grube-Str. 40, 06120 HalleTel. 0345/557-4782, Fax 0345/557-4788E-Mail: [email protected]
Medieninhaber, Verleger, Produktion,Anzeigen, Vertrieb:Krause & Pachernegg GmbHVerlag für Medizin und WirtschaftA-3003 Gablitz, Mozartgasse 10Tel. +43/2231/61 258-0, Fax +43/2231/61 258-10Internet: www.kup.at/reproduktionsmedizin
Lektorat: Krause & Pachernegg GmbH,Mag. G. Voss
Produktion: Krause & Pachernegg GmbH,Dr. Th. Haunold, M. Hegedüs
Druck: Ueberreuter Print GmbHA-2100 KorneuburgIndustriestraße 1
Deutsche Post: VertriebskennzeichenY 64238
Erscheinungsort: A-3003 Gablitz
Abonnement: EUR 80,–/Jahr, im Auslandzzgl. Porto- und Auslandsüberweisungsspesen
Grundlegende Richtung: Fachzeitschriftzur Information und Weiterbildung sowieVeröffentlichung von Übersichts- und Fort-bildungsartikeln aus dem In- und Ausland.
Urheberrecht: Mit der Annahme eines Bei-trages zur Veröffentlichung erwirbt der Verlagvom Autor alle Rechte, insbesondere das Rechtder weiteren Vervielfältigung zu gewerblichenZwecken mithilfe fotomechanischer oder an-derer Verfahren. Die Zeitschrift sowie alle inihr enthaltenen einzelnen Beiträge und Abbil-dungen sind urheberrechtlich geschützt. JedeVerwertung, die nicht ausdrücklich vom Ur-heberrechtsgesetz zugelassen ist, bedarf dervorherigen schriftlichen Zustimmung desVerlages. Dies gilt insbesondere für Verviel-fältigungen, Bearbeitungen, Übersetzungen,Mikroverfilmungen und die Einspeicherungund Verarbeitung in elektronischen Systemen.Auch die Rechte der Wiedergabe durch Vor-trag, Funk- und Fernsehsendungen, in Magnet-tonverfahren oder auf ähnlichem Wege blei-ben vorbehalten.
Die Wiedergabe von Gebrauchsnamen, Han-delsnamen, Warenbezeichnungen usw. in die-ser Zeitschrift berechtigt auch ohne besondereKennzeichnung nicht zu der Annahme, dasssolche Namen im Sinne der Warenzeichen-und Markenschutz-Gesetzgebung als frei zubetrachten wären und daher von jedermannbenützt werden dürfen.
Für Angaben über Dosierungshinweise undApplikationsformen kann vom Verlag keineGewähr übernommen werden. Derartige An-gaben müssen vom jeweiligen Anwender imEinzelfall anhand anderer Literaturstellen aufihre Richtigkeit überprüft werden.
Alle namentlich gekennzeichneten Beiträgespiegeln nicht unbedingt die Meinung derRedaktion wider. Diese Beiträge fallen somitin den persönlichen Verantwortungsbereichdes Verfassers. Die Redaktion übernimmtkeine Haftung für unaufgefordert eingesand-te Manuskripte.
Ethikkommission: Bei Originalbeiträgen,die Ergebnisse wissenschaftlicher Forschungmit Menschen wiedergeben, sollten die Auto-ren darlegen, dass das zugrunde liegende Pro-jekt vor Beginn von der zuständigen Ethik-kommission zustimmend bewertet wurde.Die Autoren müssen eine Erklärung über dieEinwilligung der Patienten nach Aufklärungvorlegen („informed consent“).
Geschlechterbezeichnung: Zur leichte-ren Lesbarkeit der Beiträge wird bei Perso-nenbezeichnungen in der Regel die männli-che Form verwendet. Es sind jedoch jeweilsweibliche und männliche Personen gemeint.


ORIGINAL ARTICLE Reproductive epidemiology
Neonatal outcome and congenitalmalformations in children born afterICSI with testicular or epididymalsperm: a controlled nationalcohort studyJ. Fedder1,2,*, A. Loft3, E.T. Parner4, S. Rasmussen5, and A. Pinborg3
1Laboratory of Reproductive Biology, Scientific Unit, Horsens Hospital, Horsens, Denmark 2Fertility Clinic, Odense University Hospital, Sdr.Boulevard 29, Odense C DK-5000, Denmark 3Fertility Clinic, The Juliane Marie Centre, Copenhagen University Hospital Rigshospitalet,Copenhagen, Denmark 4Department of Public Health, Section for Biostatistics, University of Aarhus, Aarhus, Denmark 5National Board ofHealth, Health Statistics, Copenhagen, Denmark
*Correspondence address. E-mail: [email protected]
Submitted on March 27, 2012; resubmitted on August 6, 2012; accepted on September 11, 2012
study question: Does neonatal outcome including congenital malformations in children born after ICSI with epididymal and testicularsperm [testicular sperm extraction (TESE)/percutaneous epididymal sperm aspiration (PESA)/testicular sperm aspiration (TESA) (TPT)]differ from neonatal outcome in children born after ICSI with ejaculated sperm, IVF and natural conception (NC)?
summary answer: Children born after TPT have similar neonatal outcome, including total malformation rates, as have children bornafter ICSI and IVF with ejaculated sperm. Testing for variance over the four groups may indicate smaller differences in specific malformationrates with TPT as the highest risk group.
what is known already: Regarding neonatal outcome as well as congenital malformations in children born after TPT, studies arefew, with limited sample size, heterogeneous and often performed without relevant control groups.
study design, size, duration: Population-based cohort study including all Danish children born after TPT and fresh embryotransfer in Denmark from 1995 to 2009. Children born after transfer of frozen–thawed embryos were excluded. Control groups of childrenconceived by ICSI with ejaculated sperm, IVF and NC were identified by cross-linkage of the Danish IVF Register, Medical Birth Register(MBR) and National Hospital Discharge Register (HDR).
participants/materials, setting: The study group consisted of 466 children born after TPT, while the control groups con-sisted of 8967 (ICSI with ejaculated sperm), 17 592 (IVF) and 63 854 (NC) children. Neonatal outcomes and congenital malformations wereanalysed for singletons and twins separately. Risk estimates for low birthweight (LBW, ,2500 g) and preterm birth (PTB, ,37 gestationalweeks) were adjusted for maternal age, parity, child gender and year of childbirth. The study group was identified from the Danish nationaldatabase on children born after TPT. Control groups were obtained from the IVF register and the MBR. All information included in the studywas retrieved from the national registers.
main results and the role of chance: Considering singletons and twins as one group, the sex ratio (F/C) was signifi-cantly lower for children born after TPT (0.89) compared with conventional IVF (1.11; P ¼ 0.017) but did not differ significantly when com-pared with ICSI with ejaculated sperm (0.94) and NC (1.05). The mean birthweight (BW) for singletons did not differ significantly betweengroups when including only first-born children. The mean gestational age (GA) in the TPT singletons (279+12 days) was significantly highercompared with IVF (276+18 days; P ¼ 0.02), but similar to ICSI with ejaculated sperm and NC singletons when including only first-bornchildren (277+ 16 days and 279+14 days, respectively). Rate of stillbirths, perinatal and neonatal mortality in the group of TPT singletonsdid not differ significantly from any of the control groups. Comparable results were found for the TPT twin group, except for perinatal mor-tality, which was significantly lower in the TPT group compared with naturally conceived twins. The adjusted risk of LBW was significantlyhigher for TPT versus NC singletons [adjusted odds ratio (AOR) ¼ 0.67 (0.48–0.93)]; however AOR for PTB was similar in the two groups.Regarding twins, similar adjusted risks were observed for PTB and LBW between the TPT and all three control groups. Significantly more
& The Author 2012. Published by Oxford University Press on behalf of the European Society of Human Reproduction and Embryology. All rights reserved.For Permissions, please email: [email protected]
Human Reproduction, Vol.28, No.1 pp. 230–240, 2013
Advanced Access publication on November 15, 2012 doi:10.1093/humrep/des377
at Universitaets- und L
andesbibliothek Duesseldorf on Septem
ber 19, 2013http://hum
rep.oxfordjournals.org/D
ownloaded from

Caesarean sections were performed after IVF (27.3% for singletons) and ICSI (25.1% for singletons) with ejaculated sperm compared withthe TPT group (16.4% for singletons). The total rate of congenital malformations in the TPT group was 7.7% and did not differ significantlyfrom any of the control groups. However, singleton TPT boys showed an increased rate of cardiac malformations (3.6%) compared withsingleton boys after IVF (1.4%; P ¼ 0.04) and NC (1.1%; P ¼ 0.02). Considering the level of male infertility as a continuum over the fourgroups, tests for variance in the rate of cardiac malformations in singleton boys, and undescended testicles for singleton as well as twinboys were each significantly increased from NC to IVF to ICSI to TPT (P , 0.001). The rate of hypospadias showed the same pattern,but the TPT group did not differ significantly compared with the control groups.
limitations, reasons for caution: One of the limitations is that the TPT group could not be classified according to testicularor epididymal sperm, as these data were not available in the IVF register. Another limitation is that registry-based studies are encumberedwith the risk of reporting or coding errors or missing data due to insufficient coding. However, the quality of data on congenital malforma-tions in HDR has, in other studies, been validated and found acceptable for epidemiological research, and furthermore, recordings on studyand control groups are performed similarly.
wider implications of the findings: Accumulating data show that TPT treatment is equally safe as conventional ICSI andIVF treatment and as NC with regard to neonatal outcome including congenital malformation.
study funding/potential competing interests: This study is supported by Laboratory of Reproductive Biology, Sci-entific Unit, Horsens Hospital. No competing interests declared.
Key words: neonatal outcome / congenital malformation / sex ratio / azoospermia / TESE/PESA/TESA
IntroductionSince the first children were born after ICSI using testicular sperm(Craft et al., 1993; Schoysman et al., 1993), the use of TESE (testicularsperm extraction), PESA (percutaneous epididymal sperm aspiration)and TESA (testicular sperm aspiration) has steadily increased. In 2010a total of 234 TESE/PESA/TESA (TPT) treatments were performed inDenmark (The National Board of Health, Denmark).
Two meta-analyses and a large Swedish national cohort study haveshown a statistically significant increased risk of birth defects of30–40% after IVF/ICSI when compared with natural conception(NC, Hansen et al., 2005; Kallen et al., 2005; Lie et al., 2005).Although the risk of birth defects in IVF/ICSI singletons have declinedover time, an increased risk of 10–20% in singletons conceived byassisted reproduction still remains (Kallen et al., 2010).
Following ICSI using ejaculated, epididymal or testicular sperm, therate of malformations, particularly in the cardiovascular system and theurogenital tract, appears to be increased (Wennerholm et al., 2000;Ludwig and Katalinic, 2002; Kallen et al., 2005; Fedder et al., 2007).
In a previous Danish descriptive study based on a smaller cohort ofthe present material and also including children born of Norwegiancouples treated in Denmark, a significantly decreased sex ratio (F/C) of 0.83 (�45.4% males) for children born after ICSI with spermretrieved from testis or epididymis was observed when comparedwith a Danish national IVF cohort (1.13; �53.1% males) (Fedderet al., 2007).
Several studies have demonstrated that children born after ICSI withejaculated sperm do not have poorer neonatal outcome than IVF chil-dren (Bonduelle et al., 2002; Pinborg et al., 2004). In a recent studyneonatal outcome for children conceived by ICSI with epididymalsperm was found to be similar to that of children conceived by ICSIwith ejaculated sperm (Woldringh et al., 2011). However, a higherrate of hypospadias and cardiac malformations has been suggestedafter ICSI with epididymal or testicular sperm (Fedder et al., 2007).However, according to neonatal outcome as well as congenital
malformations in children born after ICSI with epididymal or testicularsperm, studies are few, with limited sample size, heterogeneous andoften performed without relevant control groups (Woldringh et al.,2010).
The aim of this study was to compare neonatal outcomes and ratesof congenital malformations and imprinting disorders in a nationalcohort of children conceived after ICSI with epididymal or testicularsperm with appropriate control groups including children born afterICSI or IVF with ejaculated sperm or NC.
Materials and MethodsThis population-based cohort study included all Danish children born afterICSI with epididymal or testicular sperm in Denmark from 1 January 1995to 31 December 2009 (Group A). The TPT group (Group A) was identi-fied from the Danish national TPT database, which was created along witha national questionnaire examination. All Danish fertility clinics contributedand a response rate of 97.5% was obtained with only 2.5% of TPT childrenmissing (Fedder et al., 2007). In Denmark, every human individual has aunique identification number in the Centralized Personal Registry (CPRnumber) that is widely used by healthcare and social service providers.No other information than CPR numbers for mother and child wastaken from the original TPT database. All information for the study andthe control groups were retrieved from the national registers includingthe Danish Medical Birth Register (MBR).
In total we identified 499 children born after ICSI with epididymal ortesticular sperm. In the final study population we included only womenwith complete data on child sex, maternal age and gestational age in theMBR (N ¼ 466; Group A). This group was sub-divided into 290 (62.2%)singletons and 176 (37.8%) twin children. The conventional IVF and ICSIgroups were identified by a cross-linkage of the Danish IVF register andthe MBR. In the MBR register date of childbirth was linked to a specificIVF/ICSI date of ovum pick-up in the IVF register by the unique maternalCPR number. If more dates of ovum pick-up matched the pre-defined cri-teria for date of child birth, we selected the date closest to the date ofdelivery.
Neonatal outcome and malformations in TESA/PESA children 231
at Universitaets- und L
andesbibliothek Duesseldorf on Septem
ber 19, 2013http://hum
rep.oxfordjournals.org/D
ownloaded from
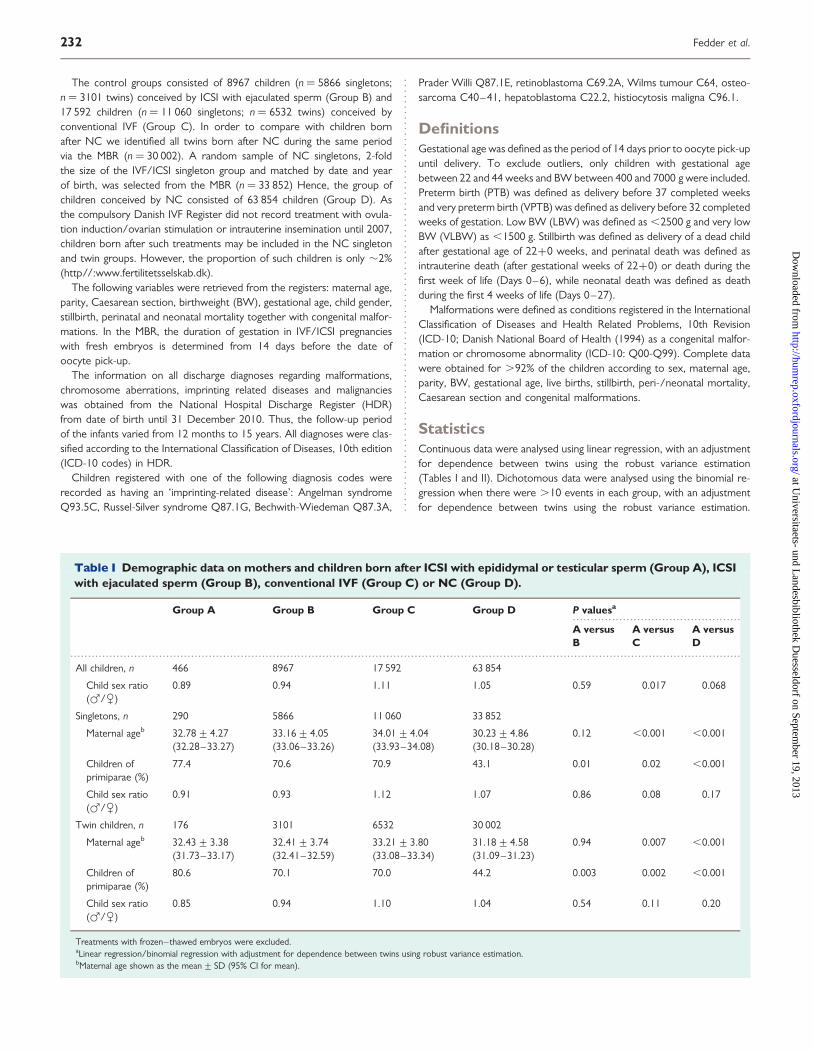
The control groups consisted of 8967 children (n ¼ 5866 singletons;n ¼ 3101 twins) conceived by ICSI with ejaculated sperm (Group B) and17 592 children (n ¼ 11 060 singletons; n ¼ 6532 twins) conceived byconventional IVF (Group C). In order to compare with children bornafter NC we identified all twins born after NC during the same periodvia the MBR (n ¼ 30 002). A random sample of NC singletons, 2-foldthe size of the IVF/ICSI singleton group and matched by date and yearof birth, was selected from the MBR (n ¼ 33 852) Hence, the group ofchildren conceived by NC consisted of 63 854 children (Group D). Asthe compulsory Danish IVF Register did not record treatment with ovula-tion induction/ovarian stimulation or intrauterine insemination until 2007,children born after such treatments may be included in the NC singletonand twin groups. However, the proportion of such children is only �2%(http//:www.fertilitetsselskab.dk).
The following variables were retrieved from the registers: maternal age,parity, Caesarean section, birthweight (BW), gestational age, child gender,stillbirth, perinatal and neonatal mortality together with congenital malfor-mations. In the MBR, the duration of gestation in IVF/ICSI pregnancieswith fresh embryos is determined from 14 days before the date ofoocyte pick-up.
The information on all discharge diagnoses regarding malformations,chromosome aberrations, imprinting related diseases and malignancieswas obtained from the National Hospital Discharge Register (HDR)from date of birth until 31 December 2010. Thus, the follow-up periodof the infants varied from 12 months to 15 years. All diagnoses were clas-sified according to the International Classification of Diseases, 10th edition(ICD-10 codes) in HDR.
Children registered with one of the following diagnosis codes wererecorded as having an ‘imprinting-related disease’: Angelman syndromeQ93.5C, Russel-Silver syndrome Q87.1G, Bechwith-Wiedeman Q87.3A,
Prader Willi Q87.1E, retinoblastoma C69.2A, Wilms tumour C64, osteo-sarcoma C40–41, hepatoblastoma C22.2, histiocytosis maligna C96.1.
DefinitionsGestational age was defined as the period of 14 days prior to oocyte pick-upuntil delivery. To exclude outliers, only children with gestational agebetween 22 and 44 weeks and BW between 400 and 7000 g were included.Preterm birth (PTB) was defined as delivery before 37 completed weeksand very preterm birth (VPTB) was defined as delivery before 32 completedweeks of gestation. Low BW (LBW) was defined as ,2500 g and very lowBW (VLBW) as ,1500 g. Stillbirth was defined as delivery of a dead childafter gestational age of 22+0 weeks, and perinatal death was defined asintrauterine death (after gestational weeks of 22+0) or death during thefirst week of life (Days 0–6), while neonatal death was defined as deathduring the first 4 weeks of life (Days 0–27).
Malformations were defined as conditions registered in the InternationalClassification of Diseases and Health Related Problems, 10th Revision(ICD-10; Danish National Board of Health (1994) as a congenital malfor-mation or chromosome abnormality (ICD-10: Q00-Q99). Complete datawere obtained for .92% of the children according to sex, maternal age,parity, BW, gestational age, live births, stillbirth, peri-/neonatal mortality,Caesarean section and congenital malformations.
StatisticsContinuous data were analysed using linear regression, with an adjustmentfor dependence between twins using the robust variance estimation(Tables I and II). Dichotomous data were analysed using the binomial re-gression when there were .10 events in each group, with an adjustmentfor dependence between twins using the robust variance estimation.
...............................................
.............................................................................................................................................................................................
Table I Demographic data on mothers and children born after ICSI with epididymal or testicular sperm (Group A), ICSIwith ejaculated sperm (Group B), conventional IVF (Group C) or NC (Group D).
Group A Group B Group C Group D P valuesa
A versusB
A versusC
A versusD
All children, n 466 8967 17 592 63 854
Child sex ratio(F/C)
0.89 0.94 1.11 1.05 0.59 0.017 0.068
Singletons, n 290 5866 11 060 33 852
Maternal ageb 32.78+4.27(32.28–33.27)
33.16+4.05(33.06–33.26)
34.01+4.04(33.93–34.08)
30.23+4.86(30.18–30.28)
0.12 ,0.001 ,0.001
Children ofprimiparae (%)
77.4 70.6 70.9 43.1 0.01 0.02 ,0.001
Child sex ratio(F/C)
0.91 0.93 1.12 1.07 0.86 0.08 0.17
Twin children, n 176 3101 6532 30 002
Maternal ageb 32.43+3.38(31.73–33.17)
32.41+3.74(32.41–32.59)
33.21+3.80(33.08–33.34)
31.18+4.58(31.09–31.23)
0.94 0.007 ,0.001
Children ofprimiparae (%)
80.6 70.1 70.0 44.2 0.003 0.002 ,0.001
Child sex ratio(F/C)
0.85 0.94 1.10 1.04 0.54 0.11 0.20
Treatments with frozen–thawed embryos were excluded.aLinear regression/binomial regression with adjustment for dependence between twins using robust variance estimation.bMaternal age shown as the mean+ SD (95% CI for mean).
232 Fedder et al.
at Universitaets- und L
andesbibliothek Duesseldorf on Septem
ber 19, 2013http://hum
rep.oxfordjournals.org/D
ownloaded from

When there were ,10 events in a group we used Fisher’s exact test withan adjustment for dependence between twins using the Bonferroni adjust-ment (Tables I and III–VI).
Adjustments were performed for maternal age (,30, 30–34, 35–39,≥40 years), parity (0 or ≥1 previous births), child gender and infantyear of birth (1995–1997, 1998–2000, 2001–2003 and 2004–2006).Data were analysed in SPSS (PASW Statistics), version 18.01. Statistical sig-nificance was defined as a probability value of P , 0.05.
According to the Danish legislation, studies based solely on register dataand with no personal involvement of the participants do not require ap-proval from an ethical committee. The study was approved by theDanish Data Protection Agency (J. no. 2008-41-1891) and the NationalBoard of Health. The authors have no conflicts of interest.
Results
Demographics/maternal background dataThe mean maternal age in Groups A and B was similar (for singletonsas well as twins), whereas the mean maternal age in the TPT group (A)was significantly lower than that in the group of conventional IVF (C)and significantly higher than that in the group of NC (D). The rate ofprimiparity in the TPT mothers was significantly higher when com-pared with the three control groups (Table I).
Evaluating singletons and twins as one group, the sex ratio (F/C)was significantly lower in Group A (0.89�47.0% males) comparedwith that in Group C (1.11�52.6% males; P ¼ 0.017) but didnot differ significantly compared with Group B (0.94�48.4% males,P ¼ 0.59) or Group D (1.05�51.3% males; P ¼ 0.068). We foundno significant differences in the sex ratio in the analyses restricted tosingletons and twins only (Table I).
Obstetric outcomeSingletonsThe mean BW for singletons was significantly lower in the TPT (GroupA) versus naturally conceived singletons (Group D), but similar com-pared with singletons born after ICSI with ejaculated sperm and IVF(Group B and C). The difference in the mean BW between GroupsA and D disappeared when including only the first-born child in theanalysis (Table II). The mean gestational age was similar for singletonsin Groups A and D (279 days) but significantly longer than in Groups B(277 days; P ¼ 0.03) and C (276 days; P ¼ 0.002). When restricted toanalyses on the first-born child, a significant difference in the mean ges-tational age remained only between Groups A and C (Table II).
The rate of LBW was significantly higher in Group A (5.9%) thanthat in Group D (3.5%) (Table III). A significantly lower rate ofVLBW in Group A compared with children conceived by conventionalIVF was observed (Table III). The rates of PTB and VPTB in Group Awere significantly lower than that in Group C, and VPTB was alsolower in Group A compared with Group B (Table III). The rate ofCaesarean sections in Group A singletons was similar to the rate inGroup D but significantly lower than the rates found in Groups Band C (Table III). The adjusted risk (AOR) of LBW was significantlyhigher in Group A compared with Group D, while no adjusted risk dif-ferences of PTB were demonstrated between the TPT group and anyof the control groups (Table IV).
....
....
....
....
....
....
....
....
....
....
....
....
....
....
....
....
....
....
....
....
....
....
....
....
....
....
....
....
....
....
....
....
....
....
....
....
....
....
....
....
....
....
....
....
....
....
....
....
....
....
....
....
....
....
....
....
....
....
....
....
....
....
....
....
....
....
....
....
....
....
....
....
....
....
....
....
....
..
Tab
leII
Bir
thw
eigh
ts(i
ngr
ams)
and
gest
atio
nala
ges
(in
days
)fo
rsi
ngle
tons
and
twin
sbo
rnaf
ter
ICS
Iw
ith
epid
idym
alte
stic
ular
sper
m(G
roup
A),
ICS
Iw
ith
ejac
ulat
edsp
erm
(Gro
upB
),co
nven
tion
alIV
F(G
roup
C)
orN
C(G
roup
D).
Gro
upA
Gro
upB
Gro
upC
Gro
upD
Pva
lues
a
Ave
rsus
BA
vers
usC
Ave
rsus
D
Sing
leto
ns
Birt
hwei
ght,
all
3433
+54
5(3
370
–34
96)
3435
+62
1(3
419
–34
51)
3374
+66
1(3
362
–33
87)
3533
+57
9(3
526
–35
39)
0.96
0.13
0.00
4
Birt
hwei
ght,
first
born
3395
+53
3(3
325
–34
66)
3395
+63
0(3
376
–34
14)
3338
+66
6(3
323
–33
53)
3446
+58
0(3
437
–34
56)
1.00
0.20
0.19
Ges
tatio
nala
ge,a
ll27
9+
11(2
78–
280)
277+
15(2
76–
277)
276+
17(2
75–
276)
279+
13(2
79–
279)
0.03
0.00
20.
96
Ges
tatio
nala
ge,fi
rst
born
279+
12(2
77–
280)
277+
16(2
77–
278)
276+
18(2
76–
276)
279+
14(2
79–
279)
0.12
0.02
0.64
Tw
inch
ildre
n
Birt
hwei
ght,
all
2551
+59
1(2
439
–26
63)
2496
+60
1(2
468
–25
25)
2464
+62
5(2
444
–24
84)
2507
+60
9(2
498
–25
16)
0.34
0.13
0.43
Birt
hwei
ght,
first
born
2487
+49
5(2
380
–25
94)
2429
+61
9(2
394
–24
64)
2410
+63
6(2
385
–24
35)
2375
+62
3(2
361
–23
90)
0.30
0.16
0.04
Ges
tatio
nala
ge,a
ll25
5+
14(2
52–
258)
254+
19(2
53–
255)
256+
22(2
56–
257)
258+
21(2
57–
258)
0.55
0.26
0.05
Ges
tatio
nala
ge,fi
rst
born
254+
15(2
51–
258)
253+
21(2
51–
254)
256+
24(2
55–
257)
255+
23(2
54–
255)
0.28
0.35
0.84
The
valu
esar
eth
em
ean+
SD(9
5%C
I).a Li
near
regr
essi
onw
ithad
just
men
tfo
rde
pend
ence
betw
een
twin
sus
ing
robu
stva
rianc
ees
timat
ion.
Neonatal outcome and malformations in TESA/PESA children 233
at Universitaets- und L
andesbibliothek Duesseldorf on Septem
ber 19, 2013http://hum
rep.oxfordjournals.org/D
ownloaded from

TwinsThe mean BW and gestational age in Group A twins was similar to theother groups, while the mean BW of the first-born twins was higher inGroup A compared with Group D (Table II). A very low frequency ofVLBW was found in Group A (1.2%) compared with each of the othergroups (6.9, 8.2, 7.1%), but Group A did not differ significantly fromthe other groups according to LBW (Table III). After adjusting for pos-sible dependency between twins, a similar rate of Caesarean sectionswas found in Group A compared with any of the three control groups(Table III). No differences were found in the AOR of LBW and PTB(Table IV).
No statistically significant differences in rates of stillbirths or neo-natal death associated with the mode of conception were observed.For twins in Group A the rate of perinatal deaths was found significant-ly lower than in Group D (Table III).
Congenital malformationsAs shown in Table V no overall increased rate of congenital malforma-tions was found in Group A compared with the other groups.However, the rate of neoplasms in bones or joint cartilages, includingosteosarcomas, was found slightly increased for twin children bornafter ICSI with epididymal/testicular sperm (1.14%) compared withICSI with ejaculated sperm (0.13%; P ¼ 0.03) and NC (0.21%; P ¼0.04), although not significantly increased when compared with
conventional IVF (0.21%). No possible imprinting-related disordersexcept osteosarcomas were detected in any of the four groups.
When focusing on specific organ systems, an increased rate ofcardiac malformations, such as Fallots tetralogy and ventricularseptal defects, was found for singleton boys conceived with epididymalor testicular sperm (3.6%) compared with singleton boys conceived byconventional IVF (1.4%, P ¼ 0.04) or NC (1.1%; P ¼ 0.02) (Table VI).Considering the groups as roughly representing a gradually increasingseverity of male infertility from Group D to Group A, a significantlyincreased trend in cardiac malformations correlating with the severityof male infertility was found (P , 0.001).
No significant differences were found in the rates of hypospadiasand non-descended testicles between Group A and the threecontrol groups, neither for singletons nor twins. However, again con-sidering Group D to A as a gradually increasing severity of male infer-tility, the rate of non-descended testicles gradually increased in boys(singletons as well as twins) (P , 0.001). The same trend existed forhypospadias both in singletons and twins, although this was not statis-tically significant (Table VI).
DiscussionThis Danish nationwide cohort study shows that singletons as well astwins born after ICSI with epididymal or testicular sperm have similarperinatal/neonatal outcomes and similar total congenital malformation
..........................................................
.............................................................................................................................................................................................
Table III Rates of LBW, VLBW, PTB, VPTB, stillbirths and Caesarean sections for children born after ICSI withepididymal or testicular sperm (Group A), ICSI with ejaculated sperm (Group B), conventional IVF (Group C) or NC(Group D).
Group A Group B Group C Group D P valuesa
A versus B A versus C A versus D
Singletons
LBW (,2500 g) 5.9 (3.5–9.2) 5.9 (5.3–6.5) 7.4 (6.9–7.9) 3.5 (3.3–3.7) 1.00 0.42 0.04
VLBW (,1500 g) 0.0 (0.0–1.3) 1.3 (1.0–1.6) 1.9 (1.7–2.2) 0.7 (0.7–0.8) 0.05 0.007 0.28
PTB (,37 weeks) 5.2 (2.9–8.4) 7.1 (6.4–7.8) 9.1 (8.6–9.6) 4.6 (4.4–4.9) 0.24 0.02 0.67
VPTB (,32 weeks) 0.0 (0.0–1.3) 1.6 (1.3–1.9) 2.1 (1.9–2.4) 0.8 (0.7–0.9) 0.02 0.005 0.18
Caesarean section 16.4 (11.7–22.0) 25.1 (23.7–26.4) 27.3 (26.3–28.4) 17.5 (17.0–18.0) 0.003 ,0.001 0.72
Stillbirths 0.0 (0.0–1.3) 0.6 (0.4–0.8) 0.7 (0.6–0.9) 0.4 (0.3–0.5) 0.40 0.28 0.64
Perinatal death 0.0 (0.0–1.3) 0.8 (0.6–1.1) 1.3 (1.1–1.5) 0.6 (0.6–0.7) 0.17 0.06 0.27
Neonatal death 0.3 (0.0–1.9) 0.3 (0.2–0.5) 0.7 (0.5–0.8) 0.3 (0.2–0.3) 0.58 1.00 0.56
Twin children
LBW (,2500 g) 43.5 (31.3–56.2) 43.7 (40.8–46.6) 45.1 (43.1–47.1) 42.6 (41.7–43.6) 1.00 1.00 1.00
VLBW (,1500 g) 1.2 (0.0–7.4) 6.9 (5.5–8.5) 8.2 (7.2–9.4) 7.1 (6.6–7.6) 0.08 0.02 0.06
PTB (,37 weeks) 48.9 (38.0–59.8) 44.7 (42.2–47.2) 40.2 (38.6–42.0) 37.8 (37.0–38.6) 0.44 0.10 0.03
VPTB (,32 weeks) 4.5 (1.0–10.6) 8.1 (6.8–9.6) 8.4 (7.5–9.4) 7.1 (6.7–7.6) 0.31 0.25 0.41
Caesarean section 49.6 (37.6–62.4) 59.0 (56.0–62.0) 58.3 (56.1–60.4) 53.1 (52.1–54.1) 0.16 0.21 0.72
Stillbirths 0.0 (0.0–4.9) 1.2 (0.7–1.9) 1.2 (0.9–1.7) 1.9 (1.6–2.1) 0.80 0.85 0.24
Perinatal death 0.0 (0.0–4.9) 2.4 (1.6–3.3) 2.8 (2.2–3.4) 3.3 (3.0–3.6) 0.22 0.15 0.04
Neonatal death 0.0 (0.0–4.9) 1.3 (0.8–2.2) 1.9 (1.4–2.5) 1.7 (1.5–2.0) 1.00 0.81 0.85
The values are % (95% CI). LBW, low birthweight; VLBW, very low birthweight; PTB, preterm birth; VPTB, very preterm birth.aSingletons: Fisher’s exact test. Twins: binomial regression with adjustment for dependence between twins using robust variance estimation when there were 10 or more events in eachgroup, otherwise Fisher’s exact test with Bonferoni’s method adjustment for dependence between twins. The exact 95% CIs for rates were calculated using the F-distribution.
234 Fedder et al.
at Universitaets- und L
andesbibliothek Duesseldorf on Septem
ber 19, 2013http://hum
rep.oxfordjournals.org/D
ownloaded from

rates compared with children born after IVF and ICSI with ejaculatedsperm.
Comparing singletons born after ICSI with non-ejaculated sperm tonatural conceived singletons we found a lower mean BW and a higheradjusted odds ratio of LBW. For TPT singleton boys we found a sig-nificantly higher rate of cardiac malformations but no increased ratein congenital malformations overall. In this registry-based study wewere not able to relate outcome to the origin of sperm retrieved,e.g. testicular or epididymal, since this information was only availablein the IVF register for the last period of the study. However, in ourprevious study a significantly higher rate of cardiac malformationswere found in TPT children conceived with testicular as well as epi-didymal sperm, supporting the assumption that the origin of thesperm is not associated with the risk of developing specific malforma-tions (Fedder et al., 2007).
The lowest sex ratio was found after ICSI with testicular or epididy-mal sperm (0.89) and conventional ICSI (0.94), while the highest ratiowas found after IVF (1.11). The sex ratio of NC was as expected(1.05). An equal pattern was seen in our previous study, which alsodemonstrated an even lower sex ratio when testicular (comparedwith ejaculated) and particularly epididymal sperm were used forICSI (Fedder et al., 2007). Other studies have also found significantlyhigher male/female ratios after conventional IVF (1.14 and 1.11) com-pared with ICSI (0.96 and 1.01) (Ericson and Kallen, 2001; Bonduelleet al., 2002).
According to the well-known differences in perinatal outcomesbetween singletons and twins, separate analyses for singletons andtwins were performed. In the twin analyses the unequal distributionof monozygotic (MZ) twins between the assisted reproductive tech-nology (ART) groups (A, B and C) and the naturally conceivedcontrol group (Group D) may bias the comparisons between
Groups A and D. The MZ twin rate in ART pregnancies is 1–2% com-pared with 20–30% in non-ART twin pregnancies. One way to over-come this problem is to make comparisons restricted to different-sextwin pairs, thereby excluding all the MZ twins. As twins were not themain focus of this study and due to the limited number of twin children(n ¼ 176) in Group A, we decided not to make sub-analyses ondifferent-sex twin pairs. Further, the MZ-twin rates may only influencethe comparisons between Groups A and D.
The pattern of the mean BW was in accordance with previousstudies: singletons were heavier than twins, boys heavier than girlsand naturally conceived children heavier than children conceived byIVF or ICSI. Further, children conceived after ICSI with ejaculated aswell as non-ejaculated sperm had a higher mean BW than IVF children(Bonduelle et al., 2002; Ludwig and Diedrich, 2002; Pinborg et al.,2004; Woldringh et al., 2011).
Obviously, severe male infertility is the most common reason forICSI treatment and thus the female of an ICSI couple may in generalbe more ‘reproductively healthy’ than women treated with conven-tional IVF. For example, female diagnoses such as polycystic ovariansyndrome, fibroids or endometriosis may be less frequent in femalesin the ICSI population. This may explain the higher mean BW (al-though not significant) in the TPT/ICSI groups compared with theIVF group.
Despite an essential overlap between the TPT cohorts in this andour previous study, the rate of congenital malformations of 7.7%found in this study was significantly higher than the 3.4% found inour previous study (Fedder et al., 2007). There are two mainreasons for this divergence, firstly malformation rates in our previousstudy were based on a self-reported questionnaire filled in by theparents and secondly, only major malformations were to be reported,while the present study is based on national register data including
.............................................................................................................................................................................................
Table IV Odds ratios of LBW and PTB for children born after ICSI with epididymal or testicular sperm (Group A), ICSIwith ejaculated sperm (Group B), conventional IVF (Group C) or NC (Group D).
Group A Group B Group C Group D
Singletons
LBW (,2500 g) 1.00 (ref.) 1.00 (0.61–1.65) 1.28 (0.68–2.40) 0.58 (0.44–0.77)
Crude
Adjusteda 1.00 (ref.) 0.97 (0.60–1.58) 1.22 (0.66–2.23) 0.67 (0.48–0.93)
PTB (,37 weeks) 1.00 (ref.) 1.40 (0.67–2.93) 1.83 (0.70–4.79) 0.89 (0.56–1.42)
Crude
Adjusteda 1.00 (ref.) 1.38 (0.66–2.85) 1.94 (0.70–5.38) 1.02 (0.60–1.74)
Twin children
LBW (,2500 g) 1.00 (ref.) 1.01 (0.69–1.47) 1.06 (0.72–1.58) 0.96 (0.68–1.37)
Crude
Adjusteda 1.00 (ref.) 1.06 (0.71–1.59) 1.16 (0.75–1.79) 1.20 (0.77–1.89)
PTB (,37 weeks) 1.00 (ref.) 0.85 (0.59–1.21) 0.70 (0.52–0.95) 0.64 (0.49–0.83)
Crude
Adjusteda 1.00 (ref.) 0.86 (0.59–1.26) 0.87 (0.59–1.26) 0.84 (0.58–1.20)
The values are OR (95% CI). Binomial regression with adjustment for dependence between twins was done using the robust variance estimation. LBW, low birthweight; PTB, pretermbirth.aAdjusted for mothers’ age (,30, 30–34, 35–39 and 40+ years), sex, birth year (1995–1997, 1998–2000,2001–2003, 2004–2009) and parity (1,2+).
Neonatal outcome and malformations in TESA/PESA children 235
at Universitaets- und L
andesbibliothek Duesseldorf on Septem
ber 19, 2013http://hum
rep.oxfordjournals.org/D
ownloaded from

minor malformations. Major congenital malformations have beendefined as malformations causing functional impairment or requiringsurgical correction, while remaining malformations are considered‘minor’ (Fedder et al., 2007). In a recent study, Belva et al. (2011)found the rate of major malformations in 724 children conceived byICSI with epididymal or testicular sperm (4.8%) non-significantlyincreased compared with 2516 children conceived by ICSI with ejacu-lated sperm (3.4%). In a questionnaire study, Woldringh et al. (2011)found that 3.6% of 370 children conceived by ICSI with epididymalsperm had major malformations. This rate did not differ significantlyfrom major malformation rates in children conceived by IVF or ICSIwith ejaculated sperm. In a systematic review including five smallerstudies, the 95% confidence interval (CI) of major malformationsafter ICSI with epididymal (2.0–4.3) and testicular sperm (0.0–9.2)was comparable to IVF (1.7–3.8) or ICSI with ejaculated sperm(1.9–8.4)(Woldringh et al., 2010). These results all correspond toour findings.
Perhaps the ‘definite health condition’ was better described by thecalculation of the rate of malformations per live year. However, thismay over-correct the ‘error’ as most major malformations areexpected to be detected in early life. As a diagnostic tool echocardi-ography is only performed if cardiovascular symptoms are present.Whenever echocardiography is performed systematically duringfollow-up of a cohort, e.g. a cohort of children conceived by ICSI, ahigher incidence of cardiac malformations may be found, as alsoasymptomatic cases will be diagnosed (Lancaster et al., 1995). An ex-ception from this is undescended testicles, as the rate may increaseduring childhood due to re-ascending of the testicles (Fedder andBoesen, 1998).
In this study, the rate of undescended testicles seems directlyrelated to the severity of the infertility in the father. The associationbetween reduced semen quality, cryptorchidism and hypospadias iswell documented, and the most likely explanation hereto is thatfathers (with reduced semen quality) and their sons (with undescend-ed testicles or hypospadias) share the same susceptibility genes for re-productive dysfunction (Skakkebæk et al., 2001; Asklund et al., 2007).However, in the present study the rate of hypospadias was not signifi-cantly associated with the severity of male infertility.
Data from the MBR and the HDR were recorded similarly for bothstudy and control groups thereby allowing an identical methodology inorder to compare neonatal outcomes and congenital malformationrates for a follow-up period of at least one year. One of the major lim-itations in the present study is that we were unable to classify the TPTgroup according to testicular or epididymal sperm as these data werenot available in the IVF register. Previous studies have shown that theoutcome may differ after use of immature testicular sperm and agedepididymal sperm (Fedder et al., 2007; Woldringh et al., 2010). Theoptimal evaluation of outcomes after ICSI using epididymal or testicu-lar sperm should also take the aetiology of infertility into account. Innon-obstructive azoospermia (NOA), the sperm is always retrievedfrom testicular tissue. However, it is not sufficient to distinguishbetween obstructive azoospermia (OA) and NOA (as done by, e.g.Belva et al., 2011), since each of these conditions include a heteroge-neous group of diagnoses. Further OA may develop into NOA (due toimpaired sperm production), as sperm production decreases overtime due to the obstruction, e.g. vasectomy (Thomas, 1987).
....
....
....
....
....
....
....
....
....
....
....
....
....
....
...
....
....
....
....
....
....
....
....
....
....
....
....
....
....
....
....
....
....
....
....
....
....
....
....
....
....
....
....
....
....
....
....
....
....
....
....
....
....
....
....
....
....
....
....
....
....
....
....
....
....
....
....
....
....
....
....
....
....
....
....
....
....
..
Tab
leV
Tot
alra
tes
ofco
ngen
ital
abno
rmal
itie
san
dpo
ssib
leim
prin
ting
-rel
ated
dise
ases
afte
rIC
SI
wit
hep
idid
ymal
orte
stic
ular
sper
m(G
roup
A),
ICS
Iw
ith
ejac
ulat
edsp
erm
(Gro
upB
),co
nven
tion
alIV
F(G
roup
C)
orN
C(G
roup
D).
Gro
upA
Gro
upB
Gro
upC
Gro
upD
P-va
luea
Ave
rsus
BA
vers
usC
Ave
rsus
D
Tot
al Con
geni
tala
bnor
mal
ities
36,7
.73
(6.1
3–
10.3
2)85
0,9.
48(8
.83
–10
.13)
1468
,8.3
4(7
.90
–8.
79)
5140
,8.0
5(7
.81
–8.
29)
0.20
0.64
0.81
Neo
plas
ms
inbo
nes
and
join
tca
rtila
ge,i
nclu
ding
oste
osar
com
a3,
0.64
(0.0
1–
1.47
)11
,0.1
2(0
.05
–0.
20)
43,0
.24
(0.1
7–
0.32
)12
2,0.
19(0
.16
–0.
23)
0.39
0.58
0.49
Sing
leto
ns
Con
geni
tala
bnor
mal
ities
21,7
.24
(4.5
4–
10.8
6)46
7,7.
96(7
.28
–8.
68)
762,
6.89
(6.4
2–
7.38
)19
52,5
.77
(5.5
2–
6.02
)0.
740.
810.
31
Neo
plas
ms
inbo
nes
and
join
tca
rtila
ge,i
nclu
ding
oste
osar
com
a1,
0.34
(0.0
1–
1.91
)7,
0.12
(0.0
5–
0.25
)29
,0.2
6(0
.18
–0.
38)
59,0
.17
(0.1
3–
0.22
)0.
320.
540.
40
Tw
ins
Con
geni
tala
bnor
mal
ities
15,8
.52
(3.7
2–
13.3
3)38
3,12
.35
(11.
00–
13.7
0)70
6,10
.81
(9.9
3–
11.6
9)31
88,1
0.63
(10.
21–
11.0
4)0.
130.
360.
39
Neo
plas
ms
inbo
nes
and
join
tca
rtila
ge,i
nclu
ding
oste
osar
com
a2,
1.14
(0.0
9–
6.85
)4,
0.13
(0.0
1–
0.52
)14
,0.2
1(0
.10
–0.
33)
63,0
.21
(0.1
5–
0.27
)0.
030.
080.
04
The
valu
esar
en
%(9
5%C
I).a Si
ngle
tons
:Fis
her’
sex
actt
est.
Tw
ins:
bino
mia
lreg
ress
ion
with
adju
stm
entf
orde
pend
ence
betw
een
twin
sus
ing
the
robu
stva
rianc
ees
timat
ion
whe
nth
ere
wer
e10
orm
ore
even
tsin
each
grou
p,ot
herw
ise
Fish
er’s
exac
ttes
twith
Bonf
eron
i’sm
etho
dad
just
men
tfo
rde
pend
ence
betw
een
twin
s.T
heex
act
95%
CIs
for
rate
sw
ere
calc
ulat
edus
ing
the
F-di
strib
utio
n.
236 Fedder et al.
at Universitaets- und L
andesbibliothek Duesseldorf on Septem
ber 19, 2013http://hum
rep.oxfordjournals.org/D
ownloaded from

..........................................................
..........................................................................................................................................................................................................................................................
Table VI Congenital malformations in specific organ systems and chromosomal aberrations in children conceived by ICSI with epididymal or testicular sperm(Group A), ICSI with ejaculated sperm (Group B), conventional IVF (Group C) or NC (Group D).
Group A Group B Group C Group D P-valuea
A versus B A versus C A versus D
All children
Malformations in total 36, 7.73 (5.13–10.32) 850, 9.48 (8.83–10.13) 1468, 8.34 (7.90–8.79) 5140, 8.05 (7.81–8.29) 0.20 0.64 0.81
Nervous (Q00–07) 0, 0.00 (0.00–0.97) 25, 0.28 (0.17–0.39) 42, 0.24 (0.16–0.32) 146, 0.23 (0.19–0.27) 1.00 1.00 1.00
Eye, ear, face (Q10–18) 0, 0.00 (0.00–0.97) 26, 0.29 (0.18–0.40) 51, 0.29 (0.21–0.37) 160, 0.25 (0.21–0.29) 0.62 0.63 0.63
Cardiac (Q20–28) 8, 1.72 (0.75–3.77) 186, 2.07 (1.76–2.39) 379, 2.15 (1.92–2.39) 1234, 1.93 (1.81–2.05) 1.00 1.00 0.68
Respiratory (Q30–34) 1, 0.21 (0.01–1.46) 29, 0.32 (0.21–0.44) 39, 0.22 (0.15–0.29) 152, 0.24 (0.20–0.28) 1.00 0.60 0.56
Orofacial clefts (Q35–37) 0, 0.00 (0.00–0.97) 22, 0.25 (0.14–0.35) 34, 0.19 (0.13–0.26) 143, 0.22 (0.19–0.26) 1.00 1.00 1.00
The tongue (Q38) 1, 0.21 (0.01–1.46) 21, 0.23 (0.13–0.34) 39, 0.22 (0.15–0.29) 115, 0.18 (0.14–0.22) 1.00 0.60 0.49
Gastrointestinal (Q39–45) 3, 0.64 (0.06–1.89) 39, 0.43 (0.30–0.57) 78, 0.44 (0.35–0.54) 243, 0.38 (0.33–0.43) 1.00 1.00 1.00
Female genitalia (Q50–52) 0, 0.00 (0.00–1.81) 4, 0.09 (0.02–0.23) 7, 0.08 (0.04–0.21) 22, 0.07 (0.04–0.10) 1.00 1.00 1.00
Non-descended testicles (Q53) 3, 1.37 (0.35–4.87) 40, 0.92 (0.64–1.21) 58, 0.63 (0.47–0.79) 144, 0.44 (0.37–0.51) 0.21 0.08 0.04
Hypospadias (Q54) 3, 1.37 (0.14–4.02) 28, 0.65 (0.41–0.88) 56, 0.61 (0.45–0.76) 182, 0.56 (0.47–0.64) 0.28 0.27 0.22
Other penis abnormalities (Q55) 0, 0.00 (0.00–2.06) 5, 0.12 (0.03–0.29) 7, 0.08 (0.03–0.17) 10, 0.03 (0.01–0.05) 1.00 1.00 1.00
Intersexuality (Q56) 0, 0.00 (0.00–0.97) 2, 0.02 (0.00–0.07) 2, 0.01 (0.00–0.05) 1, 0.00 (0.00–0.01) 1.00 1.00 1.00
Urinary (Q60–64) 2, 0.43 (0.06–1.89) 40, 0.45 (0.30–0.59) 56, 0.32 (0.23–0.40) 195, 0.31 (0.26–0.35) 0.69 0.34 0.30
Musculoskeletal (Q65–79) 15, 3.22 (1.42–5.02) 443, 4.94 (4.45–5.43) 701, 3.98 (3.66–4.31) 2651, 4.15 (3.97–4.33) 0.07 0.41 0.31
Other (Q80–89) 3, 0.64 (0.06–1.89) 32, 0.36 (0.23–0.48) 73, 0.41 (0.32–0.51) 257, 0.40 (0.35–0.45) 0.65 0.67 0.68
Chromosomal aberrations (Q90–99) 1, 0.21 (0.01–1.46) 22, 0.25 (0.14–0.36) 29, 0.16 (0.10–0.22) 101, 0.16 (0.13–0.19) 0.61 0.46 0.46
Boys, singletons
Malformations in total 15, 10.87 (6.21–17.29) 254, 8.96 (7.94–10.07) 434, 7.44 (6.78–8.15) 1091, 6.24 (5.88–6.61) 0.45 0.14 0.03
Nervous (Q00–07) 0, 0.00 (0.00–2.64) 6, 0.21 (0.08–0.46) 9, 0.15 (0.07–0.29) 33, 0.19 (0.13–0.26) 1.00 1.00 1.00
Eye, ear, face (Q10–18) 0, 0.00 (0.00–2.64) 13, 0.46 (0.24–0.78) 17, 0.29 (0.17–0.47) 49, 0.28 (0.21–0.37) 1.00 1.00 1.00
Cardiac (Q20–28) 5, 3.62 (1.19–8.25) 49, 1.73 (1.28–2.28) 79, 1.36 (1.07–1.69) 184, 1.05 (0.91–1.21) 0.10 0.04 0.02
Respiratory (Q30–34) 1, 0.72 (0.02–3.97) 14, 0.49 (0.27–0.83) 18, 0.31 (0.18–0.49) 44, 0.25 (0.18–0.34) 0.51 0.36 0.30
Orofacial clefts (Q35–37) 0, 0.00 (0.00–2.64) 9, 0.32 (0.15–0.60) 13, 0.22 (0.12–0.38) 41, 0.23 (0.17–0.32) 1.00 1.00 1.00
The tongue (Q38) 0, 0.00 (0.00–2.64) 11, 0.39 (0.19–0.69) 22, 0.38 (0.24–0.57) 43, 0.25 (0.18–0.33) 1.00 1.00 1.00
Gastrointestinal (Q39–45) 1, 0.72 (0.02–3.97) 12, 0.42 (0.22–0.74) 28, 0.48 (0.32–0.69) 72, 0.41 (0.32–0.52) 0.46 0.49 0.44
Non-desended testicles (Q53) 2, 1.45 (0.18–5.14) 23, 0.81 (0.52–1.22) 29, 0.50 (0.33–0.71) 66, 0.38 (0.29–0.48) 0.32 0.16 0.10
Hypospadias (Q54) 1, 0.72 (0.02–3.97) 17, 0.60 (0.35–0.96) 30, 0.51 (0.35–0.73) 76, 0.43 (0.34–0.54) 0.58 0.52 0.45
Other penis abnormalities (Q55) 0, 0.00 (0.00–2.64) 4, 0.14 (0.04–0.36) 5, 0.09 (0.03–0.20) 5, 0.03 (0.01–0.07) 1.00 1.00 1.00
Intersexuality (Q56) 0, 0.00 (0.00–2.64) 1, 0.04 (0.00–0.20) 1, 0.02 (0.00–0.10) 0, 0.00 (0.00–0.02) 1.00 1.00 NA
Urinary (Q60–64) 1, 0.72 (0.02–3.97) 18, 0.64 (0.38–1.00) 26, 0.45 (0.29–0.65) 66, 0.38 (0.29–0.48) 0.60 0.47 0.41
Musculoskeletal (Q65–79) 5, 3.62 (1.19–8.25) 110, 3.88 (3.20–4.66) 190, 3.26 (2.82–3.75) 457, 2.61 (2.38–2.86) 1.00 0.81 0.42
Other (Q80–89) 0, 0.00 (0.00–2.64) 17, 0.60 (0.35–0.96) 23, 0.39 (0.25–0.59) 63, 0.36 (0.28–0.46) 1.00 1.00 1.00
Chromosomal aberrations (Q90–99) 1, 0.72 (0.02–3.97) 8, 0.28 (0.12–0.56) 6, 0.10 (0.04–0.22) 28, 0.16 (0.11–0.23) 0.35 0.15 0.20
Continued
Neonataloutcom
eand
malform
ationsin
TESA
/PESAchildren
237
at Universitaets- und Landesbibliothek Duesseldorf on September 19, 2013 http://humrep.oxfordjournals.org/ Downloaded from

..........................................................
..........................................................................................................................................................................................................................................................
TableVI Continued
Group A Group B Group C Group D P-valuea
A versus B A versus C A versus D
Boys, twins
Malformations in total 9, 11.11 (3.12–26.17) 195, 12.96 (11.16–14.76) 390, 11.41 (10.26–12.57) 1734, 11.37 (10.80–11.94) 0.30 0.61 0.68
Nervous (Q00–07) 0, 0.00 (0.00–10.32) 4, 0.27 (0.06–1.01) 15, 0.44 (0.20–0.67) 54, 0.35 (0.25–0.45) 1.00 1.00 1.00
Eye, ear, face (Q10–18) 0, 0.00 (0.00–10.32) 7, 0.47 (0.10–1.37) 6, 0.18 (0.03–0.57) 42, 0.28 (0.18–0.37) 1.00 1.00 1.00
Cardiac (Q20–28) 0, 0.00 (0.00–10.32) 41, 2.72 (1.88–3.56) 104, 3.04 (2.42–3.67) 416, 2.73 (2.44–3.02) 1.00 1.00 1.00
Respiratory (Q30–34) 0, 0.00 (0.00–10.32) 6, 0.40 (0.07–1.30) 11, 0.32 (0.13–0.51) 54, 0.35 (0.26–0.45) 1.00 1.00 1.00
Orofacial clefts (Q35–37) 0, 0.00 (0.00–10.32) 5, 0.33 (0.04–1.18) 8, 0.23 (0.05–0.66) 53, 0.35 (0.25–0.45) 1.00 1.00 1.00
The tongue (Q38) 1, 1.23 (0.01–12.41) 5, 0.33 (0.11–0.77) 7, 0.20 (0.04–0.61) 42, 0.28 (0.18–0.37) 0.30 0.23 0.25
Gastrointestinal (Q39–45) 2, 2.47 (0.19–14.19) 4, 0.27 (0.02–1.08) 18, 0.53 (0.28–0.77) 79, 0.52 (0.40–0.64) 0.03 0.10 0.05
Non-desended testicles (Q53) 1, 1.23 (0.01–12.41) 17, 1.13 (0.60–1.66) 29, 0.85 (0.54–1.16) 78, 0.51 (0.40–0.63) 0.71 0.48 0.47
Hypospadias (Q54) 2, 2.47 (0.03–14.84) 11, 0.73 (0.30–1.16) 26, 0.76 (0.47–1.05) 106, 0.70 (0.55–0.84) 0.52 0.51 0.47
Other penis abnormalities (Q55) 0, 0.00 (0.00–10.32) 1, 0.07 (0.00–0.72) 2, 0.06 (0.00–0.36) 5, 0.03 (0.00–0.12) 1.00 1.00 1.00
Intersexuality (Q56) 0, 0.00 (0.00–10.32) 0, 0.00 (0.00–0.58) 0, 0.00 (0.00–0.26) 1, 0.01 (0.00–0.07) NA NA 1.00
Urinary (Q60–64) 0, 0.00 (0.00–10.32) 7, 0.47 (0.11–1.40) 15, 0.44 (0.20–0.67) 64, 0.42 (0.33–0.53) 1.00 1.00 1.00
Musculoskeletal (Q65–79) 3, 3.70 (0.21–16.63) 95, 6.31 (4.95–7.67) 181, 5.30 (4.44–6.15) 875, 5.74 (5.31–6.17) 0.70 1.00 1.00
Other (Q80–89) 0, 0.00 (0.00–10.32) 4, 0.27 (0.02–1.08) 12, 0.35 (0.15–0.55) 60, 0.39 (0.29–0.50) 1.00 1.00 1.00
Chromosomal aberrations (Q90–99) 0, 0.00 (0.00–10.32) 5, 0.33 (0.04–1.19) 6, 0.18 (0.03–0.57) 18, 0.12 (0.06–0.17) 1.00 1.00 1.00
Girls, singletons
Malformations in total 6, 3.95 (1.46–8.39) 213, 7.03 (6.14–7.99) 328, 6.29 (5.64–6.98) 861, 5.27 (4.93–5.62) 0.19 0.31 0.58
Nervous (Q00–07) 0, 0.00 (0.00–2.40) 7, 0.23 (0.09–0.48) 5, 0.10 (0.03–0.22) 24, 0.15 (0.09–0.22) 1.00 1.00 1.00
Eye, ear, face (Q10–18) 0, 0.00 (0.00–2.40) 4, 0.13 (0.04–0.34) 20, 0.38 (0.23–0.59) 43, 0.26 (0.19–0.35) 1.00 1.00 1.00
Cardiac (Q20–28) 1, 0.66 (0.02–3.61) 41, 1.35 (0.97–1.83) 76, 1.46 (1.15–1.82) 172, 1.05 (0.90–1.22) 0.72 0.73 1.00
Respiratory (Q30–34) 0, 0.00 (0.00–2.40) 7, 0.23 (0.09–0.48) 8, 0.15 (0.07–0.30) 25, 0.15 (0.10–0.23) 1.00 1.00 1.00
Orofacial clefts (Q35–37) 0, 0.00 (0.00–2.40) 5, 0.16 (0.05–0.38) 7, 0.13 (0.05–0.28) 27, 0.17 (0.11–0.24) 1.00 1.00 1.00
The tongue (Q38) 0, 0.00 (0.00–2.40) 4, 0.13 (0.04–0.34) 8, 0.15 (0.07–0.30) 13, 0.08 (0.04–0.14) 1.00 1.00 1.00
Gastrointestinal (Q39–45) 0, 0.00 (0.00–2.40) 13, 0.43 (0.23–0.73) 22, 0.42 (0.26–0.64) 46, 0.28 (0.21–0.38) 1.00 1.00 1.00
Female genitalia (Q50–52) 0, 0.00 (0.00–2.40) 3, 0.10 (0.02–0.29) 6, 0.12 (0.04–0.25) 10, 0.06 (0.03–0.11) 1.00 1.00 1.00
Intersexuality (Q56) 0, 0.00 (0.00–2.40) 0, 0.00 (0.00–0.12) 1, 0.02 (0.00–0.11) 0, 0.00 (0.00–0.02) NA 1.00 NA
Urinary (Q60–64) 1, 0.66 (0.02–3.61) 10, 0.33 (0.16–0.61) 10, 0.19 (0.09–0.35) 22, 0.13 (0.08–0.20) 0.42 0.27 0.19
Musculoskeletal (Q65–79) 4, 2.63 (0.72–6.60) 121, 3.99 (3.32–4.75) 176, 3.37 (2.90–3.90) 496, 3.03 (2.78–3.31) 0.52 0.82 1.00
Other (Q80–89) 2, 1.32 (0.16–4.67) 5, 0.16 (0.05–0.38) 17, 0.33 (0.19–0.52) 78, 0.48 (0.38–0.60) 0.04 0.10 0.17
Chromosomal aberrations (Q90–99) 0, 0.00 (0.00–2.40) 6, 0.20 (0.07–0.43) 11, 0.21 (0.11–0.38) 22, 0.13 (0.08–0.20) 1.00 1.00 1.00
Girls, twins
Malformations in total 6, 6.32 (1.07–18.90) 188, 11.79 (10.04–13.54) 316, 10.19 (9.02–11.36) 1454, 9.89 (9.34–10.44) 0.44 0.62 0.87
Nervous (Q00–07) 0, 0.00 (0.00–8.86) 8, 0.50 (0.13–1.41) 13, 0.42 (0.19–0.65) 35, 0.24 (0.15–0.32) 1.00 1.00 1.00
Eye, ear, face (Q10–18) 0, 0.00 (0.00–8.86) 2, 0.13 (0.01–0.77) 8, 0.26 (0.06–0.72) 26, 0.18 (0.10–0.25) 1.00 1.00 1.00
238Fedder
etal.
at Universitaets- und Landesbibliothek Duesseldorf on September 19, 2013 http://humrep.oxfordjournals.org/ Downloaded from

Ideally all pregnancies, also miscarriages and induced abortions dueto congenital malformations or chromosomal abnormalities, should beincluded in the congenital malformation rate. Unfortunately this wasnot possible in the present study, as the majority of fertility clinicsdo not register all elective abortions and miscarriages. In a previousstudy ,10% of the Danish TPT couples treated from 2002 andrecorded with a delivery chose to have invasive prenatal diagnosticsin the pregnancy (Fedder et al., 2011). However, the majority had anuchal translucency examination performed.
The quality of data on congenital malformations in the Danish Na-tional Patient Register has been validated and found acceptable for epi-demiological research (Larsen et al., 2003). However, registry-basedstudies are encumbered with the risk of reporting or coding errorsor missing data due to insufficient coding. Methodological limitationsin studies based on register data have been described by Toppariet al. (2001), who suggested that two-thirds of hypospadias inDenmark remained unreported. Thus, the rates of hypospadias andundescended testicles might be underestimated. This possible ten-dency of underestimation is the same as for both study and controlgroups as Q-diagnoses were recorded similarly in all four groupsand may therefore not bias the results, although a Type II error mayoccur.
The low frequency of VLBW children in the TPT group may be dueto selection bias as inclusion in the TPT database was based on self-reported questionnaires from the parents. Although the non-responserate was only 2.5%, selection bias cannot be excluded as couples withvery preterm born children may be more reluctant to return thequestionnaire.
In this cohort study including �90 000 children we found no casesof Wilm’s tumour in any of the groups. This also applied to the clas-sical imprinting-related disorders such as Beckwith–Wiedemann syn-drome (BWS) and Angelman syndrome (AS), which has beendescribed to occur in 1:13 700 children and 1:16 000 children, re-spectively (Amor and Halliday, 2008). One explanation might bethat registration of such seldom occurring disorders, which only insome cases are caused by imprinting (BWS �65%, AS �3% andPrader-Willi syndrome (PWS) ,1%) are incomplete. Lidegaardet al. (2005) detected, in another population-based Danish registerstudy, only three cases with PWS (suggested frequency 1:17 500according to Amor and Halliday, 2008) out of 448 401 ART andcontrol children. Another explanation is that PWS and AS cannotbe diagnosed until a certain age of the child and that our follow-upperiod is too short to recognize the few cases with these rare syn-dromes. Meanwhile, we found a significantly increased rate of neo-plasms in bones and joint cartilage in twin children, including anunknown number of osteoscarcomas in the TPT group. This findingmay be random due to multiple comparisons. Osteosarcoma is themost common primary bone malignancy and arises most commonlyin the metaphyseal region of long bones in adolescents and youngadults during growth. It has a complicated molecular pathogenesisand it only involves imprinting in 5% of cases (Broadhead et al., 2011).
In conclusion, this study shows that the sex ratio after ICSI with epi-didymal or testicular sperm was reduced compared with IVF but notcompared with ICSI with ejaculated sperm and NC. For singletons therate of LBW after TPT was increased compared with NC, but notcompared with IVF or ICSI. The overall rate of congenital malforma-tions was similar between the groups, but for TPT singleton boys
Car
diac
(Q20
–28
)2,
2.11
(0.0
3–
12.7
6)55
,3.4
5(2
.47
–4.
43)
120,
3.87
(3.1
2–
4.62
)46
2,3.
14(2
.82
–3.
46)
1.00
1.00
1.00
Res
pira
tory
(Q30
–34
)0,
0.00
(0.0
0–
8.86
)2,
0.13
(0.0
1–
0.79
)2,
0.06
(0.0
1–
0.40
)29
,0.2
0(0
.13
–0.
27)
1.00
1.00
1.00
Oro
faci
alcl
efts
(Q35
–37
)0,
0.00
(0.0
0–
8.86
)3,
0.19
(0.0
3–
0.87
)6,
0.19
(0.0
3–
0.63
)22
,0.1
5(0
.09
–0.
21)
1.00
1.00
1.00
The
tong
ue(Q
38)
0,0.
00(0
.00
–8.
86)
1,0.
06(0
.00
–0.
67)
2,0.
06(0
.01
–0.
41)
17,0
.12
(0.0
5–
0.18
)1.
001.
001.
00
Gas
troi
ntes
tinal
(Q39
–45
)0,
0.00
(0.0
0–
8.86
)10
,0.6
3(0
.17
–1.
59)
10,0
.32
(0.1
1–
0.82
)46
,0.3
1(0
.22
–0.
41)
1.00
1.00
1.00
Fem
ale
geni
talia
(Q50
–52
)0,
0.00
(0.0
0–
8.86
)1,
0.06
(0.0
0–
0.67
)1,
0.03
(0.0
0–
0.28
)12
,0.0
8(0
.03
–0.
13)
1.00
1.00
1.00
Inte
rsex
ualit
y(Q
56)
0,0.
00(0
.00
–8.
86)
1,0.
06(0
.00
–0.
67)
0,0.
00(0
.00
–0.
28)
0,0.
00(0
.00
–0.
06)
1.00
1.00
1.00
Urin
ary
(Q60
–64
)0,
0.00
(0.0
0–
8.86
)5,
0.31
(0.0
4–
1.12
)5,
0.16
(0.0
2–
0.57
)43
,0.2
9(0
.20
–0.
39)
1.00
1.00
1.00
Mus
culo
skel
etal
(Q65
–79
)3,
3.16
(0.1
8–
14.3
2)11
7,7.
34(5
.93
–8.
74)
154,
4.97
(4.1
2–
5.81
)82
3,5.
60(5
.16
–6.
03)
0.72
1.00
1.00
Oth
er(Q
80–
89)
1,1.
05(0
.01
–10
.68)
6,0.
38(0
.06
–1.
22)
21,0
.68
(0.3
9–
0.97
)56
,0.3
8(0
.27
–0.
49)
0.33
0.68
0.36
Chr
omos
omal
aber
ratio
ns(Q
90–
99)
0,0.
00(0
.00
–8.
86)
3,0.
19(0
.01
–0.
91)
6,0.
19(0
.03
–0.
63)
33,0
.22
(0.1
5–
0.30
)1.
001.
001.
00
Tre
atm
ents
with
froz
en–
thaw
edem
bryo
sha
vebe
enex
clud
ed.T
heva
lues
are
n%
(95%
CI).
a Sing
leto
ns:F
ishe
r’s
exac
ttes
t.T
win
s:bi
nom
ialr
egre
ssio
nw
ithad
just
men
tfor
depe
nden
cebe
twee
ntw
ins
usin
gth
ero
bust
varia
nce
estim
atio
nw
hen
ther
ew
ere
10or
mor
eev
ents
inea
chgr
oup,
othe
rwis
eFi
sher
’sex
actt
estw
ithBo
nfer
oni’s
met
hod
adju
stm
ent
for
depe
nden
cebe
twee
ntw
ins.
The
exac
t95
%C
Isfo
rra
tes
wer
eca
lcul
ated
usin
gth
eF-
dist
ribut
ion.
NA
,not
appl
icab
le.
Neonatal outcome and malformations in TESA/PESA children 239
at Universitaets- und L
andesbibliothek Duesseldorf on Septem
ber 19, 2013http://hum
rep.oxfordjournals.org/D
ownloaded from
the rate of congenital cardiac malformations was increased comparedwith NC and conventional IVF, and for singleton as well as twin boysthe rate of undescended testicles increased with the severity of maleinfertility. These data are reassuring, but larger TPT populations arestill needed to confirm our results.
Authors’ rolesJ.F., A.L. and A.P. had the idea and designed this study. J.F. was themain author. All the authors contributed to the acquisition and analysisof the data and critically revised the manuscript.
FundingThis study is funded by the Laboratory of Reproductive Biology, Scien-tific Unit, Horsens Hospital.
Conflict of interestNone declared.
ReferencesAmor DJ, Halliday J. A review of known imprinting syndromes and their
association with assisted reproduction technologies. Hum Reprod2008;23:2826–2834.
Asklund C, Jørgensen N, Skakkebæk NE, Jensen TK. Increased frequencyof reproductive health problems among fathers of boys withhypospadias. Hum Reprod 2007;22:2639–2646.
Belva F, De Schrijver F, Tournaye H, Liebaers I, Devroey P, Haentjens P,Bonduelle M. Neonatal outcome of 724 children born after ICSI usingnon-ejaculated sperm. Hum Reprod 2011;26:1752–1758.
Bonduelle M, Liebaers I, Deketelaere V, Derde M-P, Camus M, Devroey P,Van Steirteghem A. Neonatal data on a cohort of 2889 infants bornafter ICSI (1991–1999) and of 2995 infants born after IVF (1983–1999). Hum Reprod 2002;17:671–694.
Broadhead ML, Clark JCM, Myers DE, Dass CR, Choong PFM. Themolecular pathogenesis of osteosarcoma. A review 2011, Article ID959248, 12 pages.
Craft I, Bennett V, Nicholson N. Fertilizing ability of testicularspermatozoa. Lancet 1993;342:864.
Ericson A, Kallen B. Congenital malformations in infants born after IVF: apopulation-based study. Hum Reprod 2001;16:504–509.
Fedder J, Boesen M. Effect of a combined GnRH/hCG therapy in boyswith undescended testicles: evaluated in relation to testicular localizationwithin the first week after birth. Arch Androl 1998;40:181–186.
Fedder J, Gabrielsen A, Humaidan P, Erb K, Ernst E, Loft A. Malformationrate and sex ratio in 412 children conceived with epididymal or testicularsperm. Hum Reprod 2007;22:1080–1085.
Fedder J, Erb K, Humaidan P, Maigaard S, Gabrielsen A, Pedersen B,Kaspersen MD, Loft A. Prenatal diagnostics in TESA/PESApregnancies in Denmark 1995–2007: a shift from invasive procedures
to nuchal translucency examination. Syst Biol Reprod Med 2011;57:256–260.
Hansen M, Bower C, Milne E, de Klerk N, Kurinczuk JJ. Assistedreproductive technologies and the risk of birth defects—a systematicreview. Hum Reprod 2005;20:328–338.
Kallen B, Finnstrom O, Nygren KG, Olausson PO. In vitro fertilization (IVF)in Sweden: risk for congenital malformations after different IVF methods.Birth Defects Res (Part A) 2005;73:162–169.
Kallen B, Finnstrom O, Lindam A, Nilsson E, Nygren K-G, Otterblad PO.Congenital malformations in infants born after in vitro fertilization inSweden. Birth defects Res (Part A) 2010;88:137–143.
Lancaster P, Shafir E, Huang J. Assisted Conception Australia and NewZealand 1992 and 1993. Sydney: AIHW National Perinatal StatisticsUnit, 1995,1–71.
Larsen H, Nielsen GL, Bendsen J, Flint C, Olsen J, Sørensen HT. Predictivevalue and completeness of the registration of congenital abnormalities inthe three Danish population-based registries. Scand J Public Health 2003;31:12–16.
Lidegaard Ø, Pinborg A, Andersen AN. Imprinting diseases and IVF:Danish National IVF cohort study. Hum Reprod 2005;20:950–954.
Lie RT, Lyngstadaas A, Ørstavik KH, Bakketeig LS, Jacobsen G, Tanbo T..Birth defects in children conceived by ICSI compared with childrenconceived by other IVF-methods; a meta-analysis. Int J Epidemiol 2005;34:696–701.
Ludwig M, Diedrich K. Follow-up of children born after assistedreproductive technologies. Reprod BioMed Online 2002;5:317–322.
Ludwig M, Katalinic A. Malformation rate in fetuses and children conceivedafter ICSI: results of a prospective cohort study. Reprod BioMed Online2002;5:171–178.
Pinborg A, Loft A, Rasmussen S, Schmidt L, Langhoff-Roos J, Greisen G,Andersen AN. Neonatal outcome in a Danish national cohort of3438 IVF/ICSI and 10 362 non-IVF/ICSI twins born between 1995and 2000. Hum Reprod 2004;19:435–441.
Schoysman R, Vanderzwalmen P, Nijs M, Segal L, Segal-Bertin G, Geerts L,van Roosendaal E, Schoysman D. Pregnancy after fertilization withhuman testicular spermatozoa. Lancet 1993;342:1237.
Skakkebæk NE, Rajpert-De Meyts E, Main KM. Testicular dysgenesissyndrome: an increasingly common developmental disorder withenvironmental aspects. Hum Reprod 2001;16:972–978.
Thomas AJ. Vasoepididymostomy. Urol Clin North Am 1987;14:527–38.Toppari J, Kaleva M, Virtanen HE. Trends in the incidence of
cryptorchidism and hypospadias, and methodological limitations ofregistry-based data. Hum Reprod Update 2001;7:282–283.
Wennerholm U-B, Bergh C, Hamberger L, Lundin K, Nilsson L,Wikland M, Kallen B. Incidence of congenital malformations inchildren born after ICSI. Hum Reprod 2000;15:944–948.
Woldringh GH, Besselink DE, Tillema AHJ, Hendriks JCM, Kremer JAM.Karyotyping, congenital anomalies and follow-up of children afterintracytoplasmic sperm injection with non-ejaculated sperm: asystematic review. Hum Reprod Update 2010;16:12–19.
Woldringh GH, Horvers M, Janssen AJWM, Reuser JJCM, de Groot SAF,Steiner K, D’Hauwers KW, Wetzels AMM, Kremer JAM. Follow-up ofchildren born after ICSI with epididymal spermatozoa. Hum Reprod2011;26:1759–1767.
240 Fedder et al.
at Universitaets- und L
andesbibliothek Duesseldorf on Septem
ber 19, 2013http://hum
rep.oxfordjournals.org/D
ownloaded from


RBMOnline - Vol 15. No 1. 2007 38-44 Reproductive BioMedicine Online; www.rbmonline.com/Article/2808 on web 16 May 2007
38
© 2007 Published by Reproductive Healthcare Ltd, Duck End Farm, Dry Drayton, Cambridge CB3 8DB, UK
Dr Louise Brinton received training in epidemiology from the University of North Carolina at Chapel Hill (MPH, 1972) and The Johns Hopkins School of Hygiene and Public Health (PhD, 1979). She joined the NCI in 1976 and subsequently conducted post-doctoral research at Oxford University. She served as President of the Society for Epidemiologic Research in 1990, and has received the PHS Special Recognition Award and the NIH Director’s Award for innovative leadership in women’s health research. She currently serves as Chief of the Hormonal and Reproductive Epidemiology Branch of the National Cancer Institute.
Dr Louise Brinton
Hormonal and Reproductive Epidemiology Branch, National Cancer Institute, 6120 Executive Blvd., Suite 550, Room 5018, Rockville, MD 20852–7234, USACorrespondence: Fax: +13014020916; e-mail: [email protected]
Abstract
Although nulliparity has been extensively related to the risk of ovarian, breast and endometrial cancers, with many studies showing the relationship largely attributable to infertility, treatment effects on cancer risk are poorly understood. Two early studies raised substantial concern when ovulation-stimulating drugs were linked with large increases in ovarian cancer, supporting the notion of an important aetiological role of incessant ovulation. Subsequent studies have been mainly reassuring, although some have suggested possible risk increases among nulligravid women, those with extensive follow-up, and those developing borderline tumours. Results regarding effects of fertility drugs on breast cancer risk are conflicting, with some showing no associations and others demonstrating possible risk increases, although for varying subgroups. In contrast, endometrial cancer results are more consistent, with two recent studies showing increased risks related to clomiphene usage. This is of interest given that clomiphene is structurally similar to tamoxifen, a drug extensively linked with this cancer. Given the recent marketing of fertility drugs and the fact that exposed women are only beginning to reach the cancer age range, further follow-up is necessary. This will also be important to fully resolve effects of exposures such as gonadotrophins, used more recently in conjunction with IVF.
Keywords: cancer, epidemiology, fertility drugs, infertility, ovulation stimulation, risk
It is well established that nulliparity is a risk factor for ovarian, breast and endometrial cancers, with many studies suggesting that the association is largely attributable to infertility. Despite the extensive literature on the topic, causes of infertility and treatment effects on cancer risk are poorly understood.
Increasingly, women are delaying their first childbirth, resulting in many more women seeking advice for infertility. In fact, it is estimated that, by the year 2025, between 5.4–7.7 million women aged 15–44 will be diagnosed in the USA with some form of infertility (Stephen and Chandra, 1998). Consequentially, ovulation-stimulating drugs are among the fastest growing groups of drugs, with prescriptions in the USA nearly doubling between 1973 and 1991 (Wysowski, 1993).
The two most commonly used medications, clomiphene citrate and gonadotrophins, are effective at stimulating ovulation, a
factor implicated in the aetiology of both breast and ovarian cancers (Fathalla, 1971; Henderson et al., 1985). These drugs also raise both oestradiol and progesterone concentrations (Sovino et al., 2002), hormones which are recognized as affecting the development and growth of breast and gynaecological cancers. Finally, as elaborated below, some clinical and epidemiological studies have linked usage of these drugs with an increased incidence of various cancers.
Ovarian cancer
Numerous clinical reports have raised concern about a potential link between use of ovulation-stimulating drugs and ovarian cancer risk (Fishel and Jackson, 1989; Dietl, 1991; Goldberg and Runowicz, 1992; Nijman et al., 1992; Balasch et al., 1993; Lopes and Mensier, 1993; Willemsen et al., 1993; Adewole et al.,
Outlook
Long-term effects of ovulation-stimulating drugs on cancer risk
Introduction

1997; Unkila-Kallio et al., 1997). The association has biological credibility, given that ‘incessant ovulation’ and associated alterations in endogenous hormones during reproductive years are plausible explanations for several factors that alter ovarian cancer risk, including nulliparity and oral contraceptive use (Fathalla, 1971; Cramer and Welch, 1983; Whittemore et al., 1992a). Results from two epidemiological studies that found marked elevations in ovarian cancer risk associated with exposure to ovulation-stimulating drugs (Whittemore et al., 1992b; Rossing et al., 1994) provide additional support for this hypothesis.
The earliest evidence of such a link derived from a meta-analysis of 12 case–control studies of ovarian cancer conducted by Whittemore and coworkers (Whittemore et al., 1992b). Only three of these studies, with 526 cases and 966 controls, provided information regarding the use of fertility drugs and there was scant information about the type of drug or the extent of its use. Self-reported prior usage of fertility medications was associated with an odds ratio (OR) of 2.8 (95% CI 1.3–6.1) as compared with women who had no history of infertility. The increased risk was limited to nulligravid women, who experienced a 27-fold increase in risk associated with drug usage (95% CI 2.3–315.6). However, this risk was based on only 12 exposed cases and one exposed control.
Results from a retrospective cohort study involving 3837 women evaluated for infertility in a single Seattle practice between 1974 and 1985 also raised concern (Rossing et al., 1994). More details on this and other completed cohort studies are shown in Table 1. Information on drug exposures and indications for usage was collected from medical records, and outcome information was obtained via linkage against a regional cancer registry. Effects of other risk factors were evaluated by abstracting information from medical records for all ovarian cancer cases and a subcohort sample of 135 women. Using appropriate case–
cohort analytic techniques, they estimated that clomiphene use was associated with an adjusted 2.3-fold increased risk (95% CI 0.5–11.4), based on nine ovarian cancers.
Use of clomiphene for less than 1 year was not associated with an increased risk, but five of the nine women with cancer had taken the drug for 12 or more monthly cycles, resulting in a relative risk of 11.1 (95% CI 1.5–82.3). An enhanced risk associated with long-term treatment was observed in both those with and without ovulatory abnormalities. A large proportion of the observed tumours were borderline (five of the 11 in the cohort).
Although the results of these two initial studies were alarming, subsequent results from a number of case–control studies were largely reassuring (Franceschi et al., 1994; Mosgaard et al., 1997; Parazzini et al., 1997). A meta-analysis of eight studies involving data on 1060 cases and 1337 controls (Ness et al., 2002) also showed no risk associations with fertility drug use. In this study, after adjustment for types of infertility, the risk associated with drug usage was somewhat higher among nulligravid women (1.8) and among those who had more than 4 months of exposure (relative risk (RR) 1.5–1.7), but none of these risks was statistically significant.
The results of case control studies are limited by the fact that information on prior drug use is based on patient histories. Most have been further limited by small numbers of ovarian cancer cases reporting prior drug usage. For example, in the largest case–control study (Parazzini et al., 2001), based on 1031 cases and 2411 hospital controls, only 1.1–1.5% of the subjects reported prior usage of fertility drugs, resulting in only 15 cases and 26 controls with relevant exposures for analysis.
Although results have also been published from additional cohort studies (Ron et al., 1987; Shushan et al., 1996; Modan
39
Outlook - Ovulation-stimulating drugs and cancer risk - L Brinton
RBMOnline®
Table 1. Major cohorts reporting associations between fertility drugs and cancer risk. Location Reference No. of Years evaluated Average years Type of cancer subjects of follow-up Ovarian Breast Endometrial
Israel Ron et al., 1987 2575 1964–1974 12.3 4 15 5USA Rossing et al., 1994, 1996 3837 1974–1985 12.3 11 – –Australia Venn et al., 1995 10,358 1978–1992 6.5 6 34 5Israel Modan et al., 1998 2496 1964–1974 21.4 12 59 21 (Tel Hashomer)Israel Potashnik et al., 1999 1197 1960–1984 17.9 2 20 2 (Beer-Sheba)Australia Venn et al., 1999 29,666 Pre-1994 8.5 13 143 12USA Croughan-Minihane 51,371 1965–1998 5.6 50 – – et al., 2001The Netherlands Klip et al., 2002 25,152 1980–1995 5.6 17 116 14UK Doyle et al., 2002 5556 1975–1989 7.9 6 55 4Israel (Tel Aviv) Dor et al., 2002 5026 1981–1992 3.6 1 11 2Israel (Tel Aviv) Lerner-Geva et al., 2003 1082 1984–1992 6.5 3 5 USA Althuis et al., 2005 12,193 1965–1988 18.8 45 292 39 Brinton et al., 2004a,c

Outlook - Ovulation-stimulating drugs and cancer risk - L Brinton
et al., 1998; Potashnik et al., 1999; Dor et al., 2002; Doyle et al., 2002; Klip et al., 2002), most have involved small numbers of ovarian cancers, with the number of exposed cases ranging from two in the smallest study (Potashnik et al., 1999) to 12 in the largest study (Modan et al., 1998). These studies were also limited by lack of information on causes of infertility or on other factors that could independently influence ovarian cancer risk (including parity, oral contraceptive usage and socioeconomic status).
One of the most recently published studies was designed to overcome many of the limitations of previous studies (Brinton et al., 2004a). This retrospective cohort study followed 12,193 infertile women for a median of 18.8 years, and had detailed information on drug exposures and causes of infertility from medical records as well as questionnaire data on potential cancer risk factors for a substantial proportion of the patients. This study was unique in being able to identify subjects who underwent a bilateral oophorectomy and were thus no longer at risk for developing ovarian cancer. The number of ovarian cancers, 45, was larger than in other cohort studies, but this number was still too limited for analyses of small subgroups of women. The results were largely reassuring, showing no increase in risk associated with ever using either clomiphene or gonadotrophins. There were non-significant increases in risk (RR 1.5–2.5) associated with use of either clomiphene or gonadotrophins among the subjects followed for the longest periods of time (15 years or more).
While this study focused on women exposed to ovulation-stimulating agents prescribed during earlier times, a number of other studies have concentrated on exposures received during IVF. One other US study, published to date only in abstract form, found no evidence for an effect of ovulation-stimulating drugs on ovarian cancer risk. After 5.6 years of follow-up of 51,371 patients seen for conception or ovum donation in 15 California clinics, 50 ovarian cancers were diagnosed (Croughan-Minihane et al., 2001). The only significant associations with ovarian tumour risk observed in the study were with length of time in infertility treatment and nulligravidity. However, no associations of risk were found for ovulation-stimulating drugs and risk, even when dose, formulation and number of treatment cycles were considered.
Among 29,666 women referred to 10 Australian IVF clinics, 13 ovarian cancers were observed during a follow-up period averaging 7.8 years (Venn et al., 1999). The investigators had detailed information on indications for drug usage, but only limited information on patient characteristics. Comparing risks to the general population, the standardized incidence ratio (SIR) was 0.99, with no higher risk for the women who received at least one IVF treatment cycle (0.88) as compared with those who received no drug treatment (1.16). Women with unexplained infertility were at a significantly increased risk compared with the general population, but within this subgroup there was no difference in risk between treated and untreated women.
In a cohort of 25,152 women treated for subfertility in the Netherlands, 17 ovarian cancers developed during 5.6 years of follow-up (Klip et al., 2002). Strengths of this study included detailed information on causes of infertility and drug exposures from medical records, as well as on cancer risk predictors obtained through completed questionnaires from many of
the study subjects. Thus, the study was able to assess risks associated with different parameters of drug exposures, while adjusting for other risk factors. Results showed no difference in risk between treated and untreated subjects, even when the number of cycles or ampoules received were considered.
While the results of the most recent studies are consistently reassuring when compared with the results of earlier studies, several observations indicate a need for further monitoring. These include the findings in the two most recent studies (Ness et al., 2002; Brinton et al., 2004a) of modest increases in risk estimates with either extended follow-up or increased exposure to ovulation-stimulating drugs. Given that these ovulation-stimulating drugs first became available beginning in the early 1960s, women who were exposed to them are just beginning to enter the ovarian cancer age range. Furthermore, less information is available on gonadotrophins than clomiphene, given that the latter was the drug of choice in earlier time periods. Thus, additional follow-up data are needed to fully evaluate effects of both exposures.
In addition, two recent investigations (Ness et al., 2002; Brinton et al., 2004a) and Whittemore’s early meta-analysis (Whittemore et al., 1992b) found drug effects to be greatest among nulligravid women, suggesting the possibility of an enhanced effect of the medications among women with certain indications for usage.
That ovulation-stimulating drugs might preferentially affect the risk of borderline ovarian tumours is also suggested by several studies. Both cohort (Rossing et al., 1994; Shushan et al., 1996) and case–control (Parazzini et al., 1998; Ness et al., 2002) investigations have shown risk ratios in the range of 3–4 associated with fertility drug usage. In one study, the relationship was restricted to nulligravid women (Ness et al., 2002) and in another specifically to gonadotrophins (Shushan et al., 1996). These findings, in conjunction with case reports of ovarian neoplasms developing in women during or shortly after treatment with ovulation-stimulating agents (Dietl, 1991; Goldberg and Runowicz, 1992; Nijman et al., 1992; Willemsen et al., 1993; Hull et al., 1996; Adewole et al., 1997; Bayar et al., 2006), have led to speculations that ovarian stimulation may induce growth in existing highly differentiated indolent tumours. Alternatively, the findings simply could reflect more intensive medical surveillance among infertile women.
Breast cancer
The epidemiology of breast cancer has been extensively studied, with many investigations supporting the notion of an important aetiological role for endogenous as well as exogenous hormones (Bernstein, 2002). Specific concerns regarding the effects of fertility drugs have been raised by the recognized effects on breast cancer risk of ovulation and hormonal patterns (Henderson et al., 1985; Parazzini et al., 1993). Furthermore, there are a number of clinical reports of breast cancer occurring among users of such drugs (Arbour et al., 1994; Brzezinski et al., 1994; Jourdain et al., 1996; Unkila-Kallio et al., 1997).
Many cohort (Ron et al., 1987; Venn et al., 1995; Modan et al., 1998; Venn et al., 1999; Doyle et al., 2002; Klip et al., 40
RBMOnline®
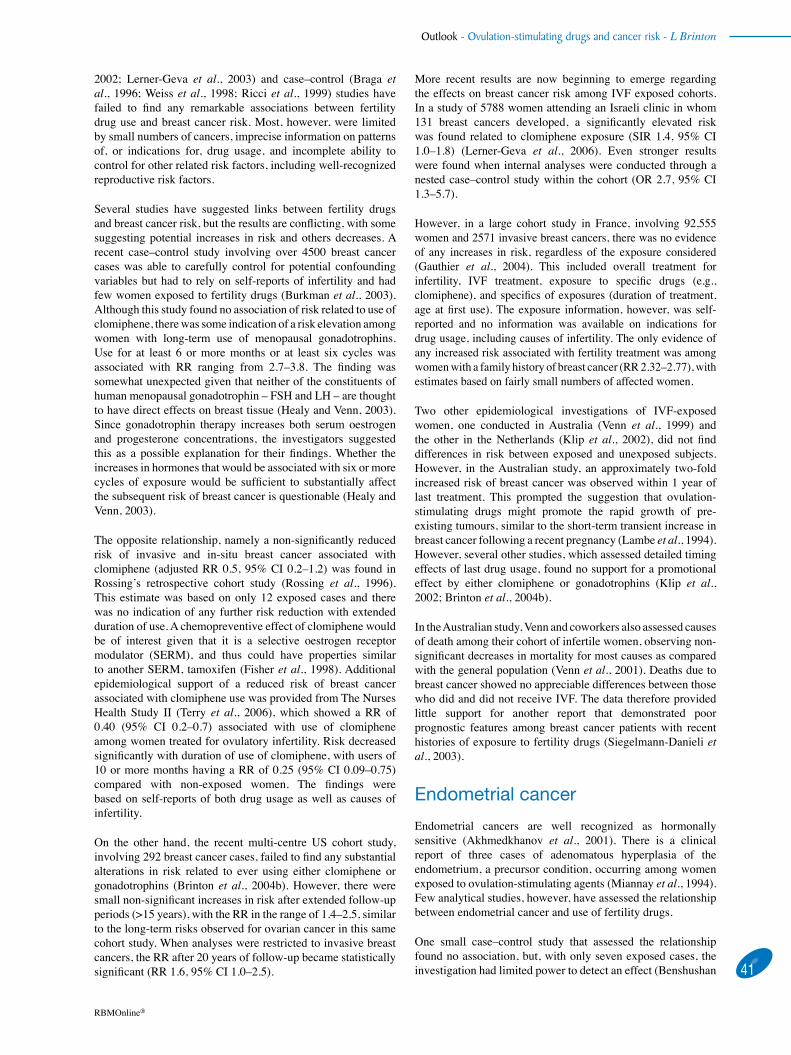
2002; Lerner-Geva et al., 2003) and case–control (Braga et al., 1996; Weiss et al., 1998; Ricci et al., 1999) studies have failed to find any remarkable associations between fertility drug use and breast cancer risk. Most, however, were limited by small numbers of cancers, imprecise information on patterns of, or indications for, drug usage, and incomplete ability to control for other related risk factors, including well-recognized reproductive risk factors.
Several studies have suggested links between fertility drugs and breast cancer risk, but the results are conflicting, with some suggesting potential increases in risk and others decreases. A recent case–control study involving over 4500 breast cancer cases was able to carefully control for potential confounding variables but had to rely on self-reports of infertility and had few women exposed to fertility drugs (Burkman et al., 2003). Although this study found no association of risk related to use of clomiphene, there was some indication of a risk elevation among women with long-term use of menopausal gonadotrophins. Use for at least 6 or more months or at least six cycles was associated with RR ranging from 2.7–3.8. The finding was somewhat unexpected given that neither of the constituents of human menopausal gonadotrophin – FSH and LH – are thought to have direct effects on breast tissue (Healy and Venn, 2003). Since gonadotrophin therapy increases both serum oestrogen and progesterone concentrations, the investigators suggested this as a possible explanation for their findings. Whether the increases in hormones that would be associated with six or more cycles of exposure would be sufficient to substantially affect the subsequent risk of breast cancer is questionable (Healy and Venn, 2003).
The opposite relationship, namely a non-significantly reduced risk of invasive and in-situ breast cancer associated with clomiphene (adjusted RR 0.5, 95% CI 0.2–1.2) was found in Rossing’s retrospective cohort study (Rossing et al., 1996). This estimate was based on only 12 exposed cases and there was no indication of any further risk reduction with extended duration of use. A chemopreventive effect of clomiphene would be of interest given that it is a selective oestrogen receptor modulator (SERM), and thus could have properties similar to another SERM, tamoxifen (Fisher et al., 1998). Additional epidemiological support of a reduced risk of breast cancer associated with clomiphene use was provided from The Nurses Health Study II (Terry et al., 2006), which showed a RR of 0.40 (95% CI 0.2–0.7) associated with use of clomiphene among women treated for ovulatory infertility. Risk decreased significantly with duration of use of clomiphene, with users of 10 or more months having a RR of 0.25 (95% CI 0.09–0.75) compared with non-exposed women. The findings were based on self-reports of both drug usage as well as causes of infertility.
On the other hand, the recent multi-centre US cohort study, involving 292 breast cancer cases, failed to find any substantial alterations in risk related to ever using either clomiphene or gonadotrophins (Brinton et al., 2004b). However, there were small non-significant increases in risk after extended follow-up periods (>15 years), with the RR in the range of 1.4–2.5, similar to the long-term risks observed for ovarian cancer in this same cohort study. When analyses were restricted to invasive breast cancers, the RR after 20 years of follow-up became statistically significant (RR 1.6, 95% CI 1.0–2.5).
More recent results are now beginning to emerge regarding the effects on breast cancer risk among IVF exposed cohorts. In a study of 5788 women attending an Israeli clinic in whom 131 breast cancers developed, a significantly elevated risk was found related to clomiphene exposure (SIR 1.4, 95% CI 1.0–1.8) (Lerner-Geva et al., 2006). Even stronger results were found when internal analyses were conducted through a nested case–control study within the cohort (OR 2.7, 95% CI 1.3–5.7).
However, in a large cohort study in France, involving 92,555 women and 2571 invasive breast cancers, there was no evidence of any increases in risk, regardless of the exposure considered (Gauthier et al., 2004). This included overall treatment for infertility, IVF treatment, exposure to specific drugs (e.g., clomiphene), and specifics of exposures (duration of treatment, age at first use). The exposure information, however, was self-reported and no information was available on indications for drug usage, including causes of infertility. The only evidence of any increased risk associated with fertility treatment was among women with a family history of breast cancer (RR 2.32–2.77), with estimates based on fairly small numbers of affected women.
Two other epidemiological investigations of IVF-exposed women, one conducted in Australia (Venn et al., 1999) and the other in the Netherlands (Klip et al., 2002), did not find differences in risk between exposed and unexposed subjects. However, in the Australian study, an approximately two-fold increased risk of breast cancer was observed within 1 year of last treatment. This prompted the suggestion that ovulation-stimulating drugs might promote the rapid growth of pre-existing tumours, similar to the short-term transient increase in breast cancer following a recent pregnancy (Lambe et al., 1994). However, several other studies, which assessed detailed timing effects of last drug usage, found no support for a promotional effect by either clomiphene or gonadotrophins (Klip et al., 2002; Brinton et al., 2004b).
In the Australian study, Venn and coworkers also assessed causes of death among their cohort of infertile women, observing non-significant decreases in mortality for most causes as compared with the general population (Venn et al., 2001). Deaths due to breast cancer showed no appreciable differences between those who did and did not receive IVF. The data therefore provided little support for another report that demonstrated poor prognostic features among breast cancer patients with recent histories of exposure to fertility drugs (Siegelmann-Danieli et al., 2003).
Endometrial cancer
Endometrial cancers are well recognized as hormonally sensitive (Akhmedkhanov et al., 2001). There is a clinical report of three cases of adenomatous hyperplasia of the endometrium, a precursor condition, occurring among women exposed to ovulation-stimulating agents (Miannay et al., 1994). Few analytical studies, however, have assessed the relationship between endometrial cancer and use of fertility drugs.
One small case–control study that assessed the relationship found no association, but, with only seven exposed cases, the investigation had limited power to detect an effect (Benshushan 41
Outlook - Ovulation-stimulating drugs and cancer risk - L Brinton
RBMOnline®

Outlook - Ovulation-stimulating drugs and cancer risk - L Brinton
et al., 2001). Most cohort studies have not observed an association, but the majority had follow-up times of less than 10 years and few associated cases of endometrial cancer (between two and 14) (Venn et al., 1995, 1999; Potashnik et al., 1999; Klip et al., 2002).
The two largest cohort studies both raise some concern regarding effects of ovulation-stimulating agents on the endometrium. In an Israeli cohort, in which 21 uterine cancers were diagnosed during an average of more than 20 years of follow-up, a significant two-fold increase in risk was associated with fertility drug usage (Modan et al., 1998). Similarly, the multi-centre US cohort study, which detected 39 cases of endometrial cancer among cohort members, found clomiphene usage associated with a non-significant increase in risk (RR 1.8, 95% CI 0.9–3.3) (Althuis et al., 2005). Further, increases in risk were found among subjects with higher dosages of exposure or longer follow-up periods, with trends in risk for the latter variable being statistically significant. Drug effects were also more apparent among nulligravid and obese women (RR of 3.5 and 6.0, respectively).
Because tamoxifen, a SERM which bears structural similarities to clomiphene (Sovino et al., 2002), has been repeatedly linked with increases in endometrial cancer risk (Varras et al., 2003), these two studies raise concern despite the fact that they were based on fairly small numbers of cancers.
Future research needs
Given that clomiphene was first approved for clinical use in 1967 and gonadotrophins in 1969, the women who first used these drugs during their late twenties and early thirties have only recently reached the age when hormonally-related cancers are common. Most studies to date are reassuring in not showing a strong association between use of these medications and risks of most cancers. On the other hand, several studies have found increasing risks with greater exposures or extended follow-up, indicating that complacency is not warranted and that long-term effects should be further monitored, especially in view of changes in reproductive technology.
There has been little attention focused on the long-term effects of assisted reproductive technologies, which often involve much higher exposures to gonadotrophins than were received by women in previous eras. In addition, most IVF protocols include luteal phase support for several weeks with supplemental progestogens, which raises concern since these agents have been linked in several studies to increases in breast cancer risk (Key and Pike, 1988; Beral, 2003). Since in-vitro techniques have become common only in the last couple of decades, it may be some time before epidemiological studies can amass the follow-up times required to fully address long-term effects.
There is some consistency across studies of a modest enhancement of ovarian cancer risk associated with use of fertility drugs among women who remain nulligravid (Whittemore et al., 1992b; Ness et al., 2002; Brinton et al., 2004c). This may indicate an interactive effect of the drugs with the underlying causes of infertility, including those reflecting unique hormonal perturbations. On the other hand, it
may be that women who continue to remain infertile may have received larger doses and longer durations of fertility or other medications than other women.
There are other issues of interest that have not been widely pursued. First is the question of whether women at particularly high risk of cancer, including those with a genetic predisposition, experience unusual risks from the use of fertility medications. Secondly, it is of interest whether fertility drugs have unusual effects among women who have used other hormones. This includes oral contraceptives, which have been shown to be associated with reduced risks of endometrial and ovarian cancers (Deligeoroglou et al., 2003) and somewhat increased risks of breast cancers (CGHFBC, 1996), and menopausal hormone replacement therapy, which has been linked with increases in the risk of all three cancer sites (Akhmedkhanov et al., 2001; Lacey et al., 2002; Beral, 2003).
Some (Rossing et al., 1994; Shushan et al., 1996; Parazzini et al., 1998; Ness et al., 2002, Brinton et al., 2004a), although not all (Brinton et al., 2004a), studies suggest an unusual occurrence of borderline ovarian cancers among women exposed to fertility medications. Whether this reflects a biological effect or is merely the result of more intensive surveillance of women treated with these drugs by ultrasound and clinical examination warrants further scrutiny. Biologically, it is of interest that oestrogen receptor expression is a common feature of borderline ovarian tumours. Thus, further study of the relationship of fertility medications to ovarian, as well as breast cancers, according to hormone receptor status would appear warranted. In addition, investigations of cancer associations by tumour histologies should also be undertaken, given clinical reports of several unusual types of ovarian cancer (e.g., clear cell, germ cell, granulosa cell tumours) occurring among fertility drug users (Willemsen et al., 1993; Tewari et al., 1998; Makrydimas et al., 2003).
Although most attention has focused on effects of fertility drugs on ovarian cancer risk, more recent investigations support the need for further attention on breast and endometrial cancers. This need is supported by the recognition that ovulation-stimulating drugs are effective at increasing both oestrogen and progestin concentrations, alterations that have been linked with both of these cancers. Further, a relationship with breast cancer would parallel findings of an increased risk of this tumour among mothers exposed to diethylstilbestrol during pregnancy (Titus-Ernstoff et al., 2001). The preliminary findings regarding an increased risk of endometrial cancer following exposure to clomiphene, a drug closely related to tamoxifen, especially warrants further follow-up in well-designed epidemiological investigations.
References
Adewole IF, Babarinsa IA, Thomas JO et al. 1997 Ovarian cancer associated with ovulation induction: a case report. African Journal of Medicine and Medical Sciences 26, 203–204.
Akhmedkhanov A, Zeleniuch-Jacquotte A, Toniolo P 2001 Role of exogenous and endogenous hormones in endometrial cancer: review of the evidence and research perspectives. Annals of the New York Academy of Sciences 943, 296–315.
Althuis MD, Moghissi KS, Westhoff CL et al. 2005 Uterine cancer after use of clomiphene citrate to induce ovulation. American Journal of Epidemiology 161, 607–615.42
RBMOnline®

Arbour L, Narod S, Glendon G et al. 1994 In-vitro fertilisation and family history of breast cancer. Lancet 344, 610–611.
Balasch J, Pahisa J, Marquez M et al. 1993 Metastatic ovarian strumosis in an in-vitro fertilization patient. Human Reproduction 8, 2075–2077.
Bayar U, Demirtas E, Usubütün A et al. 2006 Case report: ovarian adenomyoma following gonadotropin treatment for infertility. Reproductive BioMedicine Online 13, 676–679.
Benshushan A, Paltiel O, Brzezinski A et al. 2001 Ovulation induction and risk of endometrial cancer: a pilot study. European Journal of Obstetrics, Gynecology, and Reproductive Biology 98, 53–57.
Beral V 2003 Breast cancer and hormone-replacement therapy in the Million Women Study. Lancet 362, 419–427.
Bernstein L 2002 Epidemiology of endocrine-related risk factors for breast cancer. Journal of Mammary Gland Biology and Neoplasia 7, 3–15.
Braga C, Negri E, La Vecchia C et al. 1996 Fertility treatment and risk of breast cancer. Human Reproduction 11, 300–303.
Brinton LA, Lamb EJ, Moghissi KS et al. 2004a Ovarian cancer risk after the use of ovulation-stimulating drugs. Obstetrics and Gynecology 103, 1194–1203.
Brinton LA, Scoccia B, Moghissi KS et al. 2004b Breast cancer risk associated with ovulation-stimulating drugs. Human Reproduction 19, 2005–2013.
Brinton LA, Lamb EJ, Moghissi KS et al. 2004c Ovarian cancer risk associated with varying causes of infertility. Fertility and Sterility 82, 405–414.
Brzezinski A, Peretz T, Mor-Yosef S et al. 1994 Ovarian stimulation and breast cancer: is there a link? Gynecologic Oncology 52, 292–295.
Burkman RT, Tang MT, Malone KE et al. 2003 Infertility drugs and the risk of breast cancer: findings from the National Institute of Child Health and Human Development Women’s Contraceptive and Reproductive Experiences Study. Fertility and Sterility 79, 844–851.
CGHFBC 1996 Breast cancer and hormonal contraceptives: collaborative reanalysis of individual data on 53 297 women with breast cancer and 100 239 women without breast cancer from 54 epidemiological studies. Collaborative Group on Hormonal Factors in Breast Cancer (CGHFBC). Lancet 347, 1713–1727.
Cramer DW, Welch WR 1983 Determinants of ovarian cancer risk. II. Inferences regarding pathogenesis. Journal of the National Cancer Institute 71, 717–721.
Croughan-Minihane M, Camarano L, Feigenbaum S et al. 2001 The risk of ovarian cancer associated with infertility and infertility treatments. Fertility and Sterility 76 (Suppl. 1), S68
Deligeoroglou E, Michailidis E, Creatsas G 2003 Oral contraceptives and reproductive system cancer. Annals of the New York Academy of Sciences 997, 199–208.
Dietl J 1991 Ovulation and ovarian cancer. Lancet 338, 445Dor J, Lerner-Geva L, Rabinovici J et al. 2002 Cancer incidence in
a cohort of infertile women who underwent in-vitro fertilization. Fertility and Sterility 77, 324–327.
Doyle P, Maconochie N, Beral V et al. 2002 Cancer incidence following treatment for infertility at a clinic in the UK. Human Reproduction 17, 2209–2213.
Fathalla MF 1971 Incessant ovulation – a factor in ovarian neoplasia? Lancet 2, 163.
Fishel S, Jackson P 1989 Follicular stimulation for high tech pregnancies: are we playing it safe? British Medical Journal 299, 309–311.
Fisher B, Costantino JP, Wickerham DL et al. 1998 Tamoxifen for prevention of breast cancer: report of the National Surgical Adjuvant Breast and Bowel Project P-1 Study. Journal of the National Cancer Institute 90, 1371–1388.
Franceschi S, La Vecchia C, Negri E et al. 1994 Fertility drugs and risk of epithelial ovarian cancer in Italy. Human Reproduction 9, 1673–1675.
Gauthier E, Paoletti X, Clavel-Chapelon F 2004 Breast cancer risk associated with being treated for infertility: results from the French E3N cohort study. Human Reproduction 19, 2216–2221.
Goldberg GL, Runowicz CD 1992 Ovarian carcinoma of low malignant potential, infertility, and induction of ovulation – is there a link? American Journal of Obstetrics and Gynecology 166, 853–854.
Healy DL, Venn A 2003 Infertility medications and the risk of breast cancer. Fertility and Sterility 79, 852–854.
Henderson BE, Ross RK, Judd HL et al. 1985 Do regular ovulatory cycles increase breast cancer risk? Cancer 56, 1206–1208.
Hull ME, Kriner M, Schneider E et al. 1996 Ovarian cancer after successful ovulation induction: a case report. Journal of Reproductive Medicine 41, 52–54.
Jourdain O, Avril A, Mauriac L et al. 1996 Breast cancer and in-vitro fertilization. About 32 cases. European Journal of Obstetrics, Gynecology, and Reproductive Biology 67, 47–52.
Key TJ, Pike MC 1988 The role of oestrogens and progestagens in the epidemiology and prevention of breast cancer. European Journal of Cancer and Clinical Oncology 24, 29–43.
Klip H, Burger C, van Leeuwen F et al. 2002 Risk of hormone-related cancers after ovarian stimulation for in-vitro fertilisation in a cohort of 25,152 women, PrintPartners Ipskamp BV, Enschede, the Netherlands. pp. 27
Lacey JV, Jr., Mink PJ, Lubin JH et al. 2002 Menopausal hormone replacement therapy and risk of ovarian cancer. JAMA 288, 334–341.
Lambe M, Hsieh C, Trichopoulos D et al. 1994 Transient increase in the risk of breast cancer after giving birth. New England Journal of Medicine 331, 5–9.
Lerner-Geva L, Keinan-Boker L, Blumstein T et al. 2006 Infertility, Ovulation Induction Treatments and the Incidence of Breast Cancer-a Historical Prospective Cohort of Israeli Women. Breast Cancer Research and Treatment 100, 201–212.
Lerner-Geva L, Geva E, Lessing JB et al. 2003 The possible association between in-vitro fertilization treatments and cancer development. International Journal of Gynecological Cancer 13, 23–27.
Lopes P, Mensier A 1993 Ovarian cancer and assisted reproductive technology. European Journal of Obstetrics, Gynecology, and Reproductive Biology 51, 171–173.
Makrydimas G, Sotiriadis A, Paraskevaidis E et al. 2003 Clear cell ovarian carcinoma in a pregnant woman with a history of infertility, endometriosis and unsuccessful IVF treatment. European Journal of Gynaecological Oncology 24, 438–441.
Miannay E, Boutemy JJ, Leroy-Billiard M et al. 1994 [The possible endometrial risk of ovarian stimulation. Apropos of 3 cases]. Journal de Gynecologie, Obstetrique et Biologie de la Reproduction 23, 35–38.
Modan B, Ron E, Lerner-Geva L et al. 1998 Cancer incidence in a cohort of infertile women. American Journal of Epidemiology 147, 1038–1042.
Mosgaard BJ, Lidegaard O, Kjaer SK et al. 1997 Infertility, fertility drugs, and invasive ovarian cancer: a case–control study. Fertility and Sterility 67, 1005–1012.
Ness RB, Cramer DW, Goodman MT et al. 2002 Infertility, fertility drugs, and ovarian cancer: a pooled analysis of case–control studies. American Journal of Epidemiology 155, 217–224.
Nijman HW, Burger CW, Baak JP et al. 1992 Borderline malignancy of the ovary and controlled hyperstimulation, a report of 2 cases. European Journal of Cancer 28A, 1971–1973.
Parazzini F, Pelucchi C, Negri E et al. 2001 Use of fertility drugs and risk of ovarian cancer. Human Reproduction 16, 1372–1375.
Parazzini F, Negri E, La Vecchia C et al. 1998 Treatment for fertility and risk of ovarian tumors of borderline malignancy. Gynecologic Oncology 68, 226–228.
Parazzini F, Negri E, La Vecchia C et al. 1997 Treatment for infertility and risk of invasive epithelial ovarian cancer. Human Reproduction 12, 2159–2161.
Parazzini F, La Vecchia C, Negri E et al. 1993 Lifelong menstrual pattern and risk of breast cancer. Oncology 50, 222–225.
Potashnik G, Lerner-Geva L, Genkin L et al. 1999 Fertility drugs and the risk of breast and ovarian cancers: results of a long-term follow-up study. Fertility and Sterility 71, 853–859. 43
Outlook - Ovulation-stimulating drugs and cancer risk - L Brinton
RBMOnline®

Outlook - Ovulation-stimulating drugs and cancer risk - L Brinton
Ricci E, Parazzini F, Negri E et al. 1999 Fertility drugs and the risk of breast cancer. Human Reproduction 14, 1653–1655.
Ron E, Lunenfeld B, Menczer J et al. 1987 Cancer incidence in a cohort of infertile women. American Journal of Epidemiology 125, 780–790.
Rossing MA, Daling JR, Weiss NS et al. 1996 Risk of breast cancer in a cohort in infertile women. Gynecologic Oncology 60, 3–7.
Rossing MA, Daling JR, Weiss NS et al. 1994 Ovarian tumors in a cohort of infertile women. New England Journal of Medicine 331, 771–776.
Shushan A, Paltiel O, Iscovich J et al. 1996 Human menopausal gonadotropin and the risk of epithelial ovarian cancer. Fertility and Sterility 65, 13–18.
Siegelmann-Danieli N, Tamir A, Zohar H et al. 2003 Breast cancer in women with recent exposure to fertility medications is associated with poor prognostic features. Annals of Surgical Oncology 10, 1031–1038.
Sovino H, Sir-Petermann T, Devoto L 2002 Clomiphene citrate and ovulation induction. Reproductive BioMedicine Online 4, 303–310.
Stephen EH, Chandra A 1998 Updated projections of infertility in the United States: 1995–2025. Fertility and Sterility 70, 30–34.
Terry KL, Willett WC, Rich-Edwards JW et al. 2006 A prospective study of infertility due to ovulatory disorders, ovulation induction, and incidence of breast cancer. Archives of Internal Medicine 166, 2484–2489.
Tewari K, Rose GS, Balderston KD et al. 1998 Fertility drugs and malignant germ-cell tumour of ovary in pregnancy. Lancet 351, 957–958.
Titus-Ernstoff L 2000 An overview of the epidemiology of cutaneous melanoma. Clinics in Plastic Surgery 27, 305–16, vii.
Unkila-Kallio L, Leminen A, Tiitnen A et al. 1997 Malignant tumors of the ovary or the breast in association with infertility: a report of thirteen cases. Acta Obstetricia et Gynecologica Scandinavica 76, 177–181.
Varras M, Polyzos D, Akrivis C 2003 Effects of tamoxifen on the human female genital tract: review of the literature. European Journal of Gynaecological Oncology 24, 258–268.
Venn A, Hemminki E, Watson L et al. 2001 Mortality in a cohort of IVF patients. Human Reproduction 16, 2691–2696.
Venn A, Watson L, Bruinsma F et al. 1999 Risk of cancer after use of fertility drugs with in-vitro fertilisation. Lancet 354, 1586–1590.
Venn A, Watson L, Lumley J et al. 1995 Breast and ovarian cancer incidence after infertility and in-vitro fertilisation. Lancet 346, 995–1000.
Weiss HA, Troisi R, Rossing MA et al. 1998 Fertility problems and breast cancer risk in young women: a case–control study in the United States. Cancer Causes and Control 9, 331–339.
Whittemore AS, Harris R, Itnyre J 1992a Characteristics relating to ovarian cancer risk: collaborative analysis of 12 US case–control studies. IV. The pathogenesis of epithelial ovarian cancer. Collaborative Ovarian Cancer Group. American Journal of Epidemiology 136, 1212–1220.
Whittemore AS, Harris R, Itnyre J 1992b Characteristics relating to ovarian cancer risk: collaborative analysis of 12 US case–control studies. II. Invasive epithelial ovarian cancers in white women. Collaborative Ovarian Cancer Group. American Journal of Epidemiology 136, 1184–1203.
Willemsen W, Kruitwagen R, Bastiaans B et al. 1993 Ovarian stimulation and granulosa-cell tumour. Lancet 341, 986–988.
Wysowski DK 1993 Use of fertility drugs in the United States, 1973 through 1991. Fertility and Sterility 60, 1096–1098.
Paper based on a contribution presented at the First World Congress on ‘Natural Cycle/Minimal Stimulation IVF’ in London, UK, December 15–16, 2006.
Received 27 February 2007; refereed 26 March 2007; accepted 25 April 2007.
44
RBMOnline®


Time to pregnancy: results of the German prospectivestudy and impact on the management of infertility
C.Gnoth1,4, D.Godehardt1, E.Godehardt2, P.Frank-Herrmann1,3 and G.Freundl1
1Department of Reproductive Medicine and Gynaecological Endocrinology, Staedtische Kliniken Duesseldorf gGmbH, Frauenklinik
Benrath and Institute of Natural Family Planning, Heinrich-Heine University of Duesseldorf, 2Biometric Research Group, Clinic for
Thoracic and Cardiovascular Surgery, Heinrich-Heine University of Duesseldorf and 3Department of Gynaecological Endocrinology,
University of Heidelberg, Germany
4To whom correspondence should be addressed at: Staedtische Kliniken Duesseldorf gGmbH, Frauenklinik Benrath, Urdenbacher
Allee 83, 40593 Duesseldorf, Germany. E-mail: [email protected]
BACKGROUND: The likelihood of spontaneous conception in subsequent cycles is important for a balanced man-
agement of infertility. Previous studies on time to pregnancy are mostly retrospective and biased because of exclu-
sion of truly infertile couples. The study aim was to present a non-parametric estimation of cumulative probabilities
of conception (CPC) in natural family planning (NFP) users illustrating an ideal of human fertility potential.
METHODS: A total of 346 women was observed who used NFP methods to conceive from their ®rst cycle onwards.
The couples practising NFP make optimal use of their fertility potential by timed intercourse. The CPC were esti-
mated for the total group and for couples who ®nally conceived by calculating Kaplan-Meier survival rates.
RESULTS: A total of 310 pregnancies occurred among the 346 women; the remaining 36 women (10.4%) did not
conceive. Estimated CPC for the total group (n = 340 women) at one, three, six and 12 cycle(s) were 38, 68, 81 and
92% respectively. For those who ®nally conceived (truly fertile couples, n = 304 women), the respective pregnancy
rates were 42, 75, 88 and 98% respectively. Although the numbers of couples in both groups were similar, the
impact of age on time to conception, as judged by the Wilcoxon test, was less in the truly fertile than in the total
group. CONCLUSIONS: Most couples conceive within six cycles with timed intercourse. Thereafter, every second
couple is probably either subfertile or infertile. CPC decline with age because heterogeneity in fecundity increases.
In the subgroup of truly fertile couples, an age-dependent decline in CPC is statistically less obvious because of high
homogeneity, even with advancing age.
Keywords: cumulative probability of conception/management of infertility/natural family planning/survival rates/time to pregnancy
Introduction
The likelihood of conception in subsequent cycles is of major
interest to clinicians and epidemiologists to measure human
fertility and to balance the management of infertility, thereby
avoiding over- and under-treatment. Recent literature contains
very little prospective data on time to pregnancy (TTP)
(Wilcox et al., 1988; Hilgers et al., 1992). One group examined
fertility rates and pregnancy wastage prospectively in 200
presumably fertile couples trying for pregnancy over 12
menstrual cycles (Zinaman et al., 1996). These authors
observed a maximal conception rate of ~30% per cycle and a
cumulative pregnancy rate of 82% after 12 menstrual cycles.
More recent studies (Juul et al., 1999; 2000; Jensen et al.,
2001) only recorded TTP retrospectively among pregnant
women using questionnaires to measure, for example, couple
fertility by assessing exposures related to semen quality, age or
environment. Although their observation of a 12-months
pregnancy rate of ~80% was similar to that reported by others
(e.g. Zinaman et al., 1996), their study design did not estimate
real fecundity, due mainly to the fact that infertile couples were
excluded (Jensen et al., 2000). Therefore, effects on the
proportion of truly infertile couples, which is of major
importance, cannot be assessed (Baird et al., 1986). Another
disadvantage is the possible inaccuracy because at long-term
recall, TTP may sometimes only be estimated roughly by
couples completing the questionnaire. It is known from cited
previous studies that most couples are likely to conceive early.
Therefore, for validity of data, the precise shift from contra-
ception to reproduction is very important. Although validation
studies of TTP recall exist (Joffe et al., 1993), some doubts
remain. Thus, prospective studies are urgently needed.
Reproductive behaviour in western society has changed
dramatically during the past two decades. Twenty years of
contraception may precede a ®rst pregnancy; therefore, age
effects on fertility are of extreme importance. An age-related
decline in the fertility of couples was previously documented
Human Reproduction Vol.18, No.9 pp. 1959±1966, 2003 DOI: 10.1093/humrep/deg366
Human Reproduction 18(9) ã European Society of Human Reproduction and Embryology 2003; all rights reserved 1959

for daily probabilities of conception (Dunson et al., 2002).
Much more appropriate and informative are the age effects on
couples' cumulative chances of conceiving.
In general, subfertility is de®ned as the inability to conceive
within 12 months of unprotected intercourse. Cumulative
pregnancy prospects over cycles with fertility-focused inter-
course may be better than the usual dichotomous, simpli®ed
de®nition of fertile-subfertile with a failure to become pregnant
during a 12-month period. The aim is to present a non-
parametric estimation of cumulative probabilities of concep-
tion (CPC) in natural family planning (NFP) users, thereby
illustrating an ideal of human fertility potential. These
cumulative pregnancy prospects will probably help to decide
whether suf®cient exposure to the chance of conception has
taken place, when to start a routine infertility investigation, and
how to avoid a premature resort to assisted-reproduction
techniques (ART) with their associated risks, especially in
patients unsuccessfully practising a method of NFP to achieve
a pregnancy.
For more than 15 years, a long-term prospective cohort study
on the use of NFP has been conducted in Germany (Freundl
et al., 1988; 1993; Frank-Herrmann et al., 1991; 1997). In
Germany the use of symptothermal is recommended which has
been proven to be the most ef®cient and reliable method of
NFP (The European Natural Family Planning Study Groups,
1993; 1999). The double-check variation of the STM consists
of recording the main symptoms of fertility: basal body
temperature (BBT) and cervical mucus pattern and the
application of calculation rules. The fertility awareness part
of the STM focuses mainly on cervical mucus monitoring,
which correlates very closely with rising estrogen levels and
onset of the fertile period. The peak day (last day of highly
fertile mucus) is a reliable indicator of very near-ovulation. The
BBT rise indicates the beginning of the luteal phase and the end
of the fertile period. This cycle monitoring by self-observation
allows reliable ovulation detection (Freundl et al., 1984; Gnoth
et al., 1996; Dunson et al., 1999) and location of the fertile
window within the cycle for either avoiding or achieving
pregnancy. Generally, recent fertility studies on users of NFP
(e.g. Colombo and Masarotto, 2000; Dunson et al., 2001;
2002), are based on a fairly ideal sample of upper-class couples
with high compliance and close follow-up by the study centre.
The participants of this study practising NFP to achieve a
pregnancy make optimal use of their fertility potential by
accurate detection of the fertile window in their menstrual
cycles and an above-average knowledge on reproductive basics
such as optimal time and interval of intercourse.
The present study estimates CPC over time for a cohort of
couples using NFP to conceive from their ®rst cycle onwards.
To the present authors' knowledge, this is the largest
prospective study conducted to date on CPC and time to
pregnancy in terms of participants and pregnancies.
Materials and methods
Data collection
The study was conducted in accordance with the principles of the
Declaration of Helsinki. All participating women were instructed by
experienced NFP teachers during the ®rst 3±6 months of study
participation until reliability in using the fertility awareness part of the
STM was reached. The couples entered this study voluntarily after
providing their informed consent. Several standardized questionnaires
were completed in order to record all relevant data concerning parity,
medical (especially obstetric) history, socioeconomic and demo-
graphic backgrounds and ®nallyÐwhen they ceased participationÐ
the reasons for dropping out. By the end of March 2001, a total of
31,498 NFP cycle charts from 1357 women using the STM had been
collected in the authors' database. This database (NFPDAT version
1.0) is based on Microsoft Accessâ (Gnoth et al., 1999), and
guarantees maximum data quality by utilizing more than 200 validated
error formulae and an automatic request for follow-up on participants,
at least every 3 months. Among all participants, there were 346
couples who switched from contraception [NFP or oral contraceptives
(~20%)] to reproduction using the STM for fertility-focused
intercourse. For only a few of the former users of oral contraceptives
(OC), the ®rst cycles using the STM were also their ®rst trying for
pregnancy, as most had initially avoided pregnancy with the STM.
The 346 women were observed from their ®rst cycle onwards in
which they tried to conceive. Pregnancy was assessed by either
ultrasound, positive pregnancy test or a luteal phase longer than 18
days. In both of the latter cases, only later-con®rmed clinical
pregnancies (live birth, ectopic implantation or clinical abortion)
were included in the analyses.
Inclusion and exclusion criteria
The use of NFP is not bound to a regular cycle pattern (Frank-
Herrmann et al., 1991), as it is often implicitly maintained. On the
contrary, women trying to conceive use the advantages of NFP for
fertility-focused intercourse (fertility awareness), especially in cases
of irregular cycles or after discontinuation of oral contraceptives
(Gnoth et al., 2002a).
During the early stages of the study, all women trying for pregnancy
with the help of the fertility awareness part of the STM were included.
Later before data were processed using the Statistical Analysis System
(SAS) package to ensure unbiased analyses, some couples with
previous fertility problems were also excluded in addition to those
women taking hormonal medication or drugs that might affect
fertility. One women requested fertility treatment during the course of
this study and was excluded thereafter. After cessation of OC, only
ovulatory cycles were included and any woman with more than three
subsequent anovulatory cycles was excluded. Some women re-entered
the study after breastfeeding or abortion. Hence, only women trying
for a ®rst pregnancy under the conditions of the study (which may not
be necessarily the ®rst pregnancy for the couple) were included in the
analysis. Prior to every cycle, the family planning intention had to be
indicated on the cycle sheet, and the women were asked to mark every
episode of intercourse on the cycle sheet. Only cycles with at least one
episode of unprotected intercourse in the fertile window were taken
into account. Cycles with exclusively protected or no intercourse in
the fertile phase were excluded. As all of the couples in this study had
intercourse on the fertile days in most cycles, any major effect of coital
pattern on estimation of cumulative probabilities of conception could
be excluded. Only 3% of the cycles had to be excluded because of
missing intercourse, or intercourse only outside the fertile window. In
three couples, there was a longer pause with absolutely no intercourse
up to 7 months, probably with an interim change in the family
planning intention which was unreported.
Six women among those who ®nally conceived [truly fertile (TF)
couples; see below] were completely excluded from the analysis of
cumulative probabilities of conception because some cycles were
completely missing and no information on episodes of intercourse
C.Gnoth et al.
1960

(exposure to pregnancy) was available, though a conception cycle was
submitted later which led to inaccurate TTP.
Statistical methods and analysis
Statistical analyses were performed using the SAS package, version 8.
On the basis of previous studies, the analysis was based on two a priori
hypotheses that pregnancy rates decline with age in all couples and in
TF couples. Hence, in addition to the usual exploratory analyses, t-
tests, c2-tests for categorical data, Wilcoxon test and Log-rank test for
conception probabilities based on Kaplan-Meier survival rates were
also performed. The statistical method of Kaplan-Meier speci®cally
allows for estimations of `real CPC' without under- or overestimation,
especially if some women were censored for reasons other than
conception. Cumulative probability curves were computed from these
estimates as `1 ± survival rate', which provides distribution functions
for the respective variables `time to pregnancy' and `time to drop-out',
with a cut-off at 21 months observation because of the small numbers
remaining. All analyses were carried out for the whole group, and
separately for those who ®nally conceived (TF couples). Control was
applied for the in¯uence of confounding factors of major importance
such as age, parity, educational level and socio-economic status.
Results
In total, 310 pregnancies (TF) occurred among 346 women
during a maximum of 29 cycles of observation [mean 3.56 64.03 (SD) for a total of 1208 cycles observed]. During this
period, 36 women did not conceive [probably infertile (PI),
10.4%]. The mean number of cycles observed in the PI group
until drop-out was 7.83 6 5.43 (range 1±20) cycles. The mean
age of all women (n = 343) was 29.0 6 3.6 (range 20±44)
years. There was no statistically signi®cant difference in age
between those women who ®nally succeeded or failed to
conceive (TF 28.5 6 3.5 years; n = 309; PI 28.9 6 3.0 years; n
= 34). The mean age of all men (n = 333) was 31.6 6 5.5 years,
and a signi®cant difference (P = 0.027) was seen in the men's
age in couples who either ®nally conceived (TF 31.4 6 5.6
years; n = 297) or failed to conceive (PI 33.6 6 5.3 years; n =
36) during the observation period.
Most of the couples were married, and ~60% of the women
had a high-school or university degree. Approximately 50% of
the women were housewives, and ~50% were working; 82%
were Roman-Catholic.
Some 52% of the TF-group and 31% of the PI-group
reported on a prior pregnancy before participating in the study
(P < 0.001). As stated above, some women re-entered the study
after live-birth or abortion. To avoid a possible bias in the
statistical estimations, all couples were observed only for their
®rst pregnancy under the conditions of the study. Hence, this
`®rst study-pregnancy' was not necessarily the ®rst pregnancy
of the couple.
Cumulative probabilities of conception
The estimated CPC for the whole group and for the TF group
are shown in Table I and Figures 1 and 2. Only data from 340 of
346 women were included in this analysis. The TTP of six
women from the TF group (now n = 304) was inaccurate
because some cycles were completely missed (no information
on exposure to pregnancy), although a conception cycle was
submitted later, thereby leading to an inaccurate TTP.
A total of 8% of all participating women failed to conceive
within 12 cycles of fertility-focused intercourse, and were
deemed subfertile according to current clinical opinion (which
expects an ~80% overall conception rate within 12 months).
For ~30% of the women this was a secondary infertility.
By analysing CPC for the whole group (including subfertile
and truly infertile couples), and then for the subgroup of those
who ®nally conceived (TF couples) separately, very large sub-
groups (81 and 88% respectively) were identi®ed of clearly
highly fertile couples who conceived quite early within six
cycles with timed intercourse. Approximately 20% of all
couples, and only ~10% of ®nally conceiving couples (TF), did
not conceive within six cycles. Consequently, among those
women who did not become pregnant after six cycles with
timed intercourse, almost every second couple may be regarded
as subfertile or probably infertile (PI) according to current
clinical de®nitions.
Fertility was not arti®cially overestimated due to the early
drop-out of those women who did not become pregnant. The
distribution function computed from the survival curve of
cycles for those who did not conceive (PI) was signi®cantly
lower than for those who ®nally became pregnant (TF)
(Figure 2). The mean participation time (observed cycles)
was statistically longer for the PI group (7.83 6 5.43 cycles)
than the TF group (3.05 6 3.52 cycles) (P < 0.001; Wilcoxon
and Log-Rank tests). Among the PI group, 30 women stopped
sending data to the research units and withdrew from the study;
however, they continued with NFP to achieve pregnancy.
Information obtained via the NFP investigators suggested that
some women were disappointed because conception did not
occur as early as expected. Five women were lost to follow-up,
and one woman ®nally stopped attempting to conceive.
A statistically signi®cant (P = 0.0371; Wilcoxon test for
survival rates) age-related decrease in CPC was seen for all
Table I. Cumulative probability of conception (CPC) for all couples and the truly fertile subgroup ofwomen who ®nally conceived
Patient group No. of cycle
1 3 6 12
All couplesa 0.38 (0.026) 0.68 (0.026) 0.81 (0.022) 0.92 (0.017)Truly fertile couplesb 0.42 (0.028) 0.75 (0.025) 0.88 (0.018) 0.98 (0.009)
Values in parentheses are SEM.an = 340; six couples excluded due to inaccurate time to pregnancy.bn = 304 couples; six couples excluded due to inaccurate time to pregnancy.
Time to pregnancy
1961
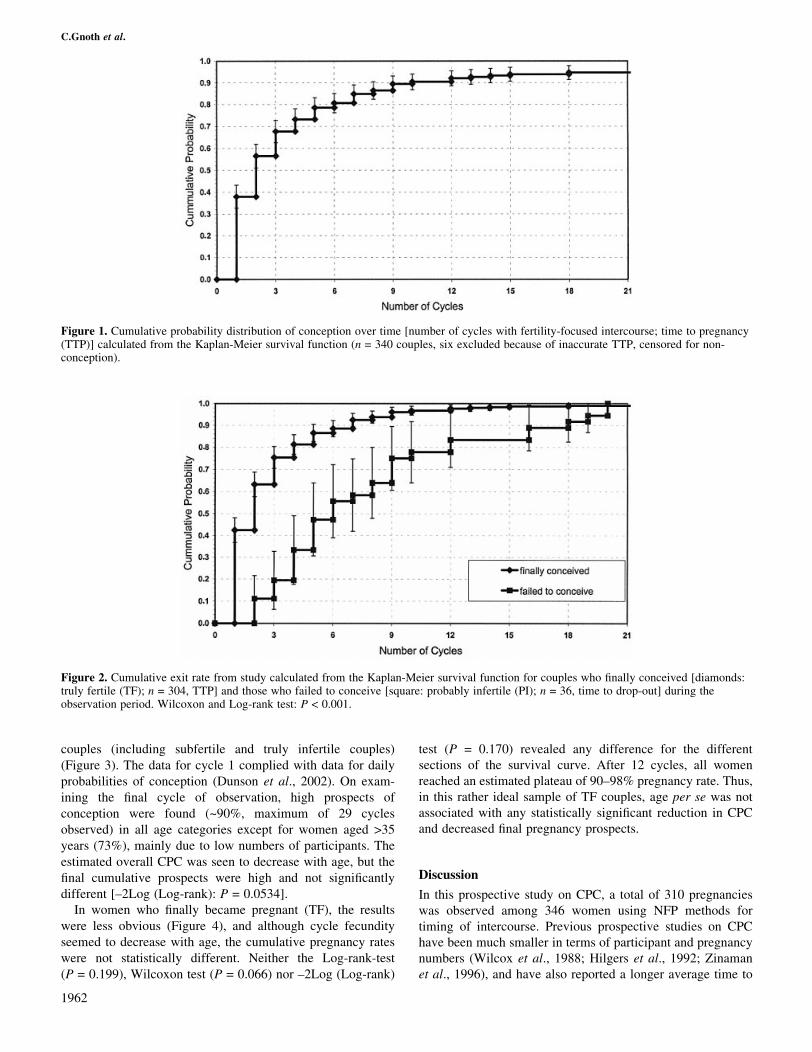
couples (including subfertile and truly infertile couples)
(Figure 3). The data for cycle 1 complied with data for daily
probabilities of conception (Dunson et al., 2002). On exam-
ining the ®nal cycle of observation, high prospects of
conception were found (~90%, maximum of 29 cycles
observed) in all age categories except for women aged >35
years (73%), mainly due to low numbers of participants. The
estimated overall CPC was seen to decrease with age, but the
®nal cumulative prospects were high and not signi®cantly
different [±2Log (Log-rank): P = 0.0534].
In women who ®nally became pregnant (TF), the results
were less obvious (Figure 4), and although cycle fecundity
seemed to decrease with age, the cumulative pregnancy rates
were not statistically different. Neither the Log-rank-test
(P = 0.199), Wilcoxon test (P = 0.066) nor ±2Log (Log-rank)
test (P = 0.170) revealed any difference for the different
sections of the survival curve. After 12 cycles, all women
reached an estimated plateau of 90±98% pregnancy rate. Thus,
in this rather ideal sample of TF couples, age per se was not
associated with any statistically signi®cant reduction in CPC
and decreased ®nal pregnancy prospects.
Discussion
In this prospective study on CPC, a total of 310 pregnancies
was observed among 346 women using NFP methods for
timing of intercourse. Previous prospective studies on CPC
have been much smaller in terms of participant and pregnancy
numbers (Wilcox et al., 1988; Hilgers et al., 1992; Zinaman
et al., 1996), and have also reported a longer average time to
Figure 2. Cumulative exit rate from study calculated from the Kaplan-Meier survival function for couples who ®nally conceived [diamonds:truly fertile (TF); n = 304, TTP] and those who failed to conceive [square: probably infertile (PI); n = 36, time to drop-out] during theobservation period. Wilcoxon and Log-rank test: P < 0.001.
Figure 1. Cumulative probability distribution of conception over time [number of cycles with fertility-focused intercourse; time to pregnancy(TTP)] calculated from the Kaplan-Meier survival function (n = 340 couples, six excluded because of inaccurate TTP, censored for non-conception).
C.Gnoth et al.
1962

pregnancy and a lower pregnancy rate at the 6- and 12-month
periods. More recent studies have been mostly retrospective
(Juul et al., 1999; 2000; Joffe, 2000; Jensen et al., 2001), but
may be biased due to long-term recall of TTP and exclusion of
truly infertile couples (Jensen et al., 2000). Nevertheless, the
CPC of the present `total' group (including subfertile and PI
couples) at the 12-month period was comparable with that
reported by others. The important advantage of this prospective
study is the information it provides about the precise shift of
contraception to reproduction, the long-term design (maximum
29 cycles of observation), and the power of the statistical
method (Kaplan-Meier) used to minimize an arti®cial over-
estimation of fertility due to early drop-out of women who did
not conceive. In addition, the mean number of cycles of
observation for those women who did not conceive was
signi®cantly greater then for those who ®nally became
pregnant. In contrast to previous reports (Dunson and
Weinberg, 2000; Dunson et al., 2002), a non-parametric
model was preferred to assess fertility rates in the present
study, mainly because presently there was no parametric model
available which would describe with suf®cient precision the
entire process of fertility and its changes. This suggests that
estimating CPC by monitoring survival functions and related
probability distribution functions, as in the present study, is
more accurate than using a parametric model.
Although the upper-class population of the present study
may not be representative of the general population in Europe,
the authors are unaware of any study linking social status to
Figure 3. Cumulative probability distribution of conception for all couples in different age categories (<25 years, n = 58; 26±30 years, n =189; 31±35 years, n = 82; >35 years, n = 10) over time calculated from Kaplan-Meier survival functions [n = 339; seven couples excludeddue to inaccurate TTP (n = 6) or woman's age not indicated (n = 1)].
Figure 4. Cumulative probability distribution of conception for truly fertile couples in different age categories (<25 years, n = 55; 26±30years, n = 168; 31±35 years, n = 71; >35 years, n = 9) over time calculated from Kaplan-Meier survival functions [n = 303; seven couplesexcluded due to inaccurate TTP (n = 6) or woman's age not indicated (n = 1)].
Time to pregnancy
1963

variability of fertility. In Germany in 1999, the mean age of
women at their ®rst birth was 28.83 years, and this was
comparable with the present study population. The in¯uence of
factors such as age (late ®rst pregnancy), coital patterns or
genital infections in different social classes on fertility is
unknown, and indeed some of these effects might neutralize
each other (e.g. higher age in upper-class groups and probable
higher rate of genital infection in lower-class groups). It is
known from previous studies (Frank et al., 1985; Frank-
Herrmann et al., 1991) that the STM also provides effective
contraception in so-called `lower-class' couples; hence, it
could be expected that the results obtained might be general-
ized to other populations in developed countries.
Users of NFP may represent a somewhat ideal sample, as
they make optimal use of their fertility potential by accurate
detection of the fertile window in their menstrual cycles and an
above-average knowledge of reproductive basics such as
optimal time and interval of intercourse. Nevertheless, it is
known from the authors that Internet-based counselling of
couples with infertility problems (www.meinkinderwunsch.de)
that increasing numbers of women are practising natural
methods before, and also in parallel with, infertility therapy.
Hence, it is hoped that the results of the present study will aid
those who counsel couples (e.g. prior to specialized infertility
therapy, general practitioner, general gynaecologist) and direct
them towards further steps of diagnosis and possible reference
to a specialized centre. Moreover, these data may also help
specialists to decide whether suf®cient exposure to the chance
of conception has occurred, as well as when to start further
infertility investigation and resort to ART, especially in cases
of unexplained infertility.
All participating women were trained and instructed by
experienced NFP teachers in parallel with their study partici-
pation (1±6 months) until autonomy and reliability in using
NFP was reached. About 20% of women switched from OC to
the STM, and in only a few of the former OC users was their
®rst cycle using STM also their ®rst cycle in attempting
pregnancy. This was due to the fact that in the past, most
former OC users initially avoided pregnancy by using the STM.
Hence, there was no difference in the correct location of the
fertile window for experienced NFP users and absolute
beginners, as has been shown previously (Frank-Herrmann
et al., 1991; 1997) when NFP was used as an effective method
of contraception.
In the present study, most couples attempting pregnancy had
intercourse in the fertile window in almost every cycle, from
the ®rst cycle until conception or drop-out. The couples were
obliged to record on the cycle sheet every episode of
intercourse was recorded, and only 3% of cycles were excluded
due to missed intercourse or intercourse only outside the fertile
window. Three couples reported a longer pause, with no
intercourse for up to 7 months, most likely with an interim
change in their family planning intention. Therefore, before
conducting the ®rst analysis the decision was made to include
only those cycles with prior documented family planning
intention, and also those with unprotected intercourse at least
once in the fertile window, the reason being that the aim was to
propose NFP as a tool for diagnostic assessment of `infertile'
couples (see below).
About 80% of the couples conceived in the ®rst six cycles
when using the fertility awareness part of the STM with
fertility-focused intercourse. These numbers partly con®rm the
data obtained from earlier and larger retrospective studies
(Bonde et al., 1998; Juul et al., 1999; 2000; Joffe, 2000; Jensen
et al., 2001), though a higher ®nal cumulative probability of
conception within 12 cycles was found. As expected, some
10.4% of women did not conceive within all observed cycles.
For those who ®nally conceived, only 2% of the pregnancies
occurred later than 12 cycles.
In another well-designed, prospective study (Bonde et al.,
1998), cumulative pregnancy probabilities of almost 60% were
obtained after six menstrual cycles. The higher CPC value
compared with all cited studies accounts for the effects of
information on the fertile period and of repeated timed
intercourse. The effect of timed intercourse on pregnancy
rates of women, with optimal use of their fertility potential, was
also recently emphasized by others (Stanford et al., 2002).
These ®ndings highlight the existence of a huge group of
highly fertile couples who conceive quite early within six
cycles with timed intercourse. About 20% of all couples, and
only 10% of ®nally conceiving couples (TF), will not be
successful within six cycles (see Table I). These TF couples
represent an ideal homogeneous group without any infertility
problems and, using a ~30% monthly chance of conception,
they will achieve a pregnancy rate of almost 90% in six cycles,
based on the formula:
Probability of conception within 6 months = 1 ± (1 ± monthly
probability of conception)6, which is precisely the relationship
con®rmed by the results of the present study.
Taking into account the results of the overall conception
rates for all couples, among whom ~20% do not conceive in six
cycles and ~10% do not conceive in 12 cycles, almost every
second couple is probably subfertile or infertile after six
unsuccessful cycles with timed intercourse. Thus, it is possible
to suggest a new threshold such that, after six unsuccessful
cycles with fertility-focused intercourse (the ideal exposure to
pregnancy) prior to the ®rst visit or during the following
months, clinicians in primary care must assume subfertility or,
in rare cases absolute infertility (such as tubal pathology or
azoospermia), in almost every second case. In the present
authors' opinion, this justi®es an early and basic infertility
work-up in these individual cases; in individual cases, the
waiting time should not be extended to 12 cycles, before
starting basic infertility work-up to avoid possible under-
treatment of infertility later.
Couples with a good prognosis (unexplained infertility, no
tubal affection, no oligoamenorrhoea, no oligoasthenozoos-
permia and no signs of reduced ovarian reserve; Navot et al.,
1987; Seifer et al., 1997; Scheffer et al., 1999), and/or no
suspicion of endometriosis, should be advised to wait as they
have a reasonably good chance (>60%) of conceiving spon-
taneously during the next 36 months (Collins et al., 1995;
Snick et al., 1997; Glazener et al., 2000; Glazener and Ford,
2002; Gnoth et al., 2002b). During this period, self-monitoring
with NFP methods may be all that is necessary. However, it is
C.Gnoth et al.
1964

sometimes dif®cult to get patients with infertility problems to
wait unless they are given detailed information about their
prognosis, the proposed pattern (and dif®culties) of investiga-
tion and treatment, as well as alternative ways of becoming
parents (Schmidt, 1998).
An advanced infertility work-up which includes laparoscopy
and hysteroscopy, endocrinological tests, in-vitro tests of
sperm±cervical mucus interactions together with consultation
with a reproductive gynaecologist and andrologist as well as
ART, should be offered to couples with poor prognosis and
more than 12 unsuccessful cycles with timed intercourse. They
may bene®t from an early resort to ART because in this case
they are superior to expectant management (Evers et al., 1998).
This balanced management avoids unreasonable early inter-
ventions such as IVF as ®rst-line treatment (Karande et al.,
1999), which may represent over-treatment and expose women
to medical complications (e.g. multiple pregnancies and
ovarian hyperstimulation syndrome) and unnecessary expense.
It also avoids late interventions which may represent infertility
under-treatment.
As expected, CPC was found to decrease with advancing
female age in all couples. Indeed, previous reports on daily
fecundability (Dunson et al., 2002) showed a decline for
women in their late 20s as well as for men in their late 30s. In
that study, 105 of the 782 participants were from a long-term
study on NFP in Germany, and most had used the STM for
contraception such that acts of unprotected intercourse were
often located in border regions of the fertile window.
Intercourse on days with the highest pregnancy prospect was
somewhat under-represented. This mixture of pregnancy
avoiders (predominantly) and achievers in¯uenced coital
pattern and may have affected the calculations of fertility.
Another possible bias in the study was an overestimation of
fertility due to the non-exclusion of participants who re-entered
the study after breastfeeding or abortion.
Cumulative pregnancy rates in natural cycles are much more
appropriate for assessing age-related effects than are daily
pregnancy probabilities (te Velde et al., 2000). In the present
study, all women had intercourse on the most fertile days of the
cycle, thereby reducing any in¯uence of coital pattern on
fertility estimation. As expected, the CPC decreases signi®-
cantly with age for all couples, and the ®nal estimated
pregnancy prospect is high (about 90%), except for women
aged >35 years. However, the proportion of women falling into
this age category is too small to prove (statistically) a
signi®cant decline in fertility. In the separately analysed,
ideal subgroup of TF couples, the CPC did not differ
signi®cantly among the different age groups. Methodically,
even when heavy censoring is employed (as in the present
study), a Kaplan-Meier approach allows the analysis of non-
censored subjects (i.e. TF couples) to calculate a distribution
function of the numbers of cycles from the survival function, as
those who failed to conceive (i.e. censored) were observed for a
signi®cantly longer period than the ®nally successful couples
(i.e. non-censored) (P < 0.001; Wilcoxon and Log-rank test).
Thus, for this ideal sample of TF couples, the effect of age on
the decline in fertility was less obvious because of their
high homogeneity with advancing age. Unfortunately, no
information is available on the rate of ongoing pregnancies and
live births in all cases. As the incidence of abortions is higher in
older women, an outcome measure of live births would provide
additionalÐand probably more solidÐinformation in terms of
an age-related birth rate. Consequently, it is dif®cult to draw
®nal conclusions based on these ®ndings.
With increasing age, there is an increasing proportion of
couples with infertility problems, and this is related mainly to
the woman. Although some fertility problems are associated
with age (e.g. reduced ovarian reserve), they depend mainly on
individual factors (te Velde and Pearson, 2002) that cause
increasing heterogeneity in fecundity with age. In the present
study, the inter-quartile range in cumulative probability of
conception for women aged between 31 and 35 years extended
from 28 to 76%, while for women aged >35 years it extended
from 20 to 100%. It is this increased heterogeneity due to an
increasing proportion of truly subfertile and infertile women
which accounts for an age-related decrease in fertility,
lowering the average for the whole group, and giving the
illusion of a gradual age-related effect. The small differences in
overall CPC between the age groups of <30 years account for a
broad plateau of relatively high fertility in most couples, and a
subsequent rapidly increasing infertility with a small plateau of
highly fertile couples of greater age. The signi®cant difference
(P = 0.0371) between these groups is mainly due to the
in¯uence of women aged >35 years. In view of the effects of
age on CPC for all and TF couples, the ®ndings of the present
study suggest that in this homogeneous setting a woman's
fertility most likely does not decline gradually with advancing
age. This stresses the importance of an early basic infertility
investigation for probably subfertile or infertile couples in
order to detect individual factors associated with a poor
prognosis of achieving spontaneous conception, regardless of
age. It is of interest to note that there was a signi®cant
association with men's age among TF couples; this con®rms
the data published by others (Dunson et al., 2002) and forms
the basis for future investigations.
LastÐbut not leastÐNFP methods are widely used by
women. Two European multicentre studies (The European
Natural Family Planning Study Groups, 1993; 1999; Colombo
and Masarotto, 2000) have shown that the NFP centres in
Europe are now well structured to carry out prospective studies
to measure a couple's fertility by assessing exposures related to
semen quality, age or environment.
Acknowledgements
The authors thank Mrs S.Heil for all her efforts collecting the NFPcycle charts, and Mrs S.Devarajoo for proof-reading the manuscript.
References
Baird, D.D., Wilcox, A.J. and Weinberg, C.R. (1986) Use of time to pregnancyto study environmental exposures. Am. J. Epidemiol., 124, 470±480.
Bonde, J.P., Ernst, E., Jensen, T.K., Hjollund, N.H., Kolstad,H.,Henriksen,T.B., Scheike, T., Giwercman, A., Olsen, J. and Skakkebaek,N.E. (1998) Relation between semen quality and fertility: a population-based study of 430 ®rst-pregnancy planners. Lancet, 352, 1172±1177.
Collins, J.A., Burrows, E.A. and Wilan, A.R. (1995) The prognosis for livebirth among untreated infertile couples. Fertil. Steril., 64, 22±28.
Time to pregnancy
1965
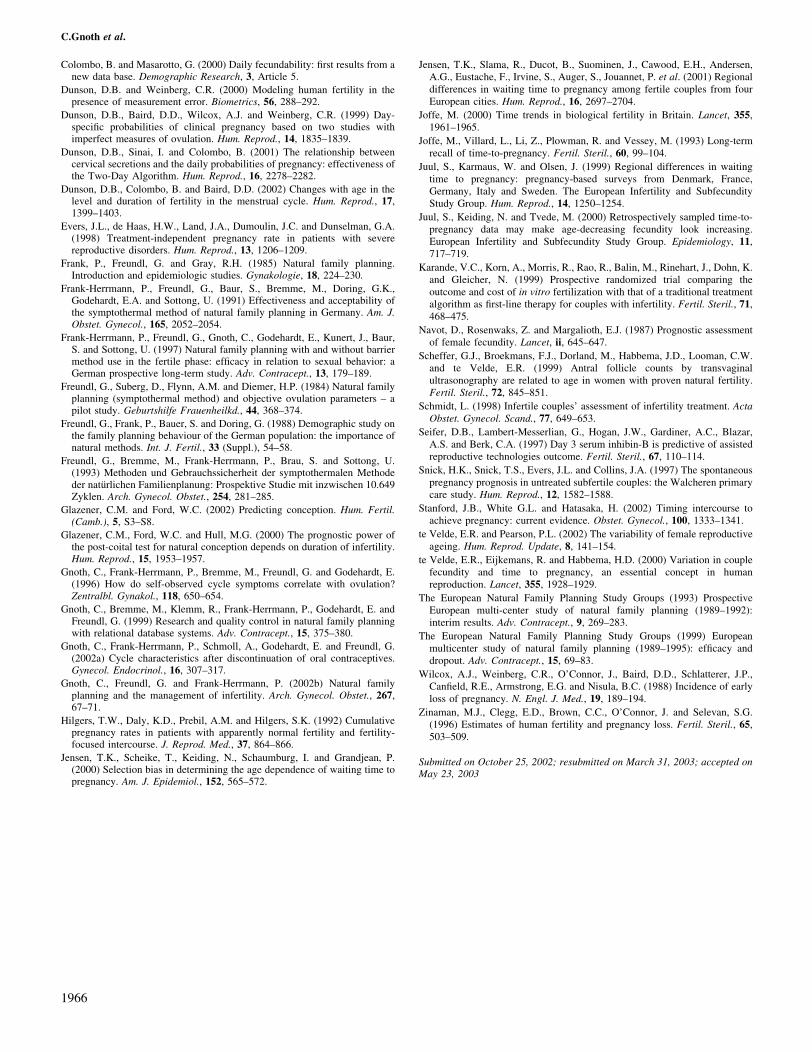
Colombo, B. and Masarotto, G. (2000) Daily fecundability: ®rst results from anew data base. Demographic Research, 3, Article 5.
Dunson, D.B. and Weinberg, C.R. (2000) Modeling human fertility in thepresence of measurement error. Biometrics, 56, 288±292.
Dunson, D.B., Baird, D.D., Wilcox, A.J. and Weinberg, C.R. (1999) Day-speci®c probabilities of clinical pregnancy based on two studies withimperfect measures of ovulation. Hum. Reprod., 14, 1835±1839.
Dunson, D.B., Sinai, I. and Colombo, B. (2001) The relationship betweencervical secretions and the daily probabilities of pregnancy: effectiveness ofthe Two-Day Algorithm. Hum. Reprod., 16, 2278±2282.
Dunson, D.B., Colombo, B. and Baird, D.D. (2002) Changes with age in thelevel and duration of fertility in the menstrual cycle. Hum. Reprod., 17,1399±1403.
Evers, J.L., de Haas, H.W., Land, J.A., Dumoulin, J.C. and Dunselman, G.A.(1998) Treatment-independent pregnancy rate in patients with severereproductive disorders. Hum. Reprod., 13, 1206±1209.
Frank, P., Freundl, G. and Gray, R.H. (1985) Natural family planning.Introduction and epidemiologic studies. Gynakologie, 18, 224±230.
Frank-Herrmann, P., Freundl, G., Baur, S., Bremme, M., Doring, G.K.,Godehardt, E.A. and Sottong, U. (1991) Effectiveness and acceptability ofthe symptothermal method of natural family planning in Germany. Am. J.Obstet. Gynecol., 165, 2052±2054.
Frank-Herrmann, P., Freundl, G., Gnoth, C., Godehardt, E., Kunert, J., Baur,S. and Sottong, U. (1997) Natural family planning with and without barriermethod use in the fertile phase: ef®cacy in relation to sexual behavior: aGerman prospective long-term study. Adv. Contracept., 13, 179±189.
Freundl, G., Suberg, D., Flynn, A.M. and Diemer, H.P. (1984) Natural familyplanning (symptothermal method) and objective ovulation parameters ± apilot study. Geburtshilfe Frauenheilkd., 44, 368±374.
Freundl, G., Frank, P., Bauer, S. and Doring, G. (1988) Demographic study onthe family planning behaviour of the German population: the importance ofnatural methods. Int. J. Fertil., 33 (Suppl.), 54±58.
Freundl, G., Bremme, M., Frank-Herrmann, P., Brau, S. and Sottong, U.(1993) Methoden und Gebrauchssicherheit der symptothermalen Methodeder natuÈrlichen Familienplanung: Prospektive Studie mit inzwischen 10.649Zyklen. Arch. Gynecol. Obstet., 254, 281±285.
Glazener, C.M. and Ford, W.C. (2002) Predicting conception. Hum. Fertil.(Camb.), 5, S3±S8.
Glazener, C.M., Ford, W.C. and Hull, M.G. (2000) The prognostic power ofthe post-coital test for natural conception depends on duration of infertility.Hum. Reprod., 15, 1953±1957.
Gnoth, C., Frank-Herrmann, P., Bremme, M., Freundl, G. and Godehardt, E.(1996) How do self-observed cycle symptoms correlate with ovulation?Zentralbl. Gynakol., 118, 650±654.
Gnoth, C., Bremme, M., Klemm, R., Frank-Herrmann, P., Godehardt, E. andFreundl, G. (1999) Research and quality control in natural family planningwith relational database systems. Adv. Contracept., 15, 375±380.
Gnoth, C., Frank-Herrmann, P., Schmoll, A., Godehardt, E. and Freundl, G.(2002a) Cycle characteristics after discontinuation of oral contraceptives.Gynecol. Endocrinol., 16, 307±317.
Gnoth, C., Freundl, G. and Frank-Herrmann, P. (2002b) Natural familyplanning and the management of infertility. Arch. Gynecol. Obstet., 267,67±71.
Hilgers, T.W., Daly, K.D., Prebil, A.M. and Hilgers, S.K. (1992) Cumulativepregnancy rates in patients with apparently normal fertility and fertility-focused intercourse. J. Reprod. Med., 37, 864±866.
Jensen, T.K., Scheike, T., Keiding, N., Schaumburg, I. and Grandjean, P.(2000) Selection bias in determining the age dependence of waiting time topregnancy. Am. J. Epidemiol., 152, 565±572.
Jensen, T.K., Slama, R., Ducot, B., Suominen, J., Cawood, E.H., Andersen,A.G., Eustache, F., Irvine, S., Auger, S., Jouannet, P. et al. (2001) Regionaldifferences in waiting time to pregnancy among fertile couples from fourEuropean cities. Hum. Reprod., 16, 2697±2704.
Joffe, M. (2000) Time trends in biological fertility in Britain. Lancet, 355,1961±1965.
Joffe, M., Villard, L., Li, Z., Plowman, R. and Vessey, M. (1993) Long-termrecall of time-to-pregnancy. Fertil. Steril., 60, 99±104.
Juul, S., Karmaus, W. and Olsen, J. (1999) Regional differences in waitingtime to pregnancy: pregnancy-based surveys from Denmark, France,Germany, Italy and Sweden. The European Infertility and SubfecundityStudy Group. Hum. Reprod., 14, 1250±1254.
Juul, S., Keiding, N. and Tvede, M. (2000) Retrospectively sampled time-to-pregnancy data may make age-decreasing fecundity look increasing.European Infertility and Subfecundity Study Group. Epidemiology, 11,717±719.
Karande, V.C., Korn, A., Morris, R., Rao, R., Balin, M., Rinehart, J., Dohn, K.and Gleicher, N. (1999) Prospective randomized trial comparing theoutcome and cost of in vitro fertilization with that of a traditional treatmentalgorithm as ®rst-line therapy for couples with infertility. Fertil. Steril., 71,468±475.
Navot, D., Rosenwaks, Z. and Margalioth, E.J. (1987) Prognostic assessmentof female fecundity. Lancet, ii, 645±647.
Scheffer, G.J., Broekmans, F.J., Dorland, M., Habbema, J.D., Looman, C.W.and te Velde, E.R. (1999) Antral follicle counts by transvaginalultrasonography are related to age in women with proven natural fertility.Fertil. Steril., 72, 845±851.
Schmidt, L. (1998) Infertile couples' assessment of infertility treatment. ActaObstet. Gynecol. Scand., 77, 649±653.
Seifer, D.B., Lambert-Messerlian, G., Hogan, J.W., Gardiner, A.C., Blazar,A.S. and Berk, C.A. (1997) Day 3 serum inhibin-B is predictive of assistedreproductive technologies outcome. Fertil. Steril., 67, 110±114.
Snick, H.K., Snick, T.S., Evers, J.L. and Collins, J.A. (1997) The spontaneouspregnancy prognosis in untreated subfertile couples: the Walcheren primarycare study. Hum. Reprod., 12, 1582±1588.
Stanford, J.B., White G.L. and Hatasaka, H. (2002) Timing intercourse toachieve pregnancy: current evidence. Obstet. Gynecol., 100, 1333±1341.
te Velde, E.R. and Pearson, P.L. (2002) The variability of female reproductiveageing. Hum. Reprod. Update, 8, 141±154.
te Velde, E.R., Eijkemans, R. and Habbema, H.D. (2000) Variation in couplefecundity and time to pregnancy, an essential concept in humanreproduction. Lancet, 355, 1928±1929.
The European Natural Family Planning Study Groups (1993) ProspectiveEuropean multi-center study of natural family planning (1989±1992):interim results. Adv. Contracept., 9, 269±283.
The European Natural Family Planning Study Groups (1999) Europeanmulticenter study of natural family planning (1989±1995): ef®cacy anddropout. Adv. Contracept., 15, 69±83.
Wilcox, A.J., Weinberg, C.R., O'Connor, J., Baird, D.D., Schlatterer, J.P.,Can®eld, R.E., Armstrong, E.G. and Nisula, B.C. (1988) Incidence of earlyloss of pregnancy. N. Engl. J. Med., 19, 189±194.
Zinaman, M.J., Clegg, E.D., Brown, C.C., O'Connor, J. and Selevan, S.G.(1996) Estimates of human fertility and pregnancy loss. Fertil. Steril., 65,503±509.
Submitted on October 25, 2002; resubmitted on March 31, 2003; accepted onMay 23, 2003
C.Gnoth et al.
1966

ORIGINAL ARTICLE Reproductive epidemiology
Final ART success rates: a 10 yearssurveyC. Gnoth1,*, B. Maxrath1, T. Skonieczny1, K. Friol1, E. Godehardt2,and J. Tigges1
1Centre for Family Planning, Gynaecological Endocrinology and Reproductive Medicine (green-ivf), Department of Obstetrics andGynaecology (Director: Prof. Peter Mallmann), University of Cologne, Rheydter Str. 143, D-41515 Grevenbroich, Germany2Biometric Research Group, Clinic for Cardiovascular Surgery, Heinrich-Heine-University of Dusseldorf, Dusseldorf, Germany
*Correspondence address. Tel: +49-2181-491513; Fax: +49-2181-491534; E-mail: [email protected]
Submitted on February 10, 2011; resubmitted on May 4, 2011; accepted on May 13, 2011
background: Cumulative pregnancy rates (CPRs) and live birth rates (CLBRs) are much better indicators of success in IVF pro-grammes than cross-sectional figures per cycle or embryo transfer. They allow a better estimation of patient’s chances of having a childand enable comparisons between centres and treatment strategies.
methods: A 10 year cohort study of patients undergoing their first assisted reproductive technique cycle was conducted. Patients werefollowed until live birth or discontinuation of treatment. All IVF and ICSI cycles and cryo-cycles with embryos derived from frozen pronuclearstage oocytes were included. The CPR and CLBR were estimated using the Kaplan–Meier method for both the number of treatment cyclesand transferred embryos. The analysis assumed that couples who did not return for subsequent treatment cycles would have had the samechance of success as those who had continued treatment.
results: A total of 3011 women treated between 1998 and 2007 were included, and 2068 children were born; women already with alive birth re-entered the analysis as a ‘new patient’. For 3394 ‘patients under observation’ with 8048 cycles, the CLBR was 52% after 3 cycles(the median number of cycles per patient), 72% after 6 cycles and 85% after 12 cycles. A CLBR of �50% was achieved for patients agedunder 40 years, after the cumulative transfer of six embryos. The mean live birth rate from one fresh cycle and its subsequent cryo-cycle(s)was 33%. Our analysis also shows that ART can reach natural fertility rates but not exceed them.
conclusions: Most couples with infertility problems can be treated successfully if they continue treatment. Thereby ART can reachnatural fertility rates. Even with the restrictions in place as a result of the German Embryo Protection Law, CLBR reach internationallycomparable levels.
Key words: cumulative pregnancy rate / cumulative live birth rate / natural fertility rate / German Embryo Protection Act
IntroductionAll IVF patients want to know their chances of success. Generally, thesuccess rates of assisted reproductive techniques (ARTs) are given asclinical pregnancy rates (PRs) per started cycle, oocyte retrieval orembryo transfer and often determined relative to maternal age. Atfirst glance, these rates seem to be disappointingly low, but it is thefinal ART success rate that is most pertinent to a patient’s decision onwhether to undertake treatment (Hull, 1994). Furthermore, final ARTsuccess rates [cumulative pregnancy rate (CPR) and live birth rate(CLBR)] appear to be a much better indicator of quality and successin IVF programmes and probably allow better comparisons betweendifferent centres (Lintsen et al., 2010). This is of particular importancefor cross-comparison of IVF results between different countries,especially as an increasing number of patients are looking for cross-
border treatment. CPR and CLBR should reflect possible advantagesor disadvantages of national IVF policies (restrictions and liberations)and individual treatment strategies of different IVF clinics. Moreover,CPR and CLBR are the most important figures for basing economicand political considerations of ART efficacy and reimbursement costs.
The German national index and most of the international indexeshave not published CLBR so far (www.deutsches-ivf-register.de).Several previous studies have calculated cumulative success rates buthave some limitations because of inconsistent inclusion criteria, incon-sistent treatment procedures or no reporting CLBR (Tan et al., 1992;Hull, 1994; Bergh et al., 1995; Dor et al., 1996; Osmanagaoglu et al.,1999; Kovacs et al., 2001; Olivius et al., 2002; Ubaldi et al., 2004;Lundin and Bergh, 2007; Pelinck et al., 2008; Sundstrom andSaldeen, 2009). More recent studies have published CPR comparingsingle versus double embryo transfer and discussed the impact on
& The Author 2011. Published by Oxford University Press on behalf of the European Society of Human Reproduction and Embryology. All rights reserved.For Permissions, please email: [email protected]
Human Reproduction, Vol.26, No.8 pp. 2239–2246, 2011
Advanced Access publication on June 9, 2011 doi:10.1093/humrep/der178

treatment policy (Sundstrom and Saldeen, 2009; Gelbaya et al., 2010),and one German study has reported on CPR with respect to nationalrestrictions and dropout reasons (Schroder et al., 2004). However,only one centre has published their CLBR, including cryo-cycles withtransfers of previously frozen embryos, as well as their treatmentpolicy in detail (Klipstein et al., 2005; Malizia et al., 2009; Moragianniand Penzias, 2010). Furthermore, in most previous studies on CLBRand CPR, the methodological management of women with live birthcoming for another child remains completely unclear.
In Germany, the performance of an ART is bound by very strict regu-lations by law (German Embryo Protection Law of 13th December 1990http://www.bmj.bund.de/files/-/1148/ESchG.pdf) and also influ-enced by general health insurances (Gemeinsamer Bundesausschussder Arzte und Krankenkassen, http://www.g-ba.de). Until 2004, upto four fresh IVF- and IVF/ICSI cycles were fully covered by insurance.Since then, half the cost of IVF- and IVF/ICSI cycles is covered by thecouple with the remainder paid by insurance and only for a maximumof three cycles. Cryo-cycles are entirely privately funded. The changein the reimbursement regulation in 2004 caused a significant drop inthe number of treatment cycles in Germany. All numbers and other stat-istical data are published yearly by the national IVF register and can beseen at www.deutsches-ivf-register.de.
According to the German Embryo Protection Law of 1990, the cell-culture of more than three pronuclears (PNs) is prohibited becauseonly as many oocytes at the PN stage as are planned to be transferredin one cycle are allowed to be cultured. PNs that are not intended forimplantation within one cycle have to be discarded or cryopreserved.As a consequence, prolonged embryo culture with the selection of thebest embryos or blastocysts and embryo cryopreservation is prohib-ited. Embryo cryopreservation is allowed only in cases of emergency.There is an ongoing and viable discussion on the interpretation of theGerman Embryo Protection Law. Therefore, the question arises ofwhether the strategy of one IVF or ICSI-cycle and its subsequent cryo-cycle(s) yields a lower cumulative CPR and CLBR than one IVF or ICSI-cycle with prolonged embryo culture and embryo selection beforetransfer.
In this cohort study, we calculated CPR and CLBR by the Kaplan–Meier-method (Kaplan and Meier, 1958), which allows for the esti-mation of CPR and CLBR without under- or overestimation, whichis of particular importance if patients are censored for reasons otherthan pregnancy or live birth. The Kaplan–Meier method assumesinherently that those who exit treatment for reasons other than preg-nancy or live birth have the same probability of future success as thosewho continued.
We performed this 10-year survey from 1998 to 2007 in a singleIVF centre in Germany in order to provide estimates of the finalsuccess that a couple would have if continuing treatment and toallow comparisons with international success figures. We includedall IVF, IVF/ICSI and cryo-cycles involving the transfer of embryosderived from frozen PN stage oocytes.
Materials and Methods
Data collection and analysisAll ART cycles included IVF, IVF/ICSI and cryo-cycles with embryos fromcryopreserved PN stage oocytes but no oocyte donations as it is
prohibited in Germany. Cycles between January 1998 and December2007 were observed in a cohort study, including all women undergoingtheir first fresh cycle in our centre. These women were followed as‘patients under observation’ until either discontinuation of their treatmentor live birth as the primary outcome. All patients without a live birth whoreturned for further treatment underwent a further attempt. Cycleswithout oocyte 6 retrieval were not included. Only cryo-cycles withembryo transfer were considered. For the Kaplan–Meier estimations,women already with a live birth re-entered the analysis as a ‘newpatient under observation’ if they underwent further ART. Patients whodid not return (perhaps because they changed the IVF centre orstopped treatment for any other reason) were censored after the lasttreatment.
This study was conducted in accordance with the principles of theDeclaration of Helsinki. Medical and laboratory data were recordedusing the clinic management program MEDISTAR, the IVF laboratorymanaging program RECDATE and Microsoft EXCEL. Data collectedincluded the length of time trying to conceive, information of previoustreatments for infertility and, if available, the reason of discontinuation, rel-evant information about ovarian stimulation and procedures in the IVF lab-oratory and outcomes of the treatment cycles. All couples had to sign aninformed consent about data storage and anonymous results reporting andtransfer to the national register.
Data were analysed using the SAS package, version 9 (SAS Institute Inc.,Cary/USA). Kaplan–Meier survival rates were estimated over all treat-ment cycles or number of transferred embryos. The usual survival rateswith means and 2 standard errors approximating the 95% confidenceinterval (CI) were computed and the cumulative probability curves (non-parametric distribution functions) were derived for the CLBR or CPR.Since age is the major factor of importance for the success rates (Lasset al., 1998; Bar-Hava et al., 1999), Kaplan–Meier curves were additionallycalculated separately for different age groups. Additionally, we also calcu-lated non-estimated live birth rates (LBRs) and PRs for one treatmentsequence, which is one fresh cycle followed by its subsequent cryo-cycle(s), to allow comparisons with cross-sectional statistics. Statistical sig-nificance was derived by the Log-rank-test for Kaplan–Meier survival ratesand the t-test for other continuous data.
Fresh cyclesThe fresh IVF- or IVF/ICSI-cycle treatment strategies have previously beendescribed in detail (Gnoth et al., 2008). The main indications for ART weremale subfertility (65%), tubal pathology (12%), endometriosis (12%), idio-pathic infertility (9%) and repeated polyfollicular development in gonado-trophin stimulation cycles for IUI (2%). The majority of patients begantreatment with a monophasic oral contraceptive pill on Days 3–5 of thecycle. The long agonist protocol was used preferentially. In about 20%of all fresh cycles, stimulation was according to the antagonist protocolespecially in cases of expected low ovarian response. Controlled ovarianhyperstimulation (COH) was performed with either recombinant follitro-pin a or b (rec FSH) or urinary HMG. The starting dosage was adjustedaccording to the patient’s age, Anti-Mullerian hormone and antral folliclecount. Most of our patients under 35 years of age were started with150 mIU/ml. In patients with expected or proved low ovarian response(≤4 oocytes in a previous cycle), we started with 300 mIU/ml. After 5days of stimulation, the follicular development was assessed by ultrasoundand hormonal measurements. If necessary, the dose of gonadotrophinswas adjusted. Transvaginal oocyte retrieval was performed 35 h after ovu-lation induction. The luteal phase was supported with vaginal application ofprogesterone and in the case of low ovarian response, vaginal estradiol(E2) was used additionally. In accordance with the regulations, two PNstage oocytes were cultured if a transfer of two embryos was planned
2240 Gnoth et al.

or three PN stage oocytes if three embryos should be transferred in onecycle. In all cases, a PN scoring was performed. All supernumerous PNstage oocytes were frozen. Approximately 30% of all fresh cycles wereconducted as IVF and 70% were conducted as IVF/ICSI. The number ofembryos transferred depended on maternal age, parity, number of pre-vious attempts and the couple’s wish, and was 2.06 per transfer onaverage. The ongoing clinical PR was considered to be the secondaryoutcome measure defined as a gestational sac and heart beat assessedby vaginal ultrasound 2–3 weeks after a positive pregnancy test.
Cryo-cyclesCycles with the transfer of embryos derived from cryopreserved PN stageoocytes were performed after priming the endometrium with a vaginal appli-cation of 2–4 mg micronized E2 per day. Luteal phase was initiated withadditional vaginal application of progesterone after ultrasound assessmentof the endometrium ideally showing a trilaminar pattern and a thickness ofat least 7 mm. The PN stage oocytes were thawed on Day 3 of vaginal pro-gesterone and transferred after 2 days of embryo culture (Day 5 of vaginalprogesterone). Clinical pregnancy was confirmed as before.
ResultsOverall 3011 individual women were eligible for inclusion. Womenalready with a live birth re-entered the analysis as a ‘new patient’.Therefore, 3394 ‘patients under observation’ contributed 8048cycles, which are summarized in Table I. The mean duration of invo-luntary infertility was 3.4 years before ART indicating serious subferti-lity (Gnoth et al., 2005). The overall mean number of treatment cycleswas 2.7 (median: 3) per patient (range 1–22). This resulted in 2193clinical pregnancies and 1718 deliveries, producing a total of 2068 chil-dren (1373 singletons, 680 twins and 15 triplets). The transfer ofembryos in cryo-cycles accounted for 20% of live births. The miscar-riage rate was 19.5%, and the ectopic PR was 2.2%. The clinical PRwas 27.2% per oocyte retrieval. The transfer of three embryos in acryo-cycle was as effective for PR per embryo transfer as the transferof two embryos in a fresh cycle.
Cumulative live birth ratesFigure 1 shows the overall CLBR for all treatment cycles with oocyteretrieval and all age groups. The CLBR were 52% after 3 cycles(approximate 95% CI: 50–54%), 72% after 6 cycles (approximate95% CI: 69–74%), 85% after 12 cycles (approximate 95% CI: 80–89%) and 94% after 18 treatment cycles (approximate 95% CI: 85–100%). The maximum number of treatment cycles that resulted in asuccessful pregnancy was 18 with the birth of healthy twins.Because of the re-entry of women after a live birth as ‘new patients’,we included 3394 ‘patients under observation’ in the estimations ofCLBRs and CPRs (Fig. 1). The proportion of re-entry in ‘patientsunder observation’ is 11.3%. The maximum of re-entry is threetimes with four children born to one woman after treatment for infer-tility in our centre. CLBR and CPR did not differ according to whetherre-entry was allowed or not.
Figure 2 shows the CLBR, for all treatment cycles with oocyteretrieval, stratified for the different age groups. The Log-rank testrevealed a significantly lower LBR for women over 40 years of age.Although the CLBR also seemed to be lower in age group over 35up to 40 years of age, it failed to reach statistical significance whencompared with the younger age groups.
Figure 3 shows the CLBR according to the number of transferredembryos. Except for women over 40 years of age, an overall CLBRof �50% was reached after the cumulative transfer of six embryos,in two or up to six cycles.
There was no statistical significant difference in the overall CLBRbetween the IVF and ICSI groups, when all ages were considered.However, when women over 35 and up to 40 were examined separ-ately, ICSI was the more favourable option (P ¼ 0.002 for CPR andP ¼ 0.0040 for CLBR).
Cumulative pregnancy ratesThe overall ongoing CPRs were 79% after 6 cycles (approximate 95%CI: 77–82%), 91% after 12 cycles (approximate 95% CI: 88–95%) and100% after 18 treatment cycles.
........................................................................................
Table I Basic characteristics of patients and treatmentcycles.
Time 1998–2007
Total number of individual women 3011
Patients under observation 3394 (with 383 re-entries after livebirth)
Total cycle number observed 8048
Patient’s age (entire study, beforeand after the change ofreimbursement policy in Germanyin 2004)
33.7+4.4 years; minimum 20years, maximum 46 years of age(all patients. entire study)34.33+4.74 years (before 2004,not pregnant in study time)a
35.75+4.4 years (2004 andbeyond, not pregnant in studytime)a
32.73+8.8 years (before 2004,finally pregnant)a
33.71+3.9 years (2004 andbeyond, finally pregnant)a
Duration of infertility 3.4 years
Cycles/patient (entire study, beforeand after the change ofreimbursement policy in Germanyin 2004)
2.7+1.3 (mean, entire study)2.4+1.7 (before 2004, notpregnant in study time)a
2.7+1.9 (2004 and beyond, notpregnant in study time)a
1.9+1.4 (2004 and beyond,finally pregnant)1.9+1.4 (2004 and beyond,finally pregnant)
Maximum cycles/patient 22
Oocytes/retrieval 10.35 (mean)
Embryos transferred/cycle 2.06 (mean)
IVF-cycles 30% of all fresh cycles
IVF/ICSI-cycles 70% of all fresh cycles
Cryo-cycles 34% of all cycles
Mean pregnancy rate 27.3%/cycle
Miscarriage rate 19.5%/cycle
Stillbirth rate 0.4%/birth
Ectopic pregnancy rate 2.2%/cycle
aSignificant difference between the subgroups.
Final ART success rates 2241
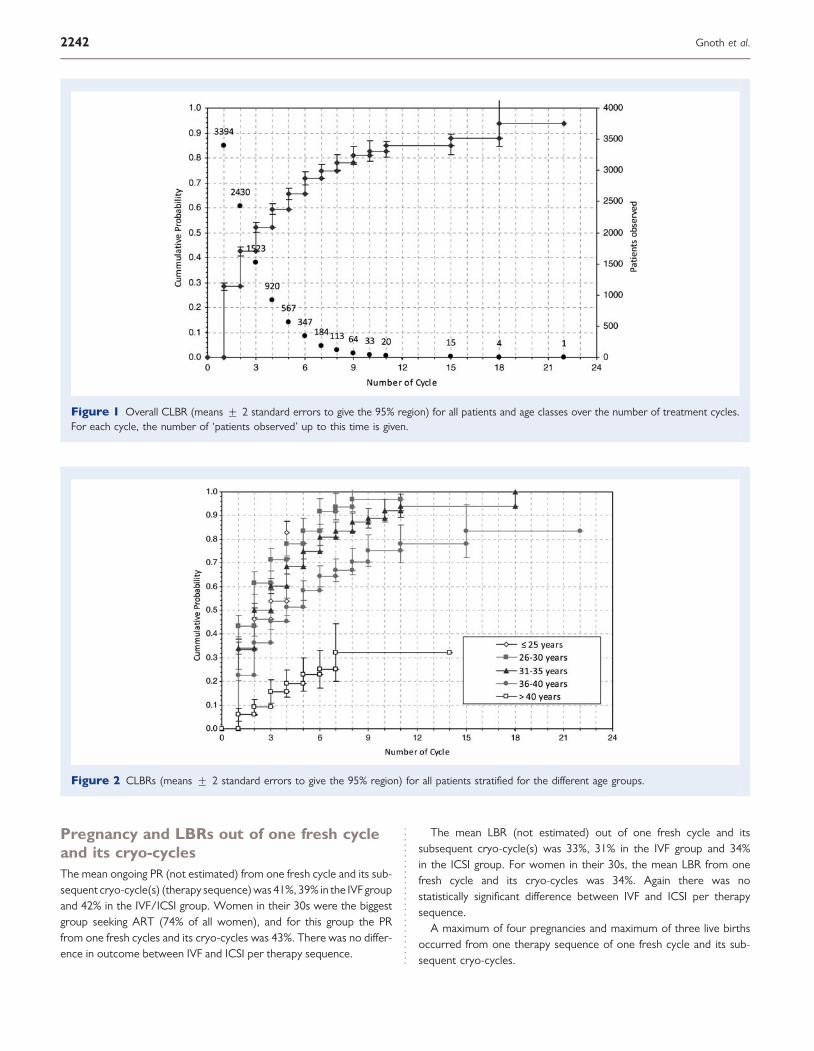
Pregnancy and LBRs out of one fresh cycleand its cryo-cyclesThe mean ongoing PR (not estimated) from one fresh cycle and its sub-sequent cryo-cycle(s) (therapy sequence) was 41%, 39% in the IVF groupand 42% in the IVF/ICSI group. Women in their 30s were the biggestgroup seeking ART (74% of all women), and for this group the PRfrom one fresh cycles and its cryo-cycles was 43%. There was no differ-ence in outcome between IVF and ICSI per therapy sequence.
The mean LBR (not estimated) out of one fresh cycle and itssubsequent cryo-cycle(s) was 33%, 31% in the IVF group and 34%in the ICSI group. For women in their 30s, the mean LBR from onefresh cycle and its cryo-cycles was 34%. Again there was nostatistically significant difference between IVF and ICSI per therapysequence.
A maximum of four pregnancies and maximum of three live birthsoccurred from one therapy sequence of one fresh cycle and its sub-sequent cryo-cycles.
Figure 1 Overall CLBR (means + 2 standard errors to give the 95% region) for all patients and age classes over the number of treatment cycles.For each cycle, the number of ‘patients observed’ up to this time is given.
Figure 2 CLBRs (means + 2 standard errors to give the 95% region) for all patients stratified for the different age groups.
2242 Gnoth et al.
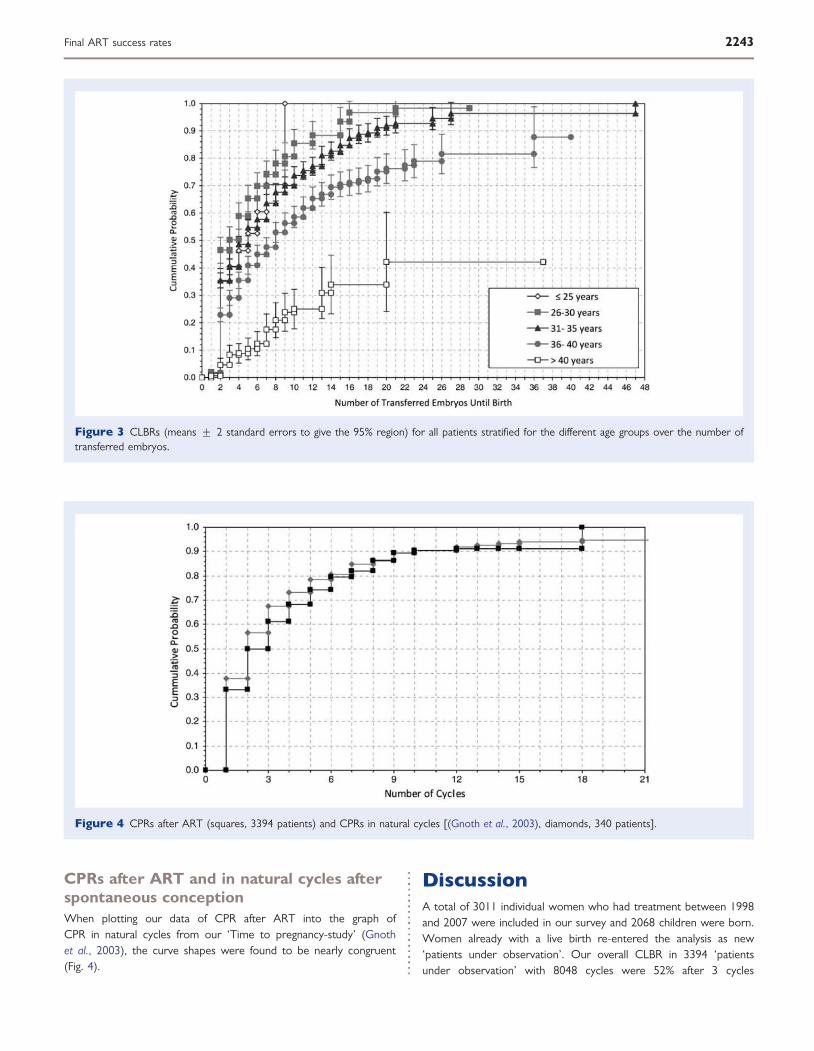
CPRs after ART and in natural cycles afterspontaneous conceptionWhen plotting our data of CPR after ART into the graph ofCPR in natural cycles from our ‘Time to pregnancy-study’ (Gnothet al., 2003), the curve shapes were found to be nearly congruent(Fig. 4).
DiscussionA total of 3011 individual women who had treatment between 1998and 2007 were included in our survey and 2068 children were born.Women already with a live birth re-entered the analysis as new‘patients under observation’. Our overall CLBR in 3394 ‘patientsunder observation’ with 8048 cycles were 52% after 3 cycles
Figure 3 CLBRs (means + 2 standard errors to give the 95% region) for all patients stratified for the different age groups over the number oftransferred embryos.
Figure 4 CPRs after ART (squares, 3394 patients) and CPRs in natural cycles [(Gnoth et al., 2003), diamonds, 340 patients].
Final ART success rates 2243
.~ :B • ~ e ~
• .2 • ., E E , u
~ :ö • ~ e ~
• > ." • ., E E , u
1.0
0.'
0.8
0.7
0.6
0.5
0.'
0.3
0.2
0.1
~ 52Syears
____ 26-30 years
---...- 31- 35 years
~ 36- 40 years
~> 40years
0.0 ~t:.:-:..-.--~~~~~~~~~~~::::;:::;:~~~:;:::;::::::::;:j
1.0
0.9
0.8
0.7
0.6
0.5
0.'
0.3
0.2
0.1
0.0
o 2 4 6 8 10 12 14 16 18 20 22 24 26 28 30 32 34 36 38 40 42 44 46 46
0
'-'
;[:1 --1- .
Number of Transferred Embryos Until Birth
I
_ ~ -.1_- , . _~ __ ~ ___ ~ __ ~ ___ ~ __ ~ ___ L __ ~ _
, ~ : ,. " "" I , I I "
, , , ""
- - ~- - -~, - - - ~ - - -:-- - T - - -:- - - t- --;- -- t -- -!-- - ~ - --:- - - ~- - -~ - - ~ -- - ~ - - ~- - -~ -- -:- --
,
" , - - -~--~---} - -~---t--~---t---~--{---~--~---~--i---~--~---~--~---
-,. ,
, , , }---:---t , , - t -:- --:---:---{---:----:---:----:.
I I I I ,
I , , , , I , , , , , I , I I I I , I
---r--~---r--~---r--~---t------T---~--,---~--'---r--'---r--~---r--~---
3
, . , T - -.. - ","
6 9 12
Number of Cycl es
, , , .,- -,---,-
15
, -,- -,-
18 21

(median number of cycles per patient), 72% after 6 cycles, 85% after12 and 94% after 18 treatment cycles. The mean, not estimated, LBRfrom one fresh cycle and its subsequent cryo-cycle(s) was 33%. There-fore, as previously noted (Damario et al., 2000), cryopreservation ofPN stage oocytes is an effective treatment strategy that optimizesthe final results from one oocyte retrieval. Provided patients continuewith treatment, the likelihood of success is high as shown by Kaplan–Meier figures. Obviously, during infertility treatment, many womenre-evaluate their situation, and our figures are useful to aid theirdecisions on whether to continue with treatment, on the number offuture cycles and on the number of embryos to be transferred thenext time. This is important in cases in which only one embryo isintended or probably only available for the next transfer.
In this study, we did not classify patients or cycles according to thedifferent causes of infertility because even recent studies have shownthat CLBR do not vary substantially with the indication for ART (Doret al., 1996; Lintsen et al., 2007, 2010).
With the use of the Kaplan–Meier method, which censors data forpatients who did not return for further treatment for any reasons, weassume that those women would have had the same chance of a livebirth by treatment as those who continued. This approach is a matterof contention as some authors have suggested it as possibly too opti-mistic (Stolwijk et al., 1996, 2000; Sharma et al., 2002) because of thepossible early dropout of women with a poor prognosis and no rea-listic chance of a pregnancy or a live birth in subsequent treatmentcycles (Hendriks et al., 2008). So a rigorous pessimistic approachassumes that women, who did not return for further treatment,have a zero chance for achieving a pregnancy. On the other hand,patients with a poor prognosis might be more inclined to continuetreatment if this seems to be the only chance of success (Roestet al., 1998) resulting in an underestimation of real CPR and CLBR.
There are many factors that can result in such over- or underesti-mation of cumulative success rates if the reasons for dropout arenot taken into account (Verberg et al., 2008) although patients’ truedropout reasons mostly remain unknown. The ‘methodological’ biasis mainly influenced by treatment strategy and counselling (Verberget al., 2008). So, the realistic CLBR lies in between the two extremesbut may be closer to the optimistic assumption as natural conceptionsdo occur in women who have ceased ART. A study by Verhagen et al.(2008) found the PR in patients who were advised to stop treatmentbecause of a medical indication (repeated fertilization failure after ICSIor very poor ovarian response), yet continued treatment, to be 14%.So, selective dropout of patients with poor treatment prognosis doesnot necessarily disadvantage our assumptions as it depends on thecentre’s treatment strategy and the population studied (Roest et al.,1998; Schroder et al., 2004). In case of a negative pregnancy test,patients with a good prognosis are generally encouraged to continuetreatment. However, also in cases of doubtful prognosis, patientsmay be advised to go for further treatment cycles as the only reason-able way to achieve success (Croucher et al., 1998; Klinkert et al.,2004). Of course, this decision purely depends on the wishes of thecouple. Another important aspect is the existence of alternatives forcouples with a poor prognosis, e.g. oocyte donation, which is prohib-ited in Germany. As long as one, at least moderately developedembryo was present on the day of transfer, we encouraged patientsto continue treatment in case of a negative test. So in this study,towards the higher number of treatment cycles, we may have an
accumulation of patients with limited prognosis reducing the overesti-mation bias.
Our CPR and CLBR could also be biased because some couples,even with good prognosis, probably did not return for further treat-ment after unsuccessful cycles because of financial reasons. Before2004, four cycles were fully reimbursed, but then legislation requiredcouples to privately fund half the cost of ART, resulting in a massivedrop in procedures conducted from 2003 to 2004 and beyond (year-books of the German IVF Index on www.deutsches-ivf-register.de).The mean maternal age and the mean number of cycles per ‘patientunder observation’ who did not conceive increased significantly after2003 in our study, reducing overestimation failures. However, themedian number of treatment cycles remained unchanged with threecycles per ‘patient under observation’ before 2004 and beyond. Theoverall ART success rates were not affected by this policy change,which was proved by usual, continuous cross-sectional statistics andseparate calculations of CLBR before and after 2004.
Women with a live birth re-entering the study for a next child wereincluded as ‘new patients under observation’ in all estimations ofCLBRs and CPRs. We are aware of this minimal lack of independencein censoring by re-entering individual women as new patients after alive birth. Re-entry of patients is not a problem in usual survival analysis(e.g. survival of cancer patients) but there is an inherited bias in cumu-lative ART success rates, which is not discussed in most successstudies. In this study, the proportion of re-entries in ‘patients underobservation’ is relatively low. However, this still might result in over-estimation of cumulative ART success rates (Molloy et al., 1995),though only with a significant effect on the first two cycles (Stolwijket al., 2000). Based on our experiences with the calculation of CPRin natural cycles, this bias of re-entry is very small because of thelong child spacing in our population (Gnoth et al., 2003). Therefore,CLBR and CPR did not differ whether re-entry was allowed or not.Allowing re-entry in the analysis best reflects the real situation in treat-ment and counselling of couples.
Some of our couples changed to another IVF centre, a practice alsorecorded in the national index where our patient’s migration is around7%. Therefore, for �3–4% of our patients, their ‘first cycle’ in ourcentre may already be their cycle two or three, further reducing theoverestimation bias just mentioned.
In exactly 4% of all fresh cycles with supernumerous PN stageoocytes, they were not cryopreserved, but discarded, mainlybecause of financial reasons of the couple. Therefore, the mean PRand LBR out of one fresh cycle are slightly underestimated as well.
An important strength of this survey is consistency in that thecentre’s treatment policy remained nearly unchanged throughoutthe entire survey with the same team of reproductive specialists andthe same responsible embryologists. Treatment methods did notchange substantially either in the entire survey except for a continuousincrease in the proportion of ICSI cycles. Over time, antagonists wereintroduced, laser-assisted hatching was offered and recently polarbody biopsy, spindle view and zona imaging has been added to therepertoire of methods. Quarterly, cross-sectional statistics showed aslight increase in clinical PRs per transfer over the years, which wasnot tested for significance and was not attributed to new methodsor drugs yet.
For all the reasons above, we assume that the inherited methodo-logical overestimation bias in our study is relatively small but it cannot
2244 Gnoth et al.

be assessed exactly. Possibly, the slightly optimistic success rates bestreflect counselling situations: the couple’s future chances of live birth isbased on the rates of those who continued in the past.
Recently, single centre CLBRs were published by Malizia et al. fromthe Waltham-IVF centre, Boston/USA (Malizia et al., 2009). Com-pared with their optimistic assumptions, our CLBR after six cycles isthe same: 72%. This is very interesting, because of completely differenttreatment strategies in both IVF centres. According to the GermanEmbryo Protection Law, it is not allowed to culture more PN stageoocytes than the embryos which are to be transferred later in thatcycle. Therefore, embryo selection as performed by this and manyother foreign centres probably with prolonged cell-culture is not poss-ible here. We strictly cryopreserved all supernumerous PN stageoocytes for later cryo-cycles. Embryos were cryopreserved only invery rare cases for emergency reasons. Obviously, completely differ-ent treatment strategies may lead to the same results: a CLBR of72% after six treatment cycles. Just for patients over 40 years ofage, we achieved a lower CLBR presumably because of studycohort differences, as there was a high proportion of women over40 entering the IVF programme but then turning to oocyte donationearly in Waltham.
The congruent CPR after ART and CPR in natural cycles (Gnothet al., 2003) (Fig. 4) are in line with recently published simulationmodels (Stanford et al., 2010) and provide reliable experimental evi-dence as support, because of the same methodological approachesin both of our studies. This strongly suggests that ART can reachnatural fertility rates but cannot exceed them.
Most of the patients in this study did not undergo many treatmentcycles (mean 2.7; median 3 with a CLBR of �50%)—even those withreasonable good prognosis for final success—because they probablycould not afford the emotional or financial cost independent of thereimbursement. However, from the medical point of view, there isno reason for generally restricting the number of cycles e.g. tothree, as done in Germany.
It was our intention to calculate final success rates for live birth tofacilitate counselling of couples with infertility problems and tohighlight the potential of ART even under rigorous restrictions bylaw. In this respect, it is important to emphasize again that reproduc-tive medicine can be successful for most couples if they continuetreatment.
Authors’ rolesC.G. played a role in study design, running of the cycles, statisticalanalysis and writing the manuscript. B.M. took part in raw data collec-tion and quality checking. T.S. was involved in raw data preparation,statistical analysis and proofreading. K.F. and J.T. were involved instudy design, running the cycles and proofreading. E.G. took part instatistical mentoring, performing the final statistical analysis andwriting the manuscript.
AcknowledgementsThe authors thank Mrs Sarah Johnson, Bedford, Bedfordshire, UK, forproof reading the manuscript, and the IVF-laboratory staff of green-ivffor recording and preparing the raw data.
FundingThe first author was supported by a grant for statistical analysis byEssex Parma GmbH, Germany, a subsidiary of Merck Sharp &Dohme Corp., a subsidiary of Merck & Co., Inc., WhitehouseStation, NJ, USA.
ReferencesBar-Hava I, Orvieto R, Ferber A, Ashkenazi J, Dicker D, Ben-Rafael Z.
Standard in vitro fertilization or intracytoplasmic sperm injection inadvanced female age—what may be expected? Gynecol Endocrinol1999;13:93–97.
Bergh C, Werner C, Nilsson L, Hamberger L. Cumulative birth ratesfollowing cryopreservation of all embryos in stimulated in vitrofertilization (IVF) cycles. J Assist Reprod Genet 1995;12:191–194.
Croucher CA, Lass A, Margara R, Winston RM. Predictive value of theresults of a first in-vitro fertilization cycle on the outcome ofsubsequent cycles. Hum Reprod 1998;13:403–408.
Damario MA, Hammitt DG, Session DR, Dumesic DA. Embryocryopreservation at the ‘ stage and efficient embryo use optimizes thechance for a liveborn infant from a single oocyte retrieval. Fertil Steril2000;73:767–773.
Dor J, Seidman DS, Ben-Shlomo I, Levran D, Ben-Rafael Z, Mashiach S.Cumulative pregnancy rate following in-vitro fertilization: thesignificance of age and infertility aetiology. Hum Reprod 1996;11:425–428.
Gelbaya TA, Tsoumpou I, Nardo LG. The likelihood of live birth andmultiple birth after single versus double embryo transfer at thecleavage stage: a systematic review and meta-analysis. Fertil Steril2010;94:936–945.
Gnoth C, Frank-Herrmann P, Freundl G, Godehardt D, Godehardt E.Time to pregnancy: results of the German prospective study andimpact on the management of infertility. Hum Reprod 2003;18:1959–1966.
Gnoth C, Godehardt E, Frank-Herrmann P, Friol K, Tigges J, Freundl G.Definition and prevalence of subfertility and infertility. Hum Reprod2005;20:1144–1147.
Gnoth C, Schuring AN, Friol K, Tigges J, Mallmann P, Godehardt E.Relevance of anti-Mullerian hormone measurement in a routine IVFprogram. Hum Reprod 2008;23:1359–1365.
Hendriks DJ, te Velde ER, Looman CW, Bancsi LF, Broekmans FJ.Expected poor ovarian response in predicting cumulative pregnancyrates: a powerful tool. Reprod Biomed Online 2008;17:727–736.
Hull MG. Effectiveness of infertility treatments: choice and comparativeanalysis. Int J Gynaecol Obstet 1994;47:99–108.
Kaplan EL, Meier P. Nonparametric estimation from incompleteobservations. J Am Stat Ass 1958;53:457–481.
Klinkert ER, Broekmans FJ, Looman CW, te Velde ER. A poor response inthe first in vitro fertilization cycle is not necessarily related to a poorprognosis in subsequent cycles. Fertil Steril 2004;81:1247–1253.
Klipstein S, Regan M, Ryley DA, Goldman MB, Alper MM, Reindollar RH.One last chance for pregnancy: a review of 2705 in vitro fertilizationcycles initiated in women age 40 years and above. Fertil Steril 2005;84:435–445.
Kovacs GT, Maclachlan V, Brehny S. What is the probability of conceptionfor couples entering an IVF program? Aust N Z J Obstet Gynaecol 2001;41:207–209.
Lass A, Croucher C, Duffy S, Dawson K, Margara R, Winston RM. Onethousand initiated cycles of in vitro fertilization in women ≥ 40 yearsof age. Fertil Steril 1998;70:1030–1034.
Final ART success rates 2245

Lintsen AM, Braat DD, Habbema JD, Kremer JA, Eijkemans MJ. Candifferences in IVF success rates between centres be explainedby patient characteristics and sample size? Hum Reprod 2010;25:110–117.
Lintsen AM, Eijkemans MJ, Hunault CC, Bouwmans CA, Hakkaart L,Habbema JD, Braat DD. Predicting ongoing pregnancy chances afterIVF and ICSI: a national prospective study. Hum Reprod 2007;22:2455–2462.
Lundin K, Bergh C. Cumulative impact of adding frozen-thawed cycles tosingle versus double fresh embryo transfers. Reprod Biomed Online 2007;15:76–82.
Malizia BA, Hacker MR, Penzias AS. Cumulative live birth rates after in vitrofertilization. N Engl J Med 2009;360:236–243.
Molloy D, Doody ML, Breen T. Second time around: a study of patientsseeking second assisted reproduction pregnancies. Fertil Steril 1995;64:546–551.
Moragianni VA, Penzias AS. Cumulative live birth rates after assistedreproductive technology. Curr Opin Obstet Gynecol 2010;22:189–192.
Olivius K, Friden B, Lundin K, Bergh C. Cumulative probability of live birthafter three in vitro fertilization/intracytoplasmic sperm injection cycles.Fertil Steril 2002;77:505–510.
Osmanagaoglu K, Tournaye H, Camus M, Vandervorst M, Van SA,Devroey P. Cumulative delivery rates after intracytoplasmic sperminjection: 5 year follow-up of 498 patients. Hum Reprod 1999;14:2651–2655.
Pelinck MJ, Knol HM, Vogel NE, Arts EG, Simons AH, Heineman MJ,Hoek A. Cumulative pregnancy rates after sequential treatment withmodified natural cycle IVF followed by IVF with controlled ovarianstimulation. Hum Reprod 2008;23:1808–1814.
Roest J, van Heusden AM, Zeilmaker GH, Verhoeff A. Cumulativepregnancy rates and selective drop-out of patients in in-vitrofertilization treatment. Hum Reprod 1998;13:339–341.
Schroder AK, Katalinic A, Diedrich K, Ludwig M. Cumulative pregnancyrates and drop-out rates in a German IVF programme: 4102 cycles in2130 patients. Reprod Biomed Online 2004;8:600–606.
Sharma V, Allgar V, Rajkhowa M. Factors influencing the cumulativeconception rate and discontinuation of in vitro fertilization treatmentfor infertility. Fertil Steril 2002;78:40–46.
Stanford JB, Mikolajczyk RT, Lynch CD, Simonsen SE. Cumulativepregnancy probabilities among couples with subfertility: effects ofvarying treatments. Fertil Steril 2010;93:2175–2181.
Stolwijk AM, Hamilton CJ, Hollanders JM, Bastiaans LA, Zielhuis GA. Amore realistic approach to the cumulative pregnancy rate after in-vitrofertilization. Hum Reprod 1996;11:660–663.
Stolwijk AM, Wetzels AM, Braat DD. Cumulative probability of achievingan ongoing pregnancy after in-vitro fertilization and intracytoplasmicsperm injection according to a woman’s age, subfertility diag-nosisand primary or secondary subfertility. Hum Reprod 2000;15:203–209.
Sundstrom P, Saldeen P. Cumulative delivery rate in an in vitro fertilizationprogram with a single embryo transfer policy. Acta Obstet Gynecol Scand2009;88:700–706.
Tan SL, Royston P, Campbell S, Jacobs HS, Betts J, Mason B, Edwards RG.Cumulative conception and livebirth rates after in-vitro fertilisation.Lancet 1992;339:1390–1394.
Ubaldi F, Rienzi L, Baroni E, Ferrero S, Iacobelli M, Minasi MG, Sapienza F,Martinez F, Anniballo R, Cobellis L et al. Cumulative pregnancy ratesafter transfer of fresh and thawed embryos. Eur J Obstet GynecolReprod Biol 2004;115(Suppl 1):S106–S109.
Verberg MF, Eijkemans MJ, Heijnen EM, Broekmans FJ, de KC, Fauser BC,Macklon NS. Why do couples drop-out from IVF treatment? Aprospective cohort study. Hum Reprod 2008;23:2050–2055.
Verhagen TE, Dumoulin JC, Evers JL, Land JA. What is the most accurateestimate of pregnancy rates in IVF dropouts? Hum Reprod 2008;23:1793–1799.
2246 Gnoth et al.

598 n www.ajmc.com n september 2008
n POLICY n
© Managed Care &Healthcare Communications, LLC
T he past decade has witnessed a dramatic increase in the de-mand for assisted reproductive technology (Art) such as in vitro fertilization (IVF).1,2 Increasing demand for Art is
related to increased infertility in modern populations, which may be attributed to couples’ delaying efforts to get pregnant until they are older and less fertile, increasing obesity in the United states, sexually transmitted diseases, low sperm count, and the stress of modern daily life.3-6 In countries where generous funding for fertility treatments is available, Art accounts for 4% to 6% of national births every year.1,2 When the proportion of children born every year from Art is couched within the population aging debate faced by many countries and the economic consequences this creates, policy analysts have started to investigate the role that fertility treatments could play in solving se-vere demographic issues associated with an aging population and the resulting insolvency of social security.7-10
Despite increasing demand for Art treatments, financial constraints are causing many national health providers and private insurers to limit access, and most couples must pay out-of-pocket for these services.11 For couples unable to afford Art, the options are limited; consequently, many withdraw from treatment or choose not to pursue treatment be-cause of costs.12-14 Furthermore, the established relationship between af-fordability and utilization of services would suggest that many couples are unable to receive treatment, with the likely consequence of fewer children being born every year.15
the economic and health consequences of financial barriers to medical treatment are frequent topics of interest for health economists and policy analysts.16-18 With respect to Art services, treatment barriers create an additional issue, as successful use of this technology leads to the creation of human life that would not have been born were the technology not available. the immediate benefit of Art success is to fulfill a couple’s desired family size, which leads to quality-of-life improvements. However, what is less well characterized is the economic effect that IVF-conceived children will make once they become economically active adults.
to assess the economic consequences of IVF-conceived children, we developed a mathematical model that explores the lifetime financial transactions between a single in-dividual conceived by IVF and the government under a theoretical as-sumption that the government paid standard fees for that IVF treatment.
In this issue Take-away Points / p602 www.ajmc.com Full text and PDF
Long-term economic benefits Attributed to IVF-conceived Children: A Lifetime tax Calculation
Mark P. Connolly, MHE; Michael S. Pollard, PhD; Stijn Hoorens, MSc; Brian R. Kaplan, MD;
Selwyn P. Oskowitz, MD; and Sherman J. Silber, MD
Objective: To evaluate whether lifetime future net tax revenues from an in vitro fertilization (IVF)-conceived child are substantial enough to warrant public subsidy relative to the mean IVF treatment costs required to obtain 1 live birth.
Study Design: Mathematical generational account-ing model.
Methods: The model estimates direct financial interactions between the IVF-conceived child and the government during the child’s projected life-time. In the model, we accrue IVF costs required to conceive the child to the government, and then we estimate future net tax revenue to the federal and state governments from this individual, offset by direct financial transfers from the government (eg, child allowances, education, Medicare, and Social Security). We discount lifetime costs and gross tax payments at Treasury Department rates to establish the present value of investing in IVF. We applied US Congressional Budget Office projected changes in tax rates over the course of the model.
Results: An IVF-conceived child, average in every respect (eg, future earnings, healthcare consumption, and life expectancy), represents a net positive return to the government. Based on an average employed individual born in 2005, the projected net lifetime tax contribution is US $606,200. Taking into consideration IVF costs and all direct financial interactions, the net present value is US $155,870.
Conclusions: Lifetime net taxes paid from a child relative to the child’s initial IVF investment represent a 700% net return to the government in discounted US dollars from fully employed individuals. This suggests that removing barriers to IVF would have positive tax benefits for the government, notwithstanding its beneficial effect on overall economic growth.
(Am J Manag Care. 2008;14(9):598-604)
For author information and disclosures, see end of text.

VOL. 14, NO. 9 n tHe AmerICAN JOUrNAL OF mANAGeD CAre n 599
Long-term Economic Benefits Attributed to IVF-conceived Children
to evaluate whether investing in IVF represents sound fis-cal policy for the government, we theoretically assigned IVF costs to the Us government in the model. the methods applied herein are based on generational accounting (GA) methods developed by Kotlikoff et al19,20 and sturrock21 and used by treasury departments, including the Us Congressio-nal budget Office, to assess whether current fiscal policies will adversely affect future generations (ie, shift costs to fu-ture generations). In this article, we describe a GA model to assess future net tax revenues derived from a hypotheti-cal IVF-conceived child to establish whether policies that increase access to IVF treatment would generate long-term economic benefits. It is envisaged that this analysis can in-form government and nongovernment agencies with a vested interest in future population age structures. such an analysis is urgently needed in view of declining birthrates, increasing numbers of aging retired persons, and the predicted insol-vency of social security.
METHODSbased on the Us GA model developed by Kotlikoff,19 a ba-
sic mathematical model was developed taking the perspective of the Us government to estimate the discounted lifetime net tax contribution derived from a single individual. the model describes the financial position between the child and the government during the child’s projected lifetime. For com-parison, the model estimates lifetime net tax contributions for a naturally conceived versus an IVF-conceived child, where the major cost difference is assumed to be IVF treatment costs and any extra costs related to the child’s care. In this model, we assign IVF costs to the government to assess the merits of funding such a policy. All direct government expenditures and tax contributions were discounted using treasury Depart-ment rates.
Conceptually, there are 3 broad stages in lifetime financial interactions, each with differing components of the financial exchange, as follows: (1) early life, when the government primarily contributes resources to individuals through child tax credits, healthcare, and educational expenses; (2) em-ployment, when individuals begin returning resources to the government through federal, state, and local taxes; and (3) re-tirement, when the government expends additional resources on social security and old-age programs.
two general models are estimated. the first model assumes that individuals graduate from high school and then follow the average higher education, employment, and unemploy-ment trends (hereafter referred to as average employment). the second model assumes full-time education from ages 6 to 19 years, with full-time employment from age 20 years until
retirement at age 65 years (hereafter referred to as full em-ployment). the models assume that successful IVF treatment results in a single live birth (with a mean life expectancy of 79 years) and that the child is identical to a naturally conceived individual.22,23 In all scenarios, the model includes hospital delivery costs, taking into consideration additional costs fre-quently accrued to IVF-conceived children attributed to low birth weight.24,25
Age-graded government expenses and tax contributions were assessed across a hypothetical individual’s lifetime to de-rive discounted lifetime net tax contributions using net pres-ent value (NpV) calculations and undiscounted lifetime net tax contributions. Following similar GA calculations used to assess Us immigration policy, we consider various costs gener-ated and taxes paid.26,27
Expenditurestwo broad categories of federal and state government ex-
penditures are considered, congestible goods and transfer pro-grams.28 Congestible goods have nonzero marginal costs and include expenditures such as roads, fire and police protection, airports, and sewers. transfer programs include all government expenditures that can be assigned to specific individuals such as social security, supplemental security Income, medicare, medicaid, Aid to Families With Dependent Children, pub-lic assistance, food stamps, unemployment benefits, disability benefits, subsidized school lunch programs, and public educa-tion at all levels. there is also a child tax credit associated with individuals until age 17 years.
Revenuesrevenues collected by the government include federal and
state income tax (the national mean rate in this model), cor-porate tax, excise tax, Federal Insurance Contributions Act tax, supplemental medical Insurance contributions, federal retirement tax, property tax, and sales tax. to calculate the accounting models, age profiles of each expenditure and rev-enue component were identified from existing data sources. because the models describe financial interactions across an individual’s lifetime, these age profiles are adjusted to account for depreciation of money over time through the application of a discount rate. the Us Congressional budget Office 2007 projections were used as the basis for estimates of inflation, individual earnings increases, tax rate increases, increases in supplemental medical Insurance revenue, and medicare and medicaid expenditures.29 Increases in expenditures on schooling are based on historical rates of increase.30 beyond the period for which these long-term forecasts are available, we assume that particular components grow to keep pace with demographic and productivity growth. A discount rate of 4%

600 n www.ajmc.com n september 2008
n POLICY n
to the government at all ages minus expenditures at all ages as follows:
where Rt indicates the sum of all revenues accruing from the individual at age t; Et, the sum of all expenditures on the in-dividual at age t; r, the rate of discount; T, the life expectancy at birth; and Ko, the initial direct costs of IVF in the base period. For individuals conceived by IVF, the direct cost of achieving a live birth is included in the expenditures as con-sisting of the cost of IVF treatment and the mean additional hospital costs associated with low birth weight attributed to IVF infants.24,25
RESULTSthe projected lifetime net tax contribution trajectories for
an average employment naturally conceived child and for an IVF-conceived child are shown in the Figure. there is a net increase in government revenue by age 37 years for naturally conceived children versus by age 40 years for an IVF-conceived child. the additional costs attributed to conceiving an IVF child are shown as an increased cost at birth. In all simulations, the financial position between the child and the government changes as the child enters the workforce and again at the point of leaving full-time employment, with a net profit to the taxing authority. In vitro fertilization coverage represents a mi-nor component of the net cost for creation of new taxpayers.
the projected combined returns to the federal and state governments in lifetime net tax contributions from an IVF-
NPV = Ko T
t = 0 Σ R t − E t
(1 + r )t −
was applied to lifetime tax revenue and transfer payments. the discount rate was compounded continuously.
IVF Treatment Costs. the mean IVF treatment costs to produce a live birth are considered herein as a further expense unique to an individual conceived using IVF. the national mean cost per IVF treatment cycle in 2003 is Us $12,400.31 Cost per live birth is calculated as the mean cost per cycle divided by the age-adjusted probability of a live birth, where the treatment efficacy is known to vary primarily by the age of the mother (ie, lower success rates with older age) and by other factors.31-34 the age-adjusted cost per live birth is given in Table 1.
Data Sources. Analyses are based primarily on 2 waves of the annual march Current population survey.35 the Cur-rent population survey is a monthly survey of about 50,000 households conducted by the bureau of the Census for the bu-reau of Labor statistics and is the primary source of informa-tion on the labor force characteristics of the Us population. the sample is representative of the civilian noninstitutional population. estimated sales tax revenue is obtained from the Consumer expenditure survey, also conducted by the bureau of Labor statistics. Government expenditures on congestible goods are obtained from the Us statistical Abstract, follow-ing prior work.26 educational expenditures are taken from the Digest of Education Statistics.30
Calculation of NPV. Given the baseline assumptions for the age profiles of expenditures and revenues, the net fi-nancial exchange of an individual at any age is derived in the accounting models simply as the discounted sum of all the economic components up to that age. specifically, life-time individual NpV is the discounted sum of all revenues
n Table 1. Discounted Lifetime Net Tax Contributions and Breakeven Ages Based on Average Employment and on Full Employmenta
Average Employment Full Employment (ages 20-64 y)
Method of Conception and Age of Mother, y
Age-adjusted Cost per Live Birth
Using IVF, US $b
Breakeven
Age, y
Discounted Lifetime Net Tax
Contribution, US $
Breakeven
Age, y
Discounted Lifetime Net Tax
Contribution, US $
Natural, all ages Not applicable 37 190,515 34 292,285
IVF
<35 27,373 40 160,540 36 266,310
35-37 32,041 40 155,870 37 257,640
38-40 43,509 41 144,405 38 246,175
41-42 158,225 44 116,240 40 218,007
IVF indicates in vitro fertilization. aThe average employment model assumes that individuals graduate from high school and then follow the average higher education, employment, and unemployment trends. The full employment model assumes full-time education from ages 6 to 19 years, with full-time employment from age 20 years until retirement at age 65 years. The breakeven point is the age at which the financial position between an individual and the state becomes positive in favor of the state. bDerived from the mean IVF cost per cycle divided by the age-adjusted probability of live birth.

VOL. 14, NO. 9 n tHe AmerICAN JOUrNAL OF mANAGeD CAre n 601
Long-term Economic Benefits Attributed to IVF-conceived Children
conceived child and from a naturally conceived child are given in table 1. For a naturally con-ceived child, the mean discounted lifetime tax contribution amounts to Us $292,285 for full employment; the projected net undiscounted lifetime tax contribution for a full employ-ment individual born in 2005 is Us $1,103,000 (Table 2). For IVF-conceived children, the net undiscounted lifetime tax contribution is simi-lar to that for naturally conceived children even after IVF investment costs are factored into the analysis.
the age at which the financial position between a naturally conceived child and an IVF-conceived child changes with respect to the taxing authority is given in table 1. We have labeled this as the breakeven age to high-light the age at which the government has recouped all direct financial transfers (discounted) in the early years to achieve working-age participation. Assuming full employment, the breakeven ages with net profit to the government are 34 years for naturally conceived children and 36 to 38 years for IVF children conceived to mothers younger than 41 years. the difference in the breakeven age for IVF-conceived children compared with naturally con-ceived children differs by 2 to 5 years depending on varia-tions in increasing IVF investment costs attributed to older mothers.12,32
DISCUSSIONthe approach used in this model assesses medical costs at-
tributed to conceiving an IVF child as an investment required to achieve a live birth with consequent long-term economic returns. It is likely that the conceptual model described here-in is of most relevance to countries with nationally funded health services where the taxing authority and the health service are 2 components of the overall government. Under these circumstances, the national health service pays for or provides IVF treatment, and the tax authority will collect tax revenue from the IVF-conceived child when he or she reaches working age.
there are obvious flaws in applying this methodological approach in the United states, where there is a clear separa-tion between the payer (eg, infertile couples and private in-surers) and the beneficiary of future tax payments from IVF children (ie, Internal revenue service). Despite these short-comings, we have positioned IVF medical costs as accruing to the government to inform government health policy in this area and to stimulate debate.
the analysis described herein has taken the perspective of the taxing authority, where net tax contributions (ie, gross tax contributions minus direct government transfers and con-gestibles) are the sole economic variable considered. because our approach has taken the perspective of the government, there are limitations to our model, which does not consider the broader economic benefits that individuals contribute to a country’s economic growth. Consequently, the analysis pre-sented herein is an underestimate of the true economic con-tributions that an individual has on the economy as a whole because we have not considered the gross domestic product contribution brought about by the increased demand for goods and services generated by this individual.
the methods applied in our work are based on GA, a meth-od frequently used by government treasury departments as an alternative to the more commonly applied deficit accounting, which only considers current year accounts. Using GA helps bridge the gap between what has been promised in the future (eg, medicare and social security payments) in relation to future revenue generated predominantly through taxation. From the government revenue–generating perspective, the number of taxpayers and the mean tax contribution per indi-vidual are relevant, as well as the importance of current birth-rates, which will directly influence the number of taxpayers in the future and, depending on future spending promises, the tax rates paid by future generations.19,20 Considering the effect that birthrates have on future fiscal imbalances between cur-rent and future generations, we believe that our approach is acceptable for evaluating IVF technology because of its estab-lished ability to significantly affect national birthrates.1,2,9
several simplifying assumptions were made during the course of the work that can be challenged. In particular, cli-
n Figure. Lifetime Net Tax Contribution Trajectories Discounted at 3% Between the State and an Average Employment Naturally Con-ceived Individual vs In Vitro Fertilization (IVF)-conceived Individual
300,000
250,000
Age, yN
et P
rese
nt V
alu
e o
f Li
feti
me
Net
Tax
Rev
enu
eD
isco
un
ted
at
3%, U
S $ 200,000
150,000
100,000
50,000
0
−50,000
−100,000
−150,000
−200,000
1 6 11 16 21 26 31 36 41 46 51 56 61 66 71 76 81 86
IVF conceivedNaturally conceived
The average employment model assumes that individuals graduate from high school and then follow the average higher education, employment, and unemployment trends.

602 n www.ajmc.com n september 2008
n POLICY n
nicians may criticize the assumption that IVF children are identical to naturally conceived children. Although we have adjusted initial costs to compensate for lower birth weight, we do not treat the subsequent education and employment trajectories of these individuals differently from those of nat-urally conceived individuals. Furthermore, additional medical costs frequently arise as a result of multiple pregnancies and pre-mature birth. However, it is likely that much of this increased risk can be mitigated by a reduction in embryos transferred and multiple births when the burden of success is shared by a third-party payer.36,37 For example, following the belgian example, the government agreed to fund up to 6 IVF cycles for every infertile couple, while simultaneously regulating the number of embryos transferred in each cycle.38 support of IVF allows the funding authority to limit the number of embryos transferred and to obviate any of the extra risks associated with patient-funded IVF. the net result of this policy change for belgium was a cost saving attributed to a reduction in multiple pregnancies.
In our model, we assumed that a child born from IVF would achieve average lifetime income earnings, which may be an oversimplification of future earnings based on current IVF utilization. What is known at present is that those seek-ing treatment for infertility and undergoing IVF are not rep-resentative of the Us population because racial/ethnic and economic factors define treatment-seeking behavior.39,40 In
the current environment, which is de-pendent on out-of-pocket payments, those accessing and using IVF services are overrepresented by individuals with higher socioeconomic backgrounds and with the financial means to pay for IVF.41,42 As a consequence of an increased proportion of higher socio-economic families accessing infertility treatments, IVF children are more likely to achieve higher socioeconomic status in their lifetimes.43 this is further sup-ported by research suggesting that IVF-
conceived children obtain higher academic scores compared with naturally conceived children.44 this would suggest that in the present IVF access environment children conceived through IVF are likely to make future tax contributions above the mean figures described in our results.
the disparity in IVF utilization based on socioeconomic status raises questions regarding what could happen if barri-ers to IVF were lowered, allowing for a broader range of so-cioeconomic groups to access treatment. In our model, the calculations are based on the statistical mean for lifetime income, which is based on income from all socioeconomic groups, low and high. On this basis, if an increased propor-tion of families of lower socioeconomic status accessed IVF, this would not affect the conclusions of our work because the lower earning capacity has already been accounted for in the average lifetime financial calculations.
One of the underlying aims of this research is to high-light that economic barriers limit access to infertility treat-ments and that costs attributed to infertility are dependent on the perspective and the period during which costs and benefits are observed. based on our analysis, we suggest that discounted future net tax contributions derived from IVF-conceived children could be used to justify government-funded IVF programs. Our work also highlights that there is a cost associated with not treating infertility in the form of lost tax revenue, which to the best of our knowledge has
never been quantified. this study is not the first application of GA principles to address important policy questions. previous explorations using GA models have evaluated the effect of Us immi-gration policies on government fiscal imbalances.45 Although it is tempting to compare our findings with those from immigration policy, we believe that this is not feasible because immigration and fertility policies are shaped by different
n Table 2. Undiscounted Lifetime Gross Tax Contributions for Average Employment and for Full Employmenta
Take-away Pointsn Financial and legislative barriers to fertility treatments prevent many couples from achiev-ing their desired family size, resulting in fewer children being born.
n Taking the perspective of the government, fewer children born in current generations represents a loss in future tax revenue that would arise from these children after they enter the workforce.
n The costs attributed to in vitro fertilization (IVF) treatment are insignificant in light of the lifetime net tax contributions of IVF-conceived children.
n Minimizing barriers to fertility treatments is likely to have long-term economic benefits that need to be considered when making IVF funding decisions.
Undiscounted Lifetime Gross Tax Contribution, US $
Method of Conception
Average Employment
Full Employment (ages 20-64 y)
Natural 633,600 1,103,000
In vitro fertilization 606,200 1,076,000
aThe average employment model assumes that individuals graduate from high school and then follow the average higher education, employment, and unemployment trends. The full employ-ment model assumes full-time education from ages 6 to 19 years, with full-time employment from age 20 years until retirement at age 65 years.
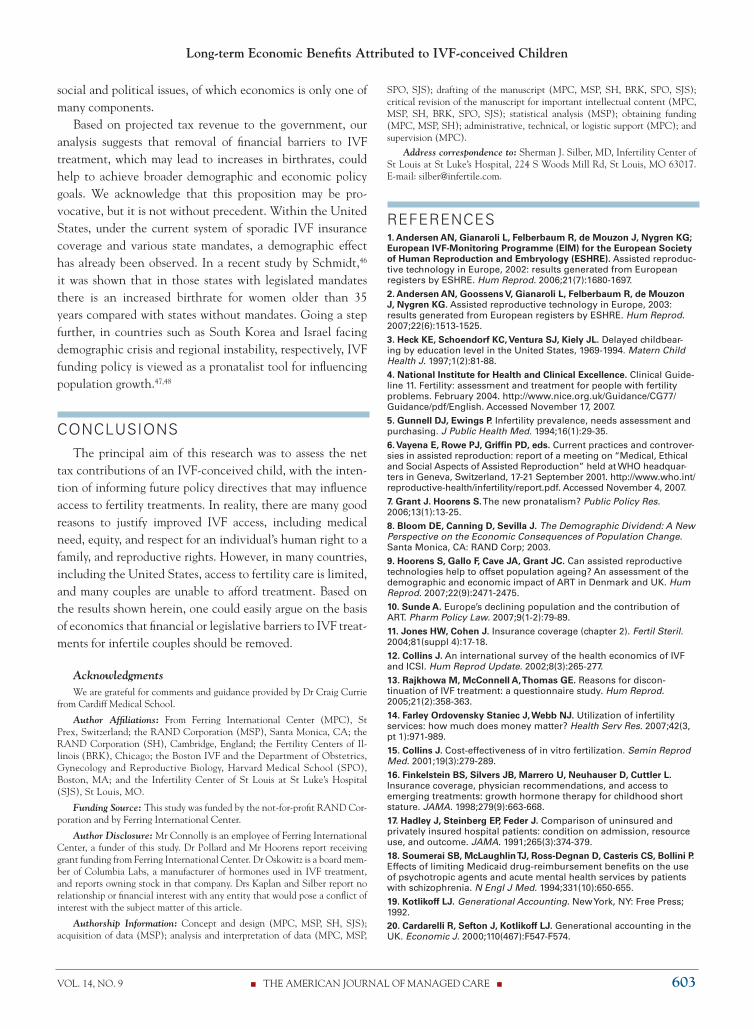
VOL. 14, NO. 9 n tHe AmerICAN JOUrNAL OF mANAGeD CAre n 603
Long-term Economic Benefits Attributed to IVF-conceived Children
social and political issues, of which economics is only one of many components.
based on projected tax revenue to the government, our analysis suggests that removal of financial barriers to IVF treatment, which may lead to increases in birthrates, could help to achieve broader demographic and economic policy goals. We acknowledge that this proposition may be pro-vocative, but it is not without precedent. Within the United states, under the current system of sporadic IVF insurance coverage and various state mandates, a demographic effect has already been observed. In a recent study by schmidt,46 it was shown that in those states with legislated mandates there is an increased birthrate for women older than 35 years compared with states without mandates. Going a step further, in countries such as south Korea and Israel facing demographic crisis and regional instability, respectively, IVF funding policy is viewed as a pronatalist tool for influencing population growth.47,48
CONCLUSIONSthe principal aim of this research was to assess the net
tax contributions of an IVF-conceived child, with the inten-tion of informing future policy directives that may influence access to fertility treatments. In reality, there are many good reasons to justify improved IVF access, including medical need, equity, and respect for an individual’s human right to a family, and reproductive rights. However, in many countries, including the United states, access to fertility care is limited, and many couples are unable to afford treatment. based on the results shown herein, one could easily argue on the basis of economics that financial or legislative barriers to IVF treat-ments for infertile couples should be removed.
AcknowledgmentsWe are grateful for comments and guidance provided by Dr Craig Currie
from Cardiff medical school.
Author Affiliations: From Ferring International Center (mpC), st prex, switzerland; the rAND Corporation (msp), santa monica, CA; the rAND Corporation (sH), Cambridge, england; the Fertility Centers of Il-linois (brK), Chicago; the boston IVF and the Department of Obstetrics, Gynecology and reproductive biology, Harvard medical school (spO), boston, mA; and the Infertility Center of st Louis at st Luke’s Hospital (sJs), st Louis, mO.
Funding Source: this study was funded by the not-for-profit rAND Cor-poration and by Ferring International Center.
Author Disclosure: mr Connolly is an employee of Ferring International Center, a funder of this study. Dr pollard and mr Hoorens report receiving grant funding from Ferring International Center. Dr Oskowitz is a board mem-ber of Columbia Labs, a manufacturer of hormones used in IVF treatment, and reports owning stock in that company. Drs Kaplan and silber report no relationship or financial interest with any entity that would pose a conflict of interest with the subject matter of this article.
Authorship Information: Concept and design (mpC, msp, sH, sJs); acquisition of data (msp); analysis and interpretation of data (mpC, msp,
spO, sJs); drafting of the manuscript (mpC, msp, sH, brK, spO, sJs); critical revision of the manuscript for important intellectual content (mpC, msp, sH, brK, spO, sJs); statistical analysis (msp); obtaining funding (mpC, msp, sH); administrative, technical, or logistic support (mpC); and supervision (mpC).
Address correspondence to: sherman J. silber, mD, Infertility Center of st Louis at st Luke’s Hospital, 224 s Woods mill rd, st Louis, mO 63017. e-mail: [email protected].
REFERENCES1. Andersen AN, Gianaroli L, Felberbaum R, de Mouzon J, Nygren KG; European IVF-Monitoring Programme (EIM) for the European Society of Human Reproduction and Embryology (ESHRE). Assisted reproduc-tive technology in Europe, 2002: results generated from European registers by ESHRE. Hum Reprod. 2006;21(7):1680-1697.2. Andersen AN, Goossens V, Gianaroli L, Felberbaum R, de Mouzon J, Nygren KG. Assisted reproductive technology in Europe, 2003: results generated from European registers by ESHRE. Hum Reprod. 2007;22(6):1513-1525.3. Heck KE, Schoendorf KC, Ventura SJ, Kiely JL. Delayed childbear-ing by education level in the United States, 1969-1994. Matern Child Health J. 1997;1(2):81-88.4. National Institute for Health and Clinical Excellence. Clinical Guide-line 11. Fertility: assessment and treatment for people with fertility problems. February 2004. http://www.nice.org.uk/Guidance/CG77/Guidance/pdf/English. Accessed November 17, 2007. 5. Gunnell DJ, Ewings P. Infertility prevalence, needs assessment and purchasing. J Public Health Med. 1994;16(1):29-35.6. Vayena E, Rowe PJ, Griffin PD, eds. Current practices and controver-sies in assisted reproduction: report of a meeting on “Medical, Ethical and Social Aspects of Assisted Reproduction” held at WHO headquar-ters in Geneva, Switzerland, 17-21 September 2001. http://www.who.int/reproductive-health/infertility/report.pdf. Accessed November 4, 2007.7. Grant J. Hoorens S. The new pronatalism? Public Policy Res. 2006;13(1):13-25.8. Bloom DE, Canning D, Sevilla J. The Demographic Dividend: A New Perspective on the Economic Consequences of Population Change. Santa Monica, CA: RAND Corp; 2003.9. Hoorens S, Gallo F, Cave JA, Grant JC. Can assisted reproductive technologies help to offset population ageing? An assessment of the demographic and economic impact of ART in Denmark and UK. Hum Reprod. 2007;22(9):2471-2475.10. Sunde A. Europe’s declining population and the contribution of ART. Pharm Policy Law. 2007;9(1-2):79-89.11. Jones HW, Cohen J. Insurance coverage (chapter 2). Fertil Steril. 2004;81(suppl 4):17-18.12. Collins J. An international survey of the health economics of IVF and ICSI. Hum Reprod Update. 2002;8(3):265-277.13. Rajkhowa M, McConnell A, Thomas GE. Reasons for discon-tinuation of IVF treatment: a questionnaire study. Hum Reprod. 2005;21(2):358-363.14. Farley Ordovensky Staniec J, Webb NJ. Utilization of infertility services: how much does money matter? Health Serv Res. 2007;42(3, pt 1):971-989.15. Collins J. Cost-effectiveness of in vitro fertilization. Semin Reprod Med. 2001;19(3):279-289.16. Finkelstein BS, Silvers JB, Marrero U, Neuhauser D, Cuttler L. Insurance coverage, physician recommendations, and access to emerging treatments: growth hormone therapy for childhood short stature. JAMA. 1998;279(9):663-668.17. Hadley J, Steinberg EP, Feder J. Comparison of uninsured and privately insured hospital patients: condition on admission, resource use, and outcome. JAMA. 1991;265(3):374-379.18. Soumerai SB, McLaughlin TJ, Ross-Degnan D, Casteris CS, Bollini P. Effects of limiting Medicaid drug-reimbursement benefits on the use of psychotropic agents and acute mental health services by patients with schizophrenia. N Engl J Med. 1994;331(10):650-655.19. Kotlikoff LJ. Generational Accounting. New York, NY: Free Press; 1992.20. Cardarelli R, Sefton J, Kotlikoff LJ. Generational accounting in the UK. Economic J. 2000;110(467):F547-F574.

604 n www.ajmc.com n september 2008
n POLICY n
21. Sturrock J. Who Pays and When? An Assessment of Generational Accounting. Washington, DC: Macroeconomic Analysis Division, Con-gressional Budget Office, Congress of the United States; 1995.22. Bonduelle M, Liebaers I, Deketelaere V, et al. Neonatal data on a cohort of 2889 infants born after ICSI (1991-1999) and of 2995 infants born after IVF (1983-1999). Hum Reprod. 2002;17(3):671-694.
23. Silber SJ. Will my baby be normal? In: How to Get Pregnant. New York, NY: Little Brown & Co; 2005:273-324.
24. Almond D, Chay KY, Lee DS. The costs of low birth weight. Q J Econ. 2005;120(3):1031-1083.
25. Schieve LA, Ferre C, Peterson HB, Macaluso M, Reynolds MA, Wright VC. Perinatal outcome among singleton infants conceived through assisted reproductive technology in the United States. Obstet Gynecol. 2004;103(6):1144-1153.
26. Lee RD, Miller TW. The current fiscal impact of immigrants and their descendants: beyond the immigrant household. In: Smith JP, Edmonston B, eds. The Immigration Debate: Studies on the Eco-nomic, Demographic, and Fiscal Effects of Immigration. Washington, DC: National Academy Press; 1998:183-205.
27. Smith JP, Edmonston B, eds; National Research Council. The New Americans: Economic, Demographic and Fiscal Impacts of Immigra-tion. Washington, DC: National Academy Press; 1997.
28. MaCurdy T, Nechyba T, Bhattacharya J. An economic framework for assessing the fiscal impacts of immigration. In: Smith JP, Edmonston B, eds. The Immigration Debate: Studies on the Economic, Demo-graphic, and Fiscal Effects of Immigration. Washington, DC: National Academy Press; 1998:13-65.
29. Congressional Budget Office. The budget and economic outlook: fiscal years 2008-2017. http://www.cbo.gov/ftpdocs/77xx/doc7731/01-24-BudgetOutlook.pdf. Accessed November 2, 2007.
30. Snyder TD, Tan AG, Hoffman CM. Digest of Education Statistics 2005 (NCES 2006-030). Washington, DC: National Center for Educa-tion Statistics, US Dept Education; 2006.
31. Wright VC, Schieve LA, Reynolds MA, Jeng G; Division of Repro-ductive Health, National Center for Chronic Disease Prevention and Health Promotion, Centers for Disease Control and Prevention (CDC). Assisted reproductive technology surveillance: United States, 2002. MMWR Surveill Summ. 2005;54(2):1-24.
32. Centers for Disease Control and Prevention. Assisted Reproductive Technology Success Rates: National Summary and Fertility Clinic Re-port (2004). Atlanta, GA: Centers for Disease Control and Prevention, US Dept Health and Human Services; 2006.
33. Lintsen AME, Eijkemans MJC, Hunault CC, et al. Predicting ongo-ing pregnancy chances after IVF and ICSI: a national prospective study. Hum Reprod. 2007;22(9):2455-2462.34. Callahan TL, Hall JE, Ettner SL, Christiansen CL, Greene ME, Crowley WF. The economic impact of multiple-gestation pregnancies and the contribution of assisted-reproduction techniques to their incidence. N Engl J Med. 1994;331(4):244-249.
35. Current Population Survey. US Department of Labor, Bureau of Labor Statistics, panel data 2003 and 2004. http://www.bls.gov/cps/publications.htm. Accessed November 2, 2007.
36. Smith S, Pfeifer SM, Collins JA. Diagnosis and management of female infertility. JAMA. 2003;290(13):1767-1770.
37. Frankfurter D. To insure or not to insure: that is the question. Fertil Steril. 2003;80(1):24-26.
38. Ombelet W. Access to assisted reproduction services and infertility treatment in Belgium in the context of the European countries. Pharm Policy Law. 2007;9:189-201.
39. Chandra A, Stephen EH. Impaired fecundity in the United States: 1982-1995. Fam Plann Perspect. 1998;30(1):34-42.
40. White L, McQuillan J, Greil AL. Explaining disparities in treatment seeking: the case of infertility. Fertil Steril. 2006;85(4):853-857.
41. Bitler M, Schmidt L. Health disparities and infertility: impacts of state-level insurance mandates. Fertil Steril. 2006;85(4):858-865.
42. Stephen EH, Chandra A. Use of infertility services in the United States: 1995. Fam Plann Perspect. 2000;32(3):132-137.
43. Ashenfelter P, Layard R, eds. Handbook of Labor Economics. Vol 1-3. Oxford, England: Elsevier North Holland; 1986.
44. Leunens L, Celestin-Westreich S, Bonduelle M, Liebaers I, Ponjaert-Kristoffersen I. Cognitive and motor development of 8-year-old children born after ICSI compared to spontaneously conceived children. Hum Reprod. 2006;21(11):2922-2929.
45. Auerbach AJ, Oreopoulos P. Generational Accounting and Im-migration in the United States. Cambridge, MA: National Bureau of Economic Research; March 1999. NBER Working Paper W7041.
46. Schmidt L. Effects of infertility insurance mandates on fertility. J Health Econ. 2007;26(3):431-446.
47. Kim CW. Daring population policy [editorial]. Korean Herald. March 2, 2007:3568.
48. Birenbaum-Carmeli D. Cheaper than a newcomer: on the social production of IVF policy in Israel. Sociol Health Illn. 2004;26(7):897-924. n