MM-DTI: Visualization and segmentation tool for diffusion tensor images
10
MM-DTI: Visualization and segmentation tool for diffusion tensor images Renan R.S. Lobo, Leticia Rittner, Roberto A. Lotufo and L´ eo P. Magalh˜ aes * 1 School of Electrical and Computer Engineering University of Campinas - UNICAMP C.P. 6101, 13083-852, Campinas (SP), Brazil {lrittner,lotufo}@dca.fee.unicamp.br Abstract. In this paper we present the MM-DTI, a tool that offers diffusion ten- sor processing functionalities based on mathematical morphology operators. Through a graphic user interface, it is possible to configure and visualize a diffusion tensor image, to compute its tensorial morphological gradient (TMG) and finally, to segment it using the watershed transform. It offers three different visualization modes (tensor glyphs, volume rendering and tracts), three color mappings (FA-based, TMG-based and Segmentation-based) and an extra fea- ture which provides an animation of the movement of water molecules through the interpolation of the objects position on the grid in the orientation and direc- tion of the tensors principal eigenvector. 1. Introduction Diffusion tensor imaging (DTI) is a relatively new Magnetic Resonance Imaging (MRI) modality able to quantify the anisotropic diffusion of water molecules in highly structured biological tissues [Basser and Pierpaoli 1996]. DTI has been used to demonstrate sub- tle abnormalities in a variety of diseases (including stroke, multiple sclerosis, dyslexia, Alzheimer and schizophrenia) and is currently becoming part of many routine clinical protocols [Eriksson et al. 2001, Assaf et al. 2003, Symms et al. 2004]. One of the fundamental problems in understanding and working with diffusion tensor data is its three-dimensional and multi-variate nature. Visualizing such tensor fields is not a trivial task. Various techniques for visualizing diffusion tensor data were reported so far [Westin et al. 2002, Zhang et al. 2004, Vilanova et al. 2005] and can be categorized in two groups. One is the series of image-based methods in which each voxel value re- presents local anisotropy measure or principle direction of diffusion, and the 3D rendering of those images by volume rendering or surface rendering of the isosurface. The other is the group of symbolic (or geometric) display methods by using various types of glyph such as ellipsoids. A few DTI visualization tools have been recently developed and can be found in [Park et al. 2004, Fillard 2005, Jiang et al. 2006, Fillard et al. 2009]. DTI-based segmentation is relatively new and is also a very challenging task. Only in the last decade some approaches for DTI-based segmentation have been pro- posed [Weldeselassie and Hamarneh 2007, Wang and Vemuri 2005, Awate and Gee 2007]. This work presents the MM-DTI, a free, open source tool that deal with these two important problems of DTI: visualization and segmentation. Its visualization approach * Thanks to CNPq and to SAE/UNICAMP for funding. 1580
Transcript of MM-DTI: Visualization and segmentation tool for diffusion tensor images
MM-DTI: Visualization and segmentation toolfor diffusion tensor images
Renan R.S. Lobo, Leticia Rittner, Roberto A. Lotufo and Leo P. Magalhaes∗
1School of Electrical and Computer EngineeringUniversity of Campinas - UNICAMP
C.P. 6101, 13083-852, Campinas (SP), Brazil
{lrittner,lotufo}@dca.fee.unicamp.br
Abstract. In this paper we present the MM-DTI, a tool that offers diffusion ten-sor processing functionalities based on mathematical morphology operators.Through a graphic user interface, it is possible to configureand visualize adiffusion tensor image, to compute its tensorial morphological gradient (TMG)and finally, to segment it using the watershed transform. It offers three differentvisualization modes (tensor glyphs, volume rendering and tracts), three colormappings (FA-based, TMG-based and Segmentation-based) and an extra fea-ture which provides an animation of the movement of water molecules throughthe interpolation of the objects position on the grid in the orientation and direc-tion of the tensors principal eigenvector.
1. IntroductionDiffusion tensor imaging (DTI) is a relatively new MagneticResonance Imaging (MRI)modality able to quantify the anisotropic diffusion of water molecules in highly structuredbiological tissues [Basser and Pierpaoli 1996]. DTI has beenused to demonstrate sub-tle abnormalities in a variety of diseases (including stroke, multiple sclerosis, dyslexia,Alzheimer and schizophrenia) and is currently becoming part of many routine clinicalprotocols [Eriksson et al. 2001, Assaf et al. 2003, Symms et al. 2004].
One of the fundamental problems in understanding and working with diffusiontensor data is its three-dimensional and multi-variate nature. Visualizing such tensor fieldsis not a trivial task. Various techniques for visualizing diffusion tensor data were reportedso far [Westin et al. 2002, Zhang et al. 2004, Vilanova et al. 2005] and can be categorizedin two groups. One is the series of image-based methods in which each voxel value re-presents local anisotropy measure or principle direction of diffusion, and the 3D renderingof those images by volume rendering or surface rendering of the isosurface. The other isthe group of symbolic (or geometric) display methods by using various types of glyphsuch as ellipsoids. A few DTI visualization tools have been recently developed and canbe found in [Park et al. 2004, Fillard 2005, Jiang et al. 2006,Fillard et al. 2009].
DTI-based segmentation is relatively new and is also a very challenging task.Only in the last decade some approaches for DTI-based segmentation have been pro-posed [Weldeselassie and Hamarneh 2007, Wang and Vemuri 2005, Awate and Gee 2007].
This work presents the MM-DTI, a free, open source tool that deal with these twoimportant problems of DTI: visualization and segmentation. Its visualization approach
∗Thanks to CNPq and to SAE/UNICAMP for funding.
1580

consists of three different and independent viewing modes and three color mapping op-tions. The segmentation of diffusion tensor fields is performed using mathematical mor-phology operators, such as the tensorial morphological gradient (TMG) and the watershedtransform [Rittner and Lotufo 2008]. The developed tool allows automatic and manualdefinition of markers as input to the watershed-based segmentation method.
There are a variety of tools which perform similar tasks, butthey usually focuson a particular approach of DTI analysis, specially tractography, providing none or a lowrange of functionalities like DTI-based segmentation. Andnone of them makes use ofmathematical morphology operators and concepts. Some of them are DTI Studio, DoDTIand DTI Track.
In contrast to others similar tools, MM-DTI provides an exclusive animation modefor the tensor glyphs viewing mode, which interpolates the glyph position on the 3D gridin the direction of the principal eigenvector of the tensor.While Section 2 describes thedeveloped tool, Section 3 presents the results and conclusions can be found in Section 4.
2. MM-DTI
MM-DTI [Lobo et al. 2009] is a diffusion tensor image processing program running un-der Windows. It is suitable for tasks such as tensor field visualization, color mappingand DTI-based segmentation. It was developed in C++ and uses only OpenGL for 3Dand graphical user interface rendering. Image segmentation is performed through SDCMorphology Toolbox.
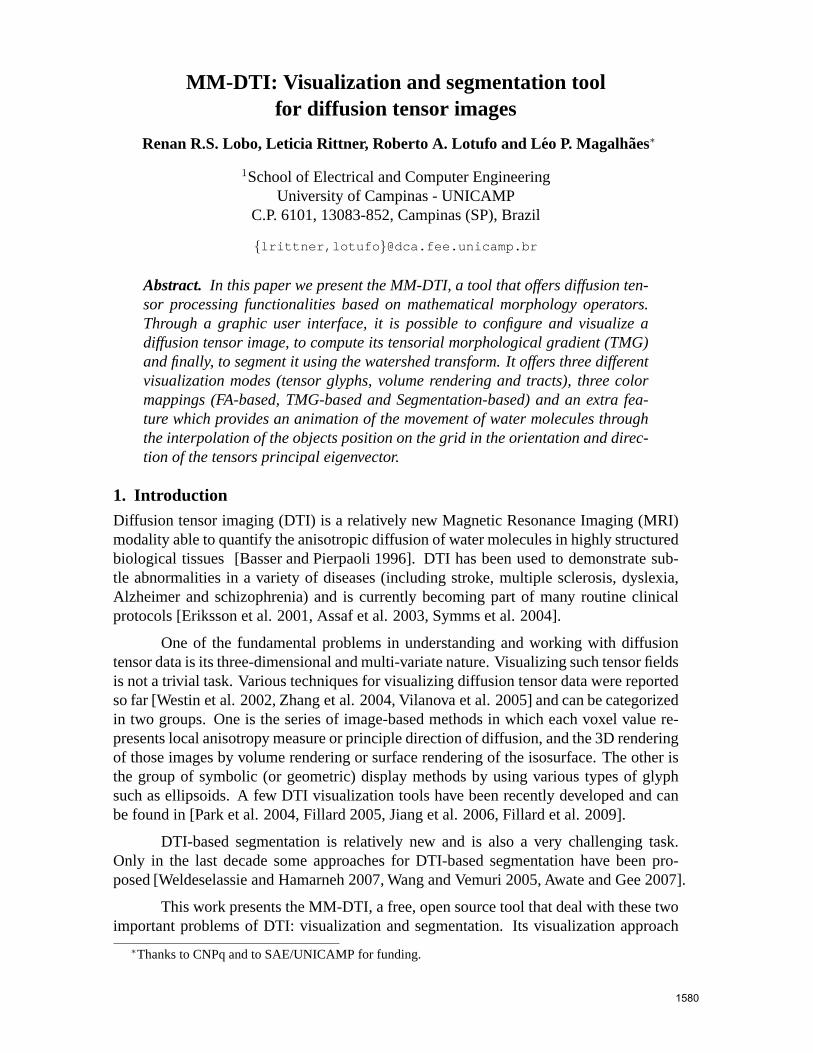
As shown in Fig. 1, it provides three viewing modes (tensor glyphs, volume ren-dering and tracts) and each one of them can reproduce a kind ofcolor mapping (diffusiondirection, TMG or segmentation labels). Fig. 2 contains oneslice of a synthetic diffusiondata (torus) illustrating all nine combinations of viewingmodes and color mappings.
Additionally to visualization functionalities, MM-DTI supports advanced tech-niques of image processing to calculate the TMG and to perform watershed-based seg-mentation.
Figure 1. MM-DTI main functionality
1581
Figure 2. Nine possible combinations of viewing modes and co lor mapping.Viewing modes at rows and color mapping at columns. The chose n exampleis one slice of a synthetic torus.
2.1. Viewing modes
MM-DTI has three viewing modes: tensor glyphs, volume rendering and tracts. The colorassigned to each voxel or region of an image depends on the chosen color mapping.
Tensors glyphs
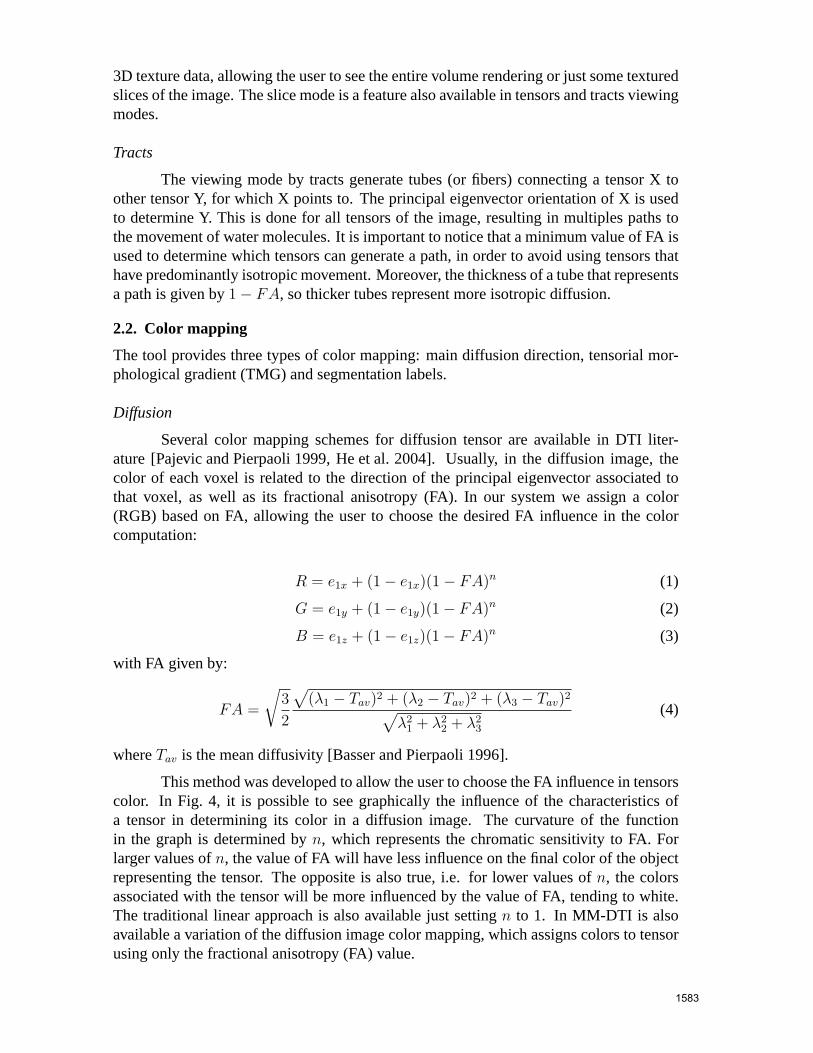
The program allows the representation of tensors by three types of objects: ellip-soids, boxes and lines. Such objects are arranged in a 3D-grid in the position of the voxelcorresponding to each tensor, and are oriented following the direction of the principaleigenvector (e1). The size of an object, in each dimension, is given by the square root ofthe corresponding eigenvalue (λi). Fig. 3 illustrates such objects.
Figure 3. Objects representing a tensor: an ellipsoid and a b ox. The axes direc-tion are defined by the tensor eigenvectors and the axes sizes are given by thesquareroot of the tensor eigenvalues.
Volume Rendering
The volume rendering viewing mode maps the color scheme being displayed on a
1582
3D texture data, allowing the user to see the entire volume rendering or just some texturedslices of the image. The slice mode is a feature also available in tensors and tracts viewingmodes.
Tracts
The viewing mode by tracts generate tubes (or fibers) connecting a tensor X toother tensor Y, for which X points to. The principal eigenvector orientation of X is usedto determine Y. This is done for all tensors of the image, resulting in multiples paths tothe movement of water molecules. It is important to notice that a minimum value of FA isused to determine which tensors can generate a path, in orderto avoid using tensors thathave predominantly isotropic movement. Moreover, the thickness of a tube that representsa path is given by1 − FA, so thicker tubes represent more isotropic diffusion.
2.2. Color mapping
The tool provides three types of color mapping: main diffusion direction, tensorial mor-phological gradient (TMG) and segmentation labels.
Diffusion
Several color mapping schemes for diffusion tensor are available in DTI liter-ature [Pajevic and Pierpaoli 1999, He et al. 2004]. Usually,in the diffusion image, thecolor of each voxel is related to the direction of the principal eigenvector associated tothat voxel, as well as its fractional anisotropy (FA). In oursystem we assign a color(RGB) based on FA, allowing the user to choose the desired FA influence in the colorcomputation:
R = e1x + (1 − e1x)(1 − FA)n (1)
G = e1y + (1 − e1y)(1 − FA)n (2)
B = e1z + (1 − e1z)(1 − FA)n (3)
with FA given by:
FA =
√
3
2
√
(λ1 − Tav)2 + (λ2 − Tav)2 + (λ3 − Tav)2
√
λ2
1+ λ2
2+ λ2
3
(4)
whereTav is the mean diffusivity [Basser and Pierpaoli 1996].
This method was developed to allow the user to choose the FA influence in tensorscolor. In Fig. 4, it is possible to see graphically the influence of the characteristics ofa tensor in determining its color in a diffusion image. The curvature of the functionin the graph is determined byn, which represents the chromatic sensitivity to FA. Forlarger values ofn, the value of FA will have less influence on the final color of the objectrepresenting the tensor. The opposite is also true, i.e. forlower values ofn, the colorsassociated with the tensor will be more influenced by the value of FA, tending to white.The traditional linear approach is also available just setting n to 1. In MM-DTI is alsoavailable a variation of the diffusion image color mapping,which assigns colors to tensorusing only the fractional anisotropy (FA) value.
1583
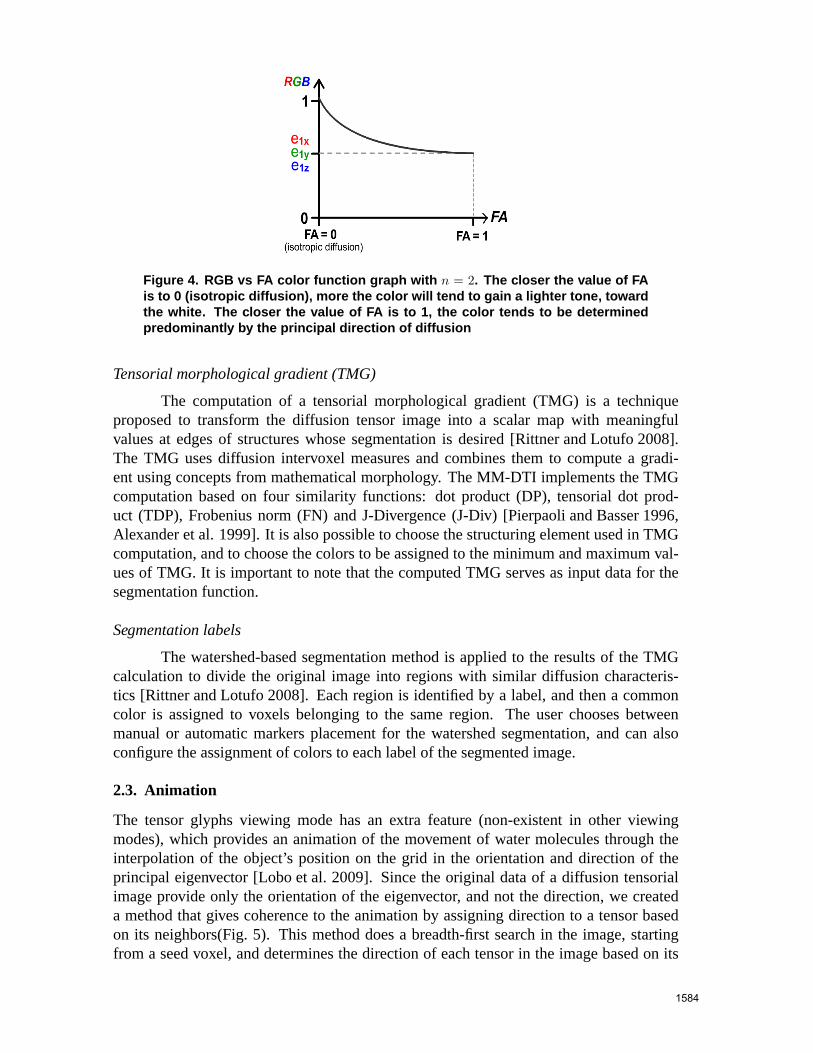
Figure 4. RGB vs FA color function graph with n = 2. The closer the value of FAis to 0 (isotropic diffusion), more the color will tend to gai n a lighter tone, towardthe white. The closer the value of FA is to 1, the color tends to be determinedpredominantly by the principal direction of diffusion
Tensorial morphological gradient (TMG)
The computation of a tensorial morphological gradient (TMG) is a techniqueproposed to transform the diffusion tensor image into a scalar map with meaningfulvalues at edges of structures whose segmentation is desired[Rittner and Lotufo 2008].The TMG uses diffusion intervoxel measures and combines them to compute a gradi-ent using concepts from mathematical morphology. The MM-DTI implements the TMGcomputation based on four similarity functions: dot product (DP), tensorial dot prod-uct (TDP), Frobenius norm (FN) and J-Divergence (J-Div) [Pierpaoli and Basser 1996,Alexander et al. 1999]. It is also possible to choose the structuring element used in TMGcomputation, and to choose the colors to be assigned to the minimum and maximum val-ues of TMG. It is important to note that the computed TMG serves as input data for thesegmentation function.
Segmentation labels
The watershed-based segmentation method is applied to the results of the TMGcalculation to divide the original image into regions with similar diffusion characteris-tics [Rittner and Lotufo 2008]. Each region is identified by a label, and then a commoncolor is assigned to voxels belonging to the same region. Theuser chooses betweenmanual or automatic markers placement for the watershed segmentation, and can alsoconfigure the assignment of colors to each label of the segmented image.
2.3. Animation
The tensor glyphs viewing mode has an extra feature (non-existent in other viewingmodes), which provides an animation of the movement of watermolecules through theinterpolation of the object’s position on the grid in the orientation and direction of theprincipal eigenvector [Lobo et al. 2009]. Since the original data of a diffusion tensorialimage provide only the orientation of the eigenvector, and not the direction, we createda method that gives coherence to the animation by assigning direction to a tensor basedon its neighbors(Fig. 5). This method does a breadth-first search in the image, startingfrom a seed voxel, and determines the direction of each tensor in the image based on its
1584
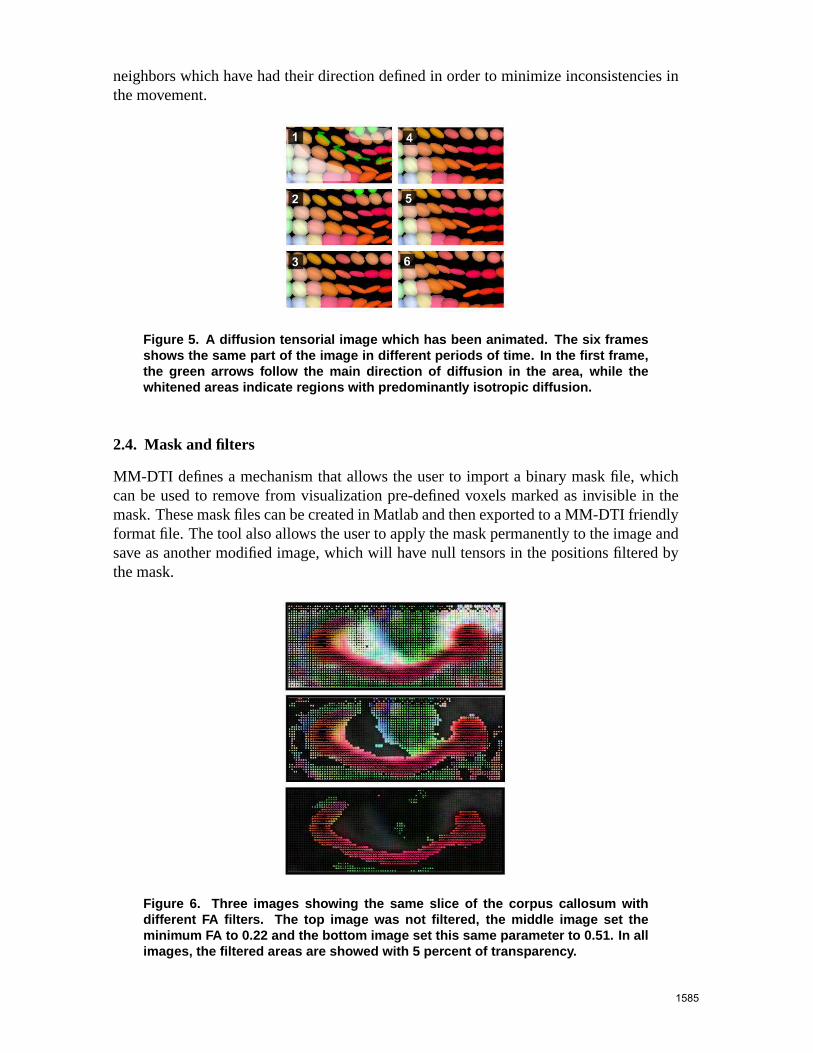
neighbors which have had their direction defined in order to minimize inconsistencies inthe movement.
Figure 5. A diffusion tensorial image which has been animate d. The six framesshows the same part of the image in different periods of time. In the first frame,the green arrows follow the main direction of diffusion in th e area, while thewhitened areas indicate regions with predominantly isotro pic diffusion.
2.4. Mask and filters
MM-DTI defines a mechanism that allows the user to import a binary mask file, whichcan be used to remove from visualization pre-defined voxels marked as invisible in themask. These mask files can be created in Matlab and then exported to a MM-DTI friendlyformat file. The tool also allows the user to apply the mask permanently to the image andsave as another modified image, which will have null tensors in the positions filtered bythe mask.
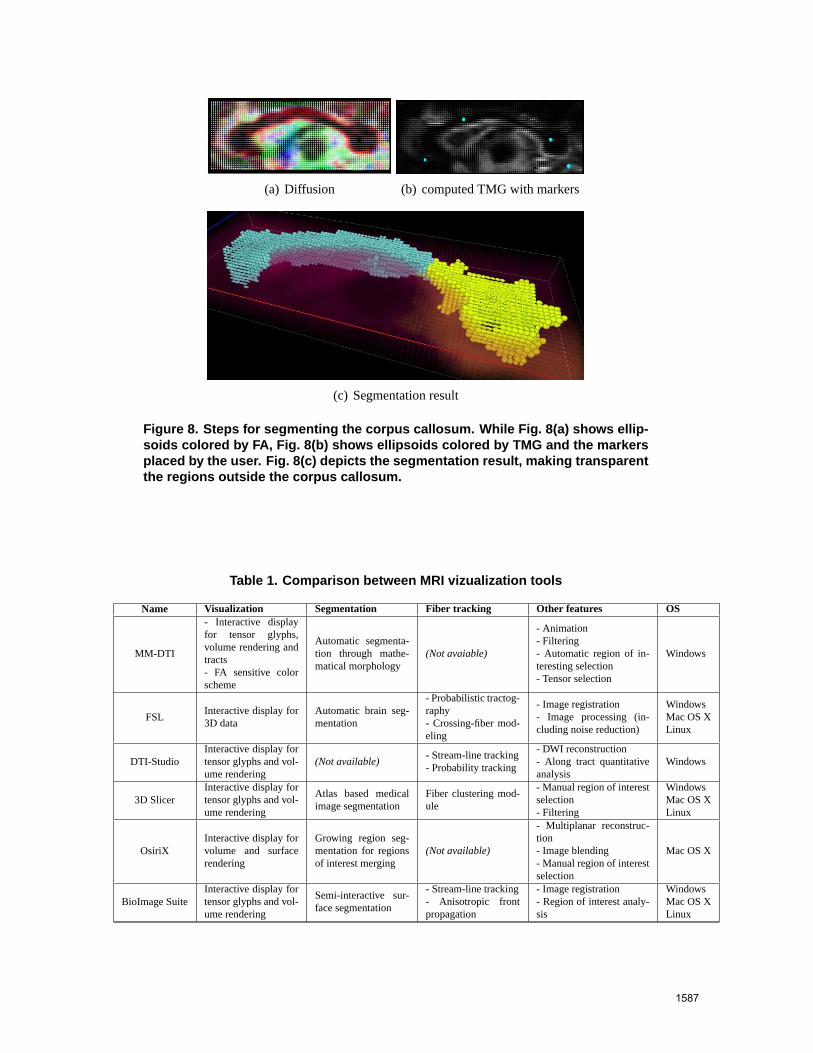
Figure 6. Three images showing the same slice of the corpus ca llosum withdifferent FA filters. The top image was not filtered, the middl e image set theminimum FA to 0.22 and the bottom image set this same paramete r to 0.51. In allimages, the filtered areas are showed with 5 percent of transp arency.
1585

The tool also provides three types of dynamic filters applicable to any kind ofcombination of viewing mode and color mapping. The first one is the FA filter, whichallows the user to set the level of transparency of tensors with FA between some definedinterval of values. It is usually useful to hide some tensorswhich compose a FA uniformimage background. An example of the use of this kind of filter can be seen in Fig. 6.
The second filter allows the user to select which regions defined by the segmen-tation process will be visible, increasing the focus on the desired view area through theexclusion of other regions that do not interest.
Finally, the third filter is the slice filter, which provides amechanism to selectorthogonal slices in the tridimensional grid of objects being viewed.
3. ResultsFig. 7 shows the MM-DTI graphical user interface, with a slice of a diffusion tensorialimage of a human brain on the center. The user interface allows camera operations, ten-sor/slice selection and simultaneous viewing modes. Through the “Settings” panel it ispossible to configure preferences in visualization and image processing.
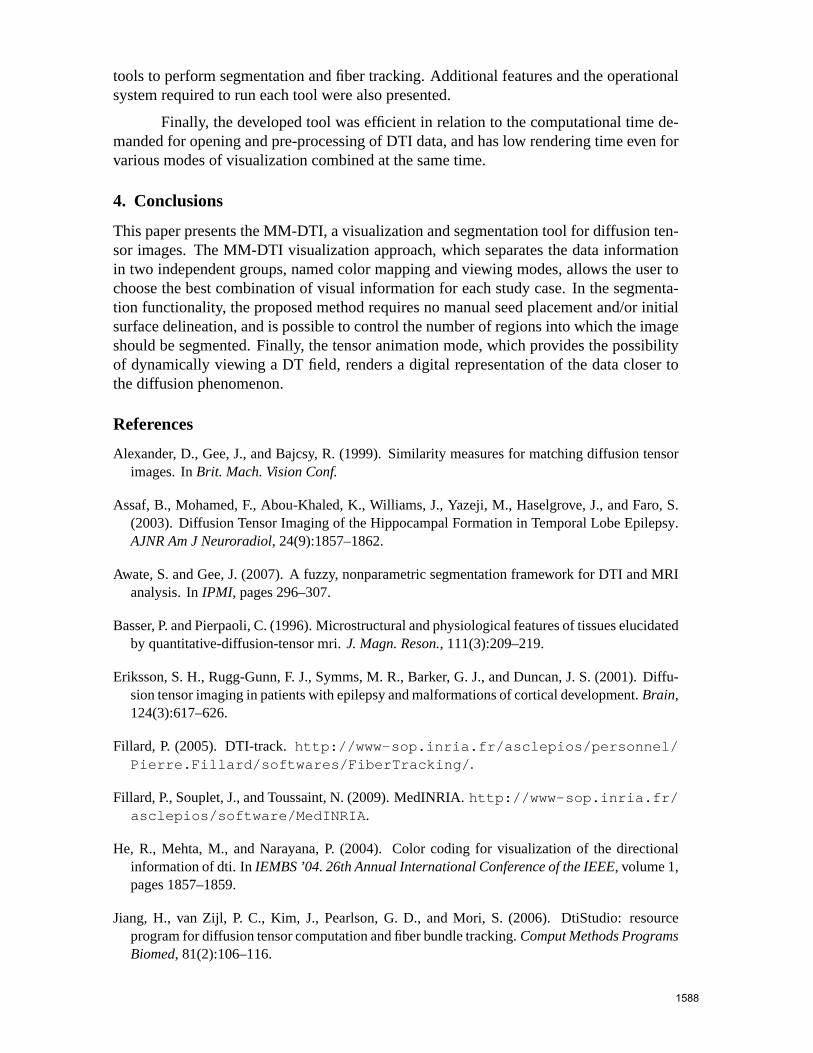
Fig. 8 illustrates the segmentation functionality of the MM-DTI. Fig. 8(a) showsan original DTI data set, cropped around the corpus callosum. Although only one sliceis shown, the data set is composed by 7 slices. Fig. 8(b) contains the computed TMGusing the FN as similarity measure and a 6-connected structuring element, where theborders of the corpus callosum can be observed. The markers to be used in the watershedsegmentation can also be observed in blue. Fig. 8(c) depictsthe segmentation result usingthe watershed from markers.
Figure 7. MM-DTI user interface. In the main window the diffu sion data is shown,according to the chosen viewing mode (ellipsoids) and the co lor mapping (diffu-sion direction). The right panel shows a slice/tensor selec tion mechanism
Table 1 lists a group of popular DTI tools, including the toolpresented in thiswork (MM-DTI), and summarizes the visualization modes and algorithms used by these
1586
(a) Diffusion (b) computed TMG with markers
(c) Segmentation result
Figure 8. Steps for segmenting the corpus callosum. While Fig . 8(a) shows ellip-soids colored by FA, Fig. 8(b) shows ellipsoids colored by TM G and the markersplaced by the user. Fig. 8(c) depicts the segmentation resul t, making transparentthe regions outside the corpus callosum.
Table 1. Comparison between MRI vizualization tools
Name Visualization Segmentation Fiber tracking Other features OS
MM-DTI
- Interactive displayfor tensor glyphs,volume rendering andtracts- FA sensitive colorscheme
Automatic segmenta-tion through mathe-matical morphology
(Not avaiable)
- Animation- Filtering- Automatic region of in-teresting selection- Tensor selection
Windows
FSLInteractive display for3D data
Automatic brain seg-mentation
- Probabilistic tractog-raphy- Crossing-fiber mod-eling
- Image registration- Image processing (in-cluding noise reduction)
WindowsMac OS XLinux
DTI-StudioInteractive display fortensor glyphs and vol-ume rendering
(Not available)- Stream-line tracking- Probability tracking
- DWI reconstruction- Along tract quantitativeanalysis
Windows
3D SlicerInteractive display fortensor glyphs and vol-ume rendering
Atlas based medicalimage segmentation
Fiber clustering mod-ule
- Manual region of interestselection- Filtering
WindowsMac OS XLinux
OsiriXInteractive display forvolume and surfacerendering
Growing region seg-mentation for regionsof interest merging
(Not available)
- Multiplanar reconstruc-tion- Image blending- Manual region of interestselection
Mac OS X
BioImage SuiteInteractive display fortensor glyphs and vol-ume rendering
Semi-interactive sur-face segmentation
- Stream-line tracking- Anisotropic frontpropagation
- Image registration- Region of interest analy-sis
WindowsMac OS XLinux
1587
tools to perform segmentation and fiber tracking. Additional features and the operationalsystem required to run each tool were also presented.
Finally, the developed tool was efficient in relation to the computational time de-manded for opening and pre-processing of DTI data, and has low rendering time even forvarious modes of visualization combined at the same time.
4. Conclusions
This paper presents the MM-DTI, a visualization and segmentation tool for diffusion ten-sor images. The MM-DTI visualization approach, which separates the data informationin two independent groups, named color mapping and viewing modes, allows the user tochoose the best combination of visual information for each study case. In the segmenta-tion functionality, the proposed method requires no manualseed placement and/or initialsurface delineation, and is possible to control the number of regions into which the imageshould be segmented. Finally, the tensor animation mode, which provides the possibilityof dynamically viewing a DT field, renders a digital representation of the data closer tothe diffusion phenomenon.
References
Alexander, D., Gee, J., and Bajcsy, R. (1999). Similarity measures for matching diffusion tensorimages. InBrit. Mach. Vision Conf.
Assaf, B., Mohamed, F., Abou-Khaled, K., Williams, J., Yazeji, M., Haselgrove, J., and Faro, S.(2003). Diffusion Tensor Imaging of the Hippocampal Formation in Temporal Lobe Epilepsy.AJNR Am J Neuroradiol, 24(9):1857–1862.
Awate, S. and Gee, J. (2007). A fuzzy, nonparametric segmentation framework for DTI and MRIanalysis. InIPMI, pages 296–307.
Basser, P. and Pierpaoli, C. (1996). Microstructural and physiological features of tissues elucidatedby quantitative-diffusion-tensor mri.J. Magn. Reson., 111(3):209–219.
Eriksson, S. H., Rugg-Gunn, F. J., Symms, M. R., Barker, G. J., and Duncan, J. S. (2001). Diffu-sion tensor imaging in patients with epilepsy and malformations of cortical development.Brain,124(3):617–626.
Fillard, P. (2005). DTI-track.http://www-sop.inria.fr/asclepios/personnel/Pierre.Fillard/softwares/FiberTracking/ .
Fillard, P., Souplet, J., and Toussaint, N. (2009). MedINRIA.http://www-sop.inria.fr/asclepios/software/MedINRIA .
He, R., Mehta, M., and Narayana, P. (2004). Color coding for visualization of the directionalinformation of dti. InIEMBS ’04. 26th Annual International Conference of the IEEE, volume 1,pages 1857–1859.
Jiang, H., van Zijl, P. C., Kim, J., Pearlson, G. D., and Mori, S. (2006). DtiStudio: resourceprogram for diffusion tensor computation and fiber bundle tracking.Comput Methods ProgramsBiomed, 81(2):106–116.
1588
Lobo, R., Rittner, L., Lotufo, R., and Magalhes, L. (2009). MM-DTI.http://www.students.ic.unicamp.br/ ˜ ra064041/mm-dti .
Pajevic, S. and Pierpaoli, C. (1999). Color schemes to represent the orientation of anisotropictissues from diffusion tensor data: Application to white matter fiber tract mapping in the humanbrain. Magn. Reson. Med., 42:526–540.
Park, H. J., Kubicki, M., Westin, C.-F., Talos, I. F., Brun, A., Pieper, S., Kikinis, R., Jolesz,F. A., McCarley, R. W., and Shenton, M. E. (2004). Method for combininginformation fromwhite matter fiber tracking and gray matter parcellation.American Journal of Neuroradiology,25:1318–1324.
Pierpaoli, C. and Basser, P. (1996). Toward a quantitative assessment of diffusion anisotropy.Magn. Reson. Medic., 36(6):893–906.
Rittner, L. and Lotufo, R. (2008). Diffusion tensor imaging segmentation bywatershed transformon tensorial morphological gradient.Brazilian Symp. on Computer Graph. and Image Proc.,pages 196–203.
Symms, M., Jager, H. R., Schmierer, K., and Yousry, T. A. (2004). A review of structural magneticresonance neuroimaging.J Neurol Neurosurg Psychiatry, 75(9):1235–1244.
Vilanova, A., Zhang, S., Kindlmann, G., and Laidlaw, D. H. (2005). An introduction to visualiza-tion of diffusion tensor imaging and its applications. InVisualization and Image Processing ofTensor Fields. Springer-Verlag.
Wang, Z. and Vemuri, B. (2005). DTI segmentation using an information theoretic tensor dissim-ilarity measure.IEEE Trans. Med. Imag.
Weldeselassie, Y. and Hamarneh, G. (2007). DT-MRI segmentation usinggraph cuts. InMedicalImaging 2007: Image Processing. SPIE.
Westin, C.-F., Maier, S., Mamata, H., Nabavi, A., Jolesz, F., and Kikinis, R. (2002). Processingand visualization for diffusion tensor mri.Medical Image Analysis, 6(93-108).
Zhang, S., Kindlmann, G., and Laidlaw, D. (2004). Diffusion tensor MRI visualization. InVisu-alization Handbook. Academic Press.
1589