Correlations between Diffusion Tensor Imaging (DTI) and Magnetic Resonance Spectroscopy (1H MRS) in...
11
BioMed Central Page 1 of 11 (page number not for citation purposes) BMC Psychiatry Open Access Research article Correlations between Diffusion Tensor Imaging (DTI) and Magnetic Resonance Spectroscopy ( 1 H MRS) in schizophrenic patients and normal controls Cheuk Y Tang* 1,2,4 , Joseph Friedman 2 , Dikoma Shungu 5 , Linda Chang 6 , Thomas Ernst 6 , Daniel Stewart 2 , Arash Hajianpour 1 , David Carpenter 1 , Johnny Ng 1 , Xiangling Mao 5 , Patrick R Hof 3 , Monte S Buchsbaum 2 , Kenneth Davis 2 and Jack M Gorman 2 Address: 1 Department of Radiology, Mount Sinai School of Medicine NY, NY 10029, USA, 2 Department of Psychiatry, Mount Sinai School of Medicine NY, NY 10029, USA, 3 Department of Neuroscience, Mount Sinai School of Medicine NY, NY 10029, USA, 4 Department of Pathology, Mount Sinai School of Medicine NY, NY 10029, USA, 5 Department of Radiology, Weill Medical College of Cornell University, NY, NY 10021, USA and 6 Department of Medicine, University of Hawaii, HI 96817, USA Email: Cheuk Y Tang* - [email protected]; Joseph Friedman - [email protected]; Dikoma Shungu - [email protected]; Linda Chang - [email protected]; Thomas Ernst - [email protected]; Daniel Stewart - [email protected]; Arash Hajianpour - [email protected]; David Carpenter - [email protected]; Johnny Ng - [email protected]; Xiangling Mao - [email protected]; Patrick R Hof - [email protected]; Monte S Buchsbaum - [email protected]; Kenneth Davis - [email protected]; Jack M Gorman - [email protected] * Corresponding author Abstract Background: Evidence suggests that white matter integrity may play an underlying pathophysiological role in schizophrenia. N-acetylaspartate (NAA), as measured by Magnetic Resonance Spectroscopy (MRS), is a neuronal marker and is decreased in white matter lesions and regions of axonal loss. It has also been found to be reduced in the prefrontal and temporal regions in patients with schizophrenia. Diffusion Tensor Imaging (DTI) allows one to measure the orientations of axonal tracts as well as the coherence of axonal bundles. DTI is thus sensitive to demyelination and other structural abnormalities. DTI has also shown abnormalities in these regions. Methods: MRS and DTI were obtained on 42 healthy subjects and 40 subjects with schizophrenia. The data was analyzed using regions of interests in the Dorso-Lateral Prefrontal white matter, Medial Temporal white matter and Occipital white matter using both imaging modalities. Results: NAA was significantly reduced in the patient population in the Medial Temporal regions. DTI anisotropy indices were also reduced in the same Medial Temporal regions. NAA and DTI- anisotropy indices were also correlated in the left medial temporal region. Conclusion: Our results implicate defects in the medial temporal white matter in patients with schizophrenia. Moreover, MRS and DTI are complementary modalities for the study of white matter disruptions in patients with schizophrenia. Published: 19 June 2007 BMC Psychiatry 2007, 7:25 doi:10.1186/1471-244X-7-25 Received: 30 October 2006 Accepted: 19 June 2007 This article is available from: http://www.biomedcentral.com/1471-244X/7/25 © 2007 Tang et al; licensee BioMed Central Ltd. This is an Open Access article distributed under the terms of the Creative Commons Attribution License (http://creativecommons.org/licenses/by/2.0 ), which permits unrestricted use, distribution, and reproduction in any medium, provided the original work is properly cited.
-
Upload
independent -
Category
Documents
-
view
0 -
download
0
Transcript of Correlations between Diffusion Tensor Imaging (DTI) and Magnetic Resonance Spectroscopy (1H MRS) in...

BioMed CentralBMC Psychiatry
ss
Open AcceResearch articleCorrelations between Diffusion Tensor Imaging (DTI) and Magnetic Resonance Spectroscopy (1H MRS) in schizophrenic patients and normal controlsCheuk Y Tang*1,2,4, Joseph Friedman2, Dikoma Shungu5, Linda Chang6, Thomas Ernst6, Daniel Stewart2, Arash Hajianpour1, David Carpenter1, Johnny Ng1, Xiangling Mao5, Patrick R Hof3, Monte S Buchsbaum2, Kenneth Davis2 and Jack M Gorman2Address: 1Department of Radiology, Mount Sinai School of Medicine NY, NY 10029, USA, 2Department of Psychiatry, Mount Sinai School of Medicine NY, NY 10029, USA, 3Department of Neuroscience, Mount Sinai School of Medicine NY, NY 10029, USA, 4Department of Pathology, Mount Sinai School of Medicine NY, NY 10029, USA, 5Department of Radiology, Weill Medical College of Cornell University, NY, NY 10021, USA and 6Department of Medicine, University of Hawaii, HI 96817, USA
Email: Cheuk Y Tang* - [email protected]; Joseph Friedman - [email protected]; Dikoma Shungu - [email protected]; Linda Chang - [email protected]; Thomas Ernst - [email protected]; Daniel Stewart - [email protected]; Arash Hajianpour - [email protected]; David Carpenter - [email protected]; Johnny Ng - [email protected]; Xiangling Mao - [email protected]; Patrick R Hof - [email protected]; Monte S Buchsbaum - [email protected]; Kenneth Davis - [email protected]; Jack M Gorman - [email protected]
* Corresponding author
AbstractBackground: Evidence suggests that white matter integrity may play an underlyingpathophysiological role in schizophrenia. N-acetylaspartate (NAA), as measured by MagneticResonance Spectroscopy (MRS), is a neuronal marker and is decreased in white matter lesions andregions of axonal loss. It has also been found to be reduced in the prefrontal and temporal regionsin patients with schizophrenia. Diffusion Tensor Imaging (DTI) allows one to measure theorientations of axonal tracts as well as the coherence of axonal bundles. DTI is thus sensitive todemyelination and other structural abnormalities. DTI has also shown abnormalities in theseregions.
Methods: MRS and DTI were obtained on 42 healthy subjects and 40 subjects with schizophrenia.The data was analyzed using regions of interests in the Dorso-Lateral Prefrontal white matter,Medial Temporal white matter and Occipital white matter using both imaging modalities.
Results: NAA was significantly reduced in the patient population in the Medial Temporal regions.DTI anisotropy indices were also reduced in the same Medial Temporal regions. NAA and DTI-anisotropy indices were also correlated in the left medial temporal region.
Conclusion: Our results implicate defects in the medial temporal white matter in patients withschizophrenia. Moreover, MRS and DTI are complementary modalities for the study of whitematter disruptions in patients with schizophrenia.
Published: 19 June 2007
BMC Psychiatry 2007, 7:25 doi:10.1186/1471-244X-7-25
Received: 30 October 2006Accepted: 19 June 2007
This article is available from: http://www.biomedcentral.com/1471-244X/7/25
© 2007 Tang et al; licensee BioMed Central Ltd. This is an Open Access article distributed under the terms of the Creative Commons Attribution License (http://creativecommons.org/licenses/by/2.0), which permits unrestricted use, distribution, and reproduction in any medium, provided the original work is properly cited.
Page 1 of 11(page number not for citation purposes)

BMC Psychiatry 2007, 7:25 http://www.biomedcentral.com/1471-244X/7/25
BackgroundAlterations in connectivity between brain regions includ-ing the frontal lobe, basal forebrain and limbic system,have been proposed as network deficits in schizophrenia[1-6]. Connections between the prefrontal cortex (PFC)and other cortical and subcortical regions implicated inthe pathophysiology of schizophrenia suggest that a whitematter abnormality in this region could have widespreadconsequences for neural connectivity in brain regions thatare critical to the core symptoms of schizophrenia. Thefinding of increased neuronal density [7-13] is consistentwith the notion that the integrity of white matter tracts iscompromised. In addition, MRI evidence for decreasedglobal [14-16], prefrontal [15,17-21] and temporal[15,21] white matter in schizophrenia is quite convincing.A meta-analysis of studies of white matter volumes inschizophrenia reveals a reduction of approximately 2%,with the greatest differences of approximately 5% inmedial temporal lobe structures [14]. Indeed, regionalrather than global reductions are far more relevant to thequestion of the origins of disconnectivity and hence ofparticular interest in the presentation of symptoms. Forexample, volume reductions in the white matter of PFC,repeatedly found in schizophrenia [17-20], are associatedwith the presentation of negative symptoms [18,20].
Both MRS [22,39,41,42,44,46,23-27] and DTI [28-34]have been used extensively to study white matter abnor-malities in patients with schizophrenia. The results ofthese two techniques may reflect different mechanisms ofabnormal pathologies. MRS measurements are deter-mined by biochemical profiles of the underlying patholo-gies, whereas DTI is more sensitive to structuraldifferences.
Magnetic resonance spectroscopy allows one to quantifythe concentrations of various metabolites in the brain. N-acetylaspartate (NAA) is the most prominent metabolitedetected in the normal human brain. NAA serves as a neu-ronal marker and is only present in mature neurons. Somestudies have also shown the presence of NAA in oli-godendrocyte-2A progenitor cells [35]. NAA has beenshown to be decreased in well-known demyelinating dis-eases such as multiple sclerosis (MS) and progressivemultifocal leukoencephalopathy (PML) and it is thoughtto be associated with axonal injury [36]. Decreased NAAin patients with schizophrenia has been found in the cer-ebellum [37], thalamus [23,38-44], dorso-lateral prefron-tal cortex (DLPFC) [23,42-44], anterior cingulate [45],and medial temporal lobe [24-27,46,47]. Reduction inNAA may signify structural abnormality or reduced viabil-ity of the underlying neurons [35,48]. Given these resultswe have acquired MRS data on the DLPFC white matter,medial temporal (MT) white matter and on the occipital(OC) white matter as a reference.
Diffusion tensor imaging allows one to quantify the integ-rity of densely packed fiber bundles such as axonal tractsand to measure the orientation of such bundles [49-53].DTI probes the microstructure of white matter by measur-ing the anisotropy of self-diffusion of water molecules inthe restricted compartments of axonal tracts. Two quanti-tative measures can be obtained from DTI: anisotropyindices and fiber tract orientations. Anisotropy indicessuch as relative anisotropy (RA) and fractional anisotropy(FA) [49,53] measure the amount of coherence of waterdiffusion which putatively reflects the amount of myelina-tion in axonal bundles or the coherence of fiber tracts. Thesame dataset also provides information on the three-dimensional orientation of the anisotropy and can beused to study fiber tract connectivity [54-56]. PreviousDTI studies have shown reduced anisotropy in patientswith schizophrenia in frontal white matter [28,29,57,58],the cingulum bundle [31,59], the temporal gyrus [32,60],and the corpus callosum [32,34,61].
Given that MRS and DTI can provide complementaryimaging data on white matter changes in brain we soughtto investigate the white matter brain changes associatedwith schizophrenia by simultaneously acquiring DTI andMRS data in a cohort of schizophrenic patients and agroup of matched healthy control subjects. MRS wasacquired targeting three regions of interests: frontal whitematter, occipital white matter and medial temporal whitematter. Since the DTI scans are much less time-consumingthan MRS scans, we acquired whole brain DTI andextracted matching voxels for correlation analysis with theMRS voxels.
MethodsSubjectsSchizophrenic subjects were recruited from inpatient, out-patient, day treatment and vocational rehabilitation serv-ices at Mount Sinai Hospital (New York, N.Y.), PilgrimPsychiatric Center (W. Brentwood, N.Y.), Bronx VA Medi-cal Center (Bronx, N.Y.), Hudson Valley Veterans AffairsMedical Center (Montrose, N.Y.), and Queens HospitalCenter (Jamaica, N.Y.) following approvals by each insti-tutional review board. Informed consent was obtained oneach subject following an assessment of capacity to pro-vide informed consent by a psychiatrist independent ofthe study. The inclusion criteria were 1) a DSMIV diagno-sis of schizophrenia or schizoaffective disorder based onthe Comprehensive Assessment of Symptoms And His-tory (CASH) [62], and 2) aged 18–80. Healthy compari-son subjects who were without any DSMIV axis I disorder(by CASH interview) were recruited from the New Yorkarea and were matched for age and gender to the schizo-phrenic subjects, they also provided informed consent.Subjects were excluded if they had 1) a positive urinedrugs of abuse screen, 2) a medical diagnosis which may
Page 2 of 11(page number not for citation purposes)

BMC Psychiatry 2007, 7:25 http://www.biomedcentral.com/1471-244X/7/25
produce white matter changes (i.e. HIV, MS), 3) a historyof brain disorder which may produce cognitive impair-ment or behavioral symptoms (i.e. head injury, cerebrov-ascular disease), or 4) had an unstable medical condition(i.e. poorly controlled diabetes or hypertension, sympto-matic coronary artery disease). Each subject was carefullyscreened and evaluated with a neuropsychological evalu-ation, structured assessment of symptoms, screening med-ical history, physical examination and laboratory studies(including complete blood count, routine chemistry, liverenzymes, and thyroid function tests) and urine toxicologyscreen, to ensure they fulfilled the inclusion criteria.
42 schizophrenic subjects and 40 healthy comparisonsubjects were recruited, assessed and scanned with bothDTI and MRS modalities. Mean age of the schizophrenicgroup did not differ significantly from the healthy com-parison group (schizophrenic mean = 38.69 years [sd =11.42]), healthy comparison mean = 43.3 years [sd =20.18], t = 1.28, p = .20), nor did the gender distribution(healthy comparison males = 57.5%, schizophrenic males= 69%, X2 = 1.18, p = .28). However, schizophrenic sub-jects attained significantly lower levels of education thanthe healthy comparison subjects (schizophrenic mean =12.21 years [sd = 2.07]), healthy comparison mean = 15.3years [sd = 2.24], t = 6.48, p < .001). The average age of ill-ness onset for the schizophrenic group was 23.53 years(sd = 7.09), 5% of the schizophrenic sample was notreceiving treatment with any antipsychotic at the time ofscanning while 19% were receiving first generation antip-sychotics, 17% clozapine, and 59% were receiving othersecond generation antipsychotics (risperidone, olanzap-ine, ziprasidone, quetiapine, aipiprazole).
Data AcquisitionAll imaging studies were performed on an Allegra 3Thead-dedicated system (Siemens, Ehrlangen, Germany)with a gradient strength of 40 mT/m and slew rate of400~900 mT/m/s, allowing EPI acquisitions with mini-mal susceptibility distortions. Patient head motion wasminimized by inflatable pillows inserted between thepatients' head and the head coil. Subjects were recruited toreceive two scans, one MRS and one structural. Most sub-jects received both scans on the same day, but there weresome that preferred to return on a second day for the otherscan. The duration between the two scans was at most 2months apart. During this time there was no change intreatment that the patients received.
MRSLocalizer MR images for prescribing the MRS volumesconsisted of a T1 sagittal with the following parameters:TR = 500 ms, TE = 10 ms, FOV = 18 cm × 14 cm, matrixsize = 512 × 384, 4.3 mm thick with 1.1 mm spacing. 25slices were obtained to cover the whole brain. From thesesagittal images, two T1-weighted transverse slices (TR =
500 ms, TE = 10 ms, Thickness = 10 mm, FOV = 16.5 cm× 22 cm with matrix 512 × 384) were identified for MRSacquisition: the first slice covered the DLPFC white matterand the OC white matter. A nearly axial plane was chosenfor the plane going through the striatum. It is chosen to beparallel to the AC-PC line as identified on the sagittalplanes (Fig 1). The second slice was prescribed to be co-axial with the Sylvian fissure such that it contained themedial temporal lobe white matter bilaterally (Fig 2). 1Hspectroscopic imaging (SI) data of the left and rightmedial temporal lobes were obtained in two sequentialscans using the phase-encoded version of the standardPRESS volume localization sequence, with TR = 2000 ms,TE = 30 ms, 24 × 24 phase-encoding steps over a field-of-view of 16 cm (zerofilled to 32 × 32 phase-encoding stepsbefore 3D Fourier transformation), a slice thickness of 10cm slice, 1 average per phase-encoding step and circular k-space sampling, to obtain voxels having a nominal size of0.25 cm3 (1.0 × 0.5 × 0.5 cm3). Outer volume saturationbands were prescribed to coincide with all 8 sides of thePRESS box. Water suppression and magnet shimmingwere automatically performed and adjusted by the hostcomputer. The 1H SI data for the DLPFC were acquiredwith the same protocol except that the FOV changed to 30cm. The resulting interpolated pixel size was (1.0 × 0.9 ×09 cm3). One slice was acquired for the DLPFC and OCwhite matter tracts. Total imaging time for all three slicesaveraged about 75 minutes.
T1-weighted axial slice for DLPF wm and OCC wm regions with CSI acquisition matrix and ROIs for metabolites quanti-fication superimposedFigure 1T1-weighted axial slice for DLPF wm and OCC wm regions with CSI acquisition matrix and ROIs for metabolites quanti-fication superimposed.
Page 3 of 11(page number not for citation purposes)

BMC Psychiatry 2007, 7:25 http://www.biomedcentral.com/1471-244X/7/25
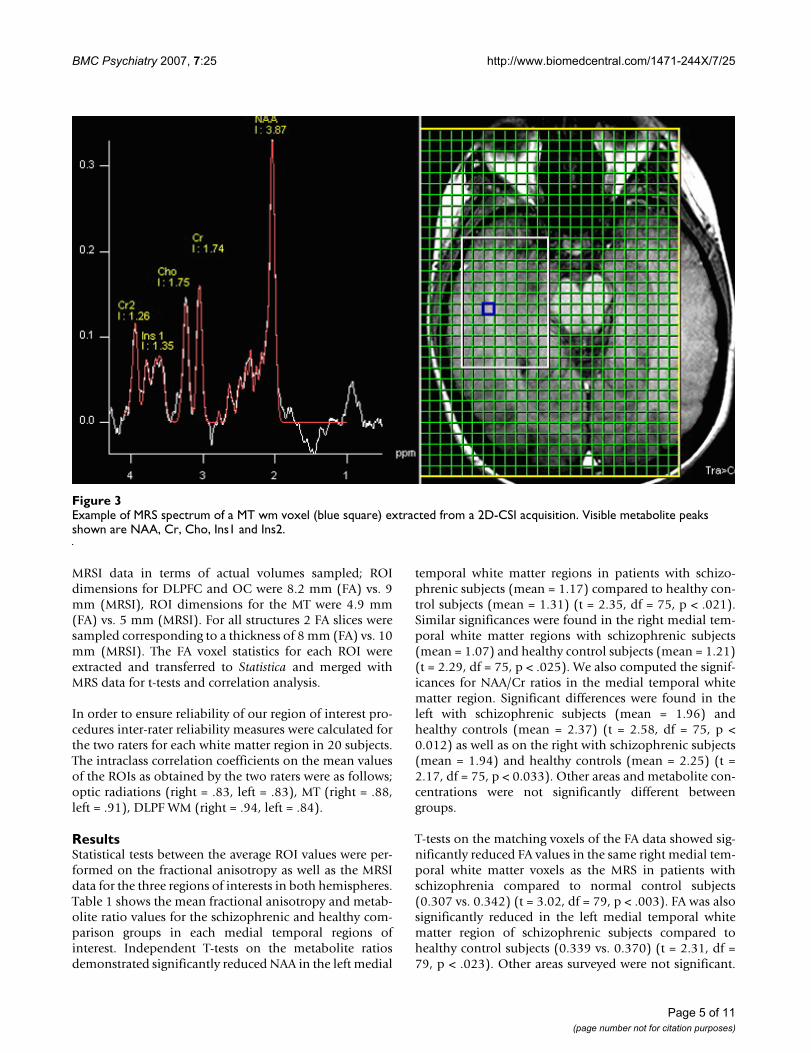
The raw SI data were processed and fitted in the fre-quency-domain to obtain metabolite peak areas usingmanufacturer-supplied MRS data processing software.Individual CSI images were reconstructed and overlaidonto the T1 anatomical images. Automatic phase correc-tion was applied, voxels of interests were identified, andthe metabolite levels were derived from the spectral fits.For the DLPFC white matter and OC white matter ROIs,three voxels were identified visually (Fig 1) for each hem-isphere. For the MT white matter four voxels were identi-fied per hemisphere because of the higher CSI resolution(Fig 2). MRS metabolites (NAA, Cho, Cr, Ins1 & Ins2)were obtained from these regions of interests (ROIs) (Fig3). The number of voxels per ROI was variable rangingbetween 1 and 3. Voxels with poor spectral data quality,defined asunresolved Cr and Cho resonances, wereexcluded from analysis. The metabolites from the selectedvoxels in each of the ROIs were averaged and transferredto Statistica v6 (StatSoft Inc., Tulsa, Ok) for statisticalanalysis.
DTIDTI data was acquired in a separate scanning session thatincluded other structural scans for morphological analy-sis. The protocol for the structural scans consisted of athree-plane sagittal localizer from which all other struc-tural scans were prescribed. The following structural scanswere acquired: Axial 3D-MPRage (TR = 2500 ms, TE = 4.4
ms, FOV = 21 cm, matrix size = 256 × 256, 208 slices withthickness = 0.82 mm); Turbo spin echo T2-weighted Axial(TR = 5380 ms, TE = 99 ms, FOV = 18.3 cm × 21 cm,matrix = 512 × 448, Turbo factor = 11, 28 slices, thickness= 3 mm skip 1 mm); DTI using a pulsed-gradient spin-echo sequence with EPI-acquisition (TR = 4100 ms, TE =80 ms, FOV = 21 cm, matrix = 128 × 128, 28 slices, thick-ness = 3 mm skip 1 mm, b-factor = 1250 s/mm2, 12 gradi-ent directions, 5 averages); and magnetization transferimaging (MTI) using a turbo spin echo sequence (TR =700 ms, TE = 12 ms, FOV = 21 cm, Matrix = 256 × 256, 28slices, thickness = 3 mm skip 1 mm). Total imaging timefor the structural scans averaged about 50 minutes.
Raw DTI data were transferred to an off-line workstationfor post-processing. In-house software written in Matlabv6.5 (The Mathworks Inc. Natick, MA) was used to com-pute the anisotropy and vector maps. The Fractional Ani-sotropy images were then converted to analyze format(Fig 4). MEDx v3.4.3 software (Medical Numerics Inc,Sterling, VA) was used to inspect and define ROIs on theFA images. Two adjacent axial slices (4 mm) were selectedfrom the FA dataset for each matching CSI image (10mm). The planes were selected to contain the same CSIvoxel locations (Fig 5). The voxels for the FA images meas-ured 1.6 × 1.6 × 3 mm3. ROI dimensions for the FA imageswere set to 5 × 5 and 3 × 3 for the DLPFC/OC and MTrespectively. These settings gave us the closest match to the
T1-weighted axial slices for left and right MT wm regions with CSI acquisition matrix superimposed as well as ROIs for metab-olites quantificationFigure 2T1-weighted axial slices for left and right MT wm regions with CSI acquisition matrix superimposed as well as ROIs for metab-olites quantification.
Page 4 of 11(page number not for citation purposes)
BMC Psychiatry 2007, 7:25 http://www.biomedcentral.com/1471-244X/7/25
MRSI data in terms of actual volumes sampled; ROIdimensions for DLPFC and OC were 8.2 mm (FA) vs. 9mm (MRSI), ROI dimensions for the MT were 4.9 mm(FA) vs. 5 mm (MRSI). For all structures 2 FA slices weresampled corresponding to a thickness of 8 mm (FA) vs. 10mm (MRSI). The FA voxel statistics for each ROI wereextracted and transferred to Statistica and merged withMRS data for t-tests and correlation analysis.
In order to ensure reliability of our region of interest pro-cedures inter-rater reliability measures were calculated forthe two raters for each white matter region in 20 subjects.The intraclass correlation coefficients on the mean valuesof the ROIs as obtained by the two raters were as follows;optic radiations (right = .83, left = .83), MT (right = .88,left = .91), DLPF WM (right = .94, left = .84).
ResultsStatistical tests between the average ROI values were per-formed on the fractional anisotropy as well as the MRSIdata for the three regions of interests in both hemispheres.Table 1 shows the mean fractional anisotropy and metab-olite ratio values for the schizophrenic and healthy com-parison groups in each medial temporal regions ofinterest. Independent T-tests on the metabolite ratiosdemonstrated significantly reduced NAA in the left medial
temporal white matter regions in patients with schizo-phrenic subjects (mean = 1.17) compared to healthy con-trol subjects (mean = 1.31) (t = 2.35, df = 75, p < .021).Similar significances were found in the right medial tem-poral white matter regions with schizophrenic subjects(mean = 1.07) and healthy control subjects (mean = 1.21)(t = 2.29, df = 75, p < .025). We also computed the signif-icances for NAA/Cr ratios in the medial temporal whitematter region. Significant differences were found in theleft with schizophrenic subjects (mean = 1.96) andhealthy controls (mean = 2.37) (t = 2.58, df = 75, p <0.012) as well as on the right with schizophrenic subjects(mean = 1.94) and healthy controls (mean = 2.25) (t =2.17, df = 75, p < 0.033). Other areas and metabolite con-centrations were not significantly different betweengroups.
T-tests on the matching voxels of the FA data showed sig-nificantly reduced FA values in the same right medial tem-poral white matter voxels as the MRS in patients withschizophrenia compared to normal control subjects(0.307 vs. 0.342) (t = 3.02, df = 79, p < .003). FA was alsosignificantly reduced in the left medial temporal whitematter region of schizophrenic subjects compared tohealthy control subjects (0.339 vs. 0.370) (t = 2.31, df =79, p < .023). Other areas surveyed were not significant.
Example of MRS spectrum of a MT wm voxel (blue square) extracted from a 2D-CSI acquisitionFigure 3Example of MRS spectrum of a MT wm voxel (blue square) extracted from a 2D-CSI acquisition. Visible metabolite peaks shown are NAA, Cr, Cho, Ins1 and Ins2.
Page 5 of 11(page number not for citation purposes)

BMC Psychiatry 2007, 7:25 http://www.biomedcentral.com/1471-244X/7/25
Correlation analysis on combined patient and controlsubjects showed a significant correlation between FA andNAA in the left medial temporal (r = 0.210, p = .050) aswell as FA and NAA/Cr (r = 0.230, p = 0.040). No signifi-cant correlation was found in the right medial temporalside (r = 0.210, p = 0.090) and (r = 0.140, p = 0.220).There have been several reports suggesting that additionalneuro-degenerative factors such as age might have effectson FA [63,64]. NAA in our patient sample as well as someother studies [65] did not show any age effect. We havealso tested partial correlations with the FA values cor-rected for age: a slight increase in significances were foundin the same regions, correlations between FA and NAA,NAA/Cr in the left medial temporal white matter were (r
= 0.332., p = .010) and (r = 0.308, p = 0.017) respectively.The correlations in all other ROIs surveyed were not sig-nificant: right medial temporal side (r = 0.20, p = 0.07)and (r = 0.16, p = 0.22); left DLPFC (r = 0.03, p = 0.80)and (r = -0.07, p = 0.56), right DLPFC (r = 0.07, p = 0.56)and (r = 0.23, p = 0.06), left occipital (r = 0.13, p = 0.10)and (r = 0.15, p = 0.21), right occipital (r = 0.10, p = 0.39)and (r = 0.18, p = 0.13) respectively.
DiscussionThe regions sampled in the current study shows that NAA/Cr and fractional anisotropy are reduced in the medialtemporal white matter in patients with schizophrenia.Reduced anisotropy was detected in the areas surveyed
Diffusion Tensor Imaging: Whole-Brain Fractional Anisotropy Maps of normal controlFigure 4Diffusion Tensor Imaging: Whole-Brain Fractional Anisotropy Maps of normal control.
Page 6 of 11(page number not for citation purposes)

BMC Psychiatry 2007, 7:25 http://www.biomedcentral.com/1471-244X/7/25
despite normal appearing white matter on conventionalT1 and T2 weighted images which suggest microscopicdamage to these fiber tracts.
NAA is thought to be present almost exclusively in neu-rons and their dendritic and axonal extensions but not inglia [66-68]. The NAA signal provides a marker of thenumber of viable neurons [69]. NAA is an intracellularamino acid derivative produced in the mitochondria [70],
but it is also found in large quantities in O-2A progenitorcells [35]. O2-A progenitor cells are putatively involvedwith glia repair processes[71]. MS studies have shown thatit is the failure of these repair processes that is the maincause of the disease [72]. A reduction in NAA may reflectboth a volume loss as well as a defect in the myelin main-tenance infrastructure. FA indices from DTI measure-ments reflect the amount of coherently restricteddiffusion (imposed by the presence of myelin) of free
Table 1: Mean values of metabolite ratios and fractional anisotropy (FA) and for the Medial Temporal, DLPFC and Occipital white matter ROIs. Significant differences between schizophrenic and healthy control subject groups by independent t tests are highlighted in bold.
NAA NAA/Cr FA
ROI Schizophrenic Mean (SD)
Control Mean (SD)
p Schizophrenic Mean (SD)
Control Mean (SD)
p Schizophrenic Mean (SD)
Control Mean (SD)
p
R Medial Temporal
1.076(0.233) 1.210(0.276) <0.025 1.937(0.556) 2.254(0.716) <0.033 0.307 (0.052) 0.342(0.073) <0.003
L Medial Temporal
1.171(0.273) 1.308(0.238) <0.021 1.956(0.732) 2.368(0.732) <0.012 0.370 (0.082) 0.339(0.064) <0.023
R Frontal 4.260(1.420) 3.970(1.230) p = 0.38 2.290(0.770) 1.990(0.610) p = 0.08 0.230 (0.043) 0.244 (0.055) p = 0.21L Frontal 4.550(1.440) 4.450(1.330) p = 0.77 2.320(0.730) 2.280(1.080) p = 0.88 0.226(0.044) 0.237(0.052) p = 0.30R Occipital 4.050(2.240) 4.070(1.320) p = 0.96 3.870(2.540) 2.360(0.780) p = 0.30 0.315(0.045) 0.325(0.051) p = 0.36L Occipital 4.360(2.640) 4.270(1.520) p = 0.87 2.840(1.830) 2.520(0.730) p = 0.34 0.356(0.069) 0.364(0.059) p = 0.60
ROI locations (left) DLPF wm, OCC wm and (right) MT wm for Fractional Anisotropy DataFigure 5ROI locations (left) DLPF wm, OCC wm and (right) MT wm for Fractional Anisotropy Data.
Page 7 of 11(page number not for citation purposes)

BMC Psychiatry 2007, 7:25 http://www.biomedcentral.com/1471-244X/7/25
water. These coherently restricted diffusion pathways aremost prominent in axonal bundles. DTI voxels are severalorders of magnitude larger than cellular dimensions, sothat the computed anisotropy indices reflect the cumula-tive effect of the underlying microstructure. While there isstill controversy regarding the source of the anisotropysuch as the contribution of the intracellular versus extra-cellular water to the diffusion signal [73-76], one canargue from a physical point of view that a reduced anisot-ropy can be the result of one of the following phenome-non: loss of myelin leading to reduced restricteddiffusion, intact fibers but not coherently oriented andloss of fibers. Measurements using multiple b-values haveshown a dependence of the diffusion signal on fast andslow diffusion as well as a deviation from mono-exponen-tial signal decay with higher b-values. With b-valuesbelow 2000 s/mm2 the signal decays mono-exponentiallyand is most sensitive to fast diffusion [74]. Our DTI datawas acquired with a b-value of 1250 s/mm2 and is thussensitized to fast diffusing water protons (probably in theextra-cellular space).
In a systematic review of proton MRS investigations meas-uring NAA differences between healthy controls andpatients with schizophrenia [77] levels of NAA do appearto be substantially reduced in frontal WM and temporalWM of schizophrenic patients. Although studies of tem-poral WM NAA changes are less well corroborated thanfrontal WM changes in schizophrenia the mean reductionof FA in temporal WM across studies was estimated at12.7% compared to 5.2% for frontal WM [77]. Moreover,antipsychotic treatment of the patients in our study mayhave confounded the measurements of NAA in the pre-frontal white matter. In a longitudinal evaluation chronicschizophrenic patients first scanned off medication thenafter treatment was started NAA levels increased signifi-cantly and selectively in the dorsolateral prefrontal cortexwithin 4 weeks but not in temporal lobe or other areasassessed [42]. The fact that we only found significant dif-ferences in the medial temporal white matter may supportthese findings.
Our group has previously published a report on the DTIfindings of the same subject population [78]. SPM analy-sis showed that there were significant differences in themedial temporal white matter as well as frontal whitematter regions. The areas of significance were in the samelocations as our ROI placements. The reason that we didnot find significant FA differences in the frontal whitematter is partly due to the size of the ROIs. The ROIdimensions and locations chosen for the current analysiswas based on the need to match the voxels obtained fromthe MRS data. These results suggest that axonal disrup-tions in the frontal white matter areas might be limited tospecific tracts within the frontal white matter. The subjects
used for the current analysis is a subset of the subjectsused in our previous report (N = 55, S = 63) versus (N42,S = 40) because some scans had to be eliminated due topoorly resolved spectra.
A similar study was performed by Steel et. al. [79], but nosignificant differences were found in NAA or FA. Thismight have been due to several reasons. Single voxel MRSis prone to partial volume contamination. Our techniqueused multivoxel spectroscopic imaging with much smallervoxel size; we only sampled the voxels which are well con-tained within the white matter regions. The second reasonfor the difference in findings may be due to our muchlarger sample of subjects (n = 40/42 vs. n = 10/10) andpotential mean age differences (Steel's group = 35/34, thisstudy = 43/39). The Steel's group did not survey themedial temporal lobe which was the location where wefound significances for both NAA and FA.
A more recent study has been performed by Irwan et. al.[80] using DTI and CSI acquired in a supraventricular slicein normal control subjects. Although they have not specif-ically looked at isolated white matter voxels, they haveshown a significant positive correlation between NAA andFA as well as a significant negative correlation betweenNAA with ADC values which is consistent with our inter-pretation of the FA index.
We also found significant correlations between FA andNAA in the left medial temporal white matter. Despite theco-occurrence of the reductions in NAA and fractional ani-sotropy these values were not significantly correlated onthe right side (p = 0.07). These relatively weak significan-ces were only observed when correlations were computedwith both control subjects and patients combined. There-fore, these results between these two measures in the sameregion may be suggestive of different structural and/ormetabolic changes co-occurring in the same region, butindependent of each other, in contrast to what is observedin multiple sclerosis [81]. For example, patients withschizophrenia may be born with proper axonal formationbut defective myelin maintenance infrastructure asreflected by reduced NAA/Cr. This interpretation is rea-sonable given that NAA is also found in large quantities inO-2A progenitor cells [35] putatively involved with gliarepair processes [71]. In this scenario our results could beinterpreted such that the reduction of anisotropy in thisarea might occur gradually whereas the low NAA/Cr levelscould be constant throughout the lifespan of the patients.Low NAA may be a hallmark throughout the lifespan ofthe disease but its effect and other factors on FA may bemore gradual.
One limitation of this study lies in the coregistration ofthe MRS ROIs with the DTI ROIs. Due to the lower sensi-
Page 8 of 11(page number not for citation purposes)

BMC Psychiatry 2007, 7:25 http://www.biomedcentral.com/1471-244X/7/25
tivity of MRS, the acquisition of MRS data is inherentlyslower and the resulting data is of lower resolution. Wewere only able to acquire two slices of MRS data. Thismade it impossible to accurately coregister the MRS slicesto the DTI slices using conventional computer algorithms.The problem is compounded by the inherent distortionsthat exists in EPI based DTI acquisition schemes. In thisstudy we have relied on our anatomy experts to visuallyidentify the regions of interests. To minimize the error wehave acquired the MRS slice for the DLPFC and the occip-ital regions in the same plane as the DTI which was alongthe AC-PC plane. This made it easier to identify the sameregions on both modalities. Other limitations are the dif-ferences in slice thickness between the two modalities.The MRS was 10 mm thick whereas the DTI were 3 mmskip 1 mm. To minimize this difference we selected twoDTI slices for every MRS slice.
ConclusionOur study has provided further evidence of white matterabnormality in the medial temporal region in chronicschizophrenic patients. This was evidenced through MRSpectroscopy as well as Diffusion Tensor Imaging. Apply-ing these two imaging modalities to an at risk populationat a younger age before the disease is diagnosed and cor-relating the results with outcome would elucidate thesequence of events such as defective NAA precedingreduced FA. Differences in the MRS and DTI results mayhelp one distinguish the nature of the white matterdefects.
Competing interestsThe author(s) declare that they have no competing inter-ests.
Authors' contributionsCYT was responsible for the DTI software development,MRI protocols, analysis and interpretation of the results.JF and DS was responsible for the recruitment and screen-ing of the subjects. LC, TE and DS were responsible for theMRS protocols. AH, DC, JN and XM were responsible forROI tracings. PRH was responsible for the anatomicallocalization of the ROIs.
The study was conceived by KD, MSB and JMG. Allauthors have read and approved the final manuscript.
AcknowledgementsThis work was supported by the following grants:
1. P50 MH 66392-01 awarded by the NIMH to Kenneth Davis.
2. VISN3 MIRECC.
3. GCRC grant M01-RR-00071 awarded to Mount Sinai School of Medicine.
References1. Benes FM: Emerging principles of altered neural circuitry in
schizophrenia. Brain Res Brain Res Rev 2000, 31:251-269.2. Bunney WE, Bunney BG: Evidence for a compromised dorsola-
teral prefrontal cortical parallel circuit in schizophrenia.Brain Res Brain Res Rev 2000, 31:138-146.
3. Carlsson A, Waters N, Holm-Waters S, Tedroff J, Nilsson M, Carls-son ML: Interactions between monoamines, glutamate, andGABA in schizophrenia: new evidence. Annu Rev Pharmacol Tox-icol 2001, 41:237-260.
4. Grace AA: Gating of information flow within the limbic sys-tem and the pathophysiology of schizophrenia. Brain Res BrainRes Rev 2000, 31:330-341.
5. Heimer L: Basal forebrain in the context of schizophrenia.Brain Res Brain Res Rev 2000, 31:205-235.
6. Middleton FA, Strick PL: Basal ganglia and cerebellar loops:motor and cognitive circuits. Brain Res Brain Res Rev 2000,31:236-250.
7. Selemon LD, Rajkowska G, Goldman-Rakic PS: Elevated neuronaldensity in prefrontal area 46 in brains from schizophrenicpatients: application of a three-dimensional, stereologiccounting method. J Comp Neurol 1998, 392:402-412.
8. Selemon LD, Rajkowska G, Goldman-Rakic PS: Abnormally highneuronal density in the schizophrenic cortex. A morphomet-ric analysis of prefrontal area 9 and occipital area 17. Arch GenPsychiatry 1995, 52:805-18; discussion 819-20.
9. Pakkenberg B: Total nerve cell number in neocortex in chronicschizophrenics and controls estimated using optical disec-tors. Biol Psychiatry 1993, 34:768-772.
10. Williams RW, Rakic P: Elimination of neurons from the rhesusmonkey's lateral geniculate nucleus during development. JComp Neurol 1988, 272:424-436.
11. Selemon LD, Goldman-Rakic PS: The reduced neuropil hypothe-sis: a circuit based model of schizophrenia. Biol Psychiatry 1999,45:17-25.
12. Davis SR, Lewis DA: Local circuit neurons of the prefrontal cor-tex in schizophrenia: selective increase in the density of cal-bindin-immunoreactive neurons. Psychiatry Res 1995, 59:81-96.
13. Akbarian S, Kim JJ, Potkin SG, Hetrick WP, Bunney WE Jr., Jones EG:Maldistribution of interstitial neurons in prefrontal whitematter of the brains of schizophrenic patients. Arch Gen Psychi-atry 1996, 53:425-436.
14. Wright IC, Rabe-Hesketh S, Woodruff PW, David AS, Murray RM,Bullmore ET: Meta-analysis of regional brain volumes in schiz-ophrenia. Am J Psychiatry 2000, 157:16-25.
15. Cannon TD, van Erp TG, Huttunen M, Lonnqvist J, Salonen O, Val-anne L, Poutanen VP, Standertskjold-Nordenstam CG, Gur RE, YanM: Regional gray matter, white matter, and cerebrospinalfluid distributions in schizophrenic patients, their siblings,and controls. Arch Gen Psychiatry 1998, 55:1084-1091.
16. Foong J, Maier M, Barker GJ, Brocklehurst S, Miller DH, Ron MA: Invivo investigation of white matter pathology in schizophre-nia with magnetisation transfer imaging. J Neurol Neurosurg Psy-chiatry 2000, 68:70-74.
17. Breier A, Buchanan RW, Elkashef A, Munson RC, Kirkpatrick B, Gel-lad F: Brain morphology and schizophrenia. A magnetic reso-nance imaging study of limbic, prefrontal cortex, andcaudate structures. Arch Gen Psychiatry 1992, 49:921-926.
18. Sigmundsson T, Suckling J, Maier M, Williams S, Bullmore E, Green-wood K, Fukuda R, Ron M, Toone B: Structural abnormalities infrontal, temporal, and limbic regions and interconnectingwhite matter tracts in schizophrenic patients with promi-nent negative symptoms. Am J Psychiatry 2001, 158:234-243.
19. Buchanan RW, Vladar K, Barta PE, Pearlson GD: Structural evalu-ation of the prefrontal cortex in schizophrenia. Am J Psychiatry1998, 155:1049-1055.
20. Sanfilipo M, Lafargue T, Rusinek H, Arena L, Loneragan C, Lautin A,Feiner D, Rotrosen J, Wolkin A: Volumetric measure of the fron-tal and temporal lobe regions in schizophrenia: relationshipto negative symptoms. Arch Gen Psychiatry 2000, 57:471-480.
21. Foong J, Symms MR, Barker GJ, Maier M, Woermann FG, Miller DH,Ron MA: Neuropathological abnormalities in schizophrenia:evidence from magnetization transfer imaging. Brain 2001,124:882-892.
22. Maier M, Mellers J, Toone B, Trimble M, Ron MA: Schizophrenia,temporal lobe epilepsy and psychosis: an in vivo magnetic
Page 9 of 11(page number not for citation purposes)
http://www.ncbi.nlm.nih.gov/entrez/query.fcgi?cmd=Retrieve&db=PubMed&dopt=Abstract&list_uids=9511926
http://www.ncbi.nlm.nih.gov/entrez/query.fcgi?cmd=Retrieve&db=PubMed&dopt=Abstract&list_uids=9511926
http://www.ncbi.nlm.nih.gov/entrez/query.fcgi?cmd=Retrieve&db=PubMed&dopt=Abstract&list_uids=9511926
http://www.ncbi.nlm.nih.gov/entrez/query.fcgi?cmd=Retrieve&db=PubMed&dopt=Abstract&list_uids=7575100
http://www.ncbi.nlm.nih.gov/entrez/query.fcgi?cmd=Retrieve&db=PubMed&dopt=Abstract&list_uids=7575100
http://www.ncbi.nlm.nih.gov/entrez/query.fcgi?cmd=Retrieve&db=PubMed&dopt=Abstract&list_uids=7575100
http://www.ncbi.nlm.nih.gov/entrez/query.fcgi?cmd=Retrieve&db=PubMed&dopt=Abstract&list_uids=8292680
http://www.ncbi.nlm.nih.gov/entrez/query.fcgi?cmd=Retrieve&db=PubMed&dopt=Abstract&list_uids=8292680
http://www.ncbi.nlm.nih.gov/entrez/query.fcgi?cmd=Retrieve&db=PubMed&dopt=Abstract&list_uids=8292680
http://www.ncbi.nlm.nih.gov/entrez/query.fcgi?cmd=Retrieve&db=PubMed&dopt=Abstract&list_uids=3417894
http://www.ncbi.nlm.nih.gov/entrez/query.fcgi?cmd=Retrieve&db=PubMed&dopt=Abstract&list_uids=3417894
http://www.ncbi.nlm.nih.gov/entrez/query.fcgi?cmd=Retrieve&db=PubMed&dopt=Abstract&list_uids=9894571
http://www.ncbi.nlm.nih.gov/entrez/query.fcgi?cmd=Retrieve&db=PubMed&dopt=Abstract&list_uids=9894571
http://www.ncbi.nlm.nih.gov/entrez/query.fcgi?cmd=Retrieve&db=PubMed&dopt=Abstract&list_uids=8771223
http://www.ncbi.nlm.nih.gov/entrez/query.fcgi?cmd=Retrieve&db=PubMed&dopt=Abstract&list_uids=8771223
http://www.ncbi.nlm.nih.gov/entrez/query.fcgi?cmd=Retrieve&db=PubMed&dopt=Abstract&list_uids=8771223
http://www.ncbi.nlm.nih.gov/entrez/query.fcgi?cmd=Retrieve&db=PubMed&dopt=Abstract&list_uids=8624186
http://www.ncbi.nlm.nih.gov/entrez/query.fcgi?cmd=Retrieve&db=PubMed&dopt=Abstract&list_uids=8624186
http://www.ncbi.nlm.nih.gov/entrez/query.fcgi?cmd=Retrieve&db=PubMed&dopt=Abstract&list_uids=8624186
http://www.ncbi.nlm.nih.gov/entrez/query.fcgi?cmd=Retrieve&db=PubMed&dopt=Abstract&list_uids=9862551
http://www.ncbi.nlm.nih.gov/entrez/query.fcgi?cmd=Retrieve&db=PubMed&dopt=Abstract&list_uids=9862551
http://www.ncbi.nlm.nih.gov/entrez/query.fcgi?cmd=Retrieve&db=PubMed&dopt=Abstract&list_uids=9862551
http://www.ncbi.nlm.nih.gov/entrez/query.fcgi?cmd=Retrieve&db=PubMed&dopt=Abstract&list_uids=1449382
http://www.ncbi.nlm.nih.gov/entrez/query.fcgi?cmd=Retrieve&db=PubMed&dopt=Abstract&list_uids=1449382
http://www.ncbi.nlm.nih.gov/entrez/query.fcgi?cmd=Retrieve&db=PubMed&dopt=Abstract&list_uids=1449382
http://www.ncbi.nlm.nih.gov/entrez/query.fcgi?cmd=Retrieve&db=PubMed&dopt=Abstract&list_uids=9699693
BMC Psychiatry 2007, 7:25 http://www.biomedcentral.com/1471-244X/7/25
resonance spectroscopy and imaging study of the hippocam-pus/amygdala complex. Psychol Med 2000, 30:571-581.
23. Bertolino A, Esposito G, Callicott JH, Mattay VS, Van Horn JD, FrankJA, Berman KF, Weinberger DR: Specific relationship betweenprefrontal neuronal N-acetylaspartate and activation of theworking memory cortical network in schizophrenia. Am J Psy-chiatry 2000, 157:26-33.
24. Rowland L, Bustillo JR, Lauriello J: Proton magnetic resonancespectroscopy (H-MRS) studies of schizophrenia. Semin ClinNeuropsychiatry 2001, 6:121-130.
25. Cecil KM, Lenkinski RE, Gur RE, Gur RC: Proton magnetic reso-nance spectroscopy in the frontal and temporal lobes of neu-roleptic naive patients with schizophrenia.Neuropsychopharmacology 1999, 20:131-140.
26. Yurgelun-Todd DA, Renshaw PF, Gruber SA, Waternaux C, CohenBM: Proton magnetic resonance spectroscopy of the tempo-ral lobes in schizophrenics and normal controls. SchizophreniaResearch 1996, 19:55-59.
27. Fukuzako H, Kodama S, Fukuzako T, Yamada K, Doi W, Sato D, Taki-gawa M: Subtype-associated metabolite differences in thetemporal lobe in schizophrenia detected by proton magneticresonance spectroscopy. Psychiatry Res 1999, 92:45-56.
28. Buchsbaum MS, Tang CY, Peled S, Gudbjartsson H, Lu D, Hazlett EA,Downhill J, Haznedar M, Fallon J: MRI white matter diffusion ani-sotropy and PET metabolic rate in Schizophrenia. Neurore-port 1998, 9:425-430.
29. Lim KO, Hedehus M, Moseley M, de Crespigny A, Sullivan EV, Pfeffer-baum A: Compromised white matter tract integrity in schiz-ophrenia inferred from diffusion tensor imaging. Arch GenPsychiatry 1999, 56:367-374.
30. Kalus P, Buri C, Slotboom J, Gralla J, Remonda L, Dierks T, Strik WK,Schroth G, Kiefer C: Volumetry and diffusion tensor imaging ofhippocampal subregions in schizophrenia. Neuroreport 2004,15:867-871.
31. Kubicki M, Westin CF, Nestor PG, Wible CG, Frumin M, Maier SE,Kikinis R, Jolesz FA, McCarley RW, Shenton ME: Cingulate fascic-ulus integrity disruption in schizophrenia: a magnetic reso-nance diffusion tensor imaging study. Biological Psychiatry 2003,54:1171-1180.
32. Ardekani BA, Nierenberg J, Hoptman MJ, Javitt DC, Lim KO: MRIstudy of white matter diffusion anisotropy in schizophrenia.Neuroreport 2003, 14:2025-2029.
33. Lim KO, Helpern JA: Neuropsychiatric applications of DTI - areview. NMR Biomed 2002, 15:587-593.
34. Foong J, Maier M, Clark CA, Barker GJ, Miller DH, Ron MA: Neu-ropathological abnormalities of the corpus callosum in schiz-ophrenia: a diffusion tensor imaging study. J Neurol NeurosurgPsychiatry 2000, 68:242-244.
35. Urenjak J, Williams SR, Gadian DG, Noble M: Proton nuclear mag-netic resonance spectroscopy unambiguously identifies dif-ferent neural cell types. J Neurosci 1993, 13:981-989.
36. Arnold DL, Matthews PM, Francis GS, O'Connor J, Antel JP: Protonmagnetic resonance spectroscopic imaging for metaboliccharacterization of demyelinating plaques. Ann Neurol 1992,31:235-241.
37. Deicken RF, Feiwell R, Schuff N, Soher B: Evidence for altered cer-ebellar vermis neuronal integrity in schizophrenia. PsychiatryRes 2001, 107:125-134.
38. Auer DP, Wilke M, Grabner A, Heidenreich JO, Bronisch T, WetterTC: Reduced NAA in the thalamus and altered membraneand glial metabolism in schizophrenic patients detected by1H-MRS and tissue segmentation. Schizophr Res 2001, 52:87-99.
39. Ende G, Braus DF, Walter S, Henn FA: Lower concentration ofthalamic n-acetylaspartate in patients with schizophrenia: areplication study. Am J Psychiatry 2001, 158:1314-1316.
40. Omori M, Murata T, Kimura H, Koshimoto Y, Kado H, Ishimori Y, ItoH, Wada Y: Thalamic abnormalities in patients with schizo-phrenia revealed by proton magnetic resonance spectros-copy. Psychiatry Res 2000, 98:155-162.
41. Deicken RF, Johnson C, Eliaz Y, Schuff N: Reduced concentrationsof thalamic N-acetylaspartate in male patients with schizo-phrenia. Am J Psychiatry 2000, 157:644-647.
42. Bertolino A, Callicott JH, Mattay VS, Weidenhammer KM, Rakow R,Egan MF, Weinberger DR: The effect of treatment with antipsy-chotic drugs on brain N-acetylaspartate measures inpatients with schizophrenia. Biol Psychiatry 2001, 49:39-46.
43. Callicott JH, Bertolino A, Mattay VS, Langheim FJ, Duyn J, Coppola R,Goldberg TE, Weinberger DR: Physiological dysfunction of thedorsolateral prefrontal cortex in schizophrenia revisited.Cereb Cortex 2000, 10:1078-1092.
44. Bertolino A, Breier A, Callicott JH, Adler C, Mattay VS, Shapiro M,Frank JA, Pickar D, Weinberger DR: The relationship betweendorsolateral prefrontal neuronal N-acetylaspartate andevoked release of striatal dopamine in schizophrenia. Neu-ropsychopharmacology 2000, 22:125-132.
45. Ende G, Braus DF, Walter S, Weber-Fahr W, Soher B, Maudsley AA,Henn FA: Effects of age, medication, and illness duration onthe N-acetyl aspartate signal of the anterior cingulate regionin schizophrenia. Schizophr Res 2000, 41:389-395.
46. Szulc A, Galinska B, Tarasow E, Walecki J, Dzienis W, Kubas B,Czernikiewicz A: [Clinical and neuropsychological correlatesof proton magnetic resonance spectroscopy detectedmetabolites in brains of first-episode and schizophrenicpatients]. Psychiatr Pol 2003, 37:977-988.
47. Fukuzako H, Takeuchi K, Hokazono Y, Fukuzako T, Yamada K,Hashiguchi T, Obo Y, Ueyama K, Takigawa M, Fujimoto T: Protonmagnetic resonance spectroscopy of the left medial tempo-ral and frontal lobes in chronic schizophrenia: preliminaryreport. Psychiatry Res 1995, 61:193-200.
48. Bitsch A, Bruhn H, Vougioukas V, Stringaris A, Lassmann H, Frahm J,Bruck W: Inflammatory CNS Demyelination: Histopatho-logic Correlation with In Vivo Quantitative Proton MR Spec-troscopy. AJNR Am J Neuroradiol 1999, 20:1619-1627.
49. Basser PJ: Inferring Microstructural features and the Physio-logical State of Tissues from Diffusion Weighted Images.NMR in Biomedicine 1995, 8:333-344.
50. Basser PJ: New histological and physiological stains derivedfrom diffusion-tensor MR images. Ann N Y Acad Sci 1997,820:123-138.
51. Basser PJ, Pierpaoli C: Microstructural and Physiological Fea-tures of Tissues Elucidated by Quantitative-Diffusion-TensorMRI. Journal of Magnetic Resonance, Series B 1996, 111(3):209-219.
52. Pierpaoli C, Jezzard P, Basser PJ, Barnett A, Chiro GD: DiffusionTensor MR Imaging of the Human Brain. Radiology 1996,201:637-648.
53. Pierpaoli C, Basser PJ: Toward a Quantitative Assessment ofDiffusion Anisotropy. Magnetic Resonance in Medicine 1996,36:893-906.
54. Mori S, van Zijl PC: Fiber tracking: principles and strategies - atechnical review. NMR Biomed 2002, 15:468-480.
55. Bammer R, Acar B, Moseley ME: In vivo MR tractography usingdiffusion imaging. European Journal of Radiology 2003, 45:223-234.
56. Conturo TE, Lori NF, Cull TS, Akbudak E, Snyder AZ, Shimony JS,McKinstry RC, Burton H, Raichle ME: Tracking neuronal fiberpathways in the living human brain. Proc Natl Acad Sci 1999,96:10422-10427.
57. Wolkin A, Choi SJ, Szilagyi S, Sanfilipo M, Rotrosen JP, Lim KO: Infe-rior frontal white matter anisotropy and negative symptomsof schizophrenia: a diffusion tensor imaging study. Am J Psychi-atry 2003, 160:572-574.
58. Hoptman MJ, Volavka J, Johnson G, Weiss E, Bilder RM, Lim KO:Frontal white matter microstructure, aggression, and impul-sivity in men with schizophrenia: a preliminary study. Biolog-ical Psychiatry 2002, 52:9-14.
59. Sun Z, Wang F, Cui L, Breeze J, Du X, Wang X, Cong Z, Zhang H, LiB, Hong N, Zhang D: Abnormal anterior cingulum in patientswith schizophrenia: a diffusion tensor imaging study. Neurore-port 2003, 14:1833-1836.
60. Spalletta G, Tomaiuolo F, Marino V, Bonaviri G, Trequattrini A, Calt-agirone C: Chronic schizophrenia as a brain misconnectionsyndrome: a white matter voxel-based morphometry study.Schizophrenia Research 2003, 64:15-23.
61. Agartz I, Andersson JL, Skare S: Abnormal brain white matter inschizophrenia: a diffusion tensor imaging study. Neuroreport2001, 12:2251-2254.
62. Andreasen NC, Flaum M, Arndt S: The Comprehensive Assess-ment of Symptoms and History (CASH). An instrument forassessing diagnosis and psychopathology. Arch Gen Psychiatry1992, 49:615-623.
63. Pfefferbaum A, Sullivan EV, Hedehus M, Lim KO, Adalsteinsson E,Moseley M: Age-related decline in brain white matter anisot-
Page 10 of 11(page number not for citation purposes)
http://www.ncbi.nlm.nih.gov/entrez/query.fcgi?cmd=Retrieve&db=PubMed&dopt=Abstract&list_uids=9885793
http://www.ncbi.nlm.nih.gov/entrez/query.fcgi?cmd=Retrieve&db=PubMed&dopt=Abstract&list_uids=9885793
http://www.ncbi.nlm.nih.gov/entrez/query.fcgi?cmd=Retrieve&db=PubMed&dopt=Abstract&list_uids=9147496
http://www.ncbi.nlm.nih.gov/entrez/query.fcgi?cmd=Retrieve&db=PubMed&dopt=Abstract&list_uids=9147496
http://www.ncbi.nlm.nih.gov/entrez/query.fcgi?cmd=Retrieve&db=PubMed&dopt=Abstract&list_uids=9512384
http://www.ncbi.nlm.nih.gov/entrez/query.fcgi?cmd=Retrieve&db=PubMed&dopt=Abstract&list_uids=9512384
http://www.ncbi.nlm.nih.gov/entrez/query.fcgi?cmd=Retrieve&db=PubMed&dopt=Abstract&list_uids=8441018
http://www.ncbi.nlm.nih.gov/entrez/query.fcgi?cmd=Retrieve&db=PubMed&dopt=Abstract&list_uids=8441018
http://www.ncbi.nlm.nih.gov/entrez/query.fcgi?cmd=Retrieve&db=PubMed&dopt=Abstract&list_uids=8441018
http://www.ncbi.nlm.nih.gov/entrez/query.fcgi?cmd=Retrieve&db=PubMed&dopt=Abstract&list_uids=1637131
http://www.ncbi.nlm.nih.gov/entrez/query.fcgi?cmd=Retrieve&db=PubMed&dopt=Abstract&list_uids=1637131
http://www.ncbi.nlm.nih.gov/entrez/query.fcgi?cmd=Retrieve&db=PubMed&dopt=Abstract&list_uids=1637131
http://www.ncbi.nlm.nih.gov/entrez/query.fcgi?cmd=Retrieve&db=PubMed&dopt=Abstract&list_uids=8748464
http://www.ncbi.nlm.nih.gov/entrez/query.fcgi?cmd=Retrieve&db=PubMed&dopt=Abstract&list_uids=8748464
http://www.ncbi.nlm.nih.gov/entrez/query.fcgi?cmd=Retrieve&db=PubMed&dopt=Abstract&list_uids=8748464
http://www.ncbi.nlm.nih.gov/entrez/query.fcgi?cmd=Retrieve&db=PubMed&dopt=Abstract&list_uids=8739270
http://www.ncbi.nlm.nih.gov/entrez/query.fcgi?cmd=Retrieve&db=PubMed&dopt=Abstract&list_uids=8739270
http://www.ncbi.nlm.nih.gov/entrez/query.fcgi?cmd=Retrieve&db=PubMed&dopt=Abstract&list_uids=9237452
http://www.ncbi.nlm.nih.gov/entrez/query.fcgi?cmd=Retrieve&db=PubMed&dopt=Abstract&list_uids=9237452
http://www.ncbi.nlm.nih.gov/entrez/query.fcgi?cmd=Retrieve&db=PubMed&dopt=Abstract&list_uids=8939209
http://www.ncbi.nlm.nih.gov/entrez/query.fcgi?cmd=Retrieve&db=PubMed&dopt=Abstract&list_uids=8939209
http://www.ncbi.nlm.nih.gov/entrez/query.fcgi?cmd=Retrieve&db=PubMed&dopt=Abstract&list_uids=8946355
http://www.ncbi.nlm.nih.gov/entrez/query.fcgi?cmd=Retrieve&db=PubMed&dopt=Abstract&list_uids=8946355
http://www.ncbi.nlm.nih.gov/entrez/query.fcgi?cmd=Retrieve&db=PubMed&dopt=Abstract&list_uids=1637251
http://www.ncbi.nlm.nih.gov/entrez/query.fcgi?cmd=Retrieve&db=PubMed&dopt=Abstract&list_uids=1637251

BMC Psychiatry 2007, 7:25 http://www.biomedcentral.com/1471-244X/7/25
Publish with BioMed Central and every scientist can read your work free of charge
"BioMed Central will be the most significant development for disseminating the results of biomedical research in our lifetime."
Sir Paul Nurse, Cancer Research UK
Your research papers will be:
available free of charge to the entire biomedical community
peer reviewed and published immediately upon acceptance
cited in PubMed and archived on PubMed Central
yours — you keep the copyright
Submit your manuscript here:http://www.biomedcentral.com/info/publishing_adv.asp
BioMedcentral
ropy measured with spatially corrected echo-planar diffusiontensor imaging. Magn Reson Med 2000, 44:259-268.
64. Nusbaum AO, Tang CY, Buchsbaum MS, Wei TC, Atlas SW:Regional and global changes in cerebral diffusion with nor-mal aging. AJNR Am J Neuroradiol 2001, 22:136-142.
65. Saunders DE, Howe FA, van den Boogaart A, Griffiths JR, Brown MM:Aging of the adult human brain: in vivo quantitation ofmetabolite content with proton magnetic resonance spec-troscopy. J Magn Reson Imaging 1999, 9:711-716.
66. Miller BL: A review of chemical issues in 1H NMR spectros-copy: N-acetyl-L-aspartate, creatine and choline. NMR Biomed1991, 4:47-52.
67. Uren jak J, Williams SR, Gadian DG, Noble M: Specific expressionof N-acetylaspartate in neurons, oligodendrocyte-type-2astrocyte progenitors, and immature oligodendrocytes invitro. J Neurochem 1992, 59:55-61.
68. Meyerhoff DJ, MacKay S, Bachman L, Poole N, Dillon WP, WeinerMW, Fein G: Reduced brain N-acetylaspartate suggests neu-ronal loss in cognitively impaired human immunodeficiencyvirus-seropositive individuals: in vivo 1H magnetic resonancespectroscopic imaging. Neurology 1993, 43:509-515.
69. Lu ZH, Chakraborty G, Ledeen RW, Yahya D, Wu G: N-Acety-laspartate synthase is bimodally expressed in microsomesand mitochondria of brain. Molecular Brain Research 2004,122:71-78.
70. Arnett HA, Fancy SP, Alberta JA, Zhao C, Plant SR, Kaing S, Raine CS,Rowitch DH, Franklin RJ, Stiles CD: bHLH transcription factorOlig1 is required to repair demyelinated lesions in the CNS.Science 2004, 306:2111-2115.
71. Chang A, Tourtellotte WW, Rudick R, Trapp BD: Premyelinatingoligodendrocytes in chronic lesions of multiple sclerosis. NEngl J Med 2002, 346:165-173.
72. Mulkern RV, Zengingonul HP, Robertson RL, Bogner P, Zou KH,Gudbjartsson H, Guttmann CR, Holtzman D, Kyriakos W, Jolesz FA,Maier SE: Multi-component apparent diffusion coefficients inhuman brain: relationship to spin-lattice relaxation. MagnReson Med 2000, 44:292-300.
73. Mulkern RV, Gudbjartsson H, Westin CF, Zengingonul HP, GartnerW, Guttmann CR, Robertson RL, Kyriakos W, Schwartz R, HoltzmanD, Jolesz FA, Maier SE: Multi-component apparent diffusioncoefficients in human brain. NMR Biomed 1999, 12:51-62.
74. Beaulieu C: The basis of anisotropic water diffusion in thenervous system - a technical review. NMR Biomed 2002,15:435-455.
75. Le Bihan D, Mangin JF, Poupon C, Clark CA, Pappata S, Molko N,Chabriat H: Diffusion tensor imaging: concepts and applica-tions. J Magn Reson Imaging 2001, 13:534-546.
76. Steen RG, Hamer RM, Lieberman JA: Measurement of brainmetabolites by 1H magnetic resonance spectroscopy inpatients with schizophrenia: a systematic review and meta-analysis. Neuropsychopharmacology 2005, 30:1949-1962.
77. Buchsbaum MS, Friedman J, Buchsbaum BR, Chu KW, Hazlett EA,Newmark R, Schneiderman JS, Torosjan Y, Tang C, Hof PR, StewartD, Davis KL, Gorman J: Diffusion Tensor Imaging in Schizo-phrenia. Biol Psychiatry 2006.
78. Steel RM, Bastin ME, McConnell S, Marshall I, Cunningham-OwensDG, Lawrie SM, Johnstone EC, Best JJK: Diffusion tensor imaging(DTI) and proton magnetic resonance spectroscopy (1HMRS) in schizophrenic subjects and normal controls. Psychia-try Research: Neuroimaging 2001, 106(3):161-170.
79. Irwan R, Sijens PE, Potze JH, Oudkerk M: Correlation of protonMR spectroscopy and diffusion tensor imaging. Magn ResonImaging 2005, 23:851-858.
80. Sijens PE, Irwan R, Potze JH, Mostert JP, De Keyser J, Oudkerk M:Analysis of the human brain in primary progressive multiplesclerosis with mapping of the spatial distributions using (1)HMR spectroscopy and diffusion tensor imaging. Eur Radiol2005, 15:1686-1693.
Pre-publication historyThe pre-publication history for this paper can be accessedhere:
http://www.biomedcentral.com/1471-244X/7/25/prepub
Page 11 of 11(page number not for citation purposes)
http://www.ncbi.nlm.nih.gov/entrez/query.fcgi?cmd=Retrieve&db=PubMed&dopt=Abstract&list_uids=1650241
http://www.ncbi.nlm.nih.gov/entrez/query.fcgi?cmd=Retrieve&db=PubMed&dopt=Abstract&list_uids=1650241
http://www.ncbi.nlm.nih.gov/entrez/query.fcgi?cmd=Retrieve&db=PubMed&dopt=Abstract&list_uids=1613513
http://www.ncbi.nlm.nih.gov/entrez/query.fcgi?cmd=Retrieve&db=PubMed&dopt=Abstract&list_uids=1613513
http://www.ncbi.nlm.nih.gov/entrez/query.fcgi?cmd=Retrieve&db=PubMed&dopt=Abstract&list_uids=1613513
http://www.ncbi.nlm.nih.gov/entrez/query.fcgi?cmd=Retrieve&db=PubMed&dopt=Abstract&list_uids=8450992
http://www.ncbi.nlm.nih.gov/entrez/query.fcgi?cmd=Retrieve&db=PubMed&dopt=Abstract&list_uids=8450992