Exposure to acrolein by inhalation causes platelet activation

Mixing Time Effects on the Dispersion Performance ofAdhesive Mixtures for InhalationFloris Grasmeijer*, Paul Hagedoorn, Henderik W. Frijlink, H. Anne de Boer
Department of Pharmaceutical Technology and Biopharmacy, University of Groningen, Groningen, The Netherlands
Abstract
This paper deals with the effects of mixing time on the homogeneity and dispersion performance of adhesivemixtures for inhalation. Interactions between these effects and the carrier size fraction, the type of drug and theinhalation flow rate were studied. Furthermore, it was examined whether or not changes in the dispersionperformance as a result of prolonged mixing can be explained with a balance of three processes that occur duringmixing, knowing drug redistribution over the lactose carrier; (de-) agglomeration of the drug (and fine lactose)particles; and compression of the drug particles onto the carrier surface. For this purpose, mixtures containingsalmeterol xinafoate or fluticasone propionate were mixed for different periods of time with a fine or coarse crystallinelactose carrier in a Turbula mixer. Drug detachment experiments were performed using a classifier based inhaler atdifferent flow rates. Scanning electron microscopy and laser diffraction techniques were used to measure drugdistribution and agglomeration, whereas changes in the apparent solubility were measured as a means to monitor thedegree of mechanical stress imparted on the drug particles. No clear trend between mixing time and contentuniformity was observed. Quantitative and qualitative interactions between the effect of mixing time on drugdetachment and the type of drug, the carrier size fraction and the flow rate were measured, which could be explainedwith the three processes mentioned. Generally, prolonged mixing caused drug detachment to decrease, with thestrongest decline occurring in the first 120 minutes of mixing. For the most cohesive drug (salmeterol) and the coarsecarrier, agglomerate formation seemed to dominate the overall effect of mixing time at a low inhalation flow rate,causing drug detachment to increase with prolonged mixing. The optimal mixing time will thus depend on theformulation purpose and the choice for other, interacting variables.
Citation: Grasmeijer F, Hagedoorn P, Frijlink HW, de Boer HA (2013) Mixing Time Effects on the Dispersion Performance of Adhesive Mixtures forInhalation. PLoS ONE 8(7): e69263. doi:10.1371/journal.pone.0069263
Editor: Richard G. Haverkamp, Massey University, New Zealand
Received April 18, 2013; Accepted June 6, 2013; Published July 2, 2013
Copyright: © 2013 Grasmeijer et al. This is an open-access article distributed under the terms of the Creative Commons Attribution License, which permitsunrestricted use, distribution, and reproduction in any medium, provided the original author and source are credited.
Funding: The work was funded by the Department of Pharmaceutical Technology and Biopharmacy of the University of Groningen. The funders had norole in study design, data collection and analysis, decision to publish, or preparation of the manuscript.
Competing interests: The authors have declared that no competing interests exist.
* E-mail: [email protected]
Introduction
Lacey was one of the first to describe the mixing process asthe creation of disorder by allowing chance to determine thepositions of the particles. With increased mixing time thesechance effects accumulate, eventually resulting in a more orless stable equilibrium of maximum disorder [1]. The theoretical‘random’ mixing process addressed by Lacey excludes particleinteraction phenomena and is therefore fundamentally differentfrom the ‘ordered’, or rather, ‘total’ mixing process that bestdescribes the formation of adhesive mixtures for inhalation[2–4]. In both instances the role of mixing time is essentially thesame, however, in that it allows chance effects to accumulateand therefore determines the extent to which certain processeswithin the mixture take place.
On blending of adhesive mixtures for inhalation several suchprocesses can be distinguished. For example, it has beenshown that drug agglomerates which are present in the starting
material will be broken up [5,6] and evidence suggests that atthe same time new, less coherent agglomerates can be formed[7]. Furthermore, the inhomogeneous nature of lactose carriersurfaces allows for redistribution of drug particles to occurbetween surface sites with a different binding activity or siteswith a different capacity to offer sheltering to drug particlesfrom the redistribution forces during further mixing [2,4,8,9]. Inaddition, repeated press-on forces and possiblytriboelectrification effects may gradually increase interactionforces between drug and carrier particles [10–12]. Lactosefines might also be generated by attrition of the carrier, but thisprocess seems to be restricted to high shear blendingoperations [13,14].
The three processes that are expected to principally affectthe dispersion performance of adhesive mixtures and that aretherefore subject of this study can be summarised asagglomeration, distribution and press-on processes,respectively. They each may alter the dispersion performance
PLOS ONE | www.plosone.org 1 July 2013 | Volume 8 | Issue 7 | e69263

of the mixture in a different direction and with a differentmagnitude. Therefore, it is to be expected that the overall effectof mixing time on the dispersion behaviour of any carrier-basedinhalation formulation is primarily related to the obtainedbalance between these three principal processes. This alsoimplies that any variable that alters this balance may interactwith the effect of mixing time.
The carrier size fraction, the drug concentration and the flowrate were previously identified as variables that can interactwith the effect of mixing time on drug detachment duringinhalation [15,16]. These variables either directly affect thedifferent processes during mixing by influencing the potentialand propensity for drug redistribution and (de-) agglomerationor the magnitude and efficacy of press-on forces, or they affectthe significance of their occurrence in relation to drugdetachment by altering the dispersion efficacy. For example,the agglomeration behaviour of drugs in adhesive mixtures wasshown to be proportional to the carrier size fraction, or morespecifically, the interparticulate pore size of the carrier powderbed [7,17]. Furthermore, the significance of a change in drugparticle mass (agglomerate size) in relation to drug detachmentfrom lactose carriers during inhalation was found to decreasewith increasing dispersion efficacy (e.g. with higher flow ratesthrough the inhaler) [18]. Therefore, for a given drug-carriercombination agglomerate formation is most likely to be adominant process determining the effect of mixing time on drugdetachment when coarse carrier particles are used anddispersion tests are performed at a low flow rate. Anothervariable that may change the balance of the differentprocesses during mixing and could therefore interact with theeffect of mixing time is the type of drug: the balance of intrinsiccohesive to adhesive interaction energy in combination withlactose can be different between drugs, and therefore, so maybe their propensity towards agglomeration [19].
Mixing is unquestionably the most important unit operation inthe formulation of adhesive mixtures for inhalation and mixingtime is an easily controllable process parameter. Despite this,the effect of mixing time on formulation performance and itsrelation to all the other variables to be considered is still notfully understood for carrier-based inhalation formulations. As astart to straightening out this discrepancy this paper deals withthe effect of mixing time on drug detachment for adhesivemixtures with a relatively low drug content. In particularinteractions between mixing time and the type of drug, thecarrier size fraction and the flow rate are investigated. Startingpoint of this study is the idea that the balance of mainly drug(de-) agglomeration, redistribution over and compression ontothe carrier surface determines the overall effect of mixing timeon drug detachment. Therefore, different characterisationtechniques have been used in an attempt to measure ormonitor the occurrence of these three ‘principal processes’and, by that, to study their relative contribution to the overalleffect.
Materials and Methods
Starting materialsAlpha lactose monohydrate (Pharmatose 80M, DMV-
Fonterra Excipients, Goch, Germany) was used to prepare the
different carrier size fractions. Micronised salmeterol xinafoateand fluticasone propionate were granted by Novartis(Germany). These drugs were chosen for their difference incohesion-adhesion balance in combination with lactose, whichwas previously reported to be 2.39 and 0.22, respectively [20].The drugs were passed through a 90 µm sieve to break uplarger agglomerates and triboelectric charge resulting from thescreening process was allowed to decay for at least 2 daysafterwards.
X-ray diffractionThe change in characteristics of drug particles when
subjected to mechanical stress during mixing may depend ontheir initial solid state. For example, disordering oramorphisation of initially crystalline particles results in a higherapparent solubility [21,22]. Therefore, the solid state of thedrugs as used was measured by X-ray diffraction with a D2PHASER equipped with a 1 mm divergence slit and aLYNXEYETM detector (Bruker AXS B.V., Delft, TheNetherlands). Approximately 15 mg of the micronised materialwas evenly spread on a zero background Si sample holderwithout the use of an adhesive. The sample holder was rotatedat 60 rpm during measurement and it was made sure that thepowder was still in place afterwards. An air-scatter screen of 1mm was used to prevent radiation from the X-ray source todirectly reach the detector. The scans were performed from 5to 40 ° 2θ with a step size of 0.01 ° 2θ and a 1 s step duration.CuKα radiation with a wavelength of 1.5406 Å was generatedat 30 kV and 10 mA. The measurements were performed on atleast two different specimens from the same powder sample toascertain the reproducibility of the obtained diffraction pattern.
Carrier classificationA coarse (250-315 µm) and a fine (63-90 µm) carrier fraction
were obtained from Pharmatose 80M by 20 minutes ofvibratory sieving at an amplitude of 1.5 mm (Retsch AS 200control, Germany). To further remove lactose fines from thesurface of the carrier particles, the carrier fractions were thenair jet sieved for 10 minutes (e200LS, Hosokawa Alpine AG,Augsburg, Germany); the coarse fraction on a 250 µm sieve atan underpressure of 2000 Pa and the fine fraction on a 63µmsieve at 3000 Pa.
Blend preparationBlends were prepared at ambient conditions. The coarse
carrier fraction was blended with 0.4% of drug and the finecarrier with 1.48% to obtain a similar carrier surface payload (inmg/m2, calculated based on the ratio of the arithmetic meanfraction diameters). The drug was sandwiched in between twoequal parts of the carrier material in a stainless steel mixingvessel with a volume of 160 cm3 and pre-mixed with a spatulafor approximately 20 orbits. The blends were subsequentlymixed with a Turbula blender operated at 90 rpm (WABachofen, Basel, Switzerland) for 0.5 to 780 minutes. Data fordifferent mixing times are obtained from the same batch,starting with a batch size of 25 g which decreased toapproximately 15 g for the final blending step due to theextraction of samples. For both carrier fractions placebo blends
Mixing Time Effects on Powders for Inhalation
PLOS ONE | www.plosone.org 2 July 2013 | Volume 8 | Issue 7 | e69263

(containing only the carrier material) were prepared in thesame way.
Content uniformity testingContent uniformity of the blends was tested by taking 10
samples of 25 ± 1 mg from random positions. Blendhomogeneity was considered acceptable at relative standarddeviations (RSDs) of the content < 3%. The mean value of the10 samples was taken as the drug content in the mixture.
Segregation sensitivity testingTo confirm a possible explanation for the content uniformity
data, the segregation sensitivity of the salmeterol mixturescontaining a coarse carrier and being mixed for 2 and 420minutes was tested. To this end, 1 g samples were subjectedto the described vibratory sieving procedure during 1 minute ona 150 µm test sieve. The salmeterol content of the sievingresidue was determined from 5 samples of 25 ± 1 mg andexpressed relative to the salmeterol content of the originalblends.
Scanning electron microscopy (SEM)The (re-)distribution and agglomeration behaviour of the drug
on the carrier with mixing time was studied with SEM. Imageswere obtained with a JSM-6301F (Jeol, Japan) at anacceleration voltage of 3kV and probe current 7. Samples werefixed on an aluminium specimen mount by means of doublesided adhesive carbon tape. For the pure drugs excess samplewas blown from the tape with pressurised air. Any excessparticles from the carrier material and blends were gentlytapped from the specimen mount to avoid detachment oflactose fines or drug from the carrier crystals, respectively. Thedrugs were sputter coated with 10 nm of a gold–palladiumalloy, whereas for the carrier and mixture samples a coatingthickness of 20 nm was found to be necessary for preventingcharging effects.
Laser diffraction analysisAll laser diffraction experiments have been performed with
the HELOS BF diffractometer (Sympatec, Clausthal-Zellerfeld,Germany) equipped with an R3 lens (measuring range 0.9-175µm) or an R5 lens (measuring range 4.5-875 µm, for thecoarse carrier fraction). The FREE calculation mode was used,which is based on the Fraunhofer theory.
Dry dispersion. The particle size distributions (PSDs) of thedrugs were measured after dispersion of the powders with aRODOS disperser at 3 bar (Sympatec, Clausthal-Zellerfeld,Germany). The PSDs did not change when the pressure dropfor dispersion was increased to 5 bar, which indicates that theprimary PSDs of the drugs were measured. Results are themean of 2 measurements, which was deemed a sufficientnumber of replicates with the added control measurements at adispersion pressure of 5 bar and considering the smalldeviations that were observed between individualmeasurements.
The PSDs of both lactose carrier fractions were measured inthe same way at 3 and 5 bar. Approximately 2 g of the sieved
and placebo blended material was fed to the RODOS disperserthrough a funnel. Results are the mean of 3 measurements.
Wet dispersion. To further quantify the qualitativeinformation from SEM, the agglomeration behaviour of thedrugs on the carrier with prolonged mixing was measured withlaser diffraction too. The agglomerate size of the hydrophobicdrugs as present in the screened starting material and in theblends was measured in aqueous suspensions using theCUVETTE SC-40 module (50 mL cuvette, Sympatec,Clausthal-Zellerfeld, Germany). A sample of the blend wasadded to saturated aqueous solutions of the drugs containingapproximately 0.03% of polysorbate 80 (Tween 80). Theparticle size distributions of suspended drug agglomerateswere measured for 10 s after precisely 12 minutes (coarsecarrier) or 2 minutes (fine carrier); the duration in which thelactose completely dissolved for all samples. Dissolution of thelactose carrier was apparent from a disappearing peakcorresponding to the size of the carrier material and furtherconfirmed by optical microscopy of the suspensions (seefurther). A stirring speed of approximately 500 rpm was usedthroughout the entire procedure to prevent sedimentation of thesuspended drug particles. It was made sure that thehydrophobic drugs did not adhere to the wall of the cuvetteduring measurement. Sample sizes were chosen such that anoptical concentration of around 10% was obtained. It waschecked that dissolved lactose did not influence the laserdiffraction results. The primary PSDs of the drugs weremeasured after wet dispersion in a similar way after a pre-suspension step comprising sonication of approximately 0.5 mgof the drugs in 2 mL of the saturated solution for 11 minutesusing a 70 W, 42 kHz ultrasonic cleaner (Electris UC449UP,France). The amount of pre-suspension that was added to theCUVETTE was titrated to an optical concentration of around10%. It was checked that the optical concentration andcharacteristic PSD data of the primary particles thus measuredremained constant for minimally 12 minutes. The chosenconditions and procedures are the result of their carefulevaluation concerning reliability and reproducibility during manyexploratory measurements. Results are the mean of at least 3measurements.
Optical microscopyAqueous suspensions of the adhesive mixtures were
inspected by optical microscopy to confirm the dissolution ofthe lactose carrier (BX50F, Olympus Optical Co., Ltd., Japan).Several drops of the suspensions were placed on a glassmicroscope slide without using a cover slip.
Solubility testingThe apparent solubility of salmeterol was measured as a
means to quantify the degree of mechanical stress imparted onthe drug particles during the mixing process. An aqueoussuspension of salmeterol was prepared by suspending themicronised starting material in demineralised water containingapproximately 0.03% polysorbate 80 (Tween 80). Aftersonication for at least 30 minutes in a Helma Transsonic 700/Hultrasonic bath (Elma Hans Schmidbauer, Singen, Germany)the suspension was stored in the dark for 1 week without
Mixing Time Effects on Powders for Inhalation
PLOS ONE | www.plosone.org 3 July 2013 | Volume 8 | Issue 7 | e69263

stirring before further use. Thereafter, the suspension waspassed through a 0.2 µm cellulose acetate filter to obtain asaturated solution. The apparent solubility strongly depends onthe suspended drug concentration [21,22]. Therefore, to 10 mLof the saturated solution, 0.7 mg of the salmeterol startingmaterial was added or a sample of the different salmeterolmixtures that resulted in an equivalent added salmeterol mass(calculated based on the measured content). The resultingsuspensions were regularly vortexed during 1 hour. Exploratorymeasurements showed that, for the longest mixing times,maximum dissolution is attained within 1 hour and that theconcentration consecutively decreases towards the equilibriumsaturation concentration in the course of several days toweeks. The procedure was continued by passing thesuspensions through a 0.2 µm cellulose acetate filter. Thesamples were further analysed as discussed in the section‘spectrophotometric analysis’. Results are the mean of 2measurements.
Drug detachment experimentsDrug detachment was measured by analysing the residual
amount of drug present on the carrier surface after a dispersionexperiment with a classifier based test inhaler [23]. The carriercrystals could be collected for analysis after a drug detachmentexperiment, since they were retained in the classifier of theinhaler. The residual amount of drug normalised to 100% of thecarrier is referred to as ‘carrier residue’ (CR). The percentageof drug detached is calculated as 100-CR. Doses of 25 ± 1 mgwere used for the drug detachment experiments, which wereperformed at flow rates of 20 and 60 L/min for a fixed durationof 3 seconds. Drug detachment experiments for the same flowrate and drug-carrier combination (at different mixing times)were performed on the same day to minimise environmentaleffects. Results are the mean of 5 measurements.
Spectrophotometric analysisSamples from the content uniformity analyses and drug
detachment experiments were analysed for salmeterol andfluticasone content by spectrophotometric analysis at awavelength of 228 nm (Unicam UV-500, ThermoSpectronic,Cambridge, UK). Calibration curves for the concentration ofboth drugs were constructed with a coefficient of determinationof 0.9998. All samples were dissolved in ethanol andsubsequently centrifuged for 5 minutes at 3000 rpm (HettichRotanta D-7200, Hettich AG, Switzerland) to clear the drugsolutions from suspended lactose particles prior tomeasurement. If necessary, samples were diluted for the drugconcentrations to fall within the range covered by thecalibration curves.
The absorbance of the samples from the solubility tests wasmeasured spectrofotometrically at a wavelength of 280 nm.The measurement at this wavelength avoids the necessity ofdilution of the supersaturated salmeterol solutions in order forthe absorption values to fall within the linear measuring rangeof the spectrophotometer used. Water containing 0.03% ofpolysorbate 80 and the dissolved pure lactose carrier (ifapplicable) was used as a blank. Because only the relativedifference in the apparent solubility of salmeterol between the
different samples is of interest, an exact quantification of thesalmeterol concentration is not necessary and no calibrationcurve was constructed.
Results and Discussion
Solid state of the drugsThe X-ray diffraction patterns of the drugs are presented in
Figure 1. Judging from the sharp peaks and the lack of a ‘halo’both drugs are crystalline.
Particle size distributions of the drugs and carriermaterials
Because the volume median diameters of the drugs are wellwithin the desirable size range for inhalation of 1-3 µm (seeTable 1), the drugs are considered suitable for use in theseexperiments.
The carrier material as obtained after the classificationprocedure still contained a measurable amount of fines, whichis presented in Table 1 as the volume fraction < 10 µm.Placebo mixing of both carrier fractions unexpectedly resultedin a trend of decreasing volume fraction < 10 µm. The loss offines with mixing was confirmed by visual observation of thecarrier particles with SEM (Figure 2). The reduction of theamount of fines may be explained by their adhesion to theinner walls of the mixing vessel, which resulted in a faint whitehaze being visible after placebo mixing.
The data from RODOS dispersion suggest that the finecarrier fraction contains a higher volume fraction of lactosefines than the coarse carrier fraction. However, because thespecific surface area of the fine carrier fraction is approximately3.7 times that of the coarse carrier (calculated based on theratio of the arithmetic mean fraction diameters), their finescontent per unit carrier surface area may well be comparable.This statement is supported by Figure 2, in which both carrierfractions are shown at a different magnification so as to displaythe carrier particles at the approximate same size. There is nonotable difference in surface coverage by fines between thefine and coarse carrier fractions. Differences in the sizedistribution of the lactose fines may exist between the carrierfractions, however.
The appearance of lactose fines in commercial carrierproducts is inevitable as they cannot be effectively removed.They will influence the balance of the principal processes (i.e.drug (de-) agglomeration, redistribution and compression)during mixing of the blends to certain extent. Based on theplacebo experiments it may be expected that in our study drugdetachment will not be affected by mixing time through thegeneration of new lactose fines. Furthermore, any difference inthe effect of mixing time on drug detachment between bothcarrier fractions is not likely to be the result of a difference inthe covering of the carrier by lactose fines. However, it is notclear to what extent this may be determined by other factorstoo, such as differences in the scale of carrier surfacediscontinuities between the carrier fractions.
Content uniformityA trend of decreasing drug content with prolonged mixing
was observed for both drugs mixed with the coarse carrier
Mixing Time Effects on Powders for Inhalation
PLOS ONE | www.plosone.org 4 July 2013 | Volume 8 | Issue 7 | e69263

(Table 2, 0.4% of drug). This is the result of drug adhesion tothe inside of the mixing vessel, which was observed as theformation of a white haze that became more opaque as mixingwas continued. For the fine carrier, drug losses occurredmostly at the early onset of mixing after which the contentstayed relatively constant (Table 2, 1.48% of drug). Thedifference in absolute drug loss to the mixing vessel wallbetween the carrier fractions is small (approximately 15 and18.5 mg for the coarse and fine carrier fraction, respectively),which suggests that the drug loss is largely determined bysaturation of the mixing vessel’s inner walls, which isindependent of the carrier type. The losses are of the sameorder of magnitude for both drugs.
For all blends the RSD of the content is < 3% and they aretherefore considered homogeneous (Table 2). No meaningfulchange in RSD with increased mixing time is observed, onlythe RSD of the 0.4% salmeterol mixture after 420 minutes ofmixing is notably higher. This higher RSD accompanies anincrease in segregation sensitivity. Between 2 and 420 minutesof mixing the drug loss resulting from 1 minute of vibratorysieving increases from 15.6% to 52.4%.
Agglomeration effectsScanning electron microscopy. The relatively lower
degree of homogeneity and increased segregation sensitivityfor the 420 min 0.4% salmeterol mixture are likely the result ofa high degree of agglomeration of the salmeterol (and possiblyfine lactose) particles onto or in between the coarse carrierparticles. For the large agglomerates of approximately 25 µmthat are visible in Figure 3 (C1 and C2) gravitational forces startto dominate adhesion forces. This shifts the balance betweenrandomisation and ‘ordering’ or adhesion in favour ofrandomisation [4]. The reproducibility of the formation of largeagglomerates was confirmed by SEM for at least three differentbatches of 0.4% salmeterol prepared. A less pronouncedagglomeration of salmeterol with prolonged mixing is observedon the fine carrier (Figure 4). The agglomerates are lessnumerous and they are smaller than those on the coarsecarrier (no larger agglomerates than about 10 µm could befound in the specimen). This observation suggests thatagglomeration may occur in the carrier surface irregularities,which are larger for the coarse carrier. These data are in linewith the conclusion from previous studies that the size of drug
Table 1. Characteristic PSD data (average (SD)) of thedrugs (n = 2) and carrier material (n = 3).
X50 (µm) V% < 10 µmSalmeterol (dry) 1.41 (0.01) 99.99 (0.01)Salmeterol (wet) 1.43 (0.01) 100Fluticasone (dry) 1.80 (0.06) 99.85 (0.03)Fluticasone (wet) 1.59 (0.02) 99.53 (0.04)Fine carrier 72.04 (0.28) 1.65 (0.06)Fine placebo* 74.75 (0.60) 1.15 (0.51)Coarse carrier 289.97 (4.29) 0.34 (0.41)Coarse placebo* 288.69 (0.87) 0.15 (0.01)
* The fine and coarse carrier as obtained after the sieving procedure have beenplacebo blended for 600 and 420 minutes, respectively.
Figure 1. X-ray diffraction data for salmeterol xinafoate (SX) and fluticasone propionate (FP). doi: 10.1371/journal.pone.0069263.g001
Mixing Time Effects on Powders for Inhalation
PLOS ONE | www.plosone.org 5 July 2013 | Volume 8 | Issue 7 | e69263

agglomerates after mixing increases with increasing carrierparticle size [7,17]. However, the conclusions from thosestudies are based on mixtures containing equal drug contents.This results in a higher carrier surface payload (mg/m2) forlarger carrier size fractions, which may also cause an increasein agglomerate size. In our study a difference in carrier surfacepayload cannot have caused the difference in agglomerationbehaviour between both carrier size fractions, as it was keptconstant.
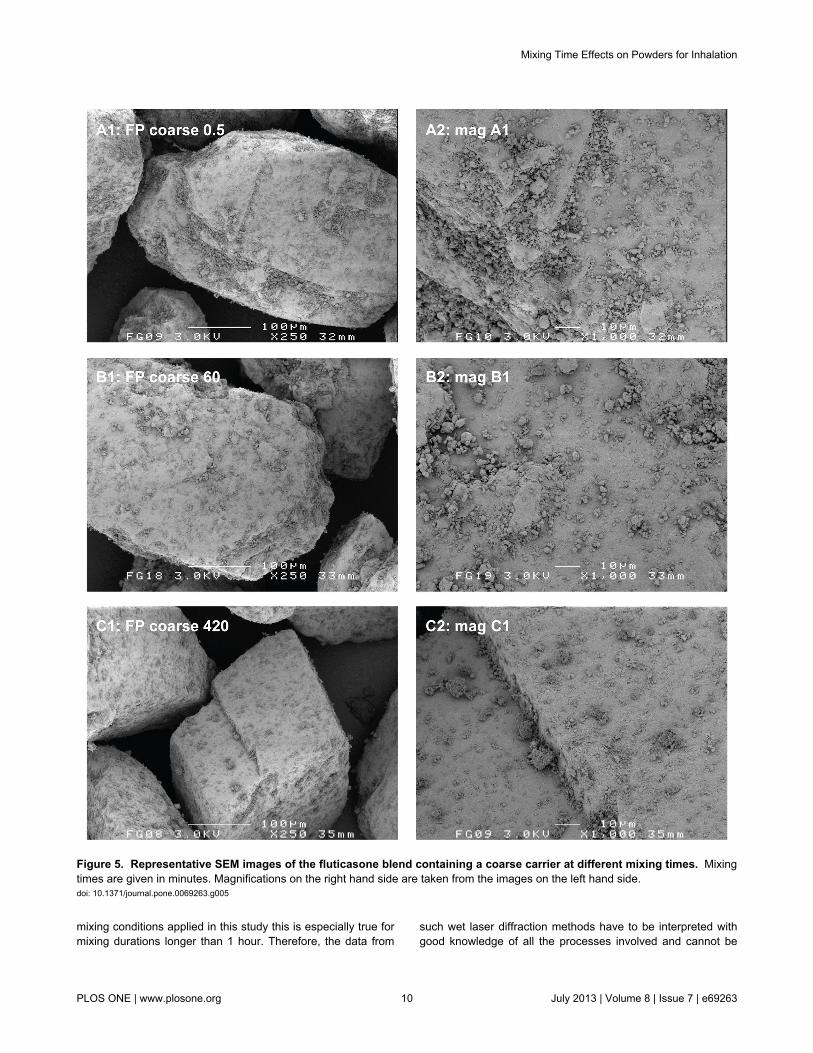
The agglomeration behaviour of fluticasone is markedlydifferent from that of salmeterol when mixed with the coarsecarrier depending on the mixing time. Some fluticasoneagglomerates could be found in the specimen after 420minutes of mixing (Figure 5, C1 and C2), but they are smaller(maximally about 10 µm) and less numerous than is the casefor salmeterol (Figure 3, C1 and C2). When mixed with the finecarrier, the difference in agglomeration behaviour betweenfluticasone (Figure 6) and salmeterol (Figure 4) is not aspronounced. Evaluations based on SEM images can lead tobiased or incorrect conclusions, however. Disadvantages
inherently associated with SEM imaging include the difficulty ofrepresentative sampling from the mixture, representativeimaging of a specimen and the possible altering of the sampleduring its preparation. SEM images presented in this paper aretherefore images that have been obtained with utmost care toascertain their representativeness. Their selection has beenmade after studying multiple samples and batches and imagingdifferent spots of the same specimen. In addition, care wastaken for the gentle handling of the powder during samplepreparation. Nevertheless, one should keep in mind thatconclusions from SEM imaging are based on a very limitednumber of observations, which is why laser diffraction wasused in this study as an additional characterisation technique.
The difference in the propensity towards agglomerationbetween both drugs, which becomes especially notable afterprolonged mixing with the coarse carrier, can be explained by adifference in their balance of intrinsic cohesive to adhesiveinteraction energy in combination with lactose. Values for thecohesion-adhesion balance (CAB) of salmeterol andfluticasone with lactose have previously been reported to be
Figure 2. Representative SEM images of the sieved and placebo blended carrier material. Mixing times for the placeboblends displayed are 420 and 600 minutes for the coarse and fine fraction, respectively.doi: 10.1371/journal.pone.0069263.g002
Mixing Time Effects on Powders for Inhalation
PLOS ONE | www.plosone.org 6 July 2013 | Volume 8 | Issue 7 | e69263

2.39 and 0.22, respectively [20]. This means that thecohesiveness of salmeterol is 2.39 times its adhesiveness tolactose, whereas for fluticasone the adhesiveness to lactose is4.55 times its cohesiveness. Although these results have beenobtained with different batches of material (which mayinfluence CAB values significantly [24]), they are in agreementwith the greater agglomeration tendency of salmeterol than thatof fluticasone observed in this study.
Laser diffraction analysis. The wet suspension laserdiffraction method provides data on the agglomerationbehaviour of salmeterol that are in agreement with theobservations from SEM (Figure 7). The X50 of 93 µm at t = 0min represents the agglomerate size of the screened startingmaterial. These agglomerates are quickly dispersed duringblending with the coarse carrier until a minimum X50 of only2.71 µm is reached after 10 minutes, which approaches theprimary particle size of the drug (Table 1). Continued mixingthen results in a gradual increase of the X50 to a value of 25.4µm after 420 minutes. As discussed, agglomerates of the sameorder of magnitude have been observed with SEM (Figure 3,C1 and C2). For the fine carrier fraction, a minimum in X50 isreached after 120 minutes, which remains very much the same(around 5 µm) during continued mixing. Compared to the X50-value of the primary salmeterol particles (Table 1) this confirmsthe occurrence of only minor agglomeration, as was concludedfrom SEM micrographs too.
Although these data for salmeterol may be in agreement withthe images from SEM, they are likely to be biased bydissolution effects and subsequent deagglomeration insuspension. It was noticed that with prolonged mixing a largersample of the blends was required to attain the desired opticalconcentration of around 10% (up to a 6-fold difference betweenthe shortest and longest mixing times for both carrier fractions).This observation can neither be explained by the slightly lowerdrug content with prolonged mixing (Table 2), nor bydifferences in the particle size distribution of the agglomerates(especially for the fine carrier). It is much more likely the resultof an increasing apparent solubility of salmeterol with increased
mixing time that causes improved dissolution of the drug andthus the formation of a supersaturated solution (Figure 8).Therefore, the conclusion has to be drawn that the salmeteroldata in Figure 7 may to certain extent be biased by dissolutioneffects, especially for long mixing times. This may result inenhanced dispersion of agglomerates, and thusunderestimation of the agglomerate size.
For fluticasone, laser diffraction data are not in agreementwith the SEM images (Figure 7). With the coarse carrier, amaximum agglomerate size in the mixture of 25 µm ismeasured after 60 minutes of mixing, but agglomerates of thissize could not be observed in the mixture by SEM (Figure 5, B1and B2). For the fine carrier the difference is even morepronounced with a maximum of 75 µm after 780 minutes ofmixing determined by laser diffraction measurements, whereasonly small agglomerates of maximally 4-10 µm could be foundwith SEM (Figure 6, D1 + D2). The value of 75 µm coincidesremarkably well with the size of the carrier particles. Lightmicroscopic imaging of the suspensions revealed that thisdiscrepancy is the result of the formation of insoluble, thin filmsthat consist of the drug material and have sufficient structuralintegrity to remain intact in suspension after completedissolution of the carrier. For the fine carrier these films haveshapes similar to those of the carrier particles (Figure 9, top),whereas for the coarse carrier the films cover a relativelysmaller part of the particle surface (Figure 9, bottom). Possiblythe larger surface irregularities prevent the formation of acontinuous film over the complete surface of the coarse carrier.Spontaneous re-agglomeration of drug particles aftersuspension is a well-known possible source of bias with wetlaser diffraction measurements too. However, such a processis not likely to have contributed to the discrepancy betweenresults from laser diffraction and SEM for fluticasone: noincrease in the X10, X50 or X90 values was observed for any ofthe mixture samples during or after dissolution of the carriermaterial or for the suspended primary particles.
The formation of a film or coating on the carrier surface byboth drugs can be observed with SEM too, especially on thefine carrier (Figures 4 and 6, D2). For salmeterol, film formationon the fine carrier could also be confirmed by suspension of theblend mixed for 600 minutes in a supersaturated drug solution.Then, similar films as shown in Figure 9 (top) for fluticasonewere observed by light microscopic imaging several minutesafter submersion of the particles (images not shown). Thisconfirms that dissolution and dispersion prior to the laserdiffraction measurements (Figure 7) must have occurred forsalmeterol. The apparent solubility of fluticasone in the mediumused in this study is too low to be reliably measured byspectroscopy, even after prolonged mixing. This explains whydissolution effects did not occur for fluticasone and the filmsremained intact in the suspension medium during the laserdiffraction measurements.
Dissolving the carrier material to allow the measurement ofdrug agglomerates in suspension is a commonly appliedtechnique [5,6,17]. However, such data are a measure of thestrength of agglomerates as well as their size, because de-agglomeration can occur during the time required fordissolution of the carrier. This will be more pronounced forweaker agglomerates. In addition, fines of the same material as
Table 2. Content uniformity test results for blendscontaining 0.4% drug on a coarse lactose carrier or 1.48%drug on a fine lactose carrier (n = 10).
0.4% salmeterol 0.4% fluticasone1.48% salmeterol1.48%fluticasone
Mixingtime Content*RSD (%)Content*RSD (%)Content*RSD (%)Content*
RSD(%)
0.5 min 95.3 0.91 97.4 1 95.5 0.96 96.5 1.232 min 94.9 0.89 97.1 0.8 96.5 0.75 95 1.4710 min 93.5 0.61 94 0.82 96.7 0.37 95.7 0.5330 min 90.3 0.56 90.7 0.56 96.3 0.86 94.5 0.6860 min 87.3 0.92 89.9 0.51 96.4 0.49 94.4 0.88120 min 76.5 0.82 86.1 0.73 96.2 0.72 93.9 0.88420 min 84.9 2.54 84.2 1.16 94 0.89 92.6 0.34600 min 93.4 0.82 94.7 0.41 780 min 94.6 0.49
* Content = % of drug weighed.
Mixing Time Effects on Powders for Inhalation
PLOS ONE | www.plosone.org 7 July 2013 | Volume 8 | Issue 7 | e69263

the carrier will be dissolved, which may cause the dispersion ofcomposite agglomerates. Our results furthermore show that
changes in the apparent solubility of the drugs and filmformation may introduce additional sources of bias. With the
Figure 3. Representative SEM images of the salmeterol blend containing a coarse carrier at different mixing times. Mixingtimes are given in minutes. Magnifications on the right hand side are taken from the images on the left hand side.doi: 10.1371/journal.pone.0069263.g003
Mixing Time Effects on Powders for Inhalation
PLOS ONE | www.plosone.org 8 July 2013 | Volume 8 | Issue 7 | e69263

Figure 4. Representative SEM images of the salmeterol blend containing a fine carrier at different mixing times. Mixingtimes are given in minutes. Magnifications on the right hand side are taken from the images on the left hand side.doi: 10.1371/journal.pone.0069263.g004
Mixing Time Effects on Powders for Inhalation
PLOS ONE | www.plosone.org 9 July 2013 | Volume 8 | Issue 7 | e69263
mixing conditions applied in this study this is especially true formixing durations longer than 1 hour. Therefore, the data from
such wet laser diffraction methods have to be interpreted withgood knowledge of all the processes involved and cannot be
Figure 5. Representative SEM images of the fluticasone blend containing a coarse carrier at different mixing times. Mixingtimes are given in minutes. Magnifications on the right hand side are taken from the images on the left hand side.doi: 10.1371/journal.pone.0069263.g005
Mixing Time Effects on Powders for Inhalation
PLOS ONE | www.plosone.org 10 July 2013 | Volume 8 | Issue 7 | e69263

Figure 6. Representative SEM images of the fluticasone blend containing a fine carrier at different mixing times. Mixingtimes are given in minutes. Magnifications on the right hand side are taken from the images on the left hand side.doi: 10.1371/journal.pone.0069263.g006
Mixing Time Effects on Powders for Inhalation
PLOS ONE | www.plosone.org 11 July 2013 | Volume 8 | Issue 7 | e69263

Figure 7. X50 from laser diffraction analysis of suspended drug particles after dissolution of the carrier material. Y-errorbars represent minimum and maximum values measured (n = 2).doi: 10.1371/journal.pone.0069263.g007
Mixing Time Effects on Powders for Inhalation
PLOS ONE | www.plosone.org 12 July 2013 | Volume 8 | Issue 7 | e69263

used unconditionally as a measure for the size of detachabledrug agglomerates. To aid in their correct interpretation,supporting data from other characterisation techniques shouldpreferably be provided.
Press-on effectsThe increase in apparent solubility of salmeterol (Figure 8)
can be explained by the mechanical stress that is imparted onthe drug particles during mixing. This causes disordering oramorphisation of the initially crystalline particle surface [25,26].Mixing with the coarse carrier results in a faster increase inapparent solubility than does mixing with the fine carrier.Apparently, the higher mass of the coarse carrier particlesresults in increased mechanical stress on the drug particlesduring collisions and this leads to faster amorphisation. Within60 minutes of mixing a plateau is reached in the apparentsolubility which is roughly 1.5 times the supposed equilibriumsolubility of the starting material. This means that a maximumdegree of disordering of the salmeterol particles is reachedwithin this time or that the suspension concentration chosen inthese experiments is not optimal for distinguishing furtherdisordering [26].
The fact that the drug particles are subjected to significantmechanical stress during mixing does not only become clearfrom the increase in apparent solubility of salmeterol. SEMimaging of the blends reveals a change in morphology of theindividual drug particles upon prolonged mixing too. This ismost clearly illustrated in Figure 10, where the starting materialis compared with agglomerates found in the mixture with a finecarrier after 420 (salmeterol) or 780 minutes (fluticasone) of
mixing. Similar agglomerates and similarly shaped primaryparticles were not observed in the placebo blends. Therefore,the agglomerates shown in Figure 10 are likely to consistprimarily of the drug component. The original plate-likesalmeterol particles are extensively plastically deformed,whereas fluticasone appears to be fragmented into smallneedle shaped particles. In the mixture with the coarse carrier,plate-like salmeterol particles have mostly been deformed tospherical particles already after 60 minutes of mixing (Figure 3,B2). When mixed with the fine carrier, the original plate-likeshape of the salmeterol particles is still recognisable after 60minutes of mixing (Figure 4, B2). Only after 420 minutes ofmixing their original shape is completely lost (Figure 4, C2).Therefore, the conclusion from the apparent solubility data thatgreater mechanical stress is caused by the coarser carrier is inagreement with the SEM images. Apparently, the larger carriersurface irregularities of the coarser carrier particles do not offersufficient protection to the drug particles from mechanicalstress to balance the higher frictional and inertial forces thatresult from a higher mass of this carrier.
The introduction of a higher degree of solid-state disorderwith prolonged mixing may affect the chemical stability of theformulation. In addition, recrystallisation at the drug-carrierinterface during storage may severely affect the powder’sdispersion behaviour in a negative way. The inertial andfrictional mixing forces that cause an increase in apparentsolubility may partly act as press-on forces, which causeincreased drug-carrier interactions and thus negativelyinfluence drug detachment during inhalation. Based on thefaster increase in apparent solubility (Figure 8) a greater
Figure 8. Change in apparent solubility of salmeterol during mixing with the coarse and fine lactose carrier. The apparentsolubility is represented by the absorption of the solution at 280 nm.doi: 10.1371/journal.pone.0069263.g008
Mixing Time Effects on Powders for Inhalation
PLOS ONE | www.plosone.org 13 July 2013 | Volume 8 | Issue 7 | e69263

negative contribution from press-on forces to the overall effectof mixing time on drug detachment may be expected for thecoarse carrier than for the fine carrier.
Drug (re-)distributionDrug particles are primarily located in carrier surface
irregularities after 0.5 minutes of mixing (Figures 3-6, A1 andA2). The presented data indicate that the drug particles aresubsequently redistributed over the complete carrier surfaceduring prolonged mixing, where they may become immobilised
by compression on the carrier surface to form continuous,coherent films. In addition, certainly for salmeterol, asubstantial fraction of the drug forms large agglomerates(whether preceded by drug redistribution into carrier surfaceirregularities or not). Agglomeration and compression (as aresult of mechanical stress that concurrently causes the filmformation and increased solubility) of the drug particles areespecially pronounced after mixing for at least 60 minutes.Therefore, after such long mixing times, the redistribution ofdrug particles between carrier surface sites with a different
Figure 9. Light microscopic images of suspended fluticasone films after dissolution of the lactose carrier. Top: 1.48%fluticasone mixed with the fine carrier for 600 minutes, the scale bar represents 60 µm; bottom: 0.4% fluticasone mixed with thecoarse carrier for 420 minutes, the scale bar represents 15 µm.doi: 10.1371/journal.pone.0069263.g009
Mixing Time Effects on Powders for Inhalation
PLOS ONE | www.plosone.org 14 July 2013 | Volume 8 | Issue 7 | e69263

intrinsic binding activity is likely to be of minor importance thanpress-on and agglomeration effects to the overall effect ofmixing time on drug detachment. With shorter mixingdistribution effects may be more significant.
Drug detachmentThe data presented in Figure 11 confirm that the effect of
mixing time on drug detachment is dependent on the type ofdrug, the carrier size fraction and the flow rate. The effect ofmixing time is most pronounced within the first 120 minutes ofmixing.
For salmeterol mixed with the coarse carrier, drugdetachment at a flow rate of 20 L/min increases from 23.9%after 2 minutes of mixing to 43.4% after 420 minutes of mixing.These values are in line with the change in the amount of drugthat is contained in easily detachable agglomerates, as wasmeasured with the segregation sensitivity test (i.e. 15.6% to52.4%, respectively). Therefore, the positive effect may be the
result of a dominance of agglomerate formation. However, themaximum increase in drug detachment is already attainedwithin the first 30 minutes of mixing, whereas agglomerationseemed to occur mostly from 10 to 420 minutes of mixing(based on the laser diffraction data in Figure 7) or from 60–420minutes of mixing (based on the SEM images in Figure 3).Therefore, other effects may have contributed to the positiveeffect as well. The observed change in the shape of thesalmeterol particles by SEM could be one of those additionaleffects (as shown in Figure 3, B2). At 60 L/min, the effect ofmixing time is dominated by press-on effects and possiblysome migration of drug particles towards active binding sites(distribution effects). In the first 10 minutes of mixingdeagglomeration may also contribute to a lower drugdetachment (i.e. a lower ratio of inertial separation to bindingforce due to a lower drug agglomerate mass). As a result, drugdetachment decreases from nearly 100% after 0.5 minutes ofmixing to 75% after 120 minutes of mixing and an oppositeeffect from that at 20 L/min is thus obtained. In other words, not
Figure 10. Representative SEM images showing morphological changes to the drug particles occurring duringmixing. Top: the salmeterol (SX) and fluticasone (FP) starting materials; bottom: drug agglomerates on the fine carrier after acertain mixing time (in minutes).doi: 10.1371/journal.pone.0069263.g010
Mixing Time Effects on Powders for Inhalation
PLOS ONE | www.plosone.org 15 July 2013 | Volume 8 | Issue 7 | e69263

the whole drug particle mass is affected by mixing time in thesame way. The salmeterol fraction that is contained in easilydetachable agglomerates increases (Figure 11: coarse, 20 L/min) concurrently with the fraction that is contained in astrongly bound film on the carrier surface (Figure 11: coarse,60 L/min). Which effect is measured depends on the dispersionefficacy (i.e. flow rate) during the drug detachmentexperiments. The fact that, at 60 L/min, a plateau in drugdetachment is reached suggests that during mixing a dynamicequilibrium is established between drug that is present in thestrongly bound film on the carrier surface and drug that ispresent as more readily detachable drug particles (includingagglomerates).
In contrast to the coarse carrier, prolonged mixing with thefine carrier results in a negative effect on drug detachment at20 L/min. Because the agglomeration of salmeterol is lesspronounced with the finer carrier, the positive contribution fromthis effect is not dominant over any negative contribution fromincreased compression of the drug onto the carrier surface andredistribution of drug towards active binding sites. The greaterdominance of press-on and possibly distribution effects is alsoapparent at 60 L/min, because no plateau value is reached and
the minimum amount of drug detached is lower than with thecoarse carrier (42% versus 75%, respectively). Based on theSEM images and apparent solubility data it was concluded thatmechanical stress and thus press-on forces on the drugparticles are lower for the fine carrier. This effect, which shouldresult in improved drug detachment, is apparently offset by thedecrease in agglomeration from the coarse to the fine carrier.
For fluticasone, drug detachment at 20 L/min stays relativelyconstant on continued mixing with the coarse carrier. Thissuggests that effects from agglomeration are balanced bypress-on effects and distribution effects and are thus lessdominant than is the case for salmeterol. This is in agreementwith the lower degree of agglomeration that was observed forfluticasone. Also the lower plateau value in drug detachmentthat is reached at 60 L/min indicates that the dynamicequilibrium between drug being present as detachableagglomerates and as strongly adhering films is shifted towardsthe latter when changing salmeterol for fluticasone. The effectof mixing time is comparable for both drugs when mixed withthe fine carrier. This too is in agreement with the lesspronounced difference in their agglomeration behaviour (which
Figure 11. Drug detachment at 20 and 60 L/min as function of mixing time. Y-error bars represent minimum and maximumvalues measured (n = 5).doi: 10.1371/journal.pone.0069263.g011
Mixing Time Effects on Powders for Inhalation
PLOS ONE | www.plosone.org 16 July 2013 | Volume 8 | Issue 7 | e69263

for salmeterol is likely restricted by the smaller surfaceirregularities).
Practical implicationsThe results show that the mixing time should be carefully
considered for the formulation of carrier-based inhalationpowders. The optimal mixing time may vary depending on theformulation purpose and the choice for other, interactingvariables. A balance between satisfactory homogeneity andmechanical stability on the one hand and dispersibility on theother may be achieved at relatively short mixing times.However, the effect of mixing time is also most pronounced atthe start of mixing, and therefore, a sufficiently robust processmay require longer mixing instead. For research purposes itmay be desirable to stress press-on effects or agglomerationeffects, which can be achieved by prolonged mixing, especiallywhen using a coarse carrier fraction.
The need for a careful consideration of the applied mixingtime is further stressed by the fact that the relevance of mixingtime is not restricted to the homogeneity and dispersionperformance of the powder formulation. The mechanical stressfrom (prolonged) mixing may influence the solid state of thedrug and, with that, its dissolution behaviour (absorption) afterinhalation and subsequent deposition in the lungs and thephysical and chemical stability of the mixture during storage.
The long mixing times that have been applied in this studymay not be representative for the mixing times applied inindustrial dry powder inhalation formulation. However, many ofthe effects that are shown in is this paper may occur at a higherrate when larger batch sizes and higher shear mixing principlesare used, as is common for industrial processes. For example,it was shown that 1 hour of mixing with the low shear Turbulablender used in this study (operated at 90 rpm) results in asimilar dispersion performance as 5 minutes of mixing with alab-scale high shear blender (i.e. Picomix operated at 1000rpm) [27].
Future perspectivesThe overall effect of mixing time on drug detachment is likely
to depend on more variables than the ones addressed in thispaper. Examples are the dispersion principle, the drug content,the carrier surface roughness, the mixing principle and themixing intensity. Furthermore, the change in drug detachmentis only an indication of the change in the maximum fine particlefraction that can be obtained, depending on the degree ofagglomerate dispersion following detachment. Therefore, muchis still to be learned from future investigations that addressthese factors in combination with the right techniques tomeasure or monitor the relevant powder properties.
Conclusions
Quantitative and qualitative interactions occur between theeffect of mixing time on drug detachment and the type of drug,the carrier size fraction and the flow rate used. This can besatisfactorily explained with a balance of three processes whichtake place during mixing, i.e., drug (de-) agglomeration,compression onto and (re-)distribution over the carrier surface.A combination of SEM, laser diffraction techniques and themeasurement of the apparent solubility of the drug can be usedto qualitatively analyse these processes, but an exactquantification requires further improvement of these or thedevelopment of other techniques.
Author Contributions
Conceived and designed the experiments: FG PH AHdeB.Performed the experiments: FG PH. Analyzed the data: FG PHHWF AHdeB. Wrote the manuscript: FG PH HWF AHdeB.
References
1. Lacey PMC (1997) The mixing of solid particles. Chem Eng Res Des75, Supplement: S49-S55. doi:10.1016/S0263-8762(97)80004-4.
2. Hersey JA (1975) Ordered mixing: A new concept in powder mixingpractice. Powder Technol 11: 41-44. doi:10.1016/0032-5910(75)80021-0.
3. Staniforth JN (1981) Total Mixing. Int J Pharm Tech Prod Mfr 2: 7-12.4. Staniforth JN (1987) British Pharmaceutical Conference Science Award
Lecture 1986: Order out of chaos. J Pharm Pharmacol 39: 329-334.doi:10.1111/j.2042-7158.1987.tb03393.x. PubMed: 2886579.
5. Kale K, Hapgood K, Stewart P (2009) Drug agglomeration anddissolution - What is the influence of powder mixing? Eur J PharmBiopharm 72: 156-164. doi:10.1016/j.ejpb.2008.12.015. PubMed:19347972.
6. de Villiers MM, Lötter AP, van der Watt JG (1993) Influence ofsurfactants and interactive mixing on the cohesive properties of apoorly wettable solid. Powder Technol 75: 159-165. doi:10.1016/0032-5910(93)80077-N.
7. de Boer AH, Hagedoorn P, Gjaltema D, Lambregts D, Irngartinger M etal. (2004) The Mode of Drug Particle Detachment from Carrier Crystalsin an Air Classifier-Based Inhaler. Pharm Res 21: 2167-2174. doi:10.1007/s11095-004-5171-6. PubMed: 15648247.
8. Travers DN (1975) Some observations on ordered mixing of micronizedsodium-bicarbonate with sucrose crystals. Powder Technol 12:189-190. doi:10.1016/0032-5910(75)80011-8.
9. de Boer AH, Hagedoorn P, Gjaltema D, Goede J, Kussendrager KD etal. (2003) Air classifier technology (ACT) in dry powder inhalation Part2. The effect of lactose carrier surface properties on the drug-to-carrier
interaction in adhesive mixtures for inhalation. Int J Pharm 260:201-216. doi:10.1016/S0378-5173(03)00264-3. PubMed: 12842340.
10. Kulvanich P, Stewart PJ (1987) The effect of blending time on particleadhesion in a model interactive system. J Pharm Pharmacol 39:732-733. doi:10.1111/j.2042-7158.1987.tb06978.x. PubMed: 2890739.
11. Lam KK, Newton JM (1991) Investigation of applied compression onthe adhesion of powders to a substrate surface. Powder Technol 65:167-175. doi:10.1016/0032-5910(91)80179-M.
12. Podczeck F (1996) Assessment of the mode of adherence and thedeformation characteristics of micronized particles adhering to varioussurfaces. Int J Pharm 145: 65-76. doi:10.1016/S0378-5173(96)04718-7.
13. Bridson RH, Robbins PT, Chen Y, Westerman D, Gillham CR et al.(2007) The effects of high shear blending on α-lactose monohydrate.Int J Pharm 339: 84-90. doi:10.1016/j.ijpharm.2007.02.022. PubMed:17398047.
14. Shur J, Harris H, Jones MD, Kaerger JS, Price R (2008) The role offines in the modification of the fluidization and dispersion mechanismwithin dry powder inhaler formulations. Pharm Res 25: 1631-1640. doi:10.1007/s11095-008-9538-y. PubMed: 18239861.
15. Dickhoff BHJ, de Boer AH, Lambregts D, Frijlink HW (2003) The effectof carrier surface and bulk properties on drug particle detachment fromcrystalline lactose carrier particles during inhalation, as function ofcarrier payload and mixing time. Eur J Pharm Biopharm 56: 291-302.doi:10.1016/S0939-6411(03)00109-7. PubMed: 12957644.
16. de Boer AH, Dickhoff BHJ, Hagedoorn P, Gjaltema D, Goede J et al.(2005) A critical evaluation of the relevant parameters for drug
Mixing Time Effects on Powders for Inhalation
PLOS ONE | www.plosone.org 17 July 2013 | Volume 8 | Issue 7 | e69263

redispersion from adhesive mixtures during inhalation. Int J Pharm 294:173-184. doi:10.1016/j.ijpharm.2005.01.035. PubMed: 15814242.
17. Le VNP, Robins E, Flament MP (2012) Agglomerate behaviour offluticasone propionate within dry powder inhaler formulations. Eur JPharm Biopharm 80: 596-603. doi:10.1016/j.ejpb.2011.12.004.PubMed: 22198291.
18. Dickhoff BHJ, Ellison MJH, de Boer AH, Frijlink HW (2002) The effectof budesonide particle mass on drug particle detachment from carriercrystals in adhesive mixtures during inhalation. Eur J Pharm Biopharm54: 245-248. doi:10.1016/S0939-6411(02)00082-6. PubMed:12191698.
19. Begat P, Morton DAV, Staniforth JN, Price R (2004) The Cohesive-Adhesive Balances in Dry Powder Inhaler Formulations II: Influence onFine Particle Delivery Characteristics. Pharm Res 21: 1826-1833. doi:10.1023/B:PHAM.0000045236.60029.cb. PubMed: 15553229.
20. Jones MD, Hooton JC, Dawson ML, Ferrie AR, Price R (2008) AnInvestigation into the Dispersion Mechanisms of Ternary Dry PowderInhaler Formulations by the Quantification of Interparticulate Forces.Pharm Res 25: 337-348. doi:10.1007/s11095-007-9467-1. PubMed:17952568.
21. Elamin AA, Ahlneck C, Alderborn G, Nyström C (1994) Increasedmetastable solubility of milled griseofulvin, depending on the formation
of a disordered surface structure. Int J Pharm 111: 159-170. doi:10.1016/0378-5173(94)00132-4.
22. Mosharraf M, Nyström C (1999) The effect of dry mixing on theapparent solubility of hydrophobic, sparingly soluble drugs. Eur JPharm Sci 9: 145-156. doi:10.1016/S0928-0987(99)00043-3. PubMed:10620727.
23. de Boer AH, Hagedoorn P, Gjaltema D, Goede J, Frijlink HW (2003) Airclassifier technology (ACT) in dry powder inhalation: Part 1.Introduction of a novel force distribution concept (FDC) explaining theperformance of a basic air classifier on adhesive mixtures. Int J Pharm260: 187-200. doi:10.1016/S0378-5173(03)00250-3. PubMed:12842339.
24. Price R (2010) Low and High Energy Blending. Presentation atconference: Lactose as a carrier for inhalation products. Parma.
25. Hüttenrauch R, Fricke S, Zielke P (1985) Mechanical Activation ofPharmaceutical Systems. Pharm Res 2: 302-306. doi:10.1023/A:1016397719020.
26. Mosharraf M, Nyström C (2003) Apparent Solubility of Drugs in PartiallyCrystalline Systems. Drug Dev Ind Pharm 29: 603-622. doi:10.1081/DDC-120021310. PubMed: 12889779.
27. Cordts E, Grasmeijer F, Van der Wel P, Dekens B, De Boer AH et al.(2012) The influence of mixing time and intensity on blend homogeneityand dispersion performance. Drugs Deliv Lungs 23. Edinburgh. pp.146-149
Mixing Time Effects on Powders for Inhalation
PLOS ONE | www.plosone.org 18 July 2013 | Volume 8 | Issue 7 | e69263
Copyright © 2022 FDOKUMEN