Uplift and active tectonics of southern Albania inferred from incision of alluvial terraces

Mixing of metamorphic and surficial fluids during the uplift of the
Hercynian upper crust: consequences for gold deposition
Marie-Christine Boirona,*, Michel Cathelineaua, David A. Banksb,Serge Fourcadec, Jean Vallancea
aCREGU and UMR G2R CNRS 7566, BP 23, 54501 Vandoeuvre les Nancy cedex, FrancebSchool of Earth Sciences, University of Leeds, Woodhouse Lane, Leeds LS2 9JT, UK
cUMR CNRS 6118 Geosciences Rennes, Campus de Beaulieu, Av. du Gal Leclerc, 35042 Rennes cedex, France
Abstract
A detailed geochemical study of fluids from representative quartz-sealed faults hosting late Hercynian gold concentrations
shows that fluids percolating the mineralised faults had two main distinct reservoirs: one was a quite shallow and the other
rather deep-seated. Both fluids have lost a great part of their original geochemical signature through interactions with host
metamorphic formations. Early fluids, present during the primary sealing of the faults by quartz, are considered to have
effectively equilibrated with the metamorphic pile and then predominantly flowed upwards along the faults. They are
characterised by CH4/CO2/H2O ratios rather typical of fluids equilibrated with graphite, and moderate to medium chlorinities
with a high Br/Cl ratio. The striking feature of the gold-bearing quartz is that gold is not synchronous within any quartz
deposition, and appears located in late microfractures and associated with Pb–Bi–Sb sulphosalts and sulphides. These late
stages are characterised by fluids whose salinities decrease to very low values indicating their progressive dilution by waters of
more surficial origin in the fault system.
The long-lived activity of the fault favoured the connection between two distinct fluid reservoirs at a critical time during the
basement uplift. The fluids evolved through two main driving mechanisms which were responsible for the Au deposition: (i)
decrease in temperature accompanying decompression from supra-lithostatic to hydrostatic conditions which yielded, in some
instances, volatile unmixing in the faulted systems, (ii) mixing of the resulting fluids with waters entering the hydrological
systems from shallower reservoirs. In addition to dilution and fluid mixing which are favourable factors for decreasing the gold
solubility, the presence of microfractured sulphides could have enhanced gold precipitation through electrochemical processes.
D 2002 Elsevier Science B.V. All rights reserved.
Keywords: Gold; Fluid chemistry; Stable isotopes; P–T conditions; Uplift; Variscan belt
1. Introduction
Previous case studies of Au–(As) ore deposits in
the Variscan belt of western Europe have shown that
they formed under similar conditions during the late
stages of uplift (Boiron et al., 1990; Noronha et al.,
2000). Most mineralised structures are faults sealed by
0009-2541/02/$ - see front matter D 2002 Elsevier Science B.V. All rights reserved.
PII: S0009 -2541 (02 )00274 -7
* Corresponding author. Tel.: +33-3-83-68-47-30; fax: +33-3-
83-68-47-01.
E-mail address: [email protected]
(M.-C. Boiron).
www.elsevier.com/locate/chemgeo
Chemical Geology 194 (2003) 119–141

Fig. 1. General map of the Variscan range in Western Europe with location of the studied ore deposits (modified from Matte, 1991).
M.-C
.Boiro
net
al./Chem
icalGeology194(2003)119–141
120

quartz that was deposited from volatile-rich fluids, but
experienced a complex evolution combining ductile
then brittle deformation during uplift (Boiron et al.,
1996). In contrast with most Archean Au-lodes
(Groves, 1993), mineralised quartz faults are charac-
terised all over Europe by a long-lived structural
evolution revealed by macro- and microstructures
inherited from various superimposed brecciation, frac-
turing, sealing or healing stages (Bouchot et al.,
2000). Thus, crack-seal textures commonly described
in Archean lode deposits (Robert and Brown, 1986;
Dugdale and Hagemann, 2001) are generally lacking
in late Hercynian deposits. Gold-hosting material in
the latter deposits rather consists of breccia made of
milky quartz cemented by fine-grained quartz which,
in turn, is affected by microfracturing. Microfractures
are frequently healed as fluid inclusion planes but
sometimes are filled with hyaline quartz (Boiron et al.,
1992). The succession of mineral assemblages and
fluid types defines a unique cycle of fluid evolution in
most studied faults. The apparent similarity of the
processes at the scale of the whole European province
of Hercynian gold deposits provides the opportunity
to synthesise fluid geochemistries and sources in an
attempt to build up a generalised model of fluid
production and flow regimes during the late uplift
stage of a collisional orogen.
This present paper compares the characteristics of
fluids involved in some important crustal structures
mineralised in Au and As throughout western Europe
(Fig. 1) namely: (i) in ‘‘mesothermal’’ gold deposit
fluids (quartz veins in the gold-bearing Saint-Yrieix
district (Bouchot et al., 1989; Boiron et al., 1990, 1992;
Essarraj et al., 2001), in the Salsigne district (Catheli-
neau et al., 1993), inNorth Iberia (Galicia) (Boiron et al.,
1996; Arias and Martin-Izard, 2000) and in the Bohe-
mian Massif (Moravek et al., 1989; Boiron et al., 2001)
and (ii) fluids associated with shallow ‘‘epithermal’’
mineralisation (As, Au) in volcano–sedimentary series
(Marche-Combrailles; Boiron et al., 1989; Cathelineau
et al., 1989). Paragenetic mineral associations before
and during the ore deposit stage, related chemical
evolution as well as gold distribution were simultane-
ously considered in order to unravel the physical/chem-
ical factors controlling the gold ore-forming processes.
The present synthesis uses a multitechnique data-
base from fluid inclusions that was systematically
built up on the aforementioned Au–As ore deposits
combined with microstructural and ore mineral para-
genesis. New data are reported on individual inclu-
sions (microthermometry, Raman spectroscopy)
together with new analyses of bulk leachates and
oxygen isotope geochemistry on quartz from the same
(bulk and sometimes microscopic) samples.
2. Geological setting
2.1. The French Massif Central
2.1.1. The Saint -Yrieix district
This district is a major metalliferous province of
the Variscan belt with several deposits such as Laur-
ieras, Bourneix, Moulin de Cheni, La Fagassiere
which formed during the intense hydrothermal activ-
ity that characterised the Neo-Variscan period (320–
290 Ma) (Marignac and Cuney, 1999). The gold
deposits are located in the Northwestern part of the
French Massif Central, 40 km south of Limoges. This
area displays series of 0.1- to 1-km long fault zones
oriented NE–SW, locally hosting quartz lenses, the
length of which are typically in the 10 to 100 m range
(Bouchot et al., 1989; Touray et al., 1989). This
district, still mined today, has already produced
around 45 tons of gold metal.
The lower lithotectonic unit of the Limousin
gneisses hosting the deposits is composed of micas-
chists of probable Late Precambrian age and of Early
Paleozoic (490 Ma) orthogneisses. The basement of
central Limousin consists of a pile of metamorphic
thrust sheets emplaced during the Early Devonian
(Floc’h, 1983). Three main stages of metamorphism
and deformation are distinguished: (i) an early high
temperature (620 jC)–high pressure (500 MPa) stage,
followed by (ii) a major Barrovian stage and finally,
(iii) a Carboniferous event (Floc’h, 1983) character-
ised by the intrusions of peraluminous granites (ca.
320–330 Ma; Duthou et al., 1984).
The major faults hosting the gold-bearing quartz
structures strike 70F20jN, with a 60F10jNW dip,
and crosscut a series of gneisses with amphibolite or
leptynite intercalations, characterised by a flat-lying
foliation (5–20j dip). Peraluminous fine-grained gran-
ites intrude the gneisses as small sills or veins and do
not display any significant magmatic or ductile defor-
mation features.
M.-C. Boiron et al. / Chemical Geology 194 (2003) 119–141 121

This main studied site was the Laurieras system of
quartz lenses which has yielded relatively high-grade
ores around 25 g Au/ton. The main fault infillings in
‘‘Laurieras’’ display the textures typical of Au-miner-
alised quartz veins in the French Massif Central,
comparable with the ‘‘Bourneix’’ Au-bearing quartz
system (Hubert, 1986; Bouchot et al., 1989). New
data on two other gold-bearing structures, ‘‘Moulin de
Cheni’’ and ‘‘La Fagassiere’’, are also discussed.
2.1.2. The Salsigne district
The Salsigne district, located in the southern part of
the French Massif Central, is an important gold
province with the Salsigne mine still active and
numerous gold showings (120 tons of gold metal
extracted since 1924). The main Salsigne deposit is
hosted by metamorphic series including Cambrian and
Devonian limestones and Early Cambrian detrital
rocks (arkosic sandstones) (Tollon, 1969; Lepine,
1989). Early sulphides (pyrrhotite and arsenopyrite)
occur in microfractured rocks close to shear planes,
together with milky quartz and are affected by duc-
tile–brittle deformation considered as late Westpha-
lian–Middle Stephanian (Lescuyer et al., 1993).
2.1.3. The Marche-Combrailles area
Along the Marche-Combrailles shear zone
(Northwestern part of the French Massif Central;
Boiron et al., 1989), Au showings and deposits lie
within a 50-km long zone. Gold ores occurs in the
Hercynian basement (Gueret monzogranite and ana-
tectic biotite–cordierite gneisses), the Visean vol-
cano–sedimentary basins and late intrusions of
peraluminous granites and calc-alkaline lampro-
phyres. The deposits consist of shallow ‘‘epithermal
mineralisation’’ (Au-bearing arsenopyrite and, to a
minor extent, pyrite) found within both the vol-
cano–sedimentary series (Villeranges; Boiron et al.,
1989) and the Hercynian basement (Chatelet; Zap-
pettini, 1983, Piantone et al., 1994). These formed
during a late stage of brittle deformation that was
significantly later than the formation of the conti-
nental basin.
2.2. The Bohemian Massif
The Psı Hory gold district (Mokrsko and Celina
deposits) is located in Central Bohemia, approxi-
mately 50 km south of Prague, in the contact zone
between Hercynian intrusives (the Mokrsko grano-
diorite) and Upper Proterozoic metamorphic rocks
from the Jılove belt. The Jılove belt is a linear
structure (70 km long and up to 6 km wide) of Upper
Proterozoic age (640–700 Ma) which consists of a
bimodal volcano–sedimentary complex exhibiting
both tholeıtic and calc-alkaline trends. These geo-
logical units have undergone regional metamorphism
to greenschist facies during the Cadomian orogeny
(550–650 Ma). During the early phase of the Variscan
orogeny (320–360 Ma), differentiated granitic rocks,
mostly granodiorites, quartz diorites and tonalites,
markedly contaminated in places by the assimilation
of volcanic and sedimentary rocks of Upper Proter-
ozoic age intrude the metamorphic series.
The Mokrsko ore zone (Moravek et al., 1989) is an
east–west trending zone, several hundred meters
thick, characterised by abundant dilational fractures.
Thus, in the ore zone, a dense set of subparallel
quartz–arsenopyrite veinlets penetrates the granodior-
ite (Boiron et al., 2001). The main ore zones occur
where the quartz veinlets are the densest. The quartz
veinlets and the granodiorite have subsequently been
affected by a succession of brittle deformation events
responsible for the development of microfissure sets
(mostly fluid inclusion planes).
2.3. The NW Iberian zone
The NW part of the Iberian Peninsula is charac-
terised by extensive areas of Hercynian basement,
mostly composed of Paleozoic metasedimentary
rocks and Variscan granites. Several areas display
extensive sets of quartz veins formed during late
brittle deformation stages within the granite. The best
examples are associated with the major Malpica–
Vigo shear zone, which is located in the western part
of Galicia, Spain (Arias and Martin-Izard, 2000).
Two representative areas have been investigated.
The Corcoesto and Tomino (Galicia) deposits are
both located along the Malpica–Vigo shear zone that
is mostly dextral, except along a small NW–SE
segment. The trend of this zone varies from N30jEin the North (Malpica) to N170jE in the South
(Vigo) (Iglesias and Choukroune, 1980). In these
mining districts, Au–As ores display similar features
with specific deformation stages affecting the quartz
M.-C. Boiron et al. / Chemical Geology 194 (2003) 119–141122

veins. Rocks surrounding the granites are mostly
pelitic metasediments, often containing graphite. In
some instances, graphite is a major rock component
(mostly in the Tomino area).
3. Methods
3.1. Fluid petrography
Studies of the typology and petrography of fluid
inclusions have been carried out on wafers from
representative samples of the host rocks and of the
quartz veins. The succession of fluid circulation has
been studied by looking at relationships between
fluid inclusions, their host mineral and the location
of ore minerals in order to obtain information on the
relative formation chronology of mineral assemb-
lages as a function of deformation and fluid events.
In most deposits, SEM images (back scattered and
cathodoluminescence) were obtained to determine
the relationships between microfractures in quartz
(fluid inclusion planes) and microfractures in sul-
phides.
The notation of fluid inclusion types follows the
nomenclature previously published (Boiron et al.,
1992, 1996), which takes into account the nature of
the dominant chemical phases (see Table 1). It is
based on the quantity of C–H–O–(N–S) species
detectable by Raman spectroscopy (subscript c, when
CO2 is dominant; m, when CH4 is present in signifi-
cant amounts up to 30–40 mol%); and w for water.
The subscripts consist in a combination of the letters
related to the abundance of the various species in the
fluid.
3.2. Microthermometry and Raman data
Fluid inclusions have been extensively studied and
related to the sequence of mineral precipitation within
the veins to constrain the conditions of fluid migration
and Au deposition.
Microthermometric characterisation of the fluid
inclusions was performed on wafers (<300 Am in
thickness) using a Chaixmeca heating–freezing stage
(Poty et al., 1976). The stage was calibrated with
melting-point solid standards at T >25 jC and with
natural and synthetic inclusions at T<0 jC. The rate ofheating was monitored in order to obtain an accuracy
ofF0.2 jC during freezing,F1 jC when heating over
the 25–400 jC range and F4 jC over the 400–600
jC range. Salinity, expressed as equivalent wt.% of
NaCl, was calculated from microthermometric data
using the revised equation of Bodnar (1993).
In volatile-bearing fluid inclusions, CO2 was iden-
tified by melting of a solid below �56.6 jC. Thevolumetric fraction of the aqueous liquid and the
volumetric fraction of the volatile-rich liquid in the
volatile-rich phase have been estimated by reference
to the volumetric chart of Roedder (1972), in order to
reconstruct bulk fluid compositions.
Molar fractions of CO2, CH4, H2S and N2 were
determined in individual inclusions by micro-Raman
analysis performed with a Labram Raman spectrom-
eter at CREGU (Nancy). Bulk composition and molar
volume were computed from the P–V–T–X proper-
Table 1
Typology and nomenclature of fluid inclusions
Type of fluid inclusions Dominant species Remarks
c–w CO2– (CH4–N2)–H2O–NaCl Tm CO2 and Th CO2 observed, high density volatile phase,
CH4+N2< 40 mol% in the volatile phase
c–m–w CO2–CH4–N2–H2O–NaCl Tm CO2 and Th CO2 observed, high density volatile phase,
40< CH4+N2 < 75 mol% in the volatile phase
w–c H2O–CO2–(CH4–N2)–NaCl Only Tm cl observed, low density volatile phase,
CH4+N2 < 40 mol% in the volatile phase
w–c–m H2O–CO2–CH4–N2–NaCl Only Tm cl observed, low density volatile phase,
40 < CH4+N2 < 80 mol% in the volatile phase
w H2O–NaCl
Tm CO2: melting temperature of solid CO2, Th CO2: homogenisation temperature of CO2, Tm cl: melting temperature of clathrate.
M.-C. Boiron et al. / Chemical Geology 194 (2003) 119–141 123
ties of individual inclusions in the C–O–H–S system
(Dubessy, 1984; Dubessy et al., 1989; Thiery et al.,
1994; Bakker, 1997). The P–V–T–X properties of
aqueous carbonic inclusions were modelled for the
system H2O–CO2–CH4 using the equations of state
of Kerrick and Jacobs (1981) and Jacobs and Kerrick
(1981). For aqueous inclusions, the isochores have
been drawn in the H2O–NaCl system using the data
from Zhang and Frantz (1987).
3.3. Fluid electrolyte composition
Bulk crush leach analysis of the inclusion fluid
contained within different quartz samples has been
carried out in order to characterise their ionic compo-
sition and, in particular, to explore the use of halogens
as conservative tracers of fluid sources. Although it is
clear that individual samples may contain a mixture of
different fluid generations, each investigated sample
was carefully selected in the light of the microthermo-
metric results to ensure that it was dominated by a
single fluid generation.
The crush leach procedure which has been used
is that of Bottrell et al. (1988), with modifications
described in Yardley et al. (1993). The weight of
sample crushed was typically 0.5–1 g. Analysis of
Cl, Br and I was performed by ion chromatography
on double-distilled water leachates. Raw analyses of
the whole leach solutions were recalculated with
reference to the mean salinity from microthermom-
etry. The errors in the Br/Cl ratio are less than 10%,
while errors associated with the I/Cl ratios are much
larger, usually a factor of 2 or 3, due to the low
concentrations of I in the leach solutions.
3.4. Isotope geochemistry
Quartz 18O/16O ratios were measured using the
conventional fluorination method of Clayton and
Mayeda (1963). Two types of samples were ana-
lysed: (i) bulk quartz samples (ca. 7 mg) and (ii)
chips of quartz (down to ca. 1 mg) extracted from
the fluid inclusion wafers. These chips correspond
exactly to the material on which FI studies were
performed. The uncertainties (estimated from dupli-
cates performed on different Ni fluorination tubes)
are generally on the order of 0.1xbut may reach
0.25xfor the quartz chips extracted from fluid
inclusion wafers. The reason for that poorer repro-
ducibility may result from the small size of the
analysed samples, but also from the fact that quartz
crystallised or recrystallised from a hydrothermal
fluid may be isotopically heterogeneous on a small
scale (two adjacent chips are not necessarily repre-
sentatives of exactly the same quartz generation or
of the same mixture of different quartz types).
4. Quartz veins and gold ores
In all the so-called ‘‘mesothermal’’ late Hercynian
deposits, with the exception of the ‘‘epithermal’’
mineralisation of the Marche-Combrailles area, the
quartz typology and associated ores follow the same
succession. A summary is given in Table 2.
The early quartz matrix is affected by ductile
deformation followed by a series of brittle deforma-
tional stages identified at the microscopic scale by a
succession of quartz types and textures (Boiron et al.,
1992, 1996; Essarraj et al., 2001; Vallance, 2001).
Several silicification stages occurred in relation with
the ductile–brittle to brittle deformation events:
(i) major silicification in the ductile–brittle regime
corresponding to the deposition of milky quartz
(mkQ) enriched in abundant small (<5 Am) fluid
inclusions (quartz lens formation stage);
(ii) brecciation of the milky quartz lens and ce-
mentation of the resulting grains by micro-
crystalline quartz (mQ) in the Saint Yrieix
district or crystallisation of clear quartz (cQ)
present as bands and overgrowths on mkQ,
sometimes with euhedral terminations (Iberian
deposits);
(iii) crystallisation of hyaline quartz, sometimes
euhedral (hQ), cementing arsenopyrite crystals,
cQ and hQ quartz contain scattered primary fluid
inclusions and pseudo-secondary fluid inclusions;
(iv) formation of small size fractures during later
brittle deformational stages.
During these late stages of fluid migration, fluid
inclusion planes result from annealing of microcracks
and are observed in all former quartz types. In some
instances, low temperature barren quartz (lbQ), as
comb and radially disposed crystals, is observed as
M.-C. Boiron et al. / Chemical Geology 194 (2003) 119–141124

Table 2
Summary of the mineralogical assemblages, fluid types and element deposition observed in the studied deposits
French Massif Central Northwest Iberia Bohemia Quartz Main element Fluid type
Laurieras Cheni-
Fagassiere
Salsigne Villeranges –
Chatelet
Corcoesto Tomino Mokrskodeposition deposited
18 t– 30 t 120 t– 30 t 10 t– 20 t 30 t 10 t 100 t
pyr – arsp pyr – arsp pyr – arsp pyr – arsp pyr – arsp – po pyr – arsp – po Si-major
sealing
As – Fe – S CO2 –H2O– (CH4 –N2) –NaCl
CO2 –CH4 – (N2) –H2O–NaCl
c –w
c –m–w
pyr – arsp (Au) pyr – arsp pyr – arsp arsp arsp po – cpy – gal (Si)-thin As – Fe – S H2O–CO2 – (CH4 –N2) –NaCl w – c
boul (Au) fk – phengite chlorite chlorite – phengite chlorite – phengite chlorite – phengite microfractures
chlorite – phengite chlorite
sph – cpy sph – cpy cpy po – chlorite sph – cpy – gal sph – cpy sph – Te –minerals healing Zn –Cu – S
native Au native Au native Au – gal combined Au in native Au native Au native Au quarts only Au H2O–NaCl w
boul II – gal boul II – gal Bi – bism – chlorite pyr – arsp
ankerite – illite
stibnite
Cu –Ag sulfosalt
Bi – bism
Cu –Zn –As sulfosalt
Bi – bism
stibnite
Bi – bism
chlorite
at Villeranges
and Chatelet
Pb – Bi – Te – (Sb)
calcite calcite calcite barren quartz H2O –NaCl w
Approximate extracted Au tonnage (in bold) and estimated reserves (in italic) are given.
pyr: Pyrite, arsp: arsenopyrite, arsp (Au): combined gold in arsenopyrite, boul (Au): combined gold in boulangerite, sph: sphalerite, cpy: chalcopyrite, gal: galena, po: pyrrhotite, bism: bismuthinite, Bi: native Bi, fk: K-feldspar, Si: quartz.
M.-C
.Boiro
net
al./Chem
icalGeology194(2003)119–141
125

late infillings which postdate As–Au ores. They are
related to late openings of the faults (La Fagassiere
deposit, for instance).
Specific mineral assemblages are associated with a
given quartz type and with the late microfissures: (1)
phengite, pyrite, massive arsenopyrite (Fpyrrhotite in
some instances) are included inmQquartz, (2) euhedral
arsenopyrite crystallised on cQ bands prior to hQ
quartz growth, (3) chlorite, locally with sulphosalts
(Pb–Ag dominated), chalcopyrite, bismuth/bismuthin-
ite, or native gold occur in late microfissures cross-
cutting all the formerly grown quartz and sulphides.
Gold is found dominantly as small metallic particles,
mostly in vugs or crack sets, especially where they
crosscut earlier sulphides. Deposition of native gold in
most of these deposits is most probably the result of
electrochemical processes at the surface of crushed
sulphides as suggested by Knipe et al. (1991), Moller
and Kersten (1994). At Salsigne, gold is typically
associated with bismuthinite, sulfosalts and chalcopyr-
ite, and is interpreted to be the result of sulfidation
processes (alteration of bismuth and pyrrhotite)
together with destabilisation of Fe-silicates (Benchek-
roun et al., 1996). There is very little evidence of gold
input in the earliest stages of veins formation (Q1 to
Q3), apart from the presence of gold in a combined
state in some growth bands of arsenopyrite and bou-
langerite (Laurieras; Essarraj et al., 2001).
In the ‘‘epithermal’’ mineralisation of the Viller-
anges volcano–sedimentary basin, gold is carried in a
combined state within arsenopyrite and pyrite crystals,
occurring either within a diffused network of quartz +
ankerite veinlets or as isolated crystals in the altered
tuffs (illite–quartz–ankerite assemblage). Stibnite
occurs either as massive veins or as small needle-
shaped crystals associated with ankerite and quartz
combs.
5. Fluid characterisation
Two major types of fluids have been recognised in
most studied deposits all along the Variscan belt,
except Villeranges–Chatelet: (i) dominant CO2–
H2O-rich fluids, locally enriched in CH4 near graph-
ite-rich wall rocks, which are generally followed by
H2O–(CH4–CO2) liquids having a low-density vola-
tile phase that was trapped after a significant pressure
drop, (ii) aqueous fluids (with moderate to low salin-
ities, up to 9 eq. wt.% NaCl) characterised the latest
stages of fracturing and fluid infiltration. The latter
progressively become predominant in the system.
Aqueous fluids are associated with the main ore
assemblage Au–Bi/bismuthinite (FPb, Sb, Cu sul-
phides or sulphosalts) which occur in cracks within
early barren sulphides (mostly arsenopyrite and to a
lesser degree, pyrite). These aqueous fluids are gen-
erally identified in secondary fluid inclusion planes,
especially in the mineralised areas. At Villeranges–
Chatelet, aqueous fluids are the only type represented,
and are observed as primary inclusions in gangue
minerals hosting Au-bearing sulphides.
A summary of the microthermometric and Raman
data including bulk compositions is given in Tables 3
and 4.
5.1. Composition of the volatile phase, density and
bulk chemical evolution of major components
The early C–H–O–N fluids (c–(Fm)–w) have
compositions typical of metamorphic environments
where graphite is present. They are mostly dominated
by CO2 but locally, these fluids may be extremely
enriched in CH4 and N2 (up to 30–50 mol%),
especially in the proximity of lydites or black shales,
indicating that the devolatilisation of C-rich units may
be largely responsible for the increase of CH4. This is
particularly the case at the Tomino deposit and, to a
lesser degree, at Corcoesto and Laurieras (Table 4).
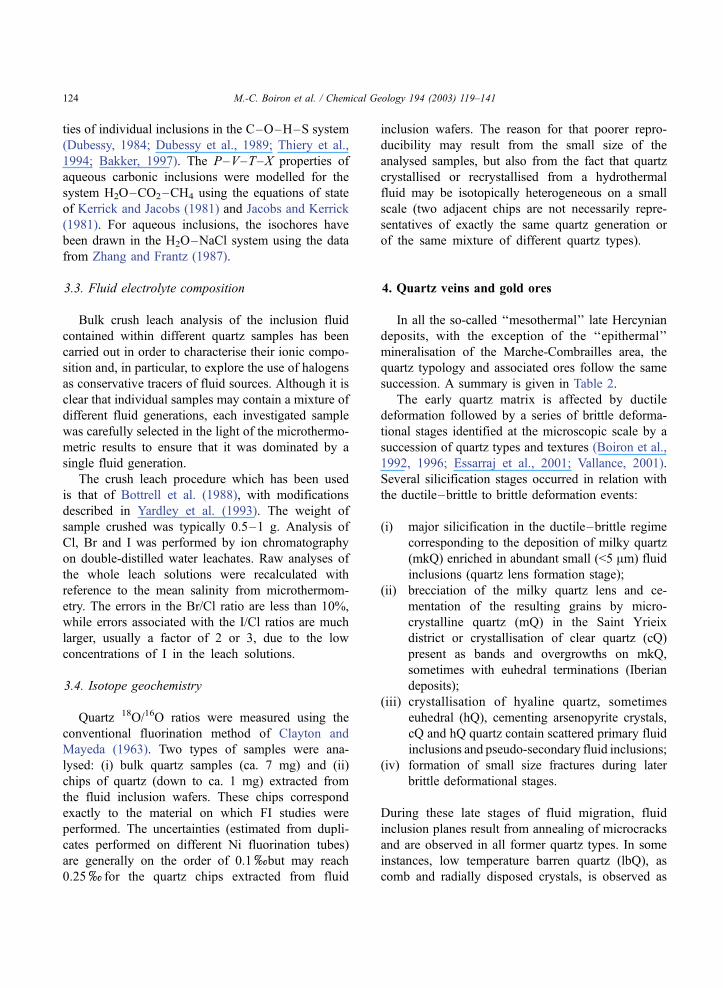
Compositional changes in the volatile phase are
related to a decrease in its density (dv) (Fig. 2),
ranging from values around 0.8 g/cm3 (three-phase
inclusions dominated by CO2) to 0.2 g/cm3 (for w–c
inclusions). The fluid inclusions with the lowest
densities are characterised by the highest water
contents (between 90 and 96 mol% H2O in most
of the deposits, except at Mokrsko), a decrease of the
CO2 content and an enrichment in CH4FN2. All
these features define a characteristic and continuous
time evolution. Three main processes involved in
this evolution can be distinguished: (i) mixing of the
predominantly c–w fluids with CH4FN2 fluids of
variable CO2–H2O content, associated with graph-
itic-rich lithologies (Fig. 3); (ii) unmixing of the
volatiles and the subsequent heterogeneous trapping
of the unmixed end-members, already discussed in
M.-C. Boiron et al. / Chemical Geology 194 (2003) 119–141126

Table 3
Summary of the microthermometric characteristics (range and mode) for the aqueous carbonic and aqueous fluids
Location Fluid type Tm CO2 Th CO2 Mode Tm cl Tm ice Th Mode
French Massif Central
Laurieras (1) c–w �62.5/�56.7 6/28 L or V 5.4/12 �5.2/�2 230/390 L or V
�58/�60 10 �4
w–c �62.3/�57.6 nv 7.5/11.6 �5/�2.3 290/360 L
�59 11
w–c–m nv nv 8/14 �4.2/�3.5 320/370 L or V
13 �4
Cheni (2) c–w �60.9/�56.8 8.6/31 L or V 2.8/10.8 �5.5/�0.6 150/250 L
�58 25
w �5.2/�0.5 190/210 L
Fagassiere (2) c–w �58.4/�58.1 28/31 L or C 6.8/7.2 no 305/366 L
�58.2 29 7
w–c �58.2/�59.5 nv 7.2/9.4 no 280/305 L
�58.3 9 295
w–c–m �57.4/�67.3 nv 8.3/9.1 no 365 V
�59.5
w �5.6/�0.8 155/280 L
Salsigne (3) c–w �57.4/�59 �12.1/12.6 L 1.5/7.5 �7.2/�4 220/390 L
�58
c–m–w �60.5/�62.3 �3.6/�6.3 L no �6
�61.5
w �6.8/�0.5 120/320 L
Villeranges (4) w (qz–arsp) �2/�0.3 140/210 L
w (qz–sb) �4/�1.2 150/200 L
Chatelet w (qz–arsp) �3.3/�0.3 140/240 L
Bohemian Massif
Mokrsko (5) c–w �58.1/�56.6 16/29.8 L or V 5/10 �4.7/�1.1 300/420 L or V
�57.4 29 7 350
w �6/�0.5 130/280
�4.5/�1 160
Northwest Iberia
Corcoesto (6) c–w �60.6/�56.8 19/30.5 L or V 4/11 �5.6/�2.5 320/390 L or V
�57.6 24/30 8 �5 350
w–c �60.2/�56.8 nv 6.5/12 �6.8/�2.3 345/390 L or V
�57.6 �3.5 350
w–c–m �60.3/�58.5 nv 8/10.4 �7.2/�2.4 345/380 L or V
�59 9 �6 350
w �7/�1 150/300 L
�4 220
Tomino (6) c–w �60.5/�56.6 4/30 L or V 4/12 �8.7/�6 240/420 L
�57.5 26 7 �6 350
c–m–w �65.5/�60.5 �16/14 L or V 8/14 �6.1/�2 300/>500
�62 �8/+4 11 �5.5
w �4.5/�0.1 145/270
Data have been completed or synthetised from: 1—Essarraj et al. (2001), 2—Vallance (2001), 3—Boiron et al. (1990), 4—Boiron et al. (1989),
5—Boiron et al. (2001), 6—Boiron et al. (1996).
Tm CO2: melting temperature of solid CO2, Th CO2: homogenisation temperature of CO2, Tm ice: melting temperature of ice, Tm cl: melting
temperature of clathrate, Th: homogenisation temperature. Homogenisation modes: L—liquid and V—vapour. All values are in jC.Nomenclature for fluid inclusions is explained in the text; no: not observed.
Qz–arsp: quartz–arsenopyrite, Qz–sb: quartz– stibnite.
M.-C. Boiron et al. / Chemical Geology 194 (2003) 119–141 127

some of the studied deposits (Boiron et al., 1992);
and (iii) dilution of the c–w fluids by waters free of
volatiles.
5.2. Aqueous fluids: salinity–Th evolution
Tm ice–Th plots (Fig. 4) summarise the evolution
of aqueous fluids in the studied deposits. Aqueous
fluids were trapped mostly as fluid inclusions in
microfissures characterised by single Th–Tm pairs
which, when the whole set of data is considered,
document a dilution trend of the earliest aqueous
fluids. The Th range (130–280 jC) cannot be
interpreted only as a result of pressure changes
because: (i) the salinity is not constant and indicates
that a mixing process has occurred, in which two
end-members are identified. The first one had a
moderate salinity (up to 9 eq. wt.% NaCl), the
second one was more dilute (close to 0.5 eq. wt.%
NaCl). The two end-members and a line showing the
trend of mixing are evident in each diagram (Fig. 4).
It is interesting to note that most of the data plot
along this line or below, and show a significant and
progressive decrease in fluid salinity. (ii) The range
of Th is too large to be simply the result of a
pressure change at constant temperature (lithostatic
to hydrostatic transition would yield a maximum
fluctuation of around 60 jC) and indicates the
mixing of two fluids with distinct temperatures.
Mixing was probably mostly adiabatic, although
the degree of thermal equilibrium with the host rocks
is unknown. These processes are well illustrated in
the Tm ice–Th plot from Tomino and Fagassiere,
among others, which show first a decrease in Th at
subconstant Tm ice, followed by a significant
decrease in Tm ice at slightly decreasing Th. In all
studied examples, fluid circulation in faults ended
with low salinity fluids, which corresponds to the
latest microcracking stage in all the gold-bearing
samples.
Table 4
Summary of the Raman data and bulk composition for the aqueous carbonic fluids
Location Fluid type Raman data Bulk composition
CO2 CH4 N2 H2O CO2 CH4 N2 NaCl
French Massif Central
Laurieras (1) c–w 54–96 2–35 nd–25 80–92 5–15 0.1–6 nd–2 0.1–2
w–c 58–93 7–40 nd–4 90–94 5–8 0.3–3 nd–0.25 0.8–2.5
w–c–m 34–18 45–66 nd–8 90–94 3–5 1–4.5 nd–0.25 1.5–3
Cheni (2) c–w 74–10 nd–18 nd–11 69–94 4–28 nd–2.3 nd–1.8 0.2–3.8
Fagassiere (2) c–w 95–98 0.7–1 1.5–4 88–91 7–10 0.05 0.1–0.2 1.2–1.4
w–c 82–85 3–5.5 10–14 91–93 6–7.5 0.1–0.2 0.4–0.7 0.8–1.1
w–c–m 19–21 28–30 50–52 77–78 4.5–5.5 6–6.5 10.5–11.5 *Salsigne (3) c–w 60–96 4–33 nd–6 22–98 2–77 0.1–25 nd–4 0.5–2.5
c–m–w 20–55 40–76 3–15 25–94 4–42 1–50 0.1–11 1.5–3
Bohemian Massif
Mokrsko (4) c–w 89–99 nd–6.8 nd–10.8 16–84 13–83 nd–2.7 nd–3.2 0.2–2.1
Northwest Iberia
Corcoesto (5) c–w 72–100 1–23 nd–10.5 40–85 13–58 nd–2.5 nd–1.3 0.5–2.6
w–c 65–95 4–32 nd–7 93–95 4–5 0.7–2 nd–0.2 0.2–1
w–c–m 50–52 44–45 2–3 95–96 1.8–2 1.6–1.8 0.1 0.4–0.6
Tomino (5) c–w 76–100 nd–22 nd–10 40–92 5–59 nd–6 nd–2.7 0.2–2
w–c–m 40–70 23–60 nd–10 30–92 3–37 1–26 nd–4 0.4–2.7
For each fluid inclusion type, ranges of compositions are given in mole %. Nomenclature for fluid inclusions is explained in the text; nd: not
detected.
Data have been completed or synthetised from: 1—Essarraj et al. (2001), 2—Vallance (2001), 3—Boiron et al. (1990), 4—Boiron et al. (2001),
5—Boiron et al. (1996).
* Indicates that bulk compositions have been calculated without NaCl.
M.-C. Boiron et al. / Chemical Geology 194 (2003) 119–141128
In the case of the Salsigne deposit, the mixing
process is not clearly observed. Most of the aqueous
fluids have low salinity (up to 2 eq. wt.% NaCl) and
Th covers a relatively wide range (120–300 jC)suggesting repeated reopening of the microcracks.
However, some fluid inclusions with a higher salin-
Fig. 2. Density of the volatile phase (dv) versus CO2 (mol%) plots of aqueous carbonic fluids from each of the studied deposits.
M.-C. Boiron et al. / Chemical Geology 194 (2003) 119–141 129

Fig. 3. H2O (mol%) versus CO2 (mol%) plots of the bulk composition of aqueous carbonic fluids from each of the studied deposits.
M.-C. Boiron et al. / Chemical Geology 194 (2003) 119–141130

ity, in the range of 6–10 eq. wt.% NaCl, are found
locally.
One exception is the case of the Villeranges and
Chatelet deposits, where aqueous fluids are observed
in authigenic quartz crystals. They have character-
istics (salinity and Th) very similar to those recorded
for late aqueous fluids from mesothermal deposits.
The salinity is less than 4 eq. wt.% NaCl and Th
Fig. 4. Tm ice versus Th plots of aqueous fluid inclusions. The two boxes in gray show the possible end-members at Laurieras, and were
reproduced identically in all the diagrams as a guide for interpretation. For the Villeranges deposit, fluids associated with the two mineral
assemblages are distinguished: quartz–arsenopyrite: Qz–arsp, quartz– stibnite: Qz–sb.
M.-C. Boiron et al. / Chemical Geology 194 (2003) 119–141 131
ranges from 140 to 240 jC (Boiron et al., 1989,
1990).
Low salinity (<1 eq. wt.% NaCl)–low temperature
(Thc100–150 jC) fluids characterise the late barren
quartz.
6. P–T evolution
The main P–T evolution pathways have already
been discussed elsewhere (Boiron et al., 1996, 2001;
Essarraj et al., 2001) and are only summarised below.
The early activity of the faults and the earliest quartz
deposition occurred at high temperatures (generally
>400 jC) within a pressure range of 200–450 MPa.
The highest pressures (350–450 MPa) were deter-
mined for inclusions found in quartz from the wall
rocks of the mineralised faults (Laurieras, for exam-
ple) which indicates that this part of the basement was
still located at a rather deep structural level (13–17
km) at the end of the Variscan collision stage (Essarraj
et al., 2001). In NW Iberia and in Bohemia, pressures
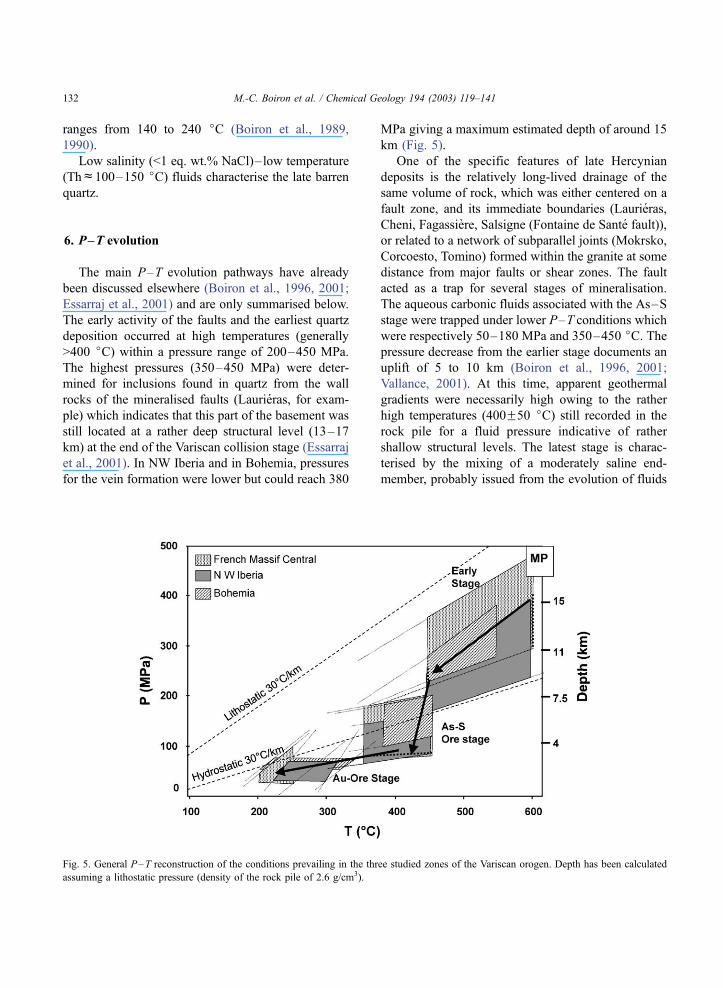
for the vein formation were lower but could reach 380
MPa giving a maximum estimated depth of around 15
km (Fig. 5).
One of the specific features of late Hercynian
deposits is the relatively long-lived drainage of the
same volume of rock, which was either centered on a
fault zone, and its immediate boundaries (Laurieras,
Cheni, Fagassiere, Salsigne (Fontaine de Sante fault)),
or related to a network of subparallel joints (Mokrsko,
Corcoesto, Tomino) formed within the granite at some
distance from major faults or shear zones. The fault
acted as a trap for several stages of mineralisation.
The aqueous carbonic fluids associated with the As–S
stage were trapped under lower P–T conditions which
were respectively 50–180 MPa and 350–450 jC. Thepressure decrease from the earlier stage documents an
uplift of 5 to 10 km (Boiron et al., 1996, 2001;
Vallance, 2001). At this time, apparent geothermal
gradients were necessarily high owing to the rather
high temperatures (400F50 jC) still recorded in the
rock pile for a fluid pressure indicative of rather
shallow structural levels. The latest stage is charac-
terised by the mixing of a moderately saline end-
member, probably issued from the evolution of fluids
Fig. 5. General P–T reconstruction of the conditions prevailing in the three studied zones of the Variscan orogen. Depth has been calculated
assuming a lithostatic pressure (density of the rock pile of 2.6 g/cm3).
M.-C. Boiron et al. / Chemical Geology 194 (2003) 119–141132

from the deep reservoir, by dilute fluids of lower
temperature. Mixing was probably favoured by the
connection of fluid reservoir by faults, and is likely to
have occurred under hydrostatic pressures, or at a
pressure lower than those reached during the preced-
ing stages.
7. Fluid sources
7.1. Halogen chemistry
The halogen data set (Table 5) consists of analyses
carried out on quartz from NW Iberia (partially
reported in Boiron et al., 1996), from Mokrsko
(Boiron et al., 2001) and from the French Massif
Central (new data on Laurieras, Salsigne, Villeranges
and Chatelet).
The halogens, Cl, Br and, to a lesser extent I, can
be used to distinguish fluids from different sources
(Bohlke and Irwin, 1992) because these are conserva-
tive anionic species which are relatively unaffected by
fluid–rock interactions (e.g., Banks et al., 1991). The
reason for that behaviour is the fact that in a low
salinity fluid, such as seawater, the concentrations of
Cl and Br (19000 and 65 ppm, respectively) are much
higher than in crustal rocks (crustal averages of 130
and 2.5 ppm, respectively). So, the Br/Cl ratio remains
constant in the event of fluid–rock interaction while
this process induces a change of the I/Cl ratio because
the concentration of I is lower in seawater than in
crustal rocks (0.06 and 0.5 ppm, respectively).
The fluid chemistry was investigated on bulk
samples and corresponds to mixed fluid populations
for most of them. Thus, it is difficult to evaluate the
contribution of the aqueous fluid-type to the bulk
analysis, since the earlier fluid types also contain
liquid water, and are contributing, in part, to the bulk
anion and cation fluid chemistry. From their halogen
composition, most of the fluids found in quartz veins
appear to have equilibrated with upper crustal rocks,
such as fluids from the deep Canadian or Baltic
shields (Frape and Fritz, 1987). log Br/Cl values in
the inclusion fluids are significantly higher than sea-
water and are in the range from �2.2 to �3 for most
of the samples. The aqueous-carbonic fluids have
halogen signatures similar to those of many upper
crustal fluids including shield brines (Frape and Fritz,
Table 5
log Br/Cl and log I/Cl (mole ratios) obtained from crush leach
analyses of fluid inclusions, with indication of the dominant fluid
type in the analysed quartz
Location Samples Dominated
fluid
Br/Cl
(104)
I/Cl
(104)
French Massif Central
Laurieras Lau-2 w 4.78 0.31
Lau-8 w 7.85 0.58
Lau-9 w 10.2 1.48
Lau-10b w 10.9 0.72
Lau-11 w 3.23 0.31
Salsigne Sal-7 c–w 38.9 0.17
Sal-10 c–w 67.6 0.02
Sal-12 c–w 46.7 0.02
Nesp-1 c–w 64.5 0.02
Cum c–w 12.3 0.24
Villeranges Vil-1 w 2.69 0.44
Vil-2 w 1.14 0.32
Vil-50 w 30.2 0.48
3183 w 35.4 0.41
56 w 28.8 0.47
Chatelet 34 w 3.1 0.62
Ch3 w 2.69 0.26
Bohemian Massif
Mokrsko (1) Mok 5 c–w+w 12.82 0.53
Mok 6 c–w+w 20.53 0.59
Mok 30–33 c–w+w 15.87 0.55
North Western Iberia
Corcoesto (2) cor-10 c–w 16.60 0.11
181–80 c–w 21.33 0.30
323–30 c–w 17.03 0.04
348–60 c–w 27.58 0.15
419–70 c–w 28.79 0.10
464–30 c–w 14.89 0.20
527–00 (c–w)+w 11.12 0.20
527–60 (c–w)+w 8.20 0.08
Tomino (2) 1 c–w 30.96 0.04
2 c–w 45.66 0.22
3 c–w 37.17 0.27
4 c–w 40.82 0.62
5 c–w 41.67 0.13
7 c–w 30.96 0.52
8 c–w 51.28 0.13
9 c–w 52.63 0.11
10 c–w 21.88 0.41
12 c–w 45.66 0.65
13 c–w 37.17 0.68
14 c–w 37.17 0.30
16 c–w 47.85 0.03
1—Data from Boiron et al. (2001); 2—data from Boiron et al.
(1996).
M.-C. Boiron et al. / Chemical Geology 194 (2003) 119–141 133

1987). Such Br/Cl ratios are quite similar to those
reported for the Muruntau Au-bearing quartz veins
where log Br/Cl values range from �2.4 to �3.4
(Graupner et al., 2001). They are also comparable to
those measured for Brusson (Yardley et al., 1993) and
Alleghany (Bohlke and Irwin, 1992) Au-bearing
quartz veins. log I/Cl values lie in between �4 and
�5.5 (Figs. 6 and 7; Table 5). However, a few samples
show lower log Br/Cl values ranging from �3.5 to �4
attesting to rather low Br contents. Samples with Br-
depleted values, relative to the Br/Cl ratio of seawater,
are dominated by the aqueous fluid population. They
are two samples from Corcoesto deposit, the ore-
bearing quartz from Laurieras, as well as the Au–
arsenopyrite-bearing quartz from Chatelet and Viller-
anges.
The halogen composition suggests that the salt
component of the early aqueous-carbonic fluids
evolved in a low water–rock ratio setting, as found
in modern shield brines. The last stage is characterised
Fig. 6. log Br/Cl vs. log I/Cl (mole ratios) plot for crush leach analyses obtained on gold-bearing quartz veins. Also shown are results for other
crustal fluids from literature (Frape and Fritz, 1987; Bohlke and Irwin, 1992). Dark symbols: aqueous-carbonic dominated fluids, white
symbols: aqueous dominated fluids, dotted symbols: mixed fluids (aqueous-carbonic+aqueous fluids).
Fig. 7. log Br/Cl vs. Cl plot for crush leach analyses obtained on gold-bearing quartz veins. Results from gold deposits reported in the literature
are also presented for comparison. Symbols are the same as in Fig. 6. (1) Brusson Au–quartz veins (Yardley et al., 1993), (2) Alleghany
Au–quartz veins (Bohlke and Irwin, 1992), (3) Muruntau Au–quartz veins (Graupner et al., 2001). Qz–sb: quartz– stibnite mineralisation and
Qz–arsp: quartz-arsenopyrite (Villeranges-Chatelet). The square in gray shows the range of Cl content for Laurieras fluids.
M.-C. Boiron et al. / Chemical Geology 194 (2003) 119–141134

by a progressive dilution of the crustal fluids by
solutions penetrating the basement from the surface
and having low Br/Cl ratios (Fig. 7).
7.2. Origin of fluids: O isotope geochemistry of
quartz
The O isotopic data base was acquired on bulk
quartz samples and also on separated quartz chips
extracted from fluid inclusion wafers in order to single
out the isotopic signature of each stage identified on
the basis of FI studies. This approach was not possible
for H in the purpose of identifying the isotopic
signatures and possibly the primary origin of the fluid
involved in the gold deposition stage. This is because
Variscan gold deposit systems do not contain OH-
bearing mineral species attributable to the gold dep-
osition stage and on the fact that high precision D/H
analysis of fluid inclusions requires large samples of
monophase quartz devoid of any minute amounts of
OH-bearing minerals, which were not available. Thus,
attempts to interpret the evolution of the quartz O
isotopic composition were carried out using the con-
straints deduced from the fluid chemistry.
The first type of fluids (H2O–CO2, H2O–CO2–
CH4 fluids) was trapped in milky quartz and micro-
crystalline quartz, and may be related to the main
sealing stages affecting the faults. The O isotopic
compositions (Table 6) are akin to those measured in
many large mesothermal deposits worldwide (e.g.,
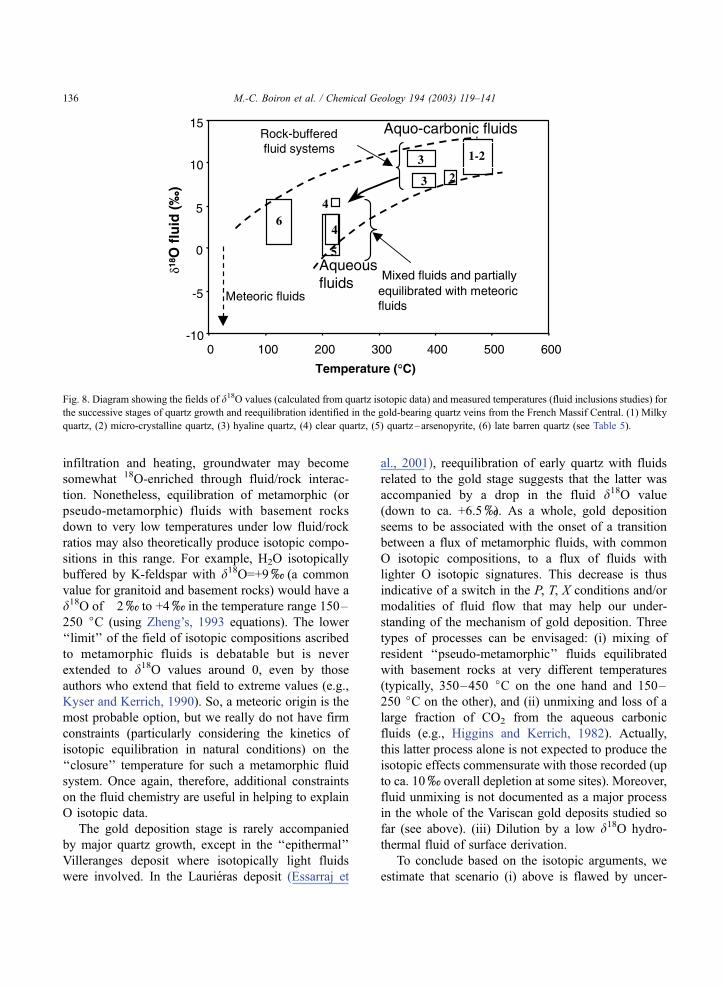
Kerrich, 1987 and references therein). Estimated d18O fluid values range from 8xto 12.5x(Table 6
and Fig. 8), considering crystallisation or reequili-
bration temperatures between 400 and 500jC. Suchvalues are characteristic of fluids isotopically in
equilibrium with common basement materials at
medium to high temperatures (z400–500jC). Thesevalues may correspond to magmatic (derived from
granitoids), metamorphic (dehydration during pro-
grade metamorphism) or ‘‘pseudo-metamorphic’’ flu-
ids (i.e., any kind of H2O-bearing fluid isotopically
equilibrated with crustal reservoirs under low fluid/
rock ratios). However, we suggest that a magmatic
origin is unlikely because, in such a case, the
original fluid should have lost the whole of its
primary characteristics (salinity, geochemical markers
such as the Li content, elemental ratios of conserva-
tive elements such as the halogens).
The d18O values calculated for the aqueous fluids
are estimated in the range 0.3–6x, based on temper-
atures between 150 and 250 jC, assuming that the
related quartz types are in equilibrium with these
fluids, which is reasonable when these quartz are
found to be newly formed at that stage. This is
generally the case but in one instance (Laurieras;
Essarraj et al., 2001), the situation may be more
complex. In the case of ‘‘epithermal’’ deposit (Viller-
anges), the isotopic signature could be even lighter
(d18O=�1xto +4x). Such values are indicative of
a meteoric origin for the fluid, considering that during
Table 6
Summary of the O stable isotope data (d18Oxvs. SMOW) for the Au–quartz veins in the French Massif Central
Location Type of quartz d18O quartz (x) Estimated T (jC) d18O fluid (x)
Laurieras (1) mkQFcQ 13.3/14.8 450–500 9.6/11.7
mkQFmQ 12.7/14.7 450–500 9.0/11.6
mQ 13.5 450–500 9.8/10.5
cQ 16.5 230 6.6
Cheni (2) mkQ 15.2/16.2 400–450 10.7/12.5
mcQ 12.2/12.9 415–425 7.9/8.8
hQ 13.1 360–400 7.7/8.6
cQ 11.9/13.4 200–240 0.3/4
Fagassiere (2) mkQ 15.4 400–450 10.9/11.7
mcQ 15.4 400–450 10.9/11.7
hQ 15.7 350–400 10.1/11.2
lbQ 21.5 100–150 0.3/6
Villeranges Q–arsp 10.6/13.6 200–240 �1.0/4
mkQ: Milky quartz, mQ: microcystalline quartz, cQ: clear quartz, hQ: hyaline quartz, lbQ: late barren quartz, Q: quartz, arsp: arsenopyrite.
Data have been completed or synthetised from 1—Essarraj et al. (2001) and 2—Vallance (2001).
M.-C. Boiron et al. / Chemical Geology 194 (2003) 119–141 135
infiltration and heating, groundwater may become
somewhat 18O-enriched through fluid/rock interac-
tion. Nonetheless, equilibration of metamorphic (or
pseudo-metamorphic) fluids with basement rocks
down to very low temperatures under low fluid/rock
ratios may also theoretically produce isotopic compo-
sitions in this range. For example, H2O isotopically
buffered by K-feldspar with d18O=+9x(a common
value for granitoid and basement rocks) would have a
d18O of �2xto +4xin the temperature range 150–
250 jC (using Zheng’s, 1993 equations). The lower
‘‘limit’’ of the field of isotopic compositions ascribed
to metamorphic fluids is debatable but is never
extended to d18O values around 0, even by those
authors who extend that field to extreme values (e.g.,
Kyser and Kerrich, 1990). So, a meteoric origin is the
most probable option, but we really do not have firm
constraints (particularly considering the kinetics of
isotopic equilibration in natural conditions) on the
‘‘closure’’ temperature for such a metamorphic fluid
system. Once again, therefore, additional constraints
on the fluid chemistry are useful in helping to explain
O isotopic data.
The gold deposition stage is rarely accompanied
by major quartz growth, except in the ‘‘epithermal’’
Villeranges deposit where isotopically light fluids
were involved. In the Laurieras deposit (Essarraj et
al., 2001), reequilibration of early quartz with fluids
related to the gold stage suggests that the latter was
accompanied by a drop in the fluid d18O value
(down to ca. +6.5x). As a whole, gold deposition
seems to be associated with the onset of a transition
between a flux of metamorphic fluids, with common
O isotopic compositions, to a flux of fluids with
lighter O isotopic signatures. This decrease is thus
indicative of a switch in the P, T, X conditions and/or
modalities of fluid flow that may help our under-
standing of the mechanism of gold deposition. Three
types of processes can be envisaged: (i) mixing of
resident ‘‘pseudo-metamorphic’’ fluids equilibrated
with basement rocks at very different temperatures
(typically, 350–450 jC on the one hand and 150–
250 jC on the other), and (ii) unmixing and loss of a
large fraction of CO2 from the aqueous carbonic
fluids (e.g., Higgins and Kerrich, 1982). Actually,
this latter process alone is not expected to produce the
isotopic effects commensurate with those recorded (up
to ca. 10xoverall depletion at some sites). Moreover,
fluid unmixing is not documented as a major process
in the whole of the Variscan gold deposits studied so
far (see above). (iii) Dilution by a low d18O hydro-
thermal fluid of surface derivation.
To conclude based on the isotopic arguments, we
estimate that scenario (i) above is flawed by uncer-
Fig. 8. Diagram showing the fields of d18O values (calculated from quartz isotopic data) and measured temperatures (fluid inclusions studies) for
the successive stages of quartz growth and reequilibration identified in the gold-bearing quartz veins from the French Massif Central. (1) Milky
quartz, (2) micro-crystalline quartz, (3) hyaline quartz, (4) clear quartz, (5) quartz–arsenopyrite, (6) late barren quartz (see Table 5).
M.-C. Boiron et al. / Chemical Geology 194 (2003) 119–141136

tainties related to the production of the low 18O fluid
end-member, by the physical difficulty of associating,
in the same place, fluids which experienced retrograde
equilibration down to very different temperatures (and
thus depths) and finally, inconsistency with the chem-
ical evolution of the fluids studied. The existence of
fluids of both deep and surficial derivation and
dilution of the hot pseudo-metamorphic fluid by
surficial fluids seems to be the most likely process
linked to gold deposition in the different gold districts
studied. Mixing between descending and ascending
fluids in the late stage of quartz lode evolution is also
consistent with the brittle regime that prevailed in the
basement during decompression and provided easy
pathways for the fluids.
8. Discussion and conclusion
Au-bearing quartz in late Hercynian lode deposits
display some constant features all over Europe (Gali-
cia in Spain, Portugal, French Massif Central, Bohe-
mian Massif) in terms of (i) timing of gold intro-
duction or enrichment and its specific association with
small amounts of Bi, Pb, Cu minerals, (ii) nature of
the fluids and their geochemical features, and (iii)
degree of equilibration with the basement of the two
main fluid types involved.
8.1. Fluid origin
All the available data suggest that the early
fluids related to the origin of the primary faults
sealing were extensively equilibrated with the meta-
morphic series whatever their ultimate origin (pseu-
do-metamorphic fluids). The fluids involved during
early development are characterised by a high Br/Cl
ratio, CH4/CO2/H2O ratios rather typical of fluids
equilibrated with graphite, and moderate to medium
salinities. From these characteristics, it appears that
the late Hercynian Au deposits share a part of their
history with typical Au mesothermal deposits
worldwide (Groves et al., 1998; Dugdale and
Hagemann, 2001). The main driving process for
fracture sealing was thus ascending flow of waters,
equilibrated with the metamorphic pile, along the
faults, as shown in Fig. 9a. The likely mechanism
to precipitate silica was a drop in fluid pressure, as
quartz solubility is highly dependant on pressure
in the 400–500 jC range (Walther and Helgeson,
1977; Cox et al., 1991). It is possible that these
early fluids experienced a moderate increase in
chlorinity linked to the hydration of minerals such as
biotite, alteration of feldspars into phengite during the
fluid–rock interaction around faults. In any case, we
must consider the possibility that scavenging of gold
from large crustal volumes was carried out by this type
of fluid which then flowed into localised, and very
small, crustal domains as suggested for the Yilgarn
Craton by Cox (1999). The main stage of gold depo-
sition is not however linked to the main sealing stages
of the fault.
Although granites are present in the surroundings
of most studied deposits, they cannot be considered as
granite-related gold deposits in the sense of Lang and
Baker (2001).The granitoids act as sources of heat that
drive thermal convection cells in which fluids scav-
enge gold and other metals as suggested by Rowins et
al. (1997) for gold mineralisations in the Telfer dome
(Western Australia).
8.2. Evolution and timing of fluid compositions in the
active faults
The main feature of the sealing process and of Au
deposition is the long-lived activity of the fault and
of fluid percolation, until the fault connected the two
distinct fluid reservoirs at a critical stage of the
basement uplift. In the model favoured here, the
shallow-seated reservoir corresponded to a fluid cell
in which surface-derived waters percolated into the
basement along short pathways, which precluded
total equilibration with the microfractured host rocks.
At that stage, fluids evolved by two main mecha-
nisms: (i) drop of temperature accompanying decom-
pression which induced in some instances volatile
unmixing at the end of the decompression event in
the faulted systems and (ii) mixing of the resulting
fluids with waters entering, or present in, the shal-
lower reservoir (Fig. 9b). The constancy of the data
is indicative of a long but similar fluid history at the
province scale (Boiron et al., 1996, 2001; Essarraj et
al., 2001).
As a whole, the P–T–X fluid evolution reflects a
series of major changes which are, in turn, connected
with the global evolution of the Variscan belt. The
M.-C. Boiron et al. / Chemical Geology 194 (2003) 119–141 137

Hercynian uplift crisis has produced a sudden link
between two major fluid reservoirs, with oscillatory or
rapid changes in pressure (lithostatic to hydrostatic)
and temperature due to advection of cool fluids from
shallower levels. In this context, dilution and mixing
appear to be the most probable factor decreasing gold
solubility together with a pressure drop (Gibert et al.,
1998), allowing Au deposition and trapping by early
deposited sulphides. Thus, the major geodynamic
switch towards generalised extensional tectonics that
occurred during the uplift and thinning of the upper
crust after the collisional stages may be the key factor
controlling Au deposition in the late Hercynian gold
deposits.
Fig. 9. Two-stage model of the fluid circulation in and around the faults active during the uplift. Reference temperatures and pressures
(in columns) at a given depth were calculated using a thermal gradient of 30 jC/km and an average density of the rock pile of 2.6 g/cm3.
M.-C. Boiron et al. / Chemical Geology 194 (2003) 119–141138

Acknowledgements
The authors thank A. Rankin, A.M. Boullier and F.
Noronha for helpful comments of the manuscript.
This work has been partially supported by CDR
TRANSMET. [RR]
References
Arias, D., Martin-Izard, A., 2000. An introduction to the typolog-
ical characteristics of gold deposits in NW Iberian Peninsula. A
geode-geofrance 3D workshop on orogenic gold deposits in
Europe with emphasis on the Variscides, Doc. BRGM. 297,
pp. 89–93.
Bakker, R.J., 1997. Clathrates: computer programs to calculate fluid
inclusion V–X properties using clathrate melting temperatures.
Comput. Geosci. 23, 1–18.
Banks, D.A., Davies, G.R., Yardley, B.W.D., McCaig, A.M., Grant,
N.T., 1991. The chemistry of brines from an Alpine thrust sys-
tem in the Central Pyrenees: an application of fluid inclusion
analysis to the study of fluid behaviour in orogenesis. Geochim.
Cosmochim. Acta 55, 1021–1030.
Benchekroun, F., Berger, G., Moine, B., 1996. Un modele miner-
alogique et chimique du depot de l’or dans le gisement de
Salsigne (Montagne Noire). C. R. Acad. Sci. 323, 129–136.
Bodnar, R.J., 1993. Revised equation and table for determining the
freezing point depression of H2O–NaCl solutions. Geochim.
Cosmochim. Acta 57, 683–684.
Bohlke, J.K., Irwin, J.J., 1992. Laser microprobe analysis of Cl, Br,
I, and K in fluid inclusions: implications for sources of salinity
in some ancient hydrothermal fluids. Geochim. Cosmochim.
Acta 56, 203–226.
Boiron, M.C., Cathelineau, M., Trescases, J.J., 1989. Conditions of
gold-bearing arsenopyrite crystallization in the Villeranges ba-
sin, Marche-Combrailles shear zone, France. A mineralogical
and fluid inclusion study. Econ. Geol. 84, 1340–1362.
Boiron, M.C., Cathelineau, M., Dubessy, J., Bastoul, A.M., 1990.
Fluids in Hercynian Au-veins from the French Variscan belt.
Min. Mag. 54, 231–243.
Boiron, M.C., Essarraj, S., Sellier, E., Cathelineau, M., Lespinasse,
M., Poty, B., 1992. Identification of fluid inclusions in relation
to their host microstructural domains in quartz by cathodolumi-
nescence. Geochim. Cosmochim. Acta 56, 175–185.
Boiron, M.C., Cathelineau, M., Banks, D., Yardley, B., Noronha, F.,
Miller, F.M., 1996. P–T–X conditions of fluid penetration in
the basement during retrograde metamorphism and uplift: a
multidisciplinary investigation of bulk and individual fluid in-
clusion chemistry from NW Iberian quartz veins. Geochim.
Cosmochim. Acta 60, 43–57.
Boiron, M.C., Barakat, A., Cathelineau, M., Banks, D.A., Durisova,
J., Moravek, P., 2001. Geometry and P–V–T–X conditions of
microfissural ore fluid migration: the Mokrsko gold deposit
(Bohemia). Chem. Geol. 173, 207–225.
Bottrell, S.H., Yardley, B.W.D., Buckley, F., 1988. A modified
crush– leach method for analysis of fluid inclusion electrolytes.
Bull. Mineral. 111, 279–290.
Bouchot, V., Gros, Y., Bonnemaison, M., 1989. Structural controls
on the auriferous shear zones of the Saint Yrieix district, Massif
Central, France: evidence from the Le Bourneix and Laurieras
gold deposits. Econ. Geol. 84, 1315–1327.
Bouchot, V., Milesi, J.P., Ledru, P., Lerouge, C., Roig, J.Y., Bellot,
J.P., Becq-Giraudon, J.F., Truffert, C., 2000. Orogenic gold
veins and W, Li–F mineralizations related to ‘‘specialised’’
granites: two markers of the crustal scale Au–W–Sb metalli-
ferous peak at 310–305 Ma (French Variscan Belt). A geode-
geofrance 3D workshop on orogenic gold deposits in Europe
with emphasis on the Variscides, Doc. BRGM 297, pp. 53–55.
Cathelineau, M., Boiron, M.C., Holliger, P., Marion, P., Denis, M.,
1989. Gold in arsenopyrites: crystal chemistry, location and
state, physical chemical conditions of deposition. Econ. Geol.,
Monograph 6, ‘‘The geology of gold deposits: the perspective in
1988’’, pp. 328–340.
Cathelineau, M., Boiron, M.C., Essarraj, S., Dubessy, J., Lespi-
nasse, M., Poty, B., 1993. Fluid pressure variations in relation
to multistage deformation and uplift: a fluid inclusion study of
Au–quartz veins. Eur. J. Mineral. 5, 107–121.
Clayton, R.N., Mayeda, T.K., 1963. The use of bromine pentafluor-
ine in the extraction of oxygen from oxides and silicates for
isotopic analysis. Geochim. Cosmochim. Acta 27, 43–52.
Cox, S.F., 1999. Deformational controls on the dynamics of fluid
flow in mesothermal gold systems. In: Mc Caffrey, K.J.W.,
Lonergan, L., Wilkinson, J.J. (Eds.), Fractures, Fluid Flow and
Mineralisation. Geological Society, vol. 155, pp. 123–140.
Special Publications, London.
Cox, S.F., Wall, V.J., Etheridge, M.A., Potter, T.F., 1991. Deforma-
tional and metamorphic processes in the formation of mesother-
mal gold deposits. Examples from Lachlan Fold Belt in central
Victoria, Australia. Ore Geol. Rev. 6, 391–423.
Dubessy, J., 1984. Simulation des equilibres chimiques dans le
systeme C–O–H. Consequences methodologiques pour les in-
clusions fluides. Bull. Mineral. 107, 157–168.
Dubessy, J., Poty, B., Ramboz, C., 1989. Advances in the C–
O–H–N–S fluid geochemistry based on micro-Raman spec-
troscopic analysis of fluid inclusions. Eur. J. Mineral. 1,
517–534.
Dugdale, A.L., Hagemann, S.G., 2001. The Bronzewing lode-gold
deposit, Western Australia: P–T–X evidence for fluid immisci-
bility caused by cyclic decompression in gold-bearing quartz
veins. Chem. Geol. 173, 59–90.
Duthou, J.L., Cantagrel, J.M., Didier, J., Vialette, Y., 1984. Paleo-
zoic granitoids from French Massif Central: age and origin
studied by 87Rb/87Sr system. Phys. Earth Planet. Inter. 35,
131–144.
Essarraj, S., Boiron, M.C., Cathelineau, M., Fourcade, S., 2001.
Multistage deformation of Au–quartz vein: evidence for late
gold introduction from microstructural, isotopic and fluid inclu-
sion studies. Tectonophysics 336, 79–99.
Floc’h, J.P., 1983. Le socle metamorphique du Limousin central:
une traverse de la zone ligerienne de l’orogenese varisque de
l’Aquitaine a la zone broyee d’Argentat (Massif Central franc�ais). Unpub. thesis, Limoges Univ.
M.-C. Boiron et al. / Chemical Geology 194 (2003) 119–141 139

Frape, S.K., Fritz, P., 1987. Geochemical trends for groundwaters
from the Canadian shield. In: Fritz, P., Frape, S.K. (Eds.), Saline
Water and Gases in Crystalline Rocks. Geol. Assoc. Canada
Spec. Pap., vol. 33, pp. 19–38.
Gibert, F., Pascal, M.L., Pichavant, M., 1998. Gold solubility and
speciation in hydrothermal solutions: experimental study of
the stability of hydrosulfide complex of gold (AuHSj) at
350 jC and 500 bars. Geochim. Cosmochim. Acta 62,
2931–2947.
Graupner, T., Kempe, U., Spooner, E.T.C., Bray, C.J., Kremenetsky,
A., Irmer, G., 2001. Microthermometric, laser Raman spectro-
scopic and volatile-ion chromatographic analysis of hydrother-
mal fluids in the Paleozoic Muruntau Au-bearing quartz vein ore
field, Uzbekistan. Econ. Geol. 96, 1–23.
Groves, D.I., 1993. The crustal continuum model for late Archaean
lode-gold deposits of the Yilgarn block, western Australia.
Miner. Depos. 28, 366–374.
Groves, D.I., Goldfarb, R.J., Gebre-Mariam, M., Hagemann, S.G.,
Robert, F., 1998. Orogenic gold deposits, a proposed classifica-
tion in the context of their crustal distribution and relationship to
other gold deposit types. Ore Geol. Rev. 13, 7–27.
Higgins, N., Kerrich, R., 1982. Progressive 18O depletion during
CO2 separation from a carbon dioxide-rich hydrothermal fluid:
evidence for the Grey River tungsten deposit. Can. J. Earth Sci.
19, 2247–2257.
Hubert, P., 1986. Textures et inclusions fluides des quartz auriferes.
Application au gıte de Cros Gallet (Haute Vienne, France) et au
prospect de Sanoukou (district de Kinieba, Mali). Doc. BRGM
114. 350 pp.
Iglesias, M., Chouckroune, P., 1980. Shear zones in the Iberian arc.
J. Struct. Geol. 2, 63–68.
Jacobs, G.K., Kerrick, D.M., 1981. Methane: an equation of state
with application to the ternary system H2O–CO2–CH4 system.
Geochim. Cosmochim. Acta 45, 607–614.
Kerrich, R., 1987. The stable isotope geochemistry of Au–Ag vein
deposits in metamorphic rocks. In: Kyser, T.K. (Ed.), Stable
Isotopes Geochemistry of Low Temperature Fluids. Min. Assoc.
Canada, vol. 13, pp. 287–336.
Kerrick, D.M., Jacobs, G.K., 1981. A remodified Redlich–Kwong
equation for H2O–CO2 and H2O–CO2 mixtures at elevated
pressures and temperatures. Am. J. Sci. 281, 735–767.
Knipe, S.W., Foster, R.P., Stanley, C.J., 1991. Hydrothermal pre-
cipitation of precious metals on sulfide substrates. Proc. of Gold,
vol. 91, pp. 431–435. A.A. Balkema, Brazil.
Kyser, T.K., Kerrich, R., 1990. Geochemistry of fluids in tectoni-
cally active crustal regions. In: Nesbitt, B.E. (Ed.), Fluids in
Tectonically Active Regimes of the Continental Crust. Min.
Assoc. Canada, vol. 18, pp. 133–230.
Lang, J.R., Baker, T., 2001. Intrusion-related gold systems: the
present level of understanding. Miner. Depos. 36, 477–489.
Lepine, J., 1989. Le gisement sulfo-arsenie aurifere du cambrien
inferieur de la mine traditionnelle de Salsigne (Montagne Noire,
France). Contexte structural, metallogenique et sedimentologi-
que. Unpub. thesis, Toulouse Univ., 243 pp.
Lescuyer, J.L., Bouchot, V., Cassard, D., Feybesse, J.L., Marcoux,
E., Moine, B., Piantone, P., Tegley, M., Tollon, F., 1993. Le
gisement aurifere de Salsigne (Aude, France): une concentra-
tion syntectonique tardivarisque dans les sediments detritiques
et carbonates de la Montagne Noire. Chron. Rech. Min. 512,
3–73.
Marignac, C., Cuney, M., 1999. Ore deposit of the French Massif
Central: insight into the metallogenesis of the Variscan collision
belt. Miner. Depos. 34, 472–504.
Matte, P., 1991. Accretionary history and crustal evolution of the
Variscan belt in western Europe. Tectonophysics 177, 151–170.
Moller, P., Kersten, G., 1994. Electrochemical accumulation of
visible gold on pyrite and arsenopyrite surfaces. Miner. Depos.
29, 404–413.
Moravek, P., Janatka, J., Pertoldova, J., Straka, E., Durisova, J.,
Pudilova, M., 1989. The Mokrsko gold deposit—the largest
gold deposit in the Bohemian Massif, Czechoslovakia. Econ.
Geol. Monogr. 6, 252–259.
Noronha, F., Cathelineau, M., Boiron, M.C., Banks, D., Doria, A.,
Ribeiro, M.A., Nogueira, P., Guedes, A., 2000. A three-fluid
stage model for Au metallogenesis in granites and their meta-
morphic host rocks in Northern Portugal. J. Explor. Geochem.
71, 209–224.
Piantone, P., Wu, X., Touray, J.C., 1994. Zoned hydrothermal alter-
ation of the gold deposit at Le Chatelet (French Massif Central).
Econ. Geol. 89, 757–777.
Poty, B., Leroy, J., Jachimowicz, L., 1976. Un nouvel appareil pour
la mesure des temperatures sous le microscope: l’installation de
microthermometrie Chaixmeca. Bull. Soc. Fr. Mineral. Cristal-
logr. 99, 182–186.
Robert, F., Brown, A.C., 1986. Archaean gold bearing quartz veins,
at the Sigma Mine, Abitibi greenstone Belt, Quebec: Part II.
Vein paragenesis and hydrothermal alteration. Econ. Geol. 81,
593–616.
Roedder, E., 1972. Composition of fluid inclusions. U.S. Geol.
Surv., Prof. Paper 440JJ, 164 pp.
Rowins, S.M., Groves, D.I., McNaughton, N.J., Palmer, M.R., El-
dridge, C.S., 1997. A reinterpretation of the role of granitoid in
the genesis of Neoproterozoic gold mineralization in the Telfer
dome, Western Australia. Econ. Geol. 92, 133–160.
Thiery, R., Vidal, J., Dubessy, J., 1994. Phase equilibria modelling
applied to fluid inclusions liquid vapour equilibria and calcula-
tion of the molar volume in the CO2–CH4–N2 system. Geo-
chim. Cosmochim. Acta 58, 1073–1082.
Tollon, F., 1969. Le district aurifere de Salsigne (Aude). Unpub.
thesis, Toulouse Univ., 176 pp.
Touray, J.C., Marcoux, E., Hubert, P., Proust, D., 1989. Hydrother-
mal processes and ore-forming fluids in the Le Bourneix gold
deposit, Central France. Econ. Geol. 84, 1328–1339.
Vallance, J., 2001. Les paleofluides de la fin de la collision
varisque: evolution pression – temperature – composition et
role metallogenique. Une etude pluridisciplinaire des districts
a Au d’Europe occidentale. Unpubl. thesis, Nancy I Univ.,
326 pp.
Walther, J.V., Helgeson, H.C., 1977. Calculation of the thermody-
namic properties of aqueous silica and the solubility of quartz
and its polymorph at high temperatures and pressures. Am. J.
Sci. 277, 1315–1351.
Yardley, B.W.D., Banks, D.A., Bottrell, S.H., Diamond, L.W.,
1993. Post-metamorphic gold–quartz veins from N.W. Italy:
M.-C. Boiron et al. / Chemical Geology 194 (2003) 119–141140

the composition and origin of the ore fluid. Min. Mag. 57,
407–422.
Zappettini, E.O., 1983. Le gisement d’or du Chatelet (Creuse, Mas-
sif Central Franc�ais). Cadre geologique regional, etude metal-
logenique. Unpub. thesis, Limoges Univ., 151 pp.
Zhang, Y.G., Frantz, J.D., 1987. Determination of the homogeniza-
tion temperatures and densities of supercritical fluids in the
system NaCl–KCl–CaCl2–H2O using synthetic fluid inclu-
sions. Chem. Geol. 64, 335–350.
Zheng, Y.F., 1993. Calculation of oxygen isotope fractionation in
anhydrous silicate minerals. Geochim. Cosmochim. Acta 56,
1079–1091.
M.-C. Boiron et al. / Chemical Geology 194 (2003) 119–141 141
Copyright © 2022 FDOKUMEN