Mixed-Status Families and Public Assistance
18
IMMIGRATION ENFORCEMENT AND MIXED-STATUS FAMILIES: THE EFFECTS OF RISK OF DEPORTATION ON MEDICAID USE Edward D. Vargas Center for Women's Health and Health Disparities Research, University of Wisconsin-Madison 310 N. Midvale Blvd, Suite 201; Madison, WI 53705, USA Abstract As Congress priorities the immigration debate on increased border security, the fate of an estimated 11 million undocumented citizens remains uncertain. Stuck in between partisan politics and practical solutions are mixed-status families in which some members of the family are U.S. citizens while other members are in the country without proper authorization. This paper, examines the relationship between risk of deportation and Medicaid use drawing from a nationally sample of mothers from the Fragile Families and Child Wellbeing Survey. These data are then merged with data from the U.S. Citizenship and Immigration Services to create a contextual risk of deportation measure. Findings suggest that an increase in risk of deportation is associated with a decrease in Medicaid use. The implications of this work have tremendous impacts for health service providers and policy makers interested in preventing and reducing health disparities in complex family structures. Keywords Health Disparities; Mixed-Status Families; Immigration Enforcement; Program Evaluation INTRODUCTION As Congress priorities the immigration debate in terms of increased border security and work authorization, the fate of an estimated 11.1 million undocumented citizens remains uncertain. Stuck in between partisan politics and practical solutions are mixed-status families in which some members of the family are U.S. citizens while other members are in the country without proper authorization. As one would expect, living in the shadows of our society and avoiding detention and deportation is an extremely stressful event that may deter an individual from seeking public services or medical attention. This phenomenal would be insignificant if the mixed-status family population was small, this however is not the case. According to the Pew Hispanic Center, of the 4.3 million babies born in the U.S. in 2008, eight percent or 340,000 of these children were born into mixed- status families (Passel, 2010). One explanation for this increase is an indirect consequence of immigration enforcement. For example, as the cost of unauthorized travel between Corresponding Author:[email protected], +011 1 (608) 262-7573, fax +011 1 (608) 265-5947. HHS Public Access Author manuscript Child Youth Serv Rev. Author manuscript; available in PMC 2015 October 02. Published in final edited form as: Child Youth Serv Rev. 2015 October ; 57: 83–89. doi:10.1016/j.childyouth.2015.07.009. Author Manuscript Author Manuscript Author Manuscript Author Manuscript
-
Upload
independent -
Category
Documents
-
view
0 -
download
0
Transcript of Mixed-Status Families and Public Assistance

IMMIGRATION ENFORCEMENT AND MIXED-STATUS FAMILIES: THE EFFECTS OF RISK OF DEPORTATION ON MEDICAID USE
Edward D. VargasCenter for Women's Health and Health Disparities Research, University of Wisconsin-Madison 310 N. Midvale Blvd, Suite 201; Madison, WI 53705, USA
Abstract
As Congress priorities the immigration debate on increased border security, the fate of an
estimated 11 million undocumented citizens remains uncertain. Stuck in between partisan politics
and practical solutions are mixed-status families in which some members of the family are U.S.
citizens while other members are in the country without proper authorization. This paper,
examines the relationship between risk of deportation and Medicaid use drawing from a nationally
sample of mothers from the Fragile Families and Child Wellbeing Survey. These data are then
merged with data from the U.S. Citizenship and Immigration Services to create a contextual risk
of deportation measure. Findings suggest that an increase in risk of deportation is associated with
a decrease in Medicaid use. The implications of this work have tremendous impacts for health
service providers and policy makers interested in preventing and reducing health disparities in
complex family structures.
Keywords
Health Disparities; Mixed-Status Families; Immigration Enforcement; Program Evaluation
INTRODUCTION
As Congress priorities the immigration debate in terms of increased border security and
work authorization, the fate of an estimated 11.1 million undocumented citizens remains
uncertain. Stuck in between partisan politics and practical solutions are mixed-status
families in which some members of the family are U.S. citizens while other members are in
the country without proper authorization. As one would expect, living in the shadows of our
society and avoiding detention and deportation is an extremely stressful event that may deter
an individual from seeking public services or medical attention.
This phenomenal would be insignificant if the mixed-status family population was small,
this however is not the case. According to the Pew Hispanic Center, of the 4.3 million babies
born in the U.S. in 2008, eight percent or 340,000 of these children were born into mixed-
status families (Passel, 2010). One explanation for this increase is an indirect consequence
of immigration enforcement. For example, as the cost of unauthorized travel between
Corresponding Author:[email protected], +011 1 (608) 262-7573, fax +011 1 (608) 265-5947.
HHS Public AccessAuthor manuscriptChild Youth Serv Rev. Author manuscript; available in PMC 2015 October 02.
Published in final edited form as:Child Youth Serv Rev. 2015 October ; 57: 83–89. doi:10.1016/j.childyouth.2015.07.009.
Author M
anuscriptA
uthor Manuscript
Author M
anuscriptA
uthor Manuscript
Mexico and the U.S. has increased, this has indirectly caused undocumented workers to
remain in the U.S. longer and ultimately increasing their chances of a child born in the U.S.
Aside from sheer numbers, the need to study mixed-status families and their use of U.S.
social services is important for several reasons. First, from a civil liberties perspective,
mixed-status families are voiceless and a vulnerable population in our society. While,
unauthorized parents live in the “shadows” of our society, the children do have standing as
these children are US citizens and are protected under the 14th Amendment. “All persons
born or naturalized in the United States, and subject to the jurisdiction thereof, are citizens
of the United States and of the State wherein they reside...”
Second, children in mixed-status families are at-risk and precisely the types of clients
targeted by many social services, social workers, and public health organizations. For
example, Hispanics in general are less likely to be insured, within the pan-ethnic Hispanic
population, immigrants without legal authorization are less likely to have employer coverage
and are currently excluded from purchasing coverage from the federal exchange in the
Affordable Care Act (Rutledge and McLaughlin, 2008; Kaiser, 2013). From, social
exclusion standpoint (i.e. lack of access to a state identification card, bank accounts, and
social services), mixed status families are at the margins and experience a multitude of
dramatic stress and marginalization (Yoshikawa, Godfrey, and Rivera, 2008). To the extent
that these individuals remain in the U.S., public policies can serve to either enhance or
diminish their eventual contributions to the U.S. economy.
In short, until recently there have been few studies that examine the risk of deportation on
take-up rates by mixed-status families of a federally funded social program in the Personal
Responsibility Work Opportunity Reconciliation Act (PRWORA) environment. One
exception is a recent paper by Watson (2014) who examined immigration enforcement on
Medicaid uptake among citizens and non-citizens. My approach differs from this work as it
develops a risk measure that standardizes enforcement by the number of estimated
undocumented citizens at the state level. Because, undocumented mothers are eligible for
Medicaid when giving birth (emergency treatment), Medicaid then provides an exception to
the general exclusion of services to this population and allows us to assess take-up rates as
well as the effect of other federal policies related to unauthorized aliens on their willingness
to apply for benefits. Using the Pew Hispanic Centers methodology to impute
documentation status, we apply this methodology in the Fragile Families dataset to examine
Medicaid use among mixed-status families (Passel 2005). The Fragile Families and Child
Wellbeing sampling strategy required that the focal child in the survey be born in the U.S. –
making them eligible for all social services provided that they meet program eligibility
requirements.
Because mixed-status families are somewhat unique relative to most social service
recipients, we expand the typical take-up model to consider one key variable of interest that
is particularly relevant to this population: risk of deportation which can contribute to a
“chilling” environment for undocumented workers. To measure risk of deportation we
submitted a Freedom of Information Act request to Homeland Security to secure the
Vargas Page 2
Child Youth Serv Rev. Author manuscript; available in PMC 2015 October 02.
Author M
anuscriptA
uthor Manuscript
Author M
anuscriptA
uthor Manuscript

necessary information to compute deportation risks; this information has subsequently been
made available online.
We fully recognize that there is likely to be considerable confusion about Medicaid
eligibility among immigrants and mixed-status families. Additionally, the federal
government allows states the discretion to expand eligibility for some social programs, at
state expense. This complex environment has also led to confusion among some program
administrators and operators who have mistakenly turned away some eligible immigrants
from services (Broder and Blazer, 2011). Our models of Medicaid take-up reflect this
current political and policy environment, not a simpler environment of across-the-board
inclusion or exclusion.
BACKGROUND
The Personal Responsibility and Work Opportunity Reconciliation Act of 1996 (PRWORA)
was the first real attempt to restrict benefits to immigrants, radically altering the policy
environment for services. Under the PRWORA (P.L. 104-193) and subsequent laws,
eligibility restrictions were enacted to restrict certain programs to legal immigrants and deny
access by unauthorized migrants to most federally funded government programs.
In general, PRWORA established an official distinction between ‘qualified ‘and
‘unqualified’ aliens. Qualified aliens are those who have legal permanent residency and/or
refugee status. Unqualified aliens are unauthorized migrants who are residing in the U.S.
without proper documentation. While qualified aliens are eligible for some federal benefits,
unqualified immigrants are denied most federal benefits including, among others,
Temporary Assistance to Needy Families (TANF), Medicare, Medicaid, State Child Health
Insurance Programs (SCHIP), Supplemental Security Income (SSI) and the Supplemental
Nutrition Assistance Program (SNAP, formerly Food Stamps).
Although clearly written in law, in practice, there is great confusion about what state level
benefits are available to both qualified and unqualified immigrants. The fact that the
programmatic restrictions can vary from state to state adds to confusion over eligibility for
benefits on the part of unauthorized immigrants. This confusion may explain part of the
disparity between program availability and program take-up that has been well documented
even among documented immigrants (Blau, 1984; Borjas & Trejo, 1993; Boras & Trejo,
1999; Borjas & Hilton, 1996; Bean et al, 1997; Van Hook et al., 1999). This paper departs
from this earlier stream of research by looking at the effects of a unique policy lever
measure (risk of deportation) on the take-up rates of Medicaid among mixed status families.
The take-up literature up to this point has focused particularly on States’ program design,
eligibility requirements, and state specific characteristics on the proportion of individuals
enrolled in public health insurance programs against the proportion of low-income
individuals eligible. Other Medicaid evaluation work has tested if SCHIP indirectly ‘crowds
out’ private insurance coverage. For example, in a U.S. GAO study of ten states, Kronick &
Gilmer (2002) examined how state public insurance programs influenced coverage of adults
and examined the extent of crowd-out private coverage. Later work by LoSasso and
Buchmueller (2004) used Current Population Survey data for 1996-2001 to examine the
Vargas Page 3
Child Youth Serv Rev. Author manuscript; available in PMC 2015 October 02.
Author M
anuscriptA
uthor Manuscript
Author M
anuscriptA
uthor Manuscript

overall success of SCHIP programs in increasing the coverage of children, the income level
of the families most responsive to SCHIP, and the groups among which the greatest crowd-
out occurred. Traditional barriers to program use in general include lack of transportation,
lack of child care, and lack of information about program eligibility along with the perceived
embarrassment of receiving a “handout” (Kahler et al., 1992).
In terms of how Medicaid/SCHIPS affects immigrant children, research shows that children
of immigrants are more likely than those with U.S. born parents to live in poverty and are
less likely to be employed in an occupation that provides private health insurance. For
example, first generation immigrant children are three times as likely as children from U.S.
born parents to lack health insurance, and second generation are twice as likely to have it
(Hernandez et al., 2011). According to the UCLA Center for Health, the uninsured rate for
noncitizen children is triple that of children whose parents are native born or have become
naturalized citizens. For U.S citizen children with noncitizen parents, the rate is double that
of those whose parents are citizens. The UCLA Center for Health as found that that one in
four uninsured children, or 2.8 million, lives in a non-citizen family (Brown et al, 1999).
As expected poverty is an important determinant in explaining lack of health insurance. In
addition, unauthorized immigrants also tend to work in jobs that do not provide employee
based health insurance and/or employed in occupations that pay off the books. Moreover, we
can also expect that poor noncitizen children whose parents lack job-based coverage have
lower rates of participation than poor citizen children of U.S. citizens. The lack of insurance
for citizen children in mixed-status families means that these children are less likely to
receive timely care for acute conditions, and less likely to have their chronic conditions
diagnosed and appropriately managed. This lack of primary and preventive care has shown
to exacerbate the cost of medical care in long run, particularly for undocumented immigrants
who all though have U.S. children that are eligible for Medicaid/SCHIPS, but are not
participating in the program because of fear of deportation (Kullgren, 2003; Amuedo-
Dorantes et al. 2013). An interesting component of trying to understand immigrant
participation in public assistance is on the nature or behaviors that drive take-up rates. For
example, if families participate at lower rates given they are eligible, is this reason attributed
to the anti-immigrant climate in their communities? How does the enforcement of
immigration in the interior impact take-up rates?
Risk of deportation as it affects the uptake of social services among undocumented
immigrants has also received relatively little attention in the literature. What we know so far
is that unauthorized immigrants who report high levels of fear (of deportation) are more
likely to report an inability to acquire medical and dental care (Berk & Schur, 2001). Asch,
Leake & Gelberg (1994) also report that undocumented immigrants feared going to
physicians because they thought that it could lead to trouble with immigration authorities.
These undocumented immigrants were almost four times as likely to delay seeking care for
more than two months compared to their citizen counterparts. Both of these papers are
qualitative and never quantified risk of deportation and never statistically tested the
relationships reported from their observational studies. Using these published manuscripts as
our theoretical framework, we create a new measure called risk of deportation to look at
Vargas Page 4
Child Youth Serv Rev. Author manuscript; available in PMC 2015 October 02.
Author M
anuscriptA
uthor Manuscript
Author M
anuscriptA
uthor Manuscript

how immigration enforcement affects the uptake of Medicaid in mixed status families in the
post-PRWORA environment.
Anti-Immigrant Climate
While social workers have concentrated most of the work on psychological phenomenal like
stigma, we argue that risk of deportation is an additional indicator that is driving the
differences between take-up rates and Medicaid participation for mixed-status families. Fear
and risk of deportation can take various forms. One of the most salient signals of anti-
immigrant backlash are the proposed English only laws spread across the states starting in
the 1980's. While the majority of the legislative actions were defeated in states with
substantial language minority populations, conservative states and states with mechanisms
for direct democracy generally adopted such laws (Citrin et al. 1997; Preuhs, 2005). Work
by Preuhs (2005) estimate that of the 50 states, around half have now adopted Official
English laws. Arguably adoption of this law is closely tied to resentment toward racial/
ethnic minorities particularly the foreign born (Schildkraut, 2001). Other anti-immigrant
bans that have negatively affected undocumented families are laws banning the issuance of
driver's licenses, laws banning day laborers sites, and measures which require proof of
citizenship to rent or lease an apartment.
Deportations through removal saw large increases during the Clinton administration years
from 70,000 in 1996 to 115,000 in 1997, and have continued to increase over time (DHS,
2014). Deportations through returns saw large decreases from the late 1900's and an
upswing after 2002 as returns began to increase which peaked in 2004 to 1,666,576
immigrants (DHS, 2014). The difference between deportation through removal and through
returns has to do with how immigrants are counted by the Department of Homeland
Security. In general, deportation through removal is much more severe as it calls for a judge
order and comes with stiffer penalties and deportation through returns can be individuals
who return without penalty and immigrants who are ‘catch and released’ when caught at the
border (Vicens, 2014) Despite, the bureaucratic semantics, it is estimated that under the
Obama administration around 438,421 undocumented immigrants were deported through
removal in 2013 (DHS, 2014) giving the President the title Deporter-in-Chief. As expected
this heighted enforcement has negatively affected the Latino community. A poll conducted
by the Pew Hispanic Center (2007) shows over half of Latinos worry they, a family member,
or close friend can be deported. Moreover, 67 percent of the foreign born respondents in this
same poll feel that they are negatively affected by the increased enforcement and attention to
illegal immigration. Moreover, since the enactment of Section 287(g) of the Immigration
and Nationality Act1, which legalizes the deputation of local law officials to act as federal
immigration law enforcers, deportations have been more visible in the undocumented
community. As of 2011, there were agreements with 69 law enforcement agencies in 24
states that have enacted 287(g). The 287(g) program has sense been phased out in 2012, but
evidence has shown that this program has been negative in terms of immigrants reluctance
to trust law enforcement and the numerous claims made by legal-aid organizations stating
1Officially passed under the Illegal Immigration Reform and Immigrant Responsibility Act of 1996 but states did not start adopting 28 7(g) agreements until 2008.
Vargas Page 5
Child Youth Serv Rev. Author manuscript; available in PMC 2015 October 02.
Author M
anuscriptA
uthor Manuscript
Author M
anuscriptA
uthor Manuscript
that the program is unjustly racially profiling Hispanic Americans. The end result of this
program however has taken its toll and has forced undocumented immigrants further into the
shadows.
In addition to federal action, states have been active in passing anti-immigrant legislations
which make it unlawful to be in the state without proper documentation. For example,
Oklahoma, South Carolina, Arizona, and Alabama have all passed anti-immigrant legislation
which is forcing the undocumented to either flee or go further underground. In sum, as the
number of deported aliens reached an all-time high in 2009 the presence of local foot
soldiers has caused an increased climate of fear and risk of deportation amongst
undocumented immigrants living in the interior.
While, there are undocumented immigrants from every corner of the world, deportations
naturally affect Mexican immigrants disproportionally. In fiscal year 2005 for example,
around 85 percent of the 1,291,142 deportable immigrants from the U.S. were from Mexico
(DHS, 2005). This of course is largely a function of the flow of undocumented aliens from
Mexico and our historical relationship with our southern neighbor. What is not clear is of
those deported, how many of these unauthorized migrants have children who are American
citizens. Thus far, the Urban Institute has produced the only study that has focused on the
outcomes of immigration raids. The study found that of the 900 unauthorized immigrants
detained in 2007 worksite raids, over 500 children were affected (Urban Institute, 2007). As
noted by the study the majority of these children were in fact U.S. citizens.
What has yet to be tested is how risk of deportation affects the likelihood of a mixed-status
mother's use social services? We posit that as anti-immigrant sentiment increases this then
would deter a mixed-status mother to not to participate in a government program in which
her child is eligible to receive. In sum, this is the first empirical analysis to first disaggregate
mixed-status mothers and quantify risk of deportation on the probability of social service
take-up in mixed-status families.
METHODOLOGY
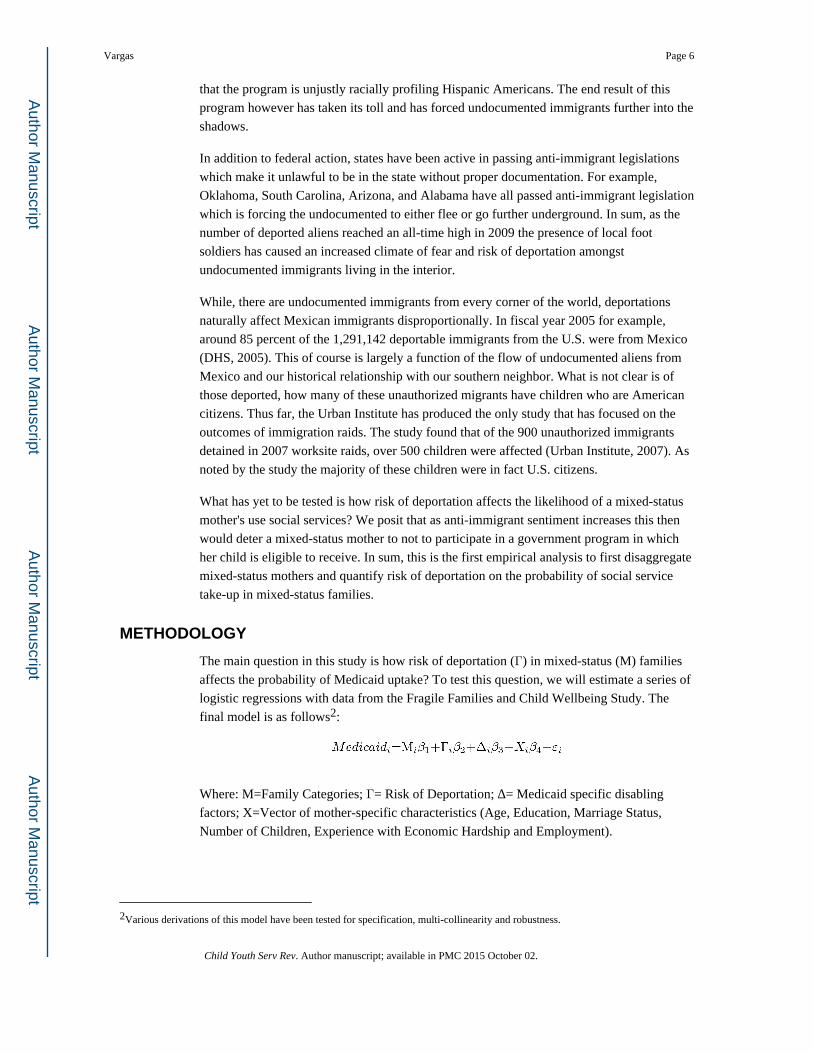
The main question in this study is how risk of deportation (Γ) in mixed-status (M) families
affects the probability of Medicaid uptake? To test this question, we will estimate a series of
logistic regressions with data from the Fragile Families and Child Wellbeing Study. The
final model is as follows2:
Where: M=Family Categories; Γ= Risk of Deportation; Δ= Medicaid specific disabling
factors; X=Vector of mother-specific characteristics (Age, Education, Marriage Status,
Number of Children, Experience with Economic Hardship and Employment).
2Various derivations of this model have been tested for specification, multi-collinearity and robustness.
Vargas Page 6
Child Youth Serv Rev. Author manuscript; available in PMC 2015 October 02.
Author M
anuscriptA
uthor Manuscript
Author M
anuscriptA
uthor Manuscript

Due to the fact that the outcome variable is binary, we will be estimating this logistic
equation with a maximum likelihood estimator (MLE). Findings will be presented using
logit coefficients and factor change in odds ratios. Because this survey is used to represent
the U.S. nationally, weights are applied in all estimations to correct for biased standard
errors and all statistical analysis were conducted using Stata 10.
DATA
Studying undocumented families and program use is a challenge especially when further
collapsing families into mixed-status subcategories by nationality, race and ethnicity. To
model a mixed-status family one family member has to be a U.S. citizen and at least one
parent should be undocumented. In order to fulfill data requirements, we make use of the
survey sampling strategy of the Fragile Families and Child Wellbeing Survey (FFCWB).
The Fragile Families and Child Wellbeing Study is a national longitudinal sample of all U.S.
cities with 200,000 or more inhabitants between 1998 and 2000. Data have been collected
on 4,898 births in 75 hospitals in 20 cities across the United States. The study then follows a
cohort of parents and their children from child's birth, 12th month, 30th month, 48th month
and when the child is nine years old. This analysis uses the nationally representative weights
to be able to generalize about the well-being of families living in fragile families.
The Fragile Families and Child Wellbeing Study are of particular importance for this study
because of their scope and national representativeness. In addition, the Fragile Families by
design includes only families who have a child born in the U.S., granting the child
citizenship by birthright. The study has a representative number of mixed-status families
who are sampled across time on various indicators of social service participation, earnings,
and physical/mental health. Moreover, the contract data has geographic indicators which
permit merging external data sources to the geographic location of the mother. The first two
waves of the Fragile Families survey are utilized which were administered in 1998-2001.
External sources of data (deportation data from Special Agent in Charge Districts of the U.S.
Department of Homeland Security3, undocumented population estimates from the Pew
Hispanic Center, and Medicaid specific measures from the Kaiser Family Foundation are
merged using the geo-coded indicators within Fragile Families and Child Survey. For
example, if living in Indianapolis, you are under the enforcement jurisdiction of the
Chicago, IL SAC district. Matching Fragile Family sites and Special Agent in Charge
districts are as followed: Oakland-San Francisco, Austin-San Antonio, Baltimore-Baltimore,
Detroit-Detroit, Newark-Newark, Philadelphia-Philadelphia, Richmond-Washington DC,
Corpus Christi-Houston, Indianapolis- Chicago, Milwaukee-Chicago, New York-New York,
San Jose-San Francisco, Boston-Boston, Nashville-New Orleans, Chicago-Chicago,
Jacksonville-Tampa, Toledo-Detroit, San Antonio-San Antonio, Pittsburgh-Philadelphia,
Norfolk-Washington DC.
3Obtained through the Freedom of Information Act (FOIA) are now publicly available.
Vargas Page 7
Child Youth Serv Rev. Author manuscript; available in PMC 2015 October 02.
Author M
anuscriptA
uthor Manuscript
Author M
anuscriptA
uthor Manuscript

MEASURES
Family Categories
Mixed-status mothers in this study are defined as mothers who are undocumented and who
have a child who is an American citizen by birthright. Families were separated by race and
ethnicity and citizenship status. For example, families were collapsed into U.S. born non-
Hispanic Whites (reference group), U.S. born non-Hispanic Black, non-Hispanic Black
naturalized, non-Hispanic Black mixed status, U.S. born Hispanic, Hispanic naturalized,
Mexican-Hispanic mixed-status, and non-Mexican Hispanic mixed-status family.
Up to this point there is no prior research on how to code mixed-status. Using qualitative
interviews and focus groups, a typology was constructed and one of these mixed-status
families is depicted in figure 1. Qualitative interviews suggest that mixed-status families are
a function of residency in the U.S., and the demographic profile on an immigrant. In general,
the family in the figure 1, is representative of a family who came to the U.S. relatively
young and has been in the U.S. long enough to form a family.
Exhibit 1: Typology of Mixed-Status Families—To be coded as mixed-status in the
FFCWB dataset you have to self-identify as being foreign born and non-citizen. If satisfying
the above criteria you were coded as mixed-status. If, mothers were not asked the citizen
question (certain cities were skipped) and said they were foreign born they were coded as
being citizens if they arrived pre-1986 and presumed to be non-citizens after 1986.
Moreover, because the FFCWB design surveys mothers who have given birth in a U.S.
hospital this automatically makes them eligible to be classified as mixed-status.
Risk of Deportation
Risk of deportation is measured as the proportion of deported aliens divided by the number
of estimated unauthorized immigrants4. For example, we would expect that the risk of being
deported in Texas is different than the risk of being deported in North Carolina. Deportation
data are gathered from the Department of Homelands Security- Immigration Statistics
office. The data are then classified by the 26 Special Agents in Charge Jurisdictions, who are
responsible for enforcing specific jurisdictions within the nation's interior. The 26 SAC
offices maintain various subordinate field offices throughout their areas of responsibility,
and produce statistics on deportations across time.
Risk is constructed by taking the proportion of deportations which is at the SAC district by
the estimated undocumented population which is measured at the state level. In some states,
there are multiple SAC districts that can be in the same state such as in Florida and New
York. Furthermore, SAC jurisdictions can have multiple offices in a state have their
jurisdictions reach across state boundaries.
Risk of deportation is constructed by taking the total number of deportations in the SAC
district and multiplying it by the proportion of the total population of a given state by the
total population of the states within the SAC region. The formula is as such:
4Estimates for unauthorized immigrants are provided by the Pew Hispanic Center.
Vargas Page 8
Child Youth Serv Rev. Author manuscript; available in PMC 2015 October 02.
Author M
anuscriptA
uthor Manuscript
Author M
anuscriptA
uthor Manuscript
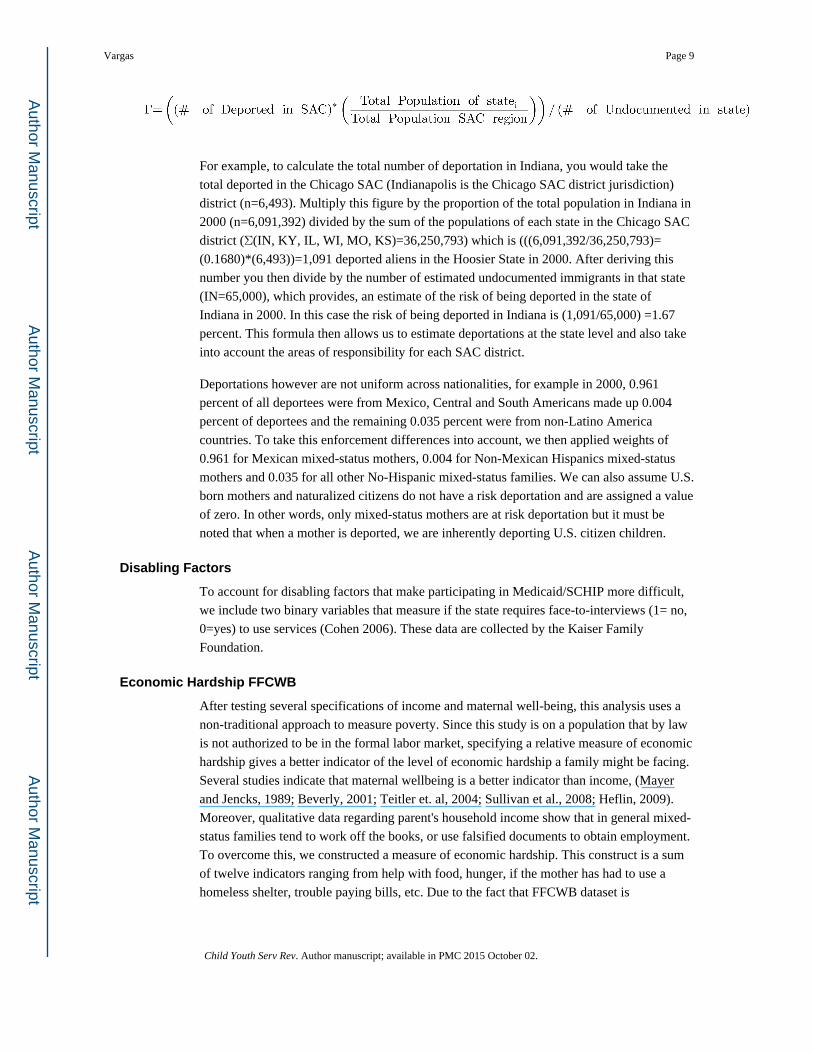
For example, to calculate the total number of deportation in Indiana, you would take the
total deported in the Chicago SAC (Indianapolis is the Chicago SAC district jurisdiction)
district (n=6,493). Multiply this figure by the proportion of the total population in Indiana in
2000 (n=6,091,392) divided by the sum of the populations of each state in the Chicago SAC
district (Σ(IN, KY, IL, WI, MO, KS)=36,250,793) which is (((6,091,392/36,250,793)=
(0.1680)*(6,493))=1,091 deported aliens in the Hoosier State in 2000. After deriving this
number you then divide by the number of estimated undocumented immigrants in that state
(IN=65,000), which provides, an estimate of the risk of being deported in the state of
Indiana in 2000. In this case the risk of being deported in Indiana is (1,091/65,000) =1.67
percent. This formula then allows us to estimate deportations at the state level and also take
into account the areas of responsibility for each SAC district.
Deportations however are not uniform across nationalities, for example in 2000, 0.961
percent of all deportees were from Mexico, Central and South Americans made up 0.004
percent of deportees and the remaining 0.035 percent were from non-Latino America
countries. To take this enforcement differences into account, we then applied weights of
0.961 for Mexican mixed-status mothers, 0.004 for Non-Mexican Hispanics mixed-status
mothers and 0.035 for all other No-Hispanic mixed-status families. We can also assume U.S.
born mothers and naturalized citizens do not have a risk deportation and are assigned a value
of zero. In other words, only mixed-status mothers are at risk deportation but it must be
noted that when a mother is deported, we are inherently deporting U.S. citizen children.
Disabling Factors
To account for disabling factors that make participating in Medicaid/SCHIP more difficult,
we include two binary variables that measure if the state requires face-to-interviews (1= no,
0=yes) to use services (Cohen 2006). These data are collected by the Kaiser Family
Foundation.
Economic Hardship FFCWB
After testing several specifications of income and maternal well-being, this analysis uses a
non-traditional approach to measure poverty. Since this study is on a population that by law
is not authorized to be in the formal labor market, specifying a relative measure of economic
hardship gives a better indicator of the level of economic hardship a family might be facing.
Several studies indicate that maternal wellbeing is a better indicator than income, (Mayer
and Jencks, 1989; Beverly, 2001; Teitler et. al, 2004; Sullivan et al., 2008; Heflin, 2009).
Moreover, qualitative data regarding parent's household income show that in general mixed-
status families tend to work off the books, or use falsified documents to obtain employment.
To overcome this, we constructed a measure of economic hardship. This construct is a sum
of twelve indicators ranging from help with food, hunger, if the mother has had to use a
homeless shelter, trouble paying bills, etc. Due to the fact that FFCWB dataset is
Vargas Page 9
Child Youth Serv Rev. Author manuscript; available in PMC 2015 October 02.
Author M
anuscriptA
uthor Manuscript
Author M
anuscriptA
uthor Manuscript
representative of low-income families were over 80 percent of respondents make less than
$25,000, we must consider non-traditional means to capture earnings.
Additional Control Variables
In addition to family categories, risk of deportation, and Medicaid specific predictors,
additional control variables are included to estimate Medicaid participation, which are
consistent with the literature. For example, education is specified with two binary variables
(0=High School and above, 1=Less than High School). A binary indicator of marital status
(1=married, 0=unmarried) is included to understand differences in Medicaid uptake by
marital status as well as a binary variable on employment status (0=unemployed,
1=employed). We also include a measure of the number of children in the household and
age of mother.
Outcome Variable
The Medicaid indicator is a dichotomous measure if the mother is using the program (1=yes,
0=no). In the Fragile Families the question is asked at the hospital when the child is born.
Table 1, provides an overview of the key demographic family groups used in this analysis.
Immigration status is broken into three categories: U.S. born citizen, naturalized citizens5
and non-citizens (mixed-status families). Race/ethnicity/nationality is broken down into the
following categories: non-Hispanic White, Non-Hispanic non-White, Pan ethnic Hispanic,
Hispanic of Mexican origin and Hispanics non Mexican ancestry. Mixed-status families
represent about 11.6 percent (567/4,884) of families in the Fragile Families and Child
Wellbeing Survey (Mexican origin representing over half). This is 2.5 percentage points
above the national estimate (9 percent) taken from the 1998 Current Population Survey (Fix
& Zimmerman, 1999; Passel and Clark, 1998).
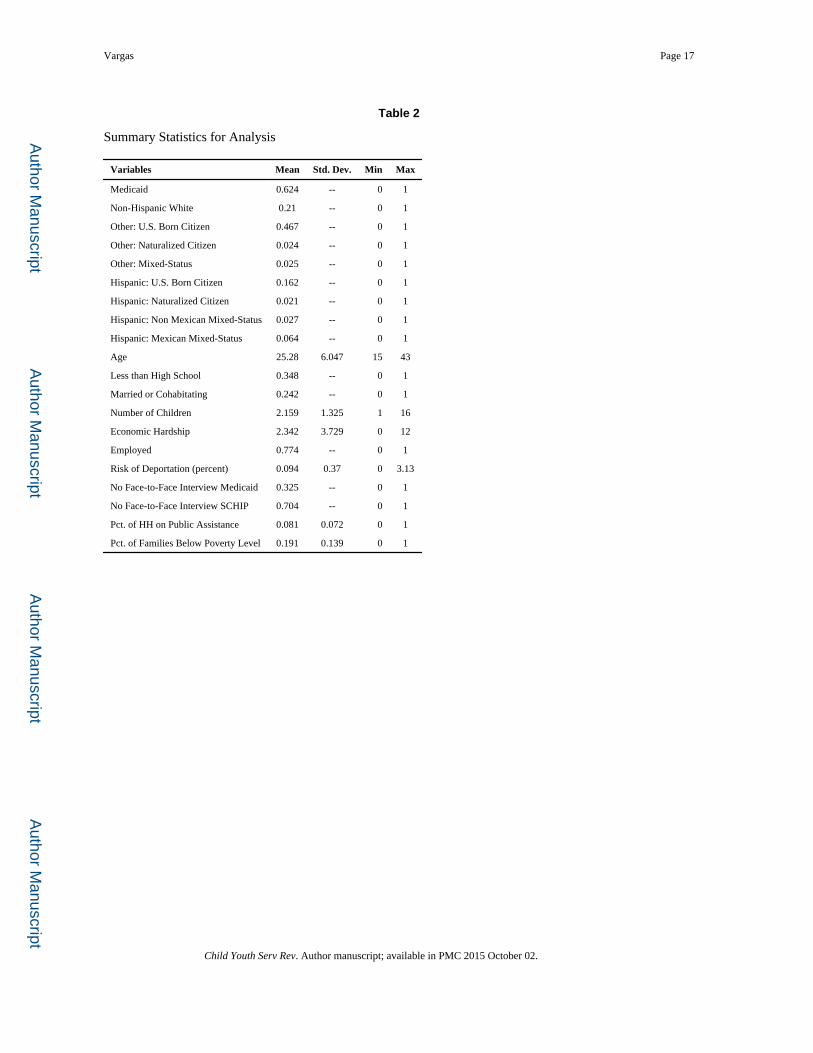
Table 2 provides a detailed tabulation of the summary statistics used in the analysis. In
general, the FFCWB sample tends to be black (46 percent), relatively young (25 years old),
and participating in Medicaid at high rates (62 percent). In general, over 30 percent of
mothers had less than a high school education yet mothers also tended to be either be part-
time or half-time employed. Fragile Family mothers in this sample also had low marriage
and cohabiting rates and have at minimum two other biological children. The fact that
FFCWB is a national representative sample of poor, single, families, explains the low
marriage rates, Medicaid use, and low educational attainment.
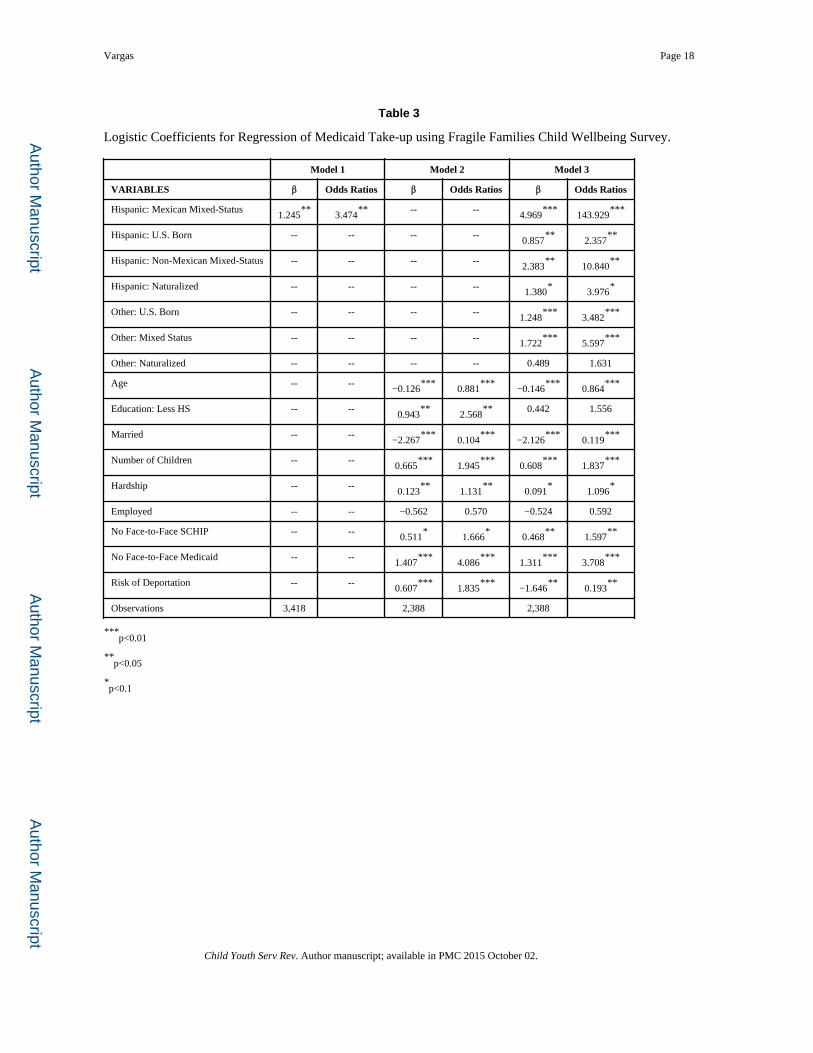
RESULTS
The analysis uses a nationally representative sample to test the relationship between risks of
deportation on the probability of Medicaid use. The first step in this analysis is to run a
baseline logistical regression to estimate Medicaid participation by comparing Mexican
mixed-status families with all other family types (model 1). Model 1 provides a benchmark
to examine Medicaid take-up differences between Mexican mixed-status families and all
5When citizenship status is missing (N=223), mothers who migrated to the U.S. prior to 1986 are categorized as naturalized citizens. Those migrating during or after 1986 are classified as non-citizens.
Vargas Page 10
Child Youth Serv Rev. Author manuscript; available in PMC 2015 October 02.
Author M
anuscriptA
uthor Manuscript
Author M
anuscriptA
uthor Manuscript

other families. Due to sample sizes and estimation issues related to overfitting the data,
model 1 is the most parsimonious model and provides us the opportunity to compare
Medicaid participating for Mixed-Status Mexican families. I include logit coefficients and a
column for odds ratios for a unit change (factor change in odds) of the independent
variables. From model 1 (table 3), we find that Mexican mixed-status families are 3.5 times
more likely to use Medicaid than all other family types, a result which exemplifies the need
for this vulnerable family. From model 2 (table 3), I estimate a model that includes the risk
of deportation along with demographic and Medicaid disabling factors controls. As
hypothesized, risk of deportation is negatively associated with Medicaid participation,
holding all else constant. For a one percentage change in risk of deportation, the odds of
Medicaid participation are expected to decrease by 83 percent, holding all else constant,
which is statistically significant at the 0.05 level. In other words, for a one percentage
increase in risk of deportation, the odds of participating in Medicaid decrease by 87 percent,
holding all else constant (p<0.01).
Our last model 3 includes family types, risk of deportation, and control variables of age,
education, marital status, number of children, economic hardship, employment, and
Medicaid disabling factors. In this model, we find that Mexican mixed-status families as
well as all other family types are more likely to use Medicaid compared to U.S. white
mothers, holding all else constant. We also find that as the risk of deportation increases, the
likelihood of Medicaid uptake decreases, holding all else constant. Taken together, this
model shows that if we compare Mexican mixed-status families Medicaid utilization in
model 1 compared to model 3, controlling for risk of deportation, Mexican mixed-status
families are more likely to use Medicaid, providing evidence that risk of deportation is
having a chilling effect on Medicaid utilization. However, it should be noted that we need to
be cautious of these findings as the odds ratios are extremely high. These inflated odds ratios
are evidence that we are over estimating our models given the low cell sizes and lack of
variation on the number of individuals who are not using Medicaid, which is expected given
that we are investigating a set of families are fragile and on the margins of our society.
Our control variable findings are in line with the Medicaid uptake literature in that age,
marital status, and additional children in the household are negatively associated with
Medicaid participation. In our sample, as a mother gets one year older, the odds of
participating in Medicaid decreases, holding all other variables constant. If a mother is
married, she is less likely to participate in Medicaid, holding all else constant. The effects of
economic hardship on Medicaid participation was as expected, so as mother's faced more
hardship, they are more likely to participate in Medicaid. We also find the expected
relationship between Medicaid disabling factors and Medicaid uptake, so if a state does not
require a face to face meeting to use Medicaid and SCHIP they are more likely to participate
in Medicaid, all else constant.
DISCUSSION
This paper finds evidence that Mexican mixed-status families have higher odds of Medicaid
uptake compared to their U.S. born white counterparts. Moreover, our empirical results
suggest that risk of deportation does negatively affect Medicaid uptake and if including it as
Vargas Page 11
Child Youth Serv Rev. Author manuscript; available in PMC 2015 October 02.
Author M
anuscriptA
uthor Manuscript
Author M
anuscriptA
uthor Manuscript

a control variable, the odds of Medicaid uptake increase substantially for mixed-status
families of Mexican origin. Mixed-status families and Mexican origin mixed-status families
in particular should be of critical concern for policy makers given their marginalization.
Mixed-status families are extremely vulnerable in terms of access to health care and
increased chances of being impacted by family disruption through deportation removal. In
our study we are concerned with the latter and find that in fact, risk of deportation is mostly
likely to burden mixed-status families of Mexican origin, a novel finding that has yet to be
documented in the Medicaid participation literature.
This study is important as it adds to the program evaluation literature that has yet to address
the link between risk of deportation and social service uptake. In addition to the
development of a new barrier to social service utilization, this analysis provides a typology
and framework to study mixed-status families and evaluate their usage of Medicaid.
Ultimately, our analysis has the potential to help service providers address the needs of
children living in complex family structures and policy makers interested in alleviating
health equity in immigrant populations. Lastly, as President Obama's executive order
Deferred Action for Parents of Americans and Lawful Permanent Residents (DAPA)
program is being tested, there remains a great deal of confusion about how this policy will
impact undocumented communities and their usage of social services. It is our hope that this
work can help unpack the link between anti-immigration sentiment and Latino health,
irrespective of citizenship status.
BIBLIOGRAPHY
Amuedo-Dorantes C, Puttitanun T, Martinez-Donate AP. How Do Tougher Immigration Measures Affect Unauthorized Immigrants? Demography. 2013; 50(3) 10.1007/s13524–013–0200–x. doi:10.1007/s13524-013-0200-x.
Asch S, Leake B, Gelberg L. Does Fear of Immigration Authorities Deter Tuberculosis Patients From Seeking Care? Western Journal Medicine. 1994; 161:373–376.
Bean, Frank D.; Jennifer, VW.; Hook, Van; Glick, Jennifer E. Country of Origin, Type of Public Assistance and Patterns of Welfare Recipiency Among U.S. Immigrants and Natives. Social Science Quarterly. 1997; 78(2):432–451.
Berk ML, Schur CL. The Effect of Fear on Access to Care Among Undocumented Latino Immigrants. Journal of Immigrant Health. 2001; 3(3):151–151. [PubMed: 16228780]
Beverly S. Material Hardship in the United States: Evidence from the Survey of Income and Program Participation. Social Work Research. 2001; 25(3):143.
Blau, Francine. The Use of Transfer Payments by Immigrants. Industrial and Labor Relations Review. 1984; 37(2):222–239.
Borjas, George; Hilton, Lynette. Immigration and the Welfare State: Immigrant Participation in Means-Tested Entitlement Programs. Quarterly Journal of Economics. 1996; 111(2):575–604.
Borjas, George; Trejo, Stephen. Immigrant Participation in the Welfare System Industrial and Labor Relations Review. 1999; 44(2):195–211.
Borjas, George; Trejo, Stephen. National Origin and Immigrant Welfare Recipiency. Journal of Public Economics. 1993; 50(3):325–344.
Broder, Tanya; Blazer, Jonathan. Overview of Immigrant Eligibility for Federal Programs. National Immigration Law Center; 2011. at http://www.nilc.org/overview-immeligfedprograms.html [11/15/2012]
Brown, Richard; Wyn, Roberta; Ojeda, Victoria D. Access to Health Insurance and Health Care for Children in Immigrant Families. UCLA Center for Health Policy Research; Los Angeles: Jun. 1999
Vargas Page 12
Child Youth Serv Rev. Author manuscript; available in PMC 2015 October 02.
Author M
anuscriptA
uthor Manuscript
Author M
anuscriptA
uthor Manuscript

Cohen Ross, D.; Cox, L. Resuming the Path to Health Coverage for Children and Parents: A 50 State Update on Eligibility Rules, Enrollment and Renewal Procedures, and Cost-Sharing Practices in Medicaid and SCHIP.. Prepared for the Center on Budget and Policy Priorities and Caryn Marks Kaiser Commission on Medicaid and the Uninsured. 2006. http://www.kff.org/medicaid/upload/7608.pdf
Citrin, Jack; Green, Donald; Muste, Christopher; Wong, Cara. Public Opinion Toward Immigration Reform: The Role of Economic Motivations. The Journal of Politics. 1997; 59(3)
Hernandez, Donald J.; Charney, Evan, editors. From Generation to Generation: The Health and Well-Being of Children in Immigrant Families. National Academy Press; Washington, D.C.: 1998. p. 10
Fix, Michael; Zimmermann, Wendy. All Under One Roof: Mixed-Status Families in an Era of Reform. The Urban Institute; Washington, DC: 1999.
Heflin, Colleeen; Iceland, John. Poverty, Material Hardship, and Depression. Social Science Quarterly. 2009; 90(5):1051–1071. [PubMed: 25530634]
Hernandez, D.; Denton, NA.; McCartney, SE. Early education Programs: Differential Access Among Young Children in Newcomer and Native Families.. In: Waters, M.; Alba, R., editors. The Next Generation: Immigrant youth and Families in Comparative Perspective. Cornell University Press; Ithaca, NY: 2011.
Kahler, Lucinda R.; O'Shea, Robert M.; Duffy, Linda C.; Buck, Germaine M. Factors Associated with Rates of Participation in WIC by Eligible Pregnant Women. Public Health Reports. 1992; 107(1)
Kronick R, Gilmer T. Insuring Low-Income Adults: Does Public Coverage Crowd Out Private? Health Affairs. 2002; 21(1):225–239. [PubMed: 11900081]
Kullgren JT. Restrictions on Undocumented Immigrants’ Access to Health Services: The Public Health Implications of Welfare Reform. American Journal of Public Health. 2003; 93(10):1630–1633. [PubMed: 14534212]
LoSasso A, Buchmueller T. The Effect of the State Children's Health Insurance Program on health insurance coverage. Journal of Health Economics. 2004; 23:1059–1082. [PubMed: 15353193]
Mayer S, Jencks C. Poverty and the Distribution of Material Hardship. The Journal of Human Resources. 1989; 24(1):88–114.
Passel, Jeffrey S.; Capps, Randy; Fix, Michael. Undocumented Immigrants: Facts and Figures. Urban Institute Immigration Studies Program; 2004.
Passel, Jeffrey S. Unauthorized Migrants: Numbers and Characteristics. Pew Hispanic Center; Washington, DC: 2005. Retrieved from: http://pewhispanic.org/files/reports/46.pdf
Passel, Jeffrey; Cohn, D'Vera. Trends in Unauthorized Immigration: Undocumented Inflow Now Trails Legal Inflow Source: Urban Institute Analysis of March 2005 U.S. Current Population Survey Data. Pew Hispanic Center; 2008.
Passel, JS. Unauthorized immigrants and their U.S.-born children. Pew Hispanic Center; 2010. http://pewhispanic.org/files/reports/125.pdf
Doe, Plyler v. 1982. 457 U.S. 202
Preuhs, Robert. Descriptive Representation, Legislative Leadership, and Direct Democracy: Latino Influence on English Only Laws in the States, 1984-2002. State Politics and Policy Quarterly. 2005; 5(Fall):203–224.
Rutledge MS, McLaughlin CG. Hispanics and health insurance coverage: the rising disparity. Medical care. 2008; 46(10):1086–1092. [PubMed: 18815531]
Schildkraut, Deborah. Official-English and the States: Influences on Declaring English the Official Language in the United States. Political Research Quarterly. Jun.2001 2001 54:445–457.
Sullivan J, Turner L, Danziger S. The Relationship between Income and Material Hardship. Journal of Policy Analysis and Management. 2008; 27(1):63–81.
Teitler, Julien O.; Reichman, Nancy E.; Nepomnyaschy, Lenna. Sources of Support, Child Care, and Hardship Among Unwed Mothers, 1999-2001. Social Services Review. 2004; 78(1):125–148.
Van Hook, Jennifer; Glick, Jennifer E.; Bean, Frank D. Public Assistance Receipt among Immigrants and Natives: How the Unit of Analysis Affects Research Findings. Demography. 1999; 36(1):111–120. [PubMed: 10036596]
Vargas Page 13
Child Youth Serv Rev. Author manuscript; available in PMC 2015 October 02.
Author M
anuscriptA
uthor Manuscript
Author M
anuscriptA
uthor Manuscript

Vicens, AJ. The Obama Administration's 2 Million Deportations, Explained. 2014. http://www.motherjones.com/politics/2014/04/obama-administration-record-deportations
Watson, Tara. Inside the Refrigerator: Immigration Enforcement and Chilling Effects in Medicaid Participation. American Economic Journal: Economic Policy. 2014; 6(3):313–38.
Yoshikawa, H.; Godfrey, EB.; Rivera, AC. Access to Institutional Resources as a Measure of Social Exclusion: Relations with Family Process and Cognitive Development in the Context of Immigration.. In: Yoshikawa, H.; Way, N., editors. Beyond the Family: Contexts of Immigrant Children's Development. Vol. 121. New Directions for Child and Adolescent Development; 2008. p. 63-86.
Kaiser Foundation. Health Coverage for the Hispanic Population Today and Under the Affordable Care Act. 2013. https://kaiserfamilyfoundation.files.wordpress.com/2013/04/84321.pdf
Pew Hispanic Center. National Survey of Latinos: As Illegal Immigration Issue Heats Up, Hispanics Feel a Chill. 2007. Retrieved from: http://pewhispanic.org/files/reports/84.pdf
Section 287 ICE found in the Office of Public Affairs of U.S. Department of Homeland Security Worksite. http://www.ice.gov/doclib/pi/news/factsheets/060816dc287gfactsheet.pdf
[April 30, 2009] Worksite Enforcement found in the Office of Public Affairs of U.S. Department of Homeland Security Worksite. Enforcement Overview http://www.ice.gov/doclib/pi/news/factsheets/worksite.pdf
Department of Homeland Security. Yearbook of Immigration Statistics. 2005. http://www.dhs.gov/yearbook-immigration-statistics-2005
National Hispanic Media Coalition. The Impact of Media Stereotypes On Opinions And Attitudes Towards Latinos. 2012. Retrieved from: http://www.nhmc.org/sites/default/files/LD%20NHMC%20Poll%20Results%20Sept.2012.pdf
The Urban Institute. Children of Immigrants: Facts and Figures. 2006. Retrieved from: http://www.urban.org/UploadedPDF/900955_children_of_immigrants.pdf
U.S. Department of Homeland Security. ENFORCE Alien Removal Module (EARM), January 2014. Enforcement Integrated Database (EID). Nov.2013
U.S. Department of Homeland Security. Customs and Border Protection (CBP) Office of Border Patrol (OBP), Immigration and Customs Enforcement (ICE) Office of Investigations (OI) and the Office of Detention and Removal Operations (DRO).
Vargas Page 14
Child Youth Serv Rev. Author manuscript; available in PMC 2015 October 02.
Author M
anuscriptA
uthor Manuscript
Author M
anuscriptA
uthor Manuscript

Figure 1. Mixed-Status Family
Vargas Page 15
Child Youth Serv Rev. Author manuscript; available in PMC 2015 October 02.
Author M
anuscriptA
uthor Manuscript
Author M
anuscriptA
uthor Manuscript

Author M
anuscriptA
uthor Manuscript
Author M
anuscriptA
uthor Manuscript
Vargas Page 16
Table 1
Key Demographic Groups in Fragile Families
Non-Hispanic White Non-Hispanic Non-White Hispanic Hispanic: Mexican National Hispanic: Non Mexican National
U.S. Born Citizen 1,024 2,283 790 -- --
Naturalized Citizena -- 116 104 -- --
Non-Citizen -- 120 -- 315 132
Note(s):
aWhen citizenship status is missing (N=223), mothers who migrated to the U.S. prior to 1986 are categorized as naturalized citizens. Those
migrating during or after 1986 are classified as non-citizens.
Child Youth Serv Rev. Author manuscript; available in PMC 2015 October 02.
Author M
anuscriptA
uthor Manuscript
Author M
anuscriptA
uthor Manuscript
Vargas Page 17
Table 2
Summary Statistics for Analysis
Variables Mean Std. Dev. Min Max
Medicaid 0.624 -- 0 1
Non-Hispanic White 0.21 -- 0 1
Other: U.S. Born Citizen 0.467 -- 0 1
Other: Naturalized Citizen 0.024 -- 0 1
Other: Mixed-Status 0.025 -- 0 1
Hispanic: U.S. Born Citizen 0.162 -- 0 1
Hispanic: Naturalized Citizen 0.021 -- 0 1
Hispanic: Non Mexican Mixed-Status 0.027 -- 0 1
Hispanic: Mexican Mixed-Status 0.064 -- 0 1
Age 25.28 6.047 15 43
Less than High School 0.348 -- 0 1
Married or Cohabitating 0.242 -- 0 1
Number of Children 2.159 1.325 1 16
Economic Hardship 2.342 3.729 0 12
Employed 0.774 -- 0 1
Risk of Deportation (percent) 0.094 0.37 0 3.13
No Face-to-Face Interview Medicaid 0.325 -- 0 1
No Face-to-Face Interview SCHIP 0.704 -- 0 1
Pct. of HH on Public Assistance 0.081 0.072 0 1
Pct. of Families Below Poverty Level 0.191 0.139 0 1
Child Youth Serv Rev. Author manuscript; available in PMC 2015 October 02.
Author M
anuscriptA
uthor Manuscript
Author M
anuscriptA
uthor Manuscript
Vargas Page 18
Table 3
Logistic Coefficients for Regression of Medicaid Take-up using Fragile Families Child Wellbeing Survey.
Model 1 Model 2 Model 3
VARIABLES β Odds Ratios β Odds Ratios β Odds Ratios
Hispanic: Mexican Mixed-Status1.245
**3.474
** -- --4.969
***143.929
***
Hispanic: U.S. Born -- -- -- --0.857
**2.357
**
Hispanic: Non-Mexican Mixed-Status -- -- -- --2.383
**10.840
**
Hispanic: Naturalized -- -- -- --1.380
*3.976
*
Other: U.S. Born -- -- -- --1.248
***3.482
***
Other: Mixed Status -- -- -- --1.722
***5.597
***
Other: Naturalized -- -- -- -- 0.489 1.631
Age -- --−0.126
***0.881
***−0.146
***0.864
***
Education: Less HS -- --0.943
**2.568
** 0.442 1.556
Married -- --−2.267
***0.104
***−2.126
***0.119
***
Number of Children -- --0.665
***1.945
***0.608
***1.837
***
Hardship -- --0.123
**1.131
**0.091
*1.096
*
Employed -- -- −0.562 0.570 −0.524 0.592
No Face-to-Face SCHIP -- --0.511
*1.666
*0.468
**1.597
**
No Face-to-Face Medicaid -- --1.407
***4.086
***1.311
***3.708
***
Risk of Deportation -- --0.607
***1.835
***−1.646
**0.193
**
Observations 3,418 2,388 2,388
***p<0.01
**p<0.05
*p<0.1
Child Youth Serv Rev. Author manuscript; available in PMC 2015 October 02.