New and modified anodic alumina membranes Part I. Thermotreatment of anodic alumina membranes
ARTICLE IN PRESSCHERD-1619; No. of Pages 10
Mp
OMK
1
Mrpitmp(tT
ipi(
h0
chemical engineering research and design x x x ( 2 0 1 4 ) xxx–xxx
Contents lists available at ScienceDirect
Chemical Engineering Research and Design
j ourna l h omepage: www.elsev ier .com/ locate /cherd
ixed matrix membranes’ gas separationerformance prediction using an analytical model
mid Bakhtiari ∗, Nasrin Sadeghiembrane Research Center, Department of Chemical Engineering, Faculty of Engineering, Razi University,
ermanshah, Iran
a b s t r a c t
Mixed matrix membranes (MMMs), as a new membrane generation, have been an attractive subject of the worldwide
academic and industrial studies accomplished by many researchers. Although many different models have been
adapted and/or developed for MMMs’ permeability prediction, almost of them neglect the so-called impermeable
filler particles’ permeabilities, e.g. Pd = 0. In the current study, a new theoretical model is developed to predict MMMs
performance considering a surface flux (or permeability) for the so-called impermeable filler particles. Due to the
adsorption of the penetrants on the filler particles’ surface, there is surface flux on the filler particles. In order to
develop a proper model, the ideal MMM structure is divided into three regions: polymer matrix, coating and filler
surface regions. Model equations for each region was developed and then the current and the employed predictive
models prediction results were compared with those of experimentally measured data. Very well agreement with
the current model result with the experimental data was found (e.g. AAREs were reduced from 52.65 to 31.74%, from
51.12 to 28.22% and from 55.33 to 31.50% for the Maxwell, the Bruggeman and the Pal models, respectively in the
current proposed model).
© 2014 The Institution of Chemical Engineers. Published by Elsevier B.V. All rights reserved.
Keywords: Mixed matrix membranes; Gas separation; Permeability prediction; Filler particles; Surface flux; Analytical
modeling
tion performance of MMMs by the first and after that provide
. Introduction
embrane separation processes have been used for gas sepa-ation since mid of 1970s. Among of many different materials,olymeric membranes were commercialized for large-scale
ndustrial application in 1980s due to their superior proper-ies of low cost, Among of them, polymeric membranes are
ore attractive due to their high flexibility, low cost and foot-rint requirement, and ease of operation and scale up, etc.
Budiyono et al., 2009, Chung et al., 2007). Some of indus-rial applications of membrane processes are summarized inable 1 (Goh et al., 2011a).
While the polymeric membranes are the main type ofndustrially employed membranes, however, their current andotential industrial applications are limited by low productiv-
ty and trade-off between their permeability and selectivity
Please cite this article in press as: Bakhtiari, O., Sadeghi, N., Mixed matrix mmodel. Chem. Eng. Res. Des. (2014), http://dx.doi.org/10.1016/j.cherd.2014.
Basu et al., 2010), e.g. Robeson upper bound limit, as reported
∗ Corresponding author. Tel.: +98 831 428 32 62; fax: +98 831 428 32 62.E-mail address: [email protected] (O. Bakhtiari).
ttp://dx.doi.org/10.1016/j.cherd.2014.06.013263-8762/© 2014 The Institution of Chemical Engineers. Published by
by Robeson (1991) for the first time. On the other hand,ceramic membranes are much restricted in their industrialapplications due to their high cost and low reproducibility pro-duction of defect-free membrane area, in addition to their lowmodular specific area while they have high thermal, chem-ical, and mechanical resistance and high productivity andseparation performance (Baker, 2004). Mixed matrix mem-branes (MMMs), as new promising approach, were proposedto combine desired properties of these two main types ofthe membrane in order to cover each group shortcomingsby the other group advantages and to pass over the Robesonupper bound limit for different gas separations (Liang et al.,2012; Xiao Yuan Chen et al., 2012). MMMs are composed ofsome incorporated dispersed filler particles, usually inorganicphases, in proper polymer matrices to provide desired separa-
embranes’ gas separation performance prediction using an analytical06.013
better MMMs structural properties for comfortable handling
Elsevier B.V. All rights reserved.

ARTICLE IN PRESSCHERD-1619; No. of Pages 10
2 chemical engineering research and design x x x ( 2 0 1 4 ) xxx–xxx
Table 1 – Various industrial applications of membranesgas separation (Goh et al., 2011a).
Gas separation tasks Application
O2/N2 Oxygen enrichment, inert gas generationH2/hydrocarbon Refinery hydrogen recoveryH2/N2 Ammonia purge gasH2/CO H2/CO ratio adjustment in syngasCO2/hydrocarbon Acid gas treatment, greenhouse gas
captureH2O/hydrocarbon Natural gas dehydrationH2S/hydrocarbon Sour gas treatingHe/hydrocarbon Helium separationHe/hydrocarbon Helium recoveryHydrocarbon/air Hydrocarbon recoveryH2O/air Air dehumidification
0 0.1 0.2 0.3 0.4 0.5 0.6 0.72
3
4
5
6
7
8
9
10
The Filler Particles Loading in the MMMs (Vol. %)
PM
MM (
Bar
rer)
Pc = 10 & P d = 0 Barrer
Fig. 1 – Effect of volumetric impermeable (e.g. Pd = 0) fillerparticles loadings on the MMMs’ permeabilities prediction
matrix begins. In a certain distance far from the filler parti-
(Goh et al., 2011a; Ismail et al., 2011). The incorporated inor-ganic particles are classified into the two main categories ofporous (e.g. zeolites (Jiang et al., 2005; Aroon et al., 2010a,b),carbon molecular sieves (Vu et al., 2003; Rafizah and Ismail,2008), metal organic framework (Zhang et al., 2008; Perez et al.,2009; Basu et al., 2011), carbon nanotubes (Kim et al., 2006;Cong et al., 2007b; Aroon et al., 2010a,b; Goh et al., 2011b, etc.)and nonporous (e.g. silica (Moaddeb and Koros, 1997; Ferrariet al., 2010; Goh et al., 2011a), TiO2 (Xiao et al., 2006; Gohet al., 2011a), fullerene (C60) (Higuchi et al., 2000)). Several fac-tors can affect the structure and consequently gas permeationproperties through the polymer/inorganic MMMs including:(1) polymer and inorganic intrinsic properties, (2) morphologyof MMMs, e.g. shape and size dispersion of the filler parti-cles through polymer matrix, (3) interfacial defects such asvoid formation and the polymer matrix’s chains rigidificationaround the filler particles (if any), and (4) MMMs preparationprocedure (Ahn et al., 2008).
Knowing the transport properties of MMMs constituentsis basic important data for their proper selection and truestructure design to improve their separation performance andconsequently increment of the MMMs competition for cur-rent and potential membrane gas separation. Developmentof proper model(s) for prediction of MMMs different proper-ties, especially those of separation performance, is essentialfor approaching this goal. On the other hand, having of thismodel(s) potentially can reduce necessity of the experimentalmeasurements’ time and money for preparation and eval-uation of different MMMs (Gonzo et al., 2006; Pal, 2008).Many theoretical and empirical predictive models have beenadapted or developed for prediction of MMMs separation per-formance (Pal, 2008; Hashemifard et al., 2010a,b; Shimekitet al., 2011). The most famous model is the Maxwell modelwhich has been developed by Maxwell for prediction of dielec-tric permittivity in 1873 (Hashemifard et al., 2010a,b) and wasadapted for MMMs permeability prediction due to similaritybetween composite thermal/electrical conductivities and thepenetrates permeation through MMMs as follows (Vu et al.,2003; Matteucci et al., 2008; Hashemifard et al., 2010a,b):
Pr = PMMM
Pc= Pd + 2Pc − 2�d(Pc − Pd)
Pd + 2Pc + �d(Pc − Pd)(1)
where Pr is the ratio of MMM permeability (PMMM) to thatof continuous polymer phase (Pc) as (PMMM/Pc), Pd is theincorporated dispersed filler particles, and ϕd is the volumet-
Please cite this article in press as: Bakhtiari, O., Sadeghi, N., Mixed matrix mmodel. Chem. Eng. Res. Des. (2014), http://dx.doi.org/10.1016/j.cherd.2014.
ric filler particles loading. In the case of MMMs containing
using the Maxwell model.
impermeable filler particles (Pd = 0), this model is reduced tothe following equation (Aroon et al., 2010a,b):
Pr = PMMM
Pc= 1 − �d
1 + 0.5�d(2)
According to the Maxwell model for impermeable fillerparticles, MMMs’ permeabilities are decreased as filler parti-cles loadings increases (Fig. 1). However, several researcherswere reported some increment in permeabilities of MMMswith incorporated impermeable filler particles (Moaddeb andKoros, 1997; He et al., 2002; Merkel et al., 2002; Hibshmanet al., 2003; Cong et al., 2007a; Hu et al., 2007). They con-cluded that increasing in the resultant MMMs’ permeabilitiesmay be due to disrupting the polymer chain packing den-sity by adding filler and increment of the matrix polymer’sfree volume, especially in the vicinity of the filler particles. Itseems there is a better explanation for the case and that is thesurface flux on the external surface of the incorporated fillerparticles.
Other models like the Bruggeman and the Pal are alsoemployed to predict MMMs separation performances. Thesemodels can be found elsewhere (Shimekit et al., 2011).
In the current study, an analytical model is developed topredict the MMMs’ permeation with incorporated imperme-able filler particles and it is used to investigate the permeationand concentration distribution through the MMMs with theideal morphological structure.
2. The problem formulation
Considering a spherical filler particle incorporated within apolymeric matrix, it is subjected to the MMMs’ overall perme-ation flux of JMMM in the z-direction, as shown schematicallyin Fig. 2. As the penetrants move through the MMM downwardtoward the spherical particles, they are attracted to the fillerparticle’s surface in its vicinity and adsorbed on its surface.After adsorption of the penetrants on the filler particles sur-face, they diffuse on the filler particle surface more facilitatedthan in the polymer matrix. As they approached to the lowerhalf of the filler particles, desorption process to the polymer
embranes’ gas separation performance prediction using an analytical06.013
cle, penetrants again experience the polymer transfer media

ARTICLE IN PRESSCHERD-1619; No. of Pages 10
chemical engineering research and design x x x ( 2 0 1 4 ) xxx–xxx 3
Fig. 2 – Schematic representation of the proposedtheoretical model for a filler particle incorporated in thep
wmpfieweripTbDrdfff(2
D
wa1ttt
fi
Fig. 3 – Schematic representation of a differential elementin the MMM’s polymer matrix region in the current study.
olymer matrix in the current study.
ith its own transport properties. Therefore the transferedium of penetrants is divided into the three regions: the
olymer matrix, a coating around the filler particle and theller particle’s surface. Each region has its own transport prop-rties. The polymer matrix region is defined as the regionhich is far enough from the filler particles and does not influ-
nce the filler particle – penetrant interactions. The coatingegion is defined as the region where filler particle imposests interaction on the penetrants permeation while its trans-ort properties are the same as the polymer matrix region.his region’s radius, RC, will be determined as discussedelow. The mean filler particles’ radius is rd. A1, A2 and
denote domains of the filler particle region, the coatingegion and the entire matrix, respectively. Thus, the matrixomain is D − (A1 + A2). The coating and matrix regions’ dif-usivities are the same as DP since both of them were maderom the same material of the polymer matrix. The sur-ace diffusivity of penetrants on the filler particle surface, DS
cm2/s), can be estimated by the following correlation (Seader,005):
S = 1.6 × 10⁻² exp
[−0.45(−�Hads)
mRT
](3)
here m is a constant and for conducting adsorbents suchs carbon and for insulating adsorbents are equal to 2 and, respectively, and �Hads, R and T are heat of adsorp-ion, universal gas constant and the filler particle absoluteemperature (is the same as MMM temperature), respec-ively.
In the following sections, proper models will be developed
Please cite this article in press as: Bakhtiari, O., Sadeghi, N., Mixed matrix mmodel. Chem. Eng. Res. Des. (2014), http://dx.doi.org/10.1016/j.cherd.2014.
or each of these three regions. It is worthy to note, accord-ng to the mass conservation, flux of each domain is equal to
MMMs’ flux and following assumptions are made in the modeldevelopment:
1. The filler particles are nonporous, spherical and uniformin size.
2. The filler particles are homogeneously dispersed in thepolymer matrix (e.g. there is no particle agglomeration andno formed voids around them (e.g. surface flux is the samefor all filler particles) in the polymer matrix.
3. There is no interaction between polymer and particles, e.g.no chain rigidification around the filler particles and thecoating region is the same as the polymer matrix region inthe view point of structural properties.
4. The coating and polymer matrix region’s diffusivities aresupposed to be the same.
2.1. The polymer matrix model development
At the first, the matrix region is modeled in order to obtainpenetrants’ concentration gradient in this region. For this pur-pose, the mass balance equation in Cartesian coordinates isconsidered, as shown schematically in Fig. 3. In the steadystate penetrants’ permeation, it can be written:
(JP = JMMM)A∣∣z+dz
− JPA|z = 0 and JP = DP∂CP
∂z(DP
∂Cm
∂z
)A
∣∣∣z+dz
−(
DP∂Cm
∂z
)A
∣∣∣z
= 0 ⇒ ∂2CP
∂z2= 0
⇒ CP = az + b
(4)
where JMMM is the MMM’s permeability, A is the element’s(MMM’s) diffusion area; JP, CP and DP are flux, concentrationand diffusivity of the penetrant(s) in the polymer matrix region(which were assumed to be constant in all the directions),respectively, and a and b are integration constants which aredetermined by two boundary conditions as the follows:
at z = 0 :
⎧⎨⎩
B.C.1 : CP = CM,F
B.C.2 : JMMM = DP∂CP
∂z⇒ ∂CP
∂z= JMMM
DP
(5)
where CM,F is the penetrant concentration on the membranefeed side and can be determined by employing a proper mod-
embranes’ gas separation performance prediction using an analytical06.013
els such as Henry’s law.

ARTICLE IN PRESSCHERD-1619; No. of Pages 10
4 chemical engineering research and design x x x ( 2 0 1 4 ) xxx–xxx
Fig. 4 – Concentration gradient in the polymer matrixregion of PMP-Fumed silica (FS) MMM’s structure. Origin ofz axis is located in the feed side of the MMM, Henry’sconstant, feed side and permeate side pressures, MMM’sthickness and permeability, feed concentration andpenetrant’s diffusivity in the polymer matrix thickness are8.032 × 10−4 mol/m3 polymer Pa, 1134.56, 101.3 kPa, 40 �m,730 Barrer, 911.28 mol/m3, 5.912 × 10⁻⁹ m2/s, respectively(Merkel et al., 2002).
2 s Pa
Fig. 5 – Schematic representation of a differential elementin the coating region of MMM in the current study.
Before applying the second boundary condition of Eq. (5),the JMMM should be defined. JMMM can be calculated by conver-sion of the MMM’s permeability, PMMM, as the follows:
JMMM (mol/m2 s) = [PMMM(Barrer) × ((3.348 × 10⁻¹⁶ mol m/ml (m)
where �p is the pressure gradient over the MMM and l isMMM’s thickness. Determination of the penetrant(s) con-centration profile in the polymer matrix region requiressubstitution of Eqs. (5) and (6) into Eq. (4) which results in thefollows equation:
CP = CM,F +(
3.348 × 10⁻¹⁶ PMMM�p/l
DP
)z (7)
As it can be seen, CP drops linearly as the penetrants pen-etrate downward in the z direction. In another words, asthe penetrant(s) diffuses downward in the MMM’s body, itsconcentration drops linearly to some certain distance in thevicinity of the filler particle. The linear concentration gradi-ent in the polymer matrix region results in constant flux inthe polymer matrix region. By the constants and parame-ters reported by Merkel et al. (2002) for PMP/fumed silica (FS)MMMs, the polymer matrix region’s concentration profile isdetermined and shown in Fig. 4. As the penetrant(s) diffusesdownward in the polymer matrix, it becomes closer to thecoating region, as defined above. This region’s model will bedeveloped in the following section.
2.2. The coating region’s model development
The mass transfer in the coating region can be projected as
Please cite this article in press as: Bakhtiari, O., Sadeghi, N., Mixed matrix mmodel. Chem. Eng. Res. Des. (2014), http://dx.doi.org/10.1016/j.cherd.2014.
two streams: one of them moves toward the filler particlesurface to be adsorbed and diffuse on its surface and then
)/1 Barrer) × �p (Pa)](6)
diffuse on the filler particle surface as surface flux and anotherturns around the filler particle in the coating region. These twostreams are shown schematically in Fig. 5.
Steady state material balance in the coating region can bewritten as the follows:
Jc,r2�r2 sin �d�∣∣r+dr
− Jc,r2�r2 sin �d�∣∣r
+ Jc,�2�r sin �dr∣∣�− Jc,�2�r sin �dr
∣∣�+d�
= 0 (8)
Jc,r = DP∂Ccoat
∂rand Jc,� = −DP
r
∂Ccoat
∂�(9)
Combining of Eqs. (8) and (9) results in the following expres-sion:
∂2Ccoat
∂r2+ 2
r
∂Ccoat
∂r+ 1
r2 sin �
∂
∂�
(∂Ccoat
∂�sin �
)= 0 (10)
This partial differential equation can be solved using theseparation of variables method. Its solution is given by thefollowing equation:
Ccoat = C0 +(
ar + b
r2
)cos � (11)
C0, a and b are the integration constants and are determinedby applying the boundary conditions of this partial differentialequation as the follows:
B.C.1 : at � = 0 and r = RC : Ccoat = Cp (12)
B.C.2 : at � = �/2 and r = RC : Ccoat = CP − (RC)∂CP
∂z (13)
embranes’ gas separation performance prediction using an analytical06.013
B.C.3 : at r = RC : JPA = JcoatA′

ARTICLE IN PRESSCHERD-1619; No. of Pages 10
chemical engineering research and design x x x ( 2 0 1 4 ) xxx–xxx 5
Fig. 6 – Concentration gradient in the polymer matrixregion of PMP-Fumed silica (FS) MMM’s structure. Origin ofz axis is located in the feed side of the MMM. Henry’sconstant, feed side and permeate side pressures, MMM’sthickness and permeability, feed concentration, penetrant’sdiffusivity in the polymer matrix, filler and coating radiusare 8.032 × 10⁻⁴ mol/m3 polymer Pa, 1134.56, 101.3 kPa,40 �m, 730 Barrer, 911.28 mol/m3, 5.912 × 10⁻⁹ m2/s,65 × 10−10 m, 65 × 10−9 m, respectively (Merkel et al., 2002).
w
A
Tpcsci
⎧⎪⎪⎪⎪⎪⎪⎨⎪⎪⎪⎪⎪⎪⎩w
(o(
Ats
Fig. 7 – Schematic representation of flux elements in adifferential element over the filler particle surface insideMMM in the current study.
Filler par� cle
⁄
⁄
⁄
| ⁄
here A = �R2C
′ =∫ �/2
0
2�R2C sin �d� (14)
he third boundary condition arises from the fact that allassed penetrates through the upper surface of an imaginedylinder with radius of RC, will pass through the upper half-phere of the coating region. After applying these boundaryonditions to the above mentioned differential equation, itsntegration constants obtained as:
C0 = Cp + RC
(JMMM
DP
)
a = −13
(JMMM
DP
)
b = −23
R3C
(JMMM
DP
)(15)
here JMMM = 3.348 × 10⁻¹⁶ PMMM �p/lFinally, by substitution of integration constants from Eq.
15) into Eq. (11), the coating region concentration will bebtained and two projected elements of the coat region’s flux
Eq. (9)) can be written as the follows:
Jc,r = DP∂Ccoat
∂r= JMMM
3
(4
R3C
r3− 1
)cos �
Jc,� = −DP
r
∂Ccoat
∂�= − JMMM
3
(2
R3C
r3+ 1
)sin �
(16)
pplying these equations to the reported data by Merkel et al.,
Please cite this article in press as: Bakhtiari, O., Sadeghi, N., Mixed matrix mmodel. Chem. Eng. Res. Des. (2014), http://dx.doi.org/10.1016/j.cherd.2014.
he coating region concentration profile can be obtained ashown be color image of Fig. 6.
2.3. The filler particle model development
Mass transfer flux on the filler particle surface vector has twoelements: one is tangentially diffuses due to the surface flux,J′, and another normally come from the coating region, J, tobe adsorbed and diffuse on the filler particles surface. Theseelements of filler particle are shown schematically in Fig. 7.
Writing material balance on the selected element in Fig. 7results in the following equation:
J′in
2�rd sin �∣∣�− J′out2�rd sin �
∣∣�+d�
+ Jc,r2�r2d
sin �d� = 0
J′in
sin �∣∣�− J′out sin �
∣∣�+d�
+ Jc,rrd sin �d� = 0
d(J′ sin �)d�
= Jc,rrd sin � = JMMM
3
(4
R3C
r3d
− 1
)cos �rd sin �
⇒ J′ sin � = − JMMMrd
12
(4
R3C
r3d
− 1
)cos 2� + K
(17)
embranes’ gas separation performance prediction using an analytical06.013
Fig. 8 – Cross sectional area of a filler in expose to masstransfer from polymer matrix.

ARTICLE IN PRESSCHERD-1619; No. of Pages 10
6 chemical engineering research and design x x x ( 2 0 1 4 ) xxx–xxx
Table 2 – Experimentally measured variables for different MMMs used for gas separation.
MMM Filler loading(vol. fraction)
Permeability (Barrer) Ref.
PCO2 PN2 PC4H10 PCH4 PH2
PMP/fumed silica (FS) 0 821.192 5710.91 He et al. (2002)0.057 860.927 9675.880.1 1198.68 8848.570.19 1847.68 15,730.10.22 2284.77 25,361.50.25 2655.63
PMP/fumed silica (FS) 0 730 Merkel et al. (2002)0.06 7520.105 1057.20.191 1686.30.225 20440.262 2489.3
PTMSP/fumed silica (FS) 0 12,000 26,000 Kono et al. (2007)0.036 12,000 27,0000.127 14,000 34,0000.254 21,000 51,000
ETPU/SiO2 0 0.17 Hassanajili et al.(2013)
0.028 0.250.057 0.320.088 0.38
ESPU/SiO2 0 1.88 Hassanajili et al.(2013)
0.026 4.490.054 5.660.084 8.54
In order to obtain the integration constant, considering theschematic representation of Fig. 8, it can be written:
�R2CJMMM = 2�rd J′
∣∣�=�/2
+∫ RC
rd
2�r(Jc,� |�=�/2) dr
�R2CJMMM = 2�rd
(JMMMrd
12
(4
R3C
r3d
− 1
)+ K
)
+∫ RC
rd
2�r
(− JMMM
3
(2
R3C
r3+ 1
))dr
⇒ K = rdJMMM
12
[(RC
rd
)3− 1
4
]
(18)
On the other hand, surface flux can be considered as the sur-face concentration gradient multiply by the filler particle’sdiffusivity. Using this relation, a pseudo adsorption loading,q, can be determined as:
J′ = −Ds∂q
rd∂�⇒ q =
(JMMMrd
2
12Ds
) [4(
RC
rd
)3− 1
]
×(
2(tan(�/2))2
1 + (tan(�/2))2− cos �
)(19)
Having in hand the calculated surface flux, now using the basicconcepts of flux and permeability relation, the filler particlespermeability, Pd, can be obtained as the follows:
Please cite this article in press as: Bakhtiari, O., Sadeghi, N., Mixed matrix mmodel. Chem. Eng. Res. Des. (2014), http://dx.doi.org/10.1016/j.cherd.2014.
Pd (Barrer) = 2.98 × 10¹⁵ J′(mol/m s) · l (m)b (m) · �p (Pa)
(20)
where b is inverse of the filler particles specific area. For theMMM volume of V (m3), filler radius and loading of rd(m) andϕd, respectively, and filler particles count of n, it can be shownthat b is given by the following expressions:
b (m3/m2) = (4/3)�nr3d
4�nrd2
⇒ b = 3.33 × 10⁻¹ rd (21)
Now Eq. (20) can be rewritten as the follows:
⇒ Pd(Barrer) = 8.96 × 10¹⁵ J′(mol/m s) · l (m)rd(m) · �p (Pa)
(22)
As the filler particles surface flux (e.g. permeability) is deter-mined, employing a proper predictive MMM’s permeabilitymodel, e.g. the most famous of Maxwell one (Eq. (1)). Theonly challenging parameter is the filler particles surface per-meabilities where can be determined based on the modeldeveloped in the current study. Some experimentally mea-sured MMMs’ permeabilities were gathered from the properpapers (Tables 2 and 3) and employed for validation of thedeveloped model in the current study.
It is worthy to note that, the systematic approach toevaluate the surface flux is to use the penetrant(s) surfaceconcentration and their surface diffusivity where can be deter-mined by Eq. (3). However, the drawback of this approach isthat there is no mean to measure the filler particles surfaceconcentration within the MMM structure and their individu-
embranes’ gas separation performance prediction using an analytical06.013
ally available adsorption isotherms cannot be used directly toestimate their surface concentration in the MMMs’ structure.

Please cite this article in press as: Bakhtiari, O., Sadeghi, N., Mixed matrix mmodel. Chem. Eng. Res. Des. (2014), http://dx.doi.org/10.1016/j.cherd.2014.
ARTICLE IN PRESSCHERD-1619; No. of Pages 10
chemical engineering research and design x x x ( 2 0 1 4 ) xxx–xxx 7
Tabl
e
3
–
Exp
erim
enta
l con
dit
ion
s
emp
loye
d
in
the
MM
Ms
per
mea
bili
ties
mea
sure
men
t
use
d
for
the
pre
sen
t
dev
elop
ed
mod
el
vali
dat
ion
.
No.
Gas
eou
s
pen
tran
t
Ran
ge
of
fill
erp
arti
cles
load
ing
Typ
e
of
fill
er
par
ticl
esor
pol
ymer
mat
rix
Feed
pre
ssu
re(k
Pa)
Perm
eate
pre
ssu
re
(kPa
)Fi
ller
rad
ius
(Å)
Mem
bran
eth
ickn
ess
(�m
)
1
N2
(He
et
al.,
2002
)0–
0.25
Fum
ed
sili
ca
(FS)
344.
560
65
125
PMP
2
C4H
10(H
e
et
al.,
2002
)0–
0.25
Fum
ed
sili
ca
(FS)
344.
560
65
125
PMP
3
CH
4(M
erke
l et
al.,
2002
)0–
0.26
2Fu
med
sili
ca
(FS)
1134
.56
101.
365
45PM
P4
H2
(Kon
o
et
al.,
2007
)0–
0.25
4Fu
med
sili
ca
(FS)
101.
34.
41
×
10−5
65
100
PTM
SP5
N2
(Kon
o
et
al.,
2007
)
0–0.
254
Fum
ed
sili
ca
(FS)
101.
3
4.41
×
10−5
65
100
PTM
SP6
CH
4(H
assa
naj
ili e
t
al.,
2013
)
0–0.
088
SiO
260
7.8
0
70
80ET
PU7
CO
2(H
assa
naj
ili e
t
al.,
2013
)
0–0.
084
SiO
260
7.8
0
70
80ES
PU
0 10 20 30 40 50 60 70 80 90 10020
25
30
35
40
45
50
R / rd
% A
AR
E
Fig. 9 – AARE of PMP/FS MMMs’ (He et al., 2002) N2
predicted permeabilities vs. R/rd ratio.
In the next section, the impact of calculated filler par-ticles surface permeabilities’ introduction into the MMMs’permeability predictive models will be discussed for the gath-ered MMMs’ experimental data. The optimization criteria ofprediction accuracy of the current developed model is abso-lute average relative error percentage (AARE %) of predictedMMMs’ permeabilities by the following equation (Shimekitet al., 2010):
AARE % = 100N
N∑i=1
∣∣∣∣Pcali
− Pexpi
Pexpi
∣∣∣∣ (23)
3. Result and discussion
The current developed model’s prediction accuracy was eval-uated for prediction of experimentally measured MMMs’permeabilities as reported in Tables 2 and 3. One of the mainsteps in the current developed model is to determine the coat-ing region’s radius (RC). This radius is determined in a mannerthat minimizes AAREs of the predicted MMMs’ permeabilities,e.g. a parameter of the main parameter of the current devel-oped model. As it can be seen in Fig. 9, AAREs of predictedMMMs’ permeabilities for N2 in PMP-FS MMMs (He et al., 2002)is reducing till the R/rd ratio of around 10. Doing this for othergathered MMMs’ permeabilities data (Merkel et al., 2002; Konoet al., 2007), it was found the R/rd ratio of 10 is good enough tominimize calculated AAREs. Then, this ratio was selected as10 throughout the current study.
N2 permeability through PMP-FS MMMs (He et al., 2002) waspredicted using the current developed approach for the fillerparticles’ permeabilities and the Maxwell model. The resultsare presented in Table 4. In order to investigate the impact ofthe filler particles’ permeabilities introduction to the Maxwellmodel, this model was used two times: the first time with theso-called impermeable filler particles, e.g. Pd = 0 and the sec-ond time with that of estimated in the current study. As it canbe seen, the Maxwell model AAREs is reduced considerablyfrom 55.01 to 23.71% after introduction of current estimated Pd.He et al. (2002) attributed the MMMs’ gas permeabilities incre-ment to increase in the polymer matrix’s free volume resulted
embranes’ gas separation performance prediction using an analytical06.013
by to incorporation of fumed silica particle within it. However,

Please cite
this
article in
press
as: B
akhtiari,
O.,
Sadegh
i, N
., M
ixed m
atrix m
embran
es’ gas
separation
perform
ance
pred
iction u
sing
an an
alyticalm
odel.
Ch
em.
Eng.
Res.
Des.
(2014), h
ttp://d
x.doi.org/10.1016/j.ch
erd.2014.06.013
AR
TIC
LE
IN P
RE
SS
CH
ERD
-1619;
No.
of Pages
10
8
chem
ical
eng
ineerin
g resea
rch a
nd
desig
n
x x
x
( 2
0 1
4 )
xxx–xxx
Table 4 – Summary of the estimated filler particles’ permeabilities and AAREs of MMMs’ permeabilities prediction using different predictive models.
MMMs Penetrant Filler loading (vol.fraction)
Current estimatedPd (Barrer)
The Maxwellmodel AARE (%)
The Bruggemanmodel AARE (%)
The Pal modelAARE (%)
Ref.
Pd = 0 Using the currentestimated Pd
Pd = 0 Using the currentestimated Pd
Pd = 0 Using the currentestimated Pd
PMP-FS N2
0
2213.12 55.01 23.71 55.38 17.45 60.28 31.55 He et al. (2002)
0.0570.10.190.220.25
PMP-FS C4H10
0
17,084.00 56.73 28.62 56.98 24.54 60.93 37.46 He et al. (2002)0.0570.10.190.22
PMP-FS CH4
0
66,291.67 68.10 43.50 55.73 17.78 60.73 32.19Merkel et al.(2002)
0.060.1050.1910.2250.262
PTMSP-FS H2
0
42,022.50 37.43 16.77 37.87 15.00 43.72 8.14Kono et al.(2007)
0.0360.1270.254
PTMSP-FS N2
0
17,634.50 32.37 11.72 32.87 25.94 39.35 6.28Kono et al.(2007)
0.0360.1270.254
ETPU-SiO2 CH4
0
475.13 49 35.23 49.07 34.55 51.21 39.87Hassanajiliet al. (2013)
0.0280.0570.088
Average of the AARE (%) 52.65 31.74 51.12 28.22 55.33 31.50
ARTICLE IN PRESSCHERD-1619; No. of Pages 10
chemical engineering research and design x x x ( 2 0 1 4 ) xxx–xxx 9
0 0.05 0.1 0.15 0.2 0.25 0.3 0.350
500
1000
1500
2000
2500
3000
φd (Vol%)
CH
4 Per
mea
bilit
y (B
arre
r)
Experimental
The Maxwell Model(Pd = 0)
The Bruggeman Model(Pd = 0)
The Pal Model (Pd = 0)
Modified Maxwell Model
Modified Bruggeman Model
Modified Pal Model
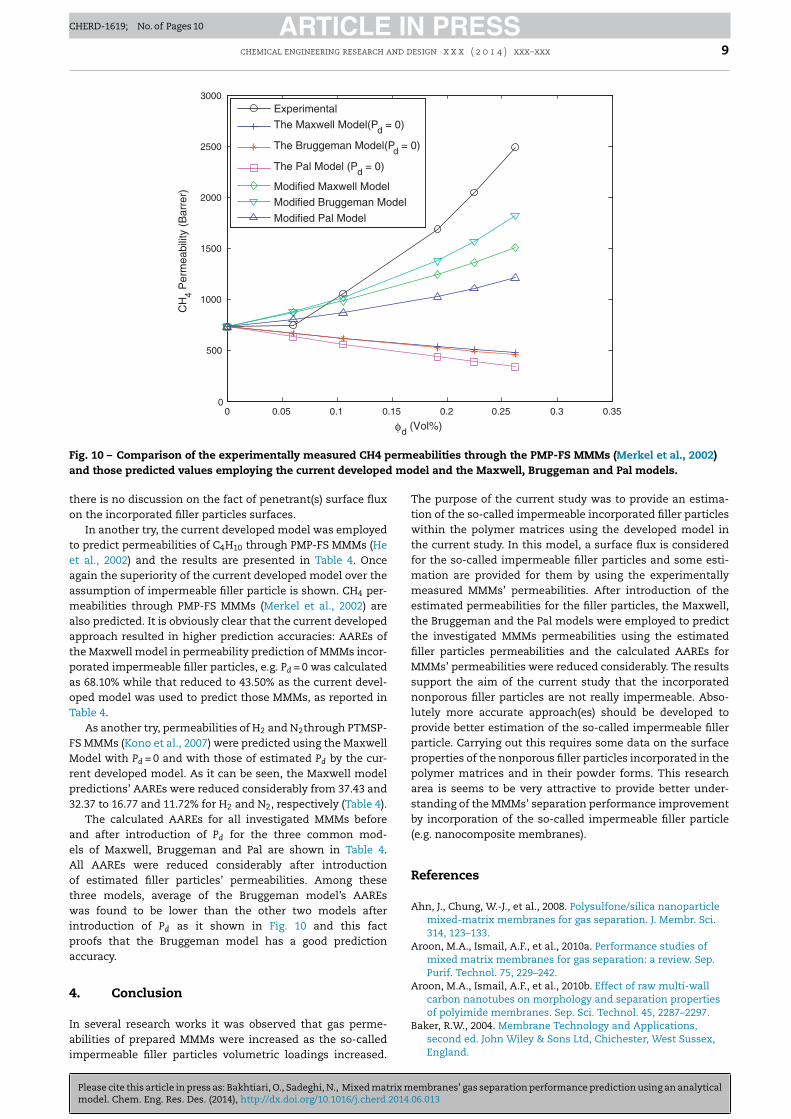
Fig. 10 – Comparison of the experimentally measured CH4 permeabilities through the PMP-FS MMMs (Merkel et al., 2002)a mo
to
teaamaatpaoT
FMrp3
aeAotwipa
4
Iai
nd those predicted values employing the current developed
here is no discussion on the fact of penetrant(s) surface fluxn the incorporated filler particles surfaces.
In another try, the current developed model was employedo predict permeabilities of C4H10 through PMP-FS MMMs (Het al., 2002) and the results are presented in Table 4. Oncegain the superiority of the current developed model over thessumption of impermeable filler particle is shown. CH4 per-eabilities through PMP-FS MMMs (Merkel et al., 2002) are
lso predicted. It is obviously clear that the current developedpproach resulted in higher prediction accuracies: AAREs ofhe Maxwell model in permeability prediction of MMMs incor-orated impermeable filler particles, e.g. Pd = 0 was calculateds 68.10% while that reduced to 43.50% as the current devel-ped model was used to predict those MMMs, as reported inable 4.
As another try, permeabilities of H2 and N2through PTMSP-S MMMs (Kono et al., 2007) were predicted using the Maxwellodel with Pd = 0 and with those of estimated Pd by the cur-
ent developed model. As it can be seen, the Maxwell modelredictions’ AAREs were reduced considerably from 37.43 and2.37 to 16.77 and 11.72% for H2 and N2, respectively (Table 4).
The calculated AAREs for all investigated MMMs beforend after introduction of Pd for the three common mod-ls of Maxwell, Bruggeman and Pal are shown in Table 4.ll AAREs were reduced considerably after introductionf estimated filler particles’ permeabilities. Among thesehree models, average of the Bruggeman model’s AAREsas found to be lower than the other two models after
ntroduction of Pd as it shown in Fig. 10 and this factroofs that the Bruggeman model has a good predictionccuracy.
. Conclusion
n several research works it was observed that gas perme-
Please cite this article in press as: Bakhtiari, O., Sadeghi, N., Mixed matrix mmodel. Chem. Eng. Res. Des. (2014), http://dx.doi.org/10.1016/j.cherd.2014.
bilities of prepared MMMs were increased as the so-calledmpermeable filler particles volumetric loadings increased.
del and the Maxwell, Bruggeman and Pal models.
The purpose of the current study was to provide an estima-tion of the so-called impermeable incorporated filler particleswithin the polymer matrices using the developed model inthe current study. In this model, a surface flux is consideredfor the so-called impermeable filler particles and some esti-mation are provided for them by using the experimentallymeasured MMMs’ permeabilities. After introduction of theestimated permeabilities for the filler particles, the Maxwell,the Bruggeman and the Pal models were employed to predictthe investigated MMMs permeabilities using the estimatedfiller particles permeabilities and the calculated AAREs forMMMs’ permeabilities were reduced considerably. The resultssupport the aim of the current study that the incorporatednonporous filler particles are not really impermeable. Abso-lutely more accurate approach(es) should be developed toprovide better estimation of the so-called impermeable fillerparticle. Carrying out this requires some data on the surfaceproperties of the nonporous filler particles incorporated in thepolymer matrices and in their powder forms. This researcharea is seems to be very attractive to provide better under-standing of the MMMs’ separation performance improvementby incorporation of the so-called impermeable filler particle(e.g. nanocomposite membranes).
References
Ahn, J., Chung, W.-J., et al., 2008. Polysulfone/silica nanoparticlemixed-matrix membranes for gas separation. J. Membr. Sci.314, 123–133.
Aroon, M.A., Ismail, A.F., et al., 2010a. Performance studies ofmixed matrix membranes for gas separation: a review. Sep.Purif. Technol. 75, 229–242.
Aroon, M.A., Ismail, A.F., et al., 2010b. Effect of raw multi-wallcarbon nanotubes on morphology and separation propertiesof polyimide membranes. Sep. Sci. Technol. 45, 2287–2297.
Baker, R.W., 2004. Membrane Technology and Applications,
embranes’ gas separation performance prediction using an analytical06.013
second ed. John Wiley & Sons Ltd, Chichester, West Sussex,England.

ARTICLE IN PRESSCHERD-1619; No. of Pages 10
10 chemical engineering research and design x x x ( 2 0 1 4 ) xxx–xxx
metal-organic framework Cu–BPY–HFS. J. Membr. Sci. 313,
Basu, S., Cano-Odena, A., et al., 2010. AsymmetricMatrimid®/[Cu3(BTC)2] mixed-matrix membranes for gasseparations. J. Membr. Sci. 362, 478–487.
Basu, S., Cano-Odena, A., et al., 2011. MOF-containingmixed-matrix membranes for CO2/CH4 and CO2/N2 binary gasmixture separations. Sep. Purif. Technol. 81, 31–40.
Budiyono, Kusworo, T.D., Ismail, A.F., Widiasa, I.N., Johari, S.,Sunarso, 2009. Synthesis characterization of polyimide-zeolitemixed matrix membrane for biogas purification. Int. J. BasicAppl. Sci. 10, 7.
Chung, T.-S., Jiang, L.Y., et al., 2007. Mixed matrix membranes(MMMs) comprising organic polymers with dispersedinorganic fillers for gas separation. Progr. Polym. Sci. 32,483–507.
Cong, H., Hu, X., et al., 2007a. Brominatedpoly(2,6-diphenyl-1,4-phenylene oxide) and its silicananocomposite membranes for gas separation. Ind. Eng.Chem. Res. 46, 2567–2575.
Cong, H., Zhang, J., et al., 2007b. Carbon nanotube compositemembranes of brominated poly(2,6-diphenyl-1,4-phenyleneoxide) for gas separation. J. Membr. Sci. 294,178–185.
Ferrari, M.C., Galizia, M., et al., 2010. Gas and vapor transport inmixed matrix membranes based on amorphous Teflon AF1600and AF2400 and fumed silica. Ind. Eng. Chem. Res. 49,11920–11935.
Goh, P.S., Ismail, A.F., et al., 2011a. Recent advances of inorganicfillers in mixed matrix membrane for gas separation. Sep.Purif. Technol. 81, 243–264.
Goh, P.S., Ng, B.C., et al., 2011b. Effect of dispersed multi-walledcarbon nanotubes on mixed matrix membrane for O2/N2
separation. Sep. Sci. Technol. 46, 1250–1261.Gonzo, E.E., Parentis, M.L., et al., 2006. Estimating models for
predicting effective permeability of mixed matrixmembranes. J. Membr. Sci. 277, 46–54.
Hashemifard, S.A., Ismail, A.F., et al., 2010a. A new theoretical gaspermeability model using resistance modeling for mixedmatrix membrane systems. J. Membr. Sci. 350,259–268.
Hashemifard, S.A., Ismail, A.F., et al., 2010b. Prediction of gaspermeability in mixed matrix membranes using theoreticalmodels. J. Membr. Sci. 347, 53–61.
Hassanajili, S., Masoudi, E., et al., 2013. Mixed matrix membranesbased on polyetherurethane and polyesterurethanecontaining silica nanoparticles for separation of CO2/CH4
gases. Sep. Purif. Technol. 116, 1–12.He, Z., Pinnau, I., et al., 2002. Nanostructured
poly(4-methyl-2-pentyne)/silica hybrid membranes for gasseparation. Desalination 146, 11–15.
Hibshman, C., Cornelius, C.J., et al., 2003. The gas separationeffects of annealing polyimide–organosilicate hybridmembranes. J. Membr. Sci. 211, 25–40.
Higuchi, A., Agatsuma, T., et al., 2000. Preparation and gaspermeation of immobilized fullerene membranes. J. Appl.Polym. Sci. 77, 529–537.
Hu, X., Cong, H., et al., 2007. Nanocomposite membranes for CO2
separations: silica/brominated poly(phenylene oxide). Ind.Eng. Chem. Res. 46, 1547–1551.
Ismail, A.F., Hashemifard, S.A., et al., 2011. Facilitated transporteffect of Ag+ ion exchanged halloysite nanotubes on the
Please cite this article in press as: Bakhtiari, O., Sadeghi, N., Mixed matrix mmodel. Chem. Eng. Res. Des. (2014), http://dx.doi.org/10.1016/j.cherd.2014.
performance of polyetherimide mixed matrix membrane forgas separation. J. Membr. Sci. 379, 378–385.
Jiang, L.Y., Chung, T.S., et al., 2005. Fundamental understandingof nano-sized zeolite distribution in the formation of themixed matrix single- and dual-layer asymmetric hollow fibermembranes. J. Membr. Sci. 252, 89–100.
Kim, S., Pechar, T.W., et al., 2006. Poly(imide siloxane) and carbonnanotube mixed matrix membranes for gas separation.Desalination 192, 330–339.
Kono, T., Hu, Y., Masuda, T., Tanaka, K., Priestley, R.D., Freeman,B.D., 2007. Effect of fumed silica nanoparticles on the gaspermeation properties of substituted polyacetylenemembranes. Polym. Bull. 58, 995–1003.
Liang, C.-Y., Uchytil, P., et al., 2012. A comparison on gasseparation between PES (polyethersulfone)/MMT(Na-montmorillonite) and PES/TiO2 mixed matrixmembranes. Sep. Purif. Technol. 92, 57–63.
Matteucci, S., Kusuma, V.A., et al., 2008. Gas transport in TiO2
nanoparticle-filled poly(1-trimethylsilyl-1-propyne). J. Membr.Sci. 307, 196–217.
Merkel, T.C., Freeman, B.D., et al., 2002. Sorption, transport, andstructural evidence for enhanced free volume inpoly(4-methyl-2-pentyne)/fumed silica nanocompositemembranes. Chem. Mater. 15, 109–123.
Moaddeb, M., Koros, W.J., 1997. Gas transport properties of thinpolymeric membranes in the presence of silicon dioxideparticles. J. Membr. Sci. 125, 143–163.
Pal, R., 2008. Permeation models for mixed matrix membranes. J.Colloid Interface Sci. 317, 191–198.
Perez, E.V., Balkus Jr., K.J., et al., 2009. Mixed-matrix membranescontaining MOF-5 for gas separations. J. Membr. Sci. 328,165–173.
Rafizah, W.A.W., Ismail, A.F., 2008. Effect of carbon molecularsieve sizing with poly(vinyl pyrrolidone) K-15 on carbonmolecular sieve–polysulfone mixed matrix membrane. J.Membr. Sci. 307, 53–61.
Robeson, L.M., 1991. Correlation of separation factor versuspermeability for polymeric membranes. J. Membr. Sci. 62,165–185.
Seader, J.D., Henley, E.J., 2005. Separation Process Principles,second ed. John Wiley & Sons, Inc, Hoboken, New Jersey, USA.
Shimekit, B., Mukhtar, H., Maitra, S., 2010. Comparison ofpredictive models for relative permeability of CO2 inMatrimid-carbon molecular sieve mixed matrix membrane. J.Appl. Sci. 10, 1204–1211.
Shimekit, B., Mukhtar, H., et al., 2011. Prediction of the relativepermeability of gases in mixed matrix membranes. J. Membr.Sci. 373, 152–159.
Vu, D.Q., Koros, W.J., et al., 2003. Mixed matrix membranes usingcarbon molecular sieves: II. Modeling permeation behavior. J.Membr. Sci. 211, 335–348.
Xiao, Y., Yu Wang, K., et al., 2006. Evolution of nano-particledistribution during the fabrication of mixed matrix-polyimidehollow fiber membranes. Chem. Eng. Sci. 61, 6228–6233.
Xiao Yuan Chen, O.G.N., Rodrigue, D., Kaliaguine, S., 2012. Mixedmatrix membranes of aminosilanes grafted FAU/EMT zeoliteand cross-linked polyimide for CO2/CH4 separation. Polymer53, 3269–3280.
Zhang, Y., Musselman, I.H., et al., 2008. Gas permeabilityproperties of Matrimid® membranes containing the
embranes’ gas separation performance prediction using an analytical06.013
170–181.
Copyright © 2022 FDOKUMEN