Mismatch between poor fetal growth and rapid postnatal ...
13
Risk Factors for Insulin Resistance and Diabetes Mismatch between poor fetal growth and rapid postnatal weight gain in the first 2 years of life is associated with higher blood pressure and insulin resistance without increased adiposity in childhood: the GUSTO cohort study Yi Ying Ong, 1 Suresh Anand Sadananthan, 2 Izzuddin M Aris , 3 Mya Thway Tint, 2,4 Wen Lun Yuan, 1 Jonathan Y Huang , 2 Yiong Huak Chan, 5 Sharon Ng, 4 See Ling Loy, 2,6,7 Sendhil S Velan, 2,8 Marielle V Fortier, 2,9 Keith M Godfrey, 10 Lynette Shek, 1,2,11 Kok Hian Tan, 7,12 Peter D Gluckman, 2,13 Fabian Yap, 7,14 Jonathan Tze Liang Choo, 14 Lieng Hsi Ling, 15 Karen Tan, 2,16 Li Chen, 2 Neerja Karnani, 2 Yap-Seng Chong, 2,4 Johan G Eriksson, 2,4 Mary E Wlodek, 2,17 Shiao-Yng Chan, 2,4 Yung Seng Lee 1,2,11† and Navin Michael 2† * 1 Department of Pediatrics, Yong Loo Lin School of Medicine, National University of Singapore, Singapore, Singapore, 2 Singapore Institute for Clinical Sciences, Agency for Science, Technology, and Research, Singapore, Singapore, 3 Division of Chronic Disease Research Across the Lifecourse, Department of Population Medicine, Harvard Medical School and Harvard Pilgrim Health Care Institute, Boston, MA, USA, 4 Department of Obstetrics and Gynaecology, Yong Loo Lin School of Medicine, National University of Singapore, Singapore, Singapore, 5 Biostatistics Unit, Yong Loo Lin School of Medicine, National University of Singapore, Singapore, Singapore, 6 Department of Reproductive Medicine, KK Women’s and Children’s Hospital, Singapore, Singapore, 7 Duke-NUS Medical School, Singapore, Singapore, 8 Singapore Bioimaging Consortium, Agency for Science Technology and Research, Singapore, Singapore, 9 Department of Diagnostic and Interventional Imaging, KK Women’s and Children’s Hospital, Singapore, Singapore, 10 MRC Lifecourse Epidemiology Unit and NIHR Southampton Biomedical Research Centre, University of Southampton and University Hospital Southampton NHS Foundation Trust, Southampton, UK, 11 Department of Pediatrics, Khoo Teck Puat-National University Children’s Medical Institute, National University Hospital, National University Health System, Singapore, Singapore, 12 Department of Maternal Fetal Medicine, KK Women’s and Children’s Hospital, Singapore, Singapore, 13 Liggins Institute, University of Auckland, Auckland, New Zealand, 14 Department of Pediatrics, KK Women’s and Children’s Hospital, Singapore, Singapore, 15 Department of Cardiology, National University Heart Centre, Singapore, Singapore, 16 Molecular Diagnosis Centre, Department of Laboratory Medicine, National University Health System, Singapore, Singapore and 17 Department of Physiology, University of Melbourne, Melbourne, VIC, Australia † Joint last authors. *Corresponding author. Brenner Centre for Molecular Medicine, 30 Medical Drive, Singapore 117609, Singapore. E-mail: [email protected] Editorial decision 26 June 2020; Accepted 20 July 2020 V C The Author(s) 2020; all rights reserved. Published by Oxford University Press on behalf of the International Epidemiological Association 1591 IEA International Epidemiological Association International Journal of Epidemiology, 2020, 1591–1603 doi: 10.1093/ije/dyaa143 Advance Access Publication Date: 20 August 2020 Original article Downloaded from https://academic.oup.com/ije/article/49/5/1591/5897702 by guest on 04 July 2022
-
Upload
khangminh22 -
Category
Documents
-
view
2 -
download
0
Transcript of Mismatch between poor fetal growth and rapid postnatal ...
Risk Factors for Insulin Resistance and Diabetes
Mismatch between poor fetal growth and rapid
postnatal weight gain in the first 2 years of life
is associated with higher blood pressure and
insulin resistance without increased adiposity in
childhood: the GUSTO cohort study
Yi Ying Ong,1 Suresh Anand Sadananthan,2 Izzuddin M Aris ,3
Mya Thway Tint,2,4 Wen Lun Yuan,1 Jonathan Y Huang ,2
Yiong Huak Chan,5 Sharon Ng,4 See Ling Loy,2,6,7 Sendhil S Velan,2,8
Marielle V Fortier,2,9 Keith M Godfrey,10 Lynette Shek,1,2,11
Kok Hian Tan,7,12 Peter D Gluckman,2,13 Fabian Yap,7,14 Jonathan Tze
Liang Choo,14 Lieng Hsi Ling,15 Karen Tan,2,16 Li Chen,2 Neerja Karnani,2
Yap-Seng Chong,2,4 Johan G Eriksson,2,4 Mary E Wlodek,2,17
Shiao-Yng Chan,2,4 Yung Seng Lee 1,2,11† and Navin Michael 2†*
1Department of Pediatrics, Yong Loo Lin School of Medicine, National University of Singapore, Singapore,
Singapore, 2Singapore Institute for Clinical Sciences, Agency for Science, Technology, and Research,
Singapore, Singapore, 3Division of Chronic Disease Research Across the Lifecourse, Department of
Population Medicine, Harvard Medical School and Harvard Pilgrim Health Care Institute, Boston, MA, USA,4Department of Obstetrics and Gynaecology, Yong Loo Lin School of Medicine, National University of
Singapore, Singapore, Singapore, 5Biostatistics Unit, Yong Loo Lin School of Medicine, National University of
Singapore, Singapore, Singapore, 6Department of Reproductive Medicine, KK Women’s and Children’s
Hospital, Singapore, Singapore, 7Duke-NUS Medical School, Singapore, Singapore, 8Singapore Bioimaging
Consortium, Agency for Science Technology and Research, Singapore, Singapore, 9Department of
Diagnostic and Interventional Imaging, KK Women’s and Children’s Hospital, Singapore, Singapore,10MRC Lifecourse Epidemiology Unit and NIHR Southampton Biomedical Research Centre, University of
Southampton and University Hospital Southampton NHS Foundation Trust, Southampton, UK, 11Department of
Pediatrics, Khoo Teck Puat-National University Children’s Medical Institute, National University Hospital,
National University Health System, Singapore, Singapore, 12Department of Maternal Fetal Medicine, KK
Women’s and Children’s Hospital, Singapore, Singapore, 13Liggins Institute, University of Auckland, Auckland,
New Zealand, 14Department of Pediatrics, KK Women’s and Children’s Hospital, Singapore, Singapore,15Department of Cardiology, National University Heart Centre, Singapore, Singapore, 16Molecular
Diagnosis Centre, Department of Laboratory Medicine, National University Health System, Singapore,
Singapore and 17Department of Physiology, University of Melbourne, Melbourne, VIC, Australia
†Joint last authors.
*Corresponding author. Brenner Centre for Molecular Medicine, 30 Medical Drive, Singapore 117609, Singapore. E-mail:
Editorial decision 26 June 2020; Accepted 20 July 2020
VC The Author(s) 2020; all rights reserved. Published by Oxford University Press on behalf of the International Epidemiological Association 1591
IEAInternational Epidemiological Association
International Journal of Epidemiology, 2020, 1591–1603
doi: 10.1093/ije/dyaa143
Advance Access Publication Date: 20 August 2020
Original article
Dow
nloaded from https://academ
ic.oup.com/ije/article/49/5/1591/5897702 by guest on 04 July 2022
Abstract
Background: Using longitudinal ultrasounds as an improved fetal growth marker, we
aimed to investigate if fetal growth deceleration followed by rapid postnatal weight gain
is associated with childhood cardiometabolic risk biomarkers in a contemporary well-
nourished population.
Methods: We defined fetal growth deceleration (FGD) as ultrasound-measured 2nd-3rd-
trimester abdominal circumference decrease by �0.67 standard deviation score (SDS)
and rapid postnatal weight gain (RPWG) as 0–2-year-old weight increase by �0.67 SDS.
In the GUSTO mother-offspring cohort, we grouped 797 children into four groups of
FGD-only (14.2%), RPWG-only (23.3%), both (mismatch, 10.7%) or neither (reference,
51.8%). Adjusting for confounders and comparing with the reference group, we tested
associations of these growth groups with childhood cardiometabolic biomarkers: mag-
netic resonance imaging (MRI)-measured abdominal fat (n¼262), liver fat (n¼216), intra-
myocellular lipids (n¼ 227), quantitative magnetic resonance-measured overall body fat
% (BF%) (n¼ 310), homeostasis model assessment of insulin resistance (HOMA-IR)
(n¼323), arterial wall thickness (n¼422) and stiffness (n¼443), and blood pressure tra-
jectories (ages 3–6 years).
Results: Mean6SD birthweights were: FGD-only (3.116 0.38 kg), RPWG-only (3.036 0.37 kg),
mismatch (2.876 0.31 kg), reference (3.306 0.36 kg). FGD-only children had elevated blood
pressure trajectories without correspondingly increased BF%. RPWG-only children had altered
body fat partitioning, higher BF% [BF¼4.26%, 95% confidence interval (CI) (2.34, 6.19)],
HOMA-IR 0.28 units (0.11, 0.45)] and elevated blood pressure trajectories. Mismatch children
did not have increased adiposity, but had elevated ectopic fat, elevated HOMA-IR [0.29 units
(0.04,0.55)] and the highest blood pressure trajectories. Associations remained even after ex-
cluding small-for-gestational-age infants from analyses.
Conclusions: Fetal growth deceleration coupled with rapid postnatal weight gain was as-
sociated with elevated childhood cardiometabolic risk biomarkers without correspond-
ingly increased BF%.
Key words: Cohort study, fetal growth, postnatal growth, mismatch, cardiometabolic risk, adiposity, insulin resis-
tance, body composition, cardiovascular, blood pressure
Key Messages
• We used dynamic growth information from longitudinal fetal ultrasounds rather than birthweight-for-gestational-age as
a marker of poor fetal growth.
• Children who experienced 2nd–3rd trimester fetal growth deceleration had elevated blood pressure trajectories without
a corresponding increase in body fat %, arterial thickness or arterial stiffness, suggesting that poor fetal growth might af-
fect blood pressure not through adiposity or changes in arterial structure, but possibly through poorer nephrogenesis.
• Children who experienced 0–2-year-old rapid postnatal weight gain, regardless of their fetal growth rates, had elevated
abdominal fat, intramyocellular lipids, insulin resistance and blood pressure trajectories in early childhood (ages 3–
6 years), which could lead to greater cardiometabolic risk if these biomarkers tracked to adulthood.
• Children who experienced a mismatch of fetal growth deceleration followed by rapid postnatal weight gain had the high-
est blood pressure trajectories and multiple elevated cardiometabolic risk biomarkers, without a corresponding increase
in overall body fat %, suggesting that rapid postnatal weight gain might act as a ‘second-hit’ and increase the cardiome-
tabolic risk in children who had experienced poor fetal growth.
• Our findings highlight the importance of monitoring longitudinal growth patterns right from the fetal stage.
1592 International Journal of Epidemiology, 2020, Vol. 49, No. 5
Dow
nloaded from https://academ
ic.oup.com/ije/article/49/5/1591/5897702 by guest on 04 July 2022
Introduction
The first 1000 days of life are a developmentally plastic
and nutritionally sensitive period which may programme
future cardiometabolic risk.1 From an evolutionary per-
spective, poor nutritional cues in utero enable predictive
adaptive responses to maximize chances of survival in the
predicted poor postnatal nutritional environment.
However, when the postnatal nutritional environment is
richer than predicted, predictive adaptive responses may
become maladaptive and lead to increased cardiometabolic
risk.2–4 This phenomenon is known as ‘developmental mis-
match’, which has been supported by animal studies inves-
tigating mismatch between maternal and postnatal
nutrition as well as epidemiological studies investigating
mismatch between fetal and postnatal growth.2–10
Poor fetal growth, rapid postnatal weight gain (RPWG)
and a combination of these two growth patterns have been
associated with increased cardiometabolic risk.5,8,9,11–14
However, earlier studies often used low birthweight or
small-for-gestational-age (SGA) as a crude proxy of poor
fetal growth.5,8 These definitions might incorrectly classify
neonates who were constitutionally small as having poor
fetal growth.15 Hence, we studied fetal growth decelera-
tion (FGD), defined as downward crossing of at least one
major centile band [�0.67 standard deviation score (SDS)]
in fetal abdominal circumference charts between the 2nd
and 3rd trimesters. Crossing down by at least one major
centile band (0.67 SDS units) has been commonly used to
assess growth deceleration, and crossing up by at least one
major centile band has been used to assess growth accelera-
tion, in both fetal and postnatal life.13,16 In addition, ear-
lier studies on developmental mismatch have focused on
extreme nutritional stresses in utero such as famine, intra-
uterine ligation or extreme caloric restriction in animal
models.6,7,9 It is less clear if the adverse cardiometabolic
risk associated with developmental mismatch manifests
even in contemporary, well-nourished populations.
We aimed to evaluate the associations of FGD alone,
RPWG alone and a combination of these growth patterns
with early cardiometabolic alterations in childhood in an
Asian mother-offspring cohort. We used an extensive panel
of childhood cardiometabolic biomarkers: adiposity out-
comes [anthropometry, body fat % (BF%), abdominal sub-
cutaneous adipose tissue, visceral adipose tissue,
intramyocellular lipids, liver fat], metabolic outcomes
[fasting plasma glucose (FPG), fasting plasma insulin, insu-
lin resistance] and cardiovascular outcomes (blood pres-
sure, arterial thickness and stiffness). More sophisticated
markers such as BF% and body fat partitioning to the ab-
domen, muscles and liver have been shown to be strong, in-
dependent correlates of cardiometabolic risk, above and
beyond that of body mass index (BMI) alone.17–20 We hy-
pothesize that the mismatch group with FGD followed by
RPWG would be associated with the greatest alterations in
cardiometabolic risk biomarkers, even in early childhood.
Methods
Study population
Children were part of the Growing Up in Singapore
Towards healthy Outcomes (GUSTO) longitudinal
mother-offspring cohort, detailed previously.21 Pregnant
women in the first trimester were recruited (June 2009-
September 2010) from KK Women’s and Children’s
Hospital and National University Hospital, Singapore. Of
3751 women, 2034 were eligible, 1247 were recruited (re-
sponse rate 61.3%) and 797 singletons with both fetal and
postnatal growth data available were included
(Supplementary Figure S1, available as Supplementary
data at IJE online). Preterm (<37 completed weeks of ges-
tation) infants were excluded, as World Health
Organization (WHO) growth charts used to derive weight
z-scores were not suitable for use in preterm infants. Data
for different cardiometabolic assessments were not avail-
able for all children due to differential consent for mea-
surement, data quality control and loss to follow-up.
Precise sample sizes for different cardiometabolic out-
comes are reported (Supplementary Figure S1). Written in-
formed consent was obtained. The National Healthcare
Group Domain Specific Review Board and SingHealth
Centralized Institutional Review Board approved the
study.
Exposures
Fetal abdominal circumference, a good indicator of fetal
growth,22 was measured by trained ultrasonographers in
the second [mean gestational age (6SD): 20.3 6 0.8 weeks
(wks)] and third (32.9 6 0.7wks) trimesters. SDS were de-
rived using the INTERGROWTH-21st standards.23 FGD
was defined as a downward crossing of fetal abdominal
circumference by at least one major centile band (change in
SDS by �0.67 units) from the second to third trimester
scan, similar to previous studies.24–26 Crossing down by at
least one major centile band (0.67 SDS units) has been
commonly used to assess growth deceleration, and crossing
up by at least one major centile band has been used to as-
sess growth acceleration, in both fetal and postnatal
life.13,16
Birthweights were extracted from hospital medical
records and weights (in grams) at age 2 years were mea-
sured (SECA803 Weighing Scale).27 SDS were derived
International Journal of Epidemiology, 2020, Vol. 49, No. 5 1593
Dow
nloaded from https://academ
ic.oup.com/ije/article/49/5/1591/5897702 by guest on 04 July 2022
according to WHO child growth standards,28 using the
lambda-mu-sigma (LMS) method.29 RPWG was defined as
an increase in weight by at least one major centile band
(change in SDS by �0.67 units) from birth to age 2 years.13
Four growth groups were defined, depending on
whether the child experienced FGD-only (14.2%), RPWG-
only (23.3%), both FGD and RPWG (mismatch group)
(10.7%) or neither (reference group) (51.8%).
Cardiometabolic risk biomarkers
At ages 4.5 and 6 years, weight (SECA803 Weighing Scale)
and standing height (SECA213 stadiometer) were mea-
sured in 674 children.27 SDS of weight, height and BMI
were derived using WHO growth standards.28 At age
6 years, high precision and accurate overall fat mass were
obtained by Quantitative Magnetic Resonance (QMR)
(EchoMRI-Adolescent Humans Body Composition
Analyzer, EchoMRI Corp., Singapore) in a subset of 310
children.30 BF% was calculated by: [fat mass (kg)/total
body weight (kg)]*100%
At age 4.5 years, abdominal magnetic resonance imag-
ing (MRI) was performed without sedation using a
Siemens Skyra 3 T magnetic resonance scanner to derive
volumes of abdominal subcutaneous adipose tissue and vis-
ceral adipose tissue in millilitres (mL) in 262 children. 31,32
Intramyocellular lipids and liver fat were assessed by pro-
ton magnetic resonance spectroscopy (1H-MRS) in 227
and 216 children, respectively.33 Intramyocellular lipids
were expressed as a percentage of the water signal and are
proportional to lipid accumulation within skeletal muscles.
Liver fat percentage by weight was calculated by averaging
across the right and left liver lobe scans (detailed MRI and
MRS protocols in Supplementary Section, available as
Supplementary data at IJE online).
At age 6 years, after an overnight fast, venous fasting
plasma glucose (FPG) was measured using the hexokinase
enzymatic method (Abbott Architect c8000 analyzer at KK
Women’s and Children’s Hospital and Beckman AU5800
analyzer at National University Hospital) in 429 children.
Fasting insulin was measured using a sandwich immunoas-
say (Beckman DXL800 analyzer, Beckman Coulter) in 324
children. In 323 children, homeostasis model assessment
(HOMA) of insulin resistance (HOMA-IR) was calculated
as follows: HOMA-IR ¼ [fasting insulin(mU/
L)*FPG(mmol/L)]/22.5.34
Peripheral systolic blood pressure (SBP) and diastolic
blood pressure (DBP) were measured from the right upper
arm (Dinamap CARESCAPE V100, GE Healthcare,
Milwaukee, WI) at ages 3 (n¼ 639), 4 (n¼ 586), 5
(n¼ 613) and 6 years (n¼ 565).35 At age 6 years, arterial
wall thickness was assessed through carotid intima-media
thickness (cIMT) using high resolution B-mode ultrasound,
and arterial stiffness was assessed through carotid-femoral
pulse wave velocity (PWV) by applanation tonometry in
422 and 443 children, respectively (detailed cIMT and
PWV protocols in Supplementary Section).
Covariates
Maternal age, ethnicity, educational attainment, household
income, parity and self-reported pre-pregnancy weight
were collected at recruitment through interviewer-
administered questionnaires. At �26–28 weeks of gesta-
tion, venous FPG was measured.36 Height was measured
using a calibrated stadiometer (SECA213 Stadiometer,
SECA Corp., Hamburg, Germany). Pre-pregnancy BMI
(ppBMI) was calculated using this height and self-reported
pre-pregnancy weight. Plasma cotinine level was measured
by liquid chromatography-tandem mass spectrometry.37
Total gestational weight gain (GWG) was calculated from
the difference between last measured antenatal weight
(taken within 4 weeks from delivery) and self-reported pre-
pregnancy weight. Child sex was taken from medical
records. Gestational age (in weeks) was calculated based
on first trimester crown-rump lengths assessed by trained
ultrasonographers. Size at birth was categorized based on
birthweight and gestational age using customized birth
charts.38 Infants were categorized as low birthweight if
they weighed less than 2500 g. Paternal height (in cm) was
measured during the year 2 postnatal visits.
Statistical analysis
To compare differences between participants included and
excluded in the study (n¼ 450 families excluded, n¼ 460
children excluded due to 10 pairs of twins), as well as those
with and without at least one MRI/MRS measurement,
blood glucose/insulin measurement and outcome measure-
ment at year 6, two-tailed t tests were performed for con-
tinuous variables and chi square tests were performed for
categorical variables. Multiple linear regression was per-
formed to test associations between growth groups and
childhood cardiometabolic risk biomarkers (anthropome-
try, BF%, abdominal fat, intramyocellular lipids, liver fat,
FPG, fasting insulin, HOMA-IR, cIMT, PWV), with re-
spect to the reference group. To gauge the magnitude of
effects, adjusted differences between each growth group
and the reference group were also expressed as a percent-
age change compared with the reference group (except for
anthropometry z-scores where negative mean z-scores of
the reference group prevent the meaningful evaluation of
percentage change). Post-estimation pairwise comparisons
using Tukey’s adjustment for multiple comparisons were
1594 International Journal of Epidemiology, 2020, Vol. 49, No. 5
Dow
nloaded from https://academ
ic.oup.com/ije/article/49/5/1591/5897702 by guest on 04 July 2022

also performed. Based on literature review, the following
confounders which influence both fetal/postnatal growth
and cardiometabolic outcomes were used: sociodemo-
graphic factors (maternal education, child sex and ethnic-
ity), in-utero environmental factors (parity, pre-
ppregnancy BMI, maternal height, gestational FPG, GWG,
cotinine). To determine longitudinal associations of
growth groups with SBP and DBP, linear mixed effects
(LME) modelling, which accounts for correlation between
repeated measures in the same participant, was performed
using maximum likelihood estimation, assuming outcome
data were missing at random39 and defining covariances as
unstructured, to distinctly estimate all variances and cova-
riances for individual growth curves.40 The models in-
cluded a random intercept, random linear slope for age, an
age-growth group interaction term and the same confound-
ers as the regression model above. Using the ‘margins’
command in Stata, adjusted differences in LME-predicted
blood pressure between each growth group and the refer-
ence group, while holding covariates constant at their
mean values, were reported.
A few sensitivity analyses were performed. First, paternal
height (available in 78.3% of participants) was added as a
covariate in multiple linear regression models, due to its
contribution to child growth.41 Since GWG and FPG could
potentially be affected by fetal growth due to the temporal
overlap in the collection of these variables, we also ran the
model after removing GWG and FPG as confounders in
multiple linear regression. Standardized residuals of blood
pressure regressed on sex and height at each time point
were calculated and their longitudinal associations with the
growth groups were evaluated using the same LME model
above, as blood pressure in growing children is closely re-
lated to sex and height. We adjusted for the rate of gesta-
tional weight gain from 15–35 weeks of gestation instead of
total gestational weight gain, to ensure that this confounder
was independent of gestational age. We also additionally
adjusted for body fat partitioning at age 4.5 years, as it
could be a potential mediator of metabolic and cardiovascu-
lar outcomes at age 6 years. Due to small sample sizes, we
conducted multiple linear regression to determine the main
effects of FGD, RPWG and their interaction term as a sensi-
tivity analysis rather than as a main analysis. Multiple im-
putation using chained equations was performed to
generate 50 imputed datasets for missing covariates (mater-
nal education: n¼6, maternal height: n¼ 15, pre-
pregnancy BMI: n¼ 63, FPG: n¼ 34, GWG: n¼ 71, cotin-
ine: n¼ 88). The imputation model included all exposure,
outcome and confounder variables included in this study.42
Multiple linear regression and LME models, whether in-
cluding or excluding SGA infants, were performed on im-
puted datasets where Rubin’s combination rules were used
to obtain pooled estimates.43 All analyses were performed
using Stata 16.0 (StataCorp LP, TX).
Results
Cohort description
Of 1247 participants, 797 were classified into four growth
groups (Supplementary Figure S1). Mothers of excluded
children had lower education, household income and age
(Supplementary Table S1, available as Supplementary data
at IJE online). Excluded children had lower mean gesta-
tional age and birthweight but had similar childhood cardio-
metabolic outcomes compared with included offspring
(Supplementary Table S2, available as Supplementary data
at IJE online). Among 797 included participants, those with
at least one MRI or MRS measurement were more likely to
have lower maternal education, lower household income,
lower proportion of nulliparous mothers, male offspring
and Chinese, as well as higher maternal pre-pregnancy BMI
and BF% at age 6 years compared with those without
(Supplementary Table S3, available as Supplementary data
at IJE online). Those with at least one child blood glucose
or insulin measurement had similar parental and child char-
acteristics compared with those without, except for slightly
lower proportion of nulliparous mothers (40.5% vs 49.0%)
(Supplementary Table S4, available as Supplementary data
at IJE online). Those with at least one outcome measure-
ment at age 6 years had similar parental and child character-
istics compared with those without (Supplementary Table
S5, available as Supplementary data at IJE online).
The mismatch and reference groups had higher maternal
education and household income than the FGD-only and
RPWG-only groups (Table 1). Compared with all other
groups, the mismatch group had the highest proportion of
nulliparous mothers (57.6%), mean plasma cotinine levels
(4.736 22.12 ng/mL) and mean height of parents, as well as
lowest gestational age (38.676 1.01wk) and birthweight
(2.876 0.31 kg). Groups which experienced FGD (mis-
match, FGD-only) had lower gestational FPG and GWG and
higher proportion of male offspring. Groups which experi-
enced RPWG (mismatch, RPWG-only) had higher propor-
tion of Indians. RPWG-only children had the highest mean z-
BMI, z-Height, BF% and abdominal fat, and mismatch chil-
dren had the highest mean FPG, fasting insulin, HOMA-IR
and blood pressure (Table 2).
Associations of growth groups with adiposity
outcomes
Compared with the reference group, the mismatch and
RPWG-only groups had elevated z-BMI [mismatch: 0.53
units (0.19, 0.88); RPWG-only: 0.98 units (0.72, 1.24)],
International Journal of Epidemiology, 2020, Vol. 49, No. 5 1595
Dow
nloaded from https://academ
ic.oup.com/ije/article/49/5/1591/5897702 by guest on 04 July 2022
abdominal subcutaneous adipose tissue [mismatch:
210.30 mL (52.74, 367.85); RPWG-only: 315.58 mL
(196.23, 434.94) and visceral adipose tissue [mismatch:
40.17 mL (5.28, 75.06); RPWG-only: 38.03 mL (11.60,
64.46)]. However, only the RPWG-only group had in-
creased overall BF% [4.26% [2.34, 6.19)], whereas the
mismatch group had elevated intramyocellular lipids
[0.13% of water signal (0.00, 0.26)] and liver fat [0.17%
by weight (-0.01, 0.35)] (Figure 1A-F; Supplementary
Table S6, available as Supplementary data at IJE online).
In fact, the RPWG-only group had noticeably higher z-
BMI, BF%, and abdominal subcutaneous adipose tissue
than the FGD-only and mismatch groups (Supplementary
Table S12, available as Supplementary data at IJE online).
The FGD-only group was similar in adiposity outcomes to
the reference group (Figure 1A-F; Supplementary Table
S6). Relative to the reference group, these findings repre-
sent large percentage increases of 45%, 22%, 29% and
32% in abdominal subcutaneous adipose tissue, visceral
adipose tissue, intramyocellular lipids and liver fat, respec-
tively, in the mismatch group, compared with a relatively
small percentage increase of 4% in BF%. They also repre-
sent large percentage increases of 23%, 67%, 21% and
21% in BF%, abdominal subcutaneous adipose tissue, vis-
ceral adipose tissue and intramyocellular lipids, respec-
tively, in the RPWG-only group.
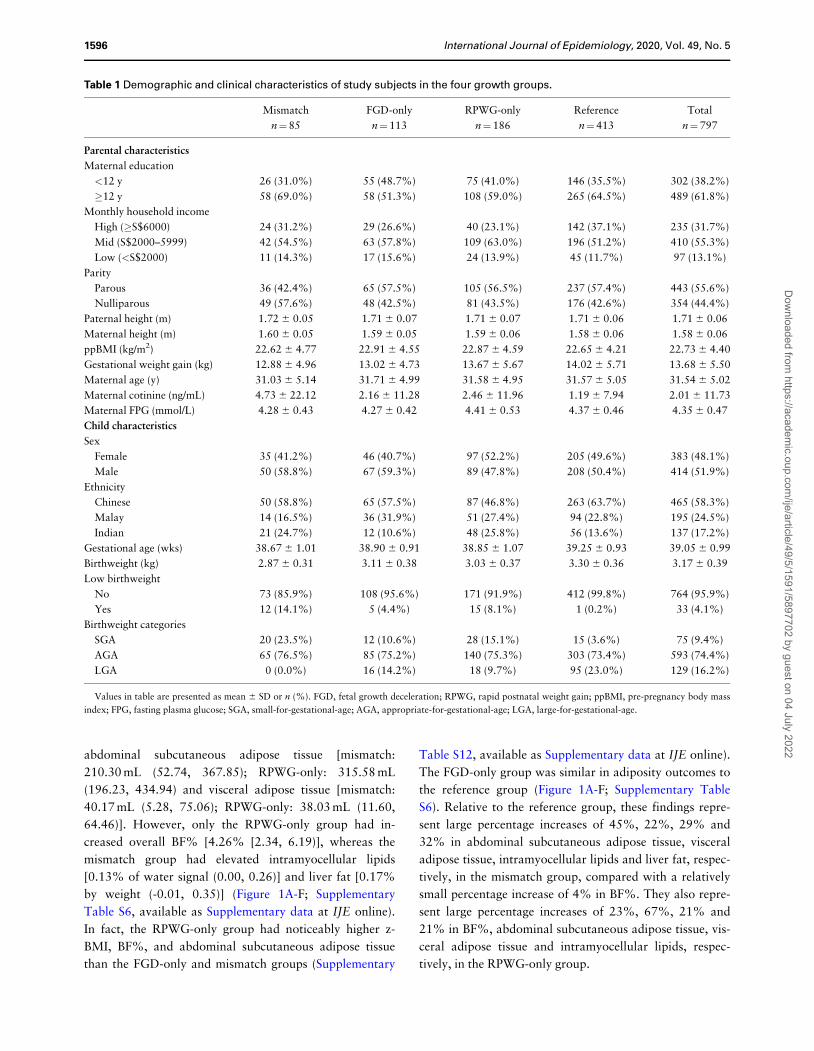
Table 1 Demographic and clinical characteristics of study subjects in the four growth groups.
Mismatch FGD-only RPWG-only Reference Total
n¼85 n¼113 n¼186 n¼413 n¼797
Parental characteristics
Maternal education
<12 y 26 (31.0%) 55 (48.7%) 75 (41.0%) 146 (35.5%) 302 (38.2%)
�12 y 58 (69.0%) 58 (51.3%) 108 (59.0%) 265 (64.5%) 489 (61.8%)
Monthly household income
High (�S$6000) 24 (31.2%) 29 (26.6%) 40 (23.1%) 142 (37.1%) 235 (31.7%)
Mid (S$2000–5999) 42 (54.5%) 63 (57.8%) 109 (63.0%) 196 (51.2%) 410 (55.3%)
Low (<S$2000) 11 (14.3%) 17 (15.6%) 24 (13.9%) 45 (11.7%) 97 (13.1%)
Parity
Parous 36 (42.4%) 65 (57.5%) 105 (56.5%) 237 (57.4%) 443 (55.6%)
Nulliparous 49 (57.6%) 48 (42.5%) 81 (43.5%) 176 (42.6%) 354 (44.4%)
Paternal height (m) 1.72 6 0.05 1.71 6 0.07 1.71 6 0.07 1.71 6 0.06 1.71 6 0.06
Maternal height (m) 1.60 6 0.05 1.59 6 0.05 1.59 6 0.06 1.58 6 0.06 1.58 6 0.06
ppBMI (kg/m2) 22.62 6 4.77 22.91 6 4.55 22.87 6 4.59 22.65 6 4.21 22.73 6 4.40
Gestational weight gain (kg) 12.88 6 4.96 13.02 6 4.73 13.67 6 5.67 14.02 6 5.71 13.68 6 5.50
Maternal age (y) 31.03 6 5.14 31.71 6 4.99 31.58 6 4.95 31.57 6 5.05 31.54 6 5.02
Maternal cotinine (ng/mL) 4.73 6 22.12 2.16 6 11.28 2.46 6 11.96 1.19 6 7.94 2.01 6 11.73
Maternal FPG (mmol/L) 4.28 6 0.43 4.27 6 0.42 4.41 6 0.53 4.37 6 0.46 4.35 6 0.47
Child characteristics
Sex
Female 35 (41.2%) 46 (40.7%) 97 (52.2%) 205 (49.6%) 383 (48.1%)
Male 50 (58.8%) 67 (59.3%) 89 (47.8%) 208 (50.4%) 414 (51.9%)
Ethnicity
Chinese 50 (58.8%) 65 (57.5%) 87 (46.8%) 263 (63.7%) 465 (58.3%)
Malay 14 (16.5%) 36 (31.9%) 51 (27.4%) 94 (22.8%) 195 (24.5%)
Indian 21 (24.7%) 12 (10.6%) 48 (25.8%) 56 (13.6%) 137 (17.2%)
Gestational age (wks) 38.67 6 1.01 38.90 6 0.91 38.85 6 1.07 39.25 6 0.93 39.05 6 0.99
Birthweight (kg) 2.87 6 0.31 3.11 6 0.38 3.03 6 0.37 3.30 6 0.36 3.17 6 0.39
Low birthweight
No 73 (85.9%) 108 (95.6%) 171 (91.9%) 412 (99.8%) 764 (95.9%)
Yes 12 (14.1%) 5 (4.4%) 15 (8.1%) 1 (0.2%) 33 (4.1%)
Birthweight categories
SGA 20 (23.5%) 12 (10.6%) 28 (15.1%) 15 (3.6%) 75 (9.4%)
AGA 65 (76.5%) 85 (75.2%) 140 (75.3%) 303 (73.4%) 593 (74.4%)
LGA 0 (0.0%) 16 (14.2%) 18 (9.7%) 95 (23.0%) 129 (16.2%)
Values in table are presented as mean 6 SD or n (%). FGD, fetal growth deceleration; RPWG, rapid postnatal weight gain; ppBMI, pre-pregnancy body mass
index; FPG, fasting plasma glucose; SGA, small-for-gestational-age; AGA, appropriate-for-gestational-age; LGA, large-for-gestational-age.
1596 International Journal of Epidemiology, 2020, Vol. 49, No. 5
Dow
nloaded from https://academ
ic.oup.com/ije/article/49/5/1591/5897702 by guest on 04 July 2022
Associations of growth groups with metabolic
outcomes
Compared with the reference group, the mismatch and
RPWG-only groups had elevated fasting insulin concentra-
tions [mismatch: 9.04 pmol/L (0.61, 17.47); RPWG-only:
8.86 pmol/L (3.15, 14.57)] and HOMA-IR [mismatch:
0.29 units (0.04, 0.55); RPWG-only: 0.28 units (0.11,
0.45)] without elevated FPG at age 6 years (Figure 1I–K;
Supplementary Table S6). The FGD-only group did not
have clear alterations in metabolic outcomes compared
with the reference group (Figure 1I–K; Supplementary
Table S6) and had lower fasting insulin [-10.79 pmol/L (-
22.14, 0.57)] and HOMA-IR [-0.39 units (-0.75, -0.04)]
than the mismatch group (Supplementary Table S12).
Relative to the reference group, these findings represent
large percentage increases of 34%, 33%, 38%,] and 36%
in fasting insulin (mismatch group), fasting insulin
(RPWG-only group), HOMA-IR (mismatch group),] and
HOMA-IR (RPWG-only group), respectively.
Associations of growth groups with
cardiovascular outcomes
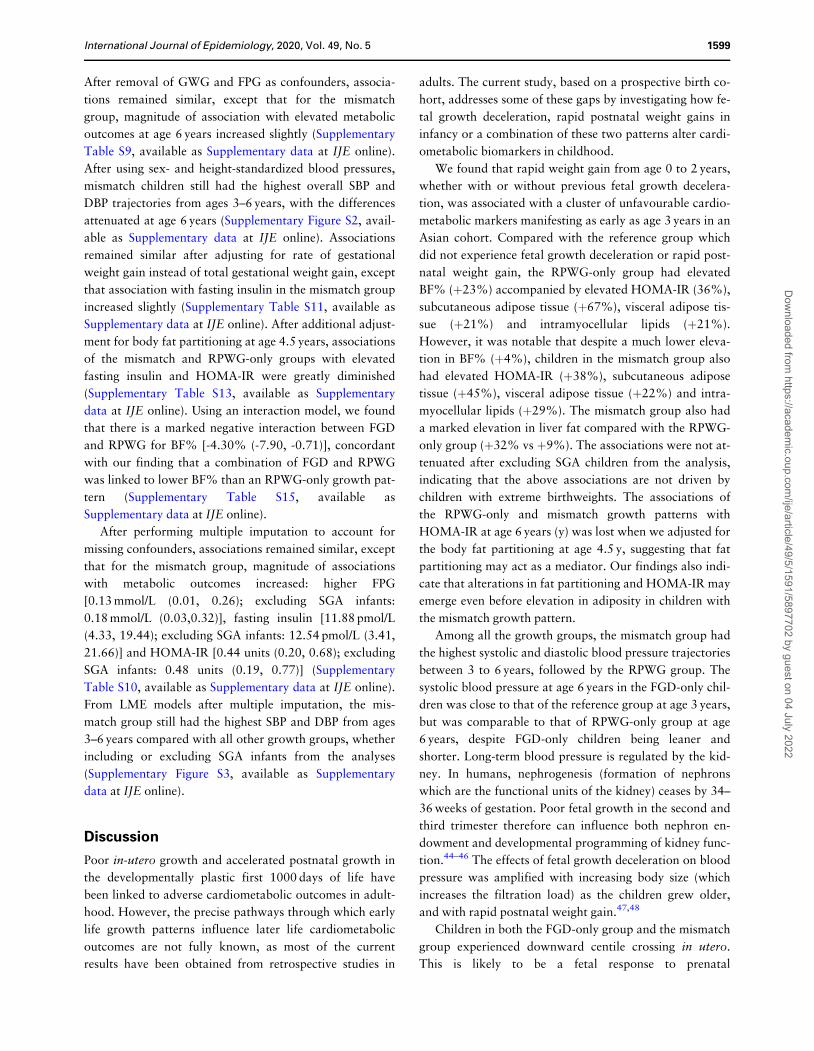
From age 3–6 years, mismatch children had the highest
SBP and DBP LME trajectories (Figure 2). The differences
in blood pressure between the mismatch and reference
groups were more marked at age 3 years and were
attenuated at age 6 years: age 3 years [SBP: 6.14 mmHg
(3.97, 8.31); DBP: 3.04 mmHg (1.53, 4.54)], 4 years [SBP:
5.13 mmHg (3.42, 6.83); DBP: 2.75 mmHg (1.58, 3.92)],
5 years [SBP: 4.11 mmHg (2.41, 5.81); DBP: 2.46 mmHg
(1.28, 3.64)], 6 years [SBP: 3.10 mmHg (0.95, 5.24); DBP:
2.18 mmHg (0.65, 3.70)] (Figure 2; Supplementary Table
S7, available as Supplementary data at IJE online).
Similarly, RPWG-only children had elevated SBP (age 3–
6 years) and DBP (age 3–5 years) trajectories. The diastolic
blood pressure trajectory of the FGD-only children was
slightly higher than the reference children consistently
from ages 3 to 6 years. The systolic blood pressure trajec-
tory of the FGD-only children started at the same point as
the reference children at age 3 years, but rose faster than
the reference children till it converged with that of the
RPWG-only children at age 6 years. None of the groups
had substantial alterations in cIMT and PWV, with per-
centage changes relative to the reference group ranging
from -1% to 6% (Figure 1G–H; Supplementary Table S6).
Sensitivity analysis
Associations remained similar after additional adjustment
for paternal height, except that for RPWG-only children,
magnitude of association with elevated metabolic out-
comes at age 6 years increased slightly (Supplementary
Table S8, available as Supplementary data at IJE online).
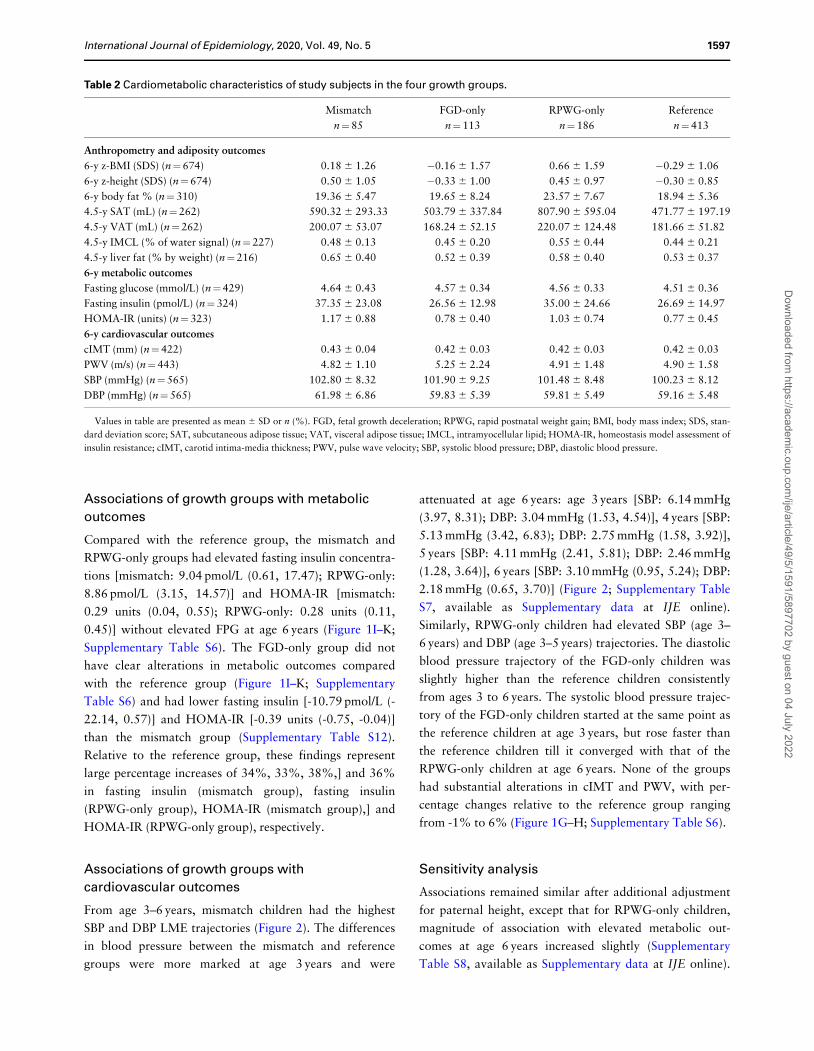
Table 2 Cardiometabolic characteristics of study subjects in the four growth groups.
Mismatch FGD-only RPWG-only Reference
n¼85 n¼113 n¼186 n¼413
Anthropometry and adiposity outcomes
6-y z-BMI (SDS) (n¼674) 0.18 6 1.26 �0.16 6 1.57 0.66 6 1.59 �0.29 6 1.06
6-y z-height (SDS) (n¼674) 0.50 6 1.05 �0.33 6 1.00 0.45 6 0.97 �0.30 6 0.85
6-y body fat % (n¼310) 19.36 6 5.47 19.65 6 8.24 23.57 6 7.67 18.94 6 5.36
4.5-y SAT (mL) (n¼262) 590.32 6 293.33 503.79 6 337.84 807.90 6 595.04 471.77 6 197.19
4.5-y VAT (mL) (n¼262) 200.07 6 53.07 168.24 6 52.15 220.07 6 124.48 181.66 6 51.82
4.5-y IMCL (% of water signal) (n¼227) 0.48 6 0.13 0.45 6 0.20 0.55 6 0.44 0.44 6 0.21
4.5-y liver fat (% by weight) (n¼216) 0.65 6 0.40 0.52 6 0.39 0.58 6 0.40 0.53 6 0.37
6-y metabolic outcomes
Fasting glucose (mmol/L) (n¼429) 4.64 6 0.43 4.57 6 0.34 4.56 6 0.33 4.51 6 0.36
Fasting insulin (pmol/L) (n¼324) 37.35 6 23.08 26.56 6 12.98 35.00 6 24.66 26.69 6 14.97
HOMA-IR (units) (n¼323) 1.17 6 0.88 0.78 6 0.40 1.03 6 0.74 0.77 6 0.45
6-y cardiovascular outcomes
cIMT (mm) (n¼422) 0.43 6 0.04 0.42 6 0.03 0.42 6 0.03 0.42 6 0.03
PWV (m/s) (n¼443) 4.82 6 1.10 5.25 6 2.24 4.91 6 1.48 4.90 6 1.58
SBP (mmHg) (n¼565) 102.80 6 8.32 101.90 6 9.25 101.48 6 8.48 100.23 6 8.12
DBP (mmHg) (n¼565) 61.98 6 6.86 59.83 6 5.39 59.81 6 5.49 59.16 6 5.48
Values in table are presented as mean 6 SD or n (%). FGD, fetal growth deceleration; RPWG, rapid postnatal weight gain; BMI, body mass index; SDS, stan-
dard deviation score; SAT, subcutaneous adipose tissue; VAT, visceral adipose tissue; IMCL, intramyocellular lipid; HOMA-IR, homeostasis model assessment of
insulin resistance; cIMT, carotid intima-media thickness; PWV, pulse wave velocity; SBP, systolic blood pressure; DBP, diastolic blood pressure.
International Journal of Epidemiology, 2020, Vol. 49, No. 5 1597
Dow
nloaded from https://academ
ic.oup.com/ije/article/49/5/1591/5897702 by guest on 04 July 2022
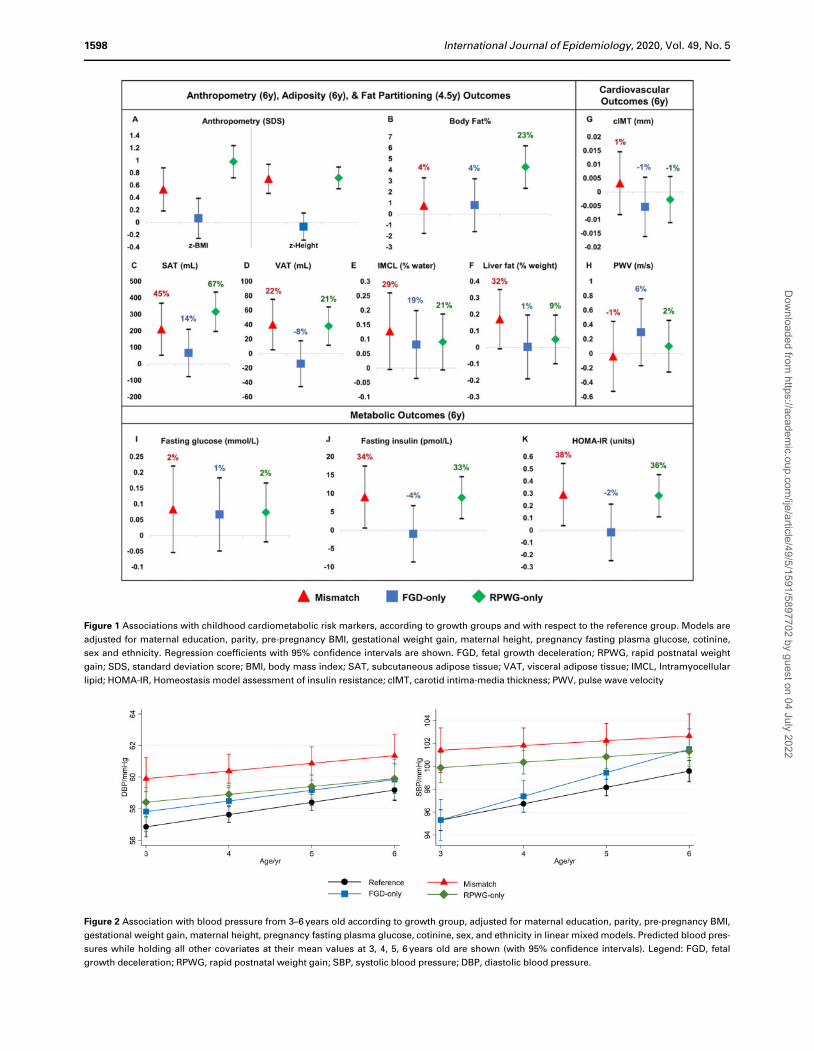
Figure 2 Association with blood pressure from 3–6 years old according to growth group, adjusted for maternal education, parity, pre-pregnancy BMI,
gestational weight gain, maternal height, pregnancy fasting plasma glucose, cotinine, sex, and ethnicity in linear mixed models. Predicted blood pres-
sures while holding all other covariates at their mean values at 3, 4, 5, 6 years old are shown (with 95% confidence intervals). Legend: FGD, fetal
growth deceleration; RPWG, rapid postnatal weight gain; SBP, systolic blood pressure; DBP, diastolic blood pressure.
Figure 1 Associations with childhood cardiometabolic risk markers, according to growth groups and with respect to the reference group. Models are
adjusted for maternal education, parity, pre-pregnancy BMI, gestational weight gain, maternal height, pregnancy fasting plasma glucose, cotinine,
sex and ethnicity. Regression coefficients with 95% confidence intervals are shown. FGD, fetal growth deceleration; RPWG, rapid postnatal weight
gain; SDS, standard deviation score; BMI, body mass index; SAT, subcutaneous adipose tissue; VAT, visceral adipose tissue; IMCL, Intramyocellular
lipid; HOMA-IR, Homeostasis model assessment of insulin resistance; cIMT, carotid intima-media thickness; PWV, pulse wave velocity
1598 International Journal of Epidemiology, 2020, Vol. 49, No. 5
Dow
nloaded from https://academ
ic.oup.com/ije/article/49/5/1591/5897702 by guest on 04 July 2022
After removal of GWG and FPG as confounders, associa-
tions remained similar, except that for the mismatch
group, magnitude of association with elevated metabolic
outcomes at age 6 years increased slightly (Supplementary
Table S9, available as Supplementary data at IJE online).
After using sex- and height-standardized blood pressures,
mismatch children still had the highest overall SBP and
DBP trajectories from ages 3–6 years, with the differences
attenuated at age 6 years (Supplementary Figure S2, avail-
able as Supplementary data at IJE online). Associations
remained similar after adjusting for rate of gestational
weight gain instead of total gestational weight gain, except
that association with fasting insulin in the mismatch group
increased slightly (Supplementary Table S11, available as
Supplementary data at IJE online). After additional adjust-
ment for body fat partitioning at age 4.5 years, associations
of the mismatch and RPWG-only groups with elevated
fasting insulin and HOMA-IR were greatly diminished
(Supplementary Table S13, available as Supplementary
data at IJE online). Using an interaction model, we found
that there is a marked negative interaction between FGD
and RPWG for BF% [-4.30% (-7.90, -0.71)], concordant
with our finding that a combination of FGD and RPWG
was linked to lower BF% than an RPWG-only growth pat-
tern (Supplementary Table S15, available as
Supplementary data at IJE online).
After performing multiple imputation to account for
missing confounders, associations remained similar, except
that for the mismatch group, magnitude of associations
with metabolic outcomes increased: higher FPG
[0.13 mmol/L (0.01, 0.26); excluding SGA infants:
0.18 mmol/L (0.03,0.32)], fasting insulin [11.88 pmol/L
(4.33, 19.44); excluding SGA infants: 12.54 pmol/L (3.41,
21.66)] and HOMA-IR [0.44 units (0.20, 0.68); excluding
SGA infants: 0.48 units (0.19, 0.77)] (Supplementary
Table S10, available as Supplementary data at IJE online).
From LME models after multiple imputation, the mis-
match group still had the highest SBP and DBP from ages
3–6 years compared with all other growth groups, whether
including or excluding SGA infants from the analyses
(Supplementary Figure S3, available as Supplementary
data at IJE online).
Discussion
Poor in-utero growth and accelerated postnatal growth in
the developmentally plastic first 1000 days of life have
been linked to adverse cardiometabolic outcomes in adult-
hood. However, the precise pathways through which early
life growth patterns influence later life cardiometabolic
outcomes are not fully known, as most of the current
results have been obtained from retrospective studies in
adults. The current study, based on a prospective birth co-
hort, addresses some of these gaps by investigating how fe-
tal growth deceleration, rapid postnatal weight gains in
infancy or a combination of these two patterns alter cardi-
ometabolic biomarkers in childhood.
We found that rapid weight gain from age 0 to 2 years,
whether with or without previous fetal growth decelera-
tion, was associated with a cluster of unfavourable cardio-
metabolic markers manifesting as early as age 3 years in an
Asian cohort. Compared with the reference group which
did not experience fetal growth deceleration or rapid post-
natal weight gain, the RPWG-only group had elevated
BF% (þ23%) accompanied by elevated HOMA-IR (36%),
subcutaneous adipose tissue (þ67%), visceral adipose tis-
sue (þ21%) and intramyocellular lipids (þ21%).
However, it was notable that despite a much lower eleva-
tion in BF% (þ4%), children in the mismatch group also
had elevated HOMA-IR (þ38%), subcutaneous adipose
tissue (þ45%), visceral adipose tissue (þ22%) and intra-
myocellular lipids (þ29%). The mismatch group also had
a marked elevation in liver fat compared with the RPWG-
only group (þ32% vs þ9%). The associations were not at-
tenuated after excluding SGA children from the analysis,
indicating that the above associations are not driven by
children with extreme birthweights. The associations of
the RPWG-only and mismatch growth patterns with
HOMA-IR at age 6 years (y) was lost when we adjusted for
the body fat partitioning at age 4.5 y, suggesting that fat
partitioning may act as a mediator. Our findings also indi-
cate that alterations in fat partitioning and HOMA-IR may
emerge even before elevation in adiposity in children with
the mismatch growth pattern.
Among all the growth groups, the mismatch group had
the highest systolic and diastolic blood pressure trajectories
between 3 to 6 years, followed by the RPWG group. The
systolic blood pressure at age 6 years in the FGD-only chil-
dren was close to that of the reference group at age 3 years,
but was comparable to that of RPWG-only group at age
6 years, despite FGD-only children being leaner and
shorter. Long-term blood pressure is regulated by the kid-
ney. In humans, nephrogenesis (formation of nephrons
which are the functional units of the kidney) ceases by 34–
36 weeks of gestation. Poor fetal growth in the second and
third trimester therefore can influence both nephron en-
dowment and developmental programming of kidney func-
tion.44–46 The effects of fetal growth deceleration on blood
pressure was amplified with increasing body size (which
increases the filtration load) as the children grew older,
and with rapid postnatal weight gain.47,48
Children in both the FGD-only group and the mismatch
group experienced downward centile crossing in utero.
This is likely to be a fetal response to prenatal
International Journal of Epidemiology, 2020, Vol. 49, No. 5 1599
Dow
nloaded from https://academ
ic.oup.com/ije/article/49/5/1591/5897702 by guest on 04 July 2022
perturbations such as maternal undernutrition or placental
insufficiency, and not due to constitutional factors.
However, metabolic characteristics, body fat partitioning
and BF% in the FGD-only group were very similar to the
reference group. Our results suggest that early alterations
in the above characteristics in children who experienced fe-
tal growth deceleration require a second hit in the form of
rapid postnatal growth. Further follow-up of these children
is required to evaluate if the effects of an adverse intrauter-
ine environment are unmasked as they grow older.
Children in all four growth groups had similar arterial
thickness and arterial stiffness at age 6 y, likely due to
small inter-individual variability of these measures in early
childhood.49,50 Thus, increase in arterial thickness and
stiffness does not seem to play a role in the elevations in
blood pressure observed in FGD-only, mismatch and
RPWG-only groups. Further longitudinal tracking of these
children is required to check if alterations in these cardio-
metabolic markers emerge later in life and to understand
the development of differential cardiometabolic risk.
Although we have detected elevations in cardiometa-
bolic risk markers in the mismatch, FGD-only and RPWG-
only groups, there is limited evidence to conclude whether
these changes are clinically significant in childhood, be-
cause of the absence of any hard clinical endpoints which
will mainly become evident only in the later stages of life.
However, since cardiometabolic risk factors tend to track
to adulthood,51,52 children in the RPWG-only, FGD-only
and mismatch groups are likely to be at increased risk of
adverse cardiometabolic outcomes in adulthood. The alter-
ations in the risk markers in the FGD-only and mismatch
group emerged even without increased adiposity. Thus
these alterations may be further accentuated if these chil-
dren become obese later in life. These findings also high-
light the importance of monitoring both fetal and
childhood growth patterns for early risk stratification, as
size at birth or overweight/obesity status alone may not be
sufficient to identify all children who may be at elevated
cardiometabolic risk.
Our findings were consistent with literature which
reported increased subcutaneous adipose tissue, visceral
adipose tissue,53,54 total body fat, BF%,13,55 BMI13,56 and
fasting insulin57 associated with rapid weight gain in child-
hood. Our findings were also consistent with literature on
the adverse cardiometabolic outcomes of poor fetal growth
followed by rapid postnatal growth.5,8,9,11–14 For the mis-
match group, other studies have reported increased an-
droid/gynoid fat ratio, fat mass index, abdominal fat and
BMI at age 6 years,24 increased visceral fat index and liver
fat at age 10 years25 and elevated blood pressure in school-
age children and adulthood.12,26 We go on to demonstrate
that adverse body fat partitioning alterations manifest as
early as age 4.5 years, and elevated blood pressures mani-
fest as early as age 3 years in Asian children.
Our findings contrast with some previous reports which
have suggested that accelerated postnatal growth after
poor fetal growth may occur with preferential fat accumu-
lation.4,53 The mismatch group, which experienced RPWG
after FGD, did not have elevations in overall BF%. This
could potentially be due to the way mismatch was charac-
terized. In the current work, we defined mismatch as hav-
ing slower growth in utero and accelerated growth in
infancy. Older works have used low birthweight as a proxy
for poor fetal growth, which cannot separate the effects of
constitutional factors from prenatal perturbations.15
Furthermore, some studies have also noted the absence of
excess fat in the mismatch group58 and reported that
catch-up after poor fetal growth might not necessarily in-
volve preferential fat mass accretion.59,60 Our findings sug-
gest that the impact of the mismatch growth pattern might
first be on increased ectopic fat accumulation, rather than
on increased adiposity. Further investigation is warranted
to resolve these conflicting findings on phenomenon of
preferential catch-up fat accumulation.
One strength of our study is the use of serial ultrasound
measures to measure fetal growth deceleration even if it
did not result in extremes of fetal or birth size. Although
retrospective cohort studies have revealed links between
early life growth patterns and cardiometabolic outcomes in
adulthood, the precise mechanisms are not fully under-
stood. The extensive phenotyping of cardiometabolic risk
markers like body composition, fat partitioning, insulin re-
sistance, blood pressure, arterial thickness and arterial
stiffness during childhood in the current study provides
insights into the potential pathways through which early
life growth patterns could influence later health outcomes.
Identifying early cardiometabolic alterations of high-risk
growth groups in a large prospective cohort provides evi-
dence for risk stratification in children and provides impe-
tus to uncover underlying mechanisms.
Our limitations include the fact that our study included
only Asian children and excluded preterm infants. Hence,
findings from our multi-ethnic Asian cohort might not be
generalizable to other populations or to preterm children.
Participants with MRI/MRS measures were of slightly
lower socioeconomic status and had slightly higher mater-
nal and child adiposity than those without, which might
lead to potential bias. We also acknowledge that some chil-
dren might be classified as having undergone RPWG/FGD
due to regression to the mean. Although we have adjusted
for sociodemographic and maternal confounders in our
analyses, we acknowledge that fetal/postnatal growth and
cardiometabolic outcomes might be further influenced by
unmeasured behavioural, environmental, nutritional and
1600 International Journal of Epidemiology, 2020, Vol. 49, No. 5
Dow
nloaded from https://academ
ic.oup.com/ije/article/49/5/1591/5897702 by guest on 04 July 2022
genetic confounders. We have suggested possible aetiolo-
gies underlying our findings, but this paper is not focused
on the etiologies of the four growth groups and further
studies are needed to understand them.
In conclusion, rapid weight gain from ages 0 to 2 years,
whether with or without poor fetal growth, is associated
with a cluster of elevated cardiometabolic risk markers in
early childhood. Notably, children with a mismatch be-
tween poor fetal growth and rapid postnatal weight gain
had elevated insulin resistance and ectopic fat accumula-
tion and the highest blood pressure trajectory in early
childhood, even without a corresponding elevation in
BF%. Children with fetal growth deceleration in the ab-
sence of rapid postnatal weight gain also had elevated sys-
tolic blood pressure without having elevated BF%. The
emergence of cardiometabolic alterations, even without in-
creased adiposity, in the mismatch and FGD-only groups is
troubling, as these changes may be further accentuated
with later life obesity. Our work highlights the role of lon-
gitudinal growth monitoring in both the fetal and the post-
natal period for early risk stratification, as screening based
on size at birth or BMI at a single time point may not be
able to uncover all children who may be at increased cardi-
ometabolic risk.
Supplementary data
Supplementary data are available at IJE online.
Funding
This work was supported by the Singapore National Research
Foundation under its Translational and Clinical Research (TCR)
Flagship Programme and administered by the Singapore Ministry of
Health’s National Medical Research Council (NMRC), Singapore
(NMRC/TCR/004-NUS/2008, NMRC/TCR/012-NUHS/2014).
Additional funding is provided by the Singapore Institute for
Clinical Sciences, Agency for Science Technology and Research
(A*STAR), Singapore. K.M.G. is supported by the UK Medical
Research Council (MC_UU_12011/4), the National Institute for
Health Research [NIHR Senior Investigator (NF-SI-0515–10042)]
and the NIHR Southampton Biomedical Research Centre, and the
European Union (Erasmusþ Programme Early Nutrition eAcademy
Southeast Asia) (573651-EPP-1–2016-1-DE-EPPKA2-CBHE-JP).
AcknowledgementsWe would like to thank all study participants and the GUSTO study
group: Allan Sheppard, Amutha Chinnadurai, Anne Eng Neo Goh,
Anne Rifkin-Graboi, Anqi Qiu, Arijit Biswas, Bee Wah Lee, Birit F P
Broekman, Boon Long Quah, Borys Shuter, Chai Kiat Chng, Cheryl
Ngo, Choon Looi Bong, Christiani Jeyakumar Henry, Claudia Chi,
Cornelia Yin Ing Chee, Yam Thiam Daniel Goh, Doris Fok, E
Shyong Tai, Elaine Tham, Elaine Quah Phaik Ling, Evelyn Chung
Ning Law, Evelyn Xiu Ling Loo, Falk Mueller-Riemenschneider,
George Seow Heong Yeo, Helen Chen, Heng Hao Tan, Hugo P S
van Bever, Iliana Magiati, Inez Bik Yun Wong, Ivy Yee-Man Lau,
Jeevesh Kapur, Jenny L Richmond, Jerry Kok Yen Chan, Joanna D
Holbrook, Joanne Yoong, Joao N Ferreira., Jonathan Y Bernard,
Joshua J Gooley, Kenneth Kwek, Krishnamoorthy Niduvaje, Kuan
Jin Lee, Leher Singh, Lin Lin Su, Ling-Wei Chen, Lourdes Mary
Daniel, Mark Hanson, Mary Foong-Fong Chong, Mary Rauff, Mei
Chien Chua, Melvin Khee-Shing Leow, Michael Meaney, Neerja
Karnani, Ngee Lek, Oon Hoe Teoh, P C Wong, Paulin Tay
Straughan, Pratibha Agarwal, Queenie Ling Jun Li, Rob M van
Dam, Salome A Rebello, Seang-Mei Saw, Seng Bin Ang, Shang Chee
Chong, Shirong Cai, Shu-E Soh, Sok Bee Lim, Stella Tsotsi, Chin-
Ying Stephen Hsu, Sue Anne Toh, Swee Chye Quek, Victor Samuel
Rajadurai, Walter Stunkel, Wayne Cutfield, Wee Meng Han, Wei
Wei Pang, and Yin Bun Cheung.
Author contributions
Y.Y.O. analysed data, interpreted data and wrote the manuscript.
N.M. contributed to the analysis, interpretation of data and drafting
of manuscript. S.A.S, I.M.A., M.T.T., W.L.Y., J.Y.H., Y.H.C., S.N.,
S.L.L., S.S.V., M.V.F., K.M.G., L.P.S., K.H.T., P.D.G., F.Y., J.T.C.,
L.H.L., K.T., L.C., N.K., Y.S.C., J.G.E., M.E.W., S.Y.C., N.M. and
Y.S.L. contributed to the concept and design of the study. I.M.A.,
J.Y.H., Y.H.C. and Y.S.L. contributed to the analysis and interpre-
tation of data. S.A.S., I.M.A., M.T.T., W.L.Y., J.Y.H., Y.H.C.,
S.N., S.L.L., S.S.V., M.V.F., K.M.G., L.P.S., K.H.T., P.D.G., F.Y.,
J.T.C., L.H.L., K.T., L.C., N.K., Y.S.C., J.G.E., M.E.W., S.Y.C.,
and Y.S.L. made critical revisions of the manuscript for important
intellectual content. Y.Y.O., N.M. and Y.S.L. have primary respon-
sibility for the final content.
Conflict of interest
K.M.G., P.D.G. and Y.S.C. are part of an academic consortium that
has received research funding, and they have received reimburse-
ment for speaking at conferences sponsored by companies selling
nutritional products. All other authors declare no potential conflict
of interest that might bias the submitted work and no other relation-
ships or activities that could appear to have influenced the submitted
work.
References
1. Gluckman PD, Hanson MA. Developmental origins of disease
paradigm: a mechanistic and evolutionary perspective. Pediatr
Res 2004;56:311–17.
2. Gluckman PD, Hanson MA, Low FM. Evolutionary and devel-
opmental mismatches are consequences of adaptive developmen-
tal plasticity in humans and have implications for later disease
risk. Philos Trans R Soc Lond B Biol Sci 2019;374:20180109.
3. Godfrey KM, Lillycrop KA, Burdge GC, Gluckman PD, Hanson
MA. Epigenetic mechanisms and the mismatch concept of the de-
velopmental origins of health and disease. Pediatr Res 2007;61:
5R–10.
4. Dulloo AG, Jacquet J, Seydoux J, Montani JP. The thrifty ‘catch-
up fat’ phenotype: its impact on insulin sensitivity during growth
trajectories to obesity and metabolic syndrome. Int J Obes 2006;
30:S23–35.
International Journal of Epidemiology, 2020, Vol. 49, No. 5 1601
Dow
nloaded from https://academ
ic.oup.com/ije/article/49/5/1591/5897702 by guest on 04 July 2022
5. Nobili V, Alisi A, Panera N, Agostoni C. Low birthweight and
catch-up-growth associated with metabolic syndrome: a ten year
systematic review. Pediatr Endocrinol Rev 2008;6:241–47.
6. Vickers MH, Breier BH, Cutfield WS, Hofman PL, Gluckman
PD. Fetal origins of hyperphagia, obesity, and hypertension and
postnatal amplification by hypercaloric nutrition. Am J Physiol-
Endocrinol Metab 2000;279:E83–87.
7. Painter RC, Roseboom TJ, Bleker OP. Prenatal exposure to the
Dutch famine and disease in later life: an overview. Reprod
Toxicol 2005;20:345–52.
8. Bavdekar A, Yajnik CS, Fall CH et al. Insulin resistance syn-
drome in 8-year-old Indian children: small at birth, big at 8
years, or both? Diabetes 1999;48:2422–29.
9. Berends LM, Dearden L, Tung YCL, Voshol P, Fernandez-
Twinn DS, Ozanne SE. Programming of central and peripheral
insulin resistance by low birthweight and postnatal catch-up
growth in male mice. Diabetologia 2018;61:2225–34.
10. Tarry-Adkins JL, Ozanne SE. Poor Early Growth and Age-
Associated Disease. Biochemistry and Cell Biology of Ageing:
Part II Clinical Science. Singapore: Springer Singapore, 2019,
pp. 1–19.
11. Fabricius-Bjerre S, Jensen RB, Færch K et al. Impact of birth-
weight and early infant weight gain on insulin resistance and as-
sociated cardiovascular risk factors in adolescence. PLoS One
2011;6:e20595.
12. Huxley RR, Shiell AW, Law CM. The role of size at birth and
postnatal catch-up growth in determining systolic blood pres-
sure: a systematic review of the literature. J Hypertens 2000;18:
815–31.
13. Ong KKL, Ahmed ML, Emmett PM, Preece MA, Dunger DB.
Association between postnatal catch-up growth and obesity in
childhood: prospective cohort study. BMJ 2000;320:967–71.
14. Lurbe E, Garcia-Vicent C, Torro MI, Aguilar F, Redon J.
Associations of birthweight and postnatal weight gain with car-
diometabolic risk parameters at 5 years of age. Hypertension
2014;63:1326–32.
15. Ananth CV, Vintzileos AM. Distinguishing pathological from
constitutional small for gestational age births in population-
based studies. Early Hum Dev 2009;85:653–58.
16. Sonnenschein-van der Voort AMM, Jaddoe VWV, Raat H et al.
Fetal and infant growth and asthma symptoms in preschool chil-
dren: the Generation R Study. Am J Respir Crit Care Med 2012;
185:731–37.
17. Bigaard J, Frederiksen K, Tjønneland A et al. Body fat and fat-
free mass and all-cause mortality. Obesity Res 2004;12:
1042–49.
18. Speliotes EK, Massaro JM, Hoffmann U et al. Fatty liver is asso-
ciated with dyslipidemia and dysglycemia independent of vis-
ceral fat: the Framingham heart study. Hepatology 2010;51:
1979–87.
19. Despres JP. Abdominal obesity: the most prevalent cause of the
metabolic syndrome and related cardiometabolic risk. Eur Heart
J Suppl 2006;8:B4–12.
20. Brumbaugh DE, Crume TL, Nadeau K, Scherzinger A, Dabelea
D. Intramyocellular lipid is associated with visceral adiposity,
markers of insulin resistance, and cardiovascular risk in prepu-
bertal children: the EPOCH study. J Clin Endocrinol Metab
2012;97:E1099–105.
21. Soh SE, Tint MT, Gluckman PD et al.; GUSTO study group.
Cohort Profile: Growing up in Singapore towards healthy out-
comes (GUSTO) birth cohort study. Int J Epidemiol 2014;43:
1401–09.
22. Nesbitt-Hawes EM, Tetstall E, Gee K, Welsh AW. Ultrasound
(in)accuracy: it’s in the formulae not in the technique - assess-
ment of accuracy of abdominal circumference measurement in
term pregnancies. Australas J Ultrasound Med 2014;17:38–44.
23. Papageorghiou AT, Ohuma EO, Altman DG et al. International
standards for fetal growth based on serial ultrasound measure-
ments: the Fetal Growth Longitudinal Study of the
INTERGROWTH-21st Project. Lancet 2014;384:869–79.
24. Gishti O, Gaillard R, Manniesing R et al. Fetal and infant
growth patterns associated with total and abdominal fat distri-
bution in school-age children. J Clin Endocrinol Metab 2014;99:
2557–66.
25. Vogelezang S, Santos S, Toemen L, Oei EHG, Felix JF, Jaddoe V.
Associations of fetal and infant weight change with general, vis-
ceral, and organ adiposity at school age. JAMA Netw Open
2019;2:e192843.
26. Toemen L, De Jonge LL, Gishti O et al. Longitudinal growth
during fetal life and infancy and cardiovascular outcomes at
school-age. J Hypertens 2016;34:1396–406.
27. Aris IM, Bernard JY, Chen LW et al. Infant body mass index
peak and early childhood cardiometabolic risk markers in a
multi-ethnic Asian birth cohort. Int J Epidemiol 2017;46:
513–25.
28. WHO Multicentre Growth Reference Study Group. WHO Child
Growth Standards: Length/Height-For Age, Weight-For-Age,
Weight-For-Length, Weight-For-Height and Body Mass Index-
For-Age, Methods and Development. Geneva: World Health
Organization, 2006.
29. Cole TJ, Green PJ. Smoothing reference centile curves: the LMS
method and penalized likelihood. Stat Med 1992;11:1305–19.
30. Chen LW, Tint MT, Fortier MV et al. Body composition mea-
surement in young children using quantitative magnetic reso-
nance: a comparison with air displacement plethysmography.
Pediatr Obes 2018;13:365–73.
31. Sadananthan SA, Tint MT, Michael N et al. Association between
early life weight gain and abdominal fat partitioning at 4.5 years
is sex, ethnicity, and age dependent. Obesity 2019;27:470–78.
32. Sadananthan SA, Prakash B, Leow MKS et al. Automated seg-
mentation of visceral and subcutaneous (deep and superficial)
adipose tissues in normal and overweight men. J Magn Reson
Imaging 2015;41:924–34.
33. Michael N, Gupta V, Sadananthan SA et al. Determinants of
intramyocellular lipid accumulation in early childhood. Int J
Obes 2020;44:1141–51.
34. Matthews DR, Hosker JP, Rudenski AS, Naylor BA, Treacher
DF, Turner RC. Homeostasis model assessment: insulin resis-
tance and b-cell function from fasting plasma glucose and insulin
concentrations in man. Diabetologia 1985;28:412–19.
35. Aris IM, Bernard JY, Chen LW et al. Postnatal height and adi-
posity gain, childhood blood pressure and prehypertension risk
in an Asian birth cohort. Int J Obes 2017;41:1011–17.
36. Aris IM, Soh SE, Tint MT et al. Associations of gestational glyce-
mia and prepregnancy adiposity with offspring growth and
1602 International Journal of Epidemiology, 2020, Vol. 49, No. 5
Dow
nloaded from https://academ
ic.oup.com/ije/article/49/5/1591/5897702 by guest on 04 July 2022
adiposity in an Asian population. Am J Clin Nutr 2015;102:
1104–12.
37. Ng S, Aris IM, Tint MT et al. High maternal circulating cotinine
during pregnancy is associated with persistently shorter stature
from birth to five years in an Asian cohort. Nicotine Tob Res
2019;21:1103–12.
38. Mikolajczyk RT, Zhang J, Betran AP et al. A global reference for
fetal-weight and birth-weight percentiles. Lancet 2011;377:
1855–61.
39. Finucane MM, Samet JH, Horton NJ. Translational methods in
biostatistics: linear mixed effect regression models of alcohol
consumption and HIV disease progression over time. Epidemiol
Perspect Innov 2007;4:8.
40. Johnson W, Balakrishna N, Griffiths PL. Modeling physical
growth using mixed effects models. Am J Phys Anthropol 2013;
150:58–67.
41. Griffiths LJ, Dezateux C, Cole TJ; Millennium Cohort Study
Child Health Group. Differential parental weight and height
contributions to offspring birthweight and weight gain in in-
fancy. Int J Epidemiol 2007;36:104–07.
42. White IR, Royston P, Wood AM. Multiple imputation using
chained equations: issues and guidance for practice. Stat Med
2011;30:377–99.
43. Rubin DB, Multiple Imputation for Nonresponse in Surveys.
Hoboken, NJ: Wiley-Interscience, 2004.
44. Verburg BO, Geelhoed JJM, Steegers EAP et al. Fetal kidney vol-
ume and its association with growth and blood flow in fetal life:
the generation R study. Kidney Intl 2007;72:754–61.
45. Bakker H, Gaillard R, Franco OH et al. Fetal and infant growth
patterns and kidney function at school age. JASN 2014;25:
2607–15.
46. Luyckx VA, Brenner BM. The clinical importance of nephron
mass. J Am Soc Nephrol 2010;21:898–910.
47. Correia-Costa L, Schaefer F, Afonso AC et al. Normalization of
glomerular filtration rate in obese children. Pediatr Nephrol
2016;31:1321–28.
48. Brandt JR, Wong CS, Hanrahan JD, Qualls C, McAfee N,
Watkins SL. Estimating absolute glomerular filtration rate in
children. Pediatr Nephrol 2006;21:1865–72.
49. Hvidt KN. Blood pressure and arterial stiffness in obese children
and adolescents. Dan Med J 2015;62:B5043.
50. Park MH, Skow A, De Matteis S et al. Adiposity and carotid-
intima media thickness in children and adolescents: a systematic
review. BMC Pediatr 2015;15:161.
51. Juhola J, Magnussen CG, Viikari JSA et al. Tracking of serum
lipid levels, blood pressure, and body mass index from childhood
to adulthood: the cardiovascular risk in young Finns study. J
Pediatr 2011;159:584–90.
52. Camhi SM, Katzmarzyk PT. Tracking of cardiometabolic risk
factor clustering from childhood to adulthood. Int J Pediatr
Obes 2010;5:122–29.
53. Iba~nez L, Ong K, Dunger DB, de Zegher F. Early development of
adiposity and insulin resistance after catch-up weight gain in
small-for-gestational-age children. J Clin Endocrinol Metab
2006;91:2153–58.
54. Iba~nez L, Suarez L, Lopez-Bermejo A, Dıaz M, Valls C, de
Zegher F. Early development of visceral fat excess after sponta-
neous catch-up growth in children with low birthweight. J Clin
Endocrinol Metab 2008;93:925–28.
55. Chomtho S, Wells JC, Williams JE, Davies PS, Lucas A, Fewtrell
MS. Infant growth and later body composition: evidence from
the 4-component model. Am J Clin Nutr 2008;87:1776–84.
56. Zheng M, Lamb KE, Grimes C et al. Rapid weight gain during
infancy and subsequent adiposity: a systematic review and meta-
analysis of evidence. Obes Rev 2018;19:321–32.
57. Voerman E, Jaddoe VWV, Franco OH, Steegers EAP, Gaillard
R. Critical periods and growth patterns from fetal life onwards
associated with childhood insulin levels. Diabetologia 2017;60:
81–88.
58. Milovanovic I, Njuieyon F, Deghmoun S, Chevenne D, Levy-
Marchal C, Beltrand J. SGA children with moderate catch-up
growth are showing the impaired insulin secretion at the age of
4. PLoS One 2014;9:e100337.
59. Raaijmakers A, Jacobs L, Rayyan M et al. Catch-up growth in
the first two years of life in Extremely Low Birthweight (ELBW)
infants is associated with lower body fat in young adolescence.
PLoS One 2017;12:e0173349.
60. van de Lagemaat M, Rotteveel J, Lafeber HN, van Weissenbruch
MM. Lean mass and fat mass accretion between term age and 6
months post-term in growth-restricted preterm infants. Eur J
Clin Nutr 2014;68:1261–63.
International Journal of Epidemiology, 2020, Vol. 49, No. 5 1603
Dow
nloaded from https://academ
ic.oup.com/ije/article/49/5/1591/5897702 by guest on 04 July 2022