miR-19, miR-345, miR-519c-5p Serum Levels Predict Adverse Pathology in Prostate Cancer Patients...
11
miR-19, miR-345, miR-519c-5p Serum Levels Predict Adverse Pathology in Prostate Cancer Patients Eligible for Active Surveillance Siao-Yi Wang, Stephen Shiboski, Cassandra D. Belair, Matthew R. Cooperberg, Jeffrey P. Simko, Hubert Stoppler, Janet Cowan, Peter R. Carroll, Robert Blelloch* Department of Urology, Helen Diller Family Comprehensive Cancer Center, University of California San Francisco, San Francisco, California, United States of America Abstract Serum microRNAs hold great promise as easily accessible and measurable biomarkers of disease. In prostate cancer, serum miRNA signatures have been associated with the presence of disease as well as correlated with previously validated risk models. However, it is unclear whether miRNAs can provide independent prognostic information beyond current risk models. Here, we focus on a group of low-risk prostate cancer patients who were eligible for active surveillance, but chose surgery. A major criteria for the low risk category is a Gleason score of 6 or lower based on pre-surgical biopsy. However, a third of these patients are upgraded to Gleason 7 on post surgical pathological analysis. Both in a discovery and a validation cohort, we find that pre-surgical serum levels of miR-19, miR-345 and miR-519c-5p can help identify these patients independent of their pre-surgical age, PSA, stage, and percent biopsy involvement. A combination of the three miRNAs increased the area under a receiver operator characteristics curve from 0.77 to 0.94 (p,0.01). Also, when combined with the CAPRA risk model the miRNA signature significantly enhanced prediction of patients with Gleason 7 disease. In-situ hybridizations of matching tumors showed miR-19 upregulation in transformed versus normal-appearing tumor epithelial, but independent of tumor grade suggesting an alternative source for the increase in serum miR-19a/b levels or the release of pre-existing intracellular miR-19a/b upon progression. Together, these data show that serum miRNAs can predict relatively small steps in tumor progression improving the capacity to predict disease risk and, therefore, potentially drive clinical decisions in prostate cancer patients. It will be important to validate these findings in a larger multi-institutional study as well as with independent methodologies. Citation: Wang S-Y, Shiboski S, Belair CD, Cooperberg MR, Simko JP, et al. (2014) miR-19, miR-345, miR-519c-5p Serum Levels Predict Adverse Pathology in Prostate Cancer Patients Eligible for Active Surveillance. PLoS ONE 9(6): e98597. doi:10.1371/journal.pone.0098597 Editor: Fabio Martelli, IRCCS-Policlinico San Donato, Italy Received August 12, 2013; Accepted May 5, 2014; Published June 3, 2014 Copyright: ß 2014 Wang et al. This is an open-access article distributed under the terms of the Creative Commons Attribution License, which permits unrestricted use, distribution, and reproduction in any medium, provided the original author and source are credited. Funding: This research was funded by the National Institutes of Health R21 CA161615 and a private donation by John and Donna Shoemaker. The funders had no role in study design, data collection and analysis, decision to publish, or preparation of the manuscript. Competing Interests: The authors have declared that no competing interests exist. * E-mail: [email protected] Introduction While prostate specific antigen (PSA)-screening has decreased PCa mortality rates in the U.S., it has done so at the cost of detecting early stage/grade PCa that might not affect a patient’s life if untreated (overdiagnosis) [1–4]. Treating those with low risk disease results in unnecessary morbidities associated with radical interventions such as surgery or radiation (overtreatment) [5]. Active surveillance (AS) is a strategy developed to reduce the treatment of patients with low risk PCa. Such patients are monitored with physical exams, selective imaging, serial PSA assessments, and repeat biopsies. Treatment is then offered to those with signs of progression. Candidates for active surveillance protocols include those with a biopsy Gleason grade of 6 or less (no pattern 4 or 5), PSA 10 ng/ml or less, and stage T1 or T2 disease [6]. Although evidence from multiple institutions suggests that AS is a viable option for men with low-risk PCa, there are considerable misclassification rates when identifying candidates for AS [6,7]. In one study of patients meeting criteria for AS but underwent immediate radical prostatectomy 28% were found to have a higher Gleason grade and 21% were found to have T3 disease on surgical pathology [8]. Several risk models intended to predict post-surgical pathology in low-risk patients using clinical characteristics such as age, PSA, stage, extent of tumor involvement within biopsies have been developed. However, they demonstrate an accuracy of only 61– 79% complicating decision-making [9]. Due to the limitations of PSA as a surrogate for disease progression and significant legitimate concerns about biopsy sampling errors, both patients and clinicians worry that delayed treatment compromises the ability to cure disease [10]. Novel markers that reliably distinguish between low-risk versus intermediate/high-risk disease would be a solution to optimize AS protocols. Growing evidence suggests microRNAs (miRNAs) as potentially promising markers for various malignancies [11]. These small, single-stranded, non-coding RNA molecules are involved in post- transcriptional gene regulation and have an altered expression profile in PCa tissue [12–14]. In addition, miRNAs detected in serum have been used to identify patients with PCa, suggesting their potential as part of a panel of serum-based markers [15,16]. Previously, we used a microfluidic-based multiplex quantitative PLOS ONE | www.plosone.org 1 June 2014 | Volume 9 | Issue 6 | e98597
Transcript of miR-19, miR-345, miR-519c-5p Serum Levels Predict Adverse Pathology in Prostate Cancer Patients...
miR-19, miR-345, miR-519c-5p Serum Levels PredictAdverse Pathology in Prostate Cancer Patients Eligiblefor Active SurveillanceSiao-Yi Wang, Stephen Shiboski, Cassandra D. Belair, Matthew R. Cooperberg, Jeffrey P. Simko,
Hubert Stoppler, Janet Cowan, Peter R. Carroll, Robert Blelloch*
Department of Urology, Helen Diller Family Comprehensive Cancer Center, University of California San Francisco, San Francisco, California, United States of America
Abstract
Serum microRNAs hold great promise as easily accessible and measurable biomarkers of disease. In prostate cancer, serummiRNA signatures have been associated with the presence of disease as well as correlated with previously validated riskmodels. However, it is unclear whether miRNAs can provide independent prognostic information beyond current riskmodels. Here, we focus on a group of low-risk prostate cancer patients who were eligible for active surveillance, but chosesurgery. A major criteria for the low risk category is a Gleason score of 6 or lower based on pre-surgical biopsy. However, athird of these patients are upgraded to Gleason 7 on post surgical pathological analysis. Both in a discovery and a validationcohort, we find that pre-surgical serum levels of miR-19, miR-345 and miR-519c-5p can help identify these patientsindependent of their pre-surgical age, PSA, stage, and percent biopsy involvement. A combination of the three miRNAsincreased the area under a receiver operator characteristics curve from 0.77 to 0.94 (p,0.01). Also, when combined with theCAPRA risk model the miRNA signature significantly enhanced prediction of patients with Gleason 7 disease. In-situhybridizations of matching tumors showed miR-19 upregulation in transformed versus normal-appearing tumor epithelial,but independent of tumor grade suggesting an alternative source for the increase in serum miR-19a/b levels or the releaseof pre-existing intracellular miR-19a/b upon progression. Together, these data show that serum miRNAs can predictrelatively small steps in tumor progression improving the capacity to predict disease risk and, therefore, potentially driveclinical decisions in prostate cancer patients. It will be important to validate these findings in a larger multi-institutionalstudy as well as with independent methodologies.
Citation: Wang S-Y, Shiboski S, Belair CD, Cooperberg MR, Simko JP, et al. (2014) miR-19, miR-345, miR-519c-5p Serum Levels Predict Adverse Pathology inProstate Cancer Patients Eligible for Active Surveillance. PLoS ONE 9(6): e98597. doi:10.1371/journal.pone.0098597
Editor: Fabio Martelli, IRCCS-Policlinico San Donato, Italy
Received August 12, 2013; Accepted May 5, 2014; Published June 3, 2014
Copyright: � 2014 Wang et al. This is an open-access article distributed under the terms of the Creative Commons Attribution License, which permitsunrestricted use, distribution, and reproduction in any medium, provided the original author and source are credited.
Funding: This research was funded by the National Institutes of Health R21 CA161615 and a private donation by John and Donna Shoemaker. The funders hadno role in study design, data collection and analysis, decision to publish, or preparation of the manuscript.
Competing Interests: The authors have declared that no competing interests exist.
* E-mail: [email protected]
Introduction
While prostate specific antigen (PSA)-screening has decreased
PCa mortality rates in the U.S., it has done so at the cost of
detecting early stage/grade PCa that might not affect a patient’s
life if untreated (overdiagnosis) [1–4]. Treating those with low risk
disease results in unnecessary morbidities associated with radical
interventions such as surgery or radiation (overtreatment) [5].
Active surveillance (AS) is a strategy developed to reduce the
treatment of patients with low risk PCa. Such patients are
monitored with physical exams, selective imaging, serial PSA
assessments, and repeat biopsies. Treatment is then offered to
those with signs of progression. Candidates for active surveillance
protocols include those with a biopsy Gleason grade of 6 or less (no
pattern 4 or 5), PSA 10 ng/ml or less, and stage T1 or T2 disease
[6]. Although evidence from multiple institutions suggests that AS
is a viable option for men with low-risk PCa, there are
considerable misclassification rates when identifying candidates
for AS [6,7]. In one study of patients meeting criteria for AS but
underwent immediate radical prostatectomy 28% were found to
have a higher Gleason grade and 21% were found to have T3
disease on surgical pathology [8].
Several risk models intended to predict post-surgical pathology
in low-risk patients using clinical characteristics such as age, PSA,
stage, extent of tumor involvement within biopsies have been
developed. However, they demonstrate an accuracy of only 61–
79% complicating decision-making [9]. Due to the limitations of
PSA as a surrogate for disease progression and significant
legitimate concerns about biopsy sampling errors, both patients
and clinicians worry that delayed treatment compromises the
ability to cure disease [10]. Novel markers that reliably distinguish
between low-risk versus intermediate/high-risk disease would be a
solution to optimize AS protocols.
Growing evidence suggests microRNAs (miRNAs) as potentially
promising markers for various malignancies [11]. These small,
single-stranded, non-coding RNA molecules are involved in post-
transcriptional gene regulation and have an altered expression
profile in PCa tissue [12–14]. In addition, miRNAs detected in
serum have been used to identify patients with PCa, suggesting
their potential as part of a panel of serum-based markers [15,16].
Previously, we used a microfluidic-based multiplex quantitative
PLOS ONE | www.plosone.org 1 June 2014 | Volume 9 | Issue 6 | e98597
reverse transcriptase polymerase chain reaction (qRT-PCR)
method to identify serum miRNA signatures in men with PCa
that associate with the validated Cancer of the Prostate Risk
Assessment (CAPRA) score for risk assessment [17]. However, this
previous study did not determine whether any of these miRNAs
could provide independent prognostic value. Therefore, here we
aimed to identify a serum miRNA signature that could subcate-
gorize pre-surgical patients with low-risk assessment scores into
those with greater or lesser risk of progression. Due to the long
follow-up required to identify patients that clinically progress and
relatively short time span in which AS has been in practice, we
evaluated post-surgical pathology as a surrogate marker. We found
a three miRNA signature that could predict worse pathological
disease than assumed based on pre-surgical biopsy. We propose
that such a signature has the potential to identify a large number of
patients that are unlikely to benefit from immediate surgery (i.e.
low clinical score combined with an absence of a positive miRNA
signature), although such a conclusion awaits a larger cross-
institutional study with long term follow-up.
Materials and Methods
Ethics StatementSerum and tissue samples as well as clinical data were collected
between 2002 and 2012. All patients provided written consent to
have their samples and linked clinical data banked for clinical and
basic research purposes. The UCSF Committee on Human
Research approved the consent process. For this study, all samples
and data were de-identified and, therefore, did not require any
additional IRB approval.
Study DesignThe study design followed the principle of prospective specimen
collection and retrospective blinded evaluation (PRoBE) design
[18] and reported following the REMARK guidelines [19]. All
serum samples were collected routinely at the time of surgery after
induction of anesthesia but prior to any procedural intervention
and stored at -80uC until use. Formalin-fixed, paraffin-embedded
(FFPE) radical prostatectomy tissue blocks were archived and
available for analysis.
Patients included in the study were those opting for immediate
radical prostatectomy who met the UCSF low-risk criteria for AS
including biopsy Gleason 2–6 (no pattern 4 or 5), PSA less than
10 ng/ml, less than 34% of biopsy cores involved, less than 50%
involvement in any single core, and clinical T1–T2 stage disease.
A pathologic Gleason score of 7 of higher is associated with an
increased risk of PCa mortality [20] and, therefore, was used to
define adverse pathology. The discovery cohort consisted of 48
patients with a post-surgical pathologic Gleason score of 7 or
higher (case group) and 48 patients with a pathologic Gleason
score of 6 (control group). A validation cohort consisted of 25 cases
and 35 controls. Patients were chosen from available samples
maintained in a UCSF tissue bank. Patients fitting criteria above
were selected from the available pool based on a random integer
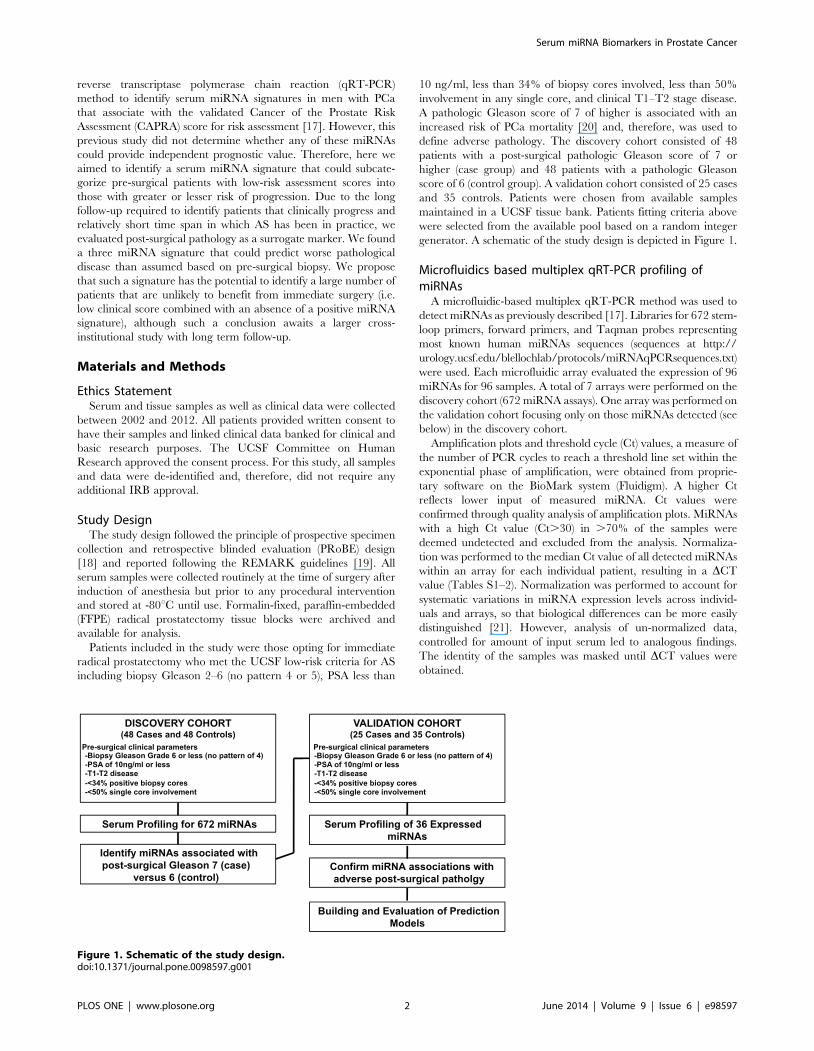
generator. A schematic of the study design is depicted in Figure 1.
Microfluidics based multiplex qRT-PCR profiling ofmiRNAs
A microfluidic-based multiplex qRT-PCR method was used to
detect miRNAs as previously described [17]. Libraries for 672 stem-
loop primers, forward primers, and Taqman probes representing
most known human miRNAs sequences (sequences at http://
urology.ucsf.edu/blellochlab/protocols/miRNAqPCRsequences.txt)
were used. Each microfluidic array evaluated the expression of 96
miRNAs for 96 samples. A total of 7 arrays were performed on the
discovery cohort (672 miRNA assays). One array was performed on
the validation cohort focusing only on those miRNAs detected (see
below) in the discovery cohort.
Amplification plots and threshold cycle (Ct) values, a measure of
the number of PCR cycles to reach a threshold line set within the
exponential phase of amplification, were obtained from proprie-
tary software on the BioMark system (Fluidigm). A higher Ct
reflects lower input of measured miRNA. Ct values were
confirmed through quality analysis of amplification plots. MiRNAs
with a high Ct value (Ct.30) in .70% of the samples were
deemed undetected and excluded from the analysis. Normaliza-
tion was performed to the median Ct value of all detected miRNAs
within an array for each individual patient, resulting in a DCT
value (Tables S1–2). Normalization was performed to account for
systematic variations in miRNA expression levels across individ-
uals and arrays, so that biological differences can be more easily
distinguished [21]. However, analysis of un-normalized data,
controlled for amount of input serum led to analogous findings.
The identity of the samples was masked until DCT values were
obtained.
Figure 1. Schematic of the study design.doi:10.1371/journal.pone.0098597.g001
Serum miRNA Biomarkers in Prostate Cancer
PLOS ONE | www.plosone.org 2 June 2014 | Volume 9 | Issue 6 | e98597
Statistical AnalysisInitial analyses compared distributions of normalized DCt
values from miRNAs between cases and controls in the discovery
sample using graphical summaries and the Wilcoxon rank-sum test
to assess significance. Logistic regression models were then fitted to
candidate miRNAs singly, adjusting for age, PSA, stage, and
degree of biopsy involvement including percent cores tumor
positive and percent of total length of cores involved. Candidate
miRNAs were included in models both as continuous measures,
and as binary categorical variables. Cut-off values for the latter
were determined using separate classification tree models or by the
median for each miRNA. Both cut-offs gave similar results.
Prediction performance of models was distinguished using
receiver operating characteristic (ROC) area under the curve
(AUC) values. A separate analysis based on a random forest
classification model [22] was also conducted including all
detectable miRNAs as well as age, PSA, stage, and degree of
biopsy involvement as predictors. The results of this analysis were
used to provide an independent assessment of variable importance,
and for confirmation of results from the simpler logistic models.
For the validation cohort, only those miRNAs that were
detected in .30% of the samples in the discovery cohort were
measured. Normalizing to all detected miRNAs run on a single
array changed the breadth ofDCt values for a given miRNA, often
improving differences between cases and controls. Analytic
approaches described above for discovery were similarly applied
in the validation cohort. Final analyses focused on miRNAs
detected as significant predictors in the discovery cohort that also
were significant in the validation set. Only markers with adjusted
p-values (based on false discovery rate methods) of at most 0.1 in
discovery analyses were considered. These were modeled singly
and jointly in logistic regression models also controlling for the
same characteristics considered in analyses for the discovery
cohort. In addition, we investigated the use of selected miRNAs to
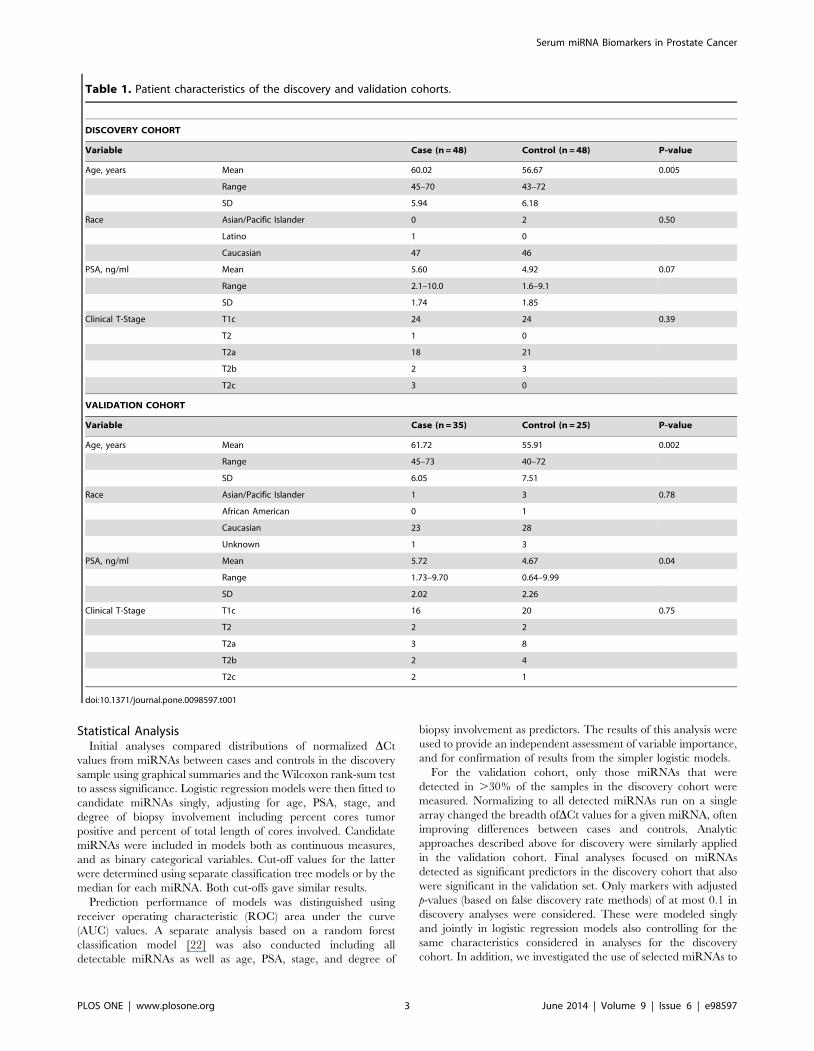
Table 1. Patient characteristics of the discovery and validation cohorts.
DISCOVERY COHORT
Variable Case (n = 48) Control (n = 48) P-value
Age, years Mean 60.02 56.67 0.005
Range 45–70 43–72
SD 5.94 6.18
Race Asian/Pacific Islander 0 2 0.50
Latino 1 0
Caucasian 47 46
PSA, ng/ml Mean 5.60 4.92 0.07
Range 2.1–10.0 1.6–9.1
SD 1.74 1.85
Clinical T-Stage T1c 24 24 0.39
T2 1 0
T2a 18 21
T2b 2 3
T2c 3 0
VALIDATION COHORT
Variable Case (n = 35) Control (n = 25) P-value
Age, years Mean 61.72 55.91 0.002
Range 45–73 40–72
SD 6.05 7.51
Race Asian/Pacific Islander 1 3 0.78
African American 0 1
Caucasian 23 28
Unknown 1 3
PSA, ng/ml Mean 5.72 4.67 0.04
Range 1.73–9.70 0.64–9.99
SD 2.02 2.26
Clinical T-Stage T1c 16 20 0.75
T2 2 2
T2a 3 8
T2b 2 4
T2c 2 1
doi:10.1371/journal.pone.0098597.t001
Serum miRNA Biomarkers in Prostate Cancer
PLOS ONE | www.plosone.org 3 June 2014 | Volume 9 | Issue 6 | e98597
supplement the well-validated CAPRA score [23] as an index of
disease risk as described in more detail in results.
Additional descriptive analyses were conducted to compare
selected patient characteristics between the discovery and valida-
tion cohorts. Formal testing was based on Fisher’s Exact test (for
categorical characteristics) and the Wilcoxon rank-sum test (for
quantitative characteristics).
All statistical analyses were performed using R (version 3.02)
and Stata (version 13.1).
In-situ hybridizationsSlides with sections (5 mm) of FFPE tumor samples from the
patient cohort were deparaffinized in Xylene and hydrated
through decreasing ethanol concentrations into PBS. The slides
were then treated with 300 ml of proteinase-K (15 mg/ml in PK
buffer, 5 mM Tris-HCl ph 7.4, 1 mM EDTA, 1 mM NaCl) at
37uc in a hybridizer (Dako) for 10 minutes. After two PBS washes,
the sections were dehydrated through increasing ethanol concen-
trations and air-dried for 15 minutes. Double DIG-labeled locked-
nucleic acid (LNA) probes (Exiqon) for individual miRNAs were
denatured by heating at 90uc for 4 minutes then diluted to 40 nM
using in situ hybridization buffer (Enzo Life Sciences). The sections
were hybridized with 50 ml of diluted probe at 54uC overnight
then washed in decreasing SSC concentrations at hybridization
temperature. Following a 5 minute incubation in 0.2xSSC at room
temperature, the slides were washed in PBS and blocked with 2%
blocking solution (Roche) for 15 minutes. The sections were then
treated with alkaline phosphatase (AP)-conjugated anti-DIG
(Roche) diluted 1:800 in blocking solution containing 2% sheep
serum for 60 minutes. After two washes in AP buffer (100 mM
Tris ph 9.5, 50 mM MgCl2, 100 mM NaCl, 0.1% Tween-20,
2 mM levamisol), the sections were incubated in BM Purple AP
substrate (Roche) in the dark at 4uC overnight. The slides were
then washed twice in PBS containing 0.1% Tween-20 and washed
twice in water. Following a 30 second treatment with Nuclear-Fast
Red (Vector), the slides were dehydrated though increasing
ethanol concentrations then mounted. The stained slides were
evaluated and graded blindly.
Results
MiRNA profiling in Discovery CohortWe aimed to determine whether miRNAs from pre-surgical
serum samples could predict post-surgical pathological upgrade.
Clinical characteristics of the patients in our discovery cohort are
summarized in Table 1. Case (post-surgical Gleason 7) and control
(post-surgical Gleason 6) groups had similar distributions of race
and clinical characteristics. Cases were significantly older than
controls (p = 0.005). PSA levels also were somewhat higher in cases
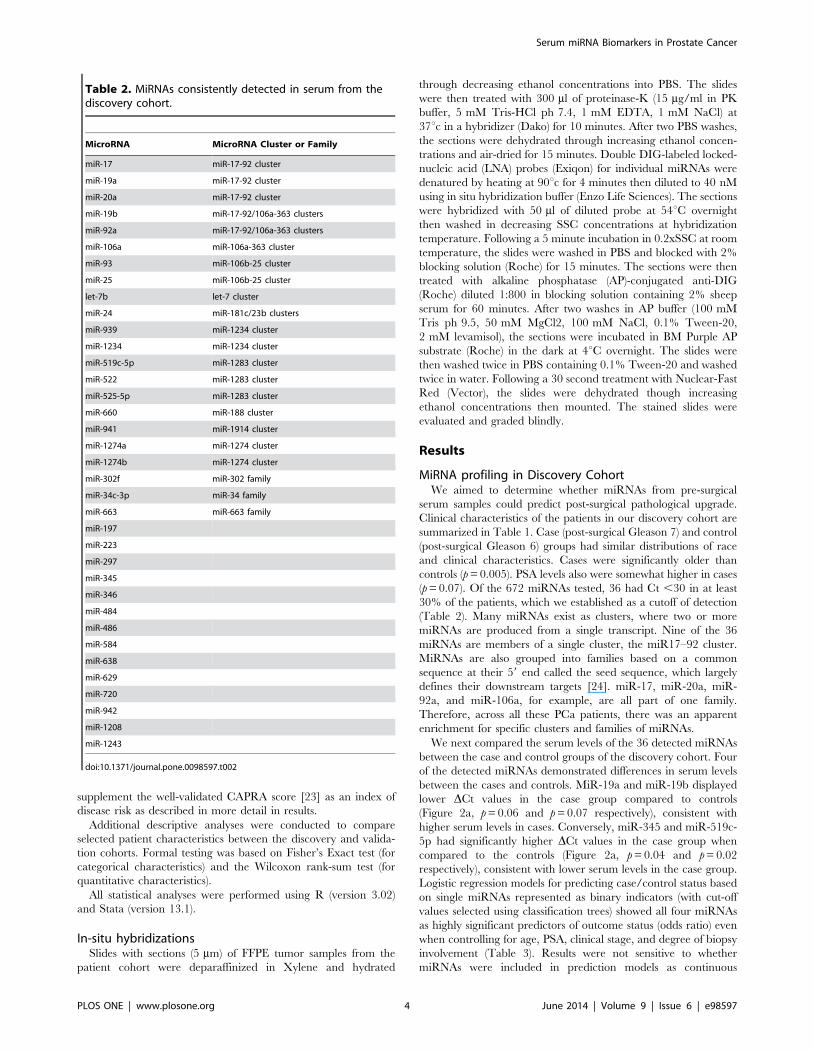
(p = 0.07). Of the 672 miRNAs tested, 36 had Ct ,30 in at least
30% of the patients, which we established as a cutoff of detection
(Table 2). Many miRNAs exist as clusters, where two or more
miRNAs are produced from a single transcript. Nine of the 36
miRNAs are members of a single cluster, the miR17–92 cluster.
MiRNAs are also grouped into families based on a common
sequence at their 59 end called the seed sequence, which largely
defines their downstream targets [24]. miR-17, miR-20a, miR-
92a, and miR-106a, for example, are all part of one family.
Therefore, across all these PCa patients, there was an apparent
enrichment for specific clusters and families of miRNAs.
We next compared the serum levels of the 36 detected miRNAs
between the case and control groups of the discovery cohort. Four
of the detected miRNAs demonstrated differences in serum levels
between the cases and controls. MiR-19a and miR-19b displayed
lower DCt values in the case group compared to controls
(Figure 2a, p = 0.06 and p = 0.07 respectively), consistent with
higher serum levels in cases. Conversely, miR-345 and miR-519c-
5p had significantly higher DCt values in the case group when
compared to the controls (Figure 2a, p = 0.04 and p = 0.02
respectively), consistent with lower serum levels in the case group.
Logistic regression models for predicting case/control status based
on single miRNAs represented as binary indicators (with cut-off
values selected using classification trees) showed all four miRNAs
as highly significant predictors of outcome status (odds ratio) even
when controlling for age, PSA, clinical stage, and degree of biopsy
involvement (Table 3). Results were not sensitive to whether
miRNAs were included in prediction models as continuous
Table 2. MiRNAs consistently detected in serum from thediscovery cohort.
MicroRNA MicroRNA Cluster or Family
miR-17 miR-17-92 cluster
miR-19a miR-17-92 cluster
miR-20a miR-17-92 cluster
miR-19b miR-17-92/106a-363 clusters
miR-92a miR-17-92/106a-363 clusters
miR-106a miR-106a-363 cluster
miR-93 miR-106b-25 cluster
miR-25 miR-106b-25 cluster
let-7b let-7 cluster
miR-24 miR-181c/23b clusters
miR-939 miR-1234 cluster
miR-1234 miR-1234 cluster
miR-519c-5p miR-1283 cluster
miR-522 miR-1283 cluster
miR-525-5p miR-1283 cluster
miR-660 miR-188 cluster
miR-941 miR-1914 cluster
miR-1274a miR-1274 cluster
miR-1274b miR-1274 cluster
miR-302f miR-302 family
miR-34c-3p miR-34 family
miR-663 miR-663 family
miR-197
miR-223
miR-297
miR-345
miR-346
miR-484
miR-486
miR-584
miR-638
miR-629
miR-720
miR-942
miR-1208
miR-1243
doi:10.1371/journal.pone.0098597.t002
Serum miRNA Biomarkers in Prostate Cancer
PLOS ONE | www.plosone.org 4 June 2014 | Volume 9 | Issue 6 | e98597

Serum miRNA Biomarkers in Prostate Cancer
PLOS ONE | www.plosone.org 5 June 2014 | Volume 9 | Issue 6 | e98597
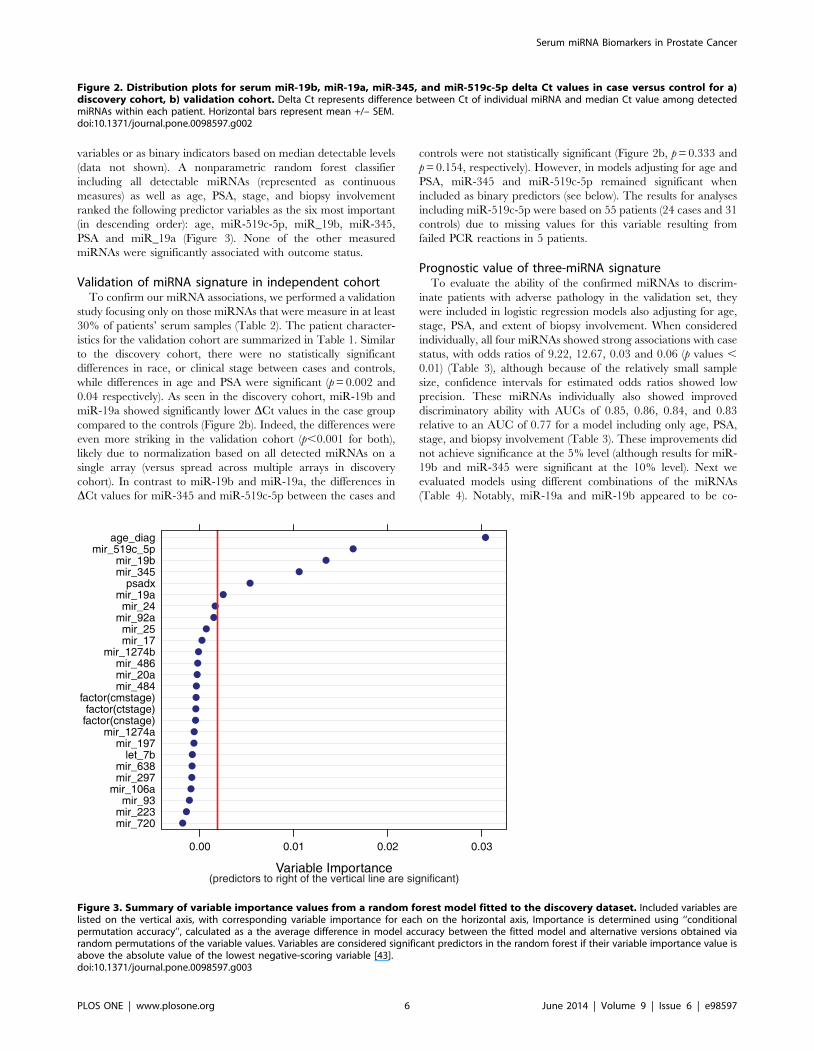
variables or as binary indicators based on median detectable levels
(data not shown). A nonparametric random forest classifier
including all detectable miRNAs (represented as continuous
measures) as well as age, PSA, stage, and biopsy involvement
ranked the following predictor variables as the six most important
(in descending order): age, miR-519c-5p, miR_19b, miR-345,
PSA and miR_19a (Figure 3). None of the other measured
miRNAs were significantly associated with outcome status.
Validation of miRNA signature in independent cohortTo confirm our miRNA associations, we performed a validation
study focusing only on those miRNAs that were measure in at least
30% of patients’ serum samples (Table 2). The patient character-
istics for the validation cohort are summarized in Table 1. Similar
to the discovery cohort, there were no statistically significant
differences in race, or clinical stage between cases and controls,
while differences in age and PSA were significant (p = 0.002 and
0.04 respectively). As seen in the discovery cohort, miR-19b and
miR-19a showed significantly lower DCt values in the case group
compared to the controls (Figure 2b). Indeed, the differences were
even more striking in the validation cohort (p,0.001 for both),
likely due to normalization based on all detected miRNAs on a
single array (versus spread across multiple arrays in discovery
cohort). In contrast to miR-19b and miR-19a, the differences in
DCt values for miR-345 and miR-519c-5p between the cases and
controls were not statistically significant (Figure 2b, p = 0.333 and
p = 0.154, respectively). However, in models adjusting for age and
PSA, miR-345 and miR-519c-5p remained significant when
included as binary predictors (see below). The results for analyses
including miR-519c-5p were based on 55 patients (24 cases and 31
controls) due to missing values for this variable resulting from
failed PCR reactions in 5 patients.
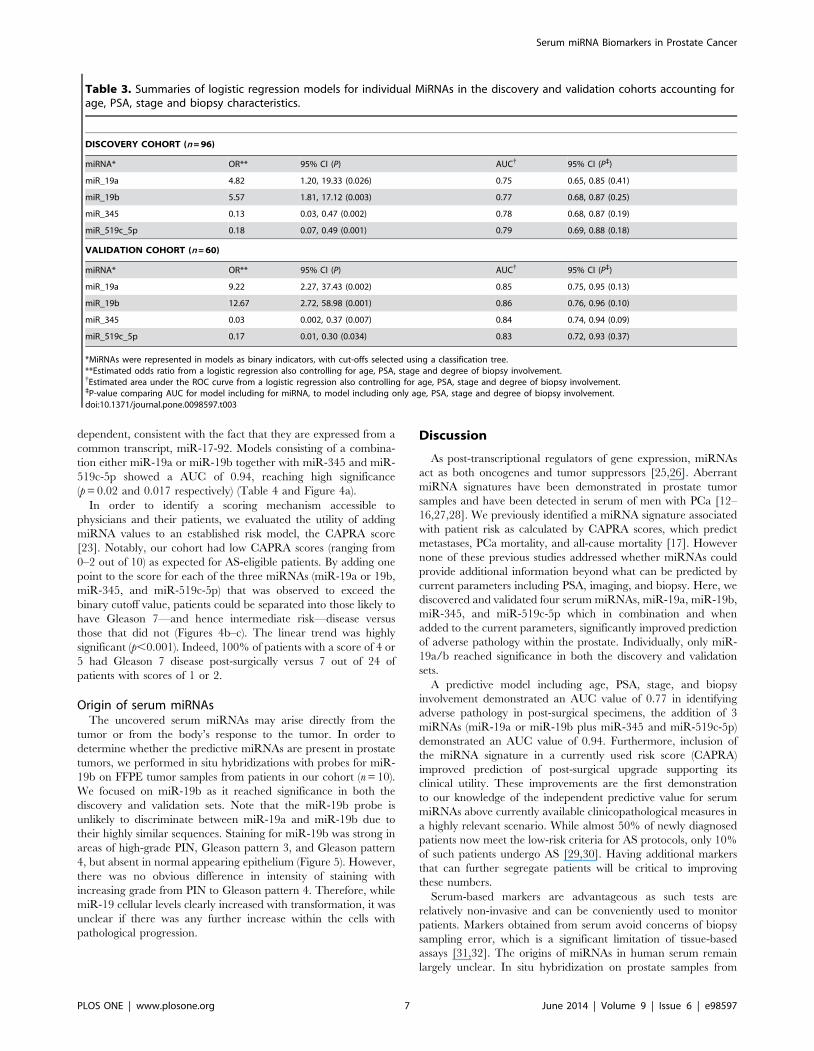
Prognostic value of three-miRNA signatureTo evaluate the ability of the confirmed miRNAs to discrim-
inate patients with adverse pathology in the validation set, they
were included in logistic regression models also adjusting for age,
stage, PSA, and extent of biopsy involvement. When considered
individually, all four miRNAs showed strong associations with case
status, with odds ratios of 9.22, 12.67, 0.03 and 0.06 (p values ,
0.01) (Table 3), although because of the relatively small sample
size, confidence intervals for estimated odds ratios showed low
precision. These miRNAs individually also showed improved
discriminatory ability with AUCs of 0.85, 0.86, 0.84, and 0.83
relative to an AUC of 0.77 for a model including only age, PSA,
stage, and biopsy involvement (Table 3). These improvements did
not achieve significance at the 5% level (although results for miR-
19b and miR-345 were significant at the 10% level). Next we
evaluated models using different combinations of the miRNAs
(Table 4). Notably, miR-19a and miR-19b appeared to be co-
Figure 2. Distribution plots for serum miR-19b, miR-19a, miR-345, and miR-519c-5p delta Ct values in case versus control for a)discovery cohort, b) validation cohort. Delta Ct represents difference between Ct of individual miRNA and median Ct value among detectedmiRNAs within each patient. Horizontal bars represent mean +/– SEM.doi:10.1371/journal.pone.0098597.g002
Figure 3. Summary of variable importance values from a random forest model fitted to the discovery dataset. Included variables arelisted on the vertical axis, with corresponding variable importance for each on the horizontal axis, Importance is determined using ‘‘conditionalpermutation accuracy’’, calculated as a the average difference in model accuracy between the fitted model and alternative versions obtained viarandom permutations of the variable values. Variables are considered significant predictors in the random forest if their variable importance value isabove the absolute value of the lowest negative-scoring variable [43].doi:10.1371/journal.pone.0098597.g003
Serum miRNA Biomarkers in Prostate Cancer
PLOS ONE | www.plosone.org 6 June 2014 | Volume 9 | Issue 6 | e98597
dependent, consistent with the fact that they are expressed from a
common transcript, miR-17-92. Models consisting of a combina-
tion either miR-19a or miR-19b together with miR-345 and miR-
519c-5p showed a AUC of 0.94, reaching high significance
(p = 0.02 and 0.017 respectively) (Table 4 and Figure 4a).
In order to identify a scoring mechanism accessible to
physicians and their patients, we evaluated the utility of adding
miRNA values to an established risk model, the CAPRA score
[23]. Notably, our cohort had low CAPRA scores (ranging from
0–2 out of 10) as expected for AS-eligible patients. By adding one
point to the score for each of the three miRNAs (miR-19a or 19b,
miR-345, and miR-519c-5p) that was observed to exceed the
binary cutoff value, patients could be separated into those likely to
have Gleason 7—and hence intermediate risk—disease versus
those that did not (Figures 4b–c). The linear trend was highly
significant (p,0.001). Indeed, 100% of patients with a score of 4 or
5 had Gleason 7 disease post-surgically versus 7 out of 24 of
patients with scores of 1 or 2.
Origin of serum miRNAsThe uncovered serum miRNAs may arise directly from the
tumor or from the body’s response to the tumor. In order to
determine whether the predictive miRNAs are present in prostate
tumors, we performed in situ hybridizations with probes for miR-
19b on FFPE tumor samples from patients in our cohort (n = 10).
We focused on miR-19b as it reached significance in both the
discovery and validation sets. Note that the miR-19b probe is
unlikely to discriminate between miR-19a and miR-19b due to
their highly similar sequences. Staining for miR-19b was strong in
areas of high-grade PIN, Gleason pattern 3, and Gleason pattern
4, but absent in normal appearing epithelium (Figure 5). However,
there was no obvious difference in intensity of staining with
increasing grade from PIN to Gleason pattern 4. Therefore, while
miR-19 cellular levels clearly increased with transformation, it was
unclear if there was any further increase within the cells with
pathological progression.
Discussion
As post-transcriptional regulators of gene expression, miRNAs
act as both oncogenes and tumor suppressors [25,26]. Aberrant
miRNA signatures have been demonstrated in prostate tumor
samples and have been detected in serum of men with PCa [12–
16,27,28]. We previously identified a miRNA signature associated
with patient risk as calculated by CAPRA scores, which predict
metastases, PCa mortality, and all-cause mortality [17]. However
none of these previous studies addressed whether miRNAs could
provide additional information beyond what can be predicted by
current parameters including PSA, imaging, and biopsy. Here, we
discovered and validated four serum miRNAs, miR-19a, miR-19b,
miR-345, and miR-519c-5p which in combination and when
added to the current parameters, significantly improved prediction
of adverse pathology within the prostate. Individually, only miR-
19a/b reached significance in both the discovery and validation
sets.
A predictive model including age, PSA, stage, and biopsy
involvement demonstrated an AUC value of 0.77 in identifying
adverse pathology in post-surgical specimens, the addition of 3
miRNAs (miR-19a or miR-19b plus miR-345 and miR-519c-5p)
demonstrated an AUC value of 0.94. Furthermore, inclusion of
the miRNA signature in a currently used risk score (CAPRA)
improved prediction of post-surgical upgrade supporting its
clinical utility. These improvements are the first demonstration
to our knowledge of the independent predictive value for serum
miRNAs above currently available clinicopathological measures in
a highly relevant scenario. While almost 50% of newly diagnosed
patients now meet the low-risk criteria for AS protocols, only 10%
of such patients undergo AS [29,30]. Having additional markers
that can further segregate patients will be critical to improving
these numbers.
Serum-based markers are advantageous as such tests are
relatively non-invasive and can be conveniently used to monitor
patients. Markers obtained from serum avoid concerns of biopsy
sampling error, which is a significant limitation of tissue-based
assays [31,32]. The origins of miRNAs in human serum remain
largely unclear. In situ hybridization on prostate samples from
Table 3. Summaries of logistic regression models for individual MiRNAs in the discovery and validation cohorts accounting forage, PSA, stage and biopsy characteristics.
DISCOVERY COHORT (n = 96)
miRNA* OR** 95% CI (P) AUC{ 95% CI (P`)
miR_19a 4.82 1.20, 19.33 (0.026) 0.75 0.65, 0.85 (0.41)
miR_19b 5.57 1.81, 17.12 (0.003) 0.77 0.68, 0.87 (0.25)
miR_345 0.13 0.03, 0.47 (0.002) 0.78 0.68, 0.87 (0.19)
miR_519c_5p 0.18 0.07, 0.49 (0.001) 0.79 0.69, 0.88 (0.18)
VALIDATION COHORT (n = 60)
miRNA* OR** 95% CI (P) AUC{ 95% CI (P`)
miR_19a 9.22 2.27, 37.43 (0.002) 0.85 0.75, 0.95 (0.13)
miR_19b 12.67 2.72, 58.98 (0.001) 0.86 0.76, 0.96 (0.10)
miR_345 0.03 0.002, 0.37 (0.007) 0.84 0.74, 0.94 (0.09)
miR_519c_5p 0.17 0.01, 0.30 (0.034) 0.83 0.72, 0.93 (0.37)
*MiRNAs were represented in models as binary indicators, with cut-offs selected using a classification tree.**Estimated odds ratio from a logistic regression also controlling for age, PSA, stage and degree of biopsy involvement.{Estimated area under the ROC curve from a logistic regression also controlling for age, PSA, stage and degree of biopsy involvement.`P-value comparing AUC for model including for miRNA, to model including only age, PSA, stage and degree of biopsy involvement.doi:10.1371/journal.pone.0098597.t003
Serum miRNA Biomarkers in Prostate Cancer
PLOS ONE | www.plosone.org 7 June 2014 | Volume 9 | Issue 6 | e98597
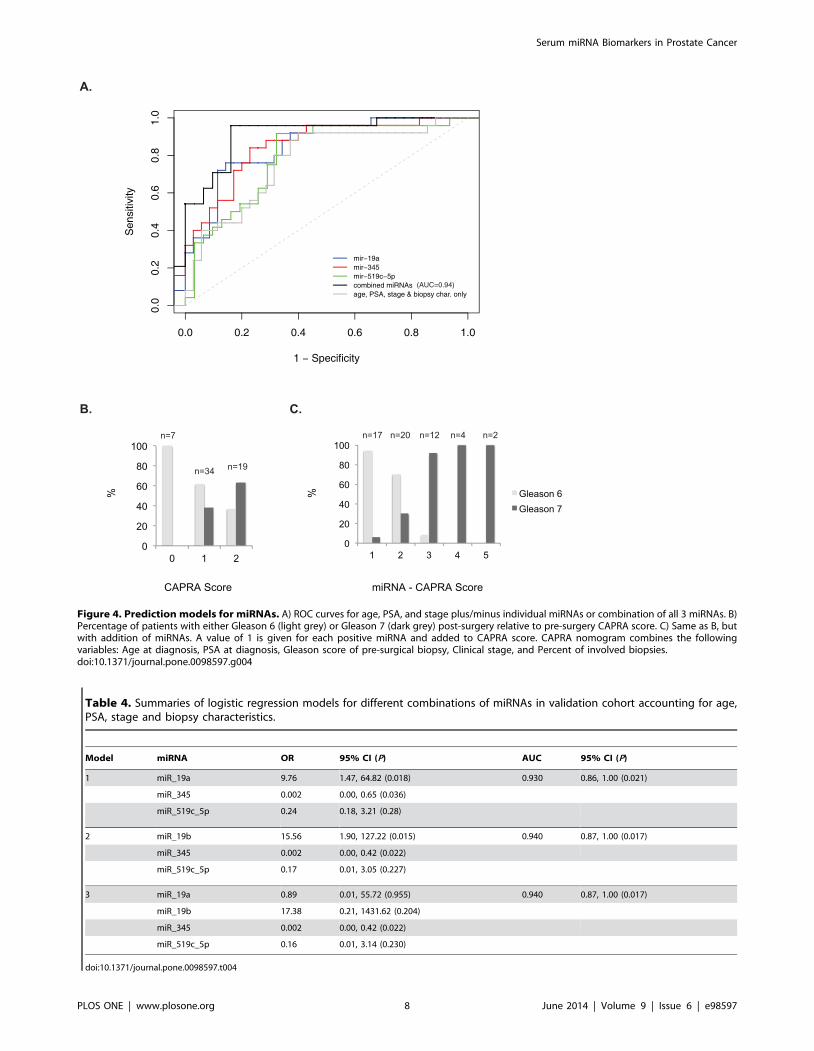
Figure 4. Prediction models for miRNAs. A) ROC curves for age, PSA, and stage plus/minus individual miRNAs or combination of all 3 miRNAs. B)Percentage of patients with either Gleason 6 (light grey) or Gleason 7 (dark grey) post-surgery relative to pre-surgery CAPRA score. C) Same as B, butwith addition of miRNAs. A value of 1 is given for each positive miRNA and added to CAPRA score. CAPRA nomogram combines the followingvariables: Age at diagnosis, PSA at diagnosis, Gleason score of pre-surgical biopsy, Clinical stage, and Percent of involved biopsies.doi:10.1371/journal.pone.0098597.g004
Table 4. Summaries of logistic regression models for different combinations of miRNAs in validation cohort accounting for age,PSA, stage and biopsy characteristics.
Model miRNA OR 95% CI (P) AUC 95% CI (P)
1 miR_19a 9.76 1.47, 64.82 (0.018) 0.930 0.86, 1.00 (0.021)
miR_345 0.002 0.00, 0.65 (0.036)
miR_519c_5p 0.24 0.18, 3.21 (0.28)
2 miR_19b 15.56 1.90, 127.22 (0.015) 0.940 0.87, 1.00 (0.017)
miR_345 0.002 0.00, 0.42 (0.022)
miR_519c_5p 0.17 0.01, 3.05 (0.227)
3 miR_19a 0.89 0.01, 55.72 (0.955) 0.940 0.87, 1.00 (0.017)
miR_19b 17.38 0.21, 1431.62 (0.204)
miR_345 0.002 0.00, 0.42 (0.022)
miR_519c_5p 0.16 0.01, 3.14 (0.230)
doi:10.1371/journal.pone.0098597.t004
Serum miRNA Biomarkers in Prostate Cancer
PLOS ONE | www.plosone.org 8 June 2014 | Volume 9 | Issue 6 | e98597
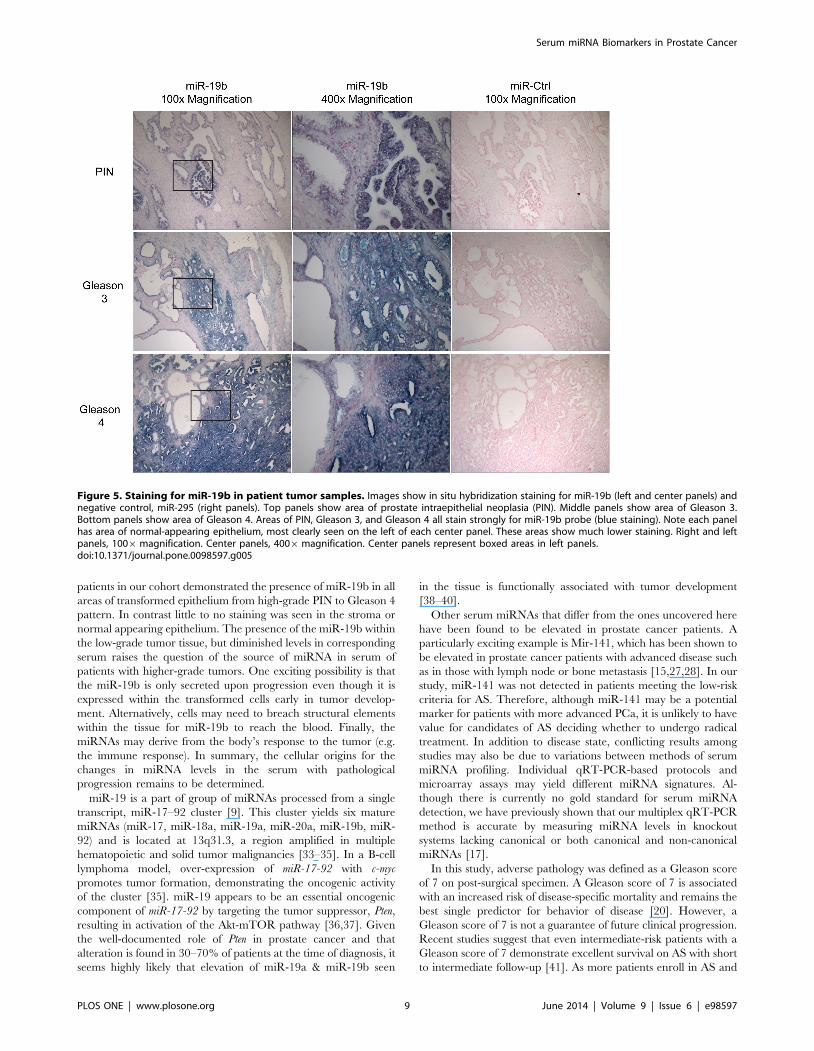
patients in our cohort demonstrated the presence of miR-19b in all
areas of transformed epithelium from high-grade PIN to Gleason 4
pattern. In contrast little to no staining was seen in the stroma or
normal appearing epithelium. The presence of the miR-19b within
the low-grade tumor tissue, but diminished levels in corresponding
serum raises the question of the source of miRNA in serum of
patients with higher-grade tumors. One exciting possibility is that
the miR-19b is only secreted upon progression even though it is
expressed within the transformed cells early in tumor develop-
ment. Alternatively, cells may need to breach structural elements
within the tissue for miR-19b to reach the blood. Finally, the
miRNAs may derive from the body’s response to the tumor (e.g.
the immune response). In summary, the cellular origins for the
changes in miRNA levels in the serum with pathological
progression remains to be determined.
miR-19 is a part of group of miRNAs processed from a single
transcript, miR-17–92 cluster [9]. This cluster yields six mature
miRNAs (miR-17, miR-18a, miR-19a, miR-20a, miR-19b, miR-
92) and is located at 13q31.3, a region amplified in multiple
hematopoietic and solid tumor malignancies [33–35]. In a B-cell
lymphoma model, over-expression of miR-17-92 with c-myc
promotes tumor formation, demonstrating the oncogenic activity
of the cluster [35]. miR-19 appears to be an essential oncogenic
component of miR-17-92 by targeting the tumor suppressor, Pten,
resulting in activation of the Akt-mTOR pathway [36,37]. Given
the well-documented role of Pten in prostate cancer and that
alteration is found in 30–70% of patients at the time of diagnosis, it
seems highly likely that elevation of miR-19a & miR-19b seen
in the tissue is functionally associated with tumor development
[38–40].
Other serum miRNAs that differ from the ones uncovered here
have been found to be elevated in prostate cancer patients. A
particularly exciting example is Mir-141, which has been shown to
be elevated in prostate cancer patients with advanced disease such
as in those with lymph node or bone metastasis [15,27,28]. In our
study, miR-141 was not detected in patients meeting the low-risk
criteria for AS. Therefore, although miR-141 may be a potential
marker for patients with more advanced PCa, it is unlikely to have
value for candidates of AS deciding whether to undergo radical
treatment. In addition to disease state, conflicting results among
studies may also be due to variations between methods of serum
miRNA profiling. Individual qRT-PCR-based protocols and
microarray assays may yield different miRNA signatures. Al-
though there is currently no gold standard for serum miRNA
detection, we have previously shown that our multiplex qRT-PCR
method is accurate by measuring miRNA levels in knockout
systems lacking canonical or both canonical and non-canonical
miRNAs [17].
In this study, adverse pathology was defined as a Gleason score
of 7 on post-surgical specimen. A Gleason score of 7 is associated
with an increased risk of disease-specific mortality and remains the
best single predictor for behavior of disease [20]. However, a
Gleason score of 7 is not a guarantee of future clinical progression.
Recent studies suggest that even intermediate-risk patients with a
Gleason score of 7 demonstrate excellent survival on AS with short
to intermediate follow-up [41]. As more patients enroll in AS and
Figure 5. Staining for miR-19b in patient tumor samples. Images show in situ hybridization staining for miR-19b (left and center panels) andnegative control, miR-295 (right panels). Top panels show area of prostate intraepithelial neoplasia (PIN). Middle panels show area of Gleason 3.Bottom panels show area of Gleason 4. Areas of PIN, Gleason 3, and Gleason 4 all stain strongly for miR-19b probe (blue staining). Note each panelhas area of normal-appearing epithelium, most clearly seen on the left of each center panel. These areas show much lower staining. Right and leftpanels, 1006magnification. Center panels, 4006magnification. Center panels represent boxed areas in left panels.doi:10.1371/journal.pone.0098597.g005
Serum miRNA Biomarkers in Prostate Cancer
PLOS ONE | www.plosone.org 9 June 2014 | Volume 9 | Issue 6 | e98597

data from ongoing trials mature, studies will need to be performed
to determine whether the miRNAs predict future metastasis or
disease-specific mortalities. In addition, prospective trials will be
needed to determine whether they are valuable tools for
monitoring patients while undergoing AS.
In conclusion, this study identifies a serum miRNA signature
that can act as an independent prognostic marker in PCa.
Furthermore, it shows how serum miRNAs can be used to identify
relatively small steps in tumor progression allowing increasing
clinical refinement of disease status. Future studies will be required
to validate these markers in a large cohort across institutions as
well as to associate with long-term outcomes, especially patient
morbidity and mortality. Additionally, it will be important to
validate these miRNAs with additional methodologies of serum
quantification, which are rapidly improving providing greater
sensitivity and specificity.
Note added to revision: While this manuscript was under
review, Tilley and colleagues published data identifying miRNAs
that could predicted risk for biochemical recurrence among
patients with Gleason 7 or greater disease who underwent radical
prostectomy providing additional evidence for the potential of
miRNAs providing prognostic information beyond current clini-
copathological parameters [42].
Supporting Information
Table S1 Delta Ct values for discovery cohort.
(XLSX)
Table S2 Delta Ct values for validation cohort.
(XLSX)
Author Contributions
Conceived and designed the experiments: SYW MRC PRC RB.
Performed the experiments: SYW CDB. Analyzed the data: SYW SS
CDB RB. Contributed reagents/materials/analysis tools: JPS HS JC PRC.
Wrote the paper: SYW SS RB.
References
1. Esserman L, Shieh Y, Thompson I (2009) Rethinking screening for breast cancer
and prostate cancer. JAMA 302: 1685–1692.
2. Hugosson J, Carlsson S, Aus G, Bergdahl S, Khatami A, et al. (2006) Mortality
results from the Goteborg randomised population-based prostate-cancer
screening trial. Lancet Oncol 11: 725–732.
3. Schroder FH, Hugosson J, Roobol MJ, Tammela TL, Ciatto S, et al. (2009)
Screening and prostate-cancer mortality in a randomized European study.
N Engl J Med 360: 1320–1328.
4. Wilt TJ, Brawer MK, Jones KM, Barry MJ, Aronson WJ, et al. (2012) Radical
prostatectomy versus observation for localized prostate cancer. N Engl J Med
367: 203–213.
5. Wilt TJ, MacDonald R, Rutks I, Shamliyan TA, Taylor BC, et al. (2008)
Systematic review: comparative effectiveness and harms of treatments for
clinically localized prostate cancer. Ann Intern Med 148: 435–448.
6. Cooperberg MR, Carroll PR, Klotz L (2011) Active surveillance for prostate
cancer: progress and promise. J Clin Oncol 29: 3669–3676.
7. Suardi N, Capitanio U, Chun FK, Graefen M, Perrotte P, et al. (2008) Currently
used criteria for active surveillance in men with low-risk prostate cancer: an
analysis of pathologic features. Cancer 113: 2068–2072.
8. Conti SL, Dall’era M, Fradet V, Cowan JE, Simko J, et al. (2009) Pathological
outcomes of candidates for active surveillance of prostate cancer. J Urol 181:
1628–1633; discussion 1633–1624.
9. Shariat SF, Karakiewicz PI, Roehrborn CG, Kattan MW (2008) An updated
catalog of prostate cancer predictive tools. Cancer 113: 3075–3099.
10. Dall’Era MA, Cowan JE, Simko J, Shinohara K, Davies B, et al. (2010) Surgical
management after active surveillance for low-risk prostate cancer: pathological
outcomes compared with men undergoing immediate treatment. BJU Int 107:
1232–1237.
11. Chen X, Ba Y, Ma L, Cai X, Yin Y, et al. (2008) Characterization of
microRNAs in serum: a novel class of biomarkers for diagnosis of cancer and
other diseases. Cell Res 18: 997–1006.
12. Ambs S, Prueitt RL, Yi M, Hudson RS, Howe TM, et al. (2008) Genomic
profiling of microRNA and messenger RNA reveals deregulated microRNA
expression in prostate cancer. Cancer Res 68: 6162–6170.
13. Porkka KP, Pfeiffer MJ, Waltering KK, Vessella RL, Tammela TL, et al. (2007)
MicroRNA expression profiling in prostate cancer. Cancer Res 67: 6130–
6135.
14. Tong AW, Fulgham P, Jay C, Chen P, Khalil I, et al. (2009) MicroRNA profile
analysis of human prostate cancers. Cancer Gene Ther 16: 206–216.
15. Mitchell PS, Parkin RK, Kroh EM, Fritz BR, Wyman SK, et al. (2008)
Circulating microRNAs as stable blood-based markers for cancer detection. Proc
Natl Acad Sci U S A 105: 10513–10518.
16. Lodes MJ, Caraballo M, Suciu D, Munro S, Kumar A, et al. (2009) Detection of
cancer with serum miRNAs on an oligonucleotide microarray. PLoS One 4:
e6229.
17. Moltzahn F, Olshen AB, Baehner L, Peek A, Fong L, et al. (2011) Microfluidic-
based multiplex qRT-PCR identifies diagnostic and prognostic microRNA
signatures in the sera of prostate cancer patients. Cancer Res 71: 550–560.
18. Pepe MS, Feng Z, Janes H, Bossuyt PM, Potter JD (2008) Pivotal evaluation of
the accuracy of a biomarker used for classification or prediction: standards for
study design. J Natl Cancer Inst 100: 1432–1438.
19. McShane LM, Altman DG, Sauerbrei W, Taube SE, Gion M, et al. (2005)
Reporting recommendations for tumor marker prognostic studies. J Clin Oncol
23: 9067–9072.
20. Albertsen PC, Hanley JA, Fine J (2005) 20-year outcomes following conserva-
tive management of clinically localized prostate cancer. JAMA 293: 2095–2101.
21. Yang YH, Dudoit S, Luu P, Lin DM, Peng V, et al. (2002) Normalization forcDNA microarray data: a robust composite method addressing single and
multiple slide systematic variation. Nucleic Acids Res 30: e15.
22. Hothorn T, Hornik K, Zeileis A (2006) Unbiased recursive partitioning: A
conditional inference framework. Journal of Computational and Graphical
Statistics 15: 651–674.
23. Cooperberg MR, Pasta DJ, Elkin EP, Litwin MS, Latini DM, et al. (2005) The
University of California, San Francisco Cancer of the Prostate Risk Assessmentscore: a straightforward and reliable preoperative predictor of disease recurrence
after radical prostatectomy. J Urol 173: 1938–1942.
24. Bartel DP (2009) MicroRNAs: target recognition and regulatory functions. Cell
136: 215–233.
25. Calin GA, Croce CM (2006) MicroRNA signatures in human cancers. Nat Rev
Cancer 6: 857–866.
26. Croce CM (2009) Causes and consequences of microRNA dysregulation in
cancer. Nat Rev Genet 10: 704–714.
27. Brase JC, Johannes M, Schlomm T, Falth M, Haese A, et al. (2010) Circulating
miRNAs are correlated with tumor progression in prostate cancer. Int J Cancer
128: 608–616.
28. Yaman Agaoglu F, Kovancilar M, Dizdar Y, Darendeliler E, Holdenrieder S, et
al. (2011) Investigation of miR-21, miR-141, and miR-221 in blood circulationof patients with prostate cancer. Tumour Biol 32: 583–588.
29. Cooperberg MR, Broering JM, Kantoff PW, Carroll PR (2007) Contemporarytrends in low risk prostate cancer: risk assessment and treatment. J Urol 178:
S14–19.
30. Klotz L (2010) Active surveillance for prostate cancer: a review. Curr Urol Rep
11: 165–171.
31. Scattoni V, Zlotta A, Montironi R, Schulman C, Rigatti P, et al. (2007)
Extended and saturation prostatic biopsy in the diagnosis and characterisation ofprostate cancer: a critical analysis of the literature. Eur Urol 52: 1309–1322.
32. Porten SP, Whitson JM, Cowan JE, Cooperberg MR, Shinohara K, et al. (2011)Changes in prostate cancer grade on serial biopsy in men undergoing active
surveillance. J Clin Oncol 29: 2795–2800.
33. Ota A, Tagawa H, Karnan S, Tsuzuki S, Karpas A, et al. (2004) Identification
and characterization of a novel gene, C13orf25, as a target for 13q31-q32
amplification in malignant lymphoma. Cancer Res 64: 3087–3095.
34. Tanzer A, Stadler PF (2004) Molecular evolution of a microRNA cluster. J Mol
Biol 339: 327–335.
35. He L, Thomson JM, Hemann MT, Hernando-Monge E, Mu D, et al. (2005) A
microRNA polycistron as a potential human oncogene. Nature 435: 828–833.
36. Olive V, Bennett MJ, Walker JC, Ma C, Jiang I, et al. (2009) miR-19 is a key
oncogenic component of mir-17-92. Genes Dev 23: 2839–2849.
37. Mu P, Han YC, Betel D, Yao E, Squatrito M, et al. (2009) Genetic dissection of
the miR-17,92 cluster of microRNAs in Myc-induced B-cell lymphomas.Genes Dev 23: 2806–2811.
38. Dahia PL (2000) PTEN, a unique tumor suppressor gene. Endocr Relat Cancer7: 115–129.
39. Gray IC, Stewart LM, Phillips SM, Hamilton JA, Gray NE, et al. (1998)Mutation and expression analysis of the putative prostate tumour-suppressor
gene PTEN. Br J Cancer 78: 1296–1300.
40. Whang YE, Wu X, Suzuki H, Reiter RE, Tran C, et al. (1998) Inactivation of
the tumor suppressor PTEN/MMAC1 in advanced human prostate cancerthrough loss of expression. Proc Natl Acad Sci U S A 95: 5246–5250.
Serum miRNA Biomarkers in Prostate Cancer
PLOS ONE | www.plosone.org 10 June 2014 | Volume 9 | Issue 6 | e98597

41. Cooperberg MR, Cowan JE, Hilton JF, Reese AC, Zaid HB, et al. (2011)
Outcomes of active surveillance for men with intermediate-risk prostate cancer.
J Clin Oncol 29: 228–234.
42. Selth LA, Townley SL, Bert AG, Stricker PD, Sutherland PD, et al. (2013)
Circulating microRNAs predict biochemical recurrence in prostate cancerpatients. Br J Cancer 109: 641–650.
43. Strobl C, Boulesteix AL, Kneib T, Augustin T, Zeileis A (2008) Conditional
variable importance for random forests. BMC Bioinformatics 9: 307.
Serum miRNA Biomarkers in Prostate Cancer
PLOS ONE | www.plosone.org 11 June 2014 | Volume 9 | Issue 6 | e98597