Minimal Rates of Oxygen Consumption in Sick and Premature Newborn Infants
11
Arch. Dis. Childh., 1966, 41, 407. Minimal Rates of Oxygen Consumption in Sick and Premature Newborn Infants J. W. SCOPES and IQBAL AHMED From the Nuffield Neonatal Research Unit, Institute of Child Health, Hammersmith Hospital, London W.12 The total energy expenditure of the living organ- ism has been the subject of interest and research since the eighteenth century when Lavoisier made the fundamental observation that energy is produced in the body by the process of oxidation. The quantity of heat produced by a subject can be measured by direct calorimetry, or indirectly by measurement of the gaseous exchange between a subject and his atmosphere and calculation of heat produced. Use of indirect calorimetry in children was reported as early as 1843 (Andral and Gavarret, 1843; Scharling, 1843), but it was Rubner and Heubner (1898) at the end of the nineteenth century who first devoted detailed attention to very young babies. Since then Benedict and Talbot (1914), Karlberg (1952), and Briick (1961) have reported work to which constant reference is made by workers in this field. Study of metabolic rate and of temperature control are obviously closely related, and newborn babies, especially if premature, are well known to show thermal instability. The purpose of this study was to obtain more information on metabolic rate in babies in the first hours, days, and weeks of life, and to relate it to size, maturity, age, thermal stability and other aspects of neonatal pathology and physiology. This paper is concerned only with minimal rates of 02 consumption. An individual's energy metabolism varies consid- erably and rapidly with such factors as exercise, environmental temperature, and food. In order to compare one individual with another, conditions should be as uniform as possible. In adults the conditions usually described as 'basal' are when the individual is awake, completely quiet physically, and fasting-usually taken early in the morning. These conditions can hardly be described as truly basal (for instance, various workers have found that during a night's sleep energy metabolism is lower still (Wang and Kern, 1928; Bruin, 1931)). Some authors, Received January 31, 1966. therefore, prefer the term 'standard metabolism' (Bierring, 1931; Du Bois, 1936; Karlberg, 1952). With a baby, the fasting state is unsatisfactory for examining 'basal' metabolism. He is always digest- ing one meal or actively anticipating the next. Lee and Iliff (1956) showed in older babies and children that metabolic rate in the awake and fasting state is higher than when the child is in post-prandial sleep. Some workers have chosen the fasting state using a small dose of barbiturate to prevent 'uneasiness' (Baer, 1929; Schadow, 1929; Karlberg, 1952). The 'specific dynamic action' of food in infants is less pronounced than in adults, the maximal increase in energy metabolism being of the order of 4-10% after an ordinary feed (McCance and Strangeways, 1954; Levine, Wilson, and Gottschall, 1928). Until about 1940, the importance of environ- mental temperature and neutral range in babies was not fully appreciated. In 1943 Day, Curtis, and Kelly showed that premature babies more than a week old increased metabolism in the cold, but as recently as 1958 Silverman, Fertig, and Berger were unable to find satisfactory evidence that premature babies less than a week old had a metabolic increase in the cold. The result is that, in much of the early work, it is far from clear whether babies were in a neu- tral thermal environment when 'basal metabolism' was measured. To avoid assumptions implicit in terms 'basal' or 'metabolic rate' in the paper, we have quoted results in terms of what was actually measured, i.e. observed minimal rate of 02 con- sumption. (For purposes of comparison 1 ml./kg. min. = 4*825 cal./kg. min. = 0O29 k. cal./kg. hr. 6'95 k. cal./kg. 24 hr.) Methods An apparatus whereby 02 consumption was measured by the closed circuit principle was built in the workshop of the Postgraduate Medical School. In a thermostatically controlled system, air or other oxygen mixtures were circulated at 25 I./min. over the baby who took up oxygen, giving off carbon dioxide and water vapour. These were removed by soda lime and a 407 group.bmj.com on August 9, 2016 - Published by http://adc.bmj.com/ Downloaded from
-
Upload
independent -
Category
Documents
-
view
6 -
download
0
Transcript of Minimal Rates of Oxygen Consumption in Sick and Premature Newborn Infants
Arch. Dis. Childh., 1966, 41, 407.
Minimal Rates of Oxygen Consumption in Sick andPremature Newborn Infants
J. W. SCOPES and IQBAL AHMEDFrom the Nuffield Neonatal Research Unit, Institute of Child Health, Hammersmith Hospital, London W.12
The total energy expenditure of the living organ-ism has been the subject of interest and researchsince the eighteenth century when Lavoisier madethe fundamental observation that energy is producedin the body by the process of oxidation. Thequantity of heat produced by a subject can bemeasured by direct calorimetry, or indirectly bymeasurement of the gaseous exchange between asubject and his atmosphere and calculation of heatproduced.Use of indirect calorimetry in children was
reported as early as 1843 (Andral and Gavarret,1843; Scharling, 1843), but it was Rubner andHeubner (1898) at the end of the nineteenth centurywho first devoted detailed attention to very youngbabies. Since then Benedict and Talbot (1914),Karlberg (1952), and Briick (1961) have reportedwork to which constant reference is made by workersin this field.
Study of metabolic rate and of temperaturecontrol are obviously closely related, and newbornbabies, especially if premature, are well known toshow thermal instability. The purpose of this studywas to obtain more information on metabolic rate inbabies in the first hours, days, and weeks of life, andto relate it to size, maturity, age, thermal stabilityand other aspects of neonatal pathology andphysiology. This paper is concerned only withminimal rates of 02 consumption.An individual's energy metabolism varies consid-
erably and rapidly with such factors as exercise,environmental temperature, and food. In order tocompare one individual with another, conditionsshould be as uniform as possible. In adults theconditions usually described as 'basal' are when theindividual is awake, completely quiet physically, andfasting-usually taken early in the morning. Theseconditions can hardly be described as truly basal (forinstance, various workers have found that during anight's sleep energy metabolism is lower still (Wangand Kern, 1928; Bruin, 1931)). Some authors,
Received January 31, 1966.
therefore, prefer the term 'standard metabolism'(Bierring, 1931; Du Bois, 1936; Karlberg, 1952).With a baby, the fasting state is unsatisfactory for
examining 'basal' metabolism. He is always digest-ing one meal or actively anticipating the next. Leeand Iliff (1956) showed in older babies and childrenthat metabolic rate in the awake and fasting state ishigher than when the child is in post-prandial sleep.Some workers have chosen the fasting state using asmall dose of barbiturate to prevent 'uneasiness'(Baer, 1929; Schadow, 1929; Karlberg, 1952). The'specific dynamic action' of food in infants is lesspronounced than in adults, the maximal increase inenergy metabolism being of the order of4-10% afteran ordinary feed (McCance and Strangeways, 1954;Levine, Wilson, and Gottschall, 1928).
Until about 1940, the importance of environ-mental temperature and neutral range in babies wasnot fully appreciated. In 1943 Day, Curtis, andKelly showed that premature babies more than aweek old increased metabolism in the cold, but asrecently as 1958 Silverman, Fertig, and Berger wereunable to find satisfactory evidence that prematurebabies less than a week old had a metabolic increasein the cold. The result is that, in much of the earlywork, it is far from clear whether babies were in a neu-tral thermal environment when 'basal metabolism'was measured. To avoid assumptions implicit interms 'basal' or 'metabolic rate' in the paper, we havequoted results in terms of what was actuallymeasured, i.e. observed minimal rate of 02 con-sumption. (For purposes of comparison 1 ml./kg.min. = 4*825 cal./kg. min. = 0O29 k. cal./kg. hr.
6'95 k. cal./kg. 24 hr.)
MethodsAn apparatus whereby 02 consumption was
measured by the closed circuit principle was built in theworkshop of the Postgraduate Medical School. In athermostatically controlled system, air or other oxygenmixtures were circulated at 25 I./min. over the baby whotook up oxygen, giving off carbon dioxide and watervapour. These were removed by soda lime and a
407
group.bmj.com on August 9, 2016 - Published by http://adc.bmj.com/Downloaded from
Scopes and Ahmedcondenser, respectively; any diminution in circuitvolume was, therefore, due to the oxygen consumed.Oxygen was replaced automatically to maintain thevolume and oxygen content of the circulating gases.The oxygen used for replacement was taken from asensitive recording spirometer which was refilled everyminute from an oxygen reservoir. A system resulted inwhich any environmental temperature and any oxygenconcentration of circulating gas could be chosen andthese factors held constant, while the minute by minuteoxygen consumption was measured and recorded. Thebaby, who had no mask or facepiece, lay undisturbed andunder continual observation. He could be removed in amatter of seconds should there be any concern about hiscondition. For a more detailed description of theperformance and accuracy of the apparatus see Scopes(1965), or Hill and Rahimtulla (1965) whose apparatuswas very similar.
Temperatures were measured by thermocouples orthermistors and included colonic temperature (inserted10 cm.-Karlberg, 1949), skin temperature (usuallyabdominal wall), wet and dry bulb temperatures ofambient air, water bath temperature, and room tempera-ture. On some occasions, respiration was recordedcontinuously by an impedance pneumograph (Pallett andScopes, 1965).
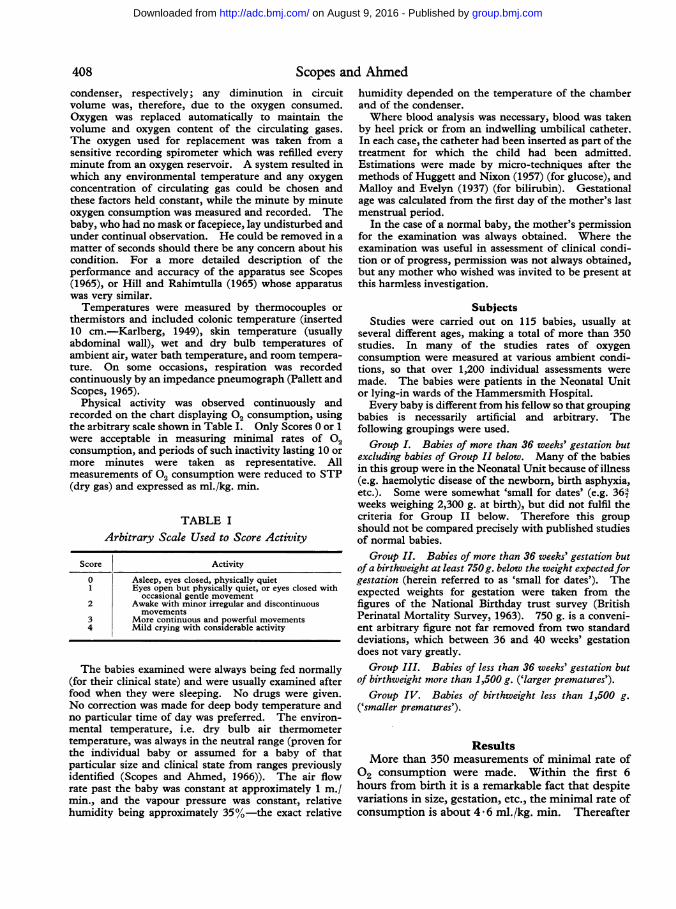
Physical activity was observed continuously andrecorded on the chart displaying 02 consumption, usingthe arbitrary scale shown in Table I. Only Scores 0 or 1were acceptable in measuring minimal rates of 02consumption, and periods of such inactivity lasting 10 ormore minutes were taken as representative. Allmeasurements of 02 consumption were reduced to STP(dry gas) and expressed as ml./kg. min.
TABLE IArbitrary Scale Used to Score Activity
Score Activity
0 Asleep, eyes closed, physically quiet1 Eyes open but physically quiet, or eyes closed with
occasional gentle movement2 Awake with minor irregular and discontinuous
movements3 More continuous and powerful movements4 Mild crying with considerable activity
The babies examined were always being fed normally(for their clinical state) and were usually examined afterfood when they were sleeping. No drugs were given.No correction was made for deep body temperature andno particular time of day was preferred. The environ-mental temperature, i.e. dry bulb air thermometertemperature, was always in the neutral range (proven forthe individual baby or assumed for a baby of thatparticular size and clinical state from ranges previouslyidentified (Scopes and Ahmed, 1966)). The air flowrate past the baby was constant at approximately 1 m./min., and the vapour pressure was constant, relativehumidity being approximately 35%-the exact relative
humidity depended on the temperature of the chamberand of the condenser.Where blood analysis was necessary, blood was taken
by heel prick or from an indwelling umbilical catheter.In each case, the catheter had been inserted as part of thetreatment for which the child had been admitted.Estimations were made by micro-techniques after themethods of Huggett and Nixon (1957) (for glucose), andMalloy and Evelyn (1937) (for bilirubin). Gestationalage was calculated from the first day of the mother's lastmenstrual period.
In the case of a normal baby, the mother's permissionfor the examination was always obtained. Where theexamination was useful in assessment of clinical condi-tion or of progress, permission was not always obtained,but any mother who wished was invited to be present atthis harmless investigation.
SubjectsStudies were carried out on 115 babies, usually at
several different ages, making a total of more than 350studies. In many of the studies rates of oxygenconsumption were measured at various ambient condi-tions, so that over 1,200 individual assessments weremade. The babies were patients in the Neonatal Unitor lying-in wards of the Hammersmith Hospital.Every baby is different from his fellow so that grouping
babies is necessarily artificial and arbitrary. Thefollowing groupings were used.
Group I. Babies of more than 36 weeks' gestation butexcluding babies of Group II below. Many of the babiesin this group were in the Neonatal Unit because of illness(e.g. haemolytic disease of the newborn, birth asphyxia,etc.). Some were somewhat 'small for dates' (e.g. 36'4weeks weighing 2,300 g. at birth), but did not fulfil thecriteria for Group II below. Therefore this groupshould not be compared precisely with published studiesof normal babies.
Group II. Babies of more than 36 weeks' gestation butof a birthweight at least 750g. below the weight expectedforgestation (herein referred to as 'small for dates'). Theexpected weights for gestation were taken from thefigures of the National Birthday trust survey (BritishPerinatal Mortality Survey, 1963). 750 g. is a conveni-ent arbitrary figure not far removed from two standarddeviations, which between 36 and 40 weeks' gestationdoes not vary greatly.Group III. Babies of less than 36 weeks' gestation but
of birthweight more than 1,500 g. ('larger prematures').Group IV. Babies of birthweight less than 1,500 g.
('smaller prematures').
ResultsMore than 350 measurements of minimal rate of
02 consumption were made. Within the first 6hours from birth it is a remarkable fact that despitevariations in size, gestation, etc., the minimal rate ofconsumption is about 4 * 6 ml./kg. min. Thereafter
408
group.bmj.com on August 9, 2016 - Published by http://adc.bmj.com/Downloaded from
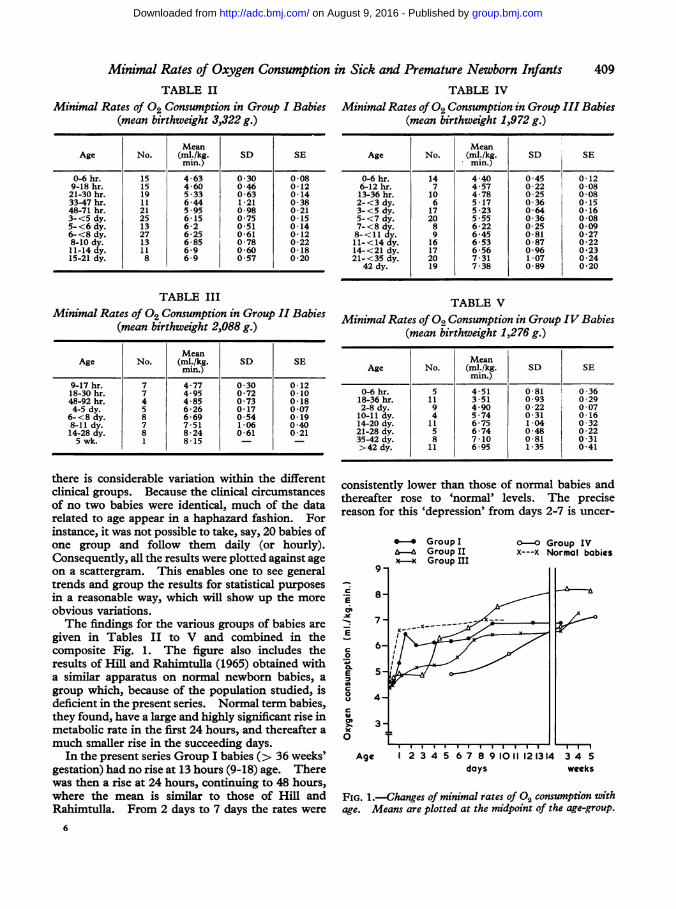
Minimal Rates of Oxygen Consumption in Sick and Premature Newborn InfantsTABLE II
Minimal Rates of 02 Consumption in Group I Babies(mean birthweight 3,322 g.)
MeanAge No. (ml./kg. SD SE
mm.)
0-6 hr. 15 4-63 0*30 0*089-18 hr. 15 4-60 0 46 0-1221-30 hr. 19 5 *33 0*63 0*1433-47 hr. 11 6*44 1*21 0*3848-71 hr. 21 5 *95 0*98 0*213-<5 dy. 25 6-15 0 75 0-155-<6 dy. 13 6-2 0-51 0-146-<8 dy. 27 6-25 0 61 0-128-10 dy. 13 6-85 0*78 0*2211-14 dy. 11 6-9 0 60 0-1815-21 dy. 8 6-9 0 57 0-20
TABLE IIIMinimal Rates of 02 Consumption in Group II Babies
(mean birthweight 2,088 g.)
MeanAge No. (mli/kg. SD SE
min.)
9-17 hr. 7 4-77 0*30 0*1218-30 hr. 7 4 95 0-72 0 1048-92 hr. 4 4-85 073 0184-5 dy. 5 6*26 0*17 0*076-<8 dy. 8 6-69 0 54 0.198-11 dy. 7 7-51 1-06 0 4014-28 dy. 8 8-24 0-61 0-215 wk. 1 8-15 - -
there is considerable variation within the differentclinical groups. Because the clinical circumstancesof no two babies were identical, much of the datarelated to age appear in a haphazard fashion. Forinstance, it was not possible to take, say, 20 babies ofone group and follow them daily (or hourly).Consequently, all the results were plotted against ageon a scattergram. This enables one to see generaltrends and group the results for statistical purposesin a reasonable way, which will show up the moreobvious variations.The findings for the various groups of babies are
given in Tables II to V and combined in thecomposite Fig. 1. The figure also includes theresults of Hill and Rahimtulla (1965) obtained witha similar apparatus on normal newborn babies, agroup which, because of the population studied, isdeficient in the present series. Normal term babies,they found, have a large and highly significant rise inmetabolic rate in the first 24 hours, and thereafter a
much smaller rise in the succeeding days.In the present series Group I babies (> 36 weeks'
gestation) had no rise at 13 hours (9-18) age. Therewas then a rise at 24 hours, continuing to 48 hours,where the mean is similar to those of Hill andRahimtulla. From 2 days to 7 days the rates were
6
TABLE IVMinimal Rates of 02 Consumption in Group III Babies
(mean birthweight 1,972 g.)
MeanAge No. (ml./kg. SD SE
mI. _
0-6 hr. 14 4*40 0 *45 0*126-12 hr. 7 4-57 0-22 0-0813-36 hr. 10 4*78 0*25 0*082-<3 dy. 6 5*17 0*36 0*153-<5 dy. 17 5*23 0*64 0*165-<7 dy. 20 5-55 0-36 0-087-<8 dy. 8 6-22 0-25 0 098-<11 dy. 9 6-45 0-81 0-2711-<14 dy. 16 6-53 0R87 0*2214-<21 dy. 17 6-56 0-96 0-2321-<35 dy. 20 7*31 1*07 0*24
42 dy. 19 7*38 0*89 0*20
TABLE VMinimal Rates of 02 Consumption in Group IV Babies
(mean birthweight 1,276 g.)
MeanAge No. (mi./kg. SD SE
min.)
0-6 hr. 5 4-51 0-81 0-3618-36 hr. 11 3-51 0-93 0-292-8 dy. 9 4-90 0*22 0*0710-11 dy. 4 5 -74 0*31 0*1614-20 dy. 11 6-75 1-04 0-3221-28 dy. 5 6*74 0*48 0*2235-42 dy. 8 7*10 0*81 0*31>42 dy. 11 6-95 1-35 0-41
consistently lower than those of normal babies andthereafter rose to 'normal' levels. The precisereason for this 'depression' from days 2-7 is uncer-
E
ci6
._
E
0
.4.
CE
0
u
x0
*-4* Group I&--- Group II*- Group III
O-O Group IVx---x Normal babies
.
I I
Age 1 2 3 4 5 6 7 8 91011121314 3 4 5days weeks
FIG. 1.-Changes of minimal rates of 02 consumption withage. Means are plotted at the midpoint of the age-group.
409
group.bmj.com on August 9, 2016 - Published by http://adc.bmj.com/Downloaded from
Scopes and Ahmedtain. Possible explanations would include thefollowing. Babies of Group I were not entirelynormal, as explained above, many of them havingjaundice, birth asphyxia, etc. Those who recoveredcompletely were discharged from the NeonatalWard at 48 hours, thus loading the successive dayswith babies who were ill or small. Many babiesincluded in this group were of relatively shortgestation (36-37 weeks) and low birthweight (2,300-2,700 g.). Other factors affecting minimal rates ofoxygen consumption, which often involved thebabies of this group, are discussed below.The Group II babies (36 weeks but 'small for
dates') showed no rise in minimal rate for the first2-3 days of life. Comparing the rates of this groupwith those of Group I babies in the age 24 hours-75hours shows a highly significant difference (p <0 -001).* At 4 days there is a large and significantrise in metabolic rate. Comparing rates 36-72 hourswith rates 4-7 days shows a rise of 1 2 ml./kg. min.(p < 0 001).* Thereafter these 'small for dates'babies have a high minimal rate compared with'term' babies, in terms of ml./kg. min. In the age-group 8 days to 4 weeks it is, on average, higher by0.9 ml./kg. min. (p < 0.001).* It is interesting,and probably more than coincidental, that duringthe relative depression of rate Of 02 consumptionover 1-3 days most of these babies show a tendencyto hypoglycaemia (Cornblath, Wybregt, Baens, andKlein, 1964). In any event, these babies areclinically undernourished and deficient in adiposetissue (Aherne and Hull, 1964), and there is goodreason to regard them as cases of intrauterinestarvation (Gruenwald, 1963). They may bedeficient, therefore, in reserves of substrate foroxidation until feeding is well established. Thehypermetabolism of days 7-28 may of course beartefactual caused by using weight directly as acorrelation factor. However, Sinclair and Silver-man (1965) report similar findings, and manyauthors (Benedict and Talbot, 1914; Levine et al.,1928; Murlin, Conklin, and Marsh, 1925; Janet andBochet, 1933; Fouet, 1924) have found that under-weight children have high metabolic rates (unlessovert starvation syndromes supervene). Indeed,there is a clear suggestion that these babies behaveas underweight babies who are starved in the first 3days of life.The larger premature babies (Group III) show a
slow steady rise for the first 6 days of life. Themore abrupt rise between day 6 and day 7 issignificant (p < 0 * 001).* The low rate comparedwith 'term' babies over days 2-6 is also highlysignificant (p < 0 .001).* Possible reasons for this
* Students 't' test.
low rate lie in the clinical state of many of thesebabies at this age. Common clinical complicationsare idiopathic respiratory distress syndrome, jaund-ice, infections, and feeding difficulties. Again itmay be more than coincidental that a rise occurs onthe 7-8th day when these conditions have usuallysubsided.The very small babies (Group IV) have a 'normal'
minimal rate of 02 consumption at birth, but there-after it is consistently low until the age of 2-3 weeks.If metabolic rate were related to surface area, onewould expect these babies to have a high rate interms of ml./kg. min., whereas the reverse is true.The very low rate shown at 24 hours is caused byloading at this age with babies who were veryseriously ill, and some of whom died.
Specific Factors Affecting Minimal Ratesof 02 Consumption
Quite apart from factors already considered(environmental temperature, food, activity, andcorrelation factors of height, weight, surface area,etc.) it is clear from the scatter obtained that otherfactors and conditions affect the minimal rate of 02consumption. In the adult there is a considerablevolume of work on this subject, but many of thefactors do not obviously apply in the newbornperiod. During the course of the present study anumber of observations, which seemed pertinent tothis aspect, were made and some of them wereexamined more closely.
(a) Deep body temperature. A principle(ascribed to van't Hoff, 1896) is that there isa change in the rate of chemical reaction withchange in temperature. Empirical determinationsfor biological systems have shown an increase inreaction velocity by a factor of 2 to 3 for each 100 C.rise in temperature. This effect is usually calledthe 'Q1O effect'. In vitro mammalian tissue showsthis effect (Fairley, 1961), so it would not beunreasonable to expect it of the total subject, andindeed the whole principle of surgical operationswith hypothermia depends on the effect. (A Q10effect of 2-3 represents a change of rate of 10-12%per 'C.) However, in the intact homeothermicsubject, cooling is physiologically countered by arise in metabolism. None the less, if all observa-tions were made in an environment where there wasno known physiological stimulus to heat production,one still might expect to demonstrate a Q10 effect inbabies. In fact, several authors (Adamsons,Gandy, and James, 1965; Mestyan, Fekete, Bata,and Jarai, 1964; Hill and Rahimtulla, 1965) havefailed to demonstrate this effect.
410
group.bmj.com on August 9, 2016 - Published by http://adc.bmj.com/Downloaded from
Minimal Rates of Oxygen Consumption in Sick and Premature Newborn InfantsBabies in a neutral thermal environment would be
expected to have no stimulus to heat productionfrom skin receptors. Under these conditions plot-ting rectal temperature against rate of 02 consump-tion gives no significant correlation when all babiesare taken as a single group. In the babies under 24hours of age, however, the correlation is significant(p < 0 05). For the babies under 6 hours of agethe correlation is highly significant. Plotting log02 consumption against temperature (and evenexcluding the 4 coldest babies) still gives a significantcorrelation (p < 0 01). The calculated bestregression lines are y = 0* 04379x - 08753 andx 14 23y + 25 42 (y = log 02 consumption,x - rectal temp.). Expressed in antilog form theslope is equivalent to a Q10 of 2-74, agreeing wellwith the expected Q10 for biological systems.
In one particular baby, with a large encephalocele,whose peripheral nerves were apparently intact andwho later at necropsy was shown to have abundantbrown fat, a Q10 effect was clearly demonstrable.At a colonic temperature of 34. 3 C. her rate of 02consumption was 3 - 1 ml./kg. min. When she hadbeen warmed to 35-3 the rate was 3-55 ml./kg. min.-a significant increase of 14%,/ for 10 C. rise. Whenwarmed to 36. 4 C. there was a further rise of 13%(over 3 55 ml./kg. min.) for 1.10 C. rise in rectaltemperature. (These measurements were made inneutral environmental thermal conditions for age,gestation, and size, and on the third day of life whenthe rise cannot be attributed to advancing agebetween the first and last measurement.)The most obvious explanation of why a Q10 effect
is difficult to demonstrate is that it is masked byphysiological stimulus to deep cold receptors. Ifthis is so, one might expect, and indeed it is true,that under anaesthesia (Fairley, 1961) and where nometabolic response at all occurs (above case and inan anencephalic baby (J. R. Hill, 1965, personalcommunication)) one can demonstrate a Q10 effect.That it shows clearly in these young babies anddisappears after 24 hours suggests that eitherextreme youth or the effects of birth suppress theaction of central cold receptors. It may also betrue that in demonstrating a Q10 effect, it is impor-tant to examine a 'mixed bag' of premature andother abnormal babies in whom normal homeostaticfunction may be deranged, because careful work byAdamsons et al. (1965), Mestyan et al. (1964), andHill and Rahimtulla (1965) on normal babies failedto demonstrate a process which is unequivocallyshown in the present data. Indeed, one could saythat the most interesting fact about the Q10 effect isthat it is difficult to demonstrate, rather than that itis demonstrable.
(b) Prematurity. Apart from the first hoursafter birth, premature babies show a low 02 con-sumption rate compared with term babies, as shownabove. This may well be an artefact arisingfrom the use of body weight as a correlationfactor (Sinclair, Scopes, and Silverman, 1966).It appears to be the effect of maturity ratherthan of size, since 'small for dates' babies-afterthe 4th day-do not show the same effect. Ingeneral, the more immature the child, the lower therate Of 02 consumption (see Fig. 1 and Mestyan etal., 1964) and the closer the rate to that obtaining inthe mother (3 65 ml./kg. min.; Dobeln, 1956).The precise reason why prematurity should be
associated with a lower metabolic rate is difficult todefine, as the mechanism whereby basal metabolicrate is controlled is not understood (see discussion).The finding is in general agreement with otherworkers (e.g. Bruck, 1961; Mestyan et al., 1964).The relation to post-conceptual age is interesting.While it is generally true that the more immaturebabies have low metabolic rates, postnatal age alsoplays a part-babies of 6 weeks old, even if veryimmature at birth and still small in size, havemetabolic rates which are not low (Fig. 1).
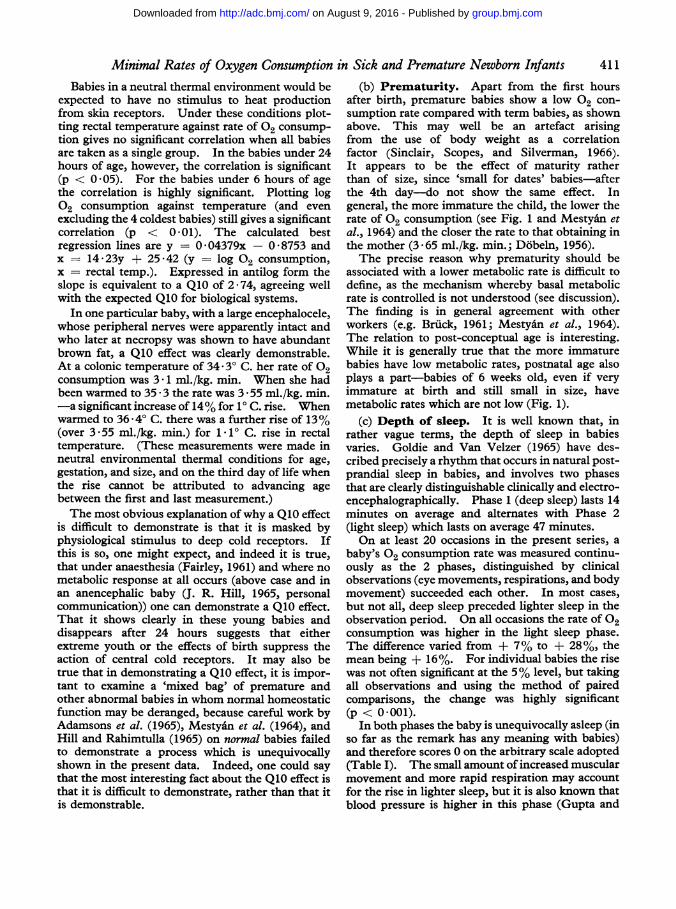
(c) Depth of sleep. It is well known that, inrather vague terms, the depth of sleep in babiesvaries. Goldie and Van Velzer (1965) have des-cribed precisely a rhythm that occurs in natural post-prandial sleep in babies, and involves two phasesthat are clearly distinguishable clinically and electro-encephalographically. Phase 1 (deep sleep) lasts 14minutes on average and alternates with Phase 2(light sleep) which lasts on average 47 minutes.On at least 20 occasions in the present series, a
baby's 02 consumption rate was measured continu-ously as the 2 phases, distinguished by clinicalobservations (eye movements, respirations, and bodymovement) succeeded each other. In most cases,but not all, deep sleep preceded lighter sleep in theobservation period. On all occasions the rate of 02consumption was higher in the light sleep phase.The difference varied from + 7% to + 28%, themean being + 16%. For individual babies the risewas not often significant at the 5% level, but takingall observations and using the method of pairedcomparisons, the change was highly significant(p < 0 001).
In both phases the baby is unequivocally asleep (inso far as the remark has any meaning with babies)and therefore scores 0 on the arbitrary scale adopted(Table I). The small amount ofincreased muscularmovement and more rapid respiration may accountfor the rise in lighter sleep, but it is also known thatblood pressure is higher in this phase (Gupta and
411
group.bmj.com on August 9, 2016 - Published by http://adc.bmj.com/Downloaded from
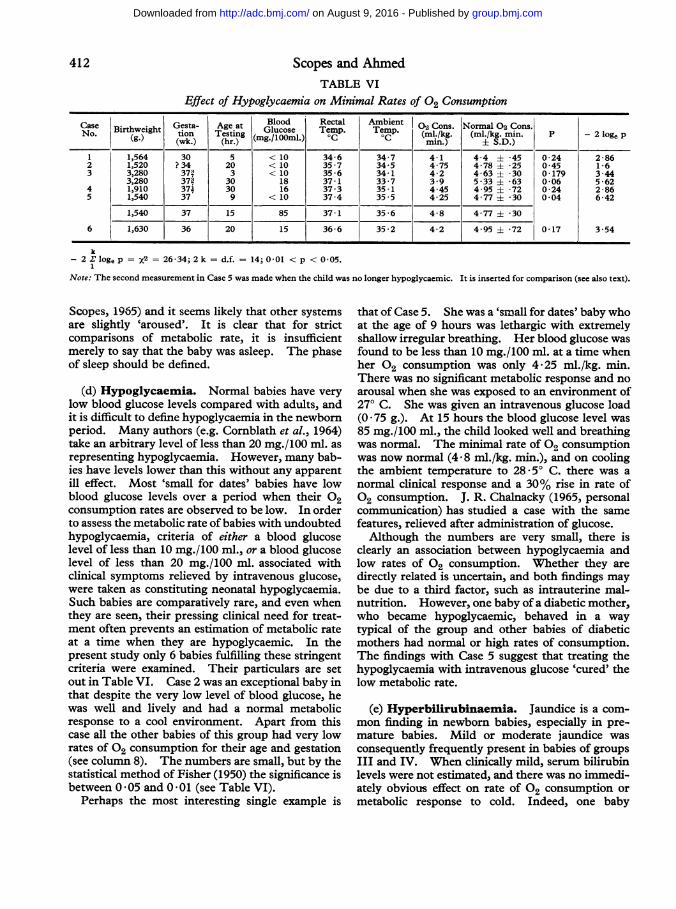
Scopes and AhmedTABLE VI
Effect of Hypoglycaemia on Minimal Rates of 02 Consumption
Case Birthweight Geta Age at Blood Rectal Ambient 002 Cons. Normal 02 Cons.No. (g) G9sta- ~~~~~Glucose Temp. Temp. (l/g m.k.m. P -2lgNo. (g.) tion Testing (mg./loom,.) QC o m.k. (l/g i. p 2lg
(wk.) (hr.) m in.) ± S.D .)
1 1,564 30 5 < 10 34-6 34-7 4-1 4-4 ± *45 0-24 2-862 1,520 ? 34 20 < 10 35 *7 34*5 4*75 4*78 ± *25 0*45 1*63 3,280 373 3 < 10 35 -6 34-1 4-2 4-63 ± 30 0179 3-44
3,280 373 30 18 37-1 33 -7 3 9 5 -33 ± *63 0-06 5 -624 1,910 377 30 16 37-3 35-1 4-45 4-95 ± *72 0-24 2-865 1,540 37 9 < 10 37-4 35 -5 4-25 4-77 ± 30 0 04 6-42
1,540 37 15 85 37-1 35-6 4-8 4-77 ± 30
6 1,630 36 20 15 36-6 35-2 4-2 4 95 ± *72 0-17 3-54
k-2E loge p = x2 26-34; 2 k =d.f. = 14; 0 01 < p < 0 05.
1
Note: The second measurement in Case 5 was made when the child was no longer hypoglycaemic. It is inserted for comparison (see also text).
Scopes, 1965) and it seems likely that other systemsare slightly 'aroused'. It is clear that for strictcomparisons of metabolic rate, it is insufficientmerely to say that the baby was asleep. The phaseof sleep should be defined.
(d) Hypoglycaemia. Normal babies have verylow blood glucose levels compared with adults, andit is difficult to define hypoglycaemia in the newbornperiod. Many authors (e.g. Cornblath et al., 1964)take an arbitrary level of less than 20 mg./100 ml. asrepresenting hypoglycaemia. However, many bab-ies have levels lower than this without any apparentill effect. Most 'small for dates' babies have lowblood glucose levels over a period when their 02
consumption rates are observed to be low. In orderto assess the metabolic rate of babies with undoubtedhypoglycaemia, criteria of either a blood glucoselevel of less than 10 mg./100 ml., or a blood glucoselevel of less than 20 mg./100 ml. associated withclinical symptoms relieved by intravenous glucose,were taken as constituting neonatal hypoglycaemia.Such babies are comparatively rare, and even whenthey are seen, their pressing clinical need for treat-ment often prevents an estimation of metabolic rateat a time when they are hypoglycaemic. In thepresent study only 6 babies fulfilling these stringentcriteria were examined. Their particulars are setout in Table VI. Case 2 was an exceptional baby inthat despite the very low level of blood glucose, hewas well and lively and had a normal metabolicresponse to a cool environment. Apart from thiscase all the other babies of this group had very lowrates of 02 consumption for their age and gestation(see column 8). The numbers are small, but by thestatistical method of Fisher (1950) the significance isbetween 0 05 and 0 01 (see Table VI).
Perhaps the most interesting single example is
that of Case 5. She was a 'small for dates' baby whoat the age of 9 hours was lethargic with extremelyshallow irregular breathing. Her blood glucose wasfound to be less than 10 mg./100 ml. at a time whenher 02 consumption was only 4'25 ml./kg. min.There was no significant metabolic response and noarousal when she was exposed to an environment of270 C. She was given an intravenous glucose load(0 75 g.). At 15 hours the blood glucose level was85 mg./100 ml., the child looked well and breathingwas normal. The minimal rate of 02 consumptionwas now normal (4 *8 ml./kg. min.), and on coolingthe ambient temperature to 28 50 C. there was a
normal clinical response and a 30% rise in rate of02 consumption. J. R. Chalnacky (1965, personalcommunication) has studied a case with the samefeatures, relieved after administration of glucose.Although the numbers are very small, there is
clearly an association between hypoglycaemia andlow rates Of 02 consumption. Whether they aredirectly related is uncertain, and both findings maybe due to a third factor, such as intrauterine mal-nutrition. However, one baby of a diabetic mother,who became hypoglycaemic, behaved in a waytypical of the group and other babies of diabeticmothers had normal or high rates of consumption.The findings with Case 5 suggest that treating thehypoglycaemia with intravenous glucose 'cured' thelow metabolic rate.
(e) Hyperbilirubinaemia. Jaundice is a com-mon finding in newborn babies, especially in pre-mature babies. Mild or moderate jaundice wasconsequently frequently present in babies of groupsIII and IV. When clinically mild, serum bilirubinlevels were not estimated, and there was no immedi-ately obvious effect on rate Of 02 consumption ormetabolic response to cold. Indeed, one baby
412
group.bmj.com on August 9, 2016 - Published by http://adc.bmj.com/Downloaded from
Minimal Rates of Oxygen Consumption in Sick and Premature Newborn Infants 413
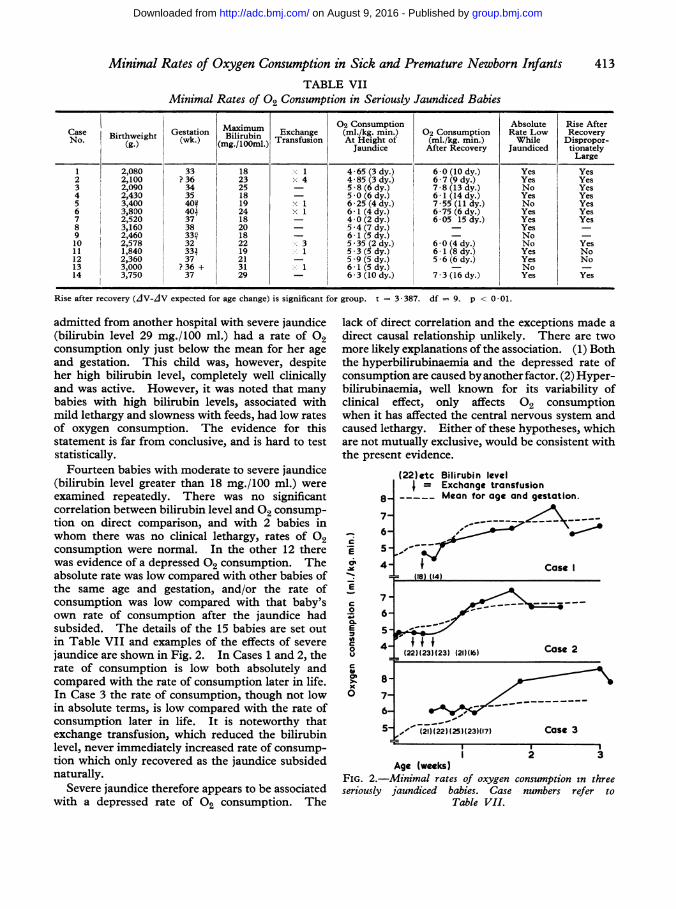
TABLE VIIMinimal Rates of 02 Consumption in Seriously Jaundiced Babies
Maximum 02 Consumption Absolute Rise AfterCase aBirthweight Gestationk) lirubOOmn. Exchange (mli/kg. min.) 02 Consumption Rate Low RecoveryNo. (g) (wk.) Biglrubin Transfusion At Height of (mi./kg. min.) While Dispropor-(g.) (mg./lOml.) Jaundice After Recovery Jaundiced tionately
Large1 2,080 33 18 1 4*65 (3 dy.) 6*0 (10 dy.) Yes Yes2 2,100 ?36 23 x 4 4 85 (3 dy.) 6 7 (9 dy.) Yes Yes3 2,090 34 25 58 (6 dy.) 7-8 (13 dy.) No Yes4 2,430 35 18 5 0 (6 dy.) 6-1 (14 dy.) Yes Yes5 3,400 402 19 X 1 6-25 (4 dy.) 7-55 (11 dy.) No Yes6 3,800 401 24 x 1 6-1 (4 dy.) 6-75 (6 dy.) Yes Yes7 2,520 37 18 4-0 (2 dy.) 6-05 15 dy.) Yes Yes8 3,160 38 20 5-4 (7 dy.) - Yes9 2,460 33a) 18 61 (5 dy.) - No -10 2,578 32 22 3 5-35 (2 dy.) 6-0 (4 dy.) No Yes11 1,840 334 19 1 5 *3 (5 dy.) 6-1 (8 dy.) Yes No12 2,360 37 21 _ 5-9 (5 dy.) 5-6 (6 dy.) Yes No13 3,000 ?36 + 31 1 6- 1 (5 dy.) - No -14 3,750 37 29 66-3 (10 dy.) 7-3 (16 dy.) Yes Yes
Rise after recovery (AV-AV expected for age change) is significant for group. t = 3-387. df-- 9. p < 0 01.
admitted from another hospital with severe jaundice(bilirubin level 29 mg./100 ml.) had a rate of 02consumption only just below the mean for her ageand gestation. This child was, however, despiteher high bilirubin level, completely well clinicallyand was active. However, it was noted that manybabies with high bilirubin levels, associated withmild lethargy and slowness with feeds, had low ratesof oxygen consumption. The evidence for thisstatement is far from conclusive, and is hard to teststatistically.
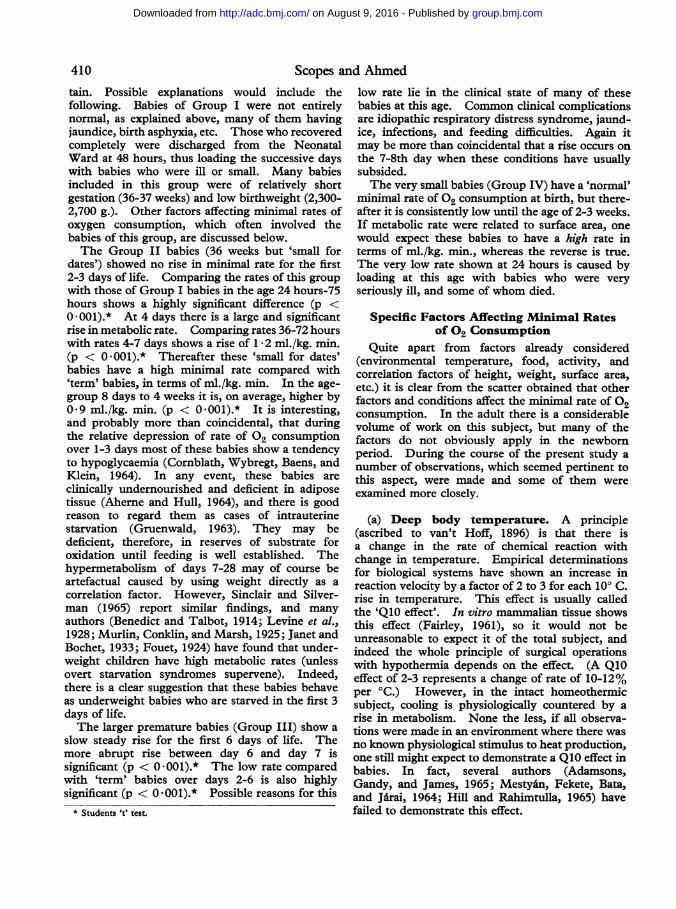
Fourteen babies with moderate to severe jaundice(bilirubin level greater than 18 mg./100 ml.) wereexamined repeatedly. There was no significantcorrelation between bilirubin level and 02 consump-tion on direct comparison, and with 2 babies inwhom there was no clinical lethargy, rates of 02consumption were normal. In the other 12 therewas evidence of a depressed 02 consumption. Theabsolute rate was low compared with other babies ofthe same age and gestation, and/or the rate ofconsumption was low compared with that baby'sown rate of consumption after the jaundice hadsubsided. The details of the 15 babies are set outin Table VII and examples of the effects of severejaundice are shown in Fig. 2. In Cases 1 and 2, therate of consumption is low both absolutely andcompared with the rate of consumption later in life.In Case 3 the rate of consumption, though not lowin absolute terms, is low compared with the rate ofconsumption later in life. It is noteworthy thatexchange transfusion, which reduced the bilirubinlevel, never immediately increased rate of consump-tion which only recovered as the jaundice subsidednaturally.
Severe jaundice therefore appears to be associatedwith a depressed rate of 02 consumption. The
lack of direct correlation and the exceptions made adirect causal relationship unlikely. There are twomore likely explanations of the association. (1) Boththe hyperbilirubinaemia and the depressed rate ofconsumption are caused by another factor. (2) Hyper-bilirubinaemia, well known for its variability ofclinical effect, only affects 02 consumptionwhen it has affected the central nervous system andcaused lethargy. Either of these hypotheses, whichare not mutually exclusive, would be consistent withthe present evidence.
8-
6-C
E
Ei 5_
o 4-
7 -
C
.20 6-a.E 5-
o 4-£
>. 8-
6-
5-
(22)etc Bilirubin levelI = Exchange transfusion
Mean for age and gestation.
Case I= (18) (14)
f__
(221(l231(23) (21)(16) Case 2
-," (21)1(22) (25)(23)(17) Case 3
2 3Age (weeks)
FIG. 2.-Minimal rates of oxygen consumption in threeseriously jaundiced babies. Case numbers refer to
Table VII.
l7
group.bmj.com on August 9, 2016 - Published by http://adc.bmj.com/Downloaded from
Scopes and Ahmed(f) Other factors. One proved cretin, aged 7
weeks, was examined. Her metabolic rate was only4-75 ml./kg. min. and her critical temperature was
very high (340 C.) at an age where the normal ratewould be about 7-8 ml./kg. min. and the normalcritical temperature about 29°-30° C. Over 20babies with idiopathic respiratory distress syndromeof the newborn had rates of 02 consumption thatwere not significantly different from the normal fortheir size and gestation, provided they were adequ-ately oxygenated. Compared with the normal termbaby, of course, they were significantly low. Onebaby's rate Of 02 consumption through a long periodof periodic breathing (common in premature babies)was compared with her rate when she converted toregular rhythm. There was no difference.
DiscussionUntil the work of Day et al. (1943) it was not
generally realized that a baby has a metabolicincrease in response to cold at surprisingly warm
ambient temperatures. Consequently earlier workis not directly comparable with this. Even in morerecent work (e.g. Karlberg, 1952; Cross, Tizard, andTrythall, 1958) the importance of ambient tempera-ture is not emphasized. It might be expectedthat, in early work, rates recorded at birth wouldbe high because the child was not in a basal state.For instance, Benedict and Talbot (1921) foundthe basal rate (re-expressed as ml./kg. min.) tobe 5 35 0 11 S.E., and Karlberg's individuallevels are high. More recent work, however,agrees very closely with the present findings(Adamsons et al. (1965) - 4 6 0 08 S.E.ml./kg. min.; Bruck (1961) -4477 i o 11 S.E.;Hill and Rahimtulla (1965) -4476 + o 09 S.E.).In term babies, there is general agreement that meta-bolic rate rises in the next 2 days though the magni-tude of the rise reported varies from author toauthor (Briick, 1961, 10 5%, Benedict and Talbot,1921, 13%, Hill and Rahimtulla, 1965,39%). Thismay be related to the fact that Briuck's figuresfor 02 consumption in days 2-9 are low comparedwith the present series or with the figures of Hill andRahimtulla. In the case of premature babies-usually defined as those with a birthweight of lessthan 2,500 g.-most authors have found little or no
rise in the first few days (Briick, 1961; Schadow,1929; Talbot, Sisson, Moriarty, and Dalrymple,1923; Mestyan et al., 1964). Ignoring the slightfluctuations in the first few days, Briick found themean consumption for premature babies to be 1 * 45
0017 k. cal./kg. hr. (= 4*35 ml./kg. min.),figures that agree with the individual examples ofSchadow. Mestyan et al. further divided prema-
ture babies into those of birthweight 1,000-1,500 g.
and 1,501-2,000 g. They found the rate ofconsumption to be significantly lower in the smallerbabies. Their absolute figures for the smallergroup accord with Bruck's, but those for the largerprematures were higher. They agreed that therewas a steady rise over the first weeks of life, and as inthe present series they found a rise at 7 days, thoughthey did not comment upon it. Figures fromAdams, Fujiwara, Spears, and Hodgman (1964a, b),Pribylova and Znamena6ek (1964) among recentpapers are not satisfactory for comparison, eitherbecause the thermal conditions were inadequatelycontrolled, or because the figures were too fewand toovariable. Silverman and Agate's (1964) individualfigures agree in general with the present series.There is general agreement in the published
reports that very small babies have a low minimalrate of oxygen consumption in terms of ml./kg. min.This rises with increasing age and size to reach a
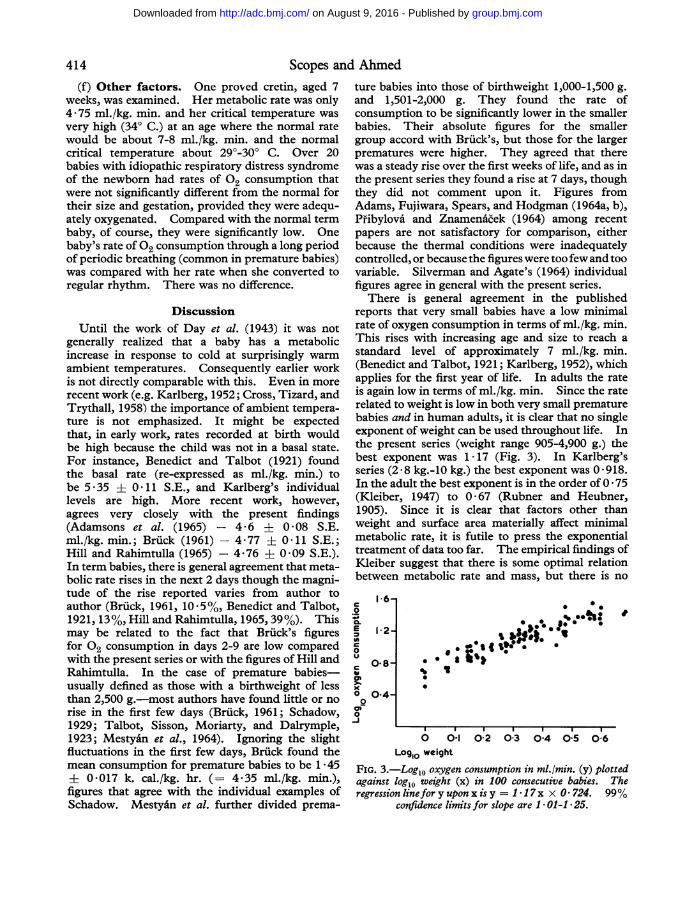
standard level of approximately 7 ml./kg. min.(Benedict and Talbot, 1921; Karlberg, 1952), whichapplies for the first year of life. In adults the rateis again low in terms of ml./kg. min. Since the raterelated to weight is low in both very small prematurebabies and in human adults, it is clear that no singleexponent of weight can be used throughout life. Inthe present series (weight range 905-4,900 g.) thebest exponent was 1 17 (Fig. 3). In Karlberg'sseries (2-8 kg.-10 kg.) the best exponent was 0 918.In the adult the best exponent is in the order of 0 * 75(Kleiber, 1947) to 0 * 67 (Rubner and Heubner,1905). Since it is clear that factors other thanweight and surface area materially affect minimalmetabolic rate, it is futile to press the exponentialtreatment of data too far. The empirical findings ofKleiber suggest that there is some optimal relationbetween metabolic rate and mass, but there is no
1l6-C.
1-2-2c 0 80
C O.8-
0-4-
Q
0
-J
0 .3
'I
0000.
* a
;.IEg 0. t o
it
I I I I
0 01- 02 03 04 05 06Log,o weight
FIG. 3.-Log1o oxygen consumption in ml./min. (y) plottedagainst logl0 weight (x) in 100 consecutive babies. Theregression linefor y upon x is y = I 1 7x x 0 724. 99%
confidence limits for slope are I * 01-1 * 25.
414
group.bmj.com on August 9, 2016 - Published by http://adc.bmj.com/Downloaded from
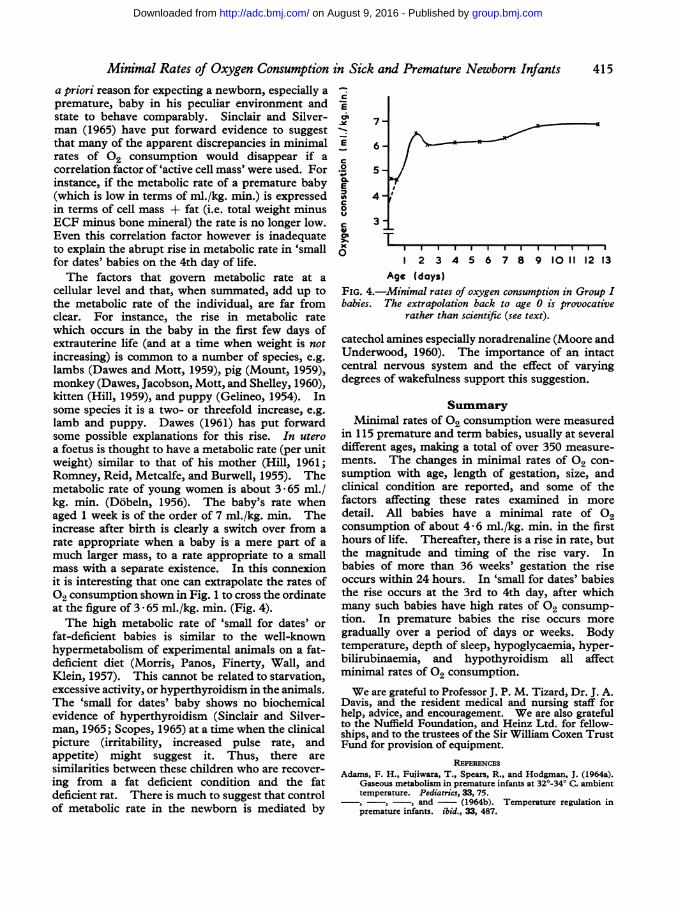
Minimal Rates of Oxygen Consumption in Sick and Premature Newborn Infants 415a priori reason for expecting a newborn, especially apremature, baby in his peculiar environment andstate to behave comparably. Sinclair and Silver-man (1965) have put forward evidence to suggestthat many of the apparent discrepancies in minimalrates of 02 consumption would disappear if acorrelation factor of 'active cell mass' were used. Forinstance, if the metabolic rate of a premature baby(which is low in terms of ml./kg. min.) is expressedin terms of cell mass + fat (i.e. total weight minusECF minus bone mineral) the rate is no longer low.Even this correlation factor however is inadequateto explain the abrupt rise in metabolic rate in 'smallfor dates' babies on the 4th day of life.The factors that govern metabolic rate at a
cellular level and that, when summated, add up tothe metabolic rate of the individual, are far fromclear. For instance, the rise in metabolic ratewhich occurs in the baby in the first few days ofextrauterine life (and at a time when weight is notincreasing) is common to a number of species, e.g.lambs (Dawes and Mott, 1959), pig (Mount, 1959),monkey (Dawes, Jacobson, Mott, and Shelley, 1960),kitten (Hill, 1959), and puppy (Gelineo, 1954). Insome species it is a two- or threefold increase, e.g.lamb and puppy. Dawes (1961) has put forwardsome possible explanations for this rise. In uteroa foetus is thought to have a metabolic rate (per unitweight) similar to that of his mother (Hill, 1961;Romney, Reid, Metcalfe, and Burwell, 1955). Themetabolic rate of young women is about 3 65 ml./kg. min. (Dobeln, 1956). The baby's rate whenaged 1 week is of the order of 7 ml./kg. min. Theincrease after birth is clearly a switch over from arate appropriate when a baby is a mere part of amuch larger mass, to a rate appropriate to a smallmass with a separate existence. In this connexionit is interesting that one can extrapolate the rates of02 consumption shown in Fig. 1 to cross the ordinateat the figure of 3 - 65 ml./kg. min. (Fig. 4).The high metabolic rate of 'small for dates' or
fat-deficient babies is similar to the well-knownhypermetabolism of experimental animals on a fat-deficient diet (Morris, Panos, Finerty, Wall, andKlein, 1957). This cannot be related to starvation,excessive activity, or hyperthyroidism in the animals.The 'small for dates' baby shows no biochemicalevidence of hyperthyroidism (Sinclair and Silver-man, 1965; Scopes, 1965) at a time when the clinicalpicture (irritability, increased pulse rate, andappetite) might suggest it. Thus, there aresimilarities between these children who are recover-ing from a fat deficient condition and the fatdeficient rat. There is much to suggest that controlof metabolic rate in the newborn is mediated by
C
7-
E 6-.2 5
E4'-
0
C 3T0
I 2 3 4 5 6 7 8 9 10 11 12 13Age (dayS)
FIG. 4.-Minimal rates of oxygen consumption in Group Ibabies. The extrapolation back to age 0 is provocative
rather than scientific (see text).
catechol amines especially noradrenaline (Moore andUnderwood, 1960). The importance of an intactcentral nervous system and the effect of varyingdegrees of wakefulness support this suggestion.
SummaryMinimal rates Of 02 consumption were measured
in 115 premature and term babies, usually at severaldifferent ages, making a total of over 350 measure-ments. The changes in minimal rates Of 02 con-sumption with age, length of gestation, size, andclinical condition are reported, and some of thefactors affecting these rates examined in moredetail. All babies have a minimal rate Of 02consumption of about 4-6 ml./kg. min. in the firsthours of life. Thereafter, there is a rise in rate, butthe magnitude and timing of the rise vary. Inbabies of more than 36 weeks' gestation the riseoccurs within 24 hours. In 'small for dates' babiesthe rise occurs at the 3rd to 4th day, after whichmany such babies have high rates Of 02 consump-tion. In premature babies the rise occurs moregradually over a period of days or weeks. Bodytemperature, depth of sleep, hypoglycaemia, hyper-bilirubinaemia, and hypothyroidism all affectminimal rates of 02 consumption.We are grateful to Professor J. P. M. Tizard, Dr. J. A.
Davis, and the resident medical and nursing staff forhelp, advice, and encouragement. We are also gratefulto the Nuffield Foundation, and Heinz Ltd. for fellow-ships, and to the trustees of the Sir William Coxen TrustFund for provision of equipment.
REs'ERENCESAdams, F. H., Fujiwara, T., Spears, R., and Hodgman, J. (1964a).
Gaseous metabolism in premature infants at 32'-34° C. ambienttemperature. Pediatrics, 33, 75.
-, -, -, and- (1964b). Temperature regulation inpremature infants. ibid., 33, 487.
group.bmj.com on August 9, 2016 - Published by http://adc.bmj.com/Downloaded from
416 Scopes and AhmedAdamsons, K., Jr., Gandy, G. M., and James, L. S. (1965). The
influence of thermal factors upon oxygen consumption of thenewborn human infant. J. Pediat., 66, 495.
Aherne, W., and Hull, D. (1964). The site of heat production in thenewborn infant. Proc. roy. Soc. Med., 57, 1172.
Andral, G., and Gavarret, J. (1843). Recherches sur la quantit6d'acide carbonique exhale par le poumon dans l'espece humaine.Ann. Chim. Phys., ser. 3, 8, 129. (Cited by Benedict andTalbot, 1921.)
Baer, H. (1929). Zur Tecknik der Ruhe-Nuchtern- Umsatz:Bestimmung beim Saughling. Z. Kinderheilk., 47, 226.
Benedict, F. G., and Talbot, F. B. (1914). The Gaseous Metabolismof Infants with Special Reference to Its Relation to Pulse Rate andMuscular Activity. (Carnegie Inst. Publication 201.) CarnegieInst., Washington.
-, and - (1921). Metabolism and Growth from Birth toPuberty. (Carnegie Inst. Publication 302.) Carnegie Inst.,Washington.
Bierring, E. (1931). The Standard Metabolism of Boys. Levin andMunksgaard, Copenhagen.
British Perinatal Mortality Survey (1963). Perinatal Mortality: TheFirst Report of the 1958 British Perinatal Survey, by N. R.Butler and D. G. Bonham. Livingstone, Edinburgh andLondon.
Bruck, K. (1961). Temperature regulation in the newborn infant.Biol. Neonat. (Basel), 3, 65.
Bruin, M. de (1931). Untersuchungen uber den Gastoffweschalgesunder Kinder. Jb. Kinderheilk, 132, 257.
Comblath, M., Wybregt, S. H., Baens, G. S., and Klein, R. I.(1964). Symptomatic neonatal hypoglycemia. Pediatrics, 33,388.
Cross, K. W., Tizard, J. P. M., and Trythall, D. A. H. (1958). Thegaseous metabolism of the new-born infant breathing 15%oxygen. Acta paediat. (Uppsala), 47, 217.
Dawes, G. S. (1961). 02 consumption and hypoxia in the newbornanimal. In Ciba Foundation Symposium on Somatic Stability inthe Newly Born, ed. G. E. W. Wolstenholme and M. O'Connor.p. 170. Churchill, London.
-, Jacobson, H. N., Mott, J. C., and Shelley, H. J. (1960). Someobservations on foetal and new-born rhesus monkeys. J.Physiol. (Lond.), 152, 271.
-, and Mott, J. C. (1959). The increase in oxygen consumptionof the lamb after birth. ibid., 146, 295.
Day, R. L., Curtis, J., and Kelly, M. (1943). Respiratory metabol-ism in infancy and in childhood. XXVII. Regulation of bodytemperature ofpremature infants. Amer.J. Dis. Child., 65,376.
Dobeln, W. von (1956). Human standard, and maximal metabolicrate in relation to fat free body mass. Acta physiol. scand., 37,Suppl. 126, 41.
Du Bois, E. F. (1936). Basal Metabolism in Health and Disease,3rd ed. Lea & Febiger, Philadelphia.
Fairley, H. B. (1961). Metabolism in hypothermia. Brit. med.Bull., 17, 52.
Fisher, R. A. (1950). Statistical Methods for Research Workers,11th ed., p. 100. Oliver and Boyd, Edinburgh.
Fouet, A. (1924). La Metabolisme Basal du Nourrison. These,Paris. (Cited by Karlberg, 1952.)
Gelineo, S. (1954). Le developpement otogenique de la thermoregu-lation chey le chien. C. R. Soc. Biol. (Paris), 148, 1483.
Goldie, L. G., and Van Velzer, C. (1965). The phases of sleep inthe newborn baby. Brain, 88, 1043.
Gruenwald, P. (1963). Chronic fetal distress and placental insuffi-ciency. Biol. Neonat. (Basel), 5, 215.
Gupta, J. M., and Scopes, J. W. (1965). Observations on bloodpressure in newborn babies. Arch. Dis. Childh., 40, 637.
Hill, J. R. (1959). The oxygen consumption of new-born and adultmammals. J. Physiol. (Lond.), 149, 346.- (1961). The physics and physiology of the development of
homeothermy. In Ciba Foundation Symposium on SomaticStability in the Newly Born, ed. G. E. W. Wolstenholme andM. O'Connor, p. 156. Churchill, London.- and Rahimtulla, K. A. (1965). Heat balance and the
metabolic rate ofnew-born babies. J. Physiol. (Lond.), 180,239.van't Hoff, J. H. (1896). Studies in Chemical Dynamics. F. Muller,
Amsterdam.Huggett, A. St. G., and Nixon, D. A. (1957). Use of glucose
oxidase, peroxidase, and O-Dianisidine in determination ofblood and urinary glucose. Lancet, 2, 368.
Janet, H., and Bochet, M. (1933). Sur le metabolism basal dunourisson. Bull. Soc. Pediat. Paris, 31, 359.
Karlberg, P. (1949). The significance of depth of insertion of thethermometer for recording rectal temperatures. Acta paediat.(Uppsala), 38, 359.(1952). Determination of standard energy metabolism (basalmetabolism) in normal infants. ibid., 41, Suppl. 89.
Kleiber, M. (1947). Body size and metabolic rate. Physiol. Rev.,27, 511.
Lee, V. A., and Iliff, A. (1956). The energy metabolism of infantsand young children during postprandial sleep. Pediatrics, 18,739.
Levine, S. Z., Wilson, J. R., and Gottschall, G. (1928). Therespiratory metabolism in infancy and in childhood. X. Therespiratory exchange in marasmus: specific dynamic action offood in normal and in marasmic infants. Amer. J. Dis. Child.,36, 740.
McCance, R. A., and Strangeways, W. M. B. (1954). Proteinkatabolism and oxygen consumption during starvation ininfants, young adults and old men. Brit. J. Nutr., 8, 21.
Malloy, H. T., and Evelyn, K. A. (1937). The determination ofbilirubin with the photoelectric colorimeter. J. biol. Chem., 119,481.
Mestyan, J., Fekete, M., Bata, G., and Jarai, I. (1964). The basalmetabolic rate ofpremature infants. Biol. Neonat. (Basel), 7, 11.
Moore, R. E., and Underwood, M. C. (1960). Noradrenaline as apossible regulator of heat production in the new-born kitten.J. Physiol. (Lond.), 150, 13P.
Morris, D. M., Panos, T. C., Finerty, J. C., Wall, R. L., and Klein,G. F. (1957). Relation of thyroid activity to increased metabol-ism induced by fat deficiency. J. Nutr., 62, 119.
Mount, L. E. (1959). The metabolic rate of the new-born pig inrelation to environmental temperature and to age. J. Physiol.(Lond.), 147, 333.
Murlin, J. R., Conklin, R. E., and Marsh, M. E. (1925). Energymetabolism of normal new-born babies, with special referenceto the influence of food and of crying. Amer. J. Dis. Child.,29,1.
Pallett, J. E., and Scopes, J. W. (1965). Recording respiration innewborn babies by measuring impedance of the chest. Mid.Electron. Biol. Engng., 3, 161.
Pfibylova, H., and Znameni6ek, K. (1964). Some aspects ofthermoregulatory reactions in newborn infants during the firsthours of life. Biol. Neonat. (Basel), 6, 324.
Romney, S. L., Reid, D. E., Metcalfe, J., and Burwell, C. S. (1955).Oxygen utilization by human fetus in utero. Amer. 3. Obstet.Gynec., 70, 791.
Rubner, M., and Heubner, 0. (1898). Die naturliche Ernahrungeines Sauglings. Z. Biol., 36, 1.
- and- (1905). Zur Kenntniss der naturlichen Ernahrungdes Saughlings. Z. exp. Path. Ther., 1, 1.
Schadow, H. (1929). Grundumsatz und spezifisch-dynamischeWirking bei gesunden Sauglingen. J. Kinderheilk., 126, 50.
Scharling, E. A. (1843). gustus Liebigs Ann. Chem., 45, 214. (Citedby Benedict and Talbot, 1921.)
Scopes, J. W. (1965). Studies in 02 consumption in newbornbabies. Ph.D. thesis, London.
-, and Ahmed, I. (1966). Range of critical temperatures in sickand premature newborn babies. Arch. Dis. Childh., 41, 417.
Silverman, W. A., and Agate, F. J., Jr. (1964). Variation in coldresistance among small newborn infants. Biol. Neonat. (Basel),6, 113.
-, Fertig, J. W., and Berger, A. P. (1958). The influence of thethermal environment upon the survival of newly born prema-ture infants. Pediatrics, 22, 876.
Sinclair, J. C., Scopes, J. W., and Silverman, W. A. (1966).Metabolic reference standards for the neonate. Communicationto American Pediatric Society, p. 14 of official program. Tobe published.
- and Silverman, W. A. (1965). Intrauterine growth inactive tissue mass of the human fetus. 3. Pediat., 67, 925.
Talbot, F. B., Sisson, W. R., Moriarty, M. E., and Dalrymple, A. J.(1923). The basal metabolism of prematurity. III. Meta-bolism findings in 21 premature infants. Amer. 3. Dis. Child.,26, 29.
Wang, C. C., and Kern, R. (1928). The influence of sleep on basalmetabolism of children. ibid, 36, 83.
group.bmj.com on August 9, 2016 - Published by http://adc.bmj.com/Downloaded from
Premature Newborn InfantsConsumption in Sick and Minimal Rates of Oxygen
J. W. Scopes and Iqbal Ahmed
doi: 10.1136/adc.41.218.4071966 41: 407-416 Arch Dis Child
http://adc.bmj.com/content/41/218/407.citationUpdated information and services can be found at:
These include:
serviceEmail alerting
online article. thearticle. Sign up in the box at the top right corner of
Receive free email alerts when new articles cite this
Notes
http://group.bmj.com/group/rights-licensing/permissionsTo request permissions go to:
http://journals.bmj.com/cgi/reprintformTo order reprints go to:
http://group.bmj.com/subscribe/To subscribe to BMJ go to:
group.bmj.com on August 9, 2016 - Published by http://adc.bmj.com/Downloaded from