
A novel ionizing radiation-induced signaling pathway that activates the transcription factor NF-κB

Minimal model of spiky oscillationsin NF-�B signalingSandeep Krishna†, Mogens H. Jensen, and Kim Sneppen
Niels Bohr Institute, Blegdamsvej 17, 2100 Copenhagen Ø, Denmark
Communicated by Leo P. Kadanoff, University of Chicago, Chicago, IL, May 25, 2006 (received for review September 20, 2005)
The NF-�B signaling system is involved in a variety of cellularprocesses including immune response, inflammation, and apopto-sis. Recent experiments have found oscillations in the nuclear-cytoplasmic translocation of the NF-�B transcription factor [Hoff-mann, A., et al. (2002) Science 298, 1241–1245; Nelson, D. E., et al.(2004) Science 306, 704–708.] How the cell uses the oscillations todifferentiate input conditions and send specific signals to down-stream genes is an open problem. We shed light on this issue byexamining the small core network driving the oscillations, whichwe show is designed to produce periodic spikes in nuclear NF-�Bconcentration. The presence of oscillations is extremely robust tovariation of parameters, depending mainly on the saturation of theactive degradation rate of I�B, an inhibitor of NF-�B. The oscilla-tions can be used to regulate downstream genes in a variety ofways. In particular, we show that genes to whose operator sitesNF-�B binds and dissociates fast can respond very sensitively tochanges in the input signal, with effective Hill coefficients of >20.
genetic oscillations � negative feedback � saturated degradation
NF-�B is a family of dimeric transcription factors that par-ticipate in the regulation of a number of cellular processes,
including immune response, inflammation, and apoptosis (1–4).Extensive experiments using electrophoretic mobility shift assayand single-cell f luorescence imaging have found oscillations inthe nuclear–cytoplasmic translocation of the NF-�B transcrip-tion factor in mammalian cells (5, 6), with a time period of theorder of hours. NF-�B can be activated by a number of externalstimuli (7), including bacteria, viruses, and various stresses andproteins [e.g., tumor necrosis factor-� (TNF-�), which was thesignal used in refs. 5 and 6]. In response to these signals, it targets�150 genes, including many chemokines, immunoreceptors, andstress response genes, as well as acute phase inflammationresponse proteins (7). Experiments show that NF-�B does notregulate all its downstream genes in the same way. For example,the chemokine gene RANTES turns on much later than anotherchemokine, IP-10, after TNF-� activation (5). Thus, the twomain questions raised by the dynamics of the NF-�B system areas follows. How does the network of interactions produceoscillations? And how does the cell use the oscillations todifferentiate input conditions and send specific signals to down-stream genes? In this work, we elucidate the small core networkdriving the oscillations and show that it is designed to produceperiodic spikes in nuclear NF-�B concentration. We show thatthe spiky oscillations are extremely robust to variation of pa-rameters. We further argue that the spikiness is associated withan increased sensitivity of the system that could be used fordifferentially regulating downstream genes.
The NF-�B system has been modeled by Hoffman et al. (5) andLipniacki et al. (8). Hoffman et al. (5) have constructed a longlist of chemical reactions between 26 different molecules in theNF-�B system, including reaction constants. This is the model wehave taken as our starting point. The Lipniacki model overlapssubstantially with the Hoffman model for the processes we areinterested in, differing mainly in that it contains an extrafeedback loop in which NF-�B exerts an inhibitory influence onthe external signal that triggers it.
Extracting the Core Feedback LoopWe reduced the NF-�B system, starting from the model in ref.5, to the core feedback loop (Fig. 1B) generating oscillations.The reduction was done in three steps: the first, removingmolecules that have no feedback from NF-�B and deleting slowreactions where faster alternate pathways exist (e.g., export ofnuclear NF-�B), resulted in a seven-variable model.
The interactions in this model are schematically displayed inFig. 1 A. It consists of cytoplasmic and nuclear NF-�B, itsinhibitor, I�B, and I�B kinase (IKK), which phosphorylates theinhibitor, leading to its degradation. The inhibitor forms acomplex with NF-�B, which, in the cytoplasm, prevents itstransport into the nucleus. Only free nuclear NF-�B is importedinto the nucleus. In contrast, from inside the nucleus, only thecomplex can be exported, not the free NF-�B. I�B is known tooccur in several isoforms. Cells containing only the I�B� isoformshow sustained oscillations, whereas cells with only the I�B� or-� isoforms do not show oscillations. Wild-type (WT) cells, withall three isoforms, typically exhibit damped oscillations (5). Thedifference between these isoforms is that only I�B� is activatedby NF-�B (9, 10). In contrast I�B� and -� are produced at a rateindependent of NF-�B and so lie outside the feedback loop (seeSupporting Text, which is published as supporting information onthe PNAS web site, for the equations governing the dynamics ofthe seven-variable model; further details on this work areprovided in Figs. 9–16 and Table 1, which are published assupporting information on the PNAS web site).
Coarse graining over fast chemical reactions involving com-plex formation reduced this system to four variables. Finally,based on numerical observations, we found we could effectivelyeliminate nuclear I�B, giving the model in Fig. 1B. More detailsof the reduction process are given in Supporting Text.
ResultsThree-Variable Model of NF-�B Oscillations. The core feedback loop,we find, consists of only three constituents (Fig. 1B): nuclearNF-�B (Nn), cytoplasmic I�B (I), and I�B mRNA (Im). NF-�Bdimers activate production of I�B mRNA, which translated toI�B inhibits nuclear NF-�B production, completing the feedbackloop.
The dynamics of the system in Fig. 1B is captured by threecoupled ordinary differential equations
dNn
dt� A
�1 � Nn�
� � I� B
INn
� � Nn, [1a]
dIm
dt� Nn
2 � Im, [1b]
dIdt
� Im � C�1 � Nn�I
� � I. [1c]
Conflict of interest statement: No conflicts declared.
Abbreviation: IKK, I�B kinase.
†To whom correspondence should be addressed. E-mail: [email protected].
© 2006 by The National Academy of Sciences of the USA
10840–10845 � PNAS � July 18, 2006 � vol. 103 � no. 29 www.pnas.org�cgi�doi�10.1073�pnas.0604085103

For ease of analysis we have rescaled all variables to be dimen-sionless (the original equations and the rescaling process aredescribed in Supporting Text). A, B, C, �, and � are dimensionlessparameters dependent on the reaction constants (see SupportingText and Figs. 9–11). The external signal is supplied by IKK thatenters the equations through the parameter C, which is propor-tional to IKK concentration.
The first term in Eq. 1a represents the import of freecytoplasmic NF-�B (whose concentration is 1 � Nn) into thenucleus. This import is hindered by the presence of cytoplasmicI�B, which sequesters NF-�B in the cytoplasm. Parameter A isproportional to the NF-�B nuclear import rate. The second termin Eq. 1a derives from the export of NF-�B from the nucleus viathe NF-�B–I�B complex, which is why the term also depends onI. B is proportional to I�B nuclear import rate. � sets theconcentration at which half the nuclear I�B is complexed to
NF-�B, and it depends both on the rates of association anddissociation of the complex as well as the export rate.
The first term in Eq. 1b, the rate of production of I�B mRNA,contains the square of Nn because the production is activated byNF-�B dimers.‡ The second term is the degradation of themRNA, whose rate, in these rescaled equations, sets the overalltimescale. It is easy to modify this equation to deal with the � and� isoforms of I�B simply by adding a constant for their NF-�B-independent rate of production (see Supporting Text).
Eq. 1c has one term for the production of cytoplasmic I�Bfrom its mRNA and a second for its degradation due to thepresence of IKK. This degradation is proportional to the con-centration of the NF-�B–I�B complex, which depends on bothI and (1 � Nn), the concentration of cytoplasmic NF-�B. � setsthe concentration at which half of the cytoplasmic NF-�B is inthe complex. C is proportional to the rate of degradation and tothe IKK concentration.
Fig. 2 shows a plot of nuclear NF-�B and cytoplasmic I�Bconcentrations obtained in simulations, using parameter valuesfrom ref. 5. Our model predicts the following experimentallyobserved facts (5, 6): (i) sustained oscillations in cells with onlythe � isoform of I�B; (ii) damped oscillations in WT cells thatinclude other isoforms of I�B; (iii) time period of the order ofhours; (iv) spikiness of nuclear NF-�B and asymmetry of cyto-plasmic I�B oscillations; (v) phase difference between NF-�Band I�B; and (vi) lower frequency upon increased transcriptionof I�B (see Fig. 2 for i, iii, iv, and v, and see Supporting Text andFigs. 10 and 12 for ii and vi).
Saturated Degradation of I�B Is Crucial for Oscillations. A keyelement in our three-variable model is the saturated degradation ofcytoplasmic I�B in the presence of IKK (second term in Eq. 1c) dueto the Michaelis–Menten complex formation between NF-�B and
‡Ref. 11 argues that making this term linear in Nn is better. In addition, a small dimerizationconstant for NF-�B (i.e., NF-�B exists mostly as dimers) also would argue in favor of a linearproduction term. We have checked that this change does not alter our conclusions (seeSupporting Text).
Fig. 1. Schematic diagram of key interactions in the NF-�B signaling system.Green arrows indicate transcription and translation; blue arrows indicatetransport in and out of the nucleus; purple arrows indicate complex forma-tion; and {NI} denotes the NF-�B–I�B complex. The red barred arrow in Bindicates the effective inhibition of nuclear NF-�B by I�B. (A) Seven-variablemodel. The variables are the concentrations of NF-�B inside and outside thenucleus, I�B inside and outside, the complex {NI} inside and outside, and finallythe concentration of the mRNA of I�B. (B) Three-variable model. The variablesare the concentrations of nuclear NF-�B, the mRNA of I�B, and cytoplasmic I�B.
Fig. 2. Oscillations of nuclear NF-�B (Nn) (red) and cytoplasmic I�B (green) forA � 0.007, B � 954.5, C � 0.035, � � 0.029, and � � 2 � 10�5 (using parametervalues taken from ref. 5; see Supporting Text). The shape, phase, and periodare remarkably similar to the experimental plot in figure 3B left in ref. 6. Tofacilitate comparison with the experimental plot, the x axis has been limitedto 600 min. Figs. 3 and 9–11 show longer time plots of Nn, confirming that theoscillations are sustained.
Krishna et al. PNAS � July 18, 2006 � vol. 103 � no. 29 � 10841
APP
LIED
MA
THEM
ATI
CSCE
LLBI
OLO
GY
I�B, a complex needed for IKK-triggered degradation of I�B. Thesame complex inhibits nuclear NF-�B production because only freecytoplasmic NF-�B is imported into the nucleus.
A stability analysis of the system shows the importance of thesaturated degradation for oscillations (see Supporting Text andFig. 11). The saturation is crucial for oscillations because it putsan upper limit to the degradation rate, allowing I�B to accu-mulate and stay around longer than with the more usualI-proportional degradation rate. This slower degradation effec-tively introduces a time delay into the feedback loop. Negativefeedback with time delay is known to easily produce oscillations,and this mechanism has been used to model the p53 (12) and Hesoscillations (13). Here, instead of being put in by hand, the timedelay arises more naturally through the dynamics of the system.
Interestingly, the NF-�B core in Fig. 1B is similar to an earlymodel showing oscillations by negative feedback (14), which intro-duced precisely the same kind of saturated degradation to mitigatethe unreasonably large Hill coefficient in an even earlier model ofGoodwin (15). The importance of this mechanism also has beenrecognized by Goldbeter and coworkers (16–19), who have used itin models of various cellular oscillations, e.g., the cell cycle (16),development in myxobacteria (17), yeast stress response (18), andthe mammalian circadian clock (19). Saturated degradation also hasbeen implicated in models of calcium oscillations in cells (20, 21).An analysis of various circadian rhythm models also suggests thatsaturated degradation plays a crucial role (22). As is evident fromthese examples, saturated degradation can be the result of a varietyof different mechanisms, all of which lead to an effective Michaelis–Menten kinetics. In our models, it comes from the complexformation between NF-�B and its inhibitor, I�B. It also wouldappear in any active degradation of a protein by an enzyme. Inseveral of the models of Goldbeter referred to above, the Michae-lis–Menten kinetics appears because of an interaction betweenphosphorylation and dephosphorylation reactions. We further notethe p53 system, which also shows oscillations, contains the degra-dation of p53 through the formation of a complex with Mdm2 (23),which could result in saturated degradation. A detailed mathemat-ical analysis of a ‘‘mixed feedback loop’’ motif in ref. 24 also suggestsa key role for this kind of complex formation in producing oscil-lations. These findings suggest that saturated degradation might bea very general mechanism, easily implemented by complex forma-tion and used by cellular processes to introduce time delays wherenecessary.
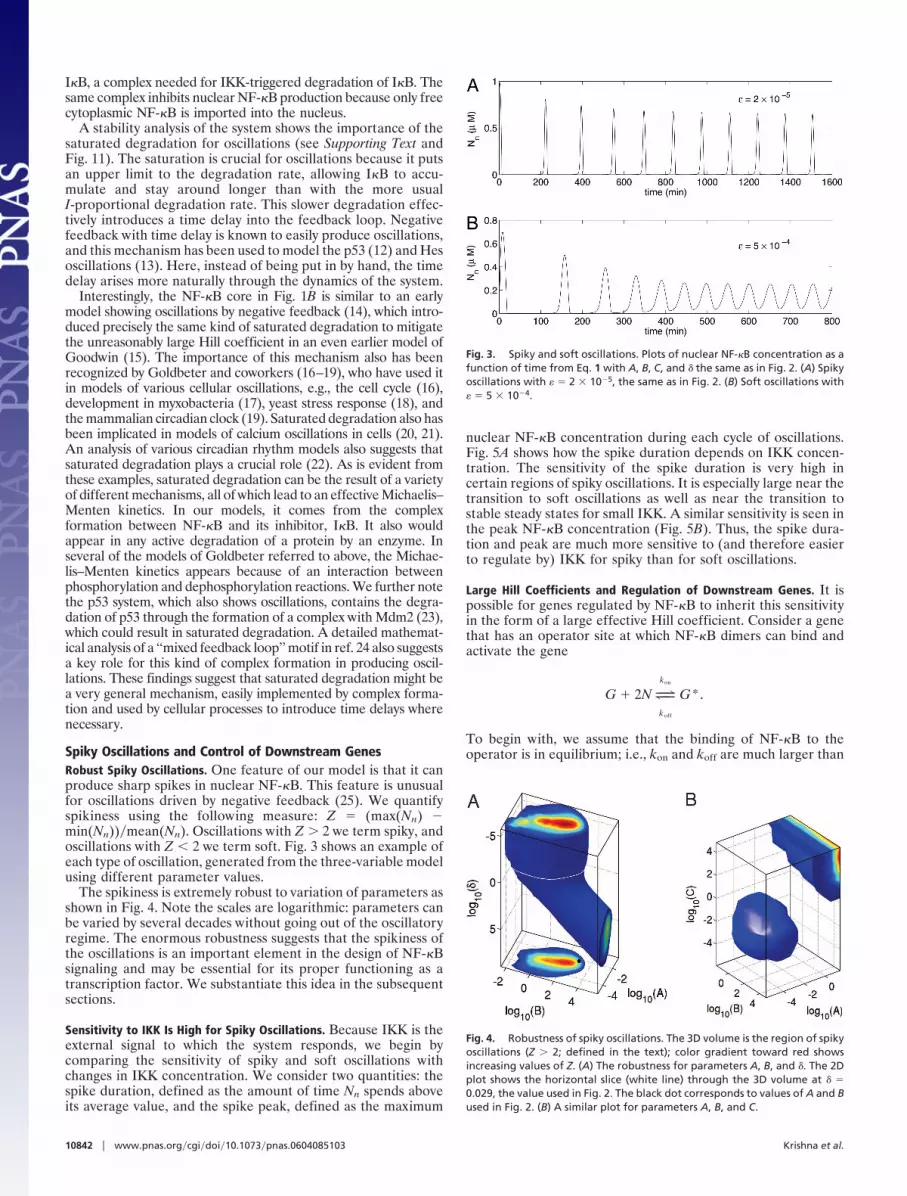
Spiky Oscillations and Control of Downstream GenesRobust Spiky Oscillations. One feature of our model is that it canproduce sharp spikes in nuclear NF-�B. This feature is unusualfor oscillations driven by negative feedback (25). We quantifyspikiness using the following measure: Z � (max(Nn) �min(Nn))�mean(Nn). Oscillations with Z � 2 we term spiky, andoscillations with Z � 2 we term soft. Fig. 3 shows an example ofeach type of oscillation, generated from the three-variable modelusing different parameter values.
The spikiness is extremely robust to variation of parameters asshown in Fig. 4. Note the scales are logarithmic: parameters canbe varied by several decades without going out of the oscillatoryregime. The enormous robustness suggests that the spikiness ofthe oscillations is an important element in the design of NF-�Bsignaling and may be essential for its proper functioning as atranscription factor. We substantiate this idea in the subsequentsections.
Sensitivity to IKK Is High for Spiky Oscillations. Because IKK is theexternal signal to which the system responds, we begin bycomparing the sensitivity of spiky and soft oscillations withchanges in IKK concentration. We consider two quantities: thespike duration, defined as the amount of time Nn spends aboveits average value, and the spike peak, defined as the maximum
nuclear NF-�B concentration during each cycle of oscillations.Fig. 5A shows how the spike duration depends on IKK concen-tration. The sensitivity of the spike duration is very high incertain regions of spiky oscillations. It is especially large near thetransition to soft oscillations as well as near the transition tostable steady states for small IKK. A similar sensitivity is seen inthe peak NF-�B concentration (Fig. 5B). Thus, the spike dura-tion and peak are much more sensitive to (and therefore easierto regulate by) IKK for spiky than for soft oscillations.
Large Hill Coefficients and Regulation of Downstream Genes. It ispossible for genes regulated by NF-�B to inherit this sensitivityin the form of a large effective Hill coefficient. Consider a genethat has an operator site at which NF-�B dimers can bind andactivate the gene
G � 2NL|;kon
koff
G*.
To begin with, we assume that the binding of NF-�B to theoperator is in equilibrium; i.e., kon and koff are much larger than
Fig. 3. Spiky and soft oscillations. Plots of nuclear NF-�B concentration as afunction of time from Eq. 1 with A, B, C, and � the same as in Fig. 2. (A) Spikyoscillations with � � 2 � 10�5, the same as in Fig. 2. (B) Soft oscillations with� � 5 � 10�4.
Fig. 4. Robustness of spiky oscillations. The 3D volume is the region of spikyoscillations (Z � 2; defined in the text); color gradient toward red showsincreasing values of Z. (A) The robustness for parameters A, B, and �. The 2Dplot shows the horizontal slice (white line) through the 3D volume at � �0.029, the value used in Fig. 2. The black dot corresponds to values of A and Bused in Fig. 2. (B) A similar plot for parameters A, B, and C.
10842 � www.pnas.org�cgi�doi�10.1073�pnas.0604085103 Krishna et al.
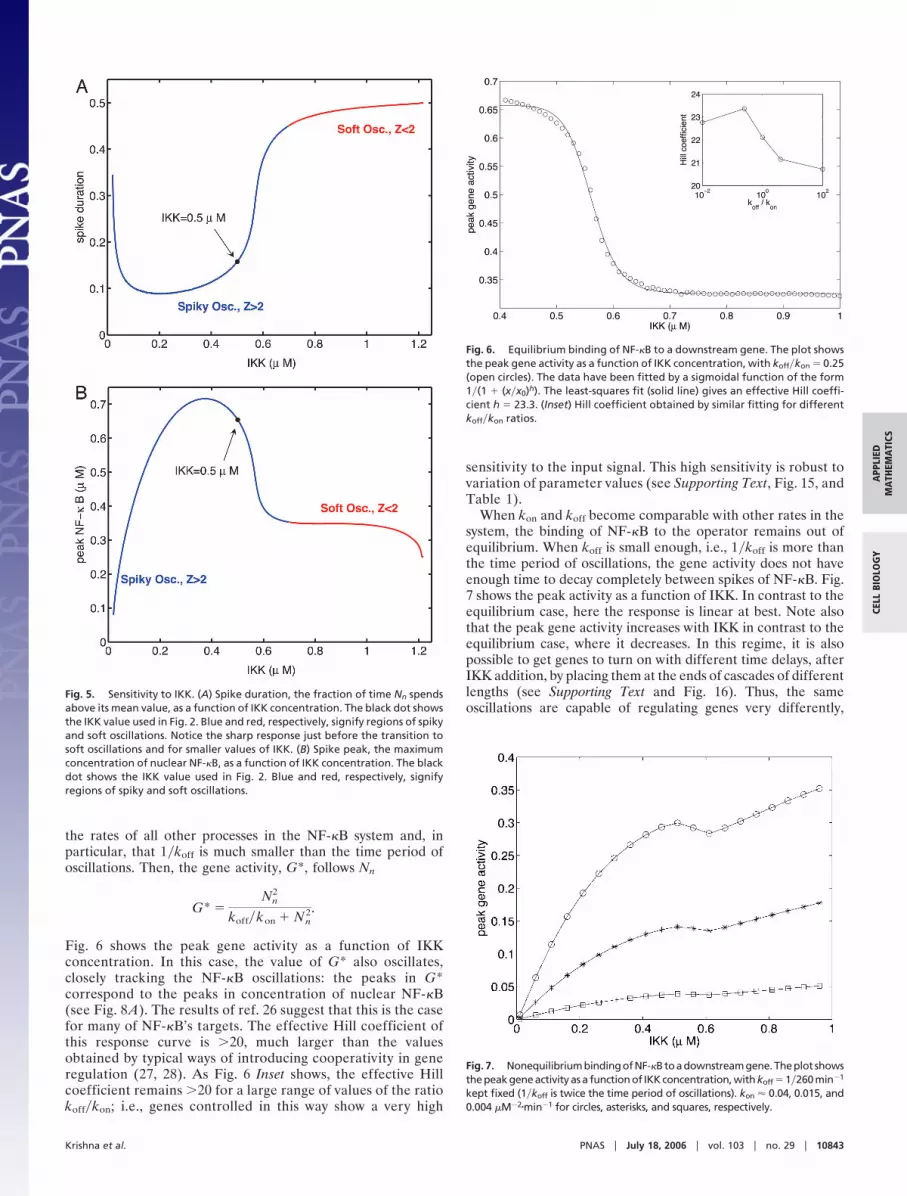
the rates of all other processes in the NF-�B system and, inparticular, that 1�koff is much smaller than the time period ofoscillations. Then, the gene activity, G*, follows Nn
G* �Nn
2
koff�kon � Nn2.
Fig. 6 shows the peak gene activity as a function of IKKconcentration. In this case, the value of G* also oscillates,closely tracking the NF-�B oscillations: the peaks in G*correspond to the peaks in concentration of nuclear NF-�B(see Fig. 8A). The results of ref. 26 suggest that this is the casefor many of NF-�B’s targets. The effective Hill coefficient ofthis response curve is �20, much larger than the valuesobtained by typical ways of introducing cooperativity in generegulation (27, 28). As Fig. 6 Inset shows, the effective Hillcoefficient remains �20 for a large range of values of the ratiokoff�kon; i.e., genes controlled in this way show a very high
sensitivity to the input signal. This high sensitivity is robust tovariation of parameter values (see Supporting Text, Fig. 15, andTable 1).
When kon and koff become comparable with other rates in thesystem, the binding of NF-�B to the operator remains out ofequilibrium. When koff is small enough, i.e., 1�koff is more thanthe time period of oscillations, the gene activity does not haveenough time to decay completely between spikes of NF-�B. Fig.7 shows the peak activity as a function of IKK. In contrast to theequilibrium case, here the response is linear at best. Note alsothat the peak gene activity increases with IKK in contrast to theequilibrium case, where it decreases. In this regime, it is alsopossible to get genes to turn on with different time delays, afterIKK addition, by placing them at the ends of cascades of differentlengths (see Supporting Text and Fig. 16). Thus, the sameoscillations are capable of regulating genes very differently,
Fig. 5. Sensitivity to IKK. (A) Spike duration, the fraction of time Nn spendsabove its mean value, as a function of IKK concentration. The black dot showsthe IKK value used in Fig. 2. Blue and red, respectively, signify regions of spikyand soft oscillations. Notice the sharp response just before the transition tosoft oscillations and for smaller values of IKK. (B) Spike peak, the maximumconcentration of nuclear NF-�B, as a function of IKK concentration. The blackdot shows the IKK value used in Fig. 2. Blue and red, respectively, signifyregions of spiky and soft oscillations.
Fig. 6. Equilibrium binding of NF-�B to a downstream gene. The plot showsthe peak gene activity as a function of IKK concentration, with koff�kon � 0.25(open circles). The data have been fitted by a sigmoidal function of the form1�(1 � (x�x0)h). The least-squares fit (solid line) gives an effective Hill coeffi-cient h � 23.3. (Inset) Hill coefficient obtained by similar fitting for differentkoff�kon ratios.
Fig. 7. NonequilibriumbindingofNF-�Btoadownstreamgene.Theplot showsthe peak gene activity as a function of IKK concentration, with koff � 1�260 min�1
kept fixed (1�koff is twice the time period of oscillations). kon 0.04, 0.015, and0.004 M�2�min�1 for circles, asterisks, and squares, respectively.
Krishna et al. PNAS � July 18, 2006 � vol. 103 � no. 29 � 10843
APP
LIED
MA
THEM
ATI
CSCE
LLBI
OLO
GY

depending on their kon,off values, which are determined by theiroperator sites.
DiscussionWhat functional role, if any, do the oscillations in the NF-�Bsystem play? There have been several suggestions, including thatdownstream gene networks are perhaps regulated by the fre-quency of the oscillations, that the oscillations could be aby-product of rapid attenuation of NF-�B, or that they might beused to make multiple evaluations of the input signal (29, 30).Barken et al. (31) warn against overemphasizing the physiolog-ical role of oscillations. Our approach to tackling this questionhas been to construct a reduced three-variable model, which,despite its simplicity, captures many characteristic features of thesystem. The simplicity of the model allows us to fully explore andunderstand the range of dynamical behavior it exhibits. Inparticular, we have shown that it is capable of both spiky and softoscillations and that the spiky oscillations are extremely robustto variation of parameters.§ These insights would have beensignificantly harder to extract from larger models. Simplificationthus facilitates an understanding of the key mechanisms byisolating the relevant variables and parameters, as well asallowing a comparison with other strategies for producing similardynamics. In the case of NF-�B, for instance, we learn that it lieswithin a class of negative feedback oscillators that have theuncommon ability to produce sharp spikes. It must be empha-sized that a careful simplification of a large dynamical systemretains many of the important details of the larger system in theparticular form of the mathematical terms in the simplifiedsystem. For instance, our three-variable model does not explicitlycontain the cytoplasmic NF-�B–I�B complex, yet its effects areevident in the saturation of the degradation rate of I�B, whichis so crucial for oscillations, as well as in the import rate ofNF-�B.
Our simplified models concentrate mainly on the feedback toNF-�B through the � isoform of I�B. Thus, our results applydirectly to mutants lacking both the I�B� and -� isoforms. Asshown in Figs. 12–14, extending the model to include the effectof these isoforms (which are not activated by NF-�B) leads todamped, but nevertheless spiky, oscillations. Therefore, webelieve our conclusions would hold for WT cells also. Indeed,single-cell f luorescence measurements of the ratio of nuclear tocytoplasmic NF-�B in WT cells do show spiky oscillations (e.g.,see figure 3B in ref. 6).¶ We emphasize that when we speak ofspikiness of the oscillations, we are referring to the concentrationof nuclear NF-�B. I�B oscillations, conversely, are not spiky,both in experiments as well as in our models.
Returning to the question of the functional role of oscillations,the activity of genes downstream of NF-�B depends on theamount of time for which NF-�B is present inside the nucleus insufficiently large concentrations to dimerize and bind to thosegenes’ operator sites. It seems reasonable to assume that NF-�Bcould signal different downstream genes, simply by regulatingthe amount and exposure time to IKK, provided that thesignaling system is sufficiently sensitive to changes in IKKconcentration. We have shown that the spiky oscillations can,indeed, show a high sensitivity to IKK. This finding is a clearly
testable prediction of our model and in fact seems to beconsistent with the results of recent experiments studying trig-gering of NF-�B using various temporal profiles of IKK (33).This sensitivity allows a great versatility in the regulation ofdownstream genes by NF-�B. Where the cell requires a gene tobe very sensitive to the IKK concentration, the system can useequilibrium binding of NF-�B to the operator site to get steepresponse curves with Hill coefficients �20. And where a slowerresponse is necessary, it can be achieved by adjusting the bindingand dissociation constants of NF-�B to the operator site so thatthe binding remains away from equilibrium.
The difference between the equilibrium and nonequilibriumcases stems from the fact that in the former case the gene activityfollows the NF-�B concentration closely (see Fig. 8A), and so thepeak gene activity follows the peak concentration, which is verysensitive to IKK as shown in Fig. 5B. Conversely, in the non-equilibrium case, the gene activity effectively integrates oversuccessive spikes of NF-�B because it decays slowly betweenspikes (see Fig. 8B). Therefore, the peak gene activity follows theaverage NF-�B concentration. This average has much lesssensitivity to IKK because it is proportional to the product of thespike peak and duration, and these two quantities have theopposite response to changes in IKK (Fig. 5), which roughlycancel in the product. Note that the nonequilibrium example isan extreme limit presented as a counterpoint to the equilibriumcase. Such small values of koff are possible but unlikely inpractice. Nevertheless, it is clear from these two limits that it ispossible for genes to respond differently despite being triggeredby the same oscillatory input.
Given this versatility in regulatory strategies, it seems likelythat cells would have evolved to make use of these propertiesof the NF-�B oscillations. It remains to be uncovered theparticular ways NF-�B regulates specific genes and to testwhether the oscillations play any physiological role in thisregulation.
We thank J. Ferkinghoff-Borg, E. Siggia, G. Tiana, and anonymousreferees for useful suggestions. This work was supported by the DanishNational Research Foundation.
1. Lee, K.-Y., D’Acquisto, F., Hayden, M. S., Shima, J.-H. & Ghosh, S. (2005)Science 308, 114–118.
2. Lawrence, P., Bebien, M., Liu, G. Y., Nizet, V. & Karin, M. (2005) Nature 434,1138–1143.
§Our conclusion is further bolstered by Hayot and Jayaprakash’s study (32) of the effects ofstochastic noise on NF-�B oscillations using a simplified model similar to our seven-variablemodel.
¶Oscillations observed by Hoffman et al. (5) in WT cells and various mutants appear to besoft. We attribute this softness to their use of bulk measurements where the spikinesscould be diluted by the averaging. Single-cell measurements avoid this averaging.
Fig. 8. Examples of time course of gene activity for genes regulated byNF-�B. Dotted line shows the nuclear NF-�B concentration. The time period ofoscillations is 130 min. Solid line shows the gene activity, G* (see text), as afunction of time. (A) Equilibrium binding: 1�koff is much less than the timeperiod of oscillations. koff � 1�13 min�1; kon 0.3 M�2�min�1. (B) Nonequi-librium binding: 1�koff is larger than the time period. koff � 1�260 min�1; kon 0.04 M�2�min�1.
10844 � www.pnas.org�cgi�doi�10.1073�pnas.0604085103 Krishna et al.

3. Ghosh, S. & Karin, M. (2002) Cell 109, S81–S96.4. Ghosh, S., May, M. J. & Kopp, E. B. (1998) Annu. Rev. Immunol. 16,
225–260.5. Hoffmann, A., Levchenko, A., Scott, M. L. & Baltimore, D. (2002) Science 298,
1241–1245.6. Nelson, D. E., Ihekwaba, A. E. C., Elliott, M., Johnson, J. R., Gibney, C. A.,
Foreman, B. E., Nelson, G., See, V., Horton, C. A., Spiller, D. G., et al. (2004)Science 306, 704–708.
7. Pahl, H. L. (1999) Oncogene 18, 6853–6866.8. Lipniacki, T., Paszek, P., Brasier, A. R., Luxon, B. & Kimmel, M. (2004) J.
Theor. Biol. 228, 195–215.9. Sun, S. C., Ganchi, P. A., Ballard, D. W. & Greene, W. C. (1993) Science 259,
1912–1915.10. Scott, M. L., Fujita, T., Liou, H. C., Nolan, G. P. & Baltimore, D. (1993) Genes
Dev. 7, 1266–1276.11. Nelson, D. E., Horton, C. A., See, V., Johnson, J. R., Nelson, G., Spiller, D. G.,
Kell, D. B. & White, M. R. H. (2005) Science 308, 52 (reply to comment).12. Tiana, G., Sneppen, K. & Jensen, M. H. (2002) Eur. J. Phys. B 29, 135–140.13. Jensen, M. H., Sneppen, K. & Tiana, G. (2003) FEBS Lett. 541, 176–177.14. Bliss, R. D., Painter, P. R. & Marr, A. G. (1982) J. Theor. Biol. 97, 177–193.15. Goodwin, B. C. (1965) in Advances in Enzyme Regulation, ed. Weber, G.
(Pergamon, Oxford) Vol. 3, pp. 425–438.16. Goldbeter, A. (1991) Proc. Natl. Acad. Sci. USA 88, 9107–9111.17. Igoshin, O. A., Goldbeter, A., Kaiser, D. & Oster, G. (2004) Proc. Natl. Acad.
Sci. USA 101, 15760–15765.
18. Jacquet, H., Renault, G., Lallet, S., Mey, J. D. & Goldbeter, A. (2003) J. CellBiol. 161, 497–505.
19. Leloup, J.-C. & Goldbeter, A. (2003) Proc. Natl. Acad. Sci. USA 100,7051–7056.
20. Reidl, J., Borowski, P., Sensse, A., Starke, J., Zapotocky, M. & Eiswirth, M.(2006) Biophys. J. 90, 1147–1155.
21. Goldbeter, A., Dupont, G. & Berridge, M. (1990) Proc. Natl. Acad. Sci. USA87, 1461–1465.
22. Kurosawa, G. & Iwasa, Y. (2002) J. Biol. Rhythms 17, 568–577.23. Vogelstein, B., Lane, D. & Levine, A. J. (2000) Nature 408, 307–310.24. Francois, P & Hakim, V. (2005) Phys. Rev. E Stat. Phys. Plasmas Fluids Relat.
Interdiscip. Top. 72, 031908.25. Goldbeter, A. (2002) Nature 420, 238–245.26. Bosisio, D., Marazzi, I., Agresti, A., Shimizu, N., Bianchi, M. E. & Natoli, G.
(2006) EMBO J. 25, 798–810.27. Huang, C.-Y. F. & Ferrel, J. E., Jr. (1996) Proc. Natl. Acad. Sci. USA 93,
10078–10083.28. Goldbeter, A. & Koshland, D. E. (1981) Proc. Natl. Acad. Sci. USA 78,
6840–6844.29. Lahav, G. (2004) Sci. STKE. 2004, pe55.30. Ting, A. Y. & Endy, D. (2002) Science 298, 1189–1190.31. Barken, D., Wang, C. J., Kearns, J., Cheong, R., Hoffmann, A. & Levchenko,
A. (2005) Science 308, 52 (comment).32. Hayot, F & Jayaprakash, C. (2006) J. Theor. Biol. 240, 583–591.33. Werner, S. L., Barken, D. & Hoffman, A. (2005) Science 309, 1857–1861.
Krishna et al. PNAS � July 18, 2006 � vol. 103 � no. 29 � 10845
APP
LIED
MA
THEM
ATI
CSCE
LLBI
OLO
GY
Copyright © 2022 FDOKUMEN