![AAS 20 [1928] - ACTA APOSTOLICAE SEDIS](https://static.fdokumen.com/doc/165x107/63268566051fac18490dccc0/aas-20-1928-acta-apostolicae-sedis.jpg)
Minerals from Macedonia. X. Separation and identification of some oxide minerals by FT IR...
29
N. Jb. Miner. Abh. 180 3 215 – 243 Stuttgart, November 2004 Minerals from Macedonia. X. Separation and identification of some oxide minerals by FT IR spectroscopy, AAS, AES-ICP and powder XRD P. Makreski, G. Jovanovski, B. Kaitner,T. Stafilov, B. Boev, and D. Cibrev With 6 figures and 17 tables Makreski, P., Jovanovski, G., Kaitner, B., Stafilov, T., Boev, B. & Cibrev, D. (2004): Minerals from Macedonia. X. Separation and identification of some oxide mi- nerals by FT IR spectroscopy, AAS, AES-ICP and powder XRD. – N. Jb. Miner. Abh. (180): 215–243; Stuttgart. Abstract: The fourier transform infrared spectroscopy (FT IR), powder X – ray diffrac- tion (XRD) as well as atomic absorption spectrometry (AAS) and emission atomic spectrometry with induced coupled plasma (AES-ICP) are used as powerful techniques in the process of identification of several oxide minerals (hematite, Fe 2 O 3 ; magnetite, Fe 3 O 4 ; limonite, FeOOH; goethite, α-FeOOH; corundum, Al 2 O 3 ; rutile, TiO 2 ; chro- mite, FeCr 2 O 4 ) collected from various localities in the Republic of Macedonia. The mineral association of the localities where the minerals appear from (Pehˇ cevo, Dam- jan, Alšar, Rˇ zanovo, Sivec, Raduša, Veselˇ cani, Košino) with their petrological and mi- neralogical aspects are discussed. The content of the main and trace elements in the studied oxides is determined using AAS, AES-ICP, classical chemical analysis and the results are related to the geological and mineralogical conditions of their origin local- ities. As a pattern for mineral identification was the comparison of their infrared bands (their number, frequencies and intensities) with the corresponding literature data for the analogue (natural and synthetic) mineral species. In this context, in some cases disagreements between the infrared spectra of the studied mineral types (the number of bands and their frequencies) and the corresponding literature analogues appeared and have been discussed. The caused additional difficulties in the identification of the stud- ied minerals were solved by the analysis of their X-ray patterns. Powder X-ray patterns were also representative for the detection of impurities in some of the studied mineral samples. Key words: Oxide minerals, Macedonia, FT IR spectroscopy, AES-ICP, AAS, powder XRD. DOI: 10.1127/0077-7757/2004/0180-0215 0077-7757/04/0180-0215 $ 7.25 2004 E. Schweizerbart’sche Verlagsbuchhandlung, D-70176 Stuttgart
-
Upload
facultynaturalsciencesmathematics -
Category
Documents
-
view
4 -
download
0
Transcript of Minerals from Macedonia. X. Separation and identification of some oxide minerals by FT IR...
NJbMinerAbh 180 3 215ndash243 Stuttgart November 2004
Minerals from MacedoniaX Separation and identification of some oxideminerals by FT IR spectroscopy AAS AES-ICPand powder XRD
P Makreski G Jovanovski B Kaitner T Stafilov B Boev andD Cibrev
With 6 figures and 17 tables
Makreski P Jovanovski G Kaitner B Stafilov T Boev B amp Cibrev D(2004) Minerals from Macedonia X Separation and identification of some oxide mi-nerals by FT IR spectroscopy AAS AES-ICP and powder XRD ndash N Jb Miner Abh(180) 215ndash243 Stuttgart
Abstract The fourier transform infrared spectroscopy (FT IR) powder Xndashray diffrac-tion (XRD) as well as atomic absorption spectrometry (AAS) and emission atomicspectrometry with induced coupled plasma (AES-ICP) are used as powerful techniquesin the process of identification of several oxide minerals (hematite Fe2O3 magnetiteFe3O4 limonite FeOOH goethite α-FeOOH corundum Al2O3 rutile TiO2 chro-mite FeCr2O4) collected from various localities in the Republic of Macedonia Themineral association of the localities where the minerals appear from (Pehcevo Dam-jan Alšar Rzanovo Sivec Raduša Veselcani Košino) with their petrological and mi-neralogical aspects are discussed The content of the main and trace elements in thestudied oxides is determined using AAS AES-ICP classical chemical analysis and theresults are related to the geological and mineralogical conditions of their origin local-ities As a pattern for mineral identification was the comparison of their infrared bands(their number frequencies and intensities) with the corresponding literature data forthe analogue (natural and synthetic) mineral species In this context in some casesdisagreements between the infrared spectra of the studied mineral types (the number ofbands and their frequencies) and the corresponding literature analogues appeared andhave been discussed The caused additional difficulties in the identification of the stud-ied minerals were solved by the analysis of their X-ray patterns Powder X-ray patternswere also representative for the detection of impurities in some of the studied mineralsamples
Key words Oxide minerals Macedonia FT IR spectroscopy AES-ICP AAS powderXRD
DOI 1011270077-775720040180-0215 0077-7757040180-0215 $ 725 2004 E Schweizerbartrsquosche Verlagsbuchhandlung D-70176 Stuttgart
216 P Makreski et al
1 Introduction
Systematic study of the carbonate (Jovanovski et al 1999 a b 2002 a Mak-reski amp Jovanovski 2003) sulfide (Makreski et al 2001 2002 Jovanovskiet al 2002 b c Minceva-Sukarova et al 2003 Makreski et al in press)and sulfate (Stefov et al 1999 2000) minerals originating from the localitieswithin the Republic of Macedonia has been performed using vibrational (in-frared and Raman) spectroscopy The research has predominantly been fo-cused on mineral identification and characterization recently being spread tothe determination of the content of trace elements (Makreski et al 20022003)
In the process of the separation and purification of the minerals the signifi-cant number of the oxides have requested extremely long and hard patientwork It is due to several reasons (i) crystals are very small and hardly definedto be resolved from the ore (ii) the oxidation of their surface is highly ex-pressed (iii) minerals appear in aggregates with two and more oxides or othermineral types (iv) the samples show common morphological features (colorshape hardness etc) Therefore firstly the content of different main and traceelements in the investigated mineral samples is determined by AES-ICP AASand some classical chemical analyses in order to define the purity of the ana-lyzed minerals
On the other hand identification and characterization using vibrationalspectroscopy acquire wider spectral region (compared to some other mineralclasses and species) because a lot of them show absorption bands in theirspectra not only in the far IR but also in the mid IR region (Taylor et al1970)
Here are presented the results of the identification of the collected oxideminerals (hematite Fe2O3 magnetite Fe3O4 limonite FeOOH goethiteα-FeOOH rutile TiO2 corundum Al2O3 chromite FeCr2O4) using FT IRspectroscopy and powder X-ray diffraction
2 Experimental
21 Samples
The studied minerals were collected from various localities hematite (DamjanRzanovo) rutile (Veselcani) corundum (Sivec) limonite (Pehcevo) goethite(Alšar) magnetite (Damjan Košino) chromite (Raduša) The monocrystals ofthe investigated minerals were carefully picked up under a microscope fromthe ore samples and then powdered
Minerals from Macedonia 217
22 Instrumentation
The far infrared spectra of the studied samples were recorded on a Bruker113 v FT IR interferometer while Perkin-Elmer FT IR system 2000 interfero-meter was employed for the spectra in the mid IR region In the first casemulls in Nujol between polyethylene plates were prepared whereas KBr pelletmethod was practiced for the mid region spectra
Philips Analytical X-ray diffractometer PW3710 was used for X-ray powderdiffraction Generator with 50 kV and electricity of 30 mA was employed as asource for CuKα radiation
A Varian SpectrAA 640Z Zeeman electrothermal atomic absorption spec-trometer with a Varian PSD-100 Autosampler and Varian Model Liberty 110Inductively coupled plasma-atomic emission spectrometer were used for ele-ment determinations in the investigated minerals For dissolution of mineralsamples a Milestone Model Touch Control Microwave digestion system wasused
23 Dissolution of mineral samples
231 Dissolution of hematite magnetite limonite goethite corundum
The powdered oxide samples (01ndash02 g) were put in teflon vessels and 5 mlconc HCl 1ml HNO3 1ml H2O2 and few drops of HF were added Vesselswere introduced into a microwave system and samples were digested for20 min on 200 ˚C
232 Dissolution of rutile and chromite
The powdered sample (1 g) and 5 g of fusion agent (60 g of Na2CO3 30 gNa2B4O7 and 05g KNO3) were put in Pt-crucible and heated into a muffle fur-nace for 2 hours on 1000 ˚C After cooling 50 ml of HCl (11) were added andevaporated to dry After that 30 ml conc HCl and 80ndash100 ml of redistilled wa-ter were added the solution was filtered and filtrate transferred in a 250 ml vo-lumetric flask
233 Gravimetric determination of SiO2
05 g of powdered sample was put in a glass beaker and 15 ml redistilled waterand 20 ml conc HCl were added and the solution was evaporated to near dry-ness The residue was dissolved with 10 ml 1 gelatin and SiO2 was precipi-tated and coagulated Precipitate was filtered and washed with HCl solution(5 95) Filter paper and residue were transferred into a platinum crucible andheated on 1000 ˚C for 10 min Crucible was weighed and the content of SiO2
was calculated
218 P Makreski et al
3 Mineral associations of the studied hematite rutilecorundum magnetite chromite limonite and goethite
31 Pehcevo deposit
Nearby the city Pehcevo (Eastern part of Macedonia) in the series of quarternsediments represented by swamp-lake products (pebbles sands clays allu-vium proluvium) another series of quartzlatite breccias appear in this regionnear the village Negrevo on the west side of the Bukovik Mountain (Stojano-vic 1969) Quartzlatite breccias are built up of the quartzlatite fragments ce-mented with limonite The limonite appears as a massive cemented materialwhich connects the quartzlatite fragments
32 Alšar deposit
In the Kozuf-volcanic area represented by the volcanic rocks from the latiticndashquartzlatiticndash trachiticndashrhyolitic varieties in the west part of the complex nearthe Macedonian-Greek border an AsndashSbndashTlndashBandashHgndashAu mineralization ap-pears (Boev 1988 Frantz et al 1994 Boev et al 2002) It appears in theform of impregnation and also in the form of the metasomatic bodies on thecontact sections between subvolcanic dykes of thachite and dolomite rocks aswell as in the form of scattered epithermal mineralization linked to the sedi-mentary rocks for example tuffs On the surface (the upper parts of the orebodies) a supergenious processes of the mineral transformation (representedby the so-called iron hats) take place
33 Raduša deposit
In the west ophiolitic Vardar belt as well as in the inner Dinarian ophioliticzone in the Republic of Macedonia (northwest part) an ultrabasic massif Ra-duša is situated Basically it is built up from the ultrabasic rocks presented bydunites harzburgites lherzolites pyroxenites rarely gabbropegmatites andrhodingites (Grcev amp Milovanovic 1962 Grcev 1964) A chromite mineral-ization appears in the dunite series as for example alpinotype mineralizationThis mineral is configured by the tectonically very deformed bodies with theradial and irregular massive form and with rather high purity
34 Veselcani deposit
In the micachistsrsquo series of the Pelagonian metamorphic complex of Macedo-nia which is basically build up of gneisses micachists amphibolites and marb-les a large well-formed crystals (even 10 cm) of rutile are found nearby theVeselcani village (Dumurdzanov amp Hristov 1976) This mineral has com-mon origin with quartz and muscovite and is associated in the pegmaticndashquartz veins Most of the rutile crystals are twinned
Minerals from Macedonia 219
35 Sivec deposit
In the marble series of the Pelagonian metamorphic complex near the Prilepcity a surface mine (Sivec) for white dolomite marble exploitation is acti-vated These marbles which according to the degree of metamorphism andmineral association belong to the group of regional-metamorphic rocks arebasically composed of dolomite calcite diaspore fluorite rutile tourmalinepyrite muscovite chlorite illite coisite and corundum (Baric 1969 Jeršek ampMitric 1999) The marbles are often associated with regularly grown pink tored colored corundum crystals The size of the crystals varies but sometimesreaches up to 20cm in length
36 Košino deposit
In the west contact edge between the Pelagonian metamorphic complex andwest-Macedonian zone a variety of paleozoic-metamorphic rocks representedby different schists series appears (Dumurdzanov et al 1972) It is to empha-size that close to the Košino village an epidotendashchloritendashamphibole schistsseries is present often composed by little content of talcschists actinoliteschists metagabbros serpentinites and metadiabases The light-green coloredschists have massive texture and nematoblastic structure They consist ofamphibole chlorite epidote and coisite as well as the less content of albitequartz sericite biotite talc titanite pyrite magnetite Magnetite appears inthe form of octahedra reaching about 1cm length
37 Rzanovo deposit
In the west ophiolitic belt of the Vardar zone a rich iron-nickel locality Rza-novo is located The basic geological constitution of this deposit includes thefollowing stratigraphic units triasic limestones jurasic serpentinites iron-nickel ore from the lower Cretaceous age upper Cretacious limestones andschists (Ivanov 1962) From the mineralogical point of view a variety of min-erals is present magnetite hematite chromite limonite pyrite chlorite rie-beckite chrysotile talc brucite and other (Boev amp Stojanov 1985 Boev ampJankovic 1996) Serpentinite minerals are also widespread because this loca-lity is placed at the ultrabasic rocks subjected to the continuous process of ser-pentinization Contrary to the magnetite samples from the Košino localityhere it is followed by massive mineralization and does not appear in regularcrystal forms
38 Damjan deposit
The scarn iron deposit Damjan is placed in the range of the Vardar zone nearlythe border of Serb-Macedonian metamorphic complex when approaching from
220 P Makreski et al
the Macedonian territory The process of iron mineralization is located on thecontacting fragments among andesites and limestons (Ivanov 1965 Serafi-movski 1990) The most common minerals are magnetite hematite and pyriteHematite originates in massive aggregates and sometimes is known as specu-larite
4 Results and discussion
41 Determination of macro and trace elements in minerals
The oxide minerals often appear as common aggregates in the nature ratherthan as well-formed monocrystal species For example the rusting problemi e oxidation of ferrous hydroxide complexes and transformation into α- β-γ- δ-FeOOH and Fe3O4 (Ryskin 1974) additionally contributes to the com-mon appearance of the iron oxides Therefore it is important to determine thecontent of the main elements and the presence of trace elements in the studiedoxide minerals and find out whether their growth origin is anyhow reflected inthe mineral purity or contamination For this purpose AAS and AES-ICP wereapplied for determination of main and trace elements and the obtained resultsare given in Tables 1 and 2
As seen the content of some elements is in relation with the origin of theminerals and with the mineralization of their locality Thus the high presenceof magnesium aluminium and silicon is observed in the hematite sample fromRzanovo which is in accordance to the high presence of serpentinite mineralsin this locality (Boev amp Stojanov 1985 Boev amp Jankovic 1996) Further-more the content of chromium in this mineral is also high (144 Cr2O3) re-
Table 1 The content of main elements (expressed in oxides) in the investigated min-erals (given in wt)
Mineral Locality Fe2O3 Al2O3 CaO MgO TiO2 Cr2O3 Na2O K2O SiO2
Hematite Damjan 9706 108 029 004 0012 0002 0028 0098 143Hematite Rzanovo 7929 239 023 464 0038 144 047 0088 954Magnetite Damjan 9030a 056 159 017 0014 0003 010 0097 78Magnetite Košino 9650a 035 144 034 034 014 0061 0031 17Limonite Pehcevo 7078b 366 048 010 031 0013 027 044 2365Goethite Alšar 8532b 096 338 125 0004 0008 0069 011 632Corundum Sivec 574 8630 147 023 004 0035 012 0093 378Rutile Veselcani 015 002 003 002 9955 0001 ndash ndash 014Chromite Raduša 2968b 025 152 092 002 625 ndash ndash 21
a Expressed as Fe3O4b Expressed as FeO
Minerals from Macedonia 221
Table 2 The content of microelements (expressed in oxides) in the investigated min-erals (given in ppm)
Mineral Locality Mn2O3 NiO ZnO CuO PbO CoO CdO Ag2O
Hematite Damjan 122 111 142 11 57 5 1 4Hematite Rzanovo 586 150 156 920 113 501 0 1Magnetite Damjan 1256 192 173 334 206 13 1 1Magnetite Košino 24 645 123 74 25 38 1 2Limonite Pehcevo 295 90 249 462 196 7 2 2Goethite Alšar 116 74 151 298 7 1 6 1Corundum Sivec 198 35 81 106 13 3 5 3
lated to the presence of chromite in this locality (Boev amp Stojanov 1985Boev amp Jankovic 1996) At Damjan deposit iron mineralization occurs onthe contacting fragments among andesites and limestone (Ivanov 1965 Sera-fimovski 1990) influencing the iron minerals contamination These resultshave shown the notable presence of Si and Ca (Table 1) in magnetite sample
Very similar behavior is observed for the goethite mineral sample from theAlšar deposit (high content of Si Al Ca and Mg) (Boev 1988 Frantz et al1994 Boev et al 2002) Extremely high content of Si was found in the limo-nite sample from Pehcevo confirming that this sample actually contains thecemented quartzlatite fragment in the limonite core (Stojanovic 1969)
As it can be seen from data given in Tables 1 and 2 magnetite sample fromKošino (well-formed monocrystals) is characterised with significantly higherpurity compared to the magnetite analogue from Damjan (small and not wellformed microcrystals) The comparison of the obtained data (Table 2) for mag-netite and hematite samples from Damjan locality has shown the presence ofdifferent content of some analyzed elements Thus the content of manganesecopper and lead in magnetite is evidently higher than in hematite which is inaccordance to the literature data (Nesse 2000)
42 Infrared and powder X-ray diffraction study
421 Hematite
Two hematite spectra of the samples from Damjan and one from Rzanovo(Fig 1) were studied in the far infrared region The spectra are similar andstrongly indicate that the investigated samples belong to the same mineral It isimportant to point out that for hematite four to six infrared bands are regis-tered in the literature (Table 3) Namely only the lowest and the highest fre-quency band lack in the spectra discussed by Taylor et al (1970) and by Far-mer (1974 a) respectively whereas both are absent in the spectrum obtained
222 P Makreski et al
Fig1 The far IR spectra of hematite from Damjan (a b) and Rzanovo (c)
Table 3 Band assignment and the frequencies in the IR spectra of hematite samplesfrom Damjan and Rzanovo compared to corresponding literature data (in cmndash1)
Des- Taylor et al Farmer McDevitt amp Serna et alcription 1970 1974a Baun 1964 1982
natural natural synthetic syntheticb
This work
Damjan1 Damjan2 Rzanovo
Eu1 641mc 640 m 643 m 625 sh ndash ndash 650 w 630 sh
Eu2 453 s 450 s 446 s 465 s 480 s 468 s 440 s 470 s
Eu3 315 s 320 s 307 s 335 s 345 s 325 s ndash 335 s
Eu4 233 w 233 w 233 w ndash 235 w ndash 229 w 229 w
A2 u1 528 s 539 s 526 s 545 s 560 s 560 s 525 s 540 s
A2 u2 397 w 394 w 397 w 370 sh 370 sh 370 sh 400 sh 380 w
a The band frequencies are approximate because numeric data are not givenb First coloumn ndash lath-shaped microcrystals Second coloumn ndash very irregular shaped particlesc s ndash strong m ndash medium w ndash weak sh ndash shoulder
by McDevitt amp Baun (1964) In spite of that all bands in our spectra arecovered (Table 3) by analogue ones in the spectra published by Serna et al(1982) However the bands in the infrared spectra of the studied hematitesamples (Fig 1) are in accordance with the predictions based on the factorgroup analysis (McMillan amp Hofmeister 1988) 2A1g(R) + 3A2 g + 5Eg(R)+ 2A1u + 2A2u(IR) + 4Eu(IR)
The crystal structure of hematite (Blake et al 1966) is based on approx-imately hexagonally close-packed oxygen anions lying on the two-fold axes
Minerals from Macedonia 223
Table 4 The most intense maxima in the X-ray diagram of hematite from Rzanovocompared to the literature data (peak hunt 3 )
Berry amp Berry (Ed) Impuritiesa
Thompson 1962 1972This work
h k l II0 dexp (Aring) dexp (Aring) dexp (Aring) dexp (Aring)
12 903 ndash 935x ndash Talc25 799 ndash 15 688 ndash 710x ndash Orthochrysotile8 467 ndash 4596 ndash Talc
0 1 2 29 362 3683 3663
10 351 ndash 3557 ndash Orthochrysotile20 305 ndash 3124 ndash Talc
1 0 4 100 267 26910 269x
1 1 0 70 249 2528 2515
6 227 ndash 2338 ndash Orthochrysotile1 1 3 25 219 2214 2203
0 2 4 36 183 18436 1844
1 1 6 45 168 16977 1696
1 2 2 14 159 16043
2 1 4 26 148 14885 1484
3 0 0 26 145 14575 1454
2 0 8 6 134 13511
1 0 10 13 131 13134
2 1 7 7 125 12612
3 1 2 5 119 11922
0 2 10 8 116 11662
1 3 4 9 114 11434
2 2 6 10 110 11064
2 1 10 10 105 10585
2 3 2 6 099 0993
a According to Berry amp Thompson 1962
and being coordinated by four iron cations in the form of rather distorted tetra-hedron (Farmer 1974 a Nesse 2000) Here the atom displacements associatedwith the corresponding normal modes are likely to be strongly mixed Gener-ally the bands registered at around 530 and 396 cmndash1 could be tentatively re-lated to the two A2 u symmetry modes These modes involve only oxygen mo-tion parallel and perpendicular to the plane of the four Fe atoms coordinatingthe oxygen whereas the remaining four bands at about 641 450 315 and233 cmndash1 (Fig 1 and Table 3) could be attributed to the iron-oxygen displace-ment modes with Eu symmetry
224 P Makreski et al
Table 5 The most intensive maxima in the X-ray diagram of hematite from Damjancompared to the literature data (peak hunt 2 )
Berry amp Berry (Ed) ImpurityThompson 1962 1972
This work
h k l II0 dexp (Aring) dexp (Aring) dexp (Aring) dexp (Aring)
0 1 2 22 361 3683 3663
14 328 ndash 334x ndash Quartz1 0 4 100 266 26910 269x
1 1 0 40 249 2528 2515
9 227 ndash 2284 ndash Quartz1 1 3 17 218 2214 2203
0 2 4 27 183 18436 1844
1 1 6 44 168 16977 1696
1 2 2 15 159 16043
2 1 4 20 148 14885 1484
3 0 0 19 145 14575 1454
2 0 8 6 134 13511
1 0 10 19 130 13134
2 1 7 7 125 12612
3 1 2 7 118 11922
0 2 10 7 116 11662
1 3 4 7 114 11434
2 2 6 7 110 107912
2 1 10 10 105 10585
2 3 2 5 099 0993
The observed frequency shifts of the corresponding bands (Fig 1 and Table3) in the studied spectra are due to the influence of the particle shape and size(Serna et al 1982)
The X-ray diagrams of the investigated hematite samples were obtained inorder to identify mineral As seen from Tables 4 and 5 both X-ray patterns aresimilar excluding the appearance of a series of the peaks with the d ndash valueshigher than 4 Aring in the X-ray pattern of hematite from Rzanovo (the X-ray dia-gram of both Damjan samples are identical) Regarding the high content ofMg and Si in the Rzanovo sample (Table 1) the peaks at d = 903 467 and305 Aring are compliant with talc maxima registered at 935 459 and 312 Aring(Berry amp Thompson 1962) whereas the maxima registered at 688 351 and227 Aring correspond to the presence of orthochrysotile impurities (710 355 and233 Aring see Table 4)
Minerals from Macedonia 225
422 Corundum
Corundum is isomorphous with hematite (Newnham amp Megaw 1960) andreasonably six active IR bands are expected in its spectrum (Fig 2) Two ofthem (A2 u symmetry modes) involve only oxygen motion parallel and per-pendicular to the plane of the four Al atoms coordinating the oxygen(McMillan amp Hofmeister 1988) are related to the bands at 607 and398 cmndash1 (Fig 2 and Table 6) The remaining bands at 644 562 459 and379 cmndash1 are tentatively prescribed to the Eu modes and have origin of bothmetal and oxygen displacements Generally the frequencies in our spectrumare in agreement with the literature data (Table 6) The differences could bemainly prescribed to the shape of the particles which provokes remarkable in-fluence on the frequency and the intensity of the most bands due to the infra-red surface modes Thus the evolution of the corundum (α-Al2O3) surfacemodes with geometry of the particles is strongly affected for the most high-frequency A2 u and Eu modes They amount from 600 to 900 cmndash1 and from640 to 880 cmndash1 respectively being moved going from transverse to longitu-dinal optical mode (Serna et al 1982)
High frequency bands at 1087 and 969 cmndash1 observed in our spectrum (Fig2) are registered at similar frequencies (Taylor et al 1970 Plyusnina 1977)Besides them additional very weak bands at 798 and 778 cmndash1 are also found
Table 6 Band assignment and the frequencies in the IR spectra of corundum from Si-vec based on the factor group analysis and compared to corresponding literature data(in cmndash1)
Descrip- This work Taylor Farmer Nicodom Plyusnina McDevitt amp Serna et al
tion (Sivec) et al 1970 1974 1998 1977 Baun 1964 1982
natural naturala naturala natural synthetic syntheticb
Eu1 644mc 640 m 630 s 642 s 620 m ndash 638m 642 s
Eu2 607 s 605 s 597 s 605 s ndash 575 s 590 s 600 s
Eu3 459 s 450 s 460 s 455 s 460 s 432 s 450 s 458 s
Eu4 379 m 380 w 380 w ndash ndash 375 sh 385 w 385 m
A2u1 562 sh ndash 495 w 560 sh 520 w ndash ndash 560 w
A2u2 398 w ndash 400 sh ndash ndash ndash ndash 433 w
Not assig- 1087 m 1085 vw 1085 s 1160 s
ned bands 969m 965 vw ndash 1040 sh
798 w 800 w 800 m 757 w
778 w 780 w 680 m 500 m
a The band frequencies are approximate because numeric data are not givenb First coloumn ndash platy-shaped particles Second coloumn ndash disc and lath-shaped particlesc s ndash strong m ndash medium w ndash weak sh ndash shoulder
226 P Makreski et al
Fig2 The mid IR spectrum of corundum from Sivec
at 800 and 780 cmndash1 (Nicodom 1998) by Plyusnina (1977) at 800 and 680cmndash1 and by Serna et al (1982) for the disc and lath-shaped particles sample(at 757 and 500 cmndash1) It could be taken as an indication about the presence ofsome type of disorder in the structure or the presence of additional type ofcoordination of the aluminium atoms (e g AlO4 AlO3) in the structure(Plyusnina 1977)
Its identity is proved by the comparison of the d ndash values of the most inten-sive maxima in the X-ray diagram of the studied sample with the most inten-sive eight maxima for the corundum sample taken from the literature (Berry1972) (Table 7) As seen from Table 7 the d ndash values of the eight most inten-sive maxima in the X-ray powder diagram of the studied mineral sample areaccompanied by practically the same d ndash values found in the corundum X-raydiagram (Berry 1972) Only negligible discrepancies in the correspondingpeak intensities are observed (Table 7) The additional peak at d = 201 Aring isprobably due to the presence of iron impurities (Table 1) in the form of magne-tite (209 Aring) (Berry amp Thompson 1962)
423 Rutile
The Ti4+ cations in the structure of rutile are octahedrally surrounded by sixO2ndash neighbors whereas three Ti4+ cations coordinate each O2ndash anion (Shin-tani et al 1975) The following vibrational modes and their activities are pre-dicted by factor group analysis (McMillan amp Hofmeister 1988) A1 g(R) +A2 g + B1g(R) + B2 g(R) + Eg(R) + A2 u(IR) + 2B1u + 3Eu(IR) Four IR active
Minerals from Macedonia 227
Table 7 The most intense maxima in the X-ray diagram of corundum from Sivec com-pared to the literature data (peak hunt 25)
This work Berry (Ed) 1972 Impuritya
h k l II0 dexp (Aring) dexp (Aring) dexp (Aring)
0 1 2 88 342 3488
1 0 4 100 252 2559
1 1 0 40 235 2384
1 1 3 97 207 209x
11 201 2097 ndash Magnetite0 2 4 57 173 1745
2 0 5 8 1621 1 6 73 159 1608
2 1 1 6 1540 1 8 10 1501 2 4 42 140 1403
3 0 0 50 137 1375
1 0 10 14 1232 2 6 17 1042 1 10 10 100a According to Berry amp Thompson 1962
Table 8 Band assignment and the frequencies in the IR spectra of rutile from Ve-selcani and compared to corresponding literature data (in cmndash1)
Description This work Luxon amp Ocana amp McDevitt amp(Veselcani) Summitt 1969 Serna 1991 Baun 1964
ndash naturala ndash naturalb ndash synthetic
Eu1 ndashν3 334 mc 350 365ndash345 352 w
Eu2 ndashν2 398 m 425 435ndash405 423 w
Eu3 ndashν1 528 w 610 545ndash515 608 s
A2 u ndashν4 600 s 680 675ndash600 695 sa The intensities are not givenb The range for band appearance is given because six spectra are observed Intensity
variesc s ndash strong m ndash medium w ndash weak
modes are registered in the studied far IR spectrum of rutile sample at 600528 398 and 334cmndash1 (Fig3 and Table 8)
The spectrum of rutile is extremely sensitive to size shape and other prepa-ration conditions of the sample (Farmer 1974 a b Lutz amp Haeuseler 1998)This effect is due to the high refraction index and is predominantly expressed
228 P Makreski et al
Fig3 The far IR spectrum of rutile from Veselcani
in the IR rather than in the corresponding Raman spectrum (Farmer 1974 a)Thus the number of the registered bands in the literature is enlarged and cau-ses broadening of the spectral region where the corresponding bands are ex-pected to appear According to Preudhomme amp Tarte (1971) and Plyusnina(1977) the presence of TiO6 octahedra is followed by the appearance of thestrong and broad band in the 700ndash500 cmndash1 region due to the stretching TindashOvibrations Similar strong band in the 680ndash600 cmndash1 region has also been ob-served by Ocana amp Serna (1991) The strong band at 680 cmndash1 prescribed tothe Ti4+ displacement relative to the O2ndash ions along the c axis has also beenregistered by Luxon amp Summitt (1969) and Farmer (1974 a) Consequentlythe highest frequency band in the studied spectrum of the rutile sample (ataround 600 cmndash1) could be prescribed to the TindashO stretchings (A2 u mode) Theremaining three bands at 528 398 and 334 cmndash1 could be probably related tothe 3Eu modes giving dipole oscillations perpendicular to the c axis (Farmer1974 a Lutz amp Haeuseler 1998) However it could be concluded that theidentification of the minerals with high polarizability index should be justifiedeven in the cases when rather expressed extent of band shifting is observed
The X-ray powder diffraction diagram of the studied rutile sample was re-corded for the purpose of the further identification of the mineral The mostintense registered maxima in the studied powder diagram are listed in Table 9and compared with the corresponding maxima in the diagrams of natural
Minerals from Macedonia 229
Table 9 The most intense maxima in the X-ray diagram of rutile from Veselcani com-pared to the literature data (peak hunt 15)
Berry amp Berry (Ed)Thompson 1962 1972a
This work
h k l II0 dexp (Aring) dexp (Aring) dexp (Aring)
1 1 0 100 321 32410 325x
1 0 1 32 246 2495 2495
2 0 0 8 223 22912
1 1 1 15 217 2183 2193
2 1 0 7 204 20512
2 1 1 33 168 16877 1696
2 2 0 9 162 16213 1622
0 0 2 6 147 14731 1461
1 3 0 6 145 14511
0 3 1 12 135 13544 1352
1 1 2 8 134 13441
3 2 1 5 118 11691
2 2 2 5 109 10921
1 4 1 5 104 104112
a Synthetic analogue
(Berry amp Thompson 1962) and synthetic (Berry 1972) rutile samples Thecomparison has shown that the powder X-ray pattern of the natural rutile takenfrom the literature (Table 9) is practically identical with the studied diagramThe results of the X-ray pattern analysis confirmed the preliminary identifica-tion based on the investigation of the FT IR spectrum of rutile
424 Magnetite
The structure of magnetite (Hill et al 1979) is based on cubic close-packedoxygens with eight Fe2+ cations in octahedral coordination sites eight Fe3+
cations distributed to tetrahedral and eight Fe3+ cations to octahedral sites Ac-cording to factor group analysis four vibrational infrared modes are expectedin its spectrum (McMillan amp Hofmeister 1988) A1 g(R) + Eg(R) + F1 g +3F2 g(R) + 2A2 u + 2Eu + 4F1u(IR) + 2F2 u but only two (at 570 and 385 cmndash1)have been observed by Taylor et al (1970) and McDevitt amp Baun (1964)(Table 10) On the other side even ten bands have been registered in the1500ndash400 cmndash1 region of the infrared spectrum of the sample contemplated asmagnetite (Nicodom 1998)
Several problems in the process of recording of the far infrared spectra ofour two magnetite samples from Damjan and Košino (Fig 4) due to the pow-dered sample particle size and weakness of the bands in the spectrum occurred
230 P Makreski et al
Table 10 The frequencies and intensities of the bands in the far and mid IR spectra ofmagnetite from Damjan and Košino compared to corresponding summarized literaturedata (in cmndash1)
Magnetite (Damjan) ndash far IR 553 sba 442 mb 388 wb ndashMagnetite (Damjan) ndash mid IR 559 sb 455 mb 396 mb 386 vwMagnetite (Košino) ndash mid IR 573 sb 459 mb 398 w 389 w 384 wTaylor et al 1970 ndash natural 570 sb ndash 385 mb ndashMcDavitt amp Baun 1964 ndash synthetic 570 sb ndash 385 mb ndasha s ndash strong m ndash medium w ndash weak b ndash broad
Fig 4 The far (a) and mid (b) IR spectra of magnetite from Damjan and mid IR spec-trum of magnetite from Košino (c)
(McDavitt amp Baun 1964 Farmer 1974 a) Therefore additional powderingof the samples was undertaken in order to record the mid spectra of magnetiteusing KBr pressed discs and to reduce the scattering (Fig 4) Consequentlythe maximum of the most intensive band in the far infrared of magnetite fromDamjan at 553 cmndash1 is blue shifted for 6 cmndash1 in the mid IR spectrum Thesame band in the mid IR spectrum of magnetite sample from Košino is shiftedfor 20 cmndash1 being much closer to the frequency from the literature (Taylor etal 1970 McDavitt amp Baun 1964) Furthermore the band in our mid IRspectrum of the Damjan sample at 396 cmndash1 is in agreement with the corre-
Minerals from Macedonia 231
Table 11 The most intense maxima in the X-ray diagram of magnetite from Damjancompared to the literature data (peak hunt 3 )
Berry amp Berry (Ed) Impuritya
Thompson 1962 1972This work
h k l II0 dexp (Aring) dexp (Aring) dexp (Aring) dexp (Aring)
1 1 1 11 474 4843
11 410 ndash 4256 ndash Quartz10 363 ndash 3692 ndash Dolomite11 330 ndash 334x ndash Quartz
0 2 2 16 294 2966 2977
35 292 ndash 288x ndash Dolomite23 267 ndash 2673 ndash Dolomite
1 1 3 100 250 25310 253x
10 245 ndash 2463 ndash Quartz2 2 2 13 240 2421
10 219 ndash 2133 ndash Quartz0 0 4 23 208 2097 2107
10 183 ndash 18175 ndash Quartz2 2 4 14 170 17124 1716
13 168 ndash 16723 ndash Quartz1 1 5 25 161 16118 1619
0 4 4 35 147 14819 1489
1 3 5 10 144 141612
0 2 6 7 132 13272
3 3 5 10 127 12804
1 3 7 8 109 10948 1096
2 2 8 7 097 09904
a According to Berry amp Thompson 1962
sponding one registered by Taylor et al (1970) and McDavitt amp Baun(1964) at 385 cmndash1 whereas the band at 455 cmndash1 is not registered neither byfirst nor by the second group of authors Additional bands in the mid infraredspectra of Damjan sample (at 386 cmndash1) and Košino sample (at 389 and384 cmndash1) are also observed (Table 10) In this context it could be mentionedthat the infrared spectra of our two samples from Damjan and Košino are in abetter agreement with the theoretically expected four bands compared to thepublished data (Taylor et al 1970 McDavitt amp Baun 1964) where only twobands have been registered
The powder X-ray patterns of the two magnetite mineral samples fromKošino and Damjan were studied in order to confirm the results obtained bythe infrared and Raman study and to identify the studied minerals (Tables 11
232 P Makreski et al
Table 12 The most intense maxima in the X-ray diagram of magnetite from Košinocompared to the literature data (peak hunt 2 )
Berry amp Berry (Ed) Impuritya
Thompson 1962 1972This work
h k l II0 dexp (Aring) dexp (Aring) dexp (Aring) dexp (Aring)
1 1 1 12 474 4843
11 329 ndash 334x ndash Quartz0 2 2 26 293 2966 2977
1 1 3 100 252 25310 253x
22 249 ndash 2463 ndash Quartz2 2 2 10 240 2421
0 0 4 39 208 2097 2107
2 2 4 10 170 17124 1716
1 1 5 29 161 16118 1619
0 4 4 28 148 14819 1489
0 2 6 6 132 13272
3 3 5 8 128 12804
2 2 6 6 126 12641
2 4 6 6 112 11224
1 3 7 13 109 10948 1096
0 0 8 6 105 10505
2 2 8 9 097 09904
a According to Berry amp Thompson 1962
and 12) Magnetite sample from Damjan according to the results obtained bythe elemental chemical analysis (Table 1) has shown higher content of Si com-pared to the Košino analogue Consequently larger number of peaks in itsX-ray diagram (Table 11) is registered at d ndash values 410 330 245 219 183and 168 Aring due to presence of higher quantity of quartz impurities (d ndash values425 334 246 213 1817 and 1672 Aring) (Berry amp Thompson 1962) Insteadonly two maxima at 329 and 249 Aring are observed in the magnetite fromKošino with lower content of quartz (Table 1 and 12) Furthermore in agree-ment with the chemical analysis peaks (at d ndash values 363 292 and 267 Aring)responsible for the presence of dolomite (at d ndash values 369 288 and 267 Aring)in Damjan sample additionally appeared (Table 11) (Berry amp Thompson1962)
425 Chromite
The structure of chromite (Hill et al 1979) is based on the spinal type withcubic close-packed oxygens with 8 Fe2+ cations in tetrahedral coordinationsites and 16 Cr3+ cations distributed to octahedral sites within the unit cell
Minerals from Macedonia 233
Fig 5 The mid IR spectrum of chromite from Raduša
Table 13 The frequencies and intensities of the fundamental vibrations in the IR spec-trum of chromite from Raduša compared to the corresponding literature data (in cmndash1)
This work (Raduša) 3690 w 3439 w 1630 w 1084 w 958 m 690 sh 630 s 500 s 441sNicodom 1998 3680 m ndash ndash 1080 m 955 m 690 sh 635 s 502 s 450 sh
Similarly to magnetite four vibrational infrared modes are expected (McMil-lan amp Hofmeister 1988) A1g(R) + Eg(R) + F1g + 3F2 g(R) + 2A2 u + 2Eu +4F1u(IR) + 2F2 u In addition to the expected four infrared active modes regis-tered in the region from 690 to 440 cmndash1 five more less intensive bands ap-peared in its IR spectrum (Fig5)
No doubt that two of them (at 3439 and 1630 cmndash1) appear as a result ofpresence of surface absorbed water molecules in the structure (at room tem-perature) The highest frequency band (at 3690 cmndash1) corresponds to thev(H2O) mode of the free water molecule whereas the bands at 1084 and958 cmndash1 might be due to the presence of some silicate impurities (Table 1) Itis interesting to point out however that except the above mentioned twobands due to the absorbed water molecules the spectrum of our chromite sam-ple is in a complete agreement with the infrared spectrum of chromite (Nico-dom 1998) including the two bands around 1080 and 955cmndash1 (Table 13)
Since the identification of this mineral based only on the study of its infra-red spectrum is practically impossible further investigation of the chromitesample by powder X-ray diffraction has been performed The results of thisstudy (Table 14) have shown that all expected maxima according to Berry amp
234 P Makreski et al
Table 14 The most intense maxima in the X-ray diagram of chromite from Radušacompared to the literature data (peak hunt 2 )
Berry amp Berry (Ed)Thompson 1962 1972
This work
h k l II0 dexp (Aring) dexp (Aring) dexp (Aring)
1 1 1 45 469 4804 4825
0 2 2 19 290 2952 2956
1 1 3 100 248 25110 252x
12 237a ndash0 0 4 26 206 2085 2077
2 2 4 9 169 170412
1 1 5 53 159 16026 1609
0 4 4 24 146 14738 1469
5 140a ndash3 3 5 19 126 12711 1106
2 2 6 6 125 125412
4 4 4 30 119 12011
1 1 7 6 116 116612
2 4 6 6 111 11121 1106
3 5 5 11 108 10849
0 0 8 6 104 10414
20 096a ndasha Impurity
Thompson (1962) are found in our diagram Exceptions are the peaks at d ndashvalues 237 140 and 096 Aring probably due to the present silicate impurities inthe sample It should be mentioned that in the case of isomorphous chromiteand magnetite (cubic spinel phases) solid solution could also exist in the stud-ied sample
426 Limonite (goethite or lepidocrocite) from Pehcevo and goethite from Alšar
Generally the term limonite is used for mixtures of various iron oxide and hy-droxide minerals the most common among them being goethite α-FeOOH(Forsyth et al 1968 Szytuta et al 1968) and lepidocrocite γ-FeOOH(Zhukhlistov 2001) Six oxygen atoms octahedrally coordinate the iron inboth crystal forms
The infrared spectra of goethite and lepidocrocite have been discussed byvarious authors (McMillan amp Hofmeister 1988 Nicodom 1998 Oles et al1970 Sato et al 1969 Schwarzmann amp Sparr 1969 Ryskin 1974 Whiteamp Roy 1964) but rather expressed disagreement between the literature data forgoethite and also for lepidocrocite mineral form in the region of the OH
Minerals from Macedonia 235T
able
15
Sum
mar
ized
liter
atur
eda
tafo
rth
ein
frar
edsp
ectr
aof
goet
hite
and
lepi
docr
ocite
com
pare
dw
ithou
rda
tafo
rth
est
udie
dgo
ethi
tean
dlim
onite
sam
ple
Goe
thite
Thi
sw
ork
Lep
idoc
roci
teQ
uart
z
Plyu
snin
a19
77N
icod
om19
98R
yski
n19
74a
Wh
ite
ampR
oy19
64A
lšar
Pehc
evo
Wh
ite
ampR
oy19
64R
yski
n19
74a
Sasa
3510
3420
ν(H
2O)
3460
3419
3483
3388
3390
ν(O
H)
3330
ν(H
2O)
3200
ν(Fe
ndashO
ndashH
)31
0030
95ν(
OH
)31
1731
4129
85ν(
OH
)28
57ν(
OH
)17
4017
9116
40δ(
Hndash
Ondash
H)
1640
1637
1630
1460
1434
1425
1166
1145
11
61δ(
OH
)11
8310
9610
9010
9310
1710
2710
13δ(
OH
)90
0δ
(Fendash
Ondash
H)
900
890
δ(O
H)
893
901
882
δ(O
H)
877
881b
800
δ(F
endashO
ndashH
)80
079
7γ(
OH
)79
3ν(
Fendash
O)
799
798
799
725
779
738
ν(Fe
ndashO
)75
3γ(
OH
)77
966
5(F
endashO
)68
266
768
369
459
9ν(
Fendash
O)
600
570
570
543
516
453
ν(Fe
ndashO
hellipFe
)46
045
047
247
046
546
040
0ν(
Fendash
Ohellip
Fe)
425
407
397
396
365
ν(Fe
ndashO
hellipFe
)27
0δ
(Fendash
Ondash
Fe)
aO
nly
the
band
sco
ncer
ning
the
OH
vibr
atio
nsar
edi
scus
sed
bD
ueto
the
pres
ence
of10
of
goet
hite
inle
pido
croc
ite
236 P Makreski et al
Fig 6 The mid IR spectra of limonite from Pehcevo (a) goethite from Alšar (b) andquartz (c)
stretching vibrations has been found (Table 15) In order to compare them withour infrared spectra (Fig 6) the obtained data have been summarized in Table15 As seen the counterpart of the ν(OH) mode at 3095 cmndash1 mentioned byRyskin (1974) is the band at 3200 cmndash1 registered by Plyusnina (1977) whilethe corresponding vibration has been assigned at 2985 cmndash1 by White amp Roy(1964) Band with the similar frequency in the region where the ν(OH) modefor the goethite form of FeOOH is also observed in our spectrum at 3141cmndash1Additional two ν (HndashOndashH) modes (at 3420 and 3330 cmndash1) and one δ (HndashOndashH) mode (at 1640 cmndash1) due to the presence of water molecules in goethitehave been registered only by Plyusnina (1977) The bands due to the pres-ence of surface absorbed water molecules in the structure (at room temper-ature) have also been registered in the infrared spectrum of our sample (Fig 6)at 3510 and 3483 cmndash1 [ν (HndashOndashH)] and at 1630 cmndash1 [δ(HndashOndashH)] On theother hand the band at 1037cmndash1 in our spectrum which is expected to dis-criminate lepidocrocite from goethite has also been registered in the literatureat 1013 and 1020 cmndash1 and prescribed to δ (OH) mode (Table 15) Furthermoreanother distinguishing feature for lepidocrocite FeOOH form is observed bandat 1166 cmndash1 in the studied sample also found at 1161cmndash1 and prescribed toδ (OH) by Ryskin (1974) White amp Roy (1964) offered no explanation for theorigin of the band at 1145 cmndash1 In sharp contrast the same mode for thegoethite form expected and found at lower frequencies (890 cmndash1 Ryskin1974 and 882cmndash1 White amp Roy 1964) is also present in our spectrum at 901
Minerals from Macedonia 237
Table 16 The most intense maxima in the X-ray diagram of limonite from Pehcevoand quartz from Sasa compared to the literature data (peak hunt 25)
Berry amp Makreski amp Berry ampThompson Jovanovski Thompson1962a unpublishedb 1962b
This work
h k l II0 dexp (Aring) dexp (Aring) dexp (Aring) dexp (Aring)
1 1 0 53 419 42110 4083 4256
13 363 ndash ndash ndash1 2 0 100 331 3372 32810 33410
11 295 ndash ndash ndash1 3 0 33 268 2698 ndash ndash0 2 1 9 256 2572 ndash ndash0 4 0 13 248 2482 ndash ndash
11 246 ndash 2431 2463
1 1 1 20 244 2447 ndash ndash1 2 1 13 226 2252 ndash 2283
11 222 ndash 2211 2232
1 4 0 10 218 2184 ndash ndash2 2 0 11 211 20912 20612 2133
1 3 1 7 197 2001 19712 19972
2 1 1 16 181 18032 181212 18175
2 2 1 9 171 17195 ndash ndash2 4 0 17 169 16892 ndash ndash0 6 0 9 166 16601 166912 16723
1 5 1 6 156 15633 ndash ndash13 154 ndash 1540-2 15424
2 5 0 6 151 15072 ndash ndash0 6 1 12 148 145612 ndash ndash0 2 2 16 145 14522 144912 14552
3 3 0 10 138 13921 ndash 13796
1 7 0 11 137 13601 ndash ndash3 2 1 7 131 13182 13431 ndash0 4 2 7 128 129312 ndash 1292
a For goethite b For quartz
877 cmndash1 (Table 15) It was evident that the spectral features of the studiedsample in the region of the OH modes indicate the existence of a mixture ofboth mineral forms
The latter study of the infrared spectrum of the collected goethite samplefrom Alšar has shown the drastic intensity decreasing of the two strong bandsat 1085 and 1037cmndash1 found in the spectrum of limonite (Fig 6) The rest ofthe bands in the spectrum did not change having almost the same intensity and
238 P Makreski et al
Table 17 The maxima in the X-ray diagram of goethite from Alšar compared to theliterature data (peak hunt 35)
Berry amp Berry (Ed) Impuritya
Thompson 1962 1962This work
h k l IIo dexp (Aring) dexp (Aring) dexp (Aring) dexp (Aring)
0 2 0 20 503 5022 4981
1 1 0 100 412 42110 418x
1 2 0 15 339 3372
79 331 ndash 334x ndash Quartz1 3 0 45 267 2698 2693
0 2 1 33 256 2572
0 4 0 28 254 2482 2492
1 1 1 79 243 2447 2453
1 2 1 28 223 2252
1 4 0 26 218 2184 2192
2 2 0 11 212 20912
1 3 1 11 200 2001
0 4 1 10 193 1921
2 1 1 19 181 18032
1 4 1 12 178 177412
2 2 1 39 173 17195 1722
2 4 0 22 169 16892
0 6 0 13 166 1661
2 3 1 14 160 16022
1 5 1 36 156 15633 1562
2 5 0 21 150 15072
0 2 2 17 145 14522
1 1 2 12 142 142012
3 3 0 11 139 13921
1 7 0 13 137 1361
2 5 1 10 135 13471
3 2 1 14 131 13182
0 4 2 8 128 129312
2 0 2 9 126 12631
1 7 1 9 124 12391
3 4 1 9 120 11971
0 8 1 10 115 11511
4 1 0 9 114 11411
3 5 1 10 112 11251
1 9 0 7 108 107712
3 6 1 9 106 10561
4 3 1 11 102 10242
1 9 1 11 101 10142
0 10 0 7 098 09961
a According to Berry amp Thompson 1962
Minerals from Macedonia 239
frequencies being in a good agreement with literature data (Table 15) It wastaken as a strong indication that the studied limonite sample is in fact a mix-ture of goethite and another mineral rather than lepidocrocite
The performed chemical analysis has shown that the limonite sample con-tains 2365 silicon (expressed in SiO2 Table 1) Significantly lower contentof Si was found in the goethite sample On the other hand in order to identifythe nature of the present silicate mineral in the limonite sample the IR spectraof the limonite goethite and quartz are compared (Fig 6) The comparison hasshown that the bands at 1085 1037 779 683 and 470 cmndash1 in the spectrum oflimonite from Pehcevo arise from the quartz impurity (Fig 6) Thus it wasconfirmed that quartz is undoubtedly the dominant impurity in the studied li-monite It is expected having in mind its Pehcevo locality mineralization(quartzlatite breccia cemented with the limonite matter)
In order to confirm the above presumption the X-ray patterns of the studiedlimonite goethite and quartz samples were recorded The summarized resultsof the powdered X-ray analysis of limonite compared with the correspondingliterature data for goethite and quartz are shown in Table 16 Obviously themost intensive maximum for the studied limonite sample at d = 331 Aring is ac-companied with the corresponding maximum of quartz at d = 334 Aring (Berryamp Thompson 1962) The limonite diagram is additionally associated withthree other peaks (246 222 and 154 Aring) typical only for quartz (246 223and 1542 Aring) No doubt that a high content of quartz impurity is present in thestudied limonite sample On the other hand the goethite form of the studiedsample is manifested by the following powder X-ray peaks registered at d ndashvalues 268 256 248 244 218 171 169 156 151 148 and 137 Aring Theremaining maxima are common for both minerals and appear at very similar dndash values (Table 16)
The X-ray pattern of goethite from Alšar show much higher extend of simi-larity with the corresponding data given in the literature (Table 17) (Berry ampThompson 1962) Exception is the intensive peak at d = 331 Aring due to thequartz impurities in the sample Its appearance as the strongest maximum inquartz is expected (Berry amp Thomson 1962)
5 Conclusions
The content of the main and trace elements in the investigated oxide mineralswas determined by flame and electrothermal AAS AES-ICP as well as clas-sical chemical analysis The correlation between the type and the origin of theminerals was found and connected with the mineralogical conditions of the lo-calities
240 P Makreski et al
It was found that both far and mid infrared spectra are useful for the analy-sis of oxide minerals because for some of them absorption bands in thehigher frequency region are observed Therefore infrared spectra in both re-gions could serve as a powerful qualitative tool for the identification and char-acterization of oxide minerals Also the problems concerning particle size andform as well as sample powdering and preparation should not be underesti-mated for acquiring the good quality spectra Significant disagreement be-tween various infrared literature data for the same mineral type (especially forlimonite) has caused additional difficulties on the identification of the studiedminerals
On the other hand the powder X-ray diffraction technique enables a rapidcheck on the purity of the studied minerals giving an unambiguous opportu-nity for their identification Although both techniques are complementaryrather than competitive the analysis of the oxide minerals has proved that thepowder X-ray diffraction is more sensitive to mineral impurities determinationcompared to the FT IR spectroscopy
Acknowledgements
The financial support from the Ministry of Education and Science of the Republic ofMacedonia is gratefully acknowledged The authors cordially thank Professors DrHartmut Haeuseler and Bernward Engelen Department of Chemistry Univer-sity of Siegen Germany for making available the far infrared instrument Dr DraganMihajlovic from RŽ Tehnicka kontrola ndash Skopje for performing the classical chem-ical analysis and Vesna Zajkova Paneva from the Faculty of Mining and GeologySts Cyril and Methodius University Republic of Macedonia for obtaining the AES-ICP results
References
Baric L (1969) Dolomitmarmor in der Umgebung der Stadt Prilep und die in ihmvorkommenden Minerale ndash Tscher Min Petr Mitt 13 233
Berry L G (Ed) (1972) Inorganic Index to the Powder Diffraction File ndash JointCommittee on Powder Diffraction Standards Pennsylvania
Berry L G amp Thompson R M (1962) X-ray Powder Data for Ore Minerals ThePeacock Atlas ndash Geol Soc of America New York
Blake R L Hessevick R E Zoltai T amp Finger L W (1966) Refinement ofthe Hematite Structure ndash Am Miner 51 123ndash129
Boev B (1988) Petrologic Geochemical and Volcanic Features of Volcanic Rocks ofthe Kožuf Mountain ndash PhD Thesis Faculty of Mining and Geology Štip pp1ndash195
Boev B Bermanec V Serafimovski T Lepitkova S Mikulcic S SoufecM Jovanovski G Stafilov T amp Najdoski M (2002) Allchar Mineral As-semblage ndash Geologica Macedonica 15ndash16 1
Minerals from Macedonia 241
Boev B amp Jankovic S (1996) Nickel and Nickel-ferous Iron Deposits of the VardarZone (SE Europe) with Particular Reference to the Ržanovo-Studena Voda OreBearing Series ndash Faculty of Mining and Geology Spec Iss No 3 273
Boev B amp Stojanov R (1985) Metamorphism of NindashFe Ores from Ržanovo-Stu-dena Voda and the Zone Almopias ndash Geologica Macedonica 1 191
Dumurdzanov N Stojanov R amp Petrovski K (1972) The Interpretation ofKruševo City Sheet from the Basic Geologic Card of Macedonia 58
Dumurdzanov N amp Hristov S (1976) The Interpretation of Vitolište-KajmakcalanArea Sheet from the Basic Geologic Card of Macedonia pp 1ndash61
Farmer V C (1974 a) The Infrared Spectra of Minerals ndash In Farmer V C (ed)Miner Soc London 183ndash204
ndash (1974 b) The Infrared Spectra of Minerals ndash In Farmer V C (ed) Miner SocLondon 1ndash10
Forsyth J B Hedley E J amp Johnson C E (1968) The Magnetic Structure andHyperfine Field of Goethite (α-FeO(OH)) ndash J Phys C1 179ndash188
Frantz E Palme H Todt W El Goresy A amp Pavicevic M K (1994) Geo-chemistry of TlndashAs Minerals and Host Rocks at Allchar (Macedonia) ndash N JbMiner Abh 167 359
Grcev K (1964) Application of the Petrological Methods in Exploration for Can-coled Chromite Ore Bodies in the Ljuboten Peridotite Massif (Macedonia) ndashOECD Paris 99
Grcev K amp Milovanovic P (1962) The Development of the Upper Part of the Lju-boten Serpentive Massif ndash Proc V Geologic Conference of Yugoslavia Belgrade2 275
Hill R J Craig J R amp Gibbs G V (1979) Systematics of the Spinal StructureType ndash Phys Chem Miner 4 317ndash319
Ivanov T (1962) Nickel-Ferous Ore on the Ržanovo Deposit at the Kozuf Mountain-Macedonia ndash V Congress of the Geolologists of Yugoslavia Budva Proceedings2 249
ndash (1965) Metalogenesis on the South Part of the Vardar Zone PhD Thesis Facultyof Mining and Geology Belgrade pp 1ndash297
Jeršek M amp Mitric B (1999) Corundum from Prilep Dolomitic Marble (Macedo-nia) ndash Scopolia 41 1
Jovanovski G Stefov V Jovanovski B Soptrajanov B amp Boev B (1999 a)Minerals From Macedonia III Determination of Calcite and Aragonite in MineralMixtures Using FT IR Spectroscopy ndash Geologica Macedonica 13 69ndash74
Jovanovski G Stefov V Jovanovski B Soptrajanov B amp Kaitner B(1999 b) Minerals From Macedonia I Analytical Application of Powder X-RayDiffraction Patterns of Calcite and Aragonite ndash Proc on the 16th Congr of Chem-ists and Technologists of Macedonia Skopje 1 43ndash46
Jovanovski G Stefov V Soptrajanov B amp Boev B (2002 a) Minerals FromMacedonia IV Discrimination Between Some Carbonate Minerals by FT IRSpectroscopy ndash N Jb Miner Abh 177 241ndash253
Jovanovski G Minceva-Sukarova B Makreski P Soptrajanov B GriffithW P amp Willis R L (2002 b) Minerals From Macedonia VII Raman Spectra of
242 P Makreski et al
Sulfide Minerals from the Allchar Deposite (Stibnite Realgar Orpiment and Lo-randite) ndash Proc on the Eighteen International Conference on Raman Spectro-scopy Budapest 931ndash932
Jovanovski G Minceva-Sukarova B Makreski P Stefov V Griffith W Pamp Willis R L (2002 c) Minerals From Macedonia VIII Raman Spectra ofSome Sulfide Minerals From Localities in Eastern Macedonia ndash Proc on theEighteen Internat Conference on Raman Spectroscopy Budapest 933ndash934
Lutz H D amp Haeuseler H (1998) Infrared and Raman Spectra of Inorganic So-lids ndash State of the Art ndash Trends Appl Spectrosc 2 59ndash88
Luxon J T amp Summitt R (1969) Interpretation of the Infrared Absorption Spectraof Stannic Oxide and Titanium Dioxide (Rutile) Powders ndash J Chem Phys 501366ndash1370
Makreski P amp Jovanovski G (2003) Minerals From Macedonia IX DistinctionBetween Some Rhombohedral Carbonates by FT IR Spectroscopy ndash Bull ChemTechnol Macedonia 22 25ndash32
Makreski P Jovanovski G Stefov V Minceva-Sukarova B Kaitner B ampBoev B (2001ndash2002) Minerals From Macedonia VI Separation and Identifica-tion of Some Sulfide Minerals ndash Geologica Macedonica 15ndash16 43ndash50
Makreski P Zajkova-Panova V Jovanovski G Stafilov T amp ZendelovskaD (2002) AAS and AES-ICP Determination of Trace Elements in Some IronMinerals ndash Proc of 3rd Aegean Analytical Chemistry Days Lesvos 440ndash443
Makreski P Jovanovski G Minceva-Sukarova B Soptrajanov B GreenA Engelen B amp Grzetic I (2004) Vibrational Spectra of MI
3MIIIS3 TypeSynthetic Minerals (MI = Tl or Ag and MIII = As or Sb) ndash Vib Spectrosc (in press)
McDevitt N T amp Baun W L (1964) Infrared Absorption Study of Metal Oxides inthe Low Frequency Region (700ndash240 cmndash1) ndash Spectrochim Acta 20 799ndash808
McMillan P F amp Hofmeister A M (1988) Infrared and Raman Spectroscopy ndashIn Hawthorne F C (ed) Spectroscopic Methods in Mineralogy and Geology ndashRev Miner 18 99ndash157
Minceva-Sukarova B Jovanovski G Makreski P Soptrajanov B GriffithW P amp Grzetic I (2003) Vibrational Spectra of MIMIIIS2 Synthetic Minerals(MI = Tl or Ag MIII = As or Sb) ndash J Mol Struct 651ndash653 181ndash189
Newnham R E amp Megaw H D (1960) Refinement of the alpha-Al2O3 Ti2O3V2O3 and Cr2O3 Structures ndash Z Krist 117 235ndash237
Nesse W D (2000) Introduction to Mineralogy ndash New York Oxford University PressNicodom (1998) Inorganic Library of FT IR Spectra ndash MineralsOcana M amp Serna C J (1991) Variations of the Infrared Powder Spectra of Tita-
nium Dioxide and Tin Dioxide (Rutile) with Polarization ndash Spectrochim Acta47A 765ndash774
Oles A Szytula A amp Wanic A (1970) Neutron Diffraction Study of γ-FeOOH ndashPhys Stat Sol 41 173ndash177
Plyusnina I I (1977) Infrakrasnye Spektry Mineralov Moskva ndash MoskovskogoUniversiteta
Preudhomme J amp Tarte P (1971) Infrared Spectra of Spinels I A Critical Discus-sion of the Actual Interpretation ndash Spectrochim Acta 27A 961ndash968
Minerals from Macedonia 243
Ryskin Ya I (1974) The Infrared Spectra of Minerals ndash In Farmer V C (ed) Mi-ner Soc London 137ndash181
Sato K Sudo T Kurosawa F amp Kammori O (1969) Effect of Crystallization onthe Infrared Spectra of α- and γ-ferric Oxyhydroxides ndash Nippon Kink Gakk 331371ndash1376
Schwarzmann E amp Sparr H (1969) Hydrogen Bridge Bonds in Hydroxides withDiaspore Structures ndash Z Naturf 24B 8ndash11
Serafimovski T (1990) Metalogenesis of the Lece-Halkidik ndash PhD Thesis Facultyof Mining and Geology Štip pp 1ndash391
Serna C J Rendon J L amp Iglesias J E (1982) Infrared Surface Modes in Co-rundum-Type Microcrystalline Oxides ndash Spectrochim Acta 38 A 797ndash802
Shintani H Sato S amp Saito Y (1975) Electron-density Distribution in RutileCrystals ndash Acta Cryst B 31 1981ndash1982
Stefov V Dimitrovska S Jovanovski G amp Soptrajanov B (1999) MineralsFrom Macedonia II Vibrational Spectra of Some Sulfate Minerals ndash Proc on the16th Congress of Chemists and Technologists of Macedonia Skopje 1 47ndash50
Stefov V Jovanovski G Soptrajanov B Minceva-Sukarova B Dimit-rovska S amp Boev B (2000) Minerals From Macedonia V Characterization ofGypsum Barite and Their Synthetic Analogues by FT IR and Raman Spectro-scopy ndash Geologica Macedonica 14 61ndash66
Stojanovic M (1969) Geological Construction of the Area of the Bukovik Mountain(Pehcevo) with Special Retrospection of the Geological-Mineralogical and Ge-netic Characteristics of the Limonite Breccias Deposit ndash Geološki Zavod SkopjeMacedonia Spec Iss No14 103
Szytuta A Burewitz A Dimitrijevic Z Krasnicki S Rzany H Todoro-vic J Wanic A amp Wolski W (1968) Neutron Diffraction Study of α-FeOOHndash Phys Stat Sol 26 429ndash434
Taylor D G Nenadic C M amp Crable J V (1970) Infrared Spectra for MineralIdentification ndash Amer Ind Hyg Ass J 31 100ndash108
White W B amp Roy R (1964) Infrared Spectra ndash Crystal Structure CorrelationsComparison of Simple Polymorphic Minerals ndash Am Miner 49 1670ndash1687
Zhukhlistov A P (2001) Crystal Structure of Lepidocrocite FeO(OH) from theElectron-Diffractometry Data ndash Crystallogr Rep 46 730ndash733
Received March 25 2003 accepted February 4 2004
Authorsrsquo addressesPetre Makreski Gligor Jovanovski Trajce Stafilov Dejan Cibrev Instituteof Chemistry Faculty of Science Sts Cyril and Methodius University P O Box 162MK-1001 Skopje Republic of Macedonia
Branko Kaitner Laboratory of General and Inorganic Chemistry HR-10000Zagreb Ul kralja Zvonimira 8 Croatia
Blazo Boev Faculty of Mining and Geology Sts Cyril and Methodius UniversityGoce Delcev 89 MK-2000 Štip Republic of Macedonia
Corresponding author e-mail petremakiunonapmfukimedumk
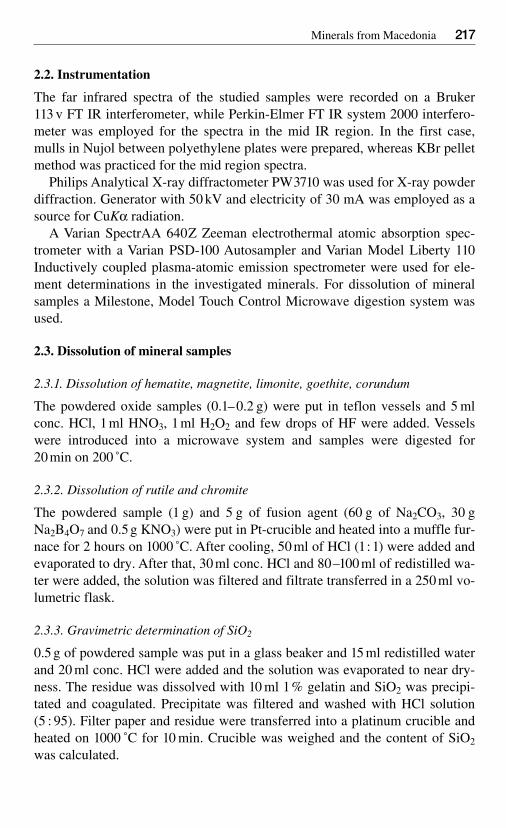
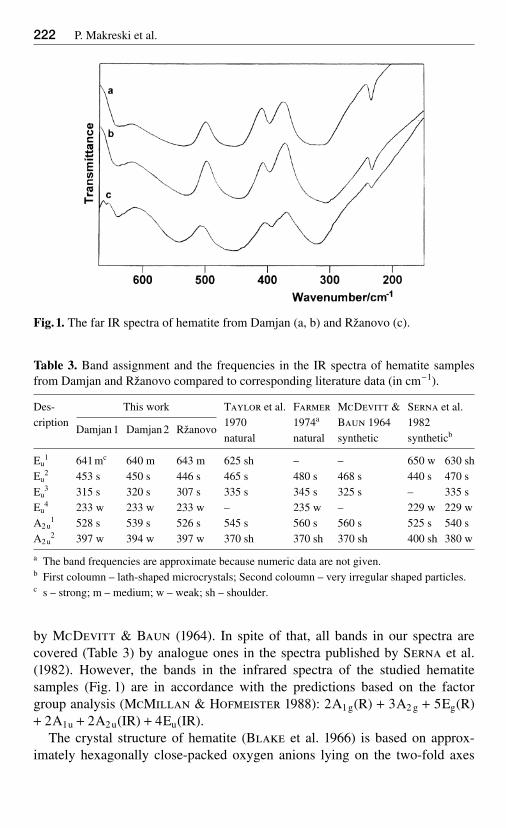
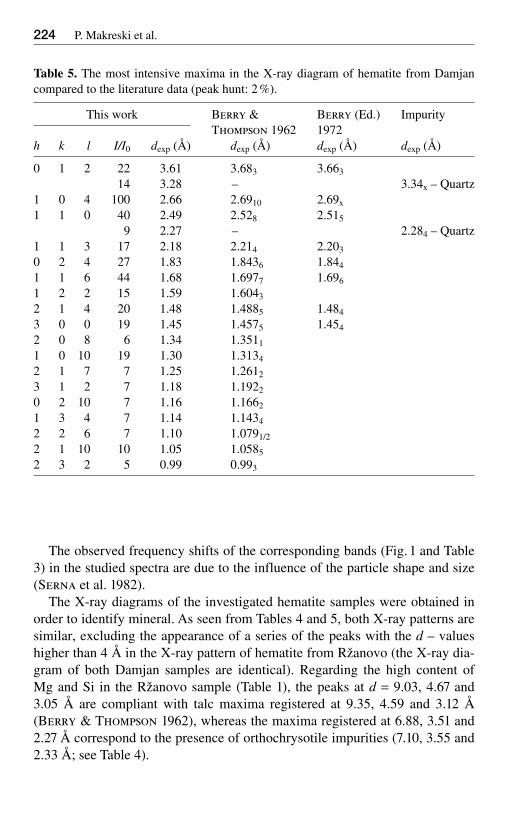
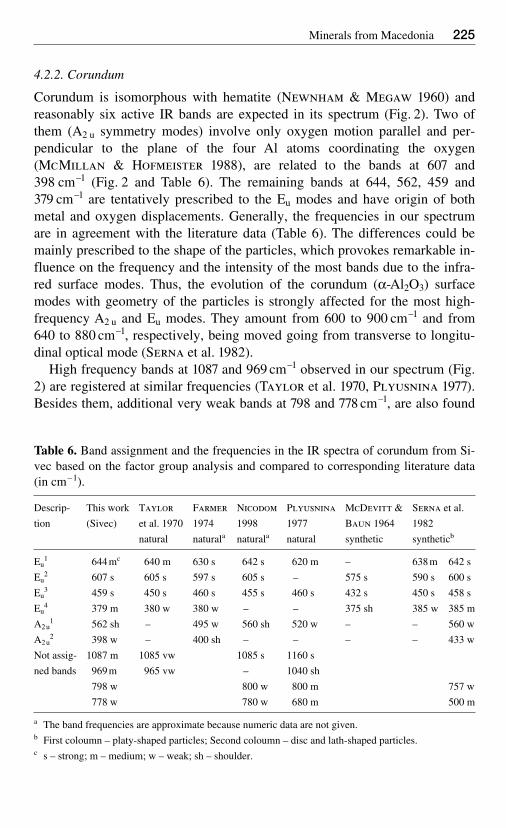
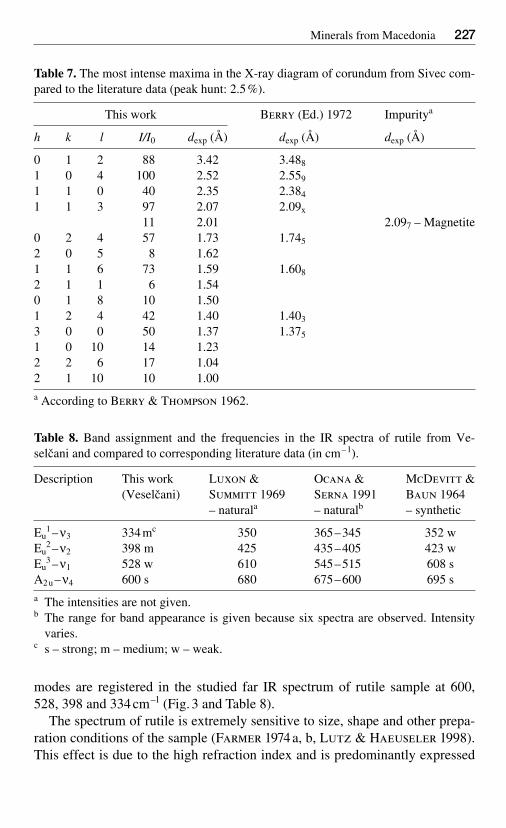
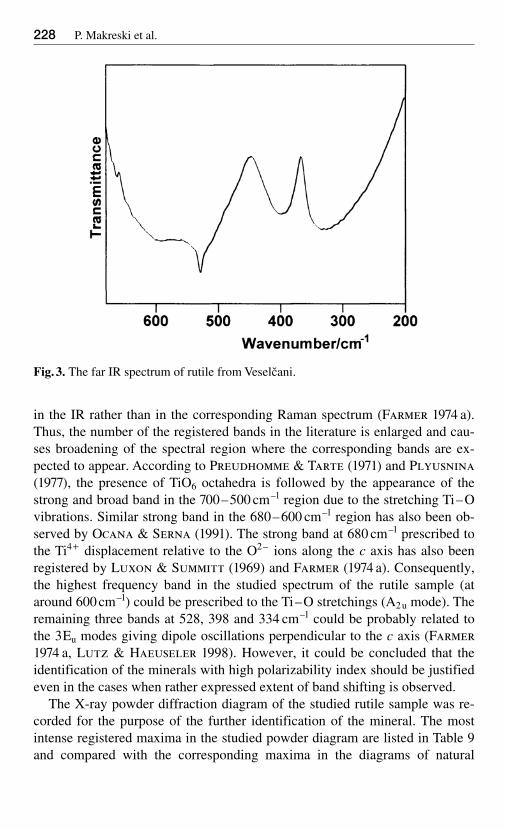
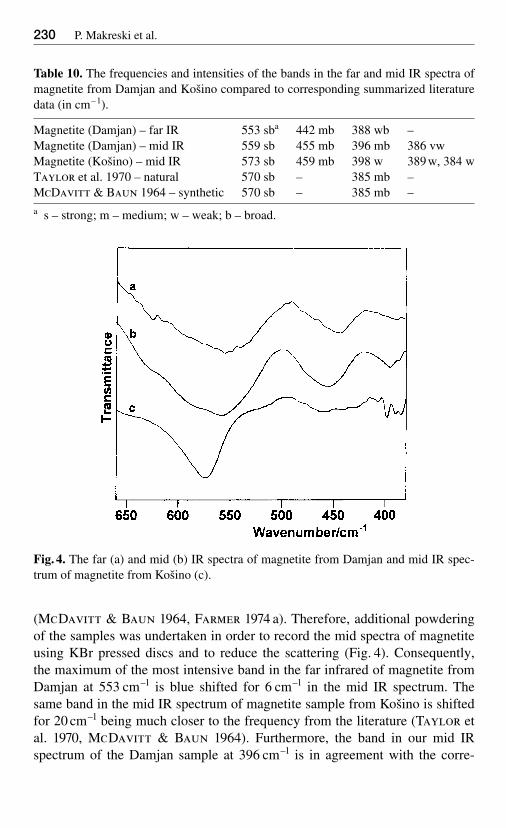
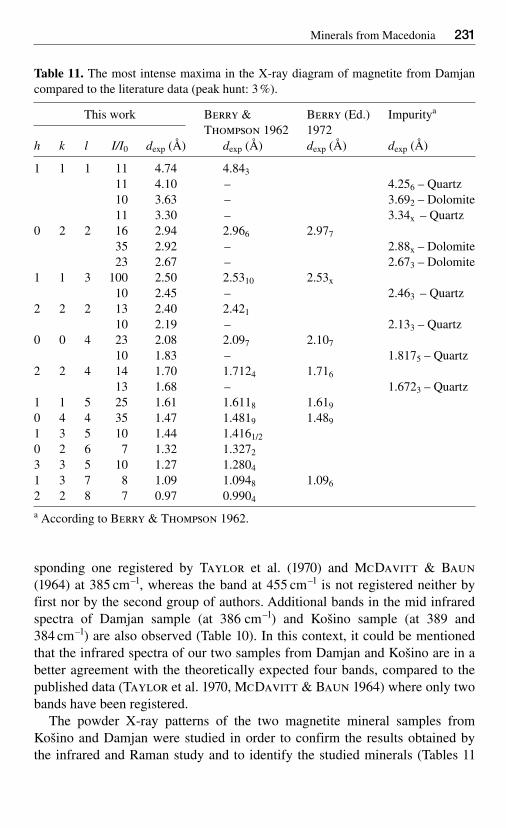
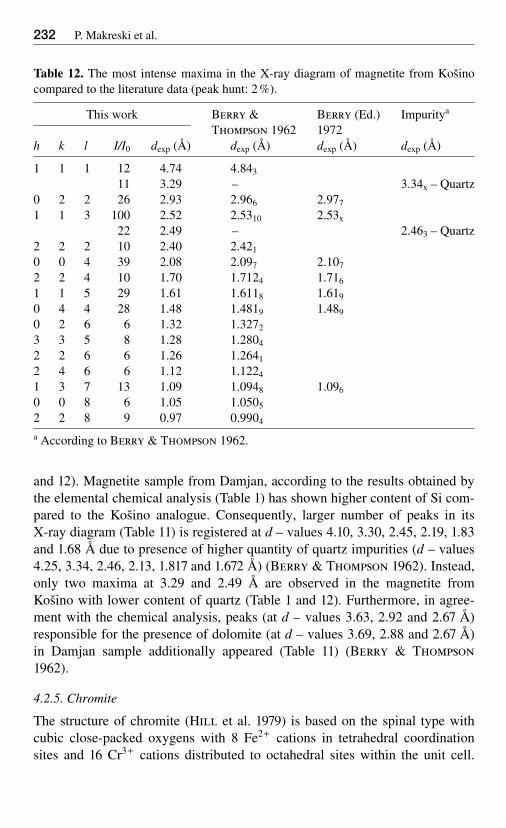
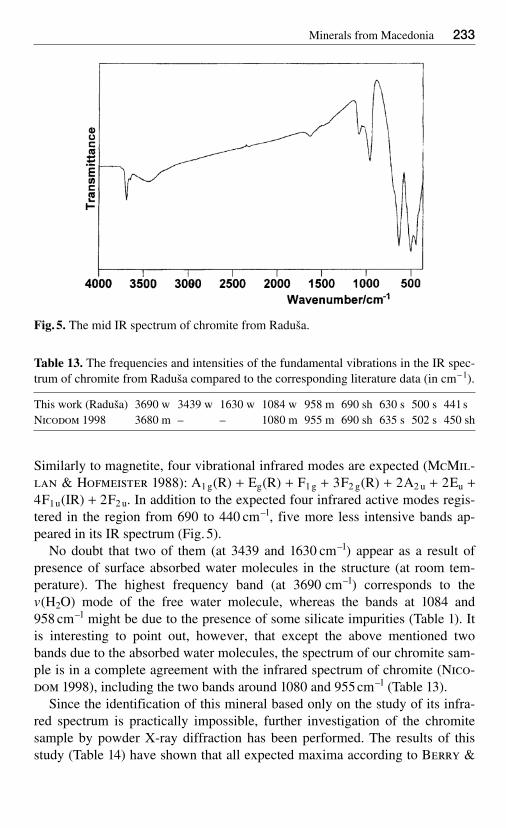
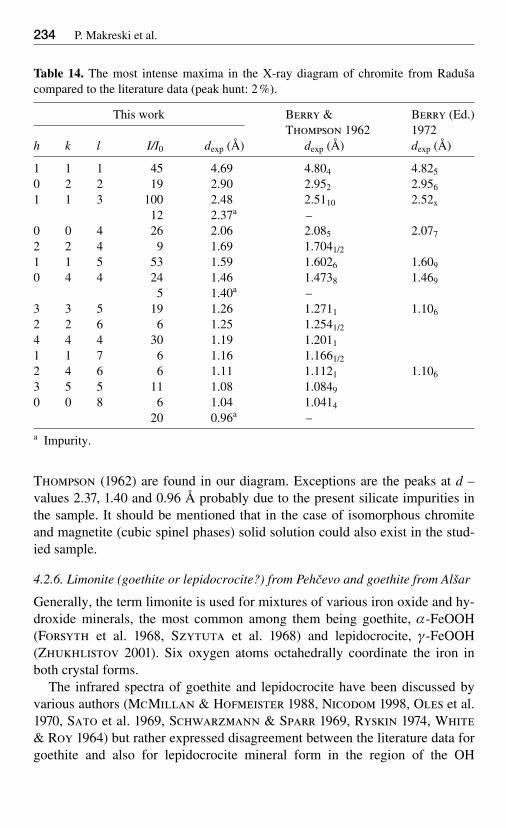
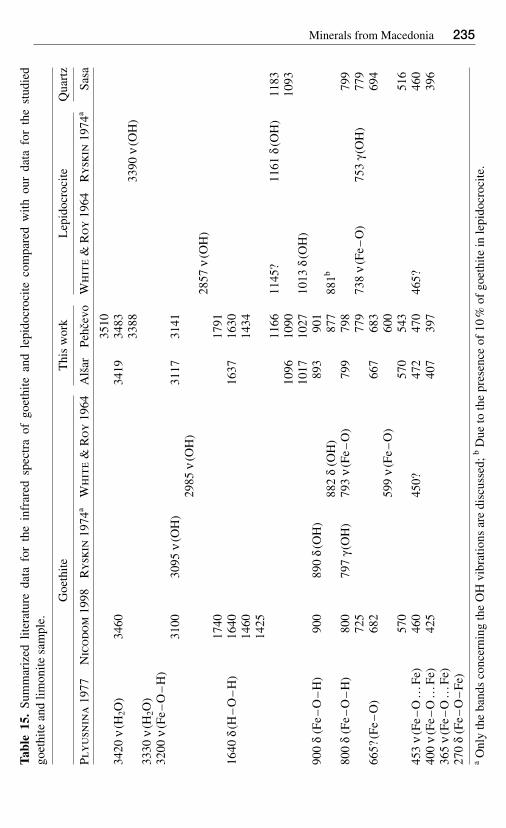
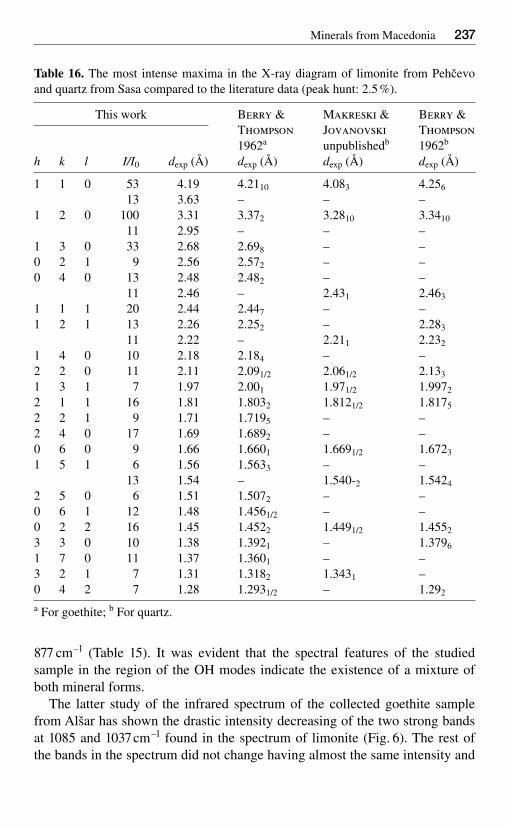
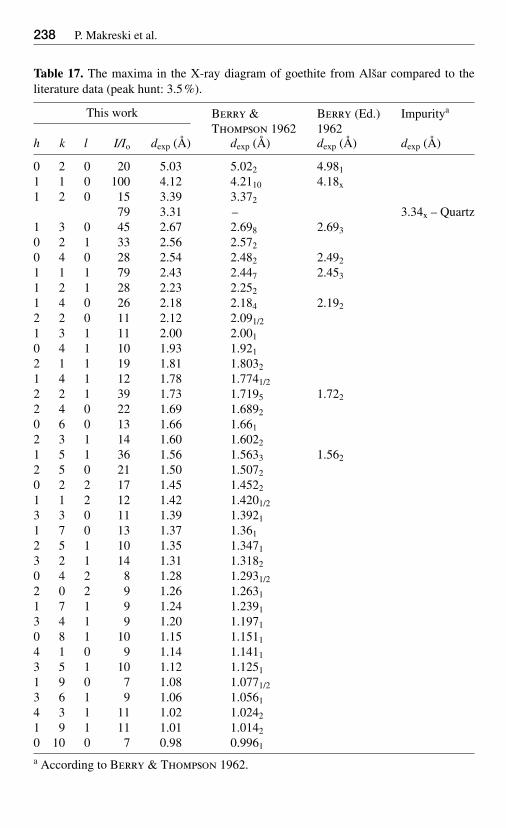