Mineral Mapping for Exploration: An Australian Journey of ...
48
geosciences Review Mineral Mapping for Exploration: An Australian Journey of Evolving Spectral Sensing Technologies and Industry Collaboration Thomas Cudahy Commonwealth Scientific and Industrial Research Organisation (CSIRO) Mineral Resources, 26 Dick Perry Avenue, Kensington, WA 6014, Australia; [email protected]; Tel.: +61-407-662-369 Academic Editors: Kevin Tansey, Stephen Grebby and Jesus Martinez-Frias Received: 10 October 2016; Accepted: 16 November 2016; Published: 29 November 2016 Abstract: This paper describes selected results from over a dozen collaborative projects led by Commonwealth Scientific and Industrial Research Organisation (CSIRO) in Australia spanning a 30-year history of developments in satellite, airborne, field and drill core sensing technologies and how these can assist explorers to measure and map valuable mineral information. The exploration case histories are largely from Australian test sites and describe how spectral sensing technologies have progressed from early “niche creation” systems, such as the field PIMA-II (Portable Field Mineral Analyzer) and airborne Geoscan, HyMap™ and OARS-TIPS (Operational Airborne Remote Sensing – Thermal Infrared Profiling Spectrometer) systems and drill-core HyLogger™ systems, to the current expanding array of pubic and commercial mineral mapping sensors, including the ASTER (Advanced Spaceborne Thermal Emission and Reflectance Radiometer) satellite system which has acquired imagery spanning the entire Earth’s land surface (<83 ◦ latitude). These sensors are delivering voluminous spectral data from different parts of the visible to the thermal infrared (400 to 14,000 nm) spectrum at different spectral, radiometric and spatial resolutions. Two critical exploration challenges are central to the case histories, namely: (i) can surface cover, such as vegetation, regolith or transported materials, be characterized and accounted for so that the target geology is accurately revealed; and (ii) does this revealed geology show evidence of alteration footprints to potential economic mineralization. Spectrally measurable minerals important to solving these challenges include white micas, kaolinite and garnets, with measurement of their respective physicochemistries being key. For example, kaolin disorder is useful for mapping transported versus weathered in situ materials, while the chemical substitution in white micas and garnets provide vectors to potential economic mineralization. Importantly, appropriate selection of the optimum sensor/data type for a given geological application depends primarily on the level of detail/accuracy of the mineral information required by the user. A major opportunity is to now harness the many sensor/data types and deliver to users consistent, accurate mineral information products, that is, creation of a number of valuable global mineral product standards. As part of this vision, CSIRO has been developing improved sensor/data calibration processes and information extraction methods that for example, unmix the target mineralogy from green and dry vegetation cover in remote sensing data sets. Emphasis to date has been on generating public spectral-mineral product standards, especially at ASTER’s limited but geologically-valuable spectral resolution. The results are showing that scalable, global, three-dimensional (3D) mineral maps are achievable which will only improve our ability to more accurately characterize regolith and geological architecture, increase our understanding of formative processes and assist the discovery of new economic mineral systems. Keywords: mineral mapping; exploration; alteration mineralogy; mineral system; multi-spectral; hyperspectral; remote sensing; geology; satellite; airborne; drill-core Geosciences 2016, 6, 52; doi:10.3390/geosciences6040052 www.mdpi.com/journal/geosciences
-
Upload
khangminh22 -
Category
Documents
-
view
2 -
download
0
Transcript of Mineral Mapping for Exploration: An Australian Journey of ...
geosciences
Review
Mineral Mapping for Exploration: An AustralianJourney of Evolving Spectral Sensing Technologiesand Industry Collaboration
Thomas Cudahy
Commonwealth Scientific and Industrial Research Organisation (CSIRO) Mineral Resources,26 Dick Perry Avenue, Kensington, WA 6014, Australia; [email protected]; Tel.: +61-407-662-369
Academic Editors: Kevin Tansey, Stephen Grebby and Jesus Martinez-FriasReceived: 10 October 2016; Accepted: 16 November 2016; Published: 29 November 2016
Abstract: This paper describes selected results from over a dozen collaborative projects led byCommonwealth Scientific and Industrial Research Organisation (CSIRO) in Australia spanninga 30-year history of developments in satellite, airborne, field and drill core sensing technologies andhow these can assist explorers to measure and map valuable mineral information. The explorationcase histories are largely from Australian test sites and describe how spectral sensing technologieshave progressed from early “niche creation” systems, such as the field PIMA-II (Portable FieldMineral Analyzer) and airborne Geoscan, HyMap™ and OARS-TIPS (Operational Airborne RemoteSensing – Thermal Infrared Profiling Spectrometer) systems and drill-core HyLogger™ systems,to the current expanding array of pubic and commercial mineral mapping sensors, including theASTER (Advanced Spaceborne Thermal Emission and Reflectance Radiometer) satellite system whichhas acquired imagery spanning the entire Earth’s land surface (<83◦ latitude). These sensors aredelivering voluminous spectral data from different parts of the visible to the thermal infrared (400 to14,000 nm) spectrum at different spectral, radiometric and spatial resolutions. Two critical explorationchallenges are central to the case histories, namely: (i) can surface cover, such as vegetation, regolithor transported materials, be characterized and accounted for so that the target geology is accuratelyrevealed; and (ii) does this revealed geology show evidence of alteration footprints to potentialeconomic mineralization. Spectrally measurable minerals important to solving these challengesinclude white micas, kaolinite and garnets, with measurement of their respective physicochemistriesbeing key. For example, kaolin disorder is useful for mapping transported versus weathered in situmaterials, while the chemical substitution in white micas and garnets provide vectors to potentialeconomic mineralization. Importantly, appropriate selection of the optimum sensor/data type fora given geological application depends primarily on the level of detail/accuracy of the mineralinformation required by the user. A major opportunity is to now harness the many sensor/datatypes and deliver to users consistent, accurate mineral information products, that is, creation ofa number of valuable global mineral product standards. As part of this vision, CSIRO has beendeveloping improved sensor/data calibration processes and information extraction methods that forexample, unmix the target mineralogy from green and dry vegetation cover in remote sensing datasets. Emphasis to date has been on generating public spectral-mineral product standards, especially atASTER’s limited but geologically-valuable spectral resolution. The results are showing that scalable,global, three-dimensional (3D) mineral maps are achievable which will only improve our abilityto more accurately characterize regolith and geological architecture, increase our understanding offormative processes and assist the discovery of new economic mineral systems.
Keywords: mineral mapping; exploration; alteration mineralogy; mineral system; multi-spectral;hyperspectral; remote sensing; geology; satellite; airborne; drill-core
Geosciences 2016, 6, 52; doi:10.3390/geosciences6040052 www.mdpi.com/journal/geosciences
Geosciences 2016, 6, 52 2 of 48
1. Introduction
Minerals are fundamental to the architecture of Earth and its formative geologic processes,including the development of economic resources. Sustainable exploration for these mineral resourcesis increasingly reliant on new technologies, including sensors operating from satellites, aircraft/drones,field-based and drill-core logging systems that measure reflectance and/or emission spectra acrossthe electromagnetic spectrum between 400 and 12,000 nm (0.4 and 12 µm). This spectral informationis sourced from only the top 1 to 100 µm of a given target’s surface [1] and requires either a suitablesource of light (e.g., the Sun) or given sample’s kinetic temperature to generate a spectrum thatcontains a myriad of spectral features that pertain to its composition. The related opportunity of valueto the resources community is often called “mineral mapping” [2]. Mineral mapping technologieshave potential significant value for explorers because: (i) it is physics-based, i.e., measurable andreproducible; (ii) it is easily validated through independent, quantitative measurements; (iii) it canprovide spatially comprehensive, scalable coverage/data; (iv) it is a non-contact and non-destructivemeasurement; and (v) many process-diagnostic alteration and weathering minerals have specificspectral signatures.
The spectroscopy of minerals is based on decades of published research [3–20], whichhave highlighted those wavelength regions where specific minerals and mineral groups possessdiagnostic features, including: (i) the Visible and Near-InfraRed (VNIR, 400 to 1000 nm)—transitionelement-bearing oxides/oxydroxides (e.g., hematite and goethite) and minerals with rare earth elements(e.g., apatite and perovskite); (ii) the ShortWave InfraRed (SWIR, 1000 to 2500 nm)—hydroxyl-bearingdioctahedral silicates (e.g., kaolin, montmorillonite, muscovite, pyrophyllite) and trioctahedral silicates(e.g., talc, chlorite, actinolite–tremolite), carbonates (e.g., calcite, dolomite, magnesite) and sulfates (e.g.,alunite, gypsum); and (ii) the Thermal-InfraRed (TIR, 7500 to 12,000 nm)—framework silicates such asquartz and feldspars (e.g., plagioclase Na–Ca series of albite to anorthite as well as alkali feldsparssuch as microcline, orthoclase), pyroxenes (e.g., clinopyroxenes such as diopside and orthopyroxenessuch as enstatite), garnets (e.g., Ca-poor Fe–Mn–Al chemical series almandine–spessartine-pyropeversus Ca-rich Fe–Al chemical series andradite-grossular), carbonates and silicates. Remote sensing ofthis diverse spectral-mineral information has been tackled by numerous workers [21–32].
The charter of the Commonwealth Industrial Research Organisation (CSIRO) is to conductscientific research to assist Australian industry and to further the interests of the Australian community.To that end, CSIRO became involved in mineral mapping research and development in the seventiesafter the launch of the Earth Resources Technology Satellite 1 (ERTS-1). It was evident that this newtechnology had the potential to assist resource exploration, especially across the vast, remote andoften environmentally/culturally sensitive Australian landscape. CSIRO established a strategy ofbuilding projects in collaboration with industry and government agencies, often through (supportedby) the Australian Minerals Industry Research Association (AMIRA) [33] or government bodiessuch as Minerals and Energy Research Industry of Western Australia (MERIWA, now MRIWA) [34]and the National Collaborative Research Infrastructure Strategy National (NCRIS) Auscope [35].This close association between CSIRO, industry and government has ensured that project outcomeswere designed to benefit sponsors though it also sometimes meant that non-sponsors were restrictedfrom gaining (timely) access to project results and that fewer journal papers were submitted for openpublication. This is in part the impetus for this paper, especially as the confidentiality periods of manyof these projects have since expired.
In addition to those sensors developed by CSIRO, the close connection between CSIRO andthe resources sector has often attracted sensor development organizations to provide early accessto their sensor data as well. The sensors/data covered in this paper reflect those worked on bythe author and include: airborne Geoscan Mk II; field PIMA; airborne MIRACO2LAS; airborneAMS (Airborne Multispectral Scanner); airborne OARS- TIPS; airborne HyMap™, airborne SEBASS(Spatially Enhanced Broadband Array Spectrograph System), satellite ASTER, satellite Hyperion,satellite Worldview-3 (WV-3), airborne TASI-600 (Thermal Airborne Spectrographic Imager) and drill
Geosciences 2016, 6, 52 3 of 48
core HyLogger™. These sensors span not just different platforms but also different wavelength regions,spectral-spatial-radiometric resolutions and calibration procedures.
CSIRO’s development/evaluation of these new sensors/data has often focused on twofundamental exploration challenges for the resource industry in Australia, namely: (i) can the nature ofthe regolith [36] and/or transported cover be characterized and mapped, i.e., does a given area/samplecomprise transported materials such that an explorer must drill before sampling or does it comprise insitu materials such that an explorer can sample from the surface; and (ii) is there a mineral alterationfootprint present that can be used to vector towards “hidden” ore? Both of these questions are nowcentral to an Australian collaborative strategy between the public and private resources sector to tacklethe challenge of mineral exploration through “cover” [37].
This paper presents selected sensor/geological results from a series of CSIRO collaborative projectsextending from the late 1980s to the present, keeping within the theme of improving industry’s abilityto more accurately and efficiently “mineral map” the regolith and alteration footprints. The paperfinishes up with a perspective of the current status of mineral mapping technologies and futureopportunities and challenges.
2. Spectral Sensing for Mineral Exploration—A Journey
2.1. AMIRA P243—Remote Sensing for Gold in Western Australia Project
2.1.1. Background
The AMIRA P243 project began in the late 1980s during a gold exploration boom that coincidedwith the arrival of new sensors such as Landsat Thematic Mapper (TM) and SPOT (Systeme Probatoired’Observation de la Terre) imaging satellites. The main challenge recognized by sponsors andthe project team [38] was how these technologies could provide valuable information for goldexploration across deeply weathered environments such as the highly prospective (Au) ArchaeanYilgarn Craton [36]. To help answer this question, the project focused on available remote sensing datasets, including NASA’s airborne NS001 (Landsat TM simulator) and Thermal Infrared Multi-spectralScanner (TIMS) as well as Landsat TM and SPOT (Geoscan was evaluated as part of the AMIRA P382Project—see Section 2.2). The project also built spectral libraries of weathered samples from mineralizedand background environments, with many of these samples being characterized for their geochemistryand mineralogy using other analytical methods. The reflectance spectra between 400 and 2500 nm weremeasured using a GER (Geophysical Environmental Research) IRIS Mark IV dual-beam spectrometer,which has a ~12 nm spectra resolution. Samples were measured approximately 60 cm from the IRIS’soptical head with a 1000 W quartz halogen light (1.5 m distance from sample/reference) providing theillumination. The reference panel was made from compacted polytetrafluoroethylene powder.
2.1.2. Spectral-Mineral Regolith Characterization
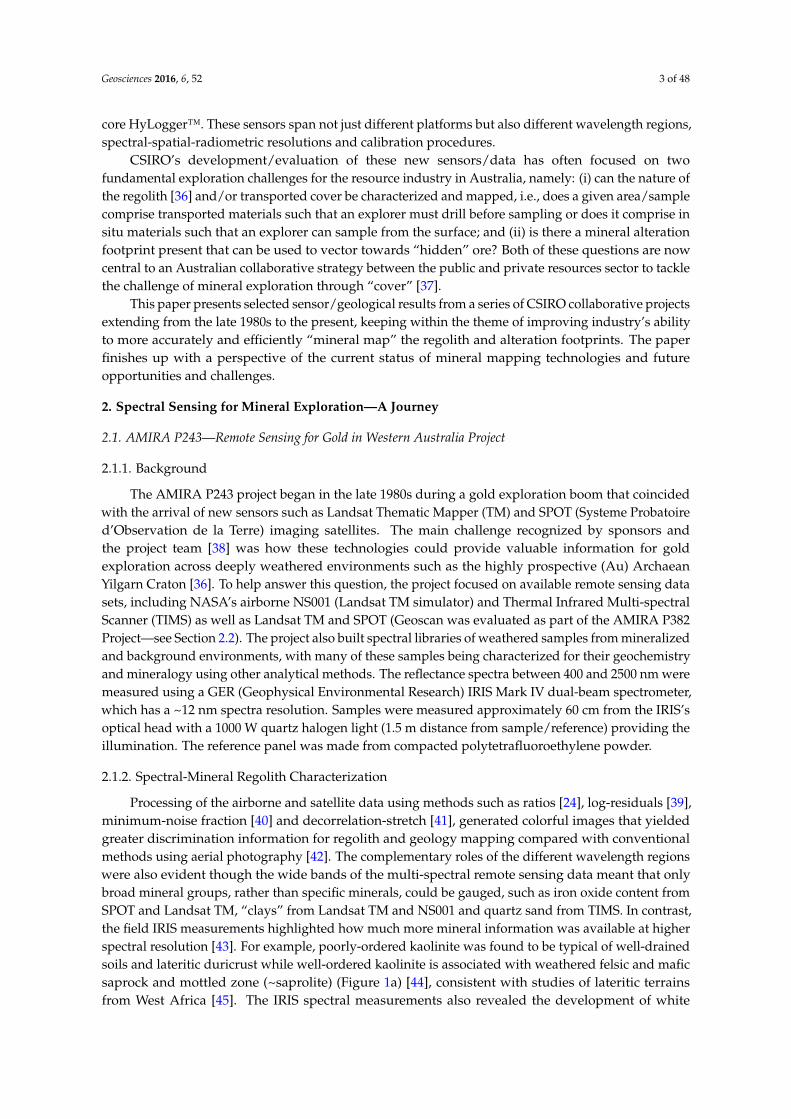
Processing of the airborne and satellite data using methods such as ratios [24], log-residuals [39],minimum-noise fraction [40] and decorrelation-stretch [41], generated colorful images that yieldedgreater discrimination information for regolith and geology mapping compared with conventionalmethods using aerial photography [42]. The complementary roles of the different wavelength regionswere also evident though the wide bands of the multi-spectral remote sensing data meant that onlybroad mineral groups, rather than specific minerals, could be gauged, such as iron oxide content fromSPOT and Landsat TM, “clays” from Landsat TM and NS001 and quartz sand from TIMS. In contrast,the field IRIS measurements highlighted how much more mineral information was available at higherspectral resolution [43]. For example, poorly-ordered kaolinite was found to be typical of well-drainedsoils and lateritic duricrust while well-ordered kaolinite is associated with weathered felsic and maficsaprock and mottled zone (~saprolite) (Figure 1a) [44], consistent with studies of lateritic terrainsfrom West Africa [45]. The IRIS spectral measurements also revealed the development of white

Geosciences 2016, 6, 52 4 of 48
mica (e.g., muscovite) in saprock/saprolite over gold deposits (Figure 1a). White mica is a commonK-metasomatic alteration product in sub-amphibolite facies Archaean ultramafic, mafic and felsicrocks [46]. The persistence of white mica up through the lateritic weathering profile is related to itsrelative (e.g., compared with chlorite) resistance to weathering. Thus, spectral detection of white micain weathered ferromagnesian (mafic and ultramafic) rocks is a potential indicator/target for ArchaeanAu-related K metasomatism (“A” in Figure 1b). The challenge is separating this “alteration-related”white mica in weathered ferromagnesian rocks with “primary” white mica in alkali-rich felsic rocks,both of which can be mixed with kaolinite (“B” n Figure 1b), which also absorbs in the same wavelength2200 nm region.
Geosciences 2016, 6, 52 4 of 48
common K-metasomatic alteration product in sub-amphibolite facies Archaean ultramafic, mafic and felsic rocks [46]. The persistence of white mica up through the lateritic weathering profile is related to its relative (e.g., compared with chlorite) resistance to weathering. Thus, spectral detection of white mica in weathered ferromagnesian (mafic and ultramafic) rocks is a potential indicator/target for Archaean Au-related K metasomatism (“A” in Figure 1b). The challenge is separating this “alteration-related” white mica in weathered ferromagnesian rocks with “primary” white mica in alkali-rich felsic rocks, both of which can be mixed with kaolinite (“B” n Figure 1b), which also absorbs in the same wavelength 2200 nm region.
Figure 1. Schematic mineral-regolith models. (a) Cross section of a lateritic profile showing changes in a range of fresh rock and weathering minerals, including a zone of metasomatic alteration that persists from fresh rock through to the surface [44]; (b) Block diagram that includes different types of parent rock as well as erosional dissection through the lateritic profile. Areas of white mica in weathered mafic or ultramafic rocks (“A”) are spectral-sensing exploration targets [44]; (c) Dissected lateritic profile over different parent rock types showing diagnostic variations in kaolin physicochemistry [47].
Figure 1. Schematic mineral-regolith models. (a) Cross section of a lateritic profile showing changes ina range of fresh rock and weathering minerals, including a zone of metasomatic alteration that persistsfrom fresh rock through to the surface [44]; (b) Block diagram that includes different types of parentrock as well as erosional dissection through the lateritic profile. Areas of white mica in weathered maficor ultramafic rocks (“A”) are spectral-sensing exploration targets [44]; (c) Dissected lateritic profile overdifferent parent rock types showing diagnostic variations in kaolin physicochemistry [47].
Geosciences 2016, 6, 52 5 of 48
2.1.3. Post P243 Developments
The complexity of kaolin types and their association with different weathered rock types was notapparent during the P243 project because of the limited SWIR-2 (2000 to 2500 nm) spectral resolutionof the IRIS field spectrometer (~12 nm). By 1992 a new field spectrometer developed by CSIRO,called the PIMA-II (Portable Infrared Mineral Analyzer), was in the process of being commercializedby Integrated Spectronics Pty. Ltd. (ISPL). The PIMA-II has a SWIR-2 spectral resolution of ~4 nmenabling the recognition and measurement of: (i) three outer hydroxyl kaolin absorption bands at2160, 2175 and 2185 nm, which are of variable intensity depending on the kaolin mineral type and itsdisorder (crystallinity) [47]; (ii) the kaolin group’s inner hydroxyl absorption band at 2205 nm havinga constant 18 nm width (full width at half height or FWHH); and (iii) a variable, weaker absorption at~2240 nm (~20 nm FWHH) related to the degree of Fe (and/or Mg) substitution in the kaolin lattice(up to 3%) [48,49].
Importantly, the intensity of the kaolin 2240 nm feature, when linked with a well-developedkaolinite absorption at 2205 nm, can be used as a gauge for parent rock composition [47]. For example,weathered ferromagnesian (intermediate, mafic and ultramafic) rocks have high levels of Fe and/orMg substitution in kaolin (i.e., detectable 2240 nm feature) whereas weathered felsic materials arerelatively poor (i.e., little/no development of the 2240 nm feature) (Figure 1c).
Mixing of white mica with kaolinite in weathered rocks can be spectrally gauged throughbroadening of the 2200 nm absorption FWHH [47]. This is because white mica has an average2200 nm FWHH of ~30 nm such that broadening of the 2205 nm FWHH beyond that expected ofkaolin’s >18 nm can be explained by a mixing with white mica [47].
Recognition of a combined 2240 nm Fe-kaolin feature with broadening of the kaolin 2205 nminner hydroxyl absorption (as well as a 2160 nm feature) represents potential K-metasomatizm ofdeeply weathered ferromagnesian rocks and thus an exploration target (Figure 1a,b). Similarly,spectral detection of white mica, together with other primary (or alteration) minerals diagnostic offerromagnesian rocks (e.g., amphibole, chlorite, talc), is another exploration opportunity (Figure 1a).
Finally, poorly-ordered kaolin is typically developed over weathered ultramafic rocks andtransported materials (Figure 1c) [47,50]. That is, spectral measurement of kaolin disorder can be usedto assist mapping transported versus weathered in situ materials, which was a major focus for theKalgoorlie and Rocklea Inlier projects (see Sections 2.9 and 2.12.2, respectively).
2.2. AMIRA P382 Project—Mineral Mapping with Spectrally Processed Geoscan Mk II Scanner Data
2.2.1. Background
During the 1980s, CSIRO and Carr Boyd Minerals Limited recognized that multi-spectralsensors such as Landsat TM were essentially being designed to map green vegetation and notmineral information required by explorers. To address this problem, the airborne Geoscan systemswere developed with the Geoscan Mk II comprising 24 spectral bands across the VNIR–SWIR–TIR.Geoscan represented the first commercial remote sensing system designed specifically for resourceexploration [51,52]. By 1990, Geoscan was operating worldwide with success, including the discoveryof the Hadleigh Castle gold deposit in Queensland. Some parts of the exploration industry thoughwere keen to receive an independent assessment of this system which led to the establishment of theAMIRA P382 project in 1991. The P382 project focused on two geological test sites, namely CoppinGorge in Western Australia and Olary in South Australia [53].
The project’s final report emphasized the need for improved calibration measures if reliablemineral information is to be routinely generated, especially: (i) 12-bit quantization of the data to negatethe need for operator adjustments of the data’s dynamic range during acquisition); (ii) blackbodycalibration of the TIR module; (iii) routine wavelength calibration; (iv) routine collection of a darkcurrent imagery; and if possible (v) isolate and remove the different forms of systematic instrumentnoise apparent in all modules [54]. Without these in place, the project team was required to implement
Geosciences 2016, 6, 52 6 of 48
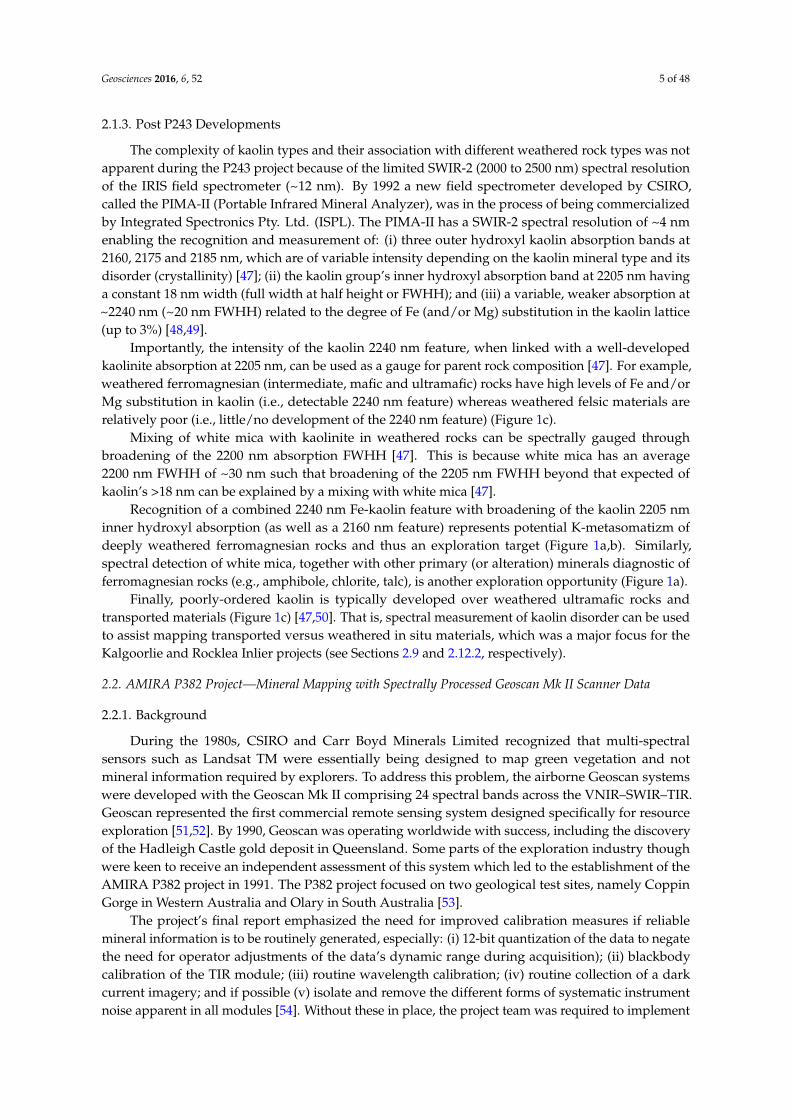
a series of noise removal and calibration processes before applying a variation of Log Residuals [39],called here KWIK residuals, to generate apparent reflectance VNIR–SWIR imagery. KWIK residuals isa method based on normalization with respect to pixel and band means and requires a sensible choiceof region-of-interest (ROI) for estimating a likely scene estimate for a “flat” spectrum, which in thisstudy was the whole Geoscan image to avoid a single material dominating the shape of all KWIKresidual spectra. A comparable calibration process was not available for the TIR module such thata decorrelation-stretch method [41] was applied to the noise-cleaned data to enhance spectral-emissivitycontrast, albeit with significant uncorrected kinetic temperature (as well as instrument effects)remaining, evident by topographic variations (Figure 2b).
Geosciences 2016, 6, 52 6 of 48
KWIK residuals is a method based on normalization with respect to pixel and band means and requires a sensible choice of region-of-interest (ROI) for estimating a likely scene estimate for a “flat” spectrum, which in this study was the whole Geoscan image to avoid a single material dominating the shape of all KWIK residual spectra. A comparable calibration process was not available for the TIR module such that a decorrelation-stretch method [41] was applied to the noise-cleaned data to enhance spectral-emissivity contrast, albeit with significant uncorrected kinetic temperature (as well as instrument effects) remaining, evident by topographic variations (Figure 2b).
2.2.2. Updating Geology-Regolith Maps
If the data are accurately reduced to reflectance, then a pixel-normalization method such as KWIK residuals will generate images that appear flat, lacking topographic (sun-illumination) information. The Olary results (Figure 2a) show this to be the case, especially when compared with the uncalibrated decorrelation-stretch TIR image (Figure 2b) confirming that the pre-processing was effective.
Figure 2. Airborne Geoscan Mk II results (~1992) for Olary, South Australia (scene center approximately −32.0981° latitude 140.3228° longitude). (a) KWIK residual RGB color composite of SWIR bands 14 (2180 nm): 15 (2224 nm): 18 (2358 nm); (b) Inverted de-correlation stretch RGB color composite of TIR bands 19 (8600 nm): 21 (9660 nm): 23 (10,710 nm); (c) Published 1:50,000 scale geology plus legend; (d) Selected Geoscan Mk II KWIK residual pixel-spectra from field sites A–H.
The KIWK residual color composite image of Geoscan bands 14, 15 and 18 (Figure 2a) shows that three areas of published Quaternary alluvium/colluvium (Figure 2c) have different spectral-mineral signatures, with area: X being yellow; Y being red; and Z being blue. From a mineral spectroscopy perspective, these three colors indicate that: area X is a tri-octahedral silicate mineral (relative absorption @ 2358 nm) such as epidote and/or amphibole; Y is white mica rich (relative absorption @ 2224 nm); and Z is kaolin rich (relative absorption @ 2180 and 2224 nm).
A selection of KIWK residual pixel-spectra (A to H in Figure 2a,b,d) show recognizable mineral signatures consistent with this spectral-mineral interpretation. For example, pixel spectra from red areas near Y (Figure 2a) of alluvium/colluvium and neighboring mapped granite and schist/quartzite (A, B and D respectively in Figure 2c,d) show relatively intense absorption at 2224 nm (band 15) and to a lesser degree at 2358 nm (band 18) consistent with white mica’s primary and secondary absorptions
Figure 2. Airborne Geoscan Mk II results (~1992) for Olary, South Australia (scene center approximately−32.0981◦ latitude 140.3228◦ longitude). (a) KWIK residual RGB color composite of SWIR bands 14(2180 nm): 15 (2224 nm): 18 (2358 nm); (b) Inverted de-correlation stretch RGB color composite of TIRbands 19 (8600 nm): 21 (9660 nm): 23 (10,710 nm); (c) Published 1:50,000 scale geology plus legend;(d) Selected Geoscan Mk II KWIK residual pixel-spectra from field sites A–H.
2.2.2. Updating Geology-Regolith Maps
If the data are accurately reduced to reflectance, then a pixel-normalization method such as KWIKresiduals will generate images that appear flat, lacking topographic (sun-illumination) information.The Olary results (Figure 2a) show this to be the case, especially when compared with the uncalibrateddecorrelation-stretch TIR image (Figure 2b) confirming that the pre-processing was effective.
The KIWK residual color composite image of Geoscan bands 14, 15 and 18 (Figure 2a) shows thatthree areas of published Quaternary alluvium/colluvium (Figure 2c) have different spectral-mineralsignatures, with area: X being yellow; Y being red; and Z being blue. From a mineral spectroscopyperspective, these three colors indicate that: area X is a tri-octahedral silicate mineral (relativeabsorption @ 2358 nm) such as epidote and/or amphibole; Y is white mica rich (relative absorption @2224 nm); and Z is kaolin rich (relative absorption @ 2180 and 2224 nm).
A selection of KIWK residual pixel-spectra (A to H in Figure 2a,b,d) show recognizable mineralsignatures consistent with this spectral-mineral interpretation. For example, pixel spectra from redareas near Y (Figure 2a) of alluvium/colluvium and neighboring mapped granite and schist/quartzite(A, B and D respectively in Figure 2c,d) show relatively intense absorption at 2224 nm (band 15) and to
Geosciences 2016, 6, 52 7 of 48
a lesser degree at 2358 nm (band 18) consistent with white mica’s primary and secondary absorptions at~2200 and 2350 nm, respectively. In contrast, pixel spectra from blue/cyan areas near Z (Figure 2a) overalluvium (Z) and schist/quartzite (C and J respectively, Figure 2c,d) show relatively weaker absorptionat 2224 and 2358 nm but stronger absorption at 2160 nm consistent with the presence of kaolin.
Even though the Geoscan KWIK residual pixel spectra do not show clear evidence ofa trioctahedral silicate absorption band in the 2300 to 2330 nm region (artefact either of the KWIKresidual method and/or a lack of a Geoscan spectral band >2354 nm) related to amphibole and/orepidote in the published geological mapping (e.g., quartz–albite–epidote–hornblende rock in Figure 2c),the yellow color in Figure 2a is consistent with this mineralogy. This “yellow” trioctahedralsilicate signature (Figure 2a) is well developed over mapped alluvium–colluvium at X (Figure 2a,c).Field investigation showed that this area comprised an extensive pediment of epidote rock float thatterminated mid-slope (white dotted line near H) indicating that the basement geology is close/atsurface. That is, the published map of the boundaries of alluvium/colluvium, as well as theprovenance of this alluvium/colluvium can be updated using the remotely sensed mineral information.Furthermore, recognition of epidote and white mica cross-cutting stratigraphy and persisting throughtransported materials are potentially important alteration indicators for explorers.
2.2.3. Project Postscript
Geoscan’s multi-spectral bands enabled mapping of “broad” mineral information, such as kaolinversus muscovite versus epidote/amphibole—information that is not available from Landsat TM.However, measuring and mapping more specific mineral information requires many more spectralbands that are well calibrated and with high signal-to-noise (SNR) (see “hyperspectral” systems suchas HyMap™ in Section 2.9). Nevertheless, the integrated VNIR–SWIR–TIR design of Geoscan isa powerful one for explorers as it delivers a wide range of mineral group information, including:(i) propylitic (minerals such as chlorite, amphibole, epidote which have absorption ~2300 nm region);(ii) phyllic (white mica with relatively symmetric absorption~2200 nm); (iii) advanced argillic (kaolinite,dickite, alunite and pyrophyllite with absorption ~2165 nm); (iv) silicic (quartz/chalcedony withfeatures at 8625 nm); (v) skarn (garnet with features in the 10,800 nm region); (vi) carbonate (calcite,dolomite with features at 11,200 nm and 2300 nm regions); (vii) iron oxides and/or gossans (hematite,goethite and related hydrated forms with features in 550–1500 nm region); and (viii) iron oxidationstate (ferric versus ferrous silicates (actinolite, chlorite) and carbonates (ankerite, siderite) withbroad absorption in the 1000–1600 nm region. A similar multi-spectral, integrated VNIR–SWIR–TIRconfiguration to that of Geoscan was later used for the satellite ASTER system [55], which has sincebecome the standard remote sensing tool for the resources industry.
2.3. MIRACO2LAS Project—Airborne, Active Hyperspectral TIR Profiling
2.3.1. Background
CSIRO’s airborne MIRACO2LAS project began in the mid-1980s and was unusual because itwas strategically funded by CSIRO with no industry support until the first geological trials in 1992.The original aim of the project was to establish whether an airborne active CO2 laser, rapidly scanningacross ~100 wavelengths between 9200 and 11,200 nm (i.e., within the TIR) in line-profile mode (i.e.,not imaging) and from a flying height of ~400 m, could provide sufficient SNR to deliver measurablesilicate mineral (e.g., quartz, feldspar, garnet, pyroxene) spectral signatures. At that time, it wasa challenge to achieve sufficient SNR from a remote, passive, hyperspectral TIR system, combinedwith the inherent problem of down-welling radiance which dampens mineral emissivity features assky temperature approaches the land surface temperature. An active system negates these effects.
The design and operation of MIRACO2LAS is described by [56] while MIRACO2LAS datavalidation, reduction methodology and geological results are provided by [57]. The first geological trailsof the MIRACO2LAS system were in collaboration with the Japanese government agency ERSDAC
Geosciences 2016, 6, 52 8 of 48
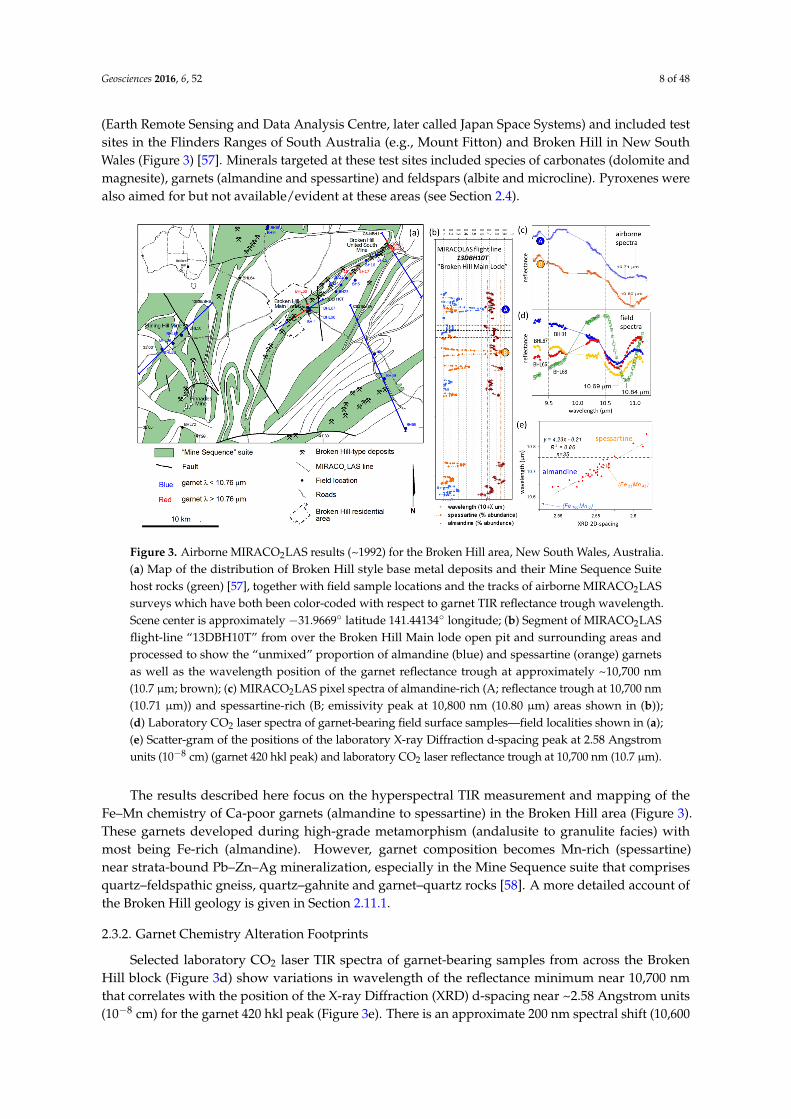
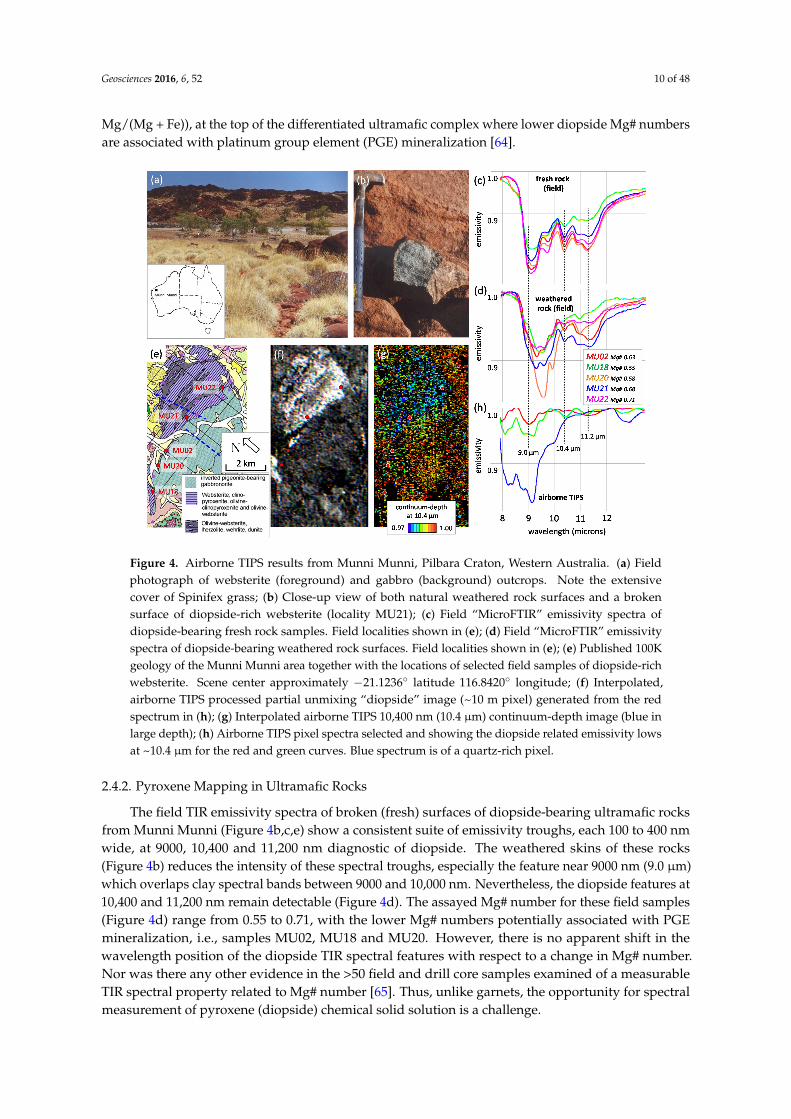
(Earth Remote Sensing and Data Analysis Centre, later called Japan Space Systems) and included testsites in the Flinders Ranges of South Australia (e.g., Mount Fitton) and Broken Hill in New SouthWales (Figure 3) [57]. Minerals targeted at these test sites included species of carbonates (dolomite andmagnesite), garnets (almandine and spessartine) and feldspars (albite and microcline). Pyroxenes werealso aimed for but not available/evident at these areas (see Section 2.4).
Geosciences 2016, 6, 52 8 of 48
(dolomite and magnesite), garnets (almandine and spessartine) and feldspars (albite and microcline). Pyroxenes were also aimed for but not available/evident at these areas (see Section 2.4).
Figure 3. Airborne MIRACO2LAS results (~1992) for the Broken Hill area, New South Wales, Australia. (a) Map of the distribution of Broken Hill style base metal deposits and their “Mine Sequence Suite host rocks (green) [57], together with field sample locations and the tracks of airborne MIRACO2LAS surveys which have both been color-coded with respect to garnet TIR reflectance trough wavelength. Scene center is approximately −31.9669° latitude 141.44134° longitude; (b) Segment of MIRACO2LAS flight-line “13DBH10T” from over the Broken Hill Main lode open pit and surrounding areas and processed to show the “unmixed” proportion of almandine (blue) and spessartine (orange) garnets as well as the wavelength position of the garnet reflectance trough at approximately ~10,700 nm (10.7 µm; brown); (c) MIRACO2LAS pixel spectra of almandine-rich (A; reflectance trough at 10,700 nm (10.71 µm)) and spessartine-rich (B; emissivity peak at 10,800 nm (10.80 µm) areas shown in (b)); (d) Laboratory CO2 laser spectra of garnet-bearing field surface samples—field localities shown in (a); (e) Scatter-gram of the positions of the laboratory X-ray Diffraction d-spacing peak at 2.58 Angstrom units (10−8 cm) (garnet 420 hkl peak) and laboratory CO2 laser reflectance trough at 10,700 nm (10.7 µm).
The results described here focus on the hyperspectral TIR measurement and mapping of the Fe–Mn chemistry of Ca-poor garnets (almandine to spessartine) in the Broken Hill area (Figure 3). These garnets developed during high-grade metamorphism (andalusite to granulite facies) with most being Fe-rich (almandine). However, garnet composition becomes Mn-rich (spessartine) near strata-bound Pb–Zn–Ag mineralization, especially in the Mine Sequence suite that comprises quartz–feldspathic gneiss, quartz–gahnite and garnet–quartz rocks [58]. A more detailed account of the Broken Hill geology is given in Section 2.11.1.
2.3.2. Garnet Chemistry Alteration Footprints
Selected laboratory CO2 laser TIR spectra of garnet-bearing samples from across the Broken Hill block (Figure 3d) show variations in wavelength of the reflectance minimum near 10,700 nm that correlates with the position of the X-ray Diffraction (XRD) d-spacing near ~2.58 Angstrom units (10−8 cm) for the garnet 420 hkl peak (Figure 3e). There is an approximate 200 nm spectral shift (10,600 to 10,800 nm) between the almandine and spessartine endmembers. A change in garnet Fe/(Fe + Al) number (Fe number) of <0.1 corresponds to a ~20 nm wavelength shift in the TIR absorption minimum, which in theory should be detectable given the spectral resolution of MIRACO2LAS.
Figure 3. Airborne MIRACO2LAS results (~1992) for the Broken Hill area, New South Wales, Australia.(a) Map of the distribution of Broken Hill style base metal deposits and their Mine Sequence Suitehost rocks (green) [57], together with field sample locations and the tracks of airborne MIRACO2LASsurveys which have both been color-coded with respect to garnet TIR reflectance trough wavelength.Scene center is approximately −31.9669◦ latitude 141.44134◦ longitude; (b) Segment of MIRACO2LASflight-line “13DBH10T” from over the Broken Hill Main lode open pit and surrounding areas andprocessed to show the “unmixed” proportion of almandine (blue) and spessartine (orange) garnetsas well as the wavelength position of the garnet reflectance trough at approximately ~10,700 nm(10.7 µm; brown); (c) MIRACO2LAS pixel spectra of almandine-rich (A; reflectance trough at 10,700 nm(10.71 µm)) and spessartine-rich (B; emissivity peak at 10,800 nm (10.80 µm) areas shown in (b));(d) Laboratory CO2 laser spectra of garnet-bearing field surface samples—field localities shown in (a);(e) Scatter-gram of the positions of the laboratory X-ray Diffraction d-spacing peak at 2.58 Angstromunits (10−8 cm) (garnet 420 hkl peak) and laboratory CO2 laser reflectance trough at 10,700 nm (10.7 µm).
The results described here focus on the hyperspectral TIR measurement and mapping of theFe–Mn chemistry of Ca-poor garnets (almandine to spessartine) in the Broken Hill area (Figure 3).These garnets developed during high-grade metamorphism (andalusite to granulite facies) withmost being Fe-rich (almandine). However, garnet composition becomes Mn-rich (spessartine)near strata-bound Pb–Zn–Ag mineralization, especially in the Mine Sequence suite that comprisesquartz–feldspathic gneiss, quartz–gahnite and garnet–quartz rocks [58]. A more detailed account ofthe Broken Hill geology is given in Section 2.11.1.
2.3.2. Garnet Chemistry Alteration Footprints
Selected laboratory CO2 laser TIR spectra of garnet-bearing samples from across the BrokenHill block (Figure 3d) show variations in wavelength of the reflectance minimum near 10,700 nmthat correlates with the position of the X-ray Diffraction (XRD) d-spacing near ~2.58 Angstrom units(10−8 cm) for the garnet 420 hkl peak (Figure 3e). There is an approximate 200 nm spectral shift (10,600
Geosciences 2016, 6, 52 9 of 48
to 10,800 nm) between the almandine and spessartine endmembers. A change in garnet Fe/(Fe + Al)number (Fe number) of <0.1 corresponds to a ~20 nm wavelength shift in the TIR absorption minimum,which in theory should be detectable given the spectral resolution of MIRACO2LAS.
Two examples of MIRACO2LAS pixel spectra are presented in Figure 3c, which clearly showthe broad garnet reflectance trough between 10,500 and 11,200 nm. These two spectra come fromflight-line 13DBH10T over the main Broken Hill mine open pits and dumps (A and B in Figure 3b).Using Figure 3e, the wavelength positions at 10,700 (“A”) and 10,800 (“B”) nm of these two airbornepixel spectra equate to mid-level (Fe number ~0.5, i.e., almandine–spessartine) and Mn-rich (Fe number~0.9, i.e., spessartine) compositions, respectively.
Tracking the MIRACO2LAS wavelength of this garnet reflectance minimum for 13DBH10T usingthe derivative of a fitted fourth-order polynomial (brown trace in in Figure 3b) shows variation in garnetwavelength between 10,660 nm (Fe number ~0.1, i.e., near pure almandine) to 10,870 nm (Fe number~1.0, i.e., near pure spessartine). Partial unmixing [59] of 13DBH10T to estimate the relative proportionsselected/interpreted almandine (blue) versus spessartine (orange) spectral endmembers (A and B inFigure 3b,c) shows a broadly similar pattern to that of the fourth-order fitted polynomial wavelength(brown—Figure 3b), though in detail there are differences, for example positions highlighted by blackdotted horizontal lines (Figure 3b). These differences can in part can be explained by the effect ofspectral depth (intensity) rather than wavelength driving the estimated partial unmixing abundances.
The wavelength position of the garnet reflectance trough near 10,700 nm for both the airborneMIRACO2LAS and field sample (measured using a MicroFTIR™ spectrometer) TIR data were separatedinto two types, namely: (i) almandine-rich where λ <10,760 nm (blue); and (ii) spessartine-rich whereλ >10,760 (red). The results (Figure 3a) identify three zones of spessartine-rich garnet, all of which arelocated within the mine sequence rocks (quartz–gahnite and garnet–quartz rocks), with two associatedwith known mineralization at the Broken Hill Main Lode and the others at Broken Hill United South(Figure 3a). There is also an apparent cross-cutting pattern within a laterally continuous, thin (~2 mwide) unit of garnet–sandstone/quartz–gahnite rocks that was traced in the field for over 10 km fromthe northern edge of the Broken Hill Main Lode workings to the Broken Hill United South Mine inthe north-northeast (Figure 3a). The third area is located midway between these areas, i.e., a 4–5 kmwide spacing, which is consistent with the pattern of seafloor convective cells above shallow hotintrusions [60] where Mn is concentrated close to the hydrothermal discharge sites and Fe is moredistal [61]. That is, a tool that can map stratigraphically cross-cutting (gradients) garnet compositionscould assist exploration for Broken Hill style base metal mineralization.
2.3.3. Project Postscript
Technology developments by the late 1990s, meant that MIRACO2LAS was superseded by highSNR airborne passive hyperspectral TIR systems, such as TIPS and SEBASS (Sections 2.4 and 2.8).
2.4. Airborne Hyperspectral VNIR–SWIR–TIR Profiling Integrated with Geophysics
2.4.1. Background
This collaborative industry project between CSIRO and World Geoscience Corporation (Perth,Australia) (later Fugro Airborne Services) spanned the mid-1990s to early 2000s and had the aim ofdeveloping an operational airborne system that integrated simultaneous acquisition of line-profilingVNIR–SWIR–TIR mineral mapping with gamma ray spectrometry and magnetics [62,63]. The rationalebeing that for a small additional cost, customers would receive not just the standard geophysics databut also a full suite of hyperspectral mineral mapping products. One of these hyperspectral line-profilesensors was TIPS, which was a Fourier transform TIR (FTIR) system. Here we focus on TIPS datacollected in 2001 from the Munni Munni test site in Western Australia (Figure 4) where there is awell-exposed, differentiated ultramafic body with surface exposure of the clino-pyroxene mineral,diopside. Importantly, diopside at Munni Munni changes its chemical composition (Mg# number;
Geosciences 2016, 6, 52 10 of 48
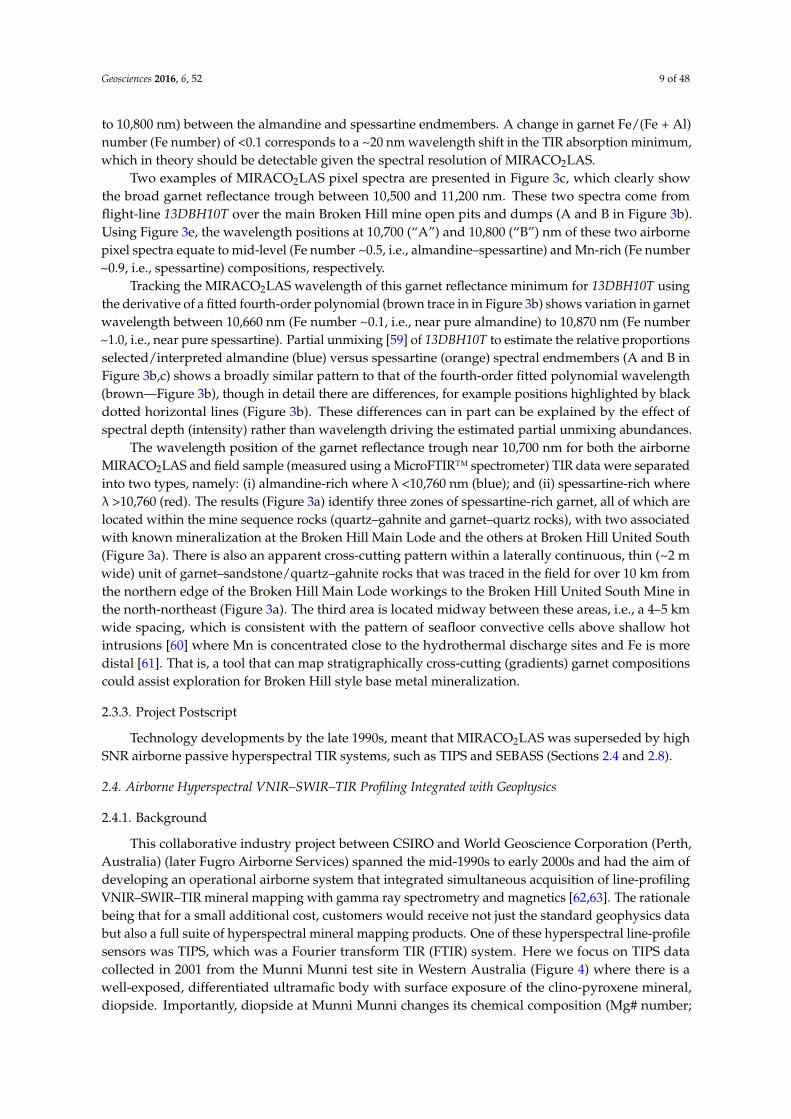
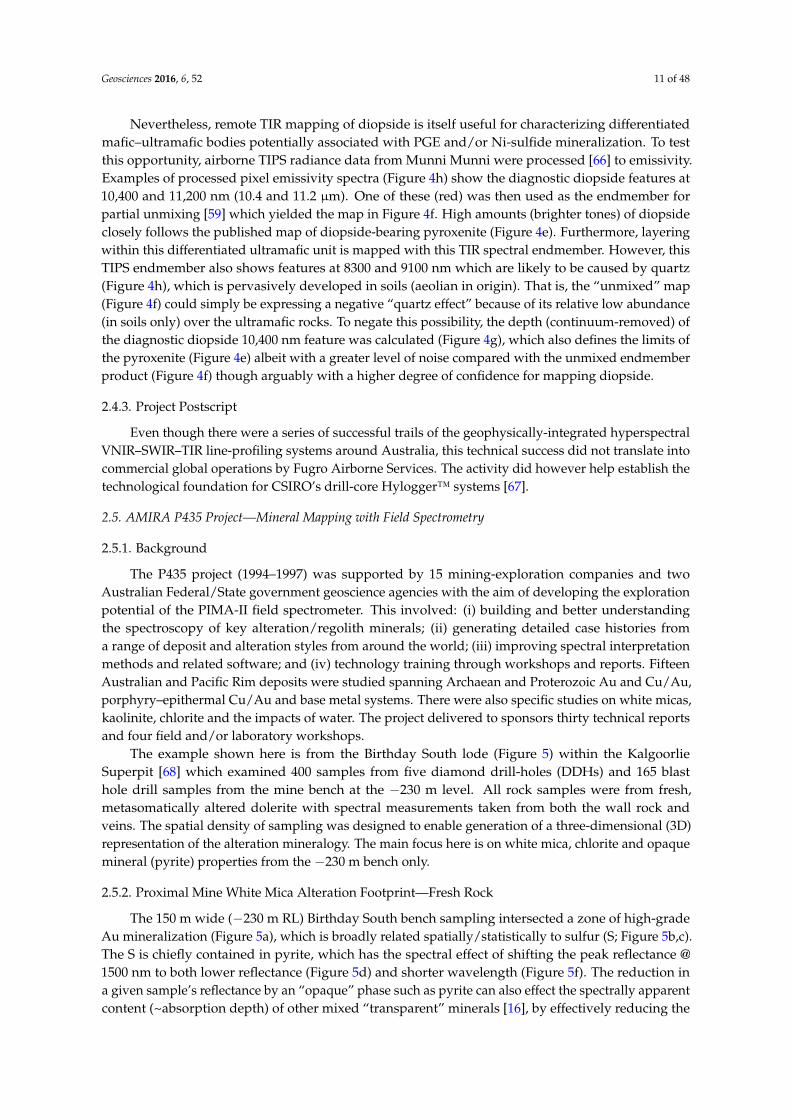
Mg/(Mg + Fe)), at the top of the differentiated ultramafic complex where lower diopside Mg# numbersare associated with platinum group element (PGE) mineralization [64].Geosciences 2016, 6, 52 10 of 48
Figure 4. Airborne TIPS results from Munni Munni, Pilbara Craton, Western Australia. (a) Field photograph of websterite (foreground) and gabbro (background) outcrops. Note the extensive cover of Spinifex grass; (b) Close-up view of both natural weathered rock surfaces and a broken surface of diopside-rich websterite (locality MU21); (c) Field “MicroFTIR” emissivity spectra of diopside-bearing fresh rock samples. Field localities shown in (e); (d) Field “MicroFTIR” emissivity spectra of diopside-bearing weathered rock surfaces. Field localities shown in (e); (e) Published 100K geology of the Munni Munni area together with the locations of selected field samples of diopside-rich websterite. Scene center approximately −21.1236° latitude 116.8420° longitude; (f) Interpolated, airborne TIPS processed partial unmixing “diopside” image (~10 m pixel) generated from the red spectrum in (h); (g) Interpolated airborne TIPS 10,400 nm (10.4 µm) continuum-depth image (blue in large depth); (h) Airborne TIPS pixel spectra selected and showing the diopside related emissivity lows at ~10.4 µm for the red and green curves. Blue spectrum is of a quartz-rich pixel.
2.4.2. Pyroxene Mapping in Ultramafic Rocks
The field TIR emissivity spectra of broken (fresh) surfaces of diopside-bearing ultramafic rocks from Munni Munni (Figure 4b,c,e) show a consistent suite of emissivity troughs, each 100 to 400 nm wide, at 9000, 10,400 and 11,200 nm diagnostic of diopside. The weathered skins of these rocks (Figure 4b) reduces the intensity of these spectral troughs, especially the feature near 9000 nm (9.0 µm) which overlaps clay spectral bands between 9000 and 10,000 nm. Nevertheless, the diopside features at 10,400 and 11,200 nm remain detectable (Figure 4d). The assayed Mg# number for these field samples (Figure 4d) range from 0.55 to 0.71, with the lower Mg# numbers potentially associated with PGE mineralization, i.e., samples MU02, MU18 and MU20. However, there is no apparent shift in the wavelength position of the diopside TIR spectral features with respect to a change in Mg# number. Nor was there any other evidence in the >50 field and drill core samples examined of a measurable TIR spectral property related to Mg# number [65]. Thus, unlike garnets, the opportunity for spectral measurement of pyroxene (diopside) chemical solid solution is a challenge.
Nevertheless, remote TIR mapping of diopside is itself useful for characterizing differentiated mafic–ultramafic bodies potentially associated with PGE and/or Ni-sulfide mineralization. To test
Figure 4. Airborne TIPS results from Munni Munni, Pilbara Craton, Western Australia. (a) Fieldphotograph of websterite (foreground) and gabbro (background) outcrops. Note the extensivecover of Spinifex grass; (b) Close-up view of both natural weathered rock surfaces and a brokensurface of diopside-rich websterite (locality MU21); (c) Field “MicroFTIR” emissivity spectra ofdiopside-bearing fresh rock samples. Field localities shown in (e); (d) Field “MicroFTIR” emissivityspectra of diopside-bearing weathered rock surfaces. Field localities shown in (e); (e) Published 100Kgeology of the Munni Munni area together with the locations of selected field samples of diopside-richwebsterite. Scene center approximately −21.1236◦ latitude 116.8420◦ longitude; (f) Interpolated,airborne TIPS processed partial unmixing “diopside” image (~10 m pixel) generated from the redspectrum in (h); (g) Interpolated airborne TIPS 10,400 nm (10.4 µm) continuum-depth image (blue inlarge depth); (h) Airborne TIPS pixel spectra selected and showing the diopside related emissivity lowsat ~10.4 µm for the red and green curves. Blue spectrum is of a quartz-rich pixel.
2.4.2. Pyroxene Mapping in Ultramafic Rocks
The field TIR emissivity spectra of broken (fresh) surfaces of diopside-bearing ultramafic rocksfrom Munni Munni (Figure 4b,c,e) show a consistent suite of emissivity troughs, each 100 to 400 nmwide, at 9000, 10,400 and 11,200 nm diagnostic of diopside. The weathered skins of these rocks(Figure 4b) reduces the intensity of these spectral troughs, especially the feature near 9000 nm (9.0 µm)which overlaps clay spectral bands between 9000 and 10,000 nm. Nevertheless, the diopside features at10,400 and 11,200 nm remain detectable (Figure 4d). The assayed Mg# number for these field samples(Figure 4d) range from 0.55 to 0.71, with the lower Mg# numbers potentially associated with PGEmineralization, i.e., samples MU02, MU18 and MU20. However, there is no apparent shift in thewavelength position of the diopside TIR spectral features with respect to a change in Mg# number.Nor was there any other evidence in the >50 field and drill core samples examined of a measurableTIR spectral property related to Mg# number [65]. Thus, unlike garnets, the opportunity for spectralmeasurement of pyroxene (diopside) chemical solid solution is a challenge.
Geosciences 2016, 6, 52 11 of 48
Nevertheless, remote TIR mapping of diopside is itself useful for characterizing differentiatedmafic–ultramafic bodies potentially associated with PGE and/or Ni-sulfide mineralization. To testthis opportunity, airborne TIPS radiance data from Munni Munni were processed [66] to emissivity.Examples of processed pixel emissivity spectra (Figure 4h) show the diagnostic diopside features at10,400 and 11,200 nm (10.4 and 11.2 µm). One of these (red) was then used as the endmember forpartial unmixing [59] which yielded the map in Figure 4f. High amounts (brighter tones) of diopsideclosely follows the published map of diopside-bearing pyroxenite (Figure 4e). Furthermore, layeringwithin this differentiated ultramafic unit is mapped with this TIR spectral endmember. However, thisTIPS endmember also shows features at 8300 and 9100 nm which are likely to be caused by quartz(Figure 4h), which is pervasively developed in soils (aeolian in origin). That is, the “unmixed” map(Figure 4f) could simply be expressing a negative “quartz effect” because of its relative low abundance(in soils only) over the ultramafic rocks. To negate this possibility, the depth (continuum-removed) ofthe diagnostic diopside 10,400 nm feature was calculated (Figure 4g), which also defines the limits ofthe pyroxenite (Figure 4e) albeit with a greater level of noise compared with the unmixed endmemberproduct (Figure 4f) though arguably with a higher degree of confidence for mapping diopside.
2.4.3. Project Postscript
Even though there were a series of successful trails of the geophysically-integrated hyperspectralVNIR–SWIR–TIR line-profiling systems around Australia, this technical success did not translate intocommercial global operations by Fugro Airborne Services. The activity did however help establish thetechnological foundation for CSIRO’s drill-core Hylogger™ systems [67].
2.5. AMIRA P435 Project—Mineral Mapping with Field Spectrometry
2.5.1. Background
The P435 project (1994–1997) was supported by 15 mining-exploration companies and twoAustralian Federal/State government geoscience agencies with the aim of developing the explorationpotential of the PIMA-II field spectrometer. This involved: (i) building and better understandingthe spectroscopy of key alteration/regolith minerals; (ii) generating detailed case histories froma range of deposit and alteration styles from around the world; (iii) improving spectral interpretationmethods and related software; and (iv) technology training through workshops and reports. FifteenAustralian and Pacific Rim deposits were studied spanning Archaean and Proterozoic Au and Cu/Au,porphyry–epithermal Cu/Au and base metal systems. There were also specific studies on white micas,kaolinite, chlorite and the impacts of water. The project delivered to sponsors thirty technical reportsand four field and/or laboratory workshops.
The example shown here is from the Birthday South lode (Figure 5) within the KalgoorlieSuperpit [68] which examined 400 samples from five diamond drill-holes (DDHs) and 165 blasthole drill samples from the mine bench at the −230 m level. All rock samples were from fresh,metasomatically altered dolerite with spectral measurements taken from both the wall rock andveins. The spatial density of sampling was designed to enable generation of a three-dimensional (3D)representation of the alteration mineralogy. The main focus here is on white mica, chlorite and opaquemineral (pyrite) properties from the −230 m bench only.
2.5.2. Proximal Mine White Mica Alteration Footprint—Fresh Rock
The 150 m wide (−230 m RL) Birthday South bench sampling intersected a zone of high-gradeAu mineralization (Figure 5a), which is broadly related spatially/statistically to sulfur (S; Figure 5b,c).The S is chiefly contained in pyrite, which has the spectral effect of shifting the peak reflectance @1500 nm to both lower reflectance (Figure 5d) and shorter wavelength (Figure 5f). The reduction ina given sample’s reflectance by an “opaque” phase such as pyrite can also effect the spectrally apparentcontent (~absorption depth) of other mixed “transparent” minerals [16], by effectively reducing the

Geosciences 2016, 6, 52 12 of 48
penetration (path length) of the volume scattered photons. XRD analyses of the Birthday Southsamples, showed that increasing pyrite content is accompanied by increasing white mica content anddecreasing chlorite content (Figure 5g), however the PIMA results show that the pyrite-rich sampleshave relatively low 2200 nm absorption depths (Figure 2b,e).
This non-linear spectral mixing behavior does not extend to the wavelength position of 2200 nmabsorption which shows a linear relationship with laboratory electron microprobe analyses of whitemica Tschermak substitution (Figure 5i) [(Al↔Si)tet = (Al↔{Fe2+,Mg, site vacancy})oct] [69,70], whichis sensitive to the physicochemical conditions of white mica formation. Here at Birthday South, whitemica is a metasomatic alteration product in ferromagnesian (dolerite) host rocks with an increase inits Tschermak substitution related to an increase in alteration intensity/proximity and hence goldmineralization. That is, the white mica becomes Si-rich (Al-poor) with proximity to gold mineralization,with its footprint extending for at least the entire width of the bench (i.e., 150 m) compared with the50 m wide Au zone.
Geosciences 2016, 6, 52 12 of 48
chlorite content (Figure 5g), however the PIMA results show that the pyrite-rich samples have relatively low 2200 nm absorption depths (Figure 2b,e).
This non-linear spectral mixing behavior does not extend to the wavelength position of 2200 nm absorption which shows a linear relationship with laboratory electron microprobe analyses of white mica Tschermak substitution (Figure 5i) [(Al↔Si)tet = (Al↔{Fe2+,Mg, site vacancy})oct] [69,70], which is sensitive to the physicochemical conditions of white mica formation. Here at Birthday South, white mica is a metasomatic alteration product in ferromagnesian (dolerite) host rocks with an increase in its Tschermak substitution related to an increase in alteration intensity/proximity and hence gold mineralization. That is, the white mica becomes Si-rich (Al-poor) with proximity to gold mineralization, with its footprint extending for at least the entire width of the bench (i.e., 150 m) compared with the 50 m wide Au zone.
Figure 5. Blast-hole pulp (166 samples, 10 m depth composite) results (~1996) for the −230 m bench of Birthday South, Superpit, Kalgoorlie, Western Australia. Approximate position −30.7715° latitude 121.5021° longitude. (a) Interpolated mine bench map of Au content (ppm); (b) Interpolated mine bench map of S content (ppm); (c) Scatter-gram of Au versus S contents; (d) Interpolated mine bench map of PIMA maximum reflectance value (%) with lower albedo yielding warmer tones; (e) Interpolated mine bench map of PIMA 2200 nm absorption continuum depth; (f) Scatter-gram of the wavelength position of the PIMA peak reflectance versus the S content; (g) Interpolated mine bench map of the depth of the continuum-removed 2250 nm absorption (~chlorite mineral content); (h) Interpolated mine bench map of the wavelength of the continuum-removed 2200 nm absorption (~white mica Tschermak substitution); (i) Scatter-gram of the wavelength of the 2200 nm absorption versus electron-microprobe analyses of the white mica octahedral sheet Al, Fe and Mg cations (Aloct/[Feoct + Mgoct]) for 13 Birthday South samples showing effects of coupled Tschermak substitution.
2.5.3. Project Postscript
Remote detection of <5 nm wavelength changes of the 2200 nm absorption observed at Birthday South requires a spectral resolution of <20 nm, given a 30 nm white mica absorption FWHH. Thus, multi-spectral systems with SWIR-2 spectral resolution of >40 nm (i.e., Geoscan and ASTER) are not
Figure 5. Blast-hole pulp (166 samples, 10 m depth composite) results (~1996) for the −230 m benchof Birthday South, Superpit, Kalgoorlie, Western Australia. Approximate position −30.7715◦ latitude121.5021◦ longitude. (a) Interpolated mine bench map of Au content (ppm); (b) Interpolated mine benchmap of S content (ppm); (c) Scatter-gram of Au versus S contents; (d) Interpolated mine bench mapof PIMA maximum reflectance value (%) with lower albedo yielding warmer tones; (e) Interpolatedmine bench map of PIMA 2200 nm absorption continuum depth; (f) Scatter-gram of the wavelengthposition of the PIMA peak reflectance versus the S content; (g) Interpolated mine bench map of thedepth of the continuum-removed 2250 nm absorption (~chlorite mineral content); (h) Interpolated minebench map of the wavelength of the continuum-removed 2200 nm absorption (~white mica Tschermaksubstitution); (i) Scatter-gram of the wavelength of the 2200 nm absorption versus electron-microprobeanalyses of the white mica octahedral sheet Al, Fe and Mg cations (Aloct/[Feoct + Mgoct]) for 13 BirthdaySouth samples showing effects of coupled Tschermak substitution.
2.5.3. Project Postscript
Remote detection of <5 nm wavelength changes of the 2200 nm absorption observed at BirthdaySouth requires a spectral resolution of <20 nm, given a 30 nm white mica absorption FWHH. Thus,multi-spectral systems with SWIR-2 spectral resolution of >40 nm (i.e., Geoscan and ASTER) are not
Geosciences 2016, 6, 52 13 of 48
suited for accurate measurement of white mica Tschermak substitution (see instead hyperspectralsystems below, e.g., Section 2.4).
2.6. Airborne Hyperspectral Imaging of the Kalgoorlie Superpit
2.6.1. Background
Like the PIMA-II, the 96 VNIR–SWIR channel Airborne Multi-spectral Scanner (AMS) witha SWIR-2 spectral resolution ~17 nm, was developed by ISPL. The AMS was built in mid-1990s forDe Beers to service their global diamond exploration program for which it was a technical success [71].In 1998, De Beers provided CSIRO with the opportunity to collect AMS data over the >4 km2 area ofthe Kalgoorlie Superpit open pit mine to follow up the P435 Birthday South results (location shown bywhite rectangle in Figure 6). No on-board, geolocation information was available for these early AMSdata, which combined with the high topographic-relief of the open pit mine, caused spatial mappingerrors in these early derived mineral maps (Figure 6).
Geosciences 2016, 6, 52 13 of 48
suited for accurate measurement of white mica Tschermak substitution (see instead hyperspectral systems below, e.g., Section 2.4).
2.6. Airborne Hyperspectral Imaging of the Kalgoorlie Superpit
2.6.1. Background
Like the PIMA-II, the 96 VNIR–SWIR channel Airborne Multi-spectral Scanner (AMS) with a SWIR-2 spectral resolution ~17 nm, was developed by ISPL. The AMS was built in mid-1990s for De Beers to service their global diamond exploration program for which it was a technical success [71]. In 1998, De Beers provided CSIRO with the opportunity to collect AMS data over the >4 km2 area of the Kalgoorlie Superpit open pit mine to follow up the P435 Birthday South results (location shown by white rectangle in Figure 6). No on-board, geolocation information was available for these early AMS data, which combined with the high topographic-relief of the open pit mine, caused spatial mapping errors in these early derived mineral maps (Figure 6).
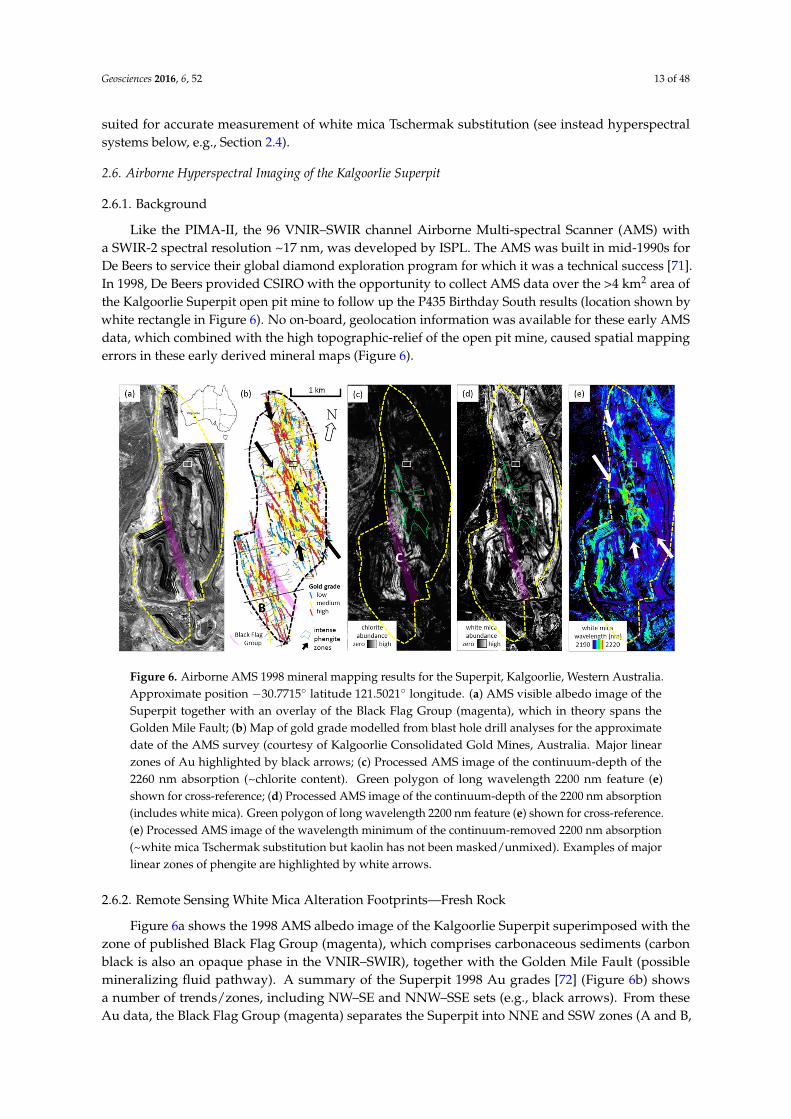
Figure 6. Airborne AMS 1998 mineral mapping results for the Superpit, Kalgoorlie, Western Australia. Approximate position −30.7715° latitude 121.5021° longitude. (a) AMS visible albedo image of the Superpit together with an overlay of the Black Flag Group (magenta), which in theory spans the Golden Mile Fault; (b) Map of gold grade modelled from blast hole drill analyses for the approximate date of the AMS survey (courtesy of Kalgoorlie Consolidated Gold Mines, Australia. Major linear zones of Au highlighted by black arrows; (c) Processed AMS image of the continuum-depth of the 2260 nm absorption (~chlorite content). Green polygon of long wavelength 2200 nm feature (e) shown for cross-reference; (d) Processed AMS image of the continuum-depth of the 2200 nm absorption (includes white mica). Green polygon of long wavelength 2200 nm feature (e) shown for cross-reference. (e) Processed AMS image of the wavelength minimum of the continuum-removed 2200 nm absorption (~white mica Tschermak substitution but kaolin has not been masked/unmixed). Examples of major linear zones of phengite are highlighted by white arrows.
2.6.2. Remote Sensing White Mica Alteration Footprints—Fresh Rock
Figure 6a shows the 1998 AMS albedo image of the Kalgoorlie Superpit superimposed with the zone of published Black Flag Group (magenta), which comprises carbonaceous sediments (carbon black is also an opaque phase in the VNIR–SWIR), together with the Golden Mile Fault (possible mineralizing fluid pathway). A summary of the Superpit 1998 Au grades [72] (Figure 6b) shows a number of trends/zones, including NW–SE and NNW–SSE sets (e.g., black arrows). From these Au data, the Black Flag Group (magenta) separates the Superpit into NNE and SSW zones (A and B,
Figure 6. Airborne AMS 1998 mineral mapping results for the Superpit, Kalgoorlie, Western Australia.Approximate position −30.7715◦ latitude 121.5021◦ longitude. (a) AMS visible albedo image of theSuperpit together with an overlay of the Black Flag Group (magenta), which in theory spans theGolden Mile Fault; (b) Map of gold grade modelled from blast hole drill analyses for the approximatedate of the AMS survey (courtesy of Kalgoorlie Consolidated Gold Mines, Australia. Major linearzones of Au highlighted by black arrows; (c) Processed AMS image of the continuum-depth of the2260 nm absorption (~chlorite content). Green polygon of long wavelength 2200 nm feature (e)shown for cross-reference; (d) Processed AMS image of the continuum-depth of the 2200 nm absorption(includes white mica). Green polygon of long wavelength 2200 nm feature (e) shown for cross-reference.(e) Processed AMS image of the wavelength minimum of the continuum-removed 2200 nm absorption(~white mica Tschermak substitution but kaolin has not been masked/unmixed). Examples of majorlinear zones of phengite are highlighted by white arrows.
2.6.2. Remote Sensing White Mica Alteration Footprints—Fresh Rock
Figure 6a shows the 1998 AMS albedo image of the Kalgoorlie Superpit superimposed with thezone of published Black Flag Group (magenta), which comprises carbonaceous sediments (carbonblack is also an opaque phase in the VNIR–SWIR), together with the Golden Mile Fault (possiblemineralizing fluid pathway). A summary of the Superpit 1998 Au grades [72] (Figure 6b) showsa number of trends/zones, including NW–SE and NNW–SSE sets (e.g., black arrows). From theseAu data, the Black Flag Group (magenta) separates the Superpit into NNE and SSW zones (A and B,
Geosciences 2016, 6, 52 14 of 48
Figure 6b, respectively). From the AMS data, these zones are separated by a broad chlorite-rich zone(C in Figure 6c), which was measured using the continuum-depth of the 2260 nm absorption whichwas also used in PIMA-II Birthday South processing (Figure 5g). This apparent chlorite is typicallydeveloped in areas poor in 2200 nm absorbing minerals (white mica and/or kaolin), estimated usingthe continuum-depth of the 2200 nm absorption.
The mineral mapping products generated in 1998 (Figure 6) did not mask/ unmix complicatingeffects such as kaolin from white mica, which share a 2200 nm absorption, albeit with different FWHHs.Kaolin can be recognized in the 1998 AMS Superpit products along the open pit walls where weatheredrock is exposed generating large 2200 nm absorption depths (Figure 6d) with short wavelengths(Figure 6e), calculated using the first derivative of a fitted fourth-order polynomial to the wavelengthsegment between 2120 and 2240 nm. This interpreted kaolin is prevalent on the eastern side of theopen pit though on the SW pit wall there is also longer wavelength 2200 absorption extending to thesurface. This suggests that white mica has persisted through the regolith profile to the surface, whichhighlights a remote sensing exploration opportunity (see M370 project in Section 2.9). The 2200 nmabsorption at the base of the open pit where chlorite is also in found fresh rock, is interpreted as whitemica only. The fresh rock pattern of the white mica 2200 nm absorption wavelength (Figure 6e), showslinear zones of phengite similar to the Au grades (Figure 6b) and extending for up to 3 km (arrowed)across mine benches, mine faces, haul roads and into the upper weathered parts of the open pit mine.
Several conclusions can be made from this study: namely: (i) Au mineralization in the Superpit isproximally associated with abundant long-wavelength (phengitic) white mica in mafic rock, whichextends for kilometers and persists up through the regolith profile (Figure 1a), i.e., is a good targetmineral for Au exploration in weathered environments; (ii) chlorite is more distal and not evident inthe overlying regolith (Figure 6c), i.e., not a good target mineral for exploration but if present indicatesrelatively fresh rock; (iii) the tops of exposed mine benches can be used to generate an accurate map ofthe alteration zonation, despite the various types of surface disturbance caused by mining such as haulroads, which when present are easily recognizable and thus discounted/masked; and (iv) combinedwith the Birthday South results (above), there is a scalable, fractal nature to the spectrally-mappablemineral alteration gradients.
2.6.3. Project Postscript
Additional airborne hyperspectral surveys were collected over the Superpit in later years alsorevealing similar white mica–chlorite–kaolinite patterns though with some changes in geometry asopen pit mining proceeded deeper. That is, there is an opportunity to begin generating 3D mineralmaps of active open pit mines from remote sensing imagery, which could be used in combination withdrill core and/or mine-face scanning data to more accurately predict the geometry of the deposit atdepth (See Rocklea Inlier in Section 2.12.2).
2.7. MERIWA M322 Project—Panorama VMS System
2.7.1. Background
In 1998, ISPL was ready to begin commercial operations using their 124-channel airbornehyperspectral VNIR–SWIR imaging system called HyMap™ [73] through its sister company HyVistaCorporation (HVC). Early public geological trails of HyMap™ were in collaboration with CSIRO at thePanorama Archaean volcanic massive sulfide (VMS) system in the remote Pilbara of Western Australia(Figure 7). This collaborative project also involved MERIWA, ERSDAC and two mining companies [74].Panorama was selected for geological testing of the HyMap™ system because recently publishedmapping [75] had showed a ~40 km pattern of 3.42 Ga volcanic massive sulfide hydrothermal alterationexposed in cross section. However, there were concerns raised by geoscientists working in this area thatthey expected little to come from the HyMap™ survey because: (i) the proximal propylitic alteration,characterized by chlorite, was poorly expressed at the surface as a result of weathering; (ii) PIMA-II
Geosciences 2016, 6, 52 15 of 48
studies had found no clear regional pattern in the white mica Tschermak substitution [76,77]; and(iii) the region is often covered by spinifex grass and other vegetation.
Geosciences 2016, 6, 52 15 of 48
Tschermak substitution [76,77]; and (iii) the region is often covered by spinifex grass and other vegetation.
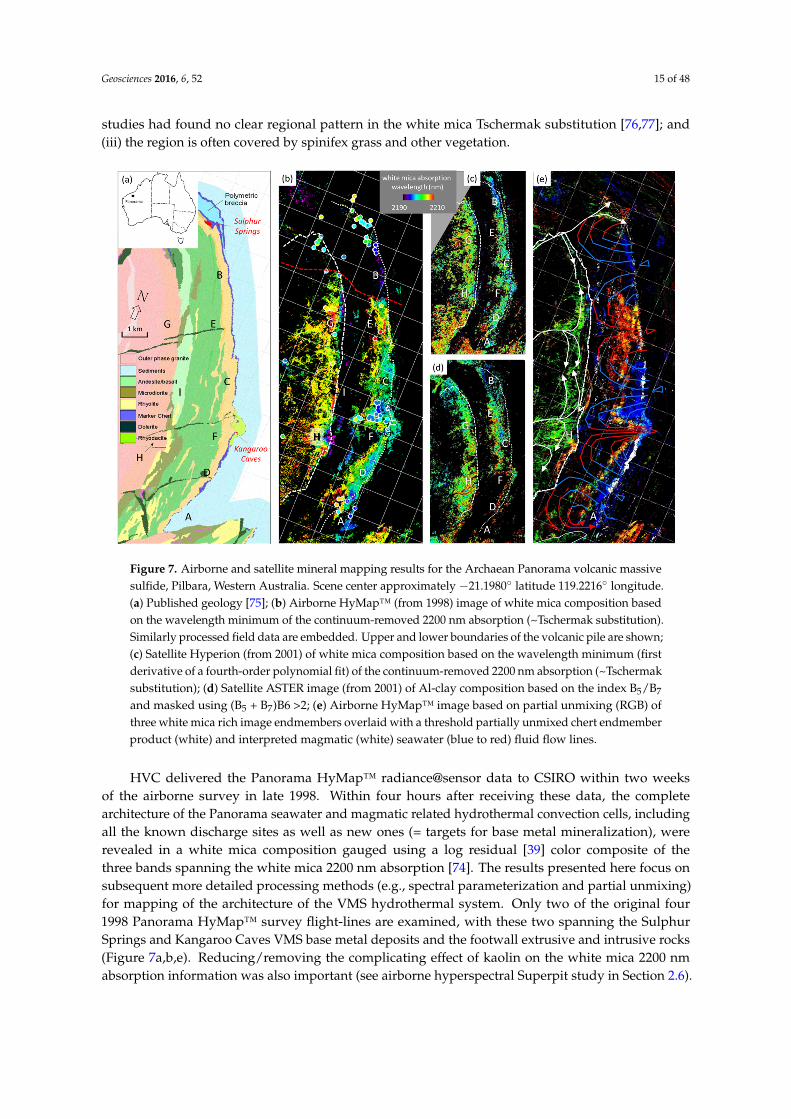
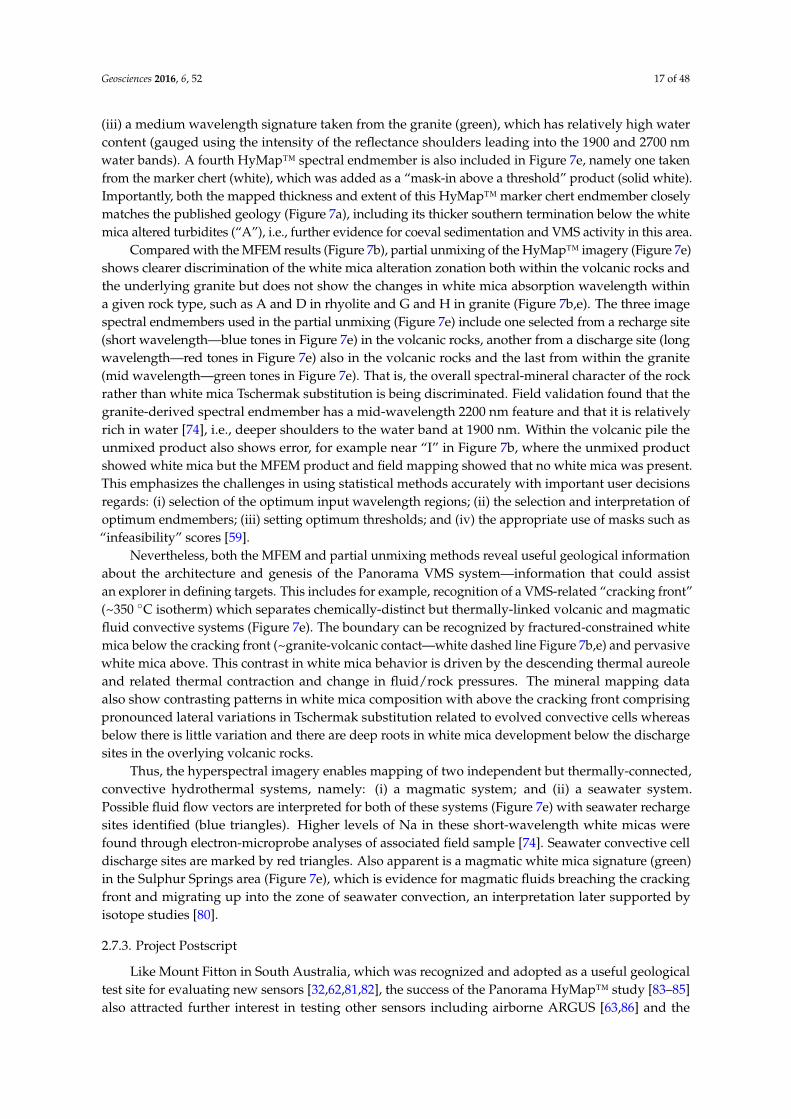
Figure 7. Airborne and satellite mineral mapping results for the Archaean Panorama volcanic massive sulfide, Pilbara, Western Australia. Scene center approximately −21.1980° latitude 119.2216° longitude. (a) Published geology [75]; (b) Airborne HyMap™ (from 1998) image of white mica composition based on the wavelength minimum of the continuum-removed 2200 nm absorption (~Tschermak substitution). Similarly processed field data are embedded. Upper and lower boundaries of the volcanic pile are shown; (c) Satellite Hyperion (from 2001) of white mica composition based on the wavelength minimum (first derivative of a fourth-order polynomial fit) of the continuum-removed 2200 nm absorption (~Tschermak substitution); (d) Satellite ASTER image (from 2001) of Al-clay composition based on the index B5/B7 and masked using (B5 + B7)B6 >2; (e) Airborne HyMap™ image based on partial unmixing (RGB) of three white mica rich image endmembers overlaid with a threshold partially unmixed chert endmember product (white) and interpreted magmatic (white) seawater (blue to red) fluid flow lines.
HVC delivered the Panorama HyMap™ radiance@sensor data to CSIRO within two weeks of the airborne survey in late 1998. Within four hours after receiving these data, the complete architecture of the Panorama seawater and magmatic related hydrothermal convection cells, including all the known discharge sites as well as new ones (= targets for base metal mineralization), were revealed in a white mica composition gauged using a log residual [39] color composite of the three bands spanning the white mica 2200 nm absorption [74]. The results presented here focus on subsequent more detailed processing methods (e.g., spectral parameterization and partial unmixing) for mapping of the architecture of the VMS hydrothermal system. Only two of the original four 1998 Panorama HyMap™ survey flight-lines are examined, with these two spanning the Sulphur Springs and Kangaroo Caves VMS base metal deposits and the footwall extrusive and intrusive rocks (Figure 7a,b,e). Reducing/removing the complicating effect of kaolin on the white mica 2200 nm absorption information was also important (see airborne hyperspectral Superpit study in Section 2.6).
2.7.2. VMS Alteration Architecture Using White Mica Information
Figure 7. Airborne and satellite mineral mapping results for the Archaean Panorama volcanic massivesulfide, Pilbara, Western Australia. Scene center approximately −21.1980◦ latitude 119.2216◦ longitude.(a) Published geology [75]; (b) Airborne HyMap™ (from 1998) image of white mica composition basedon the wavelength minimum of the continuum-removed 2200 nm absorption (~Tschermak substitution).Similarly processed field data are embedded. Upper and lower boundaries of the volcanic pile are shown;(c) Satellite Hyperion (from 2001) of white mica composition based on the wavelength minimum (firstderivative of a fourth-order polynomial fit) of the continuum-removed 2200 nm absorption (~Tschermaksubstitution); (d) Satellite ASTER image (from 2001) of Al-clay composition based on the index B5/B7
and masked using (B5 + B7)B6 >2; (e) Airborne HyMap™ image based on partial unmixing (RGB) ofthree white mica rich image endmembers overlaid with a threshold partially unmixed chert endmemberproduct (white) and interpreted magmatic (white) seawater (blue to red) fluid flow lines.
HVC delivered the Panorama HyMap™ radiance@sensor data to CSIRO within two weeksof the airborne survey in late 1998. Within four hours after receiving these data, the completearchitecture of the Panorama seawater and magmatic related hydrothermal convection cells, includingall the known discharge sites as well as new ones (= targets for base metal mineralization), wererevealed in a white mica composition gauged using a log residual [39] color composite of thethree bands spanning the white mica 2200 nm absorption [74]. The results presented here focus onsubsequent more detailed processing methods (e.g., spectral parameterization and partial unmixing)for mapping of the architecture of the VMS hydrothermal system. Only two of the original four1998 Panorama HyMap™ survey flight-lines are examined, with these two spanning the SulphurSprings and Kangaroo Caves VMS base metal deposits and the footwall extrusive and intrusive rocks(Figure 7a,b,e). Reducing/removing the complicating effect of kaolin on the white mica 2200 nmabsorption information was also important (see airborne hyperspectral Superpit study in Section 2.6).

Geosciences 2016, 6, 52 16 of 48
2.7.2. VMS Alteration Architecture Using White Mica Information
The first method for extracting white mica information from the HyMap™ reflectance datainvolved a step-wise, multi-parameter plus masking approach, later called multi-feature extractionmethod or MFEM [78]. This involved calculating the wavelength of the white mica absorption near2200 nm using the first derivative a fourth-order polynomial fitted between 2120 and 2240 nm,which was then masked: (i) to remove pixels with detectable dry vegetation using a celluloseabsorption feature near 2100 nm; (ii) to remove pixels with detectable green vegetation cover usingan Normalized-Difference-Vegetation-Index (NDVI) [79]; (iii) to remove pixels with detectable kaolinusing the presence of 2160 nm absorption; and (iv) to include pixels with a detectable white micaabsorption at ~2350 nm. Importantly, the MFEM method allows statistical comparison of the remotesensing white mica information with similarly processed field PIMA-II spectral data as well as otherquantitative sample data such as laboratory electron-microprobe geochemical analyses of white micaTschermak substitution.
The MFEM processed HyMap™ and PIMA-II results (color coded in Figure 7b) show similarpatterns in white mica 2200 nm wavelength that cross-cut the published geology (e.g., A–B–C–D inFigure 7a) providing evidence for superimposed metasomatic alteration. This distribution of whitemica terminates at the stratigraphic top of the volcanic pile below younger turbiditic sediments(white dotted line = “marker chert” in Figure 7a), except in the south (A in Figure 7b). Both VMSsites at Sulphur Springs and Kangaroo Caves (Figure 7a) are located in the volcanic rocks at thisseafloor interface, where discharging fluids would have experienced large changes in physicochemicalgradients inducing metal precipitation. These particular discharge sites are characterized by moderateto long (green to yellow) wavelength (Si-rich, Al-poor) white mica, i.e., moderate to high levels ofTschermak substitution. Sulphur Springs has fewer mapped pixels because of a blanket of spinifexgrass cover at the time of the airborne campaign. This cover was largely burnt (removed) in the areasouth of Sulphur Springs (red dashed line in Figure 7b) not long before the 1998 HyMap™ survey.
Between the Sulphur Springs and Kangaroo Caves VMS sites, the HyMap™ results show anothertwo-kilometer-wide zone of long-wavelength (yellow-red) white mica not previously recognized asa VMS discharge site [75]. This new zone shares similar characteristics with Kangaroo Caves including:(i) white mica alteration extending deep (~1 km) into intermediate and mafic rocks stratigraphicallybelow (i.e., a metasomatic alteration effect); (ii) a lack of white mica in the bottom half of the volcanicpile; (iii) localized (~1000 m wide and ~200 m thick), very short-wavelength (magenta) white micaat the contact with (white dashed line) and extending into the underlying granite; and (iv) verylong-wavelength (red) white mica deeper (500–1000 m) within the granite (G and H, Figure 7b) andlinked with deeper sub-vertical zone/s. The implication is that this new zone represents a potentialVMS exploration target.
Across the study area, the HyMap™ results show that the composition of the white mica crosscutsstratigraphically-conformable rhyolitic, andesitic and basaltic extrusive rocks, with shorter wavelengthwhite mica zones (~2 km wide) positioned at B, C and D and longer wavelength white mica zones(~2 km wide) at E (Sulphur Springs), F (Kangaroo Caves) and SW of D (Figure 7b). This four-kilometercyclic pattern over an approximately two-kilometer thick volcanic pile is consistent with modelling ofVMS hydrothermal convective cells [60].
Note that the HyMap™ results also show short-wavelength white mica developed in the overlyingsediments near “A”, which suggests that this part of an apparent northward-prograding turbiditefan was deposited during the hydrothermal event. The large gradient in white mica compositionacross this sediment pile possibly reflecting changing fluid flow conditions as the underlying dischargebecame increasingly buried.
The second approach for extracting white mica information from the HyMap™ reflectance dataused a CSIRO partial unmixing method [59]. Three white mica endmembers were used to generatea composite white mica mineral map (Figure 7e), including: (i) a long-wavelength signature taken fromthe volcanic rocks (red); (ii) a short-wavelength signature also taken from the volcanic rocks (blue); and
Geosciences 2016, 6, 52 17 of 48
(iii) a medium wavelength signature taken from the granite (green), which has relatively high watercontent (gauged using the intensity of the reflectance shoulders leading into the 1900 and 2700 nmwater bands). A fourth HyMap™ spectral endmember is also included in Figure 7e, namely one takenfrom the marker chert (white), which was added as a “mask-in above a threshold” product (solid white).Importantly, both the mapped thickness and extent of this HyMap™ marker chert endmember closelymatches the published geology (Figure 7a), including its thicker southern termination below the whitemica altered turbidites (“A”), i.e., further evidence for coeval sedimentation and VMS activity in this area.
Compared with the MFEM results (Figure 7b), partial unmixing of the HyMap™ imagery (Figure 7e)shows clearer discrimination of the white mica alteration zonation both within the volcanic rocks andthe underlying granite but does not show the changes in white mica absorption wavelength withina given rock type, such as A and D in rhyolite and G and H in granite (Figure 7b,e). The three imagespectral endmembers used in the partial unmixing (Figure 7e) include one selected from a recharge site(short wavelength—blue tones in Figure 7e) in the volcanic rocks, another from a discharge site (longwavelength—red tones in Figure 7e) also in the volcanic rocks and the last from within the granite(mid wavelength—green tones in Figure 7e). That is, the overall spectral-mineral character of the rockrather than white mica Tschermak substitution is being discriminated. Field validation found that thegranite-derived spectral endmember has a mid-wavelength 2200 nm feature and that it is relativelyrich in water [74], i.e., deeper shoulders to the water band at 1900 nm. Within the volcanic pile theunmixed product also shows error, for example near “I” in Figure 7b, where the unmixed productshowed white mica but the MFEM product and field mapping showed that no white mica was present.This emphasizes the challenges in using statistical methods accurately with important user decisionsregards: (i) selection of the optimum input wavelength regions; (ii) the selection and interpretation ofoptimum endmembers; (iii) setting optimum thresholds; and (iv) the appropriate use of masks such as“infeasibility” scores [59].
Nevertheless, both the MFEM and partial unmixing methods reveal useful geological informationabout the architecture and genesis of the Panorama VMS system—information that could assistan explorer in defining targets. This includes for example, recognition of a VMS-related “cracking front”(~350 ◦C isotherm) which separates chemically-distinct but thermally-linked volcanic and magmaticfluid convective systems (Figure 7e). The boundary can be recognized by fractured-constrained whitemica below the cracking front (~granite-volcanic contact—white dashed line Figure 7b,e) and pervasivewhite mica above. This contrast in white mica behavior is driven by the descending thermal aureoleand related thermal contraction and change in fluid/rock pressures. The mineral mapping dataalso show contrasting patterns in white mica composition with above the cracking front comprisingpronounced lateral variations in Tschermak substitution related to evolved convective cells whereasbelow there is little variation and there are deep roots in white mica development below the dischargesites in the overlying volcanic rocks.
Thus, the hyperspectral imagery enables mapping of two independent but thermally-connected,convective hydrothermal systems, namely: (i) a magmatic system; and (ii) a seawater system.Possible fluid flow vectors are interpreted for both of these systems (Figure 7e) with seawater rechargesites identified (blue triangles). Higher levels of Na in these short-wavelength white micas werefound through electron-microprobe analyses of associated field sample [74]. Seawater convective celldischarge sites are marked by red triangles. Also apparent is a magmatic white mica signature (green)in the Sulphur Springs area (Figure 7e), which is evidence for magmatic fluids breaching the crackingfront and migrating up into the zone of seawater convection, an interpretation later supported byisotope studies [80].
2.7.3. Project Postscript
Like Mount Fitton in South Australia, which was recognized and adopted as a useful geologicaltest site for evaluating new sensors [32,62,81,82], the success of the Panorama HyMap™ study [83–85]also attracted further interest in testing other sensors including airborne ARGUS [63,86] and the
Geosciences 2016, 6, 52 18 of 48
satellite-borne Hyperion [87,88] and ASTER imaging sensors. The ability of these satellite systems formapping the VMS related pattern white mica compositional information is presented in Figure 7c,d.The Hyperion was processed using a first derivative of a fitted fourth-order polynomial similar to theHyMap™ processing (Figure 7b) whereas processing the lower SWIR spectral resolution ASTER datarequired use of a ratio of ASTER bands B5/B7 masked to include only those pixels that generate anAl-clay absorption at 2200 nm using a ratio of (B5 + B7)/B6. Taking into consideration the differencesin spatial, spectral and radiometric resolutions between these three sensors, there is similarity in thepattern of white mica composition that shows the lithology-crosscutting recharge sites (e.g., “B” and“C”) and discharge sites (e.g., “E” and “F”) within the volcanic pile as well as the mica alteration inthe granite apparent in their respective products. Thus, these satellite systems can also be used byexplorers to map possible hydrothermal white mica information associated with VMS systems in atleast relatively well exposed geology.
The Panorama HyMap™ study was also the catalyst for the government geoscience agenciesacross Australia to begin thinking about the opportunities of collecting regional remote sensing dataas part of their standard collection of public geophysical, geochemical and geological precompetitivegeoscience data. However, this was tempered by their concerns regarding regolith (and vegetation)cover on a signal measured from only the top 100 µm of the surface, which was (is) a prevailing viewthat remote sensing would only be valuable in well-exposed areas such as Panorama and not therest of Australia where “seeing through” vegetation, regolith and transported cover is imperative forsuccessful exploration. Tackling this “cover” challenge was the impetus for the Kalgoorlie MERIWAM370 project (see Section 2.9).
Finally, the vegetation-mineral mixing problem highlighted at Panorama (Figure 7b) has sincebeen tackled using a variety of techniques [85,89] and now implemented in the generation of seamless3D mineral mapping products from drill core, surface and remote sensing data (See 3D MineralMapping project in Section 2.12).
2.8. SEBASS Airborne Passive Hyperspectral TIR Imaging—Yerington Nevada Porphyry–Skarn System
2.8.1. Background
In early 1999, CSIRO was approached by Aerospace Corporation to assist with geological trialsof their airborne, liquid helium cooled, mid-infrared (MIR; 3000–5000 nm) and TIR hyperspectralimaging system called SEBASS [90]. Both of the SEBASSS MIR and TIR wavelength modulescomprise 128 by 128-pixel detector arrays with the TIR module (also called long-wave infraredor LWIR) spanning the wavelength region between 7500 and 13,600 µm. The ensuing collaborativeairborne campaign in September 1999 included the Yerington (Nevada) porphyry–epithermal–skarnsystem (Figure 8a), which was chosen because: (i) it comprised a well-exposed cross section througha porphyry–skarn–epithermal alteration mineral system with related chemical variations in garnetsand feldspars [91,92]; and (ii) it had a history as a remote sensing geological test site [93,94].CSIRO established an industry collaboration project which involved Aerospace Corporation as wellas a number of mining companies, ERSDAC (Japan) and HVC and examined not just SEBASS butalso the complementary role of the TIR with VNIR–SWIR using hyperspectral HyMap and (highaltitude) AVIRIS data. Key TIR results showed that the compositions of both plagioclase feldsparNa–Ca chemistry [95] and the Fe–Al chemistry of Ca-rich series of garnets (grandites) could bemeasured and mapped [96,97]. Here we focus on garnet chemistry mapping and its role in definingalteration footprints.
2.8.2. Garnet-Skarn Fe–Al Composition
Three SEBASS flight-lines intersecting the skarn system at Yerington (Figure 8f) were pre-processedto generate apparent emissivity [96]. Selected SEBASS emissivity pixel spectra (Figure 8b) matchassociated field MicroFTIR™ emissivity spectra (Figure 8c), both of which showing diagnostic spectral

Geosciences 2016, 6, 52 19 of 48
features of garnets with different Fe–Al compositions (Figure 8d,e). However, the apparent emissivitycontrast of the airborne spectral features (~0.9 to 1.0) is much less compared to that of the fieldspectra (~0.4 to 1.0), presumably because of uncorrected down-welling radiance effecting the airbornesignatures. Nevertheless, the spectral shape is itself sufficient for mapping the garnet composition,such as the wavelength position of the garnet emissivity peak near 11,400 nm. Comparisons of thispeak wavelength position versus: (i) the XRD d-spacing for the garnet 420 hkl peak (Figure 8d); and(ii) electron-microprobe analyses of the Fe and Al contents of garnet grains (Figure 8e), show significantcorrelations. That is increasing wavelength of the garnet 11,400 nm emissivity peak is proportional tothe Fe/((Fe + Al) content of the almandine-grossular solid solution series.
The wavelength position of 11,400 nm garnet peak (~garnet Fe–Al composition) in theSEBASS apparent emissivity data was measured using the first derivative of a fitted fourth-orderpolynomial between 11,000 and 12,000 nm (note that carbonates also have a narrow trough at thesewavelengths—i.e., potential mixing problem), which was then masked to include only those pixels witha 11,400 nm peak. The resultant garnet Fe–Al composition map (Figure 8a) is validated using: (i) fieldsample emissivity data (color coded dots in Figure 8a), which were processed the same way as theSEBASS data; and (ii) a published garnet composition map (Figure 8f) [98], which was generated usinglaboratory electron-microprobe analyses of an extensive suite of field samples [91]. Importantly allthree datasets show that Fe-rich garnet (almandine) is centered over Cu mineralization at CastingCopper and Douglas Hill mines whereas Al-rich garnet (~grossular) is distal (1–4 km away) fromCu mineralization.
Geosciences 2016, 6, 52 19 of 48
significant correlations. That is increasing wavelength of the garnet 11,400 nm emissivity peak is proportional to the Fe/((Fe + Al) content of the almandine-grossular solid solution series.
The wavelength position of 11,400 nm garnet peak (~ garnet Fe–Al composition) in the SEBASS apparent emissivity data was measured using the first derivative of a fitted fourth-order polynomial between 11,000 and 12,000 nm (note that carbonates also have a narrow trough at these wavelengths—i.e., potential mixing problem), which was then masked to include only those pixels with a 11,400 nm peak. The resultant garnet Fe–Al composition map (Figure 8a) is validated using: (i) field sample emissivity data (color coded dots in Figure 8a), which were processed the same way as the SEBASS data; and (ii) a published garnet composition map (Figure 8f) [98], which was generated using laboratory electron-microprobe analyses of an extensive suite of field samples [91]. Importantly all three datasets show that Fe-rich garnet (almandine) is centered over Cu mineralization at Casting Copper and Douglas Hill mines whereas Al-rich garnet (~grossular) is distal (1–4 km away) from Cu mineralization.
Figure 8. Garnet composition results for the Yerington copper porphyry–skarn system, Nevada, USA. Approximate scene center −38.9544° latitude −119.2669° longitude. (a) Airborne SEBASS TIR image of garnet Fe–Al chemistry based on the wavelength of the 10,600 nm emissivity peak. Similarly processed field validation data; (b) Selected SEBASS pixel spectra showing evidence of Ca-rich garnets (grandite); (c) Selected field MicroFTIR™ spectra of grandite-rich rocks from (a); (d) Scatter-grams of laboratory electron-microprobe (Fe–Al) analyses and (e) XRD 2D spacing of the garnet 420 hkl peak versus the MicroFTIR 10.6 µm peak wavelength position of field samples ranging in composition from andradite to grossular garnets sampled from (a); (f) Map of the andradite component (Fe) of the garnet composition based on published electron-microprobe analyses of field samples [98].
These results shown that remote hyperspectral TIR sensing can be used as an exploration tool for measuring and mapping garnet Fe–Al compositional gradients and potentially the physicochemical evolution and pathways of related mineralizing fluids from a porphyry-magmatic source rocks (e.g., interpreted black dashed lines—Figure 8f). At Yerington, this fluid pathway is further revealed using both: (i) TIR derived plagioclase Na–Ca chemistry that delineates a zone of albite (pink polygon in Figure 8a) [96]; and (ii) SWIR-2 derived chlorite Mg# number (green polygon in Figure 8a). That is, the combined spectral mineral information indicates that the hydrothermal mineralizing fluids were relatively rich Fe, Na, Si and Al as well as Cu and that these were focused along fluid paths and sourced from the neighboring Yerington batholith (Figure 8c).
Figure 8. Garnet composition results for the Yerington copper porphyry–skarn system, Nevada, USA.Approximate scene center−38.9544◦ latitude−119.2669◦ longitude. (a) Airborne SEBASS TIR image ofgarnet Fe–Al chemistry based on the wavelength of the 10,600 nm emissivity peak. Similarly processedfield validation data; (b) Selected SEBASS pixel spectra showing evidence of Ca-rich garnets (grandite);(c) Selected field MicroFTIR™ spectra of grandite-rich rocks from (a); (d) Scatter-grams of laboratoryelectron-microprobe (Fe–Al) analyses and (e) XRD 2D spacing of the garnet 420 hkl peak versus theMicroFTIR 10.6 µm peak wavelength position of field samples ranging in composition from andradite togrossular garnets sampled from (a); (f) Map of the andradite component (Fe) of the garnet compositionbased on published electron-microprobe analyses of field samples [98].
These results shown that remote hyperspectral TIR sensing can be used as an exploration tool formeasuring and mapping garnet Fe–Al compositional gradients and potentially the physicochemical
Geosciences 2016, 6, 52 20 of 48
evolution and pathways of related mineralizing fluids from a porphyry-magmatic source rocks (e.g.,interpreted black dashed lines—Figure 8f). At Yerington, this fluid pathway is further revealed usingboth: (i) TIR derived plagioclase Na–Ca chemistry that delineates a zone of albite (pink polygon inFigure 8a) [96]; and (ii) SWIR-2 derived chlorite Mg# number (green polygon in Figure 8a). That is,the combined spectral mineral information indicates that the hydrothermal mineralizing fluids wererelatively rich Fe, Na, Si and Al as well as Cu and that these were focused along fluid paths andsourced from the neighboring Yerington batholith (Figure 8c).
2.8.3. Project Postscript
There have been airborne trials of other TIR systems at Yerington, including ITRES’s 32 channelairborne TASI-600 imaging system. CSIRO’s evaluation of this system is found in the SupplementaryDocument 1 which shows that Fe–Al garnet composition is also measurable with TASI-600, eventhough this system has a spectral resolution (~100 nm) less than half that of SEBASS and without thesystem being cooled in liquid helium.
A CSIRO TIR study [99] of garnet skarn associated with at the Candelaria Iron Oxide CopperGold (IOCG) deposit in Chile showed a similar pattern in field sample Fe–Al garnet compositions.However, even though the garnet skarn was detectable using ASTER’s TIR bands (B12/B13), its limitedspectral resolution (~500 nm) is insufficient for measurement of garnet Fe–Al information.
2.9. MERIWA M370—Regolith, Geology and Alteration Mineral Maps from New Generation Airborne andSatellite Remote Sensing Technologies
2.9.1. Background
This collaborative project aimed to assess whether remote mineral mapping technologies, such asthe airborne HyMap system, can provide new and valuable information for exploration in a coveredenvironment where deep regolith and transported materials are common challenges. The Kalgoorliearea was chosen for this task both because of its extensive cover that obscures underlying fresh rockand the high exploration interest of this region based on its rich history of gold endowment. Prior tothe project start, there was considerable skepticism from the resource community that remote mineralmapping of this region would provide any value.
In 2004 and with the support of MERIWA, the Geological Survey of Western Australia (GSWA), theCooperative Research Centre for Landscape Evolution and Mineral Exploration (CRC-LEME), HVCand industry, the collaborative M370 project began with the main aims of: (i) collecting airbornehyperspectral VNIR–SWIR data at 5 m pixel resolution over an entire 1:100,000 scale standardmap-sheet (Kalgoorlie-Kanowna special map-sheet; Figure 9; area of 2500 km2), (ii) generatinga derived suite of validated mineral products suitable for mapping transported versus in situ weatheredmaterials and fresh rock metasomatic alteration footprints; and (iii) testing whether this informationprovides any useful information for characterization of the regolith cover and mapping any evidence ofalteration footprints through this cover. This need for better tools to improve the characterization of theregolith and to detect any alteration footprints is now central to Australia’s UNCOVER initiative [37].
The Kalgoorlie-Kanowna 1:100,000 scale map-sheet was also selected because a new digitalregolith map was being generated for this area by the GSWA and thus could prove useful forcomparison. Similarly, an exploration-mining company had been conducting extensive drilling acrossthis area for which they were measuring PIMA-II spectra of the bottom-of-hole “fresh rock” samplesto extract white mica 2200 nm wavelength information to help define local-regional metasomaticalteration patterns. The same company had discounted any value in obtaining this information fromhigher up in the regolith profile, especially from remote sensing systems.
Twenty-six flight-lines of HyMap™ imagery were collected in May 2004 over theKalgoorlie-Kanowna 1:100,000 scale map-sheet, some under poor weather conditions, includingextensive thin (stratus) cloud and wet ground, which were unavoidable during the contracted airborne

Geosciences 2016, 6, 52 21 of 48
survey period. The processing methods, validation of mineral products and geological case historiesgenerated from these data are described in the M370 final report [100]. Three geological issuesare examined here, namely: (i) the mapping of transported versus weathered in situ materials;(ii) the persistence of white mica information through the weathered profile; and (iii) the explorationsignificance of surface white mica patterns.Geosciences 2016, 6, 52 21 of 48
Figure 9. Regolith mineralogy of the Kalgoorlie region, Western Australia, spanning a 2500 km2 area (26 airborne flight-lines @ 5 m pixel resolution) centered over Kalgoorlie city [100]. (a) Airborne HyMap™ (~2005) image of kaolin disorder based on the relative continuum-depths of the 2160 nm and 2200 nm absorption (well-ordered kaolin is a warmer color) masked to include only those pixels that show these kaolin features together with similarly processed field sample spectral data (colored dots); (b) Published regolith map showing only depositional (transported) versus in situ units together with the locations of the Superpit (Figure 6) and Binduli (Figure 10); (c) Selected airborne HyMap™ pixel and the United States Geological Survey (USGS) mineral library spectra of samples rich in kaolin of different disorder (crystallinity); (d) Scatter-gram of ASD spectra of kaolin-rich field samples comparing the depth of the 2160 nm depth measured at 8 nm versus at 18 nm spectral resolution; (e) Field sample data comparing the continuum-depth of the 2160 nm absorption versus laboratory XRD data processed using Partial Least Squares (PLS) to predict this same spectral feature.
2.9.2. Mapping Transported Versus In Situ Materials
Using a regolith spectral-mineral model (Figure 1c), transported materials can in theory be recognized by the development of poorly-ordered kaolin whereas weathered in situ felsic, intermediate and mafic rocks can be recognized by well-ordered kaolin. This change in kaolin disorder was measured spectrally in the SWIR-2 using the relative intensity of the 2160 and 2205 nm kaolin absorptions (see USGS SWIR-2 spectra of halloysite (= poorly-ordered) versus kaolinite (= well-ordered) in Figure 9c) [47]. Even though the narrow widths of these absorptions (FWHH <20 nm) [47] are close to the SWIR-2 spectral resolution of HyMap™, continuum-removed HyMap pixel spectra (Figure 9c) show variation in the left-handed asymmetry of the 2200 nm absorption (pink arrow).
The possibility for HyMap™ to measure the relative intensity of the 2160 nm feature was further assessed using field spectra collected with an Analytical Spectral Devices (ASD) Fieldspec Pro of kaolin-rich samples with variable kaolin disorder, which were processed and compared at ~8 nm versus HyMap’s 18 nm spectral resolutions. The results (Figure 9d) show high correlation as does the
Figure 9. Regolith mineralogy of the Kalgoorlie region, Western Australia, spanning a 2500 km2
area (26 airborne flight-lines @ 5 m pixel resolution) centered over Kalgoorlie city [100]. (a) AirborneHyMap™ (~2005) image of kaolin disorder based on the relative continuum-depths of the 2160 nm and2200 nm absorption (well-ordered kaolin is a warmer color) masked to include only those pixels thatshow these kaolin features together with similarly processed field sample spectral data (colored dots);(b) Published regolith map showing only depositional (transported) versus in situ units together withthe locations of the Superpit (Figure 6) and Binduli (Figure 10); (c) Selected airborne HyMap™ pixeland the United States Geological Survey (USGS) mineral library spectra of samples rich in kaolin ofdifferent disorder (crystallinity); (d) Scatter-gram of ASD spectra of kaolin-rich field samples comparingthe depth of the 2160 nm depth measured at 8 nm versus at 18 nm spectral resolution; (e) Field sampledata comparing the continuum-depth of the 2160 nm absorption versus laboratory XRD data processedusing Partial Least Squares (PLS) to predict this same spectral feature.
2.9.2. Mapping Transported Versus In Situ Materials
Using a regolith spectral-mineral model (Figure 1c), transported materials can in theory berecognized by the development of poorly-ordered kaolin whereas weathered in situ felsic, intermediateand mafic rocks can be recognized by well-ordered kaolin. This change in kaolin disorder wasmeasured spectrally in the SWIR-2 using the relative intensity of the 2160 and 2205 nm kaolinabsorptions (see USGS SWIR-2 spectra of halloysite (= poorly-ordered) versus kaolinite (= well-ordered)in Figure 9c) [47]. Even though the narrow widths of these absorptions (FWHH <20 nm) [47] are closeto the SWIR-2 spectral resolution of HyMap™, continuum-removed HyMap pixel spectra (Figure 9c)show variation in the left-handed asymmetry of the 2200 nm absorption (pink arrow).
Geosciences 2016, 6, 52 22 of 48
The possibility for HyMap™ to measure the relative intensity of the 2160 nm feature was furtherassessed using field spectra collected with an Analytical Spectral Devices (ASD) Fieldspec Pro ofkaolin-rich samples with variable kaolin disorder, which were processed and compared at ~8 nmversus HyMap’s 18 nm spectral resolutions. The results (Figure 9d) show high correlation as doesthe depth of the 2160 nm absorption versus XRD measurement of kaolin disorder (Figure 9e) [47,100].That is, HyMap data can in theory be used to gauge kaolin disorder.
The use of remote hyperspectral measurement of kaolin disorder for mapping transported versusin situ materials was tested using HyMap™ for the Kalgoorlie-Kanowna 1:100,000 special map-sheet(Figure 9a). Importantly, the 1:100,000 scale map-sheet of HyMap™ derived kaolin disorder (Figure 9a)is seamless not showing evidence for flight-line boundaries despite some of the data being collectedunder less than ideal conditions [100]. The validation of this map involved convolving laboratoryASD spectra measured from ~200 field samples to simulate the HyMap™ band-pass responses beforeinformation extraction using the MFEM method. The results (colored dots in Figure 9a) show similarspatial information with the processed airborne HyMap™ data. Combined, these results show theeffectiveness of the MFEM method for rapid, accurate, transferable processing of remote sensing data.The accuracy of the HyMap™ kaolin product also means that remote hyperspectral SWIR-2 mappingtechnologies can be used to accurately map transported versus weathered in situ regolith materialsover felsic–mafic rocks.
Using Figure 1, poorly-ordered kaolin (cooler colors) should theoretically map transportedmaterials whereas well-ordered kaolin (warmer colors) should map weathered in situ materials.Comparison of this “measured” map versus the published digital regolith map [101], which wasgenerated using standard field mapping and photo interpretation methods and simplified here toshow only transported (yellow) versus in situ (blue and mauve) materials (Figure 9b) only, revealshigh spatial similarity between the two products.
Note though from Figure 1 that more than just kaolin disorder can be used to help map theregolith. Access to even greater spectral resolution (<10 nm in SWIR-2) remote sensing data will enableeven more detailed mineral-geological information. For example, mapping the nature of weatheredparent rock composition maybe possible through measurement of the 2240 nm Fe-kaolin feature(Figure 1c), which is not well resolved at HyMap’s 18 nm spectral resolution (Figure 9c).
2.9.3. Persistence of Primary Minerals through the Regolith
The possible persistence of fresh rock alteration minerals, such as white mica, upward throughthe regolith profile to the surface (Figure 1) was tested for an area called Binduli (Figure 9b).This area is located approximately 10 km west-southwest (WSW) of Kalgoorlie and comprisesfloat/subcrop of felsic volcaniclastic rocks (white polygons, Figure 10), alluvium/colluvium andlacustrine sediments [102]. The published regolith mapping [101] interpreted this area to be“transitional” between deeply weathered pediment to the north and transported materials in thesouth. Exploration drilling had intersected fresh rock at depths ranging from >60 m to <15 m belowsurface (Figure 10a). The bottom-of-hole fresh rock samples were assayed by the exploration companyfor gold and spectrally measured to capture information regards, for example, white mica 2200 nmabsorption wavelength.
Without the assistance of the company’s drill core information, a white mica 2200 nm absorptionwavelength map was generated from the HyMap™ data (Figure 10b), which was masked to removethose pixels with any kaolin related 2160 nm absorption, i.e., any mixtures of white mica and kaolinwere omitted (black areas). In spite of this heavy first pass masking, the resultant surface white micaimage shows close similarity with the bottom of drill hole “fresh rock” spectral data points (coloreddots). For example, areas of “transported” cover at localities “A” and “B” (Figure 10) show the samewhite mica information at the surface as that found >60 m below in fresh rock.
This highlights the valuable potential of remote measurement and mapping of spectral-mineralogyand the difficultly in generating an accurate map of regolith cover using subjective interpretation
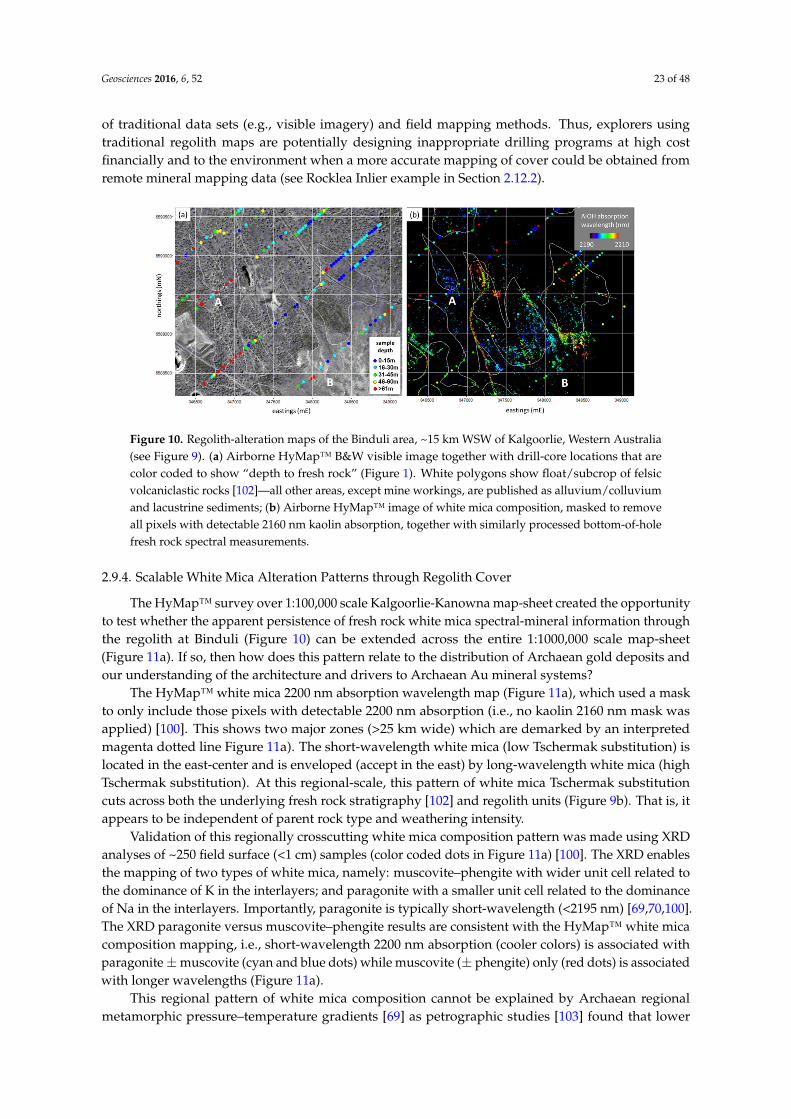
Geosciences 2016, 6, 52 23 of 48
of traditional data sets (e.g., visible imagery) and field mapping methods. Thus, explorers usingtraditional regolith maps are potentially designing inappropriate drilling programs at high costfinancially and to the environment when a more accurate mapping of cover could be obtained fromremote mineral mapping data (see Rocklea Inlier example in Section 2.12.2).Geosciences 2016, 6, 52 23 of 48
Figure 10. Regolith-alteration maps of the Binduli area, ~15 km WSW of Kalgoorlie, Western Australia (see Figure 9). (a) Airborne HyMap™ B&W visible image together with drill-core locations that are color coded to show “depth to fresh rock” (Figure 1). White polygons show float/subcrop of felsic volcaniclastic rocks [102]—all other areas, except mine workings, are published as alluvium/colluvium and lacustrine sediments; (b) Airborne HyMap™ image of white mica composition, masked to remove all pixels with detectable 2160 nm kaolin absorption, together with similarly processed bottom-of-hole fresh rock spectral measurements.
2.9.4. Scalable White Mica Alteration Patterns through Regolith Cover
The HyMap™ survey over 1:100,000 scale Kalgoorlie-Kanowna map-sheet created the opportunity to test whether the apparent persistence of fresh rock white mica spectral-mineral information through the regolith at Binduli (Figure 10) can be extended across the entire 1:1000,000 scale map-sheet (Figure 11a). If so, then how does this pattern relate to the distribution of Archaean gold deposits and our understanding of the architecture and drivers to Archaean Au mineral systems?
The HyMap™ white mica 2200 nm absorption wavelength map (Figure 11a), which used a mask to only include those pixels with detectable 2200 nm absorption (i.e., no kaolin 2160 nm mask was applied) [100]. This shows two major zones (>25 km wide) which are demarked by an interpreted magenta dotted line Figure 11a). The short-wavelength white mica (low Tschermak substitution) is located in the east-center and is enveloped (accept in the east) by long-wavelength white mica (high Tschermak substitution). At this regional-scale, this pattern of white mica Tschermak substitution cuts across both the underlying fresh rock stratigraphy [102] and regolith units (Figure 9b). That is, it appears to be independent of parent rock type and weathering intensity.
Validation of this regionally crosscutting white mica composition pattern was made using XRD analyses of ~250 field surface (<1 cm) samples (color coded dots in Figure 11a) [100]. The XRD enables the mapping of two types of white mica, namely: muscovite–phengite with wider unit cell related to the dominance of K in the interlayers; and paragonite with a smaller unit cell related to the dominance of Na in the interlayers. Importantly, paragonite is typically short-wavelength (<2195 nm) [69,70,100]. The XRD paragonite versus muscovite–phengite results are consistent with the HyMap™ white mica composition mapping, i.e., short-wavelength 2200 nm absorption (cooler colors) is associated with paragonite ± muscovite (cyan and blue dots) while muscovite (± phengite) only (red dots) is associated with longer wavelengths (Figure 11a).
This regional pattern of white mica composition cannot be explained by Archaean regional metamorphic pressure–temperature gradients [69] as petrographic studies [103] found that lower grades (greenschist facies) are associated with short wavelength white mica while higher grades (biotite facies) are associated with long wavelength white mica. This is contrary to the studies that show that increasing metamorphic grade is related to decreasing white mica Tschermak substitution [69].
Figure 10. Regolith-alteration maps of the Binduli area, ~15 km WSW of Kalgoorlie, Western Australia(see Figure 9). (a) Airborne HyMap™ B&W visible image together with drill-core locations that arecolor coded to show “depth to fresh rock” (Figure 1). White polygons show float/subcrop of felsicvolcaniclastic rocks [102]—all other areas, except mine workings, are published as alluvium/colluviumand lacustrine sediments; (b) Airborne HyMap™ image of white mica composition, masked to removeall pixels with detectable 2160 nm kaolin absorption, together with similarly processed bottom-of-holefresh rock spectral measurements.
2.9.4. Scalable White Mica Alteration Patterns through Regolith Cover
The HyMap™ survey over 1:100,000 scale Kalgoorlie-Kanowna map-sheet created the opportunityto test whether the apparent persistence of fresh rock white mica spectral-mineral information throughthe regolith at Binduli (Figure 10) can be extended across the entire 1:1000,000 scale map-sheet(Figure 11a). If so, then how does this pattern relate to the distribution of Archaean gold deposits andour understanding of the architecture and drivers to Archaean Au mineral systems?
The HyMap™ white mica 2200 nm absorption wavelength map (Figure 11a), which used a maskto only include those pixels with detectable 2200 nm absorption (i.e., no kaolin 2160 nm mask wasapplied) [100]. This shows two major zones (>25 km wide) which are demarked by an interpretedmagenta dotted line Figure 11a). The short-wavelength white mica (low Tschermak substitution) islocated in the east-center and is enveloped (accept in the east) by long-wavelength white mica (highTschermak substitution). At this regional-scale, this pattern of white mica Tschermak substitutioncuts across both the underlying fresh rock stratigraphy [102] and regolith units (Figure 9b). That is, itappears to be independent of parent rock type and weathering intensity.
Validation of this regionally crosscutting white mica composition pattern was made using XRDanalyses of ~250 field surface (<1 cm) samples (color coded dots in Figure 11a) [100]. The XRD enablesthe mapping of two types of white mica, namely: muscovite–phengite with wider unit cell related tothe dominance of K in the interlayers; and paragonite with a smaller unit cell related to the dominanceof Na in the interlayers. Importantly, paragonite is typically short-wavelength (<2195 nm) [69,70,100].The XRD paragonite versus muscovite–phengite results are consistent with the HyMap™ white micacomposition mapping, i.e., short-wavelength 2200 nm absorption (cooler colors) is associated withparagonite±muscovite (cyan and blue dots) while muscovite (± phengite) only (red dots) is associatedwith longer wavelengths (Figure 11a).
This regional pattern of white mica composition cannot be explained by Archaean regionalmetamorphic pressure–temperature gradients [69] as petrographic studies [103] found that lower

Geosciences 2016, 6, 52 24 of 48
grades (greenschist facies) are associated with short wavelength white mica while higher grades (biotitefacies) are associated with long wavelength white mica. This is contrary to the studies that show thatincreasing metamorphic grade is related to decreasing white mica Tschermak substitution [69].
Thermodynamic modelling [104] provided a more plausible explanation for the pattern of whitemica composition. This found that REDOX/pH can drive changes in white mica composition, withincreasing alkaline/oxidized conditions producing muscovite then phengite whereas paragonite isdeveloped in acid/reduced conditions (Figure 11b). The thermodynamic modelling also predictedthe development of pyrophyllite in the most acid/reduced conditions (Figure 11b). Even thoughpyrophyllite had not previously been recorded in the Kalgoorlie area, the HyMap™ survey datarevealed clear pyrophyllite spectral signatures (Figure 11c). These include localities such as A andB in Figure 11c, which were subsequently validated by laboratory spectral and XRD analyses offield samples [100]. As predicted by thermodynamic modelling, this spectrally mapped pyrophylliteis located close to (within) the paragonite-bearing zone (i.e., acid/reduced conditions) and not themuscovite–phengite zone (i.e., alkaline/oxidized conditions).
The implications from these results is that spectrally measured white mica composition can beused as a gauge for REDOX/pH gradients and that remote hyperspectral SWIR-2 data has mapped (forthe first time and through cover) very large (>25 km wide, i.e., proportional to the thickness of the crust)hydrothermal cells with contrasting REDOX/pH characteristics. Importantly, gold deposits/camps inthe Kalgoorlie region (white dots and includes the Superpit and Kanowna Belle (X and Y respectively)in Figure 11a) are located at the largest gradients in white mica 2200 nm wavelength, i.e., the reactiveinterface between reduced/acid fluids and alkaline/oxidized fluids/rocks [105]. How these cells relateto the 3D crustal architecture of structural-controlled plumbing systems [106] is currently unclear.
Geosciences 2016, 6, 52 24 of 48
Thermodynamic modelling [104] provided a more plausible explanation for the pattern of white mica composition. This found that REDOX/pH can drive changes in white mica composition, with increasing alkaline/oxidized conditions producing muscovite then phengite whereas paragonite is developed in acid/reduced conditions (Figure 11b). The thermodynamic modelling also predicted the development of pyrophyllite in the most acid/reduced conditions (Figure 11b). Even though pyrophyllite had not previously been recorded in the Kalgoorlie area, the HyMap™ survey data revealed clear pyrophyllite spectral signatures (Figure 11c). These include localities such as A and B in Figure 11c, which were subsequently validated by laboratory spectral and XRD analyses of field samples [100]. As predicted by thermodynamic modelling, this spectrally mapped pyrophyllite is located close to (within) the paragonite-bearing zone (i.e., acid/reduced conditions) and not the muscovite–phengite zone (i.e., alkaline/oxidized conditions).
The implications from these results is that spectrally measured white mica composition can be used as a gauge for REDOX/pH gradients and that remote hyperspectral SWIR-2 data has mapped (for the first time and through cover) very large (>25 km wide, i.e., proportional to the thickness of the crust) hydrothermal cells with contrasting REDOX/pH characteristics. Importantly, gold deposits/camps in the Kalgoorlie region (white dots and includes the Superpit and Kanowna Belle (X and Y respectively) in Figure 11a) are located at the largest gradients in white mica 2200 nm wavelength, i.e., the reactive interface between reduced/acid fluids and alkaline/oxidized fluids/rocks [105]. How these cells relate to the 3D crustal architecture of structural-controlled plumbing systems [106] is currently unclear.
Figure 11. Alteration mineralogy of the Kalgoorlie region, Western Australia, spanning a 50 × 50 km area (25 airborne HyMap™ flight-lines @ 5 m pixel resolution) centered over Kalgoorlie city. (a) Airborne HyMap™ (~2005) derived image of white mica composition based on the wavelength minimum (first derivative of a fitted fourth-order polynomial) of the continuum-removed 2200 nm absorption between 2120 and 2250 nm and masked to only include pixels with a detectable 2200 nm absorption. X marks the Superpit and Y is Kanowna Belle gold mines; (b) Predicted mineral suite with changing pH and REDOX [104] at greenschist facies. Note prediction paragonite and pyrophyllite in more acid/reduced conditions; (c) Selected HyMap™ pixel spectra and USGS library spectra showing the diagnostic major absorption feature at 2160 nm and minor one at 2320 nm for pyrophyllite.
Figure 11. Alteration mineralogy of the Kalgoorlie region, Western Australia, spanning a 50 × 50 kmarea (25 airborne HyMap™ flight-lines @ 5 m pixel resolution) centered over Kalgoorlie city.(a) Airborne HyMap™ (~2005) derived image of white mica composition based on the wavelengthminimum (first derivative of a fitted fourth-order polynomial) of the continuum-removed 2200 nmabsorption between 2120 and 2250 nm and masked to only include pixels with a detectable 2200 nmabsorption. X marks the Superpit and Y is Kanowna Belle gold mines; (b) Predicted mineral suite withchanging pH and REDOX [104] at greenschist facies. Note prediction paragonite and pyrophyllite inmore acid/reduced conditions; (c) Selected HyMap™ pixel spectra and USGS library spectra showingthe diagnostic major absorption feature at 2160 nm and minor one at 2320 nm for pyrophyllite.
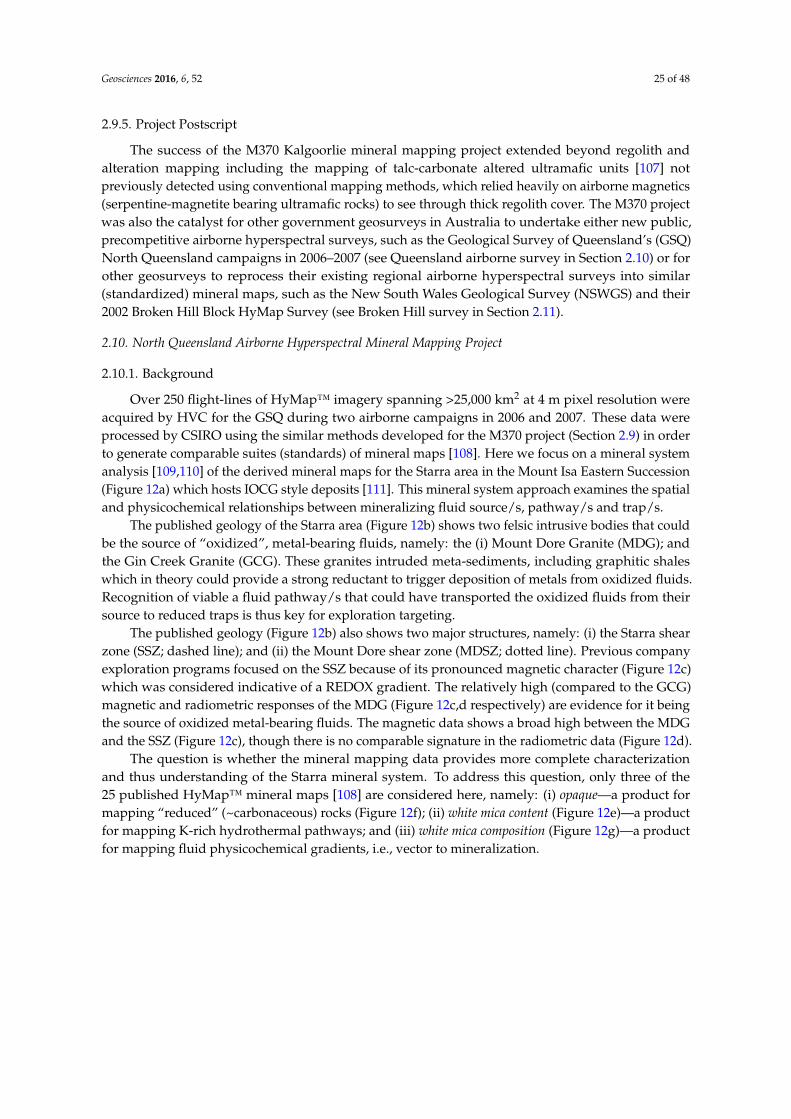
Geosciences 2016, 6, 52 25 of 48
2.9.5. Project Postscript
The success of the M370 Kalgoorlie mineral mapping project extended beyond regolith andalteration mapping including the mapping of talc-carbonate altered ultramafic units [107] notpreviously detected using conventional mapping methods, which relied heavily on airborne magnetics(serpentine-magnetite bearing ultramafic rocks) to see through thick regolith cover. The M370 projectwas also the catalyst for other government geosurveys in Australia to undertake either new public,precompetitive airborne hyperspectral surveys, such as the Geological Survey of Queensland’s (GSQ)North Queensland campaigns in 2006–2007 (see Queensland airborne survey in Section 2.10) or forother geosurveys to reprocess their existing regional airborne hyperspectral surveys into similar(standardized) mineral maps, such as the New South Wales Geological Survey (NSWGS) and their2002 Broken Hill Block HyMap Survey (see Broken Hill survey in Section 2.11).
2.10. North Queensland Airborne Hyperspectral Mineral Mapping Project
2.10.1. Background
Over 250 flight-lines of HyMap™ imagery spanning >25,000 km2 at 4 m pixel resolution wereacquired by HVC for the GSQ during two airborne campaigns in 2006 and 2007. These data wereprocessed by CSIRO using the similar methods developed for the M370 project (Section 2.9) in orderto generate comparable suites (standards) of mineral maps [108]. Here we focus on a mineral systemanalysis [109,110] of the derived mineral maps for the Starra area in the Mount Isa Eastern Succession(Figure 12a) which hosts IOCG style deposits [111]. This mineral system approach examines the spatialand physicochemical relationships between mineralizing fluid source/s, pathway/s and trap/s.
The published geology of the Starra area (Figure 12b) shows two felsic intrusive bodies that couldbe the source of “oxidized”, metal-bearing fluids, namely: the (i) Mount Dore Granite (MDG); andthe Gin Creek Granite (GCG). These granites intruded meta-sediments, including graphitic shaleswhich in theory could provide a strong reductant to trigger deposition of metals from oxidized fluids.Recognition of viable a fluid pathway/s that could have transported the oxidized fluids from theirsource to reduced traps is thus key for exploration targeting.
The published geology (Figure 12b) also shows two major structures, namely: (i) the Starra shearzone (SSZ; dashed line); and (ii) the Mount Dore shear zone (MDSZ; dotted line). Previous companyexploration programs focused on the SSZ because of its pronounced magnetic character (Figure 12c)which was considered indicative of a REDOX gradient. The relatively high (compared to the GCG)magnetic and radiometric responses of the MDG (Figure 12c,d respectively) are evidence for it beingthe source of oxidized metal-bearing fluids. The magnetic data shows a broad high between the MDGand the SSZ (Figure 12c), though there is no comparable signature in the radiometric data (Figure 12d).
The question is whether the mineral mapping data provides more complete characterizationand thus understanding of the Starra mineral system. To address this question, only three of the25 published HyMap™ mineral maps [108] are considered here, namely: (i) opaque—a product formapping “reduced” (~carbonaceous) rocks (Figure 12f); (ii) white mica content (Figure 12e)—a productfor mapping K-rich hydrothermal pathways; and (iii) white mica composition (Figure 12g)—a productfor mapping fluid physicochemical gradients, i.e., vector to mineralization.
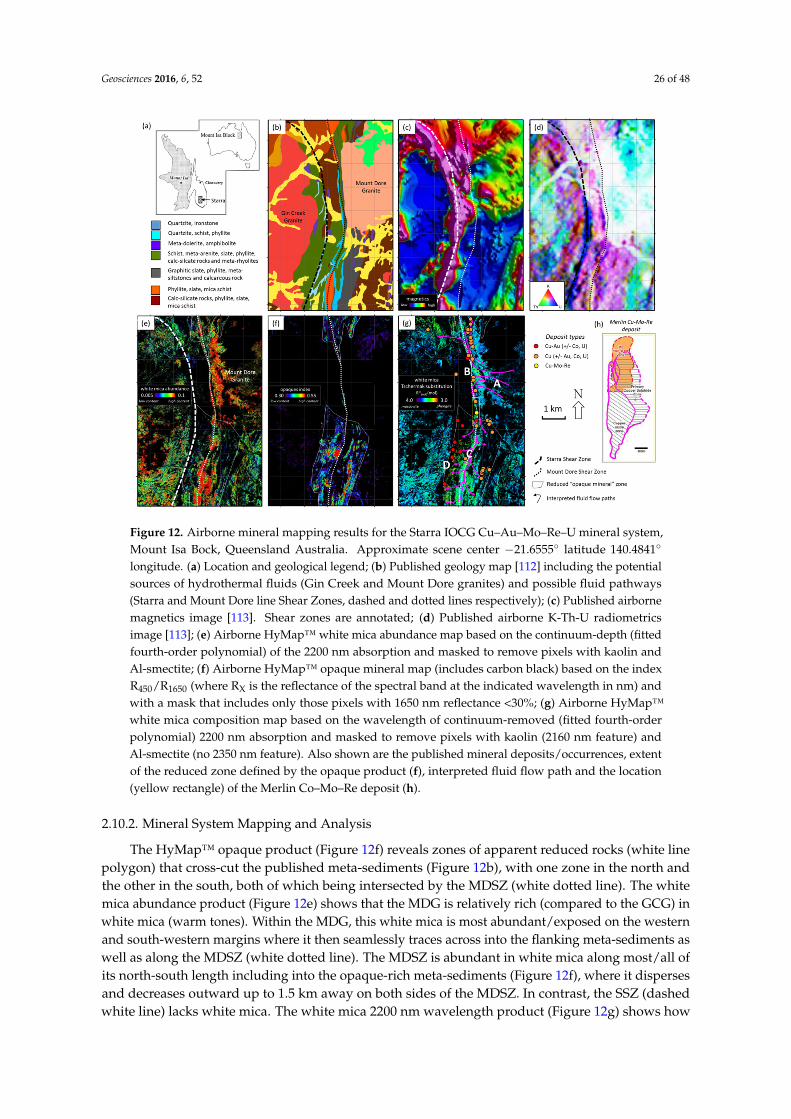
Geosciences 2016, 6, 52 26 of 48Geosciences 2016, 6, 52 26 of 48
Figure 12. Airborne mineral mapping results for the Starra IOCG Cu–Au–Mo–Re–U mineral system, Mount Isa Bock, Queensland Australia. Approximate scene center −21.6555° latitude 140.4841° longitude. (a) Location and geological legend; (b) Published geology map [112] including the potential sources of hydrothermal fluids (Gin Creek and Mount Dore granites) and possible fluid pathways (Starra and Mount Dore line Shear Zones, dashed and dotted lines respectively); (c) Published airborne magnetics image [113]. Shear zones are annotated; (d) Published airborne K-Th-U radiometrics image [113]; (e) Airborne HyMap™ white mica abundance map based on the continuum-depth (fitted fourth-order polynomial) of the 2200 nm absorption and masked to remove pixels with kaolin and Al-smectite; (f) Airborne HyMap™ opaque mineral map (includes carbon black) based on the index R450/R1650 (where RX is the reflectance of the spectral band at the indicated wavelength in nm) and with a mask that includes only those pixels with 1650 nm reflectance <30%; (g) Airborne HyMap™ white mica composition map based on the wavelength of continuum-removed (fitted fourth-order polynomial) 2200 nm absorption and masked to remove pixels with kaolin (2160 nm feature) and Al-smectite (no 2350 nm feature). Also shown are the published mineral deposits/occurrences, extent of the reduced zone defined by the opaque product (f), interpreted fluid flow path and the location (yellow rectangle) of the Merlin Co–Mo–Re deposit (h).
2.10.2. Mineral System Mapping and Analysis
The HyMap™ opaque product (Figure 12f) reveals zones of apparent reduced rocks (white line polygon) that cross-cut the published meta-sediments (Figure 12b), with one zone in the north and the other in the south, both of which being intersected by the MDSZ (white dotted line). The white mica abundance product (Figure 12e) shows that the MDG is relatively rich (compared to the GCG) in white mica (warm tones). Within the MDG, this white mica is most abundant/exposed on the western and south-western margins where it then seamlessly traces across into the flanking meta-sediments as well as along the MDSZ (white dotted line). The MDSZ is abundant in white mica along most/all of its north-south length including into the opaque-rich meta-sediments (Figure 12f), where it disperses and decreases outward up to 1.5 km away on both sides of the MDSZ. In contrast, the SSZ (dashed white line) lacks white mica. The white mica 2200 nm wavelength product (Figure 12g)
Figure 12. Airborne mineral mapping results for the Starra IOCG Cu–Au–Mo–Re–U mineral system,Mount Isa Bock, Queensland Australia. Approximate scene center −21.6555◦ latitude 140.4841◦
longitude. (a) Location and geological legend; (b) Published geology map [112] including the potentialsources of hydrothermal fluids (Gin Creek and Mount Dore granites) and possible fluid pathways(Starra and Mount Dore line Shear Zones, dashed and dotted lines respectively); (c) Published airbornemagnetics image [113]. Shear zones are annotated; (d) Published airborne K-Th-U radiometricsimage [113]; (e) Airborne HyMap™ white mica abundance map based on the continuum-depth (fittedfourth-order polynomial) of the 2200 nm absorption and masked to remove pixels with kaolin andAl-smectite; (f) Airborne HyMap™ opaque mineral map (includes carbon black) based on the indexR450/R1650 (where RX is the reflectance of the spectral band at the indicated wavelength in nm) andwith a mask that includes only those pixels with 1650 nm reflectance <30%; (g) Airborne HyMap™white mica composition map based on the wavelength of continuum-removed (fitted fourth-orderpolynomial) 2200 nm absorption and masked to remove pixels with kaolin (2160 nm feature) andAl-smectite (no 2350 nm feature). Also shown are the published mineral deposits/occurrences, extentof the reduced zone defined by the opaque product (f), interpreted fluid flow path and the location(yellow rectangle) of the Merlin Co–Mo–Re deposit (h).
2.10.2. Mineral System Mapping and Analysis
The HyMap™ opaque product (Figure 12f) reveals zones of apparent reduced rocks (white linepolygon) that cross-cut the published meta-sediments (Figure 12b), with one zone in the north andthe other in the south, both of which being intersected by the MDSZ (white dotted line). The whitemica abundance product (Figure 12e) shows that the MDG is relatively rich (compared to the GCG) inwhite mica (warm tones). Within the MDG, this white mica is most abundant/exposed on the westernand south-western margins where it then seamlessly traces across into the flanking meta-sediments aswell as along the MDSZ (white dotted line). The MDSZ is abundant in white mica along most/all ofits north-south length including into the opaque-rich meta-sediments (Figure 12f), where it dispersesand decreases outward up to 1.5 km away on both sides of the MDSZ. In contrast, the SSZ (dashedwhite line) lacks white mica. The white mica 2200 nm wavelength product (Figure 12g) shows how
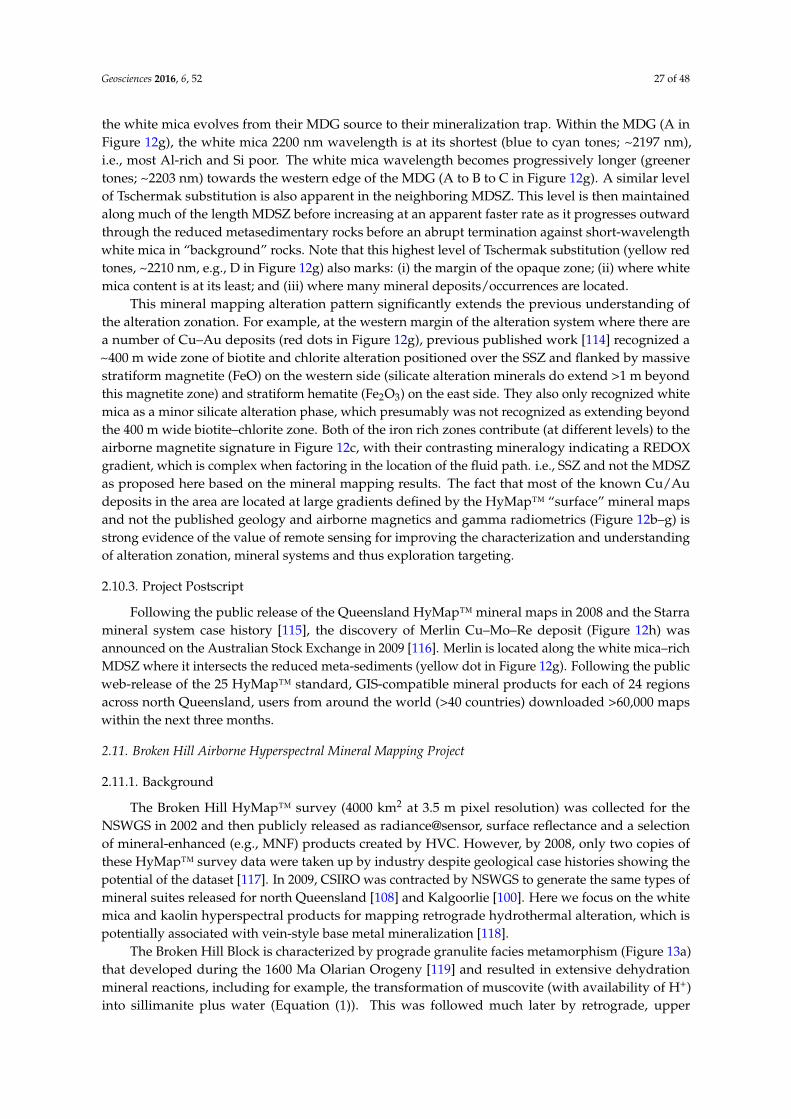
Geosciences 2016, 6, 52 27 of 48
the white mica evolves from their MDG source to their mineralization trap. Within the MDG (A inFigure 12g), the white mica 2200 nm wavelength is at its shortest (blue to cyan tones; ~2197 nm),i.e., most Al-rich and Si poor. The white mica wavelength becomes progressively longer (greenertones; ~2203 nm) towards the western edge of the MDG (A to B to C in Figure 12g). A similar levelof Tschermak substitution is also apparent in the neighboring MDSZ. This level is then maintainedalong much of the length MDSZ before increasing at an apparent faster rate as it progresses outwardthrough the reduced metasedimentary rocks before an abrupt termination against short-wavelengthwhite mica in “background” rocks. Note that this highest level of Tschermak substitution (yellow redtones, ~2210 nm, e.g., D in Figure 12g) also marks: (i) the margin of the opaque zone; (ii) where whitemica content is at its least; and (iii) where many mineral deposits/occurrences are located.
This mineral mapping alteration pattern significantly extends the previous understanding ofthe alteration zonation. For example, at the western margin of the alteration system where there area number of Cu–Au deposits (red dots in Figure 12g), previous published work [114] recognized a~400 m wide zone of biotite and chlorite alteration positioned over the SSZ and flanked by massivestratiform magnetite (FeO) on the western side (silicate alteration minerals do extend >1 m beyondthis magnetite zone) and stratiform hematite (Fe2O3) on the east side. They also only recognized whitemica as a minor silicate alteration phase, which presumably was not recognized as extending beyondthe 400 m wide biotite–chlorite zone. Both of the iron rich zones contribute (at different levels) to theairborne magnetite signature in Figure 12c, with their contrasting mineralogy indicating a REDOXgradient, which is complex when factoring in the location of the fluid path. i.e., SSZ and not the MDSZas proposed here based on the mineral mapping results. The fact that most of the known Cu/Audeposits in the area are located at large gradients defined by the HyMap™ “surface” mineral mapsand not the published geology and airborne magnetics and gamma radiometrics (Figure 12b–g) isstrong evidence of the value of remote sensing for improving the characterization and understandingof alteration zonation, mineral systems and thus exploration targeting.
2.10.3. Project Postscript
Following the public release of the Queensland HyMap™ mineral maps in 2008 and the Starramineral system case history [115], the discovery of Merlin Cu–Mo–Re deposit (Figure 12h) wasannounced on the Australian Stock Exchange in 2009 [116]. Merlin is located along the white mica–richMDSZ where it intersects the reduced meta-sediments (yellow dot in Figure 12g). Following the publicweb-release of the 25 HyMap™ standard, GIS-compatible mineral products for each of 24 regionsacross north Queensland, users from around the world (>40 countries) downloaded >60,000 mapswithin the next three months.
2.11. Broken Hill Airborne Hyperspectral Mineral Mapping Project
2.11.1. Background
The Broken Hill HyMap™ survey (4000 km2 at 3.5 m pixel resolution) was collected for theNSWGS in 2002 and then publicly released as radiance@sensor, surface reflectance and a selectionof mineral-enhanced (e.g., MNF) products created by HVC. However, by 2008, only two copies ofthese HyMap™ survey data were taken up by industry despite geological case histories showing thepotential of the dataset [117]. In 2009, CSIRO was contracted by NSWGS to generate the same types ofmineral suites released for north Queensland [108] and Kalgoorlie [100]. Here we focus on the whitemica and kaolin hyperspectral products for mapping retrograde hydrothermal alteration, which ispotentially associated with vein-style base metal mineralization [118].
The Broken Hill Block is characterized by prograde granulite facies metamorphism (Figure 13a)that developed during the 1600 Ma Olarian Orogeny [119] and resulted in extensive dehydrationmineral reactions, including for example, the transformation of muscovite (with availability of H+)into sillimanite plus water (Equation (1)). This was followed much later by retrograde, upper
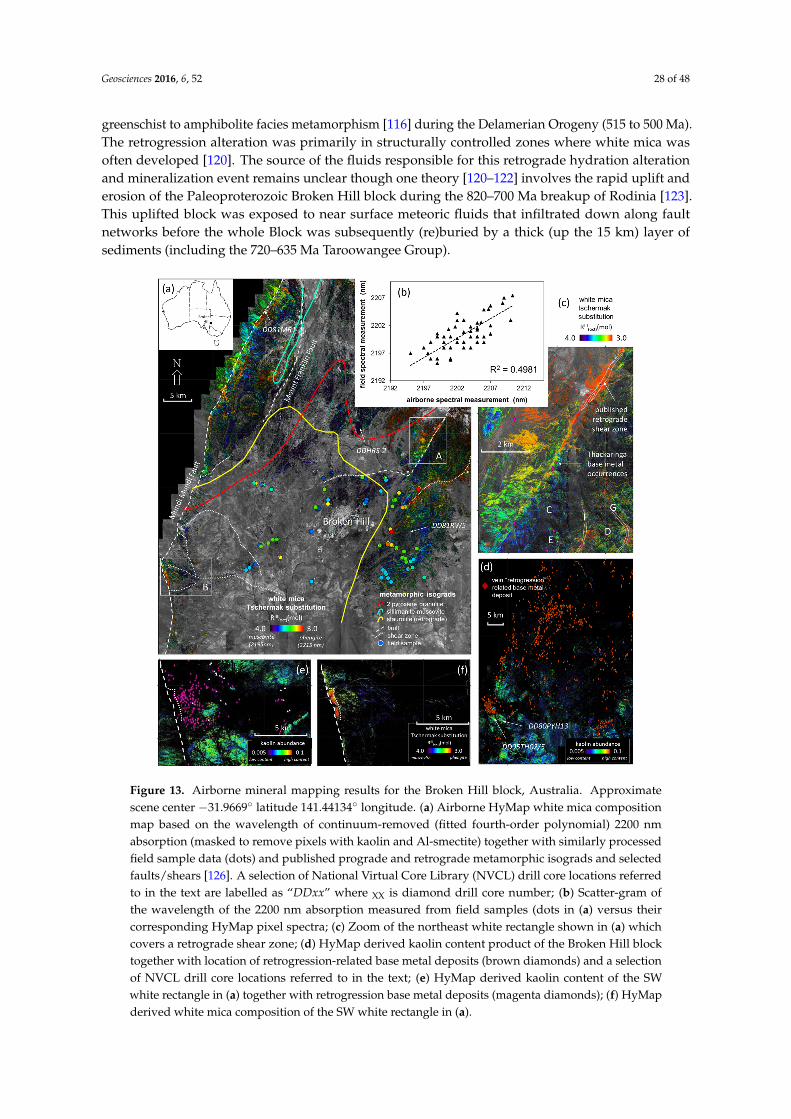
Geosciences 2016, 6, 52 28 of 48
greenschist to amphibolite facies metamorphism [116] during the Delamerian Orogeny (515 to 500 Ma).The retrogression alteration was primarily in structurally controlled zones where white mica wasoften developed [120]. The source of the fluids responsible for this retrograde hydration alterationand mineralization event remains unclear though one theory [120–122] involves the rapid uplift anderosion of the Paleoproterozoic Broken Hill block during the 820–700 Ma breakup of Rodinia [123].This uplifted block was exposed to near surface meteoric fluids that infiltrated down along faultnetworks before the whole Block was subsequently (re)buried by a thick (up the 15 km) layer ofsediments (including the 720–635 Ma Taroowangee Group).
Geosciences 2016, 6, 52 28 of 48
often developed [120]. The source of the fluids responsible for this retrograde hydration alteration and mineralization event remains unclear though one theory [120–122] involves the rapid uplift and erosion of the Paleoproterozoic Broken Hill block during the 820–700 Ma breakup of Rodinia [123]. This uplifted block was exposed to near surface meteoric fluids that infiltrated down along fault networks before the whole Block was subsequently (re)buried by a thick (up the 15 km) layer of sediments (including the 720–635 Ma Taroowangee Group).
Figure 13. Airborne mineral mapping results for the Broken Hill block, Australia. Approximate scene center −31.9669° latitude 141.44134° longitude. (a) Airborne HyMap white mica composition map based on the wavelength of continuum-removed (fitted fourth-order polynomial) 2200 nm absorption (masked to remove pixels with kaolin and Al-smectite) together with similarly processed field sample data (dots) and published prograde and retrograde metamorphic isograds and selected faults/shears [126]. A selection of National Virtual Core Library (NVCL) drill core locations referred to in the text are labelled as “DDxx” where XX is diamond drill core number; (b) Scatter-gram of the wavelength of the 2200 nm absorption measured from field samples (dots in (a) versus their corresponding HyMap pixel spectra; (c) Zoom of the northeast white rectangle shown in (a) which covers a retrograde shear zone; (d) HyMap derived kaolin content product of the Broken Hill block together with location of retrogression-related base metal deposits (brown diamonds) and a selection of NVCL drill core locations referred to in the text; (e) HyMap derived kaolin content of the SW white rectangle in (a) together with retrogression base metal deposits (magenta diamonds); (f) HyMap derived white mica composition of the SW white rectangle in (a).
Figure 13. Airborne mineral mapping results for the Broken Hill block, Australia. Approximatescene center −31.9669◦ latitude 141.44134◦ longitude. (a) Airborne HyMap white mica compositionmap based on the wavelength of continuum-removed (fitted fourth-order polynomial) 2200 nmabsorption (masked to remove pixels with kaolin and Al-smectite) together with similarly processedfield sample data (dots) and published prograde and retrograde metamorphic isograds and selectedfaults/shears [126]. A selection of National Virtual Core Library (NVCL) drill core locations referredto in the text are labelled as “DDxx” where XX is diamond drill core number; (b) Scatter-gram ofthe wavelength of the 2200 nm absorption measured from field samples (dots in (a) versus theircorresponding HyMap pixel spectra; (c) Zoom of the northeast white rectangle shown in (a) whichcovers a retrograde shear zone; (d) HyMap derived kaolin content product of the Broken Hill blocktogether with location of retrogression-related base metal deposits (brown diamonds) and a selectionof NVCL drill core locations referred to in the text; (e) HyMap derived kaolin content of the SWwhite rectangle in (a) together with retrogression base metal deposits (magenta diamonds); (f) HyMapderived white mica composition of the SW white rectangle in (a).
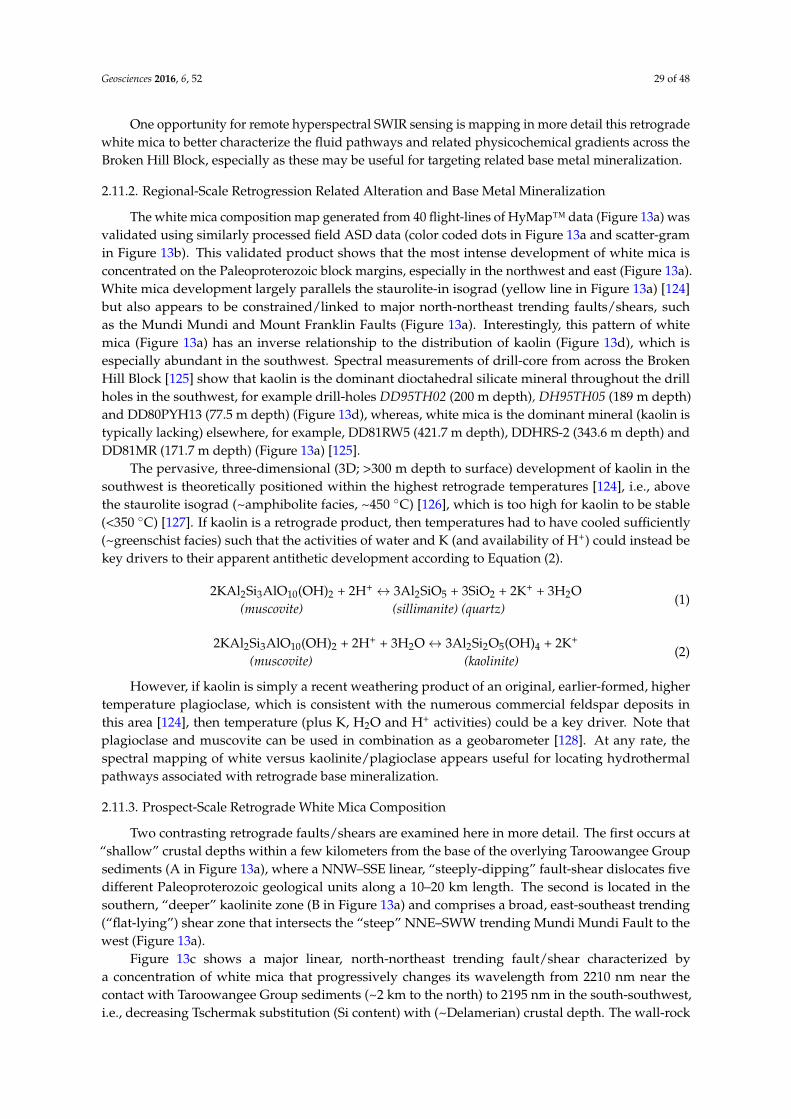
Geosciences 2016, 6, 52 29 of 48
One opportunity for remote hyperspectral SWIR sensing is mapping in more detail this retrogradewhite mica to better characterize the fluid pathways and related physicochemical gradients across theBroken Hill Block, especially as these may be useful for targeting related base metal mineralization.
2.11.2. Regional-Scale Retrogression Related Alteration and Base Metal Mineralization
The white mica composition map generated from 40 flight-lines of HyMap™ data (Figure 13a) wasvalidated using similarly processed field ASD data (color coded dots in Figure 13a and scatter-gramin Figure 13b). This validated product shows that the most intense development of white mica isconcentrated on the Paleoproterozoic block margins, especially in the northwest and east (Figure 13a).White mica development largely parallels the staurolite-in isograd (yellow line in Figure 13a) [124]but also appears to be constrained/linked to major north-northeast trending faults/shears, suchas the Mundi Mundi and Mount Franklin Faults (Figure 13a). Interestingly, this pattern of whitemica (Figure 13a) has an inverse relationship to the distribution of kaolin (Figure 13d), which isespecially abundant in the southwest. Spectral measurements of drill-core from across the BrokenHill Block [125] show that kaolin is the dominant dioctahedral silicate mineral throughout the drillholes in the southwest, for example drill-holes DD95TH02 (200 m depth), DH95TH05 (189 m depth)and DD80PYH13 (77.5 m depth) (Figure 13d), whereas, white mica is the dominant mineral (kaolin istypically lacking) elsewhere, for example, DD81RW5 (421.7 m depth), DDHRS-2 (343.6 m depth) andDD81MR (171.7 m depth) (Figure 13a) [125].
The pervasive, three-dimensional (3D; >300 m depth to surface) development of kaolin in thesouthwest is theoretically positioned within the highest retrograde temperatures [124], i.e., abovethe staurolite isograd (~amphibolite facies, ~450 ◦C) [126], which is too high for kaolin to be stable(<350 ◦C) [127]. If kaolin is a retrograde product, then temperatures had to have cooled sufficiently(~greenschist facies) such that the activities of water and K (and availability of H+) could instead bekey drivers to their apparent antithetic development according to Equation (2).
2KAl2Si3AlO10(OH)2 + 2H+ ↔ 3Al2SiO5 + 3SiO2 + 2K+ + 3H2O(muscovite) (sillimanite) (quartz)
(1)
2KAl2Si3AlO10(OH)2 + 2H+ + 3H2O↔ 3Al2Si2O5(OH)4 + 2K+
(muscovite) (kaolinite)(2)
However, if kaolin is simply a recent weathering product of an original, earlier-formed, highertemperature plagioclase, which is consistent with the numerous commercial feldspar deposits inthis area [124], then temperature (plus K, H2O and H+ activities) could be a key driver. Note thatplagioclase and muscovite can be used in combination as a geobarometer [128]. At any rate, thespectral mapping of white versus kaolinite/plagioclase appears useful for locating hydrothermalpathways associated with retrograde base mineralization.
2.11.3. Prospect-Scale Retrograde White Mica Composition
Two contrasting retrograde faults/shears are examined here in more detail. The first occurs at“shallow” crustal depths within a few kilometers from the base of the overlying Taroowangee Groupsediments (A in Figure 13a), where a NNW–SSE linear, “steeply-dipping” fault-shear dislocates fivedifferent Paleoproterozoic geological units along a 10–20 km length. The second is located in thesouthern, “deeper” kaolinite zone (B in Figure 13a) and comprises a broad, east-southeast trending(“flat-lying”) shear zone that intersects the “steep” NNE–SWW trending Mundi Mundi Fault to thewest (Figure 13a).
Figure 13c shows a major linear, north-northeast trending fault/shear characterized bya concentration of white mica that progressively changes its wavelength from 2210 nm near thecontact with Taroowangee Group sediments (~2 km to the north) to 2195 nm in the south-southwest,i.e., decreasing Tschermak substitution (Si content) with (~Delamerian) crustal depth. The wall-rock

Geosciences 2016, 6, 52 30 of 48
of this area (e.g., C and D, Figure 13c) is characterized by the pervasive development of white micawhich typically has a shorter wavelength compared with the closest retrograde shears/faults (e.g., E, Fand G in Figure 13c), which all show topographic low expression.
Importantly, all of the published occurrences of retrogression-related base metal occurrences(magenta diamonds) are located along zones of longer wavelength white mica, some of which have notbeen interpreted as faults/shears by previous mapping (e.g., E in Figure 13c). These mineral mappingresults are interpreted as follows: (i) early white mica formation in near surface crustal wall rockswith little fluid movement/evolution and no association with mineralization; and (ii) later white micadevelopment in zone/shears focusing significant fluids that progressively lost Si and with associatedbase metal mineralization (Figure 13d).
Figure 13f shows a >5 km wide, triangular-shaped zone of white mica zone (B in Figure 13a)that cross-cuts kaolin-rich wallrock (Figure 13e) and intersects numerous retrogression base metaloccurrences (magenta diamonds). This white mica decreases its level of Tschermak substitutioneastward (Figure 13f) away from the Mundi Mundi Fault (dashed white line) which it abuts/intersectsto the west and is interpreted as the source (originating pathway) of the mineralizing fluids. In detail,these base metal occurrences are located in a zone of moderate levels of white mica Tschermaksubstitution (green to yellow) but not within the highest levels as seen within the zone ~1 km from theMundi Mundi Fault (white dotted line in Figure 13d,e). This is also consistent with the results shown inFigure 13c and suggests that base metal precipitation required some change in fluid physicochemistrybefore metal precipitation, which was also reflected in the level of white mica Tschermak substitution.The precise mechanism for this process is unclear.
2.11.4. Geological and Exploration Implications
The pervasive nature, compositional uniformity and relatively low level of Tschermak-substitutionof white mica developed in wall rocks in the upper parts of the block only is interpreted to have formedby the downward movement of near-surface waters into underlying rocks during the 820–700 Mauplift/erosion and possibly into the 720–635 Ma period of Taroowangee Group sedimentation duringrift basin formation. This water was relatively poor in Si but rich in alkalis. This was followed bySi-rich water, also from above, that moved along faults/shears that (re)activated during the 515 to500 Ma Delamerian Orogeny, with some fluids penetrating along these to much greater depths whereno early-formed white mica was developed in the wall-rocks. This later Si-rich fluid post-dated thestaurolite-in isograd [126] and carried the potentially economic metal budget. The point of precipitationof these metals from solution is linked to a decrease in fluid Si activity.
From these results, the sites/zones of metal deposition can be targeted as follows: (i) eliminatingareas where kaolinite (and abundant plagioclase) are develop from the viable search space; (ii) identifyingzones of locally higher levels of Tschermak substitution compared to the neighboring wall rocks (ifpresent); and (iii) eliminate areas of highest white mica Tschermak substitution (i.e., Si-rich) and insteadfocus on gradients associated with moderate levels of white mica Tschermak substitution.
2.12. Western Australian Centre of Excellence for 3D Mineral Mapping (C3DMM)
2.12.1. Background
C3DMM was a five-year collaborative project supported by State and Federal governmentagencies, industry and technology service organizations. The aim of C3DMM was to generatespectral-mineral mapping capabilities that deliver a web-accessible, scalable, seamless, digital 3Dmineral map of (Western) Australia. This required new methods, including: (i) cross-calibration ofdrill core, field and remote sensing data [129,130]; (ii) unmixing the contribution of both green anddry vegetation from the target mineral information in remote sensing data [89]; and (iii) rigorousvalidation aimed at establishing national geoscience information product standards [131]. Here wefocus on: previously unpublished aspects of (i) the “prospect-scale” Rocklea Inlier iron ore exploration
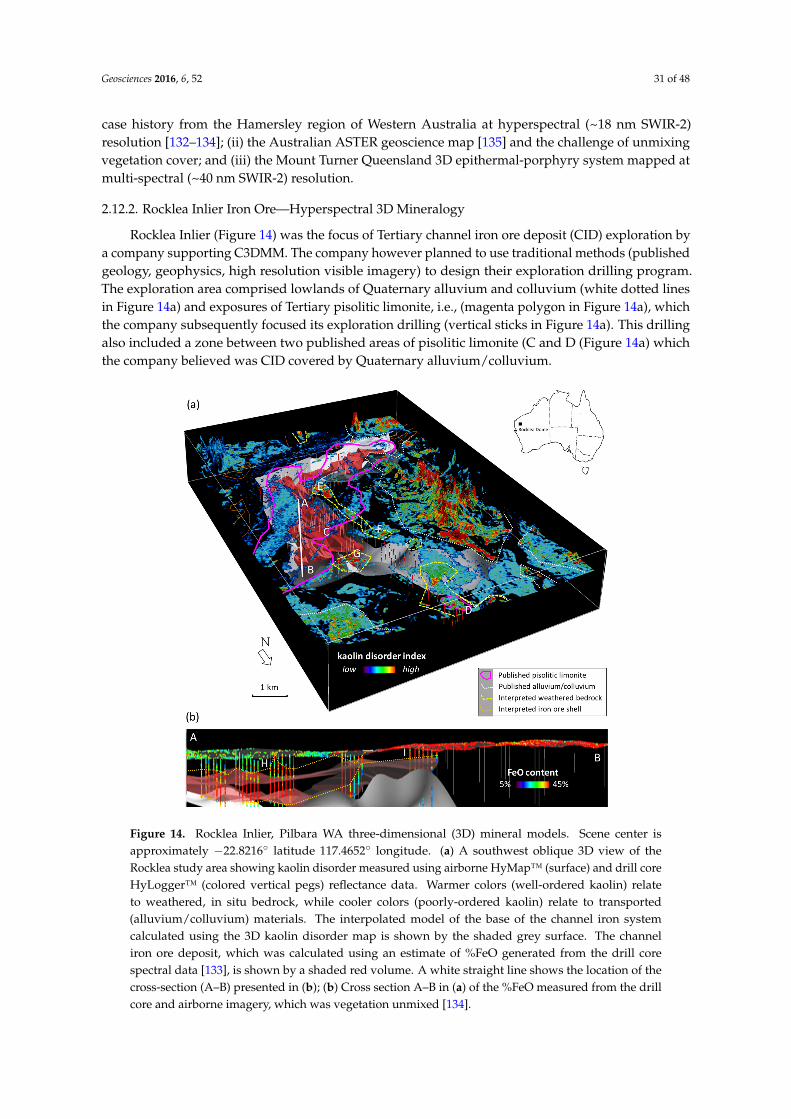
Geosciences 2016, 6, 52 31 of 48
case history from the Hamersley region of Western Australia at hyperspectral (~18 nm SWIR-2)resolution [132–134]; (ii) the Australian ASTER geoscience map [135] and the challenge of unmixingvegetation cover; and (iii) the Mount Turner Queensland 3D epithermal-porphyry system mapped atmulti-spectral (~40 nm SWIR-2) resolution.
2.12.2. Rocklea Inlier Iron Ore—Hyperspectral 3D Mineralogy
Rocklea Inlier (Figure 14) was the focus of Tertiary channel iron ore deposit (CID) exploration bya company supporting C3DMM. The company however planned to use traditional methods (publishedgeology, geophysics, high resolution visible imagery) to design their exploration drilling program.The exploration area comprised lowlands of Quaternary alluvium and colluvium (white dotted linesin Figure 14a) and exposures of Tertiary pisolitic limonite, i.e., (magenta polygon in Figure 14a), whichthe company subsequently focused its exploration drilling (vertical sticks in Figure 14a). This drillingalso included a zone between two published areas of pisolitic limonite (C and D (Figure 14a) whichthe company believed was CID covered by Quaternary alluvium/colluvium.
Geosciences 2016, 6, 52 31 of 48
vegetation cover; and (iii) the Mount Turner Queensland 3D epithermal-porphyry system mapped at multi-spectral (~40 nm SWIR-2) resolution.
2.12.2. Rocklea Inlier Iron Ore—Hyperspectral 3D Mineralogy
Rocklea Inlier (Figure 14) was the focus of Tertiary channel iron ore deposit (CID) exploration by a company supporting C3DMM. The company however planned to use traditional methods (published geology, geophysics, high resolution visible imagery) to design their exploration drilling program. The exploration area comprised lowlands of Quaternary alluvium and colluvium (white dotted lines in Figure 14a) and exposures of Tertiary pisolitic limonite, i.e., (magenta polygon in Figure 14a), which the company subsequently focused its exploration drilling (vertical sticks in Figure 14a). This drilling also included a zone between two published areas of pisolitic limonite (C and D (Figure 14a) which the company believed was CID covered by Quaternary alluvium/colluvium.
Figure 14. Rocklea Inlier, Pilbara WA three-dimensional (3D) mineral models. Scene center is approximately −22.8216° latitude 117.4652° longitude. (a) A southwest oblique 3D view of the Rocklea study area showing kaolin disorder measured using airborne HyMap™ (surface) and drill core HyLogger™ (colored vertical pegs) reflectance data. Warmer colors (well-ordered kaolin) relate to weathered, in situ bedrock, while cooler colors (poorly-ordered kaolin) relate to transported (alluvium/colluvium) materials. The interpolated model of the base of the channel iron system calculated using the 3D kaolin disorder map is shown by the shaded grey surface. The channel iron ore deposit, which was calculated using an estimate of %FeO generated from the drill core spectral data [133], is shown by a shaded red volume. A white straight line shows the location of the cross-section (A–B) presented in (b); (b) Cross section A–B in (a) of the %FeO measured from the drill core and airborne imagery, which was vegetation unmixed [134].
One of the aims of C3DMM was to determine if mineral mapping could provide a more efficient (accurate, faster, cheaper, sustainable) tool for designing an exploration drilling program targeting
Figure 14. Rocklea Inlier, Pilbara WA three-dimensional (3D) mineral models. Scene center isapproximately −22.8216◦ latitude 117.4652◦ longitude. (a) A southwest oblique 3D view of theRocklea study area showing kaolin disorder measured using airborne HyMap™ (surface) and drill coreHyLogger™ (colored vertical pegs) reflectance data. Warmer colors (well-ordered kaolin) relateto weathered, in situ bedrock, while cooler colors (poorly-ordered kaolin) relate to transported(alluvium/colluvium) materials. The interpolated model of the base of the channel iron systemcalculated using the 3D kaolin disorder map is shown by the shaded grey surface. The channeliron ore deposit, which was calculated using an estimate of %FeO generated from the drill corespectral data [133], is shown by a shaded red volume. A white straight line shows the location of thecross-section (A–B) presented in (b); (b) Cross section A–B in (a) of the %FeO measured from the drillcore and airborne imagery, which was vegetation unmixed [134].

Geosciences 2016, 6, 52 32 of 48
One of the aims of C3DMM was to determine if mineral mapping could provide a more efficient(accurate, faster, cheaper, sustainable) tool for designing an exploration drilling program targetingCID in “covered” terrain. Key to this is recognition of weathered in situ Archaean geology persistingthrough either the Tertiary or Quaternary cover sequences as these would constrain the architectureof any economically viable CID system and which may have been missed by conventional regolithmapping methods. Kaolin disorder (Figure 1) was selected as a key mineral mapping product for thistask. Airborne AMS (hyperspectral) imagery was acquired (from the De Beers archive) to deliver thisinformation (ASTER being of insufficient spectral resolution) which was later supplemented by over100 company drill cores that were spectrally (VNIR–SWIR) scanned using a HyLogger™. This enabledthe generation of a suite of 3D mineral products of the CID and its surrounds. The same MFEMinformation extraction methods were applied to both the AMS and HyLogger™ data.
The resultant 3D map of kaolin disorder (Figure 14a) shows well-ordered kaolin (i.e., weathered insitu bedrock) as warmer colors and poorly-ordered kaolin (i.e., transported Tertiary CID or Quaternaryalluvium/colluvium) as cooler colors. Note how the red tops to drill core strings near D and E intersectwarmer colors in the surface AMS results for areas shown (incorrectly) in the published mappingas being “transported” pisolitic limonite. That is, these areas are weathered in situ basement andnot transported Tertiary or Quaternary cover. There are also areas within the published Quaternaryalluvium/colluvium cover that the mineral mapping data reveal as being weathered in situ basement,such as F and G (Figure 14a). The regolith pattern that emerges from the kaolin disorder map isa linear chain of previously unmapped weathered basement rocks exposed at the surface (yellowdashed polygons). This basement high would have restricted the development of any Tertiary channelore development and thus critical in designing an exploration drilling program. Unfortunately, thecompany’s exploration drilling program did not take advantage of these mineral mapping information,such that ~30% of their drill holes were sunk into weathered basement that was close to/at the surface.Note that the visual appearance of the surface is indistinguishable between these weathered in situand transported areas [134].
The potential value of the remote sensing mineral mapping data to a company’s explorationprogram can also be extended to quantitative delineation of the deposit, including its ore quality.This requires unmixing complicating surface effects such as green and dry vegetation [89,134].Figure 14b presents a cross-section (A–B, Figure 14a) of the spectrally estimated %FeO contentgenerated from the drill core and airborne hyperspectral data. This mineral mapping estimate of %FeOwas generated/validated against geochemical data [132,133]. The results show that the shell of ironore (orange, dotted polygon in Figure 14b) can be extended from under a cover of ~20 m of alluviumnear “H” to where it is exposed at the surface zone near “I” where both the remote sensing and drillcore spectral results show the same estimates of %FeO. Other attributes of iron ore quality, such as theamount and composition of clay minerals, can similarly be measured spectrally and modelled in 3Denabling the opportunity for more comprehensive 3D characterization of the ore body. The messagebeing that current 3D modelling of the ore can be improved through use of remote sensing data.This opportunity to seamlessly map target geology in 3D despite variable vegetation and regolithcover is also demonstrated for a porphyry hydrothermal alteration system in Section 2.12.4.
2.12.3. ASTER Geoscience Maps—Vegetation Cover Challenge
Fifteen ASTER “Version 1” (V1) geoscience map products of Australia were publicly released in2012 [135]. A number of these ASTER mineral products appeared to be independent of vegetationcover, for example, “Ferric Oxide Composition” (Figure 15a), which is essentially a measure ofthe visible color (ASTER bands B2/B1) with the abundance of “red” hematite being the driver.This vegetation-independence is shown by its apparent high correlation with >1000 ASD measurementsof the National Geochemical Survey of Australia (NGSA) surface (0–10 cm depth) sample suite [136],which were convolved to ASTER band pass responses in order derive a comparable B2/B1 product(colored dots in Figure 15a).
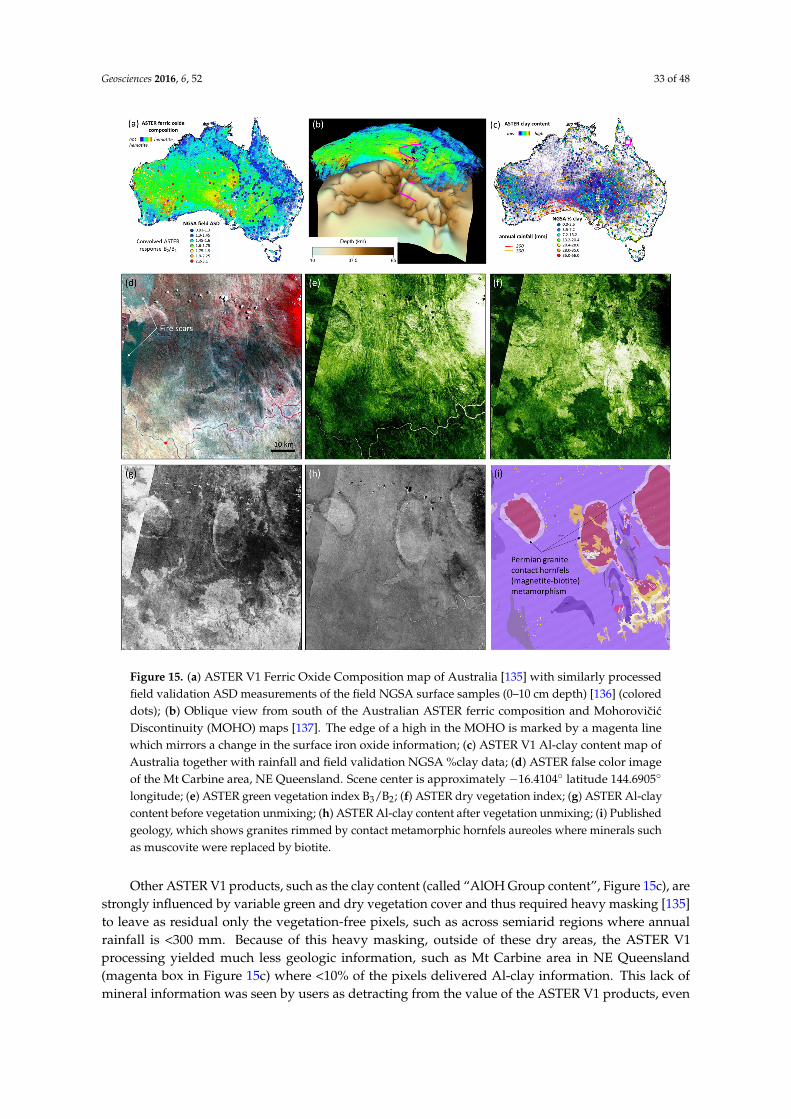
Geosciences 2016, 6, 52 33 of 48Geosciences 2016, 6, 52 33 of 48
Figure 15. (a) ASTER V1 Ferric Oxide Composition map of Australia [135] with similarly processed field validation ASD measurements of the field NGSA surface samples (0–10 cm depth) [136] (colored dots); (b) Oblique view from south of the Australian ASTER ferric composition and Mohorovičić Discontinuity (MOHO) maps [137]. The edge of a high in the MOHO is marked by a magenta line which mirrors a change in the surface iron oxide information; (c) ASTER V1 Al-clay content map of Australia together with rainfall and field validation NGSA %clay data; (d) ASTER false color image of the Mt Carbine area, NE Queensland. Scene center is approximately −16.4104° latitude 144.6905° longitude; (e) ASTER green vegetation index B3/B2; (f) ASTER dry vegetation index; (g) ASTER Al-clay content before vegetation unmixing; (h) ASTER Al-clay content after vegetation unmixing; (i) Published geology, which shows granites rimmed by contact metamorphic hornfels aureoles where minerals such as muscovite were replaced by biotite.
Other ASTER V1 products, such as the clay content (called “AlOH Group content”, Figure 15c), are strongly influenced by variable green and dry vegetation cover and thus required heavy masking [135] to leave as residual only the vegetation-free pixels, such as across semiarid regions where annual rainfall is <300 mm. Because of this heavy masking, outside of these dry areas, the ASTER V1 processing yielded much less geologic information, such as Mt Carbine area in NE Queensland (magenta box in Figure 15c) where <10% of the pixels delivered Al-clay information. This lack of mineral information was seen by users as detracting from the value of the ASTER V1 products, even though it was recognized that recording “null” information was better than providing “erroneous” information, as follow-up fieldwork is costly.
Figure 15. (a) ASTER V1 Ferric Oxide Composition map of Australia [135] with similarly processedfield validation ASD measurements of the field NGSA surface samples (0–10 cm depth) [136] (coloreddots); (b) Oblique view from south of the Australian ASTER ferric composition and MohorovicicDiscontinuity (MOHO) maps [137]. The edge of a high in the MOHO is marked by a magenta linewhich mirrors a change in the surface iron oxide information; (c) ASTER V1 Al-clay content map ofAustralia together with rainfall and field validation NGSA %clay data; (d) ASTER false color imageof the Mt Carbine area, NE Queensland. Scene center is approximately −16.4104◦ latitude 144.6905◦
longitude; (e) ASTER green vegetation index B3/B2; (f) ASTER dry vegetation index; (g) ASTER Al-claycontent before vegetation unmixing; (h) ASTER Al-clay content after vegetation unmixing; (i) Publishedgeology, which shows granites rimmed by contact metamorphic hornfels aureoles where minerals suchas muscovite were replaced by biotite.
Other ASTER V1 products, such as the clay content (called “AlOH Group content”, Figure 15c), arestrongly influenced by variable green and dry vegetation cover and thus required heavy masking [135]to leave as residual only the vegetation-free pixels, such as across semiarid regions where annualrainfall is <300 mm. Because of this heavy masking, outside of these dry areas, the ASTER V1processing yielded much less geologic information, such as Mt Carbine area in NE Queensland(magenta box in Figure 15c) where <10% of the pixels delivered Al-clay information. This lack ofmineral information was seen by users as detracting from the value of the ASTER V1 products, even
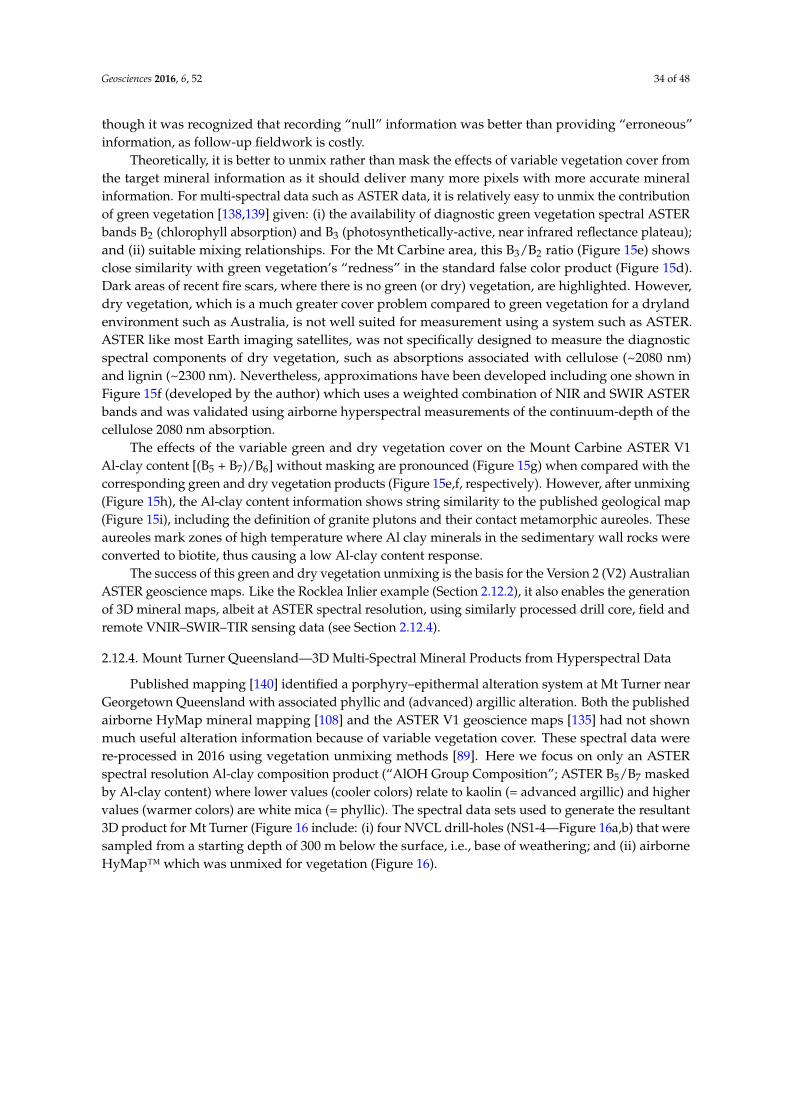
Geosciences 2016, 6, 52 34 of 48
though it was recognized that recording “null” information was better than providing “erroneous”information, as follow-up fieldwork is costly.
Theoretically, it is better to unmix rather than mask the effects of variable vegetation cover fromthe target mineral information as it should deliver many more pixels with more accurate mineralinformation. For multi-spectral data such as ASTER data, it is relatively easy to unmix the contributionof green vegetation [138,139] given: (i) the availability of diagnostic green vegetation spectral ASTERbands B2 (chlorophyll absorption) and B3 (photosynthetically-active, near infrared reflectance plateau);and (ii) suitable mixing relationships. For the Mt Carbine area, this B3/B2 ratio (Figure 15e) showsclose similarity with green vegetation’s “redness” in the standard false color product (Figure 15d).Dark areas of recent fire scars, where there is no green (or dry) vegetation, are highlighted. However,dry vegetation, which is a much greater cover problem compared to green vegetation for a drylandenvironment such as Australia, is not well suited for measurement using a system such as ASTER.ASTER like most Earth imaging satellites, was not specifically designed to measure the diagnosticspectral components of dry vegetation, such as absorptions associated with cellulose (~2080 nm)and lignin (~2300 nm). Nevertheless, approximations have been developed including one shown inFigure 15f (developed by the author) which uses a weighted combination of NIR and SWIR ASTERbands and was validated using airborne hyperspectral measurements of the continuum-depth of thecellulose 2080 nm absorption.
The effects of the variable green and dry vegetation cover on the Mount Carbine ASTER V1Al-clay content [(B5 + B7)/B6] without masking are pronounced (Figure 15g) when compared with thecorresponding green and dry vegetation products (Figure 15e,f, respectively). However, after unmixing(Figure 15h), the Al-clay content information shows string similarity to the published geological map(Figure 15i), including the definition of granite plutons and their contact metamorphic aureoles. Theseaureoles mark zones of high temperature where Al clay minerals in the sedimentary wall rocks wereconverted to biotite, thus causing a low Al-clay content response.
The success of this green and dry vegetation unmixing is the basis for the Version 2 (V2) AustralianASTER geoscience maps. Like the Rocklea Inlier example (Section 2.12.2), it also enables the generationof 3D mineral maps, albeit at ASTER spectral resolution, using similarly processed drill core, field andremote VNIR–SWIR–TIR sensing data (see Section 2.12.4).
2.12.4. Mount Turner Queensland—3D Multi-Spectral Mineral Products from Hyperspectral Data
Published mapping [140] identified a porphyry–epithermal alteration system at Mt Turner nearGeorgetown Queensland with associated phyllic and (advanced) argillic alteration. Both the publishedairborne HyMap mineral mapping [108] and the ASTER V1 geoscience maps [135] had not shownmuch useful alteration information because of variable vegetation cover. These spectral data werere-processed in 2016 using vegetation unmixing methods [89]. Here we focus on only an ASTERspectral resolution Al-clay composition product (“AlOH Group Composition”; ASTER B5/B7 maskedby Al-clay content) where lower values (cooler colors) relate to kaolin (= advanced argillic) and highervalues (warmer colors) are white mica (= phyllic). The spectral data sets used to generate the resultant3D product for Mt Turner (Figure 16 include: (i) four NVCL drill-holes (NS1-4—Figure 16a,b) that weresampled from a starting depth of 300 m below the surface, i.e., base of weathering; and (ii) airborneHyMap™ which was unmixed for vegetation (Figure 16).
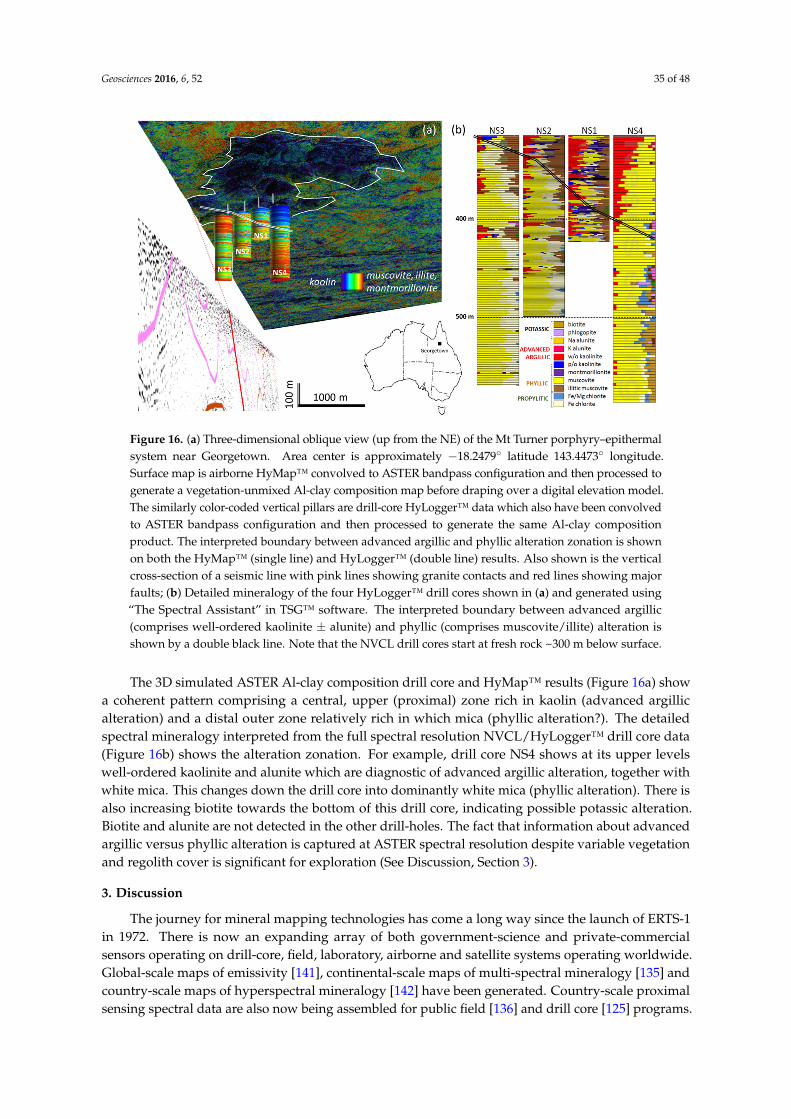
Geosciences 2016, 6, 52 35 of 48Geosciences 2016, 6, 52 35 of 48
Figure 16. (a) Three-dimensional oblique view (up from the NE) of the Mt Turner porphyry–epithermal system near Georgetown. Area center is approximately −18.2479° latitude 143.4473° longitude. Surface map is airborne HyMap™ convolved to ASTER bandpass configuration and then processed to generate a vegetation-unmixed Al-clay composition map before draping over a digital elevation model. The similarly color-coded vertical pillars are drill-core HyLogger™ data which also have been convolved to ASTER bandpass configuration and then processed to generate the same Al-clay composition product. The interpreted boundary between advanced argillic and phyllic alteration zonation is shown on both the HyMap™ (single line) and HyLogger™ (double line) results. Also shown is the vertical cross-section of a seismic line with pink lines showing granite contacts and red lines showing major faults; (b) Detailed mineralogy of the four HyLogger™ drill cores shown in (a) and generated using “The Spectral Assistant” in TSG™ software. The interpreted boundary between advanced argillic (comprises well-ordered kaolinite ± alunite) and phyllic (comprises muscovite/illite) alteration is shown by a double black line. Note that the NVCL drill cores start at fresh rock ~300 m below surface.
The 3D simulated ASTER Al-clay composition drill core and HyMap™ results (Figure 16a) show a coherent pattern comprising a central, upper (proximal) zone rich in kaolin (advanced argillic alteration) and a distal outer zone relatively rich in which mica (phyllic alteration?). The detailed spectral mineralogy interpreted from the full spectral resolution NVCL/HyLogger™ drill core data (Figure 16b) shows the alteration zonation. For example, drill core NS4 shows at its upper levels well-ordered kaolinite and alunite which are diagnostic of advanced argillic alteration, together with white mica. This changes down the drill core into dominantly white mica (phyllic alteration). There is also increasing biotite towards the bottom of this drill core, indicating possible potassic alteration. Biotite and alunite are not detected in the other drill-holes. The fact that information about advanced argillic versus phyllic alteration is captured at ASTER spectral resolution despite variable vegetation and regolith cover is significant for exploration (See Discussion, Section 3).
3. Discussion
The journey for mineral mapping technologies has come a long way since the launch of ERTS-1 in 1972. There is now an expanding array of both government-science and private-commercial sensors operating on drill-core, field, laboratory, airborne and satellite systems operating worldwide. Global-scale maps of emissivity [141], continental-scale maps of multi-spectral mineralogy [135] and country-scale maps of hyperspectral mineralogy [142] have been generated. Country-scale proximal sensing spectral data are also now being assembled for public field [136] and drill core [125] programs. Across Australia, Federal, State and Territory government geoscience organizations now
Figure 16. (a) Three-dimensional oblique view (up from the NE) of the Mt Turner porphyry–epithermalsystem near Georgetown. Area center is approximately −18.2479◦ latitude 143.4473◦ longitude.Surface map is airborne HyMap™ convolved to ASTER bandpass configuration and then processed togenerate a vegetation-unmixed Al-clay composition map before draping over a digital elevation model.The similarly color-coded vertical pillars are drill-core HyLogger™ data which also have been convolvedto ASTER bandpass configuration and then processed to generate the same Al-clay compositionproduct. The interpreted boundary between advanced argillic and phyllic alteration zonation is shownon both the HyMap™ (single line) and HyLogger™ (double line) results. Also shown is the verticalcross-section of a seismic line with pink lines showing granite contacts and red lines showing majorfaults; (b) Detailed mineralogy of the four HyLogger™ drill cores shown in (a) and generated using“The Spectral Assistant” in TSG™ software. The interpreted boundary between advanced argillic(comprises well-ordered kaolinite ± alunite) and phyllic (comprises muscovite/illite) alteration isshown by a double black line. Note that the NVCL drill cores start at fresh rock ~300 m below surface.
The 3D simulated ASTER Al-clay composition drill core and HyMap™ results (Figure 16a) showa coherent pattern comprising a central, upper (proximal) zone rich in kaolin (advanced argillicalteration) and a distal outer zone relatively rich in which mica (phyllic alteration?). The detailedspectral mineralogy interpreted from the full spectral resolution NVCL/HyLogger™ drill core data(Figure 16b) shows the alteration zonation. For example, drill core NS4 shows at its upper levelswell-ordered kaolinite and alunite which are diagnostic of advanced argillic alteration, together withwhite mica. This changes down the drill core into dominantly white mica (phyllic alteration). There isalso increasing biotite towards the bottom of this drill core, indicating possible potassic alteration.Biotite and alunite are not detected in the other drill-holes. The fact that information about advancedargillic versus phyllic alteration is captured at ASTER spectral resolution despite variable vegetationand regolith cover is significant for exploration (See Discussion, Section 3).
3. Discussion
The journey for mineral mapping technologies has come a long way since the launch of ERTS-1in 1972. There is now an expanding array of both government-science and private-commercialsensors operating on drill-core, field, laboratory, airborne and satellite systems operating worldwide.Global-scale maps of emissivity [141], continental-scale maps of multi-spectral mineralogy [135] andcountry-scale maps of hyperspectral mineralogy [142] have been generated. Country-scale proximalsensing spectral data are also now being assembled for public field [136] and drill core [125] programs.
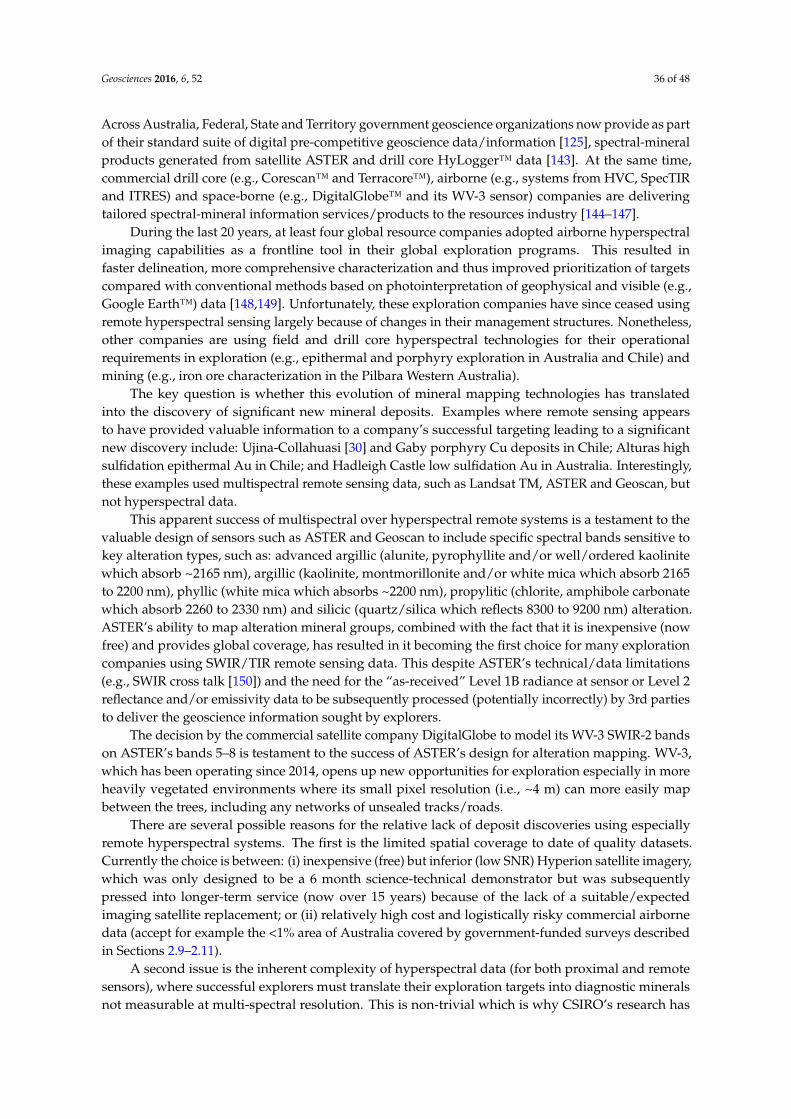
Geosciences 2016, 6, 52 36 of 48
Across Australia, Federal, State and Territory government geoscience organizations now provide as partof their standard suite of digital pre-competitive geoscience data/information [125], spectral-mineralproducts generated from satellite ASTER and drill core HyLogger™ data [143]. At the same time,commercial drill core (e.g., Corescan™ and Terracore™), airborne (e.g., systems from HVC, SpecTIRand ITRES) and space-borne (e.g., DigitalGlobe™ and its WV-3 sensor) companies are deliveringtailored spectral-mineral information services/products to the resources industry [144–147].
During the last 20 years, at least four global resource companies adopted airborne hyperspectralimaging capabilities as a frontline tool in their global exploration programs. This resulted infaster delineation, more comprehensive characterization and thus improved prioritization of targetscompared with conventional methods based on photointerpretation of geophysical and visible (e.g.,Google Earth™) data [148,149]. Unfortunately, these exploration companies have since ceased usingremote hyperspectral sensing largely because of changes in their management structures. Nonetheless,other companies are using field and drill core hyperspectral technologies for their operationalrequirements in exploration (e.g., epithermal and porphyry exploration in Australia and Chile) andmining (e.g., iron ore characterization in the Pilbara Western Australia).
The key question is whether this evolution of mineral mapping technologies has translatedinto the discovery of significant new mineral deposits. Examples where remote sensing appearsto have provided valuable information to a company’s successful targeting leading to a significantnew discovery include: Ujina-Collahuasi [30] and Gaby porphyry Cu deposits in Chile; Alturas highsulfidation epithermal Au in Chile; and Hadleigh Castle low sulfidation Au in Australia. Interestingly,these examples used multispectral remote sensing data, such as Landsat TM, ASTER and Geoscan, butnot hyperspectral data.
This apparent success of multispectral over hyperspectral remote systems is a testament to thevaluable design of sensors such as ASTER and Geoscan to include specific spectral bands sensitive tokey alteration types, such as: advanced argillic (alunite, pyrophyllite and/or well/ordered kaolinitewhich absorb ~2165 nm), argillic (kaolinite, montmorillonite and/or white mica which absorb 2165to 2200 nm), phyllic (white mica which absorbs ~2200 nm), propylitic (chlorite, amphibole carbonatewhich absorb 2260 to 2330 nm) and silicic (quartz/silica which reflects 8300 to 9200 nm) alteration.ASTER’s ability to map alteration mineral groups, combined with the fact that it is inexpensive (nowfree) and provides global coverage, has resulted in it becoming the first choice for many explorationcompanies using SWIR/TIR remote sensing data. This despite ASTER’s technical/data limitations(e.g., SWIR cross talk [150]) and the need for the “as-received” Level 1B radiance at sensor or Level 2reflectance and/or emissivity data to be subsequently processed (potentially incorrectly) by 3rd partiesto deliver the geoscience information sought by explorers.
The decision by the commercial satellite company DigitalGlobe to model its WV-3 SWIR-2 bandson ASTER’s bands 5–8 is testament to the success of ASTER’s design for alteration mapping. WV-3,which has been operating since 2014, opens up new opportunities for exploration especially in moreheavily vegetated environments where its small pixel resolution (i.e., ~4 m) can more easily mapbetween the trees, including any networks of unsealed tracks/roads.
There are several possible reasons for the relative lack of deposit discoveries using especiallyremote hyperspectral systems. The first is the limited spatial coverage to date of quality datasets.Currently the choice is between: (i) inexpensive (free) but inferior (low SNR) Hyperion satellite imagery,which was only designed to be a 6 month science-technical demonstrator but was subsequentlypressed into longer-term service (now over 15 years) because of the lack of a suitable/expectedimaging satellite replacement; or (ii) relatively high cost and logistically risky commercial airbornedata (accept for example the <1% area of Australia covered by government-funded surveys describedin Sections 2.9–2.11).
A second issue is the inherent complexity of hyperspectral data (for both proximal and remotesensors), where successful explorers must translate their exploration targets into diagnostic mineralsnot measurable at multi-spectral resolution. This is non-trivial which is why CSIRO’s research has
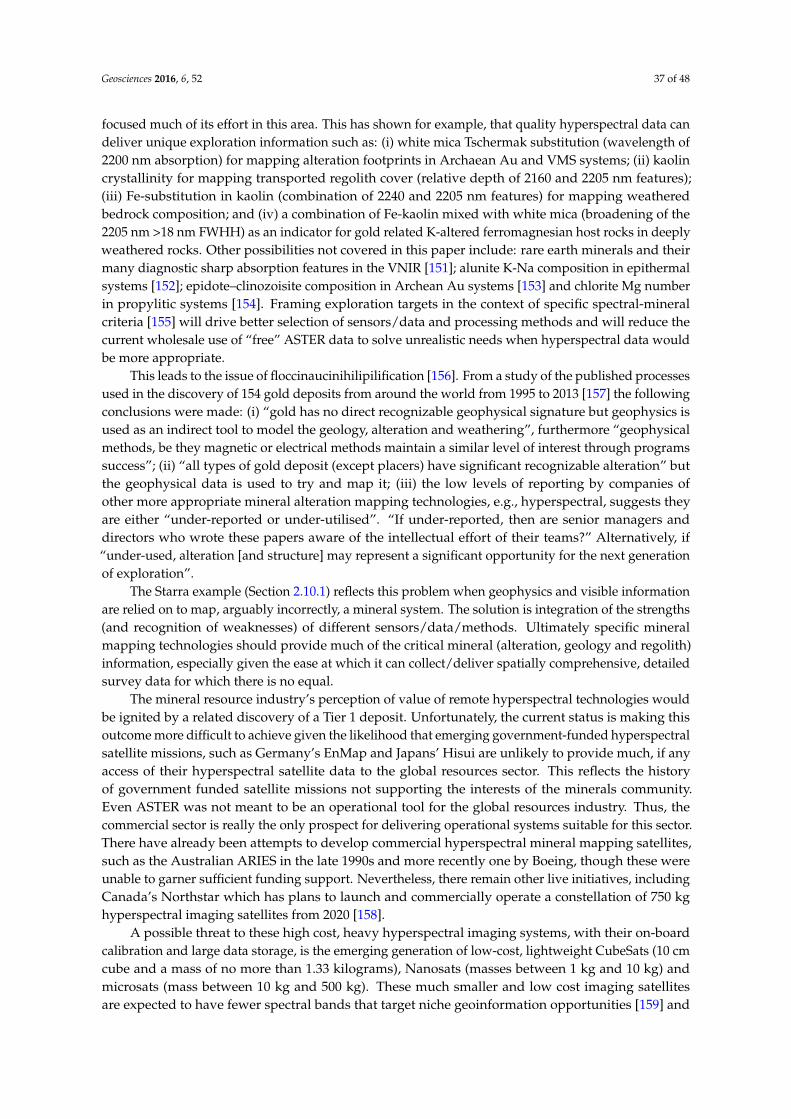
Geosciences 2016, 6, 52 37 of 48
focused much of its effort in this area. This has shown for example, that quality hyperspectral data candeliver unique exploration information such as: (i) white mica Tschermak substitution (wavelength of2200 nm absorption) for mapping alteration footprints in Archaean Au and VMS systems; (ii) kaolincrystallinity for mapping transported regolith cover (relative depth of 2160 and 2205 nm features);(iii) Fe-substitution in kaolin (combination of 2240 and 2205 nm features) for mapping weatheredbedrock composition; and (iv) a combination of Fe-kaolin mixed with white mica (broadening of the2205 nm >18 nm FWHH) as an indicator for gold related K-altered ferromagnesian host rocks in deeplyweathered rocks. Other possibilities not covered in this paper include: rare earth minerals and theirmany diagnostic sharp absorption features in the VNIR [151]; alunite K-Na composition in epithermalsystems [152]; epidote–clinozoisite composition in Archean Au systems [153] and chlorite Mg numberin propylitic systems [154]. Framing exploration targets in the context of specific spectral-mineralcriteria [155] will drive better selection of sensors/data and processing methods and will reduce thecurrent wholesale use of “free” ASTER data to solve unrealistic needs when hyperspectral data wouldbe more appropriate.
This leads to the issue of floccinaucinihilipilification [156]. From a study of the published processesused in the discovery of 154 gold deposits from around the world from 1995 to 2013 [157] the followingconclusions were made: (i) “gold has no direct recognizable geophysical signature but geophysics isused as an indirect tool to model the geology, alteration and weathering”, furthermore “geophysicalmethods, be they magnetic or electrical methods maintain a similar level of interest through programssuccess”; (ii) “all types of gold deposit (except placers) have significant recognizable alteration” butthe geophysical data is used to try and map it; (iii) the low levels of reporting by companies ofother more appropriate mineral alteration mapping technologies, e.g., hyperspectral, suggests theyare either “under-reported or under-utilised”. “If under-reported, then are senior managers anddirectors who wrote these papers aware of the intellectual effort of their teams?” Alternatively, if“under-used, alteration [and structure] may represent a significant opportunity for the next generationof exploration”.
The Starra example (Section 2.10.1) reflects this problem when geophysics and visible informationare relied on to map, arguably incorrectly, a mineral system. The solution is integration of the strengths(and recognition of weaknesses) of different sensors/data/methods. Ultimately specific mineralmapping technologies should provide much of the critical mineral (alteration, geology and regolith)information, especially given the ease at which it can collect/deliver spatially comprehensive, detailedsurvey data for which there is no equal.
The mineral resource industry’s perception of value of remote hyperspectral technologies wouldbe ignited by a related discovery of a Tier 1 deposit. Unfortunately, the current status is making thisoutcome more difficult to achieve given the likelihood that emerging government-funded hyperspectralsatellite missions, such as Germany’s EnMap and Japans’ Hisui are unlikely to provide much, if anyaccess of their hyperspectral satellite data to the global resources sector. This reflects the historyof government funded satellite missions not supporting the interests of the minerals community.Even ASTER was not meant to be an operational tool for the global resources industry. Thus, thecommercial sector is really the only prospect for delivering operational systems suitable for this sector.There have already been attempts to develop commercial hyperspectral mineral mapping satellites,such as the Australian ARIES in the late 1990s and more recently one by Boeing, though these wereunable to garner sufficient funding support. Nevertheless, there remain other live initiatives, includingCanada’s Northstar which has plans to launch and commercially operate a constellation of 750 kghyperspectral imaging satellites from 2020 [158].
A possible threat to these high cost, heavy hyperspectral imaging systems, with their on-boardcalibration and large data storage, is the emerging generation of low-cost, lightweight CubeSats (10 cmcube and a mass of no more than 1.33 kilograms), Nanosats (masses between 1 kg and 10 kg) andmicrosats (mass between 10 kg and 500 kg). These much smaller and low cost imaging satellitesare expected to have fewer spectral bands that target niche geoinformation opportunities [159] and

Geosciences 2016, 6, 52 38 of 48
have little (if any) on-board image calibration (i.e., reliance on vicarious and/or other forms ofcross-calibration) and limited data storage capacity (i.e., continuous data download). Key challengesfor generating valuable geoinformation from these small imaging systems will be: (i) reducing theuncalibrated sensor signal into accurate surface compositional information; and (ii) spatially integratingdata/information from one sensor with that from other sensors to deliver integrated geoscienceinformation of value to users.
Given that one of the consistent issues in CSIRO’s research over the last 30 years has been theimportance of high quality data calibration, without which the derived information is reduced tojust pretty pictures, then large volumes of uncalibrated, disparate data from these small satellites isa concern. The emerging paradigm of artificial intelligence, such as International Business MachinesCorporation’s Watson [160], may provide the solutions though these two frontiers have yet to coalesceeffectively/operationally for resource applications.
Today there is a plethora of non-standard (not comparable) geoscience information products beinggenerated from the many different sensor types and information service providers. These products alltoo often lack related documentation of their methods, let alone independent validation assessments.Even though this may help preserve the commercial viability of providers, it arguably has confusedthe resources community, reduced the size of marketplace and limited the opportunity for buildingintegrated datasets. The solution is setting traceable standards, which to date has been problematicfor this community. Ideally, explorers should be able to insert their local field or drill core data intoa regional mineral mapping framework that was generated from other public drill core, field airborneand satellite data. This would for example, enable explorers to determine if the alteration recognizedin their data extends beyond their exploration leases.
A first-step mineral mapping framework could be based on the global ASTER data archive, whichis now free and available as an ortho-rectified radiance@sensor product [161,162]. Any/all other drillcore, field, airborne and space-borne VNIR–SWIR–TIR spectral data could thus be convolved intoASTER’s 14 spectral bands and then processed and integrated with other similarly processed ASTERmineral products [135]. This vision is currently being pursued by CSIRO and the GSQ for all publiclyavailable spectral data (NVCL, NGSA, HyMap, Hyperion and ASTER) across Queensland. The aim isto generate a suite of consistent (standard), transferrable, public, digital geologically-valuable mineralproducts that are readily visualized in 3D using off-the-shelf software. To achieve a similar opportunityglobally, requires understanding and preserving the interests of different government-science andprivate-commercial organizations. Such an opportunity can potentially be pursued through theinter-governmental Group on Earth Observation’s (GEO), especially its newly established SocietalBenefit Area (SBA) on “Minerals and Energy Management” (CA06) [163] or via an industry R&Dbroker such as AMIRA.
Given that accurate, seamless 3D mineral mapping is now within reach, then future R&Dcould develop opportunities around using the “measured” mineral information to model “hybrid”geological information. For example: (i) transported versus in situ materials based on kaolinphysicochemistry (and other diagnostic spectral-mineral indicators) from surface and if availablesub-surface hyperspectral data; (ii) lithology cross-cutting alteration zonation/footprints based on,for example, a combination of white mica plus amphibole, chlorite or talc as an indicator for K andSi metasomatized ferromagnesian rocks; and (iii) a complete mineral system using spectral-mineralindicators sensitive to REDOX (e.g., opaque phases such as graphite) and Si (white mica Tschermaksubstitution) and K (white mica content) activities. Such hybrid geological models could also beuseful in the inversion of geophysical data. For example, a mineral mapping derived hybrid mapof transported versus in situ regolith materials could assist in the first-pass inversion of airborneelectromagnetic data for modelling depth to bedrock through complex unconsolidated cover [164].
There also remain fundamental questions regards what geologic conditions drive the spectrallymeasurable physicochemistry of specific minerals. For example, white mica Tschermak substitution hasshown apparently conflicting patterns for different mineral deposits at similar pressure-temperature

Geosciences 2016, 6, 52 39 of 48
conditions [165]. Thermodynamic modelling research is now helping to resolve this complexity [166,167],which may ultimately explain even larger patterns, such as whether the apparent relationship betweenthe thickness of the Australian crust (~depth to MOHO) [137] and the surface (top 100 µm) mineralogy(e.g., Figure 16b) is related to the vertical migration of reduced, alkaline mantle fluids [168,169].
Finally, even though this paper has focused on mineral resource exploration, the spectral sensingtechnologies examined here have particular relevance to the theme of this special issue, namely“lithological and structural mapping using earth observation technologies” (as well as many otherapplications, such as mining environment, soils, agricultural fertility, ground and surface water, naturalheritage sites, desertification, vegetation communities and ecosystems). That is, our ability to measureand map mineralogy will enable better characterization of lithological and structural architecture aswell as provide valuable new insights into any superimposed metasomatic and weathering alterationimprints/processes.
4. Conclusions
This paper summarizes results from 30 years of many unpublished CSIRO collaborative industryprojects that tested emerging proximal and remote sensing systems for mapping mineral informationpotentially valuable for mineral exploration. These sensors operated at specific optical wavelengths(within the 400 and 14,000 nm range), spectral resolutions (multi-spectral to hyperspectral), radiometricresolutions, spatial footprints and/or measurement conditions (platforms, calibration, timing, access,cost) and included: (i) airborne Geoscan Mk II, MIRACO2LAS, HyMap™, SEBASS and TIPS imagingand/or profiling systems, (ii) satellite Hyperion and ASTER imaging satellites; (iii) PIMA fieldspectrometer; and (iv) HyLogger™ drill core logger. The mineral exploration challenges tackledby the various CSIRO projects included: (i) characterization of the regolith and transported cover usingkaolinite crystallinity and/or degree of Fe-substitution; (ii) persistence of Archaean orogenic goldrelated white mica alteration through deep lateritic regolith cover at Kalgoorlie, Eastern Goldfieldswith PIMA-II, HyMap™ and ASTER; (iii) extent and chemistry of white mica alteration associatedwith volcanic massive sulfide alteration at Panorama in the Pilbara using HyMap™, Hyperion andASTER; (iv) patterns of garnet and feldspar mineral-chemistry related to skarn–porphyry alteration atYerington, Nevada with SEBASS and TASI-600; (v) mapping the mineral system framework for an ironoxide copper–gold system at Starra, Mount Isa with HyMap™; (vi) pyroxene compositions associatedwith platinum-group element mineralization in a differentiated ultramafic intrusive complex at MunniMunni in the Pilbara with TIPS; (vii) prograde garnet and retrograde white mica alteration associatedwith base metal systems at Broken Hill with MIRACO2LAS and HyMap™; and (viii) 3D geometry ofiron oxide and clay compositions/contents for the Rocklea Inlier channel iron ore deposit, HamersleyBasin with HyLogger™ and AMS. These studies show that spectral sensing technologies can deliverspecific mineral information of value to explorers, whether it be for more accurate and efficientmapping/characterizing of the regolith or detection of alteration footprints to economic mineralization.The most recent CSIRO projects have demonstrated that it is now possible to generate accurate mineralproducts that seamlessly mesh across different sensor types (multi-spectral to hyperspectral) andsensor platforms (drill core to satellite) enabling the generation of 3D mineralogy from “fresh rockto space”. This has required solutions for example, to sensor data (re) calibration and vegetationunmixing, such that the vision of a global, scalable, web-accessible world of 3D mineralogy is nowwithin reach for the benefit of the exploration community.
Supplementary Materials: The following is available online at http://www.mdpi.com/2076-3263/6/4/52/s1:An evaluation of airborne TASI-600 imagery for mineral mapping of the Yerington skarn-porphyry system, Nevada.
Acknowledgments: This 30-year journey has relied on the support of many people and organizations. These includefrom: (i) CSIRO—John Creasey, Peter Wilson, Jon Huntington, Andy Green, Andy Gabell, Ian Tapley,Peter Hick, Steve Fraser, Chris Horsfall, Maurice Craig, Peter Mason, Lew Whitbourn, Phil Conner, Dick Phillips,Rob Hewson, Dave Gray, Ravi Anand, Cindy Ong, Mike Caccetta, Andrew Rodger, Erick Ramanaidou, Rui Wang,John Walshe, Keith Scott, Kai Yang, Melissa Quigley, Maarten Haest, Carsten Laukamp, Martin Wells, Mike Verrell,Amanda Cornelius, Rob Woodcock, Ryan Fraser, Peter Warren, Mark Berman, Peter Caccetta, Simon Collings,

Geosciences 2016, 6, 52 40 of 48
Joanne Chia, Norm Campbell, Jeremy Wallace and many others; (ii) NASA/JPL—Mike Abrams, Anne Kahleand Simon Hook and others; (iii) Geoscience Australia—Matilda Thomas, Patrice De Caritat, Lesley Wyborn,Pauline English and others; (iv) Geological Survey of Western Australia—Marian Skwarnecki, Ian Tyler, Paul Morris,Bob Gozzard, Nadine de Souza Kovacs and others; (v) Geological Survey of South Australia—Alan Maugerand others; (vi) Queensland Geological Survey—Mal Jones, Dave Mason and Vladimir Lisitsin andothers; (vii) USGS—Dave Meyer, Chris Doescher, Jim Crowley and others; (viii) CRC–LEME—Dennis Gee;(ix) MERIWA—Pam Smith; (x) AMIRA—Joe Cucuzza and Adele Seymon; (xi) ERSDAC/JSS—Osamu Kashimura,Yuichi Maruyama and others; (xii) Geological Survey of Japan—Yoshiki Ninomiya and others; (xiii) ASTERScience Team—Yasushi Yamaguchi, Larry Rowan, Jack Salisbury, Allan Gillespie and others; (xiv) HyperionScience Team—David Jupp, Pamela Barry, Jay Pearlman; (xv) Aerospace Corporation—John Hackwell, Dean Rileyand others; (xvi) HyVista/ISPL—Terry Cocks, Peter Cocks and others; (xvii) ITRES (Canada)—Stephen Achal;(xviii) SpecTIR—Mark Landers; (xix) World Geoscience (Fugro Airborne Services)—Peter Hausknecht, Pavel Jurza,Guy Roberts and others; (xx) International Training Centre (ITC Netherlands)—Frank van Ruitenbeek,Freek van der Meer and others; (xxi) University of Alberta—Benoit Rivard; (xxii) University of Campinas—CarlosRoberto de Souza Filho and others; (xxiii) Sumitomo Metal Mining—Kazuya Okada, Koji Ueda and others; (xxiv)JOGMEC (Japan)—Taro Yajima and others; (xxv) Anglo American (South Africa)—Michael Sears, Paul Linton,Phil Harris, Neil Pendock, Ronell Carey and others; (xxvi) DeBeers—Mike Hussey, Brian Bennett and others;(xxvii) Anglogold—Andrew Jenkins and others; (xxviii) Geoscan—Frank Honey, Bob Agar and others; (xxix) postgraduate students whom I have supervised including Adrian Brown, Louise Luong, Iwan Vitins, Rebecca Smythe,Kombada Mhopjeni, Ivor Kahimise, Fitri Augustine and Julia Novikova; and (xxx) others such as (but not restrictedto) Roger Bateman, Scott Halley, Carl Brauhart, Joe Boardman, Fred Kruse, Brigette Martini, Greg Swayze,Phoebe Hauff, Sasha Pontual, Gavin Hunt, Stuart Marsh, Stephen Chevrel, Eyal Ben Dor, Andreas Mueller,Charlie Kauffman, Sabine Chabrillat, Andi Eiseler, Pamela Blake, Saeid Asadzadeh, Florian de Boissieu,Rodrigo dos Reis Salles, Shi Pilong, Fu Bihong, and Chris McCauley Powell. To all of you thanks for making thejourney all the more enjoyable and worthwhile. I also thank the three reviewers of the draft manuscript whoprovided useful comments which I trust have now been addressed.
Conflicts of Interest: The author declares no conflict of interest.
References
1. Buckingham, W.F.; Sommer, S.E. Mineralogical characterisation of rock surfaces formed by hydrothermalalteration and weathering—Application to Remote Sensing. Econ. Geol. 1983, 78, 664–674. [CrossRef]
2. Huntington, J.F.; Cudahy, T.J.; Yang, K.; Scott, K.M.; Mason, P.; Gray, D.J.; Berman, M.; Bischoff, L.;Reston, M.S.; Mauger, A.J.; et al. Mineral Mapping with Field Spectroscopy for Exploration; AMIRA ProjectP435—CSIRO Exploration and Mining Report 419R; Commonwealth Scientific and Industrial ResearchOrganisation (CSIRO): Canberra, Australia, 1999. Available online: ftp://ftp.csiro.au/arrc/AMIRA%20P435%20Project%20Reports/Emr419r%20Final.pdf (accessed on 13 September 2016).
3. Henry, R.L. The transmission of powdered films in the infrared. J. Opt. Soc. Am. 1948, 38, 775–789. [CrossRef]4. Launer, P.J. Regularities in the infrared absorption spectra of silicate minerals. Am. Mineral. 1952, 37, 764–784.5. Hapke, B.W. A theoretical photometric function for the lunar surface. J. Geophys. Res. 1963, 68, 4571–4585. [CrossRef]6. Lyon, R.J.P.; Burns, E.A. Analysis of rocks and minerals by reflected infrared radiation. Econ. Geol. 1963, 58,
274–284. [CrossRef]7. Lyon, R.J.P. Analysis of rocks by spectral infrared emission (8 to 25 microns). Econ. Geol. 1965, 60, 715–736. [CrossRef]8. Conel, J.E. Infrared emissivities of silicates: Experimental results and a cloudy atmosphere model of spectra
emission from condensed particulate mediums. J. Geophys. Res. 1969, 74, 1614–1634. [CrossRef]9. Hunt, G.R.; Vincent, R.K. The behaviour of spectral features in the infrared emission from particulate surfaces
of various grain sizes. J. Geophys. Res. 1968, 73, 6039–6046. [CrossRef]10. Vincent, R.K.; Hunt, G.R. Infrared reflectance from mat surfaces. Appl. Opt. 1968, 7, 53–59. [CrossRef] [PubMed]11. Hunt, G.R.; Salisbury, J.W.; Lenhoff, C.J. Visible and near-infrared spectra of minerals and rocks. III. Oxides
and hydroxides. Mod. Geol. 1971, 2, 195–205.12. Hunt, G.R.; Salisbury, J.W.; Lenhoff, C.J. Visible and near-infrared spectra of minerals and rocks. VI.
Additional silicates. Mod. Geol. 1973, 4, 85–106.13. Hunt, G.R.; Salisbury, J.W. Visible and near-infrared spectra of minerals and rocks. I. Silicate minerals.
Mod. Geol. 1970, 1, 283–300.14. Hunt, G.R.; Salisbury, J.W. Visible and near infrared spectra of minerals and rocks: III. Silicates. Mod. Geol.
1971, 1, 283–300.15. Hunt, G.R.; Salisbury, J.W. Visible and near-infrared spectra of minerals and rocks. WI. Sedimentary rocks.
Mod. Geol. 1976, 5, 211–217.

Geosciences 2016, 6, 52 41 of 48
16. Clark, R.N. Spectral properties of mixtures of montmorillonite and dark carbon grains: Implications forremote sensing minerals containing chemically and physically absorbed water. J. Geophys. Res. 1983, 88,10635–10644. [CrossRef]
17. Clark, R.N. Chapter 1: Spectroscopy of Rocks and Minerals, and Principles of Spectroscopy. In Manual ofRemote Sensing; Rencz, A.N., Ed.; John Wiley and Sons: New York, NY, USA, 1999; Volume 3, pp. 3–58.
18. Salisbury, J.W.; Walter, L.S. Thermal infrared (2.5–13.5 µm) spectroscopic remote sensing of igneous rocktypes on particulate planetary surfaces. J. Geophys. Res. 1989, 94, 9192–9202. [CrossRef]
19. Rivard, B.; Arvidson, R.E.; Duncan, I.J.; Sultan, M.; Kaliouby, B.E. Varnish, sediment and rock controls onspectral reflectance of outcrops in arid regions. Geology 1992, 20, 295–298. [CrossRef]
20. Ninomiya, Y. Quantitative estimation of SiO2 content in igneous rocks using thermal infrared spectra witha neural network approach. IEEE Trans. Geosci. Remote Sens. 1995, 33, 684–691. [CrossRef]
21. Rowan, L.C.; Wetlaufer, P.H.; Goetz, A.F.H.; Billingsley, F.C.; Stewart, J.H. Discrimination of Rock Types andAltered Areas in Nevada by Use of ERTS Images; U.S. Geological Survey Professional Paper 883; U.S. GeologicalSurvey: Washington, DC, USA, 1974.
22. Rowan, L.C.; Goetz, A.F.H.; Ashely, R.P. Discrimination of hydrothermally altered rocks in visible and nearinfrared multispectral images. Geophysics 1977, 42, 522–535. [CrossRef]
23. Goetz, A.F.H.; Rowan, L.C.; Kingston, M.J. Mineral identification from orbit: Initial results from the ShuttleMultispectral Infrared Radiometer. Science 1982, 218, 1020–1024. [CrossRef] [PubMed]
24. Abrams, M.J.; Brown, D.; Lepley, L.; Sadowski, R. Remote sensing for porphyry copper deposits insouthern Arizona. Econ. Geol. 1983, 78, 591–604. [CrossRef]
25. Kahle, A.B.; Goetz, A.F.H. Mineralogic information from a new airborne thermal infrared multispectral scanner.Science 1983, 222, 24–27. [CrossRef] [PubMed]
26. Townsend, T.E. Discrimination of iron alteration minerals in visible and near infrared reflectance data.J. Geophys. Res. 1987, 92, 1441–1454. [CrossRef]
27. Drury, S.A. Image Interpretation in Geology; Allen and Unwin: London, UK, 1987.28. Kruse, F.A. Use of airborne imaging spectrometer data to map minerals associated with hydrothermal altered
rocks in the Northern Grapevine Mountains, Nevada and California. Remote Sens. Environ. 1988, 24, 31–51.[CrossRef]
29. Vane, G.; Green, R.O.; Chrien, T.G.; Enmark, H.T.; Hansen, E.G.; Porter, W.M. The airborne visible/infraredimaging spectrometer (AVIRIS). Remote Sens. Environ. 1993, 44, 127–143. [CrossRef]
30. Sabins, F.F. Remote sensing for mineral exploration. Ore Geol. Rev. 1999, 14, 157–183. [CrossRef]31. Ninomiya, Y.; Fu, B.; Cudahy, T.J. Detecting lithology with Advanced Space-borne Thermal Emission and
Reflectance Radiometer (ASTER) multispectral thermal infrared “radiance-at-sensor” data. Remote Sens. Environ.2005, 99, 127–139. [CrossRef]
32. Hewson, R.D.; Cudahy, T.J. Chapter 13: Issues affecting geological mapping with ASTER data: A case studyof the Mount Fitton area, South Australia. In Land Remote Sensing and Global Environmental Change: NASA’sEarth Observing System and the Science of ASTER and MODIS; Ramachandran, B., Justice, C., Abrams, M., Eds.;Springer: New York, NY, USA, 2010; pp. 273–300.
33. AMIRA. Available online: http://www.amira.com.au (accessed on 29 September 2016).34. MRIWA. Available online: http://www.mriwa.wa.gov.au (accessed on 29 September 2016).35. Auscope. Available online: http://www.auscope.org.au/ncris (accessed on 29 September 2016).36. Anand, R.R.; Paine, M. Regolith geology of the Yilgarn Craton, Western Australia: implications for exploration.
Aust. J. Earth Sci. 2002, 49, 3–162. [CrossRef]37. UNCOVER. Searching the Deep Earth: A Vision for Exploration Geoscience in Australia. Available online:
http://www.uncoverminerals.org.au (accessed on 20 September 2016).38. Gabell, A.R.; Cudahy, T.J.; Gozzard, J.R.; Hunter, W.M.; Munday, T.J.; Tapley, I.J. Remote sensing for Gold
Exploration in Western Australia—Final Report; AMIRA Project P243—Remote Sensing for Gold ExplorationGeoscience Restricted Report 329R; Commonwealth Scientific and Industrial Research Organisation (CSIRO):Canberra, Australia, 1992.
39. Green, A.A.; Craig, M.D. Analysis of aircraft spectrometer data with logarithmic residuals. In Proceedings ofthe Airborne Imaging Spectrometer Data Analysis Workshop, 8–10 April 1985; JPL Publication: Pasadena,CA, USA, 1985; pp. 85–41, 111–119.
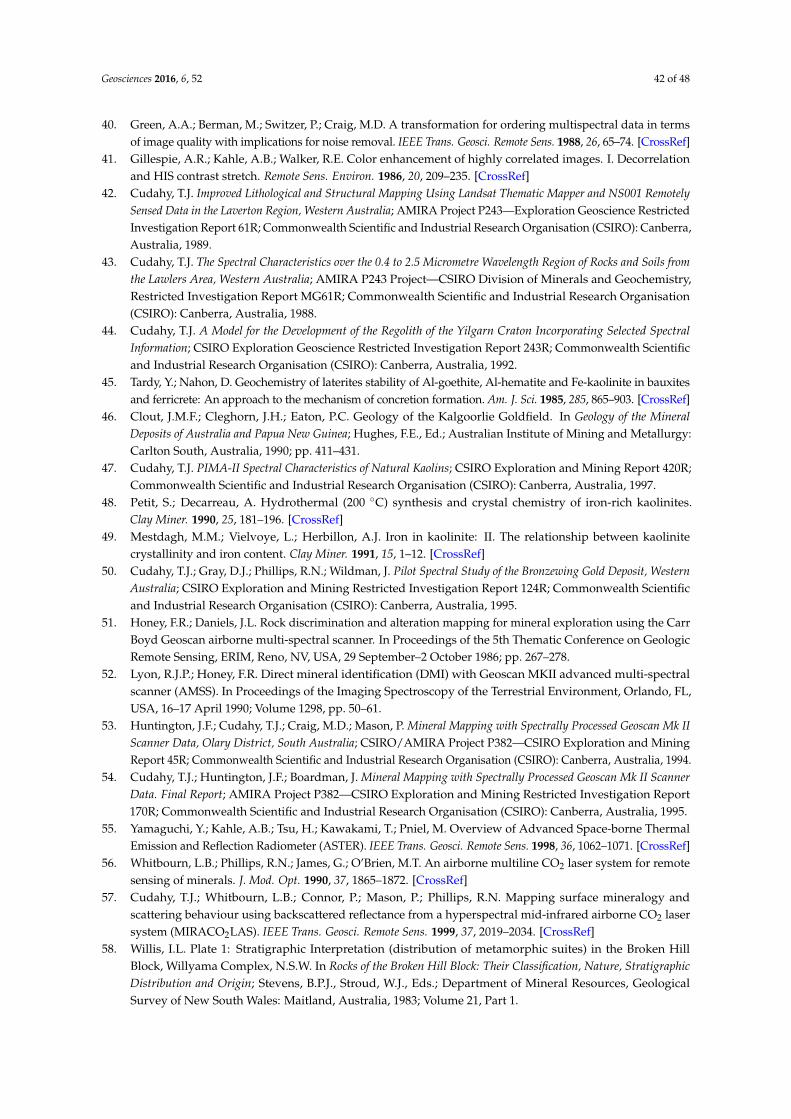
Geosciences 2016, 6, 52 42 of 48
40. Green, A.A.; Berman, M.; Switzer, P.; Craig, M.D. A transformation for ordering multispectral data in termsof image quality with implications for noise removal. IEEE Trans. Geosci. Remote Sens. 1988, 26, 65–74. [CrossRef]
41. Gillespie, A.R.; Kahle, A.B.; Walker, R.E. Color enhancement of highly correlated images. I. Decorrelationand HIS contrast stretch. Remote Sens. Environ. 1986, 20, 209–235. [CrossRef]
42. Cudahy, T.J. Improved Lithological and Structural Mapping Using Landsat Thematic Mapper and NS001 RemotelySensed Data in the Laverton Region, Western Australia; AMIRA Project P243—Exploration Geoscience RestrictedInvestigation Report 61R; Commonwealth Scientific and Industrial Research Organisation (CSIRO): Canberra,Australia, 1989.
43. Cudahy, T.J. The Spectral Characteristics over the 0.4 to 2.5 Micrometre Wavelength Region of Rocks and Soils fromthe Lawlers Area, Western Australia; AMIRA P243 Project—CSIRO Division of Minerals and Geochemistry,Restricted Investigation Report MG61R; Commonwealth Scientific and Industrial Research Organisation(CSIRO): Canberra, Australia, 1988.
44. Cudahy, T.J. A Model for the Development of the Regolith of the Yilgarn Craton Incorporating Selected SpectralInformation; CSIRO Exploration Geoscience Restricted Investigation Report 243R; Commonwealth Scientificand Industrial Research Organisation (CSIRO): Canberra, Australia, 1992.
45. Tardy, Y.; Nahon, D. Geochemistry of laterites stability of Al-goethite, Al-hematite and Fe-kaolinite in bauxitesand ferricrete: An approach to the mechanism of concretion formation. Am. J. Sci. 1985, 285, 865–903. [CrossRef]
46. Clout, J.M.F.; Cleghorn, J.H.; Eaton, P.C. Geology of the Kalgoorlie Goldfield. In Geology of the MineralDeposits of Australia and Papua New Guinea; Hughes, F.E., Ed.; Australian Institute of Mining and Metallurgy:Carlton South, Australia, 1990; pp. 411–431.
47. Cudahy, T.J. PIMA-II Spectral Characteristics of Natural Kaolins; CSIRO Exploration and Mining Report 420R;Commonwealth Scientific and Industrial Research Organisation (CSIRO): Canberra, Australia, 1997.
48. Petit, S.; Decarreau, A. Hydrothermal (200 ◦C) synthesis and crystal chemistry of iron-rich kaolinites.Clay Miner. 1990, 25, 181–196. [CrossRef]
49. Mestdagh, M.M.; Vielvoye, L.; Herbillon, A.J. Iron in kaolinite: II. The relationship between kaolinitecrystallinity and iron content. Clay Miner. 1991, 15, 1–12. [CrossRef]
50. Cudahy, T.J.; Gray, D.J.; Phillips, R.N.; Wildman, J. Pilot Spectral Study of the Bronzewing Gold Deposit, WesternAustralia; CSIRO Exploration and Mining Restricted Investigation Report 124R; Commonwealth Scientificand Industrial Research Organisation (CSIRO): Canberra, Australia, 1995.
51. Honey, F.R.; Daniels, J.L. Rock discrimination and alteration mapping for mineral exploration using the CarrBoyd Geoscan airborne multi-spectral scanner. In Proceedings of the 5th Thematic Conference on GeologicRemote Sensing, ERIM, Reno, NV, USA, 29 September–2 October 1986; pp. 267–278.
52. Lyon, R.J.P.; Honey, F.R. Direct mineral identification (DMI) with Geoscan MKII advanced multi-spectralscanner (AMSS). In Proceedings of the Imaging Spectroscopy of the Terrestrial Environment, Orlando, FL,USA, 16–17 April 1990; Volume 1298, pp. 50–61.
53. Huntington, J.F.; Cudahy, T.J.; Craig, M.D.; Mason, P. Mineral Mapping with Spectrally Processed Geoscan Mk IIScanner Data, Olary District, South Australia; CSIRO/AMIRA Project P382—CSIRO Exploration and MiningReport 45R; Commonwealth Scientific and Industrial Research Organisation (CSIRO): Canberra, Australia, 1994.
54. Cudahy, T.J.; Huntington, J.F.; Boardman, J. Mineral Mapping with Spectrally Processed Geoscan Mk II ScannerData. Final Report; AMIRA Project P382—CSIRO Exploration and Mining Restricted Investigation Report170R; Commonwealth Scientific and Industrial Research Organisation (CSIRO): Canberra, Australia, 1995.
55. Yamaguchi, Y.; Kahle, A.B.; Tsu, H.; Kawakami, T.; Pniel, M. Overview of Advanced Space-borne ThermalEmission and Reflection Radiometer (ASTER). IEEE Trans. Geosci. Remote Sens. 1998, 36, 1062–1071. [CrossRef]
56. Whitbourn, L.B.; Phillips, R.N.; James, G.; O’Brien, M.T. An airborne multiline CO2 laser system for remotesensing of minerals. J. Mod. Opt. 1990, 37, 1865–1872. [CrossRef]
57. Cudahy, T.J.; Whitbourn, L.B.; Connor, P.; Mason, P.; Phillips, R.N. Mapping surface mineralogy andscattering behaviour using backscattered reflectance from a hyperspectral mid-infrared airborne CO2 lasersystem (MIRACO2LAS). IEEE Trans. Geosci. Remote Sens. 1999, 37, 2019–2034. [CrossRef]
58. Willis, I.L. Plate 1: Stratigraphic Interpretation (distribution of metamorphic suites) in the Broken HillBlock, Willyama Complex, N.S.W. In Rocks of the Broken Hill Block: Their Classification, Nature, StratigraphicDistribution and Origin; Stevens, B.P.J., Stroud, W.J., Eds.; Department of Mineral Resources, GeologicalSurvey of New South Wales: Maitland, Australia, 1983; Volume 21, Part 1.
Geosciences 2016, 6, 52 43 of 48
59. Boardman, J.W. Automatic spectral unmixing of AVIRIS data using convex geometry concepts. In Proceedingsof the 4th Annual Airborne Geoscience Workshop, Washington, DC, USA, 25–29 October 1993; p. 11.
60. Solomon, M.; Walshe, J.L.; Eastoe, C.J. Experiments on convection and their relevance to the genesis ofmassive sulphide deposits. Aust. J. Earth Sci. 1987, 34, 311–323. [CrossRef]
61. Binns, R.A.; Barriga, F.J.A.S.; Miller, D.J. Leg 193 synthesis: anatomy of an active felsic-hosted hydrothermalsystem, eastern Manus Basin, Papua New Guinea. Proc. ODP Sci. Results 2007, 193, 1–17.
62. Hewson, R.; Hausknecht, P.; Cudahy, T.; Batty, S.; Stamoulis, V.; Mauger, A. Geophysically integratedprofiling airborne mineral mapping—Mount Fitton. MESA J. 2001, 23, 16–19.
63. Hausknecht, P.; Cudahy, T.J.; Jurza, P.; Yajima, T. The airborne ARGUS line-profiling system: Integratedhyperspectral VNIR-SWIR-TIR spectrometry with magnetics and radiometrics—Geological case history,Panorama, Pilbara, Western Australia. In Proceedings of the 12th Australasian Remote Sensing andPhotogrammetry Conference, Fremantle, Australia, 18–22 October 2004.
64. Hoatson, D.M.; Keays, R.R. Formation of Platiniferous Sulfide Horizons by Crystal Fractionation and MagmaMixing in the Munni Munni Layered Intrusion West Pilbara Block Western Australia. Econ. Geol. 1989, 84,1775–1804. [CrossRef]
65. Rivard, B. (CSIRO Visiting Scientist from University of Alberta, Edmonton, AB, Canada). Personalcommunication, 2002.
66. Hausknecht, P. (Fugro Airborne Services, Perth, Australia). Personal communication, 2002.67. Huntington, J.F.; Whitbourn, L.B.; Laukamp, C.; Schodlock, M.; Yang, K.; Haest, M.; Quigley, M.;
Mason, P.; Green, A.A. Probing Australia’s Subsurface with New 1, 2 and 3D Hyperspectral Logging Technologiesfor “Whole-of-Mine-Life” Mineralogical Characterisation; Australian Institute of Geoscientists, ExplorationTechnologies: Perth, Australia, 2011; pp. 40–47.
68. Cudahy, T.J. Geometry of the Spectral-Mineralogical Alteration Halo at Birthday South, Fimiston Gold Deposit,Western Australia; CSIRO Exploration and Mining Report 421R; Commonwealth Scientific and IndustrialResearch Organisation (CSIRO): Canberra, Australia, 1997.
69. Duke, E.F. Near infrared spectra of muscovite, Tschermak substitution and metamorphic reaction progress:Implications for remote sensing. Geology 1994, 22, 621–624. [CrossRef]
70. Scott, K.; Yang, K. Spectral Reflectance Studies of White Micas; CSIRO Exploration and Mining RestrictedInvestigation Report 439R; Commonwealth Scientific and Industrial Research Organisation (CSIRO):Canberra, Australia, 1997.
71. Hussey, M. (De Beers, Perth, Australia). Personal communication, 1998.72. Bateman, R. (KCGM, Kalgoorlie, Australia). Personal communication, 1998.73. Cocks, T.; Jenssen, R.; Stewart, A.; Wilson, I.; Shields, T. The HyMap™ airborne hyperspectral sensor: The system,
calibration and performance. In Proceedings of the 1st EARSEL Workshop on Imaging Spectrometry, Zurich,Switzerland, 6–8 October 1998; pp. 37–42.
74. Cudahy, T.J.; Okada, K.; Ueda, K.; Brauhart, C.; Morant, P.; Huston, D.; Cocks, T.; Wilson, J.; Mason, P.;Huntington, J.F. Mapping the Panorama VMS-Style Alteration and Host Rock Mineralogy, Pilbara Block, UsingAirborne Hyperspectral VNIR-SWIR Data; MERIWA Report No. 205—CSIRO Exploration and Mining Report661R; Commonwealth Scientific and Industrial Research Organisation (CSIRO): Canberra, Australia, 1999.
75. Brauhart, C.W.; Groves, D.I.; Morant, P. Regional alteration systems associated with volcanogenic massivesulphide mineralization at Panorama, Pilbara, Western Australia. Econ. Geol. 1998, 93, 292–302. [CrossRef]
76. Huston, D.L.; Kamprad, J.; Brauhart, C. Definition of High Temperature Alteration Zones with PIMA: An Examplefrom the Panorama VHMS District, Central Pilbara Block; AGSO Research Newsletter 30; Australian GeologicalSurvey Organisation (AGSO): Canberra, Australia, 1999.
77. Young, C. Footwall Alteration at the Sulphur Springs Zn-Cu Volcanic-Hosted Massive Sulphide (VMS) Prospect,East Pilbara, Western Australia. Honours Thesis, University of Western Australia, Crawley, Australia, 1997.
78. Laukamp, C.; Caccetta, M.; Chia, J.; Cudahy, T.J.; Gessner, K.; Haest, M.; Liu, Y.C.; Ong, C.; Rodger, A.Uses, abuses and opportunities for hyperspectral technologies and derived geoscience information.In Proceedings of the Geo-Computing 2010, Australian Institute of Geoscientists, Brisbane, Australia,29 September–1 October 2010; pp. 73–76.
79. Rouse, J.W.; Haas, R.H.; Scheel, J.A.; Deering, D.W. Monitoring Vegetation Systems in the Great Plains withERTS. In Proceedings of the 3rd Earth Resource Technology Satellite (ERTS) Symposium, Washington, DC,USA, 10–14 December 1973; Volume 1, pp. 48–62.
Geosciences 2016, 6, 52 44 of 48
80. Drieberg, S.L.; Hagemann, S.G.; Huston, D.L.; Landis, G.; Ryan, C.G.; Van Achterbergh, E.; Vennemann, T.The interplay of evolved seawater and magmatic-hydrothermal fluids in the 3.24 Ga panoramavolcanic-hosted massive sulfide hydrothermal system, North Pilbara Craton, Western Australia. Econ. Geol.2012, 108, 79–110. [CrossRef]
81. Cudahy, T.J.; Hewson, R.D.; Huntington, J.F.; Quigley, M.A.; Barry, P.S. The performance of the satellite-borneHyperion Hyperspectral VNIR-SWIR imaging system for mineral mapping at Mount Fitton, South Australia.In Proceedings of the IEEE 2001 International Conference on Geoscience and Remote Sensing, Sydney,Australia, 9–13 July 2001.
82. Cudahy, T.J.; Rodger, A.R.; Barry, P.S.; Mason, P.; Quigley, M.A.; Folkman, M.A.; Pearlman, J. Assessmentof the stability of the Hyperion SWIR module for hyperspectral mineral mapping using multi-date imagesfrom Mount Fitton, Australia. In Proceedings of the IEEE 2002 International Conference on Geoscience andRemote Sensing, Toronto, ON, Canada, 24–28 June 2002.
83. Cudahy, T.J.; Okada, K.; Brauhart, C. Targeting VMS-style Zn mineralisation at Panorama, Australia, usingairborne hyperspectral VNIR-SWIR HYMAP™ data. In Proceedings of the 14th International Conference onApplied Geologic Remote Sensing, Las Vegas, NV, USA, 6–8 November 2000; pp. 395–402.
84. Ruitenbeek, F.J.A.; van Cudahy, T.J.; Hale, M.; van der Meer, F.D. Tracing fluid pathways in fossilhydrothermal systems with near infrared spectroscopy. Geology 2005, 33, 587–600. [CrossRef]
85. Ruitenbeek, F.J.A.; van Debba, P.; van der Meer, F.D.; Cudahy, T.J.; van der Meijde, M.; Hale, M. Mappingwhite micas and their absorption wavelengths using hyperspectral band ratios. Remote Sens. Environ. 2006,102, 211–222. [CrossRef]
86. Luong, L.; Cudahy, T.J.; Hausknecht, P. A comparison of HyMap™ and ARGUS hyperspectral airborne systems,using white mica mineral mapping at the Panorama VMS deposits, Western Australia. In Proceedings of the12th Australasian Remote Sensing and Photogrammetry Conference, Fremantle, Australia, 18–22 October 2004.
87. Cudahy, T.J.; Barry, P.S. Earth magmatic-seawater hydrothermal alteration revealed through satellite-borneHyperion imagery at Panorama, Western Australia. In Proceedings of the 2002 IEEE International Conferenceon Geoscience and Remote Sensing, Toronto, ON, Canada, 24–28 June 2002.
88. Cudahy, T.J.; Quigley, M. Panorama. In Evaluation of the EO-1 Hyperion hyperSpectral Instrument and ItsApplications at Australian Validation Sites 2001–2003; Jupp, D.L.B., Datt, B., Eds.; CSIRO Earth ObservationReport No. 2004/6; Commonwealth Scientific and Industrial Research Organisation (CSIRO): Canberra,Australia, 2004; pp. 150–160.
89. Rodger, A.R.; Cudahy, T.J. Vegetation Corrected Continuum Depths at 2.20 µm: An Approach forHyperspectral Sensors. Remote Sens. Environ. 2009, 113, 2243–2257. [CrossRef]
90. Hackwell, J.A.; Warren, D.W.; Bongiovi, R.P.; Hansel, S.J.; Hayhurst, T.L.; Mabry, D.J.; Sivjee, M.G.;Skinner, J.W. LWIR/MWIR Imaging Hyperspectral sensor for airborne and ground-based remote sensing.Proc. SPIE 1996, 2819, 102–107.
91. Einaudi, M.T. Petrogenesis of the copper-bearing skarn at the Mason Valley Mine, Yerington district, Nevada.Econ. Geol. 1977, 72, 769–795. [CrossRef]
92. Dilles, J.H.; Einaudi, M.T. Wall-rock alteration and hydrothermal flow paths about the Ann-Mason porphyrycopper deposit, Nevada—A 6-km vertical reconstruction. Econ. Geol. 1992, 87, 1963–2001. [CrossRef]
93. Windeler, D.S. Garnet-pyroxene alteration mapping in the Ludwig skarn (Yerington, Nevada) with Geoscanairborne multispectral data. Photogramm. Eng. Remote Sens. 1993, 59, 1277–1286.
94. Windeler, D.S.; Lyon, R.J.P. Discriminating dolomitization of marble in the Ludwig skarn near Yerington,Nevada using high-resolution airborne infrared imagery. Photogramm. Eng. Remote Sens. 1991, 57, 1171–1177.
95. Cudahy, T.J.; Wilson, J.; Hewson, R.D.; Okada, K.; Linton, P.; Harris, P.; Sears, M.; Hackwell, J.A. Mappingvariations in plagioclase feldspar mineralogy using airborne hyperspectral VNIR-SWIR-TIR imaging data.In Proceedings of the IEEE 2001 International Conference on Geoscience and Remote Sensing, Sydney,Australia, 9–13 July 2001.
96. Cudahy, T.J.; Okada, K.; Yamato, Y.; Maekawa, M.; Hackwell, J.A.; Huntington, J.F. Mapping Skarn andPorphyry Alteration Mineralogy at Yerington, Nevada, Using Airborne Hyperspectral TIR SEBASS Data; CSIROExploration and Mining Report 734R; Commonwealth Scientific and Industrial Research Organisation(CSIRO): Canberra, Australia, 2000.
Geosciences 2016, 6, 52 45 of 48
97. Cudahy, T.J.; Okada, K.; Yamato, Y.; Huntington, J.F.; Hackwell, J.A. Mapping skarn alteration mineralogy atYerington, Nevada, using airborne hyperspectral TIR SEBASS imaging data. In Proceedings of the 14thInternational Conference on Applied Geologic Remote Sensing, Las Vegas, NV, USA, 6–8 November 2000; pp. 70–79.
98. Dilles, J.D.; Einaudi, M.T.; Profett, J.R.; Barton, M.D. Overview of the Yerington Porphyry Copper District:Magmatic to non-magmatic sources of fluids: Their flow paths and alteration effects on rocks andCu-Mo-Fe-Au ores. Econ. Geol. 2000, 32, 55–66.
99. Cudahy, T.J.; Okada, K.; Megasu, K.; Hewson, R.D. VNIR-SWIR-TIR Spectral-Mineral Characterizationand Assessment of Satellite-Borne ASTER and Hyperion Data from the Candelaria, Iron Oxide Cu-Au Deposit,Chile; CSIRO Exploration and Mining Report 1123R; Commonwealth Scientific and Industrial ResearchOrganisation (CSIRO): Canberra, Australia, 2003.
100. Cudahy, T.J.; Caccetta, M.; Cornelius, A.; Hewson, R.D.; Wells, M.; Skwarnecki, M.; Halley, S.; Hausknecht, P.;Mason, P.; Quigley, M. Regolith Geology and Alteration Mineral Maps from New Generation Airborne andSatellite Remote Sensing Technologies and Explanatory Notes for the Kalgoorlie-Kanowna 1:100,000 Scale MapSheet, Remote Sensing Mineral Maps; MERIWA Report No. 252; Commonwealth Scientific and IndustrialResearch Organisation (CSIRO): Canberra, Australia, 2005; pp. 1–114.
101. Skwarnecki, M. Regolith-Landform Mapping and Hyperspectral Data for the Kalgoorlie-Kanowna Area; GeologicalSurvey of Western Australia Record 2005/7; Commonwealth Scientific and Industrial Research Organisation(CSIRO): Canberra, Australia, 2005.
102. GeoView. 1:100,000 Scale Geology. Available online: http://warims.dmp.wa.gov.au/GeoView/Viewer.html?Viewer=GeoVIEW (accessed on 6 October 2016).
103. Mikucki, E.J.; Roberts, F.I. Metamorphic Petrography of the Kalgoorlie Region Eastern Goldfields Granite-GreenstoneTerrane METPET Database; Geological Survey of Western Australia: Perth, Australiia, 2003.
104. Walshe, J. (CSIRO Mineral Resources, Perth, Australia). Personal communication, 2005.105. Neumayr, P.; Walshe, J.; Hagemann, S.; Petersen, K.; Roache, A.; Frikken, P.; Horn, L.; Halley, S. Oxidized and
reduced mineral assemblages in greenstone belt rocks of the St. Ives gold camp, Western Australia: Vectorsto high-grade ore bodies in Archaean gold deposits. Min. Depos. 2008, 43, 363–371. [CrossRef]
106. Blewett, R. Archaean Gold Mineral Systems in the Western Yilgran Craton. AUSGEO News, December 2010.Available online: http://www.ga.gov.au/webtemp/image_cache/GA18909.pdf (accessed on 6 October 2016).
107. Cudahy, T.J.; Hewson, R.D.; Barnes, S.; Groenewald, B. Mapping non-magnetic talc-bearing ultramafic rocksin the Kalgoorlie region using airborne hyperspectral data. In Proceedings of the Australian Earth ScienceConvention, Melbourne, Australia, 2–8 July 2006.
108. Cudahy, T.J.; Jones, M.; Thomas, M.; Laukamp, C.; Caccetta, M.; Hewson, R.D.; Rodger, A.R.; Verrall, M.Next Generation Mineral Mapping: Queensland Airborne HyMap™ and Satellite ASTER Surveys 2006–2008;CSIRO Exploration and Mining Open File Report P2007/364; Commonwealth Scientific and IndustrialResearch Organisation (CSIRO): Canberra, Australia, 2008.
109. Wyborn, L.A.; Heinrich, C.A.; Jacques, A.L. Australian Proterozoic Mineral Systems: Essential ingredients andmappable criteria. In Proceedings of the AUSIMM Annual Conference, Darwin, Australia, 5–9 August 1994.Available online: https://www.researchgate.net/profile/Lai_Wyborn/publication/263884864_Australian_Proterozoic_mineral_systems_essential_ingredients_and_mappable_criteria/links/54b48ef00cf28ebe92e47fe9.pdf (accessed on 27 September 2016).
110. McCuaig, T.C.; Hronsky, J. The Mineral System Concept: The Key to Exploration Targeting; Special Publication 18;Society of Economic Geologists, Inc.: Littleton, CO, USA, 2014; pp. 153–175.
111. Foster, D.R.W.; Austin, J.R. The 1800–1610 Ma stratigraphic and magmatic history of the Eastern Succession,Mount Isa Inlier, and correlations with adjacent Paleoproterozoic terranes. Precambrian Res. 2008, 163, 7–30.[CrossRef]
112. MinesOnlineMaps, Queensland Government. 1:100,000 Scale Geology. Available online: https://www.business.qld.gov.au/industry/mining/mining-online-services/minesonlinemaps (accessed on 7 October 2016).
113. Geophysical Archive Data Delivery System. Geoscience Australia. Available online: http://www.geoscience.gov.au/cgi-bin/mapserv?map=/nas/web/ops/prod/apps/mapserver/gadds/wms_map/gadds.map&mode=browse(accessed on 27 September 2016).
114. Rotherham, J.F. A metasomatic origin for the iron-oxide Au-Cu Starr ore bodies. Eastern Fold Belt, MountIsa Inlier. Miner. Depos. 1997, 32, 205–218. [CrossRef]

Geosciences 2016, 6, 52 46 of 48
115. Cudahy, T.J.; Jones, M.; Thomas, M.; Laukamp, C.; Caccetta, M.; Hewson, R.D.; Verrall, M.; Hackett, A.;Rodger, A. Mineral Mapping Queensland: IOCG Mineral System Case History, Starra, Mount Isa Inlier.In Proceedings of the PACRIM Conference, Jupiters Casino, Australia, 24–26 November 2008. Available online:https://www.ausimm.com.au/publications/epublication.aspx?ID=4787 (accessed on 21 September 2016).
116. Ivanhoe Australia’s Merlin Project. Australian Stock Exchange Market Release 21 April 2009. Availableonline: http://www.asx.com.au/asxpdf/20090421/pdf/31h4x7hqwh7v5g.pdf (accessed on 7 October 2016).
117. Taylor, G.R.; Hansford, P.; Stevens, B.P.J.; Robson, D. HyMap™ of Broken Hill—Imaging spectrometry forrock and mineral abundance mapping. Explor. Geophys. 2005, 36, 397–400. [CrossRef]
118. Barnes, R.G. Types of mineralization in the Broken Hill Block and their relationship to stratigraphy. In A Guideto the Stratigraphy and Mineralization of the Broken Hill Block, New South Wales—Record 20; Stevens, B.P.J., Ed.;Geological Survey of New South Wales: Maitland, Australia, 1980; pp. 33–70.
119. Binns, R.A. Zones of progressive regional metamorphism in the Willyama Complex, Broken Hill district,New South Wales. J. Geol. Soc. Aust. 1964, 11, 283–330. [CrossRef]
120. Fitzherbert, J.A.; Downes, P.M. A concise geological history of the Broken Hill region. Geol. Surv. N. S. W.Q. Notes 2015, 143, 29–43.
121. Raimondo, T.; Clark, C.; Hand, M.; Cliff, J.; Anczkiewicz, R. A. simple mechanism for mid-crustal shearzones to record surface-derived fluid signatures. Geology 2013, 41, 711–714. [CrossRef]
122. Clark, C.; Hand, M.; Faure, K.; Schmidt Mumm, A. Up-temperature flow of surface-derived fluids inmid-crust: The role of pre-orogenic burial of hydrated rocks. J. Metamorph. Petrol. 2006, 24, 367–387. [CrossRef]
123. Li, Z.X.; Bogdanova, S.V.; Collins, A.S.; Davidson, A.; De Waele, B.; Ernst, R.E.; Fitzsimons, I.C.W.; Fuck, R.A.;Gladkochub, D.P.; Jacobs, J.; et al. Assembly, configuration, and Break-up history of Rodinia: A Synthesis.Precambrian Res. 2008, 160, 179–210. [CrossRef]
124. Fitzherbert, J.A.; Downes, P.M.; Colquhoun, G.P.; Blevin, P.L.; Forster, D.B. Broken Hill Special 1:250,000Metallogenic Map, 1st ed.; Geological Survey of New South Wales: Maitland, Australia, 2015.
125. Australian Geoscience Information Network—Geoscience Portal. Layer: Boreholes/NVCL. Drill Hole ID:DD95TH05. Available online: http://portal.geoscience.gov.au/gmap.html (accessed on 23 September 2016).
126. Fitzherbert, J.A. Refined peak and retrograde metamorphic isograds for Broken Hill and Eurowie blocks, NSW.Geol. Surv. N. S. W. Q. Notes 2015, 143, 1–27.
127. De Segonzac, G.D. The transformation of clay minerals during diagenesis and low grade metamorphism:A review. Sedimentology 1970, 15, 281–346. [CrossRef]
128. Green, N.L.; Usdansky, S.I. Towards a practical plagioclase-muscovite thermometer. Am. Mineral. 1986, 71,1109–1117.
129. Rodger, A. SODA: A new method of in-scene atmospheric water vapor estimation and post-flightspectral recalibration for hyperspectral sensors—Application to the HyMap sensor at two locations.Remote Sens. Environ. 2010, 115, 536–547. [CrossRef]
130. Caccetta, M.; Collings, S.; Cudahy, T.J. A calibration method for continental scale mapping using ASTERimagery. Remote Sens. Environ. 2012, 139, 306–317. [CrossRef]
131. Cudahy, T.; Caccetta, M.; Thomas, M.; Hewson, R.D.; Abrams, M.; Kato, M.; Kashimura, O.; Ninomiya, Y.;Yamaguchi, Y.; Collings, S.; et al. Satellite-derived mineral mapping and monitoring of weathering,deposition and erosion. Nat. Sci. Rep. 2016, 6, 23702. [CrossRef] [PubMed]
132. Haest, M.; Cudahy, T.; Laukamp, C.; Gregory, S. Quantitative mineralogy from visible to shortwave infraredspectroscopic data—I. Validation of mineral abundance and composition products of the Rocklea Domechannel iron deposit in Western Australia. Econ. Geol. 2012, 107, 209–228. [CrossRef]
133. Haest, M.; Cudahy, T.; Laukamp, C.; Gregory, S. Quantitative mineralogy from visible to shortwaveinfrared spectroscopic data—II. 3D mineralogical characterisation of the Rocklea Dome channel iron deposit,Western Australia. Econ. Geol. 2012, 107, 229–249. [CrossRef]
134. Haest, M.; Cudahy, T.J.; Rodger, A.; Laukamp, C.; Martens, C.; Caccetta, M. Unmixing vegetation fromairborne visible-near to shortwave infrared spectroscopy-based mineral maps over the Rocklea Dome(Western Australia), with a focus on iron rich palaeochannels. Remote Sens. Environ. 2013, 129, 17–31. [CrossRef]
135. Cudahy, T.J. Australian ASTER Geoscience Product Notes; CSIRO Report, EP-30-07-12-44; CommonwealthScientific and Industrial Research Organisation (CSIRO): Canberra, Australia, 2012. Available online:https://data.csiro.au/dap/landingpage?pid=csiro%3A6182 (accessed on 28 September 2016).

Geosciences 2016, 6, 52 47 of 48
136. De Caritat, P.; Cooper, M. National Geochemical Survey of Australia: The Geochemical Atlas of Australia;Geoscience Australia Record 2011/20; Geoscience Australia: Symonston, Australia, 2011. Available online:http://www.ga.gov.au/metadata-gateway/metadata/record/gcat_71973 (accessed on 17 November 2016).
137. Kennett, B.L.N.; Blewett, R.S. Lithospheric framework of Australia. Episodes 2012, 35, 9–22.138. Smith, M.O.; Ustin, S.L.; Adams, J.B.; Gillespie, G.R. Vegetation in deserts: I. A regional measure of abundance
from multispectral images. Remote Sens. Environ. 1990, 31, 1–26. [CrossRef]139. Guerschman, J.P.; Scarth, P.F.; McVicar, T.R.; Renzullo, L.J.; Malthus, T.J.; Stewart, J.B.; Rickards, J.E.;
Trevithick, R. Assessing the effects of site heterogeneity and soil properties when unmixing photosyntheticvegetation, non-photosynthetic vegetation and bare soil fractions from Landsat and MODIS data.Remote Sens. Environ. 2015, 161, 12–26. [CrossRef]
140. Rossiter, A.G. Stream-sediment sampling near two porphyry copper prospects, Georgetown, Queensland.BMR J. Aust. Geol. Geophys. 1979, 4, 163–165.
141. Hulley, G.C.; Hook, S.J.; Abbott, E.; Malakar, N.; Islam, T.; Abrams, M. The ASTER Global Emissivity Dataset(ASTER GED): Mapping Earth’s emissivity at 100 meter spatial scale. Geophys. Res. Lett. 2015, 42. [CrossRef]
142. Kokaly, R.F.; King, T.V.V.; Hoefen, T.M.; Dudek, K.B.; Livo, K.E. Surface Materials Map of Afghanistan:Carbonates, Phyllosilicates, Sulfates, Altered Minerals and Other Materials: U.S. Geological Survey ScientificInvestigations Map 3152–A, One Sheet, Scale 1:1,100,000. 2011. Available online: http://pubs.usgs.gov/sim/3152/A/ (accessed on 9 October 2016).
143. Auscope National Virtual Core Library (NVCL). Available online: http://www.auscope.org.au/nvcl/(accessed on 9 October 2016).
144. Robert, F.; Brommecker, R.; Bourne, B.T.; Dobak, P.J.; McEwan, C.J.; Rowe, R.R.; Zhou, X. Models andexploration methods for major gold deposit types. In Proceedings of the Exploration 07: Fifth DecennialInternational Conference on Mineral Exploration, Toronto, ON, Canada, 9–12 September 2007; pp. 691–711.Available online: https://www.911metallurgist.com/blog/wp-content/uploads/2015/10/Models-and-Exploration-Methods-for-Major-Gold-Deposit-Type.pdf (accessed on 8 November 2016).
145. Holliday, J.R.; Cook, D.R. Advances in geological models and exploration methods for copper ± goldporphyry deposits. In Proceedings of the Exploration 07: Fifth Decennial International Conferenceon Mineral Exploration, Toronto, ON, Canada, 9–12 September 2007; pp. 791–809. Available online:https://www.911metallurgist.com/blog/wp-content/uploads/2015/10/Advances-in-Geological-Models-and-Exploration-Methods-for-Copper-Gold-Porphyry-Deposits.pdf(accessedon8November2016).
146. Harris, A.C.; Carey, R.; Holliday, J.R.; MacCorquodale, F. High-resolution VNIR-SWIR core logging:A revolutionary new tool for exploration, mining and research. In Proceedings of the Society ofExploration Geology (SEG) 2015 Conference, Hobart, Australia, 27–30 September 2015. Available online:https://www.segweb.org/SEG/_Events/Conference_Website_Archives/2015/Conference_Proceedings/files/topics/..%5Cpdf%5COral-Presentations%5CAbstracts%5CHarris.pdf (accessed on 8 November 2016).
147. Halley, S.; Dilles, J.H.; Tosdal, R.M. Footprints: Hydrothermal alteration and geochemical dispersion aroundporphyry copper deposits. SEG Newslett. 2015, 100, 1–29.
148. Gingerich, J.; Peshko, M.; Ross, D. Enhancing the effectiveness and success rate of exploration. In Proceedings ofthe AMIRA 4th Biennial Exploration Managers’ Conference “Globalisation of Exploration R&D”, Melbourne,Australia, 27 March 2001.
149. Hussey, M. (De Beers, Perth, Australia). Personal communication, 2008.150. Iwasaki, A.; Oyama, E. Correction of stray light and filter scratch blurring for ASTER imagery. IEEE Trans.
Geosci. Remote. Sens. 2005, 43, 2763–2768. [CrossRef]151. Rowan, L.C.; Mars, J.C. Lithological mapping in the Mountain Pass, California area using Advanced
Spaceborne Thermal Emission and Reflectance Radiometer (ASTER) data. Remote Sens. Environ. 2003, 84,350–366. [CrossRef]
152. Hauff, P. An Overview of VIS-NIR-SWIR Field Spectroscopy as Applied to Precious Metals Exploration; SpectralInternational Inc.: Arvada, CO, USA. Available online: http://www.spectral-international.com/files/50329239.pdf (accessed on 8 November 2016).
153. Roache, T.J.; Walshe, J.L.; Huntngton, J.F.; Quigley, M.A.; Yang, K.; Bil, B.W.; Blake, K.L.; Hyvärinen, T.Epidote-clinozoisite as a hyperspectral toll in exploration for Archaea gold. Aust. J. Earth Sci. 2011, 58,813–822. [CrossRef]

Geosciences 2016, 6, 52 48 of 48
154. Wilkinson, J.J.; Chang, Z.; Cooke, D.R.; Baker, M.J.; Wilkinson, C.C.; Inglis, S.; Chen, H.; Gemmell, J.B.The chlorite proximitor: A new tool for detecting porphyry ore deposits. J. Geochem. Explor. 2015, 152, 10–26.[CrossRef]
155. Guides for Mineral Exploration (GMEX). AusSpec International. Available online: http://www.ausspec.com/GMEX.htm (accessed on 8 November 2016).
156. Vearncombe, J. Value in Exploration: A Geologists’ Perspective on (Gold) Data, Perceptions and Messages;Australian Institute of Mining and Metallurgy and Australian Institute of Geoscientists: Perth, Australia,2013. Available online: https://www.aig.org.au/wp-content/uploads/2013/05/Vearncombe-AusIMM_AIG-talk.pdf (accessed on 11 November 2016).
157. Brown, L.; Vearncombe, J.R. Critical analysis of successful gold exploration methods. Appl. Earth Sci. Trans.Inst. Min. Miner. Metall. B 2014, 123, 18–24. [CrossRef]
158. Werner, D. Hyperspectral Harbingers. Space Daily News. 15 August 2016. Available online: https://www.spacenewsmag.com/feature/hyperspectral-harbingers/ (accessed on 10 November 2016).
159. Mandi, D.; Huemmerich, K.; Crum, G.; Ly, V.; Handy, M.; Ong, L. Hyperspectral Cubesat Constalletion forRapid Natural Hazard Response. Available online: https://ntrs.nasa.gov/archive/nasa/casi.ntrs.nasa.gov/20150023589.pdf (accessed on 10 November 2016).
160. IBM Watson. Available online: http://www.ibm.com/watson/ (accessed on 12 November 2016).161. ASTER Level 1 Precision Terrain Corrected Registered At-Sensor Radiance Download. Land Processes
Distributed Active Archive Centre (LPDAAC). Available online: https://lpdaac.usgs.gov/dataset_discovery/aster/aster_products_table/ast_l1t (accessed on 12 November 2016).
162. ASTER Data Download, METI AIST Data Archive System (MASDAS). Available online: https://gbank.gsj.jp/madas/map/ (accessed on 12 November 2016).
163. Group on Earth Observations (GEO) Strategic Plan 2016–2025: Community Activity CA-06: EO Data andMineral Resources. Available online: http://www.earthobservations.org/activity.php?id=6 (accessed on9 October 2016).
164. Wilford, J.R. New Regolith Mapping Approaches for Old Australian Landscapes. Ph.D. Thesis, The Universityof Adelaide, Adelaide, Australia, 2013. Available online: https://digital.library.adelaide.edu.au/dspace/bitstream/2440/85930/9/01front.pdf (accessed on 12 November 2016).
165. Herrmann, W.; Blake, M.; Doyle, M.; Huston, D.; Kamprad, J. Application of PIMA and FTIR spectrometry toVHMS alteration studies. In AMIRA P439 Project Final Report, Studies of VHMS-Related Alteration: Geochemicaland Mineralogical Vectors to Ore; University of Tasmania: Hobart, Australia, 1998; pp. 13–88. Available online:http://www.codes.utas.edu.au/reports/AMIRA_Reports/P439/P439_06_Vol_3_May_1998.pdf (accessedon 12 November 2016).
166. Wang, R.; Cudahy, T.J.; Laukamp, C.; Walshe, J.L.; Bath, A.; Mei, Y.; Young, C.; Roache, T.J.; Jenkins, A.;Roberts, M.; et al. White mica as a hyperspectral tool in exploration for Sunrise Dam and Kanowna Bellegold deposits, Western Australia. Econ. Geol. 2016, in press.
167. Abweny, M.S.; van Ruitenbeek, F.J.A.; de Smeth, J.B.; Woldai, T.; van der Meer, F.D.; Cudahy, T.; Zegers, T.;Blom, J.K.; Thuss, B. Short-wavelength infrared (SWIR) spectroscopy of low-grade metamorphic volcanicrocks of the Pilbara Craton. J. Afr. Earth Sci. 2016, 117, 124–134. [CrossRef]
168. Wickam, S.M.; Janardhan, A.S.; Stern, R.J. Regional carbonate alteration of the crust by mantle-derivedmagmatic fluids, Tamil Nadu, South India. J. Geol. 1994, 102, 379–398. [CrossRef]
169. Frezzotti, M.; Touret, J.L.R. CO2, carbonate-rich melt, and brines in the mantle. Geosci. Front. 2014, 5, 697–710.[CrossRef]
© 2016 by the author; licensee MDPI, Basel, Switzerland. This article is an open accessarticle distributed under the terms and conditions of the Creative Commons Attribution(CC-BY) license (http://creativecommons.org/licenses/by/4.0/).