Regional heavy mineral survey in the exploration for gold using regression: Grenville Province,...
17
Journal of GeochemlcalExploratlon, 47 ( 1993 ) 45-61 45 Elsevier Science Pubhshers B V, Amsterdam Regional heavy mineral survey in the exploration for gold using regression: Grenville Province, southwestern Quebec Claude Bellehumeur and Michel J6brak Umverstte du Qudbec a Montrkal, Dbpartement des Sciences de la Terre, C P 8888 Succ 4 Montreal, Quebec H36 3P8, Canada (Received 2 July 1991, accepted after revision 21 May 1992 ) ABSTRACT Bellehumeur, C and J6brak, M, 1993 Regional heavy mineral survey m the exploration for gold using regression Grenville Province, southwestern Quebec In F W Dlckson and L C Hsu (E&- tors), Geochemical Exploration 1991 J Geochern E~plor, 47 45-61 A geochemical reconnaissance heavy mineral survey has been canned out m the area of the Gat~- neau River Valley, over a part of the Grenville Province of Quebec The majority of samples show gold concentrations below the detection limit of 5 ppb, and anomahes are erratic To circumvent these problems and to present an accurate image of the gold-bearing potential of the area, a regression analysis has been apphed to the samples whose gold concentrations were above the detection hmlt The regression of gold on chalcophde pathfinder elements (As, Se and Pb) explains 11% of the gold variance Bedrock htholog~es, overburden cover and physlco-chemlcal characteristics are ~mportant factors influencing the chalcophde element dispersion pattern Principal component analysis was used to characterize the pnnclpai rater-element relationships and to identify the factors influencing the dis- persion of chalcophde elements A filtenng procedure was used to remove the background effects influencing the pathfinder elements, and to enhance the Influence of mmerahzat~on This procedure uses standard formulas for partial reconstruction of the data matrix from results of principal compo- nent analysis The regression model constructed with these corrected data explains 20% of gold van- ance It constitutes an improvement over the model which uses non-filtered data The equation referred from regression was apphed to the whole data set and provided an estimation of gold at each samphng point Exploration targets are defined from highest gold concentrations esti- mated by regression The regression model aided in the defimtlon of some well defined anomahes associated with geologacal structures favourable to gold mlnerahzatlon INTRODUCTION Geochemical prospecting for gold must deal with many problems Natural low gold concentrations and heterogeneous distribution m the samples create Correspondence to M J6brak, Umverslt6 du Quebec a Montr6al, D6partement des Sciences de la Terre, C P 8888, Succ A, Montreal, Qu6bec H3C 3P8, Canada 0375-6742/93/$06 00 © 1993 Elsevier Science Pubhshers B V All rights reserved
Transcript of Regional heavy mineral survey in the exploration for gold using regression: Grenville Province,...

Journal of GeochemlcalExploratlon, 47 ( 1993 ) 45-61 45 Elsevier Science Pubhshers B V , Amste rdam
Regional heavy mineral survey in the exploration for gold using regression: Grenville Province,
southwestern Quebec
Claude Bellehumeur and Michel J6brak Umverstte du Qudbec a Montrkal, Dbpartement des Sciences de la Terre, C P 8888 Succ 4
Montreal, Quebec H36 3P8, Canada
(Received 2 July 1991, accepted after revision 21 May 1992 )
ABSTRACT
Bellehumeur, C and J6brak, M , 1993 Regional heavy mineral survey m the exploration for gold using regression Grenville Province, southwestern Quebec In F W Dlckson and L C Hsu (E&- tors), Geochemical Exploration 1991 J Geochern E~plor, 47 45-61
A geochemical reconnaissance heavy mineral survey has been canned out m the area of the Gat~- neau River Valley, over a part of the Grenville Province of Quebec The majority of samples show gold concentrations below the detection limit of 5 ppb, and anomahes are erratic To circumvent these problems and to present an accurate image of the gold-bearing potential of the area, a regression analysis has been apphed to the samples whose gold concentrations were above the detection hmlt The regression of gold on chalcophde pathfinder elements (As, Se and Pb) explains 11% of the gold variance
Bedrock htholog~es, overburden cover and physlco-chemlcal characteristics are ~mportant factors influencing the chalcophde element dispersion pattern Principal component analysis was used to characterize the pnnclpai rater-element relationships and to identify the factors influencing the dis- persion of chalcophde elements A filtenng procedure was used to remove the background effects influencing the pathfinder elements, and to enhance the Influence of mmerahzat~on This procedure uses standard formulas for partial reconstruction of the data matrix from results of principal compo- nent analysis The regression model constructed with these corrected data explains 20% of gold van- ance It constitutes an improvement over the model which uses non-filtered data
The equation referred from regression was apphed to the whole data set and provided an estimation of gold at each samphng point Exploration targets are defined from highest gold concentrations esti- mated by regression The regression model aided in the defimtlon of some well defined anomahes associated with geologacal structures favourable to gold mlnerahzatlon
I N T R O D U C T I O N
Geochemical prospecting for gold must deal with many problems Natural low gold concentrations and heterogeneous distribution m the samples create
Correspondence to M J6brak, Umvers l t6 du Quebec a Montr6al, D6par tement des Sciences de la Terre, C P 8888, Succ A, Montreal , Qu6bec H3C 3P8, Canada
0375 -6742 /93 /$06 00 © 1993 Elsevier Science Pubhshers B V All rights reserved

46 C BELLEHUMEUR AND M JEBRAK
difficulties for collecting and prepanng representative samples for analysis Gold concentraUons are easily affected by the nugget effect, which can be compared to a random phenomenon that masks the true geochemical signal Many papers have studied the design of geochemical exploration surveys which specifically aim for gold mineralization (Clifton et al , 1969, Harris, 1982, Nichol, 1985, Day and Hetcher, 1986, Paopongsawan and Hetcher, 1991 ) Generally, the collection and analysis of representative samples re- quires talong large volumes of matenal and specific granulometrlc and heavy mineral separations, adapted to the characteristics of the mineralization Typical designs of geochemical surveys for general multlelement assessments do not have the same requirements, consequently they encounter many prob- lems with gold data. Many gold concentrations are below or equal to the de- tection limit and anomalies are typically extremely erratic and difficult to confirm, giving a poor estimate of the gold potential of the region These sur- veys could contain useful information for gold prospecting, and a close look at commonly associated pathfinder elements is warranted Many pathfinder elements have been commonly used in gold exploration Boyle (1979) men- tions that Ag, As and Sb are typically enriched in all types and ages of eplge- netlc gold deposits Elements such as TI, Se, B, BI, Hg and W are commonly ennched in gold deposits, but seem to be restricted to specific mineral belts Cu, Zn, Pb, Cd and Ba reflect the presence of polymetalhc sulfide deposits and can be useful indicators of some kinds of gold deposits
Usually, the pathfinder elements are used without specific knowledge of the quality of their relationship with the gold content The intent of this paper IS to set out a methodology Involving pathfinder elements for geochemical gold exploration. We have used data from stream sediment heavy mineral concen- trates collected by the Quebec Department of Energy and Resources (Chol- nitre, 1988)
Regression analysis is used to model the distribution of gold concentrations on the basis of pathfinder element concentrations This technique determines which elements are linked significantly to gold and quantitatively evaluates the goodness of fit of the model A filtering procedure was used to remove the background effects influencing the pathfinder elements, and to enhance the influence of mineralization. This procedure uses standard formulas for par- tial reconstruction of data matnces from results of principal component anal- ysis (Lebart et al , 1984, Marcotte and Fox, 1990) The regression model is constructed with these corrected data
G E O L O G I C A L SETTING A N D M I N E R A L I Z A T I O N S
The geochemical survey lies within the Grenville Structural Province of the Canadian Shield, in southwestern Quebec (Fig 1 ) It is confined to two ma- jor units of the Grenville Province, the Allochthonous Mono- and Polycycllc

REGIONAL HEAVY MINERAL SURVEY IN THE EXPLORATION FOR GOLD USING REGRESSION 47
~7 °
46 °
76 ° Syenite Granite
MONT-LAURIER TERRANE -~ ~ Marble / Gneiss
BASKATONG TERRANE -~ ~ Gneiss
Fig 1 Location and general geology of the study area (after Avramtchev and Plch6, 1981 )

48 c BELLEHUMEURANDM JEBRAK
Belts (Rivers et al , 1989 ) To the southeast, the Mont-Launer Terrane (MLT) constitutes a p o m o n of the Monocychc Belt It is composed of Middle Pro- terozolc supracrustal rocks (1300-1200 Ma) which have been thrusted on Early Proterozolc Terranes Marbles are abundant in the northwest part of the MLT; metapelltes, quartzltes, amphlbolltes and granulltlC gnelsses pre- dominate elsewhere These hthologles were affected by the Grenvlllian oro- genic cycle (1250-1050 Ma, Moore and Thompson, 1980) The degree of metamorphism varies from upper amphibohte to granuhte facies The MLT hosts a series of potasslc intrusions and pegmatltes which could have been generated at the end of the Grenvllllan deformation (Ayres and Cerny, 1982, Corrlveau, 1989)
To the northwest, the Allochthonous Polycychc Belt consists mainly of Apheblan grey gneisses of granuhte facies These hthologles occur in a 30 km wide band called the Baskatong Terrane which is separated from the Mono- cyclic Belt to the southeast by a highly deformed zone (Hanmer and Cleslel- ski, 1984)
The majority of precious metal deposits of the Grenville Province are con- tamed in Paleohehkian supracrustal rocks. These rocks host some strata- bound base and precious metal deposits of possible volcanogenlc origin such as the Calumet, Montauban and Simon mines These deposits are associated with quartz, biotite and garnet gnelsses containing bands of coarse b~otlte, cordierite and anthophylhte (Bishop and JourdaIn, 1987, Jourdam et al , 1987) The Calumet Mine is located in the study area, but it was not specifi- cally sampled during the field work The Grenville Province also hosts some small eplgenetic deposits. The majority are located in southeastern Ontario (Carter and Colvine, 1985 )
The dominant ice flow direction during the late Wlsconsinan glaciation was southerly, down the Gatmeau Valley (Kettles and Shllts, 1989) Till is the most widespread deposit, forming a thin cover over Precambrian bedrock Along the Ottawa and Gatmeau Valleys, glaciomarlne and glaclolacustrlne sediments predominate. The Ottawa and Lower Gatmeau X'alleys were inun- dated by the Champlain Sea, and the upper part of the Gatineau Valley by a late glacial Lake (Richard, 1975, Gadd, 1980)
SAMPLING AND ANALYTICAL METHOD
Stream sediment samples were collected from 1644 sites over an area of 17700 km 2 ( 1 per 10 km 2) The samples were sieved in the field to - 850/tm ( - 20 mesh) A volume of 4 litres of material was collected from each site The heavy fraction was separated with a gravity table The samples were dried and magnetic fractions were removed with a hand magnet Cholnl6re ( 1988 ) demonstrated that the samples contained 15% to 30% of light materials (d< 3.3 g /cm 3 ) after this treatment The concentration factor (Initial Weight/

REGIONAL HEAVY MINERAL SURVEY IN THE EXPLORATION FOR GOLD USING REGRESSION 49
Non-magnetic Heavy Concentrate Weight) of the heavy concentrates varied from 40 to 100.
The heavy non-magnetic material was pulverized to - 177 gm ( - 80 mesh) and digested in hot HNO3. The determination of Ag, A1, B, Be, Ca, Cd, Ce, Co, Cr, Cu, Eu, Fe, K, La, LI, Mg, Mn, Mo, Na, P, Pb, Sm, Sr, Th, T1, V, Y and Zn was by plasma emission spectrometry and Hg by atomic absorption spectrometry. One gram of matenal was analyzed for As, Au, Br, Cs, Sb, Se, Tm, U, and W by instrumental neutron activation
GEOCHEMICALDATA
The geochemical data relate to two different llthotectonic domains, Mont- Launer Terrane and Baskatong Terrane The data must be treated separately because they have very different background levels (Bellehumeur and J6brak, 1992) Because our work attempts to describe a general methodology, only the results from the Mont-Launer Terrane (MLT) of the Monocychc Belt are presented here.
Only 265 samples, representing about 25% of the MLT samples, have gold concentrations above the detection limit of 5 ppb. Sixteen samples are more than 20 ppb, two of which have concentrations of 429 and 805 ppb (Fig 2)
Figure 3 shows the distribution of gold concentrations As mentioned by Cholnl6re ( 1988 ), two large anomalous areas are worthy of note in the MLT They are respectively located north of Hull (A) and east of Baskatong Res- ervoir (B) The majority of anomalous samples north of Hull are located in a flat area of the Gatlneau River Valley, where there IS a great thickness of glacgofluvlal debris (Kettles and Shllts, 1989) Therefore, these anomalous samples are probably not related to local mineralization The Baskatong Res- ervoir anomaly IS located over a succession of metasedlmentary rocks The
v
o" q) LL
MONT-LAURIER TERRANE
4 o - ~ , n = 2 6 5
~ ' ~ = 9 10 /.4 3 o - / / ~ s = 3 3 4 /A / /I
20 - ~
10
0 10 14 18 22
Au (ppb)
J0~805 26
Fig 2 Frequency histograms of gold m heavy mineral concentrates of stream se&ments, Mont Launer Terrane ~?=anthmetlc mean, s=standard deviation

50 C BELLEHUMEUR AND M JEBRAK
Au (ppb)
• >25 • 18-25
[] 15-18
[] 10-15 • 8-10
2 0 km I I
n C A L U M E T 1 D E P O S I T I'l //'0
[]
• []
[] []
No Data
• [ ]
[] Reservoir []•
[] . . m
" []
" 0
o e
% A ' n
I []
,3
76 °
47 o
46 °
Fig 3 The d ls tnbut lon of gold m heavy mineral concentrates of stream sediments, Mont-Lau- her Terrane Sample points displayed on the map represent gold concentrat ions greater than the 85th percentile Dashed lines delimit areas containing high gold concentrations
anomaly is large, but anomalous samples are poorly grouped Finally, a num- ber of single-point anomahes are scattered throughout an extenswe area, along the Gatmeau River Valley (C)

REGIONAL HEAVY MINERAL SURVEY IN THE EXPLORATION FOR GOLD USING REGRESSION
U S E O F P A T H F I N D E R E L E M E N T S F O R G O L D P R O S P E C T I N G
51
Regresston model
A regression model of chalcophlle pathfinder elements (As, Pb, Se) was used to estimate the gold concentrations in heavy mineral concentrates of stream sediment samples Most elements show asymmetrical ummodal dls- tnbut~ons, consequently, pnor to statistical calculations, the element concen- trations were transformed to their natural loganthms Th~s transformation reduces the effect of h~gh values which may strongly influence the calculation (regression and principal component analysis), and assists m meeting the assumptions of normality of vanables. To s~mpllfy subsequent calculations (filtenng of lithologlcal background effects), all natural logarithm-trans- formed vanables were expressed in the standard normal form of zero mean and umt standard deviations As a result, the constant of the regression (~ e intercept) becomes zero. We employed a stepwlse procedure which selects only the variables making a slgmficant contribution to the regression Only samples w~th gold concentrations above the detection hmlt of 5 ppb were em- ployed in developing the model Considered as gross outhers, the two high values of 429 and 805 ppb were removed from the database.
The elements which contribute significantly to the estimation of gold val- ues are As, Se and Pb (Table 1 ) They explain 11% of the variance of gold and have a multiple correlation coefficient of 0 33 The analys~s of vanance (Fisher statistical test), revolving the ratio of mean squares due to regression and mean squares due to devmtlon, indicates a slgmficant regression at the 5% significance level.
TABLE 1
Mult iple regression o f gold, M o n t - L a u n e r Terrane (n = 263) Coeff are the coefficients for the pre- dictors in explaining gold Par t R 2 indicates the % of var iance m Au explained by each predictor Corr is the mul t ip le correlat ion coefficient The F-Value is the ratio o f m e a n squares due to regression and m e a n squares due to devia t ion The critical F-Value at the 5% slgmficance level is 2 60
Predictors Coef f Part R 2 (%)
As 0 25 6 20 Pb 0 12 1 40 Se 0 19 3 40
R 2 11 00 Corr 0 33 F-Value 10 50

52 C BELLEHUMEUR AND M JEBRAK
Correctton of background and hydrodynamtc effects
The proportion of vanance explained by the model is low. A part of gold and pathfinder element variation is influenced by factors not related to mi- neralization, and these factors could mask the true geochemical signal
Bedrock hthologaes, overburden cover and physlco-chemical characteris- tics are important factors influencing the chalcophlle element dispersion pat- tern (Closs and Nlchol, 1975, Hale, 1981; Roquln and Zeegers, 1987) For example, the chalcophlle element concentrations are strongly affected by ad- sorption phenomena and by host minerals such as ferro-magnesian silicates and Fe-Mn oxides.
Principal component analysis (PCA) was used to characterize the pnncl- pal inter-element relationships and to identify the factors influencing the dis- persion of chalcophile elements. PCA is a multivariate technique where the correlation matrix is decomposed into an uncorrelated set of new variables (components) which are linear combinations of the original element values The components are extracted in such a way that the first accounts for as much of the total vanabihty of the data as possible, the second for as much as possible of the residual vanance, and so on These components correspond to the elgenvectors of the correlation matnx (Howarth and Martin, 1979 )
Table 2 shows the results of PCA employing 21 selected elements. The first component explains the dispersion of C a - P - L a - Y - T h as well as A1-Fe-Mg- Mn-T1 which indicates the occurrence of apatlte and /o r monazlte, and gar- net, metallic oxides and mafic silicates The samples exhibiting high first component scores are restricted to area of charnoclotic gneisses of granulltlC metamorphic facies The C a - P - L a - Y - U association is linked positively to component 2, whilst AI -Ba-Fe-Mn-NI contrast negatively with this compo- nent The positive expression of the component 2 is related to felsic Intru- sions, pegmatites and quartzo-feldspathlc gnelsses while the negative side is related to the presence of amphibohtes The three other factors may be as- cribed to mineralization
These results show that the first two components constitute a hthologlcal background model They account for most of the hthophile and siderophlle element variations and characterize the common mineralogy of hthologic units. The projection of samples onto the first two eigenvectors enables new variables (component scores) to be calculated which model the background variations ascribed to hthologlc units This type of modeling can be of a great interest in geochemical exploration. An important proportion of the variance of elements of economic interest depends on charactenstics of llthologlc units Cu, Zn, As, Pb and Se, usually having a chalcophlle behavior, are strongly related to this background model. The square of each component loading is weighted proportionally to the amount of variance contributed by a variable to the component The first two components explain respectively 54%, 41%,

REGIONAL HEAVY MINERAL SURVEY IN THE EXPLORATION FOR GOLD USING REGRESSION 5 3
T A B L E 2
Principal c o m p o n e n t analysis performed on the > 5 p p b gold data subset Each co lumn xs an e~gen- vector , / t ~s the assocmted elgenvalue and % gives the percentage o f total v a n a t m n accounted by the elgenvectors Loadmgs smaller than 0 25 are not presented Component s were extracted from the
correlation matrix
F I F 2 F 3 F 4 F 5
6 6 7 2 8 2 1 70 1 35 I 10
% 3 1 8 0 1 3 4 0 8 10 6 4 0 5 2 0
~Xl 0 67 - 0 39 - - 0 47 -
As 0 39 - - 0 36 - 0 42
Ba 0 34 - 0 36 - 0 26 - Ca 0 72 0 55 - - -
C u 0 68 - 0 27 - 0 31 -
F e 0 77 - 0 38 - - -
H g - - 0 52 - -
L a 0 77 0 33 - - - Mg 0 78 . . . .
M n 0 67 - 0 28 - - 0 37 - N1 0 6 4 - 0 27 - - 0 38
P 0 6 0 0 62 - 0 33 - -
P b 0 4 0 - 0 26 0 29 0 42 -
S b - 0 29 0 52 - -
Se - 0 54 0 37 - 0 52
T h 0 71 0 27 - 0 31 -
T~ 0 61 - 0 38 - 0 4 0 - 0 27
U - 0 63 0 4 4 - -
W - - 0 38 - -
Y 0 74 0 52 - - -
Z n 0 54 - 0 35 - - 0 31
16%, 23% and 30% of these element variations The data will more positively reflect the influence of mineralization by removing the effect of those factors
The filtenng technique, proposed by Marcotte and Fox (1990) , was used to eliminate the background effect which can mask the influence of mmerah- zation A total of 21 variables were used to characterize the background ef- fect, consequently PCA calculated 21 elgenvectors which establish inter-ele- ment relationships, and 21 new variables commonly named component scores These matrices can be use to filter the original data matrix by excluding the first two components from the calculation Lebart et al , (1984) demon- strated that that the original data matrix X can be reconstructed using the following relationship
P
x= Z c,u', l = l
54 C BELLEHUMEURAND M JEBRAK
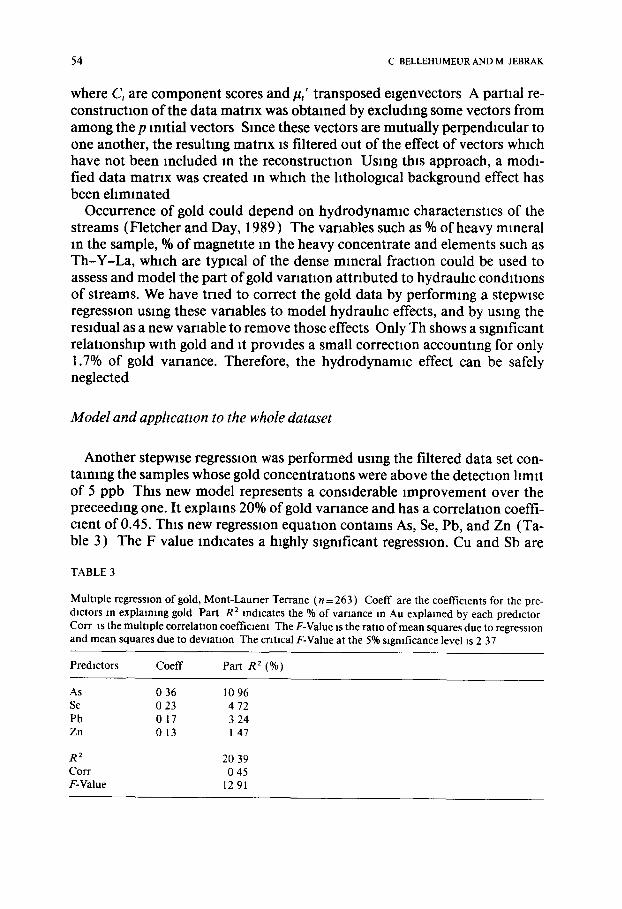
where C, are component scores and/~,' transposed elgenvectors A partial re- construction of the data matrix was obtained by excluding some vectors from among the p initial vectors Since these vectors are mutually perpendicular to one another, the resulting matrix is filtered out of the effect of vectors which have not been included in the reconstruction Using this approach, a modi- fied data matrix was created in which the hthologlcal background effect has been eliminated
Occurrence of gold could depend on hydrodynamic characteristics of the streams (Fletcher and Day, 1989 ) The variables such as % of heavy mineral In the sample, % of magnetite in the heavy concentrate and elements such as Th-Y-La, which are typical of the dense mineral fraction could be used to assess and model the part of gold vanatlon attributed to hydraulic conditions of streams. We have tried to correct the gold data by performing a stepwise regression using these variables to model hydraulic effects, and by using the residual as a new variable to remove those effects Only Th shows a significant relationship with gold and it provides a small correction accounting for only 1.7% of gold variance. Therefore, the hydrodynamic effect can be safely neglected
Model and apphcatton to the whole dataset
Another stepwlse regression was performed using the filtered data set con- taming the samples whose gold concentrations were above the detection limit of 5 ppb This new model represents a considerable improvement over the preceedlng one. It explains 20% of gold variance and has a correlation coeffi- cient of 0.45. This new regression equation contains As, Se, Pb, and Zn (Ta- ble 3) The F value indicates a highly significant regression. Cu and Sb are
TABLE3
Multiple regression of gold, Mont-Laurler Terrane (n = 263) Coeff are the coefficients for the pre- dictors in explaining gold Part R 2 indicates the % of variance in Au explained by each predictor Corr IS the multiple correlation coefficient The F-Value ~s the ratio of mean squares due to regression and mean squares due to deviation The critical F-Value at the 5% significance level is 2 37
Predictors Coeff Part R 2 (%)
As 0 36 10 96 Se 0 23 4 72 Pb 0 17 3 24 Zn 0 13 1 47
R 2 20 39 Con- 0 45 F-Value 12 91

REGIONAL HEAVY MINERAL SURVEY IN THE EXPLORATION FOR GOLD USING REGRESSION 5 5
-$ 0
"o
o v
<
4
3
2
1
0
1
-2 3
I i I i
• • • ° o ° o • g o • •
• • o • • • o • • •
• g o o o o o • o o • •
• • D O g o o o o g o
e o o • g o d • • g o g o
• • B O O • • g o g o • • • •
e o o O o O O O • O e o o o • •
• • o o o o o o O O O O O • • •
• • g o • • • • • g o • O • g o • •
e o o O O O O O O • O O O • • •
I I I I I
2 1 0 1 2
As (filtered values)
4
3
m 2
" o O > t
O
O 0
i I I I i
- . . . . " .
• ." 222.." . ' . • o o o o g i g • • •
• • g o g o • • g o • •
• • o o o o o o o o o o o o o •
• • o o o o o o • g o • o o
• o o o o o o o o o • •
o o o • o o o o o o e o o o o • •
• • • e • • g o • g o • • • • •
I 1 I I I
-2 -1 0 1 2
A u ( p r e d i c t e d v a l u e s )
° o
o o
l
3 4
Fig 4 Scatterplot of observed gold values versus filtered As values and scatterplot of observed gold values versus predicted gold values All data are expressed m standard devlauons
only slightly significant and contribute little to gold estimation Figure 4 shows the scatterplot of filtered As concentrations (the best predictor of gold) ver- sus gold, and the scatterplot of observed gold values versus predicted gold values Table 4 gives the correlation matrix of gold and its predictors.
After filtenng, 80% of Au variance remains unexplained. Two mamdea- tures could produce high levels of variation and noisy data ( 1 ) the low abun- dance of Au in ore deposits and its random occurrence mostly as native grams, (2) the low quantity of material ( 1 to 3 g) commonly used m standard neu- tron activation analysis standard procedures. The correlations observed be- tween gold and its pathfinder elements appear low, but they are significant In addition, the highest correlations established between gold and widely rec- ognized pathfinder elements such as As, Se, Pb and Zn indicate that the sul- fides probably control in part the gold distribution

56 C BELLEHUMEUR AND M JEBRAK
T A B L E 4
C o r r e l a t i o n m a t r i x o f f i l t e r e d g o l d p r e d i c t o r s a n d go ld , > 5 p p b g o l d d a t a s u b s e t C o r r e l a t i o n s h i g h e r
t h a n 0 12 o r l o w e r t h a n - 0 12 a r e s t a t i s t i c a l l y s i g n i f i c a n t a t t h e 5% s l g m f i c a n c e level ( u n d e r Ho r = 0,
n = 2 6 3 )
A s Se P b Z n
A u 0 3 2 0 2 2 0 2 4 0 18
Z n 0 11 0 22 - 0 0 4
P b 0 18 0 l l
Se - 0 2 0
T A B L E 5
P n n c ~ p a l c o m p o n e n t a n a l y s i s p e r f o r m e d o n the w h o l e d a t a se t E a c h c o l u m n is a n e ~ g e n v e c t o r , / t ~s
t h e a s s o o a t e d e l g e n v a l u e a n d % g ives t h e p e r c e n t a g e o f t o t a l v a r i a t i o n a c c o u n t e d b y t h e e~genvec to r s
L o a d l n g s s m a l l e r t h a n 0 25 a re n o t p r e s e n t e d C o m p o n e n t s w e r e e x t r a c t e d f r o m the c o r r e l a t i o n m a t r i x
F 1 F 2 F 3 F 4 F5
/t 6 63 2 82 1 6 0 1 37 1 13
% 31 57 13 4 0 7 62 6 52 5 38
A1 0 6 3 - 0 4 9 - - 0 36 -
As 0 4 0 - - 0 39 - 0 4 0
Ba 0 39 - 0 2 9 - - -
C a 0 77 0 47 - 0 26 - -
C u 0 67 - 0 26 - 0 26 -
Fe 0 69 - 0 50 - - -
H g - - 0 4 1 - - 0 29
La 0 8 0 0 30 - - -
M g 0 69 . . . .
M n 0 67 - 0 26 - - 0 43 -
N 1 0 4 2 - 0 4 0 - 0 29 0 45
P 0 6 6 0 52 - 0 31 - -
P b 0 42 - 0 4 0 0 34 - 0 30
Sb - - 0 53 - -
Se - 0 4 4 0 49 - 0 47
T h 0 75 0 3 4 - - -
T1 0 6 0 -- -- - 0 4 7 -
U 0 2 9 0 65 0 36 - -
W - - 0 4 6 - 0 37 Y 0 7 8 0 4 1 - - -
Z n 0 51 - 0 39 - - -
The regression model was applied to the whole data set to provide infor- mation about gold over the study area To do this, It IS necessary to remove the influence o f background variations on the whole data set PCA performed on the whole data set (Table 5 ) gives the same result as PCA performed on the data subset containing gold concentrations > 5 ppb Consequently, we

REGIONAL HEAVY MINERAL SURVEY IN THE EXPLORATION FOR GOLD USING REGRESSION 57
Gold predicted by the regression (standard devtatlons from the mean1
W 2 25-3 75
0
1 0
q
0
q n 0
I
3
J
1
I
1
47”
16”
76”
Fig 5 The dlstnbutlon of gold predlcted by regresslon Sample pomts displayed on the map represent gold estlmatlons greater than the 85th percentde
removed the influence of background vanatlon on the whole data set by ex- cluding the first two components of matrices of PCA Based on the > 5 ppb gold data subset, the regresslon model was then applied to the whole data set, and from this, we proceeded to identify the anomalies

5 8 C B E L L E H U M E U R A N D M J E B R A K
ANOMALY MAP
Figure 5 is the anomaly map of gold estimated by the regression, In which elemental contribution from background lltholog~cal effects estimated by the first two pnncIpal components of the data have been filtered out of the origi- nal data set The area north of Hull was originally the most important anom- aly in the MLT The regression strongly reduces the contrast and the extent of this anomaly A few high values are grouped together and they are still located in a flat area where there is a great thickness of g l a c l o f l u v l a l debris Gold is not related to pathfinder elements in this area
The east Baskatong Anomaly becomes more interesting (Fig 6 ) It is a high gold background area, but no clear gold anomaly is defined by the raw data However, the regression enhances the anomaly as a 20 km long alignment of 11 anomalous adjoining samples This NE-SW alignment is located along the contact between granuhtic f a c i e s charnockltiC gnelsses and amphibohte facies
[ I Syemte ~ Marble Granite [ I Paragnelss Uonzon, te t , ,I Granuhte
:r..,~_- - Fault zone m B L ineament / /
Gold predicted / ) by the regression ) (s tandard dewat)ons from the mean)
m 2 25-3 75 / / [ ] 1 6-2 25 [] 1 2 - 1 6 • < 1 2
[]
. • .
~ [] ° •
1 0 k m I
47 °
76 °
Fig 6 The distribution of gold predicted by regression in the area of the Baskatong Reservoir

REGIONAL HEAVY MINERAL SURVEY IN THE EXPLORATION FOR GOLD USING REGRESSION 59
paragnelss This metamorphic contrast could be related to major faults Landsat images show many hneaments parallel to this contact (L6vesque et al , 1990) The catchment basin of these samples is less than 200 km 2 The regression model has enabled us to dehmit an interesting and very well de- fined target
To the north of the Baskatong Reservoir, gold estimated by the regression shows many adjacent anomalous samples located along the contact between the Monocychc and Polycychc Belts and near granitic and monzonltlC intrusions
CONCLUSIONS
The gold raw data does not permit an accurate appraisal of the gold-beanng potential of the area The anomalies are small and isolated, and the targets are not well defined The use of a regression model based on pathfinder ele- ments, with less erratic behaviour than gold, can be more revealing of that potential
The background variations of chalcophlle element concentrations are influ- enced by hthologlc units. These background variations were modeled using principal component analysis They were removed from the original data set by partial reconstruction of the data matrix A regression model was em- ployed to esUmate the gold concentrations from the residual pathfinder ele- ment estimates after filtenng the background effects The model accounts for 20% of the gold variation. It involves the chalcophile pathfinders As, Se, Pb and Zn, all of which could be indicators of sulfide minerals This model rep- resents a considerable improvement over the non-filtered data model It en- ables some well defined anomalies assooated with geological structures fa- vourable to gold mineralization to be identified Thus, regression analysis estimating gold abundance is a useful, complementary technique for the Interpretation of reconnaissance prospecting
ACKNOWLEDGEMENTS
This study was funded by grants to M. J6brak from the Quebec Department of Energy and Resources C. Bellehumeur received financial assistance from UQAM and a Natural Soences and Engmeenng Research Council of Canada Postgraduate Scholarship. Professor James Bourne is thanked for his numer- ous valuable comments
REFERENCES
Avramtchev, L and Plch~, G , 1981 Carte des gites mm6raux du Qu6bec, r6glon de Laurentle- Saguenay, Mmlst~re de l'Energle et des Ressources du Qu6bec, DPV 809
60 c BELLEHUMEUR AND M JEBR~K
~,yres, L D and Cerny, P, 1982 Metallogenv ofgranltold rocks m the Canadian Shield Can Miner, 20 439-535
Bellehumeur, C and J¢brak, M, 1992 Analyse multl&menslonnelle des donnees g6ochlm~ques apphqu6es ~ la prospectmn dans la r6glon de la Gatlneau Mlnlstere de l'Energle et des Res- sources du Qu6bec, MB 92-05, 45 pp
Bishop, C and Jourdam, V, 1987 Grenville polymetalhcs, the Montauban and Grand Calumet deposits North Mln Mag,December 1987 15-17
Boyle, R W, 1979 The geochemistry of gold and its deposxts (together with a chapter on geo- chemical prospectmg for the element) Geol Surv Can Bull 280, 584 pp
Carter, T R and Colvlne, A C, 1985 Metallic mineral deposits of the Grenville Province, southeastern Ontario Can Inst Mm Metall Bull, 78 95-106
Cholnlere, J 1988 Geochlmle des mlneraux lourds, region de la Gatlneau Mlnistere de 1 E- nergle et des Ressources du Quebec, MB 88-35, 38 pp
Clifton, H E Hunter, R E, Swanson, F J and Phllhps, R L, 1969 Sample size and meanmgful gold analysls U S Geol Surv, Prof Pap 625-C, 17 pp
Closs, L G and Nlchol, I , 1975 The role of factor and regression analysts in the interpretation of geochemical reconnaissance data Can J Earth Sci, 12 1316-1330
Corrlveau, L, 1989 The ultrapotasslc Kensmgton pluton, SW Grenvdle Province In k Cor- rlveau, D Gold, J B6dard and J Bourne (E&tors), Alkahne and Calc-alkahne Complexes of Southern Quebec-FleldTnp B3 Geol Ass Can/Miner Ass Can, Montreal, pp 1-22
Day, S and Fletcher, W K, 1986 Particle size and abundance of gold in selected stream sedi- ments, southern British Columbm, Canada J Geochem Explor, 26 203-214
Fletcher, W K and Day, S J , 1989 Behavmur of gold and other heavy mmerals in dramage sediments some lmphcatlons for exploratmn geochemical survey Trans Instn Mm Metall (Sect B Appl Earth Scl ), 98 130-136
Gadd, N R, 1980 Late-glacial regional ice-flow patterns m eastern Ontario Can J Earth Scl 17 1439-1453
Hale, M, 1981 Pathfinder apphcatlons of arsenic, antimony and bismuth m geochemical ex- ploration J Geochem Explor, 15 307-323
Hanmer, S K and Cleslelski, A, 1984 A structural reconnaissance of the northwest boundar~ of the Central Metasedlmentary Belt, Grenville Province, Ontario and Quebec Current Re- search, Part B, Geol Surv of Canada, Paper 84-1 B, pp 121-131
Harris, J F , 1982 Samphng and analytical requirements for effective use of geochemlstD in exploratmn for gold In A A Levmson (Editor), Precious Metals in the Northern Cordil- lera The Assoclatmn ofExploratmn Geochemlsts, Spec Vol 10, pp 53-67
Howarth, R J and Martin, L, 1979 Computer-based techmques in the compflatmn, mapping and interpretatmn ofexploratmn geochemical data In P J Hood (E&tor), Geophysics and Geochemistry m the Search for Metalhc Ores Geol Surv Can Econ Geol Rep 31 545- 574
Jourdam, V, Roy, D W and Slmard, J M, 1987 Stratigraphy and structural analysts of the north gold zone at Montauban-les-Mmes, Quebec Can Inst Mm Metall Bull, 80 61-66
Kettles, I M and Shflts, W W, 1989 Geochemistry of drift over the Precambrmn Grenville Province, southeastern Ontario and southwestern Quebec In R N W D~Labm and W B Coker (E&tors), Drift Prospecting Geol Surv of Canada, Paper 89-20, pp 97-112
I-ebart, L, Morineau, A and Warwick, K M, 1984 Multivariate Descriptive Statistical Anal- ysis Wiley, New York, NY, 231 pp
Levesque, J , Sharma, K N M and Globensk~, Y, 1990 Supervision, etudes geologlques et teledetectmn Rapport d'actwlt6s 90 Mmlst6re de l'Energxe et des Ressources du Qu6bec, DV 90-10
Marcotte, D and Fox, J S, 1990 The Shefferwlle area mulUvanate analysis used to enhance lnterpretatmn of lake sediment geochemical data J Geochem Explor, 38 247-263

REGIONAL HEAVY MINERAL SURVEY IN THE EXPLORATION FOR GOLD USING REGRESSION 61
Moore, J M and Thompson, P H , 1980 The Fhnton Group a late Precambrlan metasedlmen- tary succession in the Grenville Province of eastern Ontario Can J Earth Scl, 17 1685- 1707
Nlchol, I , 1985 Geochemical exploration for gold a special problem In I Thornton and R J Howarth (Editors), Applied Geochemistry In the 1980's Graham and Trotman, London, pp 40-85
Paopongsawan, P and Fletcher, W K, 1991 Distribution and dispersion of gold in sediments of the Hual Hln Laep, Loel, Northeastern Thailand In 15th Internatxonal Geochemical Exploration Symposmm, Reno, Nevada Abstracts with program, p 38
Richard, S H, 1975 Surficlal geology mapping Ottawa Valley Lowlands (parts of 31G, B F) Report of Activities, Part B, Geol Surv of Canada Paper 75-1B, pp 113-117
R~vers, T , Mamgnole, J , Gower, C F and Davldson, A, 1989 New tectomc divisions of the Grenvdle Province, southeast Canadian Shield Tectonics, 8 63-84
Roqum, C and Zeegers, H , 1987 Improving anomaly selection by statxstlcal estimation of background variations m regional geochemical prospecting J Geochem Explor, 29 295- 316