Mineral magnetism and archaeomagnetic dating of a mediaeval oven from Zlatna Livada, Bulgaria
15
Mineral magnetism and archaeomagnetic dating of a mediaeval oven from Zlatna Livada, Bulgaria A.I.R. Herries a,b, * , M. Kovacheva b , M. Kostadinova b a Human Origins Group, School of Medical Sciences, University of New South Wales, Kensington, Sydney 2052, Australia b Geophysical Institute, Bulgarian Academy of Science, Sofia 1113, Bulgaria Available online 19 February 2008 Abstract Archaeomagnetic palaeodirectional and palaeointensity results are presented from a domestic oven at the mediaeval site of Zlatna Livada. Archaeological evidence suggests that the site was occupied in the 11th or 12th C. AD, with the oven dating to the beginning of this period. The samples are dominated by magnetite and maghaemite. In some samples thermally unstable maghaemite occurs with unblocking temperatures between 300 °C and 400 °C, while in others maghaemite is stable to inversion until >600 °C. The mineral mag- netic analyses, Thellier results and sample heterogeneity suggest that the oven was not heated to a very high or consistent temperature in antiquity (<320–<400 °C). Hysteresis measurements show a mixture of single and multi-domain grains, which may account for the var- iability in the success of the Thellier experiments. Water glass, the material used to physically stabilize unconsolidated samples, does not appear to react with the samples’ mineralogy until above 500 °C, and thus does not affect the Thellier results. The oven has a mean pal- aeointensity determination of 72.13 lT, a mean declination of 15.8 o and a mean inclination of 61.9 o . The archaeomagnetic age estimate for the site using all three parameters is between 826 and 1004 AD and using only palaeodirectional data is 777–967 AD. Based on these archaeomagnetic age assessments and the archaeological evidence, the site is best dated to the very end of the 10th C. AD or first few years of the 11th C. AD. This confirms that the oven dates to the early period of site use, although the date is perhaps slightly younger than expected. This paper highlights a number of problems encountered during archaeomagnetic studies and emphasises the need for more reference curve data to increase the precision of the dating method, particularly during the mediaeval period in Bulgaria. Ó 2008 Elsevier Ltd. All rights reserved. Keywords: Archaeomagnetism; Mineral magnetism; Mediaeval oven; Bulgaria; Palaeointensity; Palaeodirection 1. Introduction Archaeomagnetic studies can reveal information about the long-term behaviour of the Earth’s geomagnetic field and, when an adequate reference curve exists, can date archaeological sites and burnt structures (Aitken, 1978; Lanos et al., 1999). Zlatna Livada is located close to the town of Chirpan in south central Bulgaria (lat. = 42.2°, long. = 25.4°; Fig. 1A). The settlement is preliminarily dated by archaeological finds to the 11th–12th C. AD. Based on stratigraphic evidence the oven should date to the beginning of this period and a slightly earlier date is possible (Koleva, personal communication). The oven was constructed by digging into the northern side of a par- tially sunk domestic dwelling. It was most likely used for domestic purposes such as baking bread, although perhaps for more than one family. The oven is domed and has a diameter of between 1.32 and 1.40 m at its base. The oven has a sandy clay floor that consists of two layers of con- struction up to 0.40 m thick. Two stones flank the oven mouth, in front of which, a large trapezium-shaped pit and a smaller and deeper square pit occur. These were dug for the removal of ash from the oven. The aim of this study was to date the site based on the palaeointensity (PI) and palaeodirectional (PD) data 1474-7065/$ - see front matter Ó 2008 Elsevier Ltd. All rights reserved. doi:10.1016/j.pce.2008.02.021 * Corresponding author. Address: Human Origins Group, School of Medical Sciences, University of New South Wales, Kensington, Sydney 2052, Australia. Tel.: +61 (0) 2 9385 1217; fax: +61 (0) 2 9385 8016. E-mail addresses: [email protected], [email protected] (A.I.R. Herries). www.elsevier.com/locate/pce Available online at www.sciencedirect.com Physics and Chemistry of the Earth 33 (2008) 496–510
-
Upload
independent -
Category
Documents
-
view
0 -
download
0
Transcript of Mineral magnetism and archaeomagnetic dating of a mediaeval oven from Zlatna Livada, Bulgaria
Available online at www.sciencedirect.com
www.elsevier.com/locate/pce
Physics and Chemistry of the Earth 33 (2008) 496–510
Mineral magnetism and archaeomagnetic dating of a mediaevaloven from Zlatna Livada, Bulgaria
A.I.R. Herries a,b,*, M. Kovacheva b, M. Kostadinova b
a Human Origins Group, School of Medical Sciences, University of New South Wales, Kensington, Sydney 2052, Australiab Geophysical Institute, Bulgarian Academy of Science, Sofia 1113, Bulgaria
Available online 19 February 2008
Abstract
Archaeomagnetic palaeodirectional and palaeointensity results are presented from a domestic oven at the mediaeval site of ZlatnaLivada. Archaeological evidence suggests that the site was occupied in the 11th or 12th C. AD, with the oven dating to the beginningof this period. The samples are dominated by magnetite and maghaemite. In some samples thermally unstable maghaemite occurs withunblocking temperatures between 300 �C and 400 �C, while in others maghaemite is stable to inversion until >600 �C. The mineral mag-netic analyses, Thellier results and sample heterogeneity suggest that the oven was not heated to a very high or consistent temperature inantiquity (<320–<400 �C). Hysteresis measurements show a mixture of single and multi-domain grains, which may account for the var-iability in the success of the Thellier experiments. Water glass, the material used to physically stabilize unconsolidated samples, does notappear to react with the samples’ mineralogy until above 500 �C, and thus does not affect the Thellier results. The oven has a mean pal-aeointensity determination of 72.13 lT, a mean declination of 15.8o and a mean inclination of 61.9o. The archaeomagnetic age estimatefor the site using all three parameters is between 826 and 1004 AD and using only palaeodirectional data is 777–967 AD. Based on thesearchaeomagnetic age assessments and the archaeological evidence, the site is best dated to the very end of the 10th C. AD or first fewyears of the 11th C. AD. This confirms that the oven dates to the early period of site use, although the date is perhaps slightly youngerthan expected. This paper highlights a number of problems encountered during archaeomagnetic studies and emphasises the need formore reference curve data to increase the precision of the dating method, particularly during the mediaeval period in Bulgaria.� 2008 Elsevier Ltd. All rights reserved.
Keywords: Archaeomagnetism; Mineral magnetism; Mediaeval oven; Bulgaria; Palaeointensity; Palaeodirection
1. Introduction
Archaeomagnetic studies can reveal information aboutthe long-term behaviour of the Earth’s geomagnetic fieldand, when an adequate reference curve exists, can datearchaeological sites and burnt structures (Aitken, 1978;Lanos et al., 1999). Zlatna Livada is located close to thetown of Chirpan in south central Bulgaria (lat. = 42.2�,long. = 25.4�; Fig. 1A). The settlement is preliminarily
1474-7065/$ - see front matter � 2008 Elsevier Ltd. All rights reserved.
doi:10.1016/j.pce.2008.02.021
* Corresponding author. Address: Human Origins Group, School ofMedical Sciences, University of New South Wales, Kensington, Sydney2052, Australia. Tel.: +61 (0) 2 9385 1217; fax: +61 (0) 2 9385 8016.
E-mail addresses: [email protected], [email protected](A.I.R. Herries).
dated by archaeological finds to the 11th–12th C. AD.Based on stratigraphic evidence the oven should date tothe beginning of this period and a slightly earlier date ispossible (Koleva, personal communication). The ovenwas constructed by digging into the northern side of a par-tially sunk domestic dwelling. It was most likely used fordomestic purposes such as baking bread, although perhapsfor more than one family. The oven is domed and has adiameter of between 1.32 and 1.40 m at its base. The ovenhas a sandy clay floor that consists of two layers of con-struction up to 0.40 m thick. Two stones flank the ovenmouth, in front of which, a large trapezium-shaped pitand a smaller and deeper square pit occur. These weredug for the removal of ash from the oven.
The aim of this study was to date the site based onthe palaeointensity (PI) and palaeodirectional (PD) data
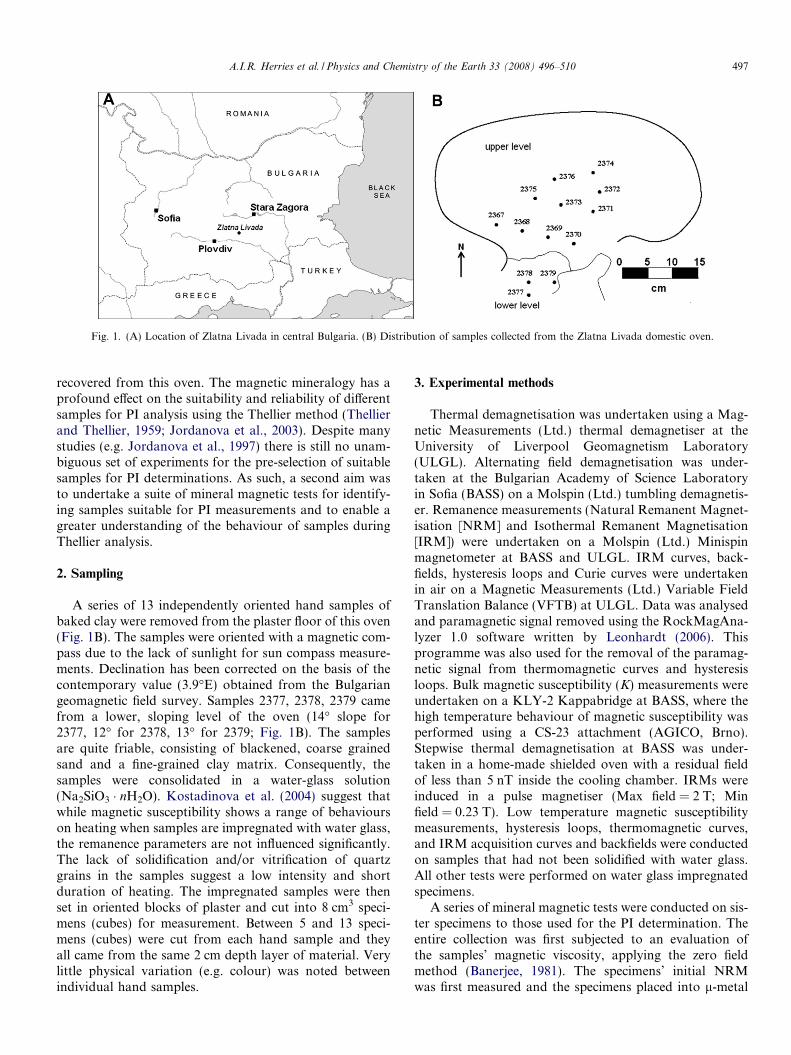
Fig. 1. (A) Location of Zlatna Livada in central Bulgaria. (B) Distribution of samples collected from the Zlatna Livada domestic oven.
A.I.R. Herries et al. / Physics and Chemistry of the Earth 33 (2008) 496–510 497
recovered from this oven. The magnetic mineralogy has aprofound effect on the suitability and reliability of differentsamples for PI analysis using the Thellier method (Thellierand Thellier, 1959; Jordanova et al., 2003). Despite manystudies (e.g. Jordanova et al., 1997) there is still no unam-biguous set of experiments for the pre-selection of suitablesamples for PI determinations. As such, a second aim wasto undertake a suite of mineral magnetic tests for identify-ing samples suitable for PI measurements and to enable agreater understanding of the behaviour of samples duringThellier analysis.
2. Sampling
A series of 13 independently oriented hand samples ofbaked clay were removed from the plaster floor of this oven(Fig. 1B). The samples were oriented with a magnetic com-pass due to the lack of sunlight for sun compass measure-ments. Declination has been corrected on the basis of thecontemporary value (3.9�E) obtained from the Bulgariangeomagnetic field survey. Samples 2377, 2378, 2379 camefrom a lower, sloping level of the oven (14� slope for2377, 12� for 2378, 13� for 2379; Fig. 1B). The samplesare quite friable, consisting of blackened, coarse grainedsand and a fine-grained clay matrix. Consequently, thesamples were consolidated in a water-glass solution(Na2SiO3 � nH2O). Kostadinova et al. (2004) suggest thatwhile magnetic susceptibility shows a range of behaviourson heating when samples are impregnated with water glass,the remanence parameters are not influenced significantly.The lack of solidification and/or vitrification of quartzgrains in the samples suggest a low intensity and shortduration of heating. The impregnated samples were thenset in oriented blocks of plaster and cut into 8 cm3 speci-mens (cubes) for measurement. Between 5 and 13 speci-mens (cubes) were cut from each hand sample and theyall came from the same 2 cm depth layer of material. Verylittle physical variation (e.g. colour) was noted betweenindividual hand samples.
3. Experimental methods
Thermal demagnetisation was undertaken using a Mag-netic Measurements (Ltd.) thermal demagnetiser at theUniversity of Liverpool Geomagnetism Laboratory(ULGL). Alternating field demagnetisation was under-taken at the Bulgarian Academy of Science Laboratoryin Sofia (BASS) on a Molspin (Ltd.) tumbling demagnetis-er. Remanence measurements (Natural Remanent Magnet-isation [NRM] and Isothermal Remanent Magnetisation[IRM]) were undertaken on a Molspin (Ltd.) Minispinmagnetometer at BASS and ULGL. IRM curves, back-fields, hysteresis loops and Curie curves were undertakenin air on a Magnetic Measurements (Ltd.) Variable FieldTranslation Balance (VFTB) at ULGL. Data was analysedand paramagnetic signal removed using the RockMagAna-lyzer 1.0 software written by Leonhardt (2006). Thisprogramme was also used for the removal of the paramag-netic signal from thermomagnetic curves and hysteresisloops. Bulk magnetic susceptibility (K) measurements wereundertaken on a KLY-2 Kappabridge at BASS, where thehigh temperature behaviour of magnetic susceptibility wasperformed using a CS-23 attachment (AGICO, Brno).Stepwise thermal demagnetisation at BASS was under-taken in a home-made shielded oven with a residual fieldof less than 5 nT inside the cooling chamber. IRMs wereinduced in a pulse magnetiser (Max field = 2 T; Minfield = 0.23 T). Low temperature magnetic susceptibilitymeasurements, hysteresis loops, thermomagnetic curves,and IRM acquisition curves and backfields were conductedon samples that had not been solidified with water glass.All other tests were performed on water glass impregnatedspecimens.
A series of mineral magnetic tests were conducted on sis-ter specimens to those used for the PI determination. Theentire collection was first subjected to an evaluation ofthe samples’ magnetic viscosity, applying the zero fieldmethod (Banerjee, 1981). The specimens’ initial NRMwas first measured and the specimens placed into l-metal
498 A.I.R. Herries et al. / Physics and Chemistry of the Earth 33 (2008) 496–510
boxes for three weeks. After this period the samples wereremoved from the boxes and their stable, viscous freeNRM (NRMst) was measured and the viscosity coefficient{Sv% = [(NRM � NRMst)/NRM]*100} was calculated.Representative samples of the collection were both ther-mally demagnetised and alternating field demagnetised toaid as a check that the NRMst value was a true represen-tation of the primary direction of the sample. A mixtureof zero field (NRMst; method described above), alternatingfield and thermally cleaned NRM directions were used incalculating the final sample means using Fisher (1953) sta-tistics. Characteristic Remanent Magnetisations (ChRM)were calculated for these samples using principal compo-nent analysis (Kirschvink, 1980).
Lowrie–Fuller tests were initially undertaken on a num-ber of specimens (Lowrie and Fuller, 1971) followed by a3-axes IRM (3IRM) test (as per Lowrie, 1990) on sisterspecimens. This involves inducing three different strengthsof IRM (0.23 T. 0.46 T and 2 T) along three different axesof a specimen. The specimen was then thermally demagne-tised in set temperature steps. At each step the IRM left ineach axis is measured. Saturation isothermal remanentmagnetisation tests (SIRM test) similar to those under-taken by Van Velzen and Zijderveld (1992) and Jordanova(1996) were used to look at the alteration of the specimensused for Lowrie–Fuller tests during laboratory heating. Aninitial 2 T IRM is induced in the sample. A new 2 T IRM isinduced after each thermal step and both the SIRMremaining after each thermal demagnetisation step (SIRM-left) and the newly induced 2 T SIRM (SIRM) impartedafter this measurement are measured. K is also monitored.A comparison is made between the 3IRM (thermal demag-netisation of 3-axes IRMs in the sister samples) and theSIRMleft and this should identify samples where new mag-netic minerals are formed. The 3IRM demagnetisationcurve shows the original mineralogy. By imparting a new2 T SIRM after each heating step, magnetisation will beinduced into any new minerals created by the previousthermal demagnetisation. K, SIRM and SIRMleft will beaffected by any new minerals created. When the thermaldecay of 3IRM and SIRMleft is identical the test is positiveand when a substantial difference is observed it is negative.Negative SIRM tests are usually associated with unsuccess-ful Thellier experiments and vice versa (Jordanova et al.,1997, 2003). AF demagnetisation of SIRM(2 T) was addi-tionally performed after heating to certain temperaturesduring the SIRM test to look at changes in coercivity moreclosely.
Classic-style Thellier experiments (Thellier and Thellier,1959) were performed in the Vitosha Mountain laboratory.Samples were heated in a nonmagnetic oven in the presenceof the Earth’s field, which is fairly stable at the site. Thenatural laboratory field was measured daily during theexperiment with a fluxgate magnetometer (mean labora-tory intensity [Flab] = 37 lT, inclination [Ilab] = 70o anddeclination [Dlab] = 0o). Samples were heated and mea-sured twice, with a 180o vertical rotation of the sample so
that the field was directly opposite during each heating.pTRM checks were conducted after heating to 200 �C(120 �C heating), 300 �C (150 �C heating), 420 �C (320 �Cheating) and 460 �C (320 �C heating). Because the sampleswere hardened in water glass, the magnetic susceptibilitycould not be used as a reliable indicator of mineralogicalchange during PI experiments (Kostadinova et al., 2004).Remanence stability and pTRM checks were instead usedexclusively with an 8% acceptance criteria for the upperlimit of pTRM checks. Remanence measurements for thisexperiment were made using a computerised astatic magne-tometer with an optical feedback system (Boroc Geomag-netic Laboratory, Russia).
4. Results
4.1. Mineral magnetism
Mineral magnetic data for selected samples is shown inTable 1. Mean Sv for the majority of samples is below 10%(mean of 6.19%) and shows that they contain little viscousmaterial. Volume specific magnetic susceptibility (K) islower than expected for burnt material (mean 24.5 � 10�5
SI) and values for samples 2377–2379 are lower than therest of the collection (below 10 � 10�5 SI). As shown inprevious studies (e.g. Moringa et al., 1999; Jordanovaet al., 2001), an increase in K during heating is dependenton the sample initial mineralogical composition and iscaused by the formation of new magnetic material, oftenin the single domain to superparamagnetic grain size. Theformation of new ferro-oxides depends on the iron supply,the temperature and surrounding atmosphere (reducing oroxidizing) during heating. Thus, the three samples fromthe lower levels of the oven (Fig. 1B) have probably notbeen extensively heated. The Koeningsberger ratio(Q = NRM/(K � H)), where K is the magnetic susceptibil-ity and H the strength of the ambient geomagnetic field(Dunlop and Ozdemir, 1997), was also calculated. In spiteof relatively low values of Q, the remanent magnetization isgreater than the induced one (Q > 1, mean 4.05) and sug-gests the samples are suitable for archaeomagnetic analysis.
Hysteresis loops (Fig. 2A–D) all show a high paramag-netic component in the samples. On removal of the para-magnetic signal the curves indicate that the samples areall dominated by low coercivity minerals (Fig. 3). This isconfirmed by IRM acquisition curves, which almost com-pletely saturate between 100 and 200 mT (Fig. 2A–D), withonly a small anti-ferromagnetic contribution suggested (B-ratio; Table 1). Accordingly, curves from 3IRM tests(Fig. 3) are dominated by the soft (0.23 T) component, withonly very small medium (0.46 T) and hard (2 T) compo-nents evident. Lowrie and Fuller (1971) tests (Fig. 4) haveIRM curves with a lower coercivity than the NRM compo-nent at low fields. The opposite occurs at high fields withcross-over of the curves at low to medium field strengths.The samples fit Bailey and Dunlop (1983) Type 3, modal
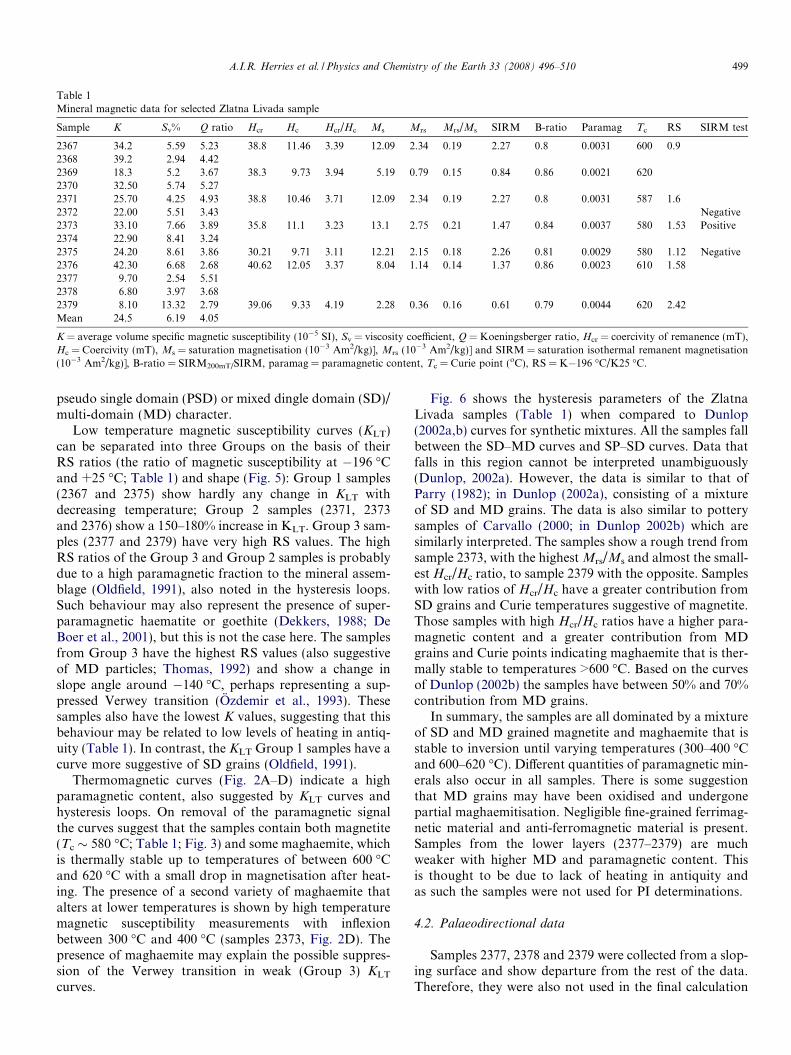
Table 1Mineral magnetic data for selected Zlatna Livada sample
Sample K Sv% Q ratio Hcr Hc Hcr/Hc Ms Mrs Mrs/Ms SIRM B-ratio Paramag Tc RS SIRM test
2367 34.2 5.59 5.23 38.8 11.46 3.39 12.09 2.34 0.19 2.27 0.8 0.0031 600 0.92368 39.2 2.94 4.422369 18.3 5.2 3.67 38.3 9.73 3.94 5.19 0.79 0.15 0.84 0.86 0.0021 6202370 32.50 5.74 5.272371 25.70 4.25 4.93 38.8 10.46 3.71 12.09 2.34 0.19 2.27 0.8 0.0031 587 1.62372 22.00 5.51 3.43 Negative2373 33.10 7.66 3.89 35.8 11.1 3.23 13.1 2.75 0.21 1.47 0.84 0.0037 580 1.53 Positive2374 22.90 8.41 3.242375 24.20 8.61 3.86 30.21 9.71 3.11 12.21 2.15 0.18 2.26 0.81 0.0029 580 1.12 Negative2376 42.30 6.68 2.68 40.62 12.05 3.37 8.04 1.14 0.14 1.37 0.86 0.0023 610 1.582377 9.70 2.54 5.512378 6.80 3.97 3.682379 8.10 13.32 2.79 39.06 9.33 4.19 2.28 0.36 0.16 0.61 0.79 0.0044 620 2.42Mean 24.5 6.19 4.05
K = average volume specific magnetic susceptibility (10�5 SI), Sv = viscosity coefficient, Q = Koeningsberger ratio, Hcr = coercivity of remanence (mT),Hc = Coercivity (mT), Ms = saturation magnetisation (10�3 Am2/kg)], Mrs (10�3 Am2/kg)] and SIRM = saturation isothermal remanent magnetisation(10�3 Am2/kg)], B-ratio = SIRM200mT/SIRM, paramag = paramagnetic content, Tc = Curie point (oC), RS = K�196 �C/K25 �C.
A.I.R. Herries et al. / Physics and Chemistry of the Earth 33 (2008) 496–510 499
pseudo single domain (PSD) or mixed dingle domain (SD)/multi-domain (MD) character.
Low temperature magnetic susceptibility curves (KLT)can be separated into three Groups on the basis of theirRS ratios (the ratio of magnetic susceptibility at �196 �Cand +25 �C; Table 1) and shape (Fig. 5): Group 1 samples(2367 and 2375) show hardly any change in KLT withdecreasing temperature; Group 2 samples (2371, 2373and 2376) show a 150–180% increase in KLT. Group 3 sam-ples (2377 and 2379) have very high RS values. The highRS ratios of the Group 3 and Group 2 samples is probablydue to a high paramagnetic fraction to the mineral assem-blage (Oldfield, 1991), also noted in the hysteresis loops.Such behaviour may also represent the presence of super-paramagnetic haematite or goethite (Dekkers, 1988; DeBoer et al., 2001), but this is not the case here. The samplesfrom Group 3 have the highest RS values (also suggestiveof MD particles; Thomas, 1992) and show a change inslope angle around �140 �C, perhaps representing a sup-pressed Verwey transition (Ozdemir et al., 1993). Thesesamples also have the lowest K values, suggesting that thisbehaviour may be related to low levels of heating in antiq-uity (Table 1). In contrast, the KLT Group 1 samples have acurve more suggestive of SD grains (Oldfield, 1991).
Thermomagnetic curves (Fig. 2A–D) indicate a highparamagnetic content, also suggested by KLT curves andhysteresis loops. On removal of the paramagnetic signalthe curves suggest that the samples contain both magnetite(Tc � 580 �C; Table 1; Fig. 3) and some maghaemite, whichis thermally stable up to temperatures of between 600 �Cand 620 �C with a small drop in magnetisation after heat-ing. The presence of a second variety of maghaemite thatalters at lower temperatures is shown by high temperaturemagnetic susceptibility measurements with inflexionbetween 300 �C and 400 �C (samples 2373, Fig. 2D). Thepresence of maghaemite may explain the possible suppres-sion of the Verwey transition in weak (Group 3) KLT
curves.
Fig. 6 shows the hysteresis parameters of the ZlatnaLivada samples (Table 1) when compared to Dunlop(2002a,b) curves for synthetic mixtures. All the samples fallbetween the SD–MD curves and SP–SD curves. Data thatfalls in this region cannot be interpreted unambiguously(Dunlop, 2002a). However, the data is similar to that ofParry (1982); in Dunlop (2002a), consisting of a mixtureof SD and MD grains. The data is also similar to potterysamples of Carvallo (2000; in Dunlop 2002b) which aresimilarly interpreted. The samples show a rough trend fromsample 2373, with the highest Mrs/Ms and almost the small-est Hcr/Hc ratio, to sample 2379 with the opposite. Sampleswith low ratios of Hcr/Hc have a greater contribution fromSD grains and Curie temperatures suggestive of magnetite.Those samples with high Hcr/Hc ratios have a higher para-magnetic content and a greater contribution from MDgrains and Curie points indicating maghaemite that is ther-mally stable to temperatures >600 �C. Based on the curvesof Dunlop (2002b) the samples have between 50% and 70%contribution from MD grains.
In summary, the samples are all dominated by a mixtureof SD and MD grained magnetite and maghaemite that isstable to inversion until varying temperatures (300–400 �Cand 600–620 �C). Different quantities of paramagnetic min-erals also occur in all samples. There is some suggestionthat MD grains may have been oxidised and undergonepartial maghaemitisation. Negligible fine-grained ferrimag-netic material and anti-ferromagnetic material is present.Samples from the lower layers (2377–2379) are muchweaker with higher MD and paramagnetic content. Thisis thought to be due to lack of heating in antiquity andas such the samples were not used for PI determinations.
4.2. Palaeodirectional data
Samples 2377, 2378 and 2379 were collected from a slop-ing surface and show departure from the rest of the data.Therefore, they were also not used in the final calculation
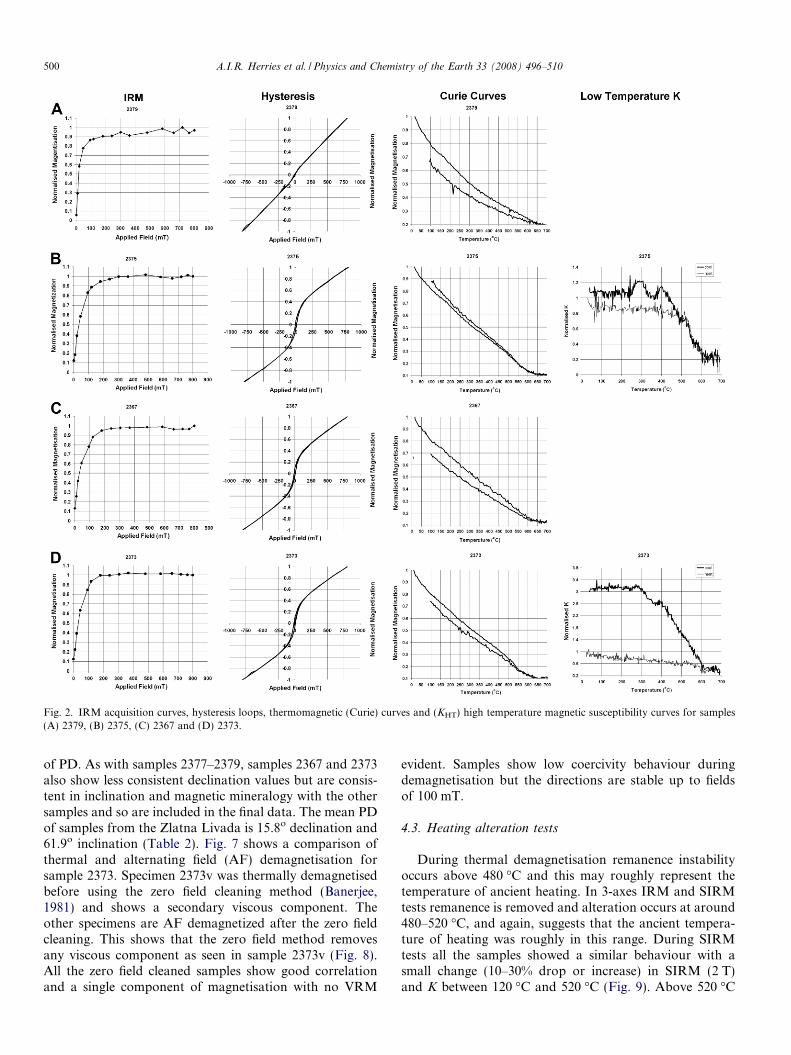
Fig. 2. IRM acquisition curves, hysteresis loops, thermomagnetic (Curie) curves and (KHT) high temperature magnetic susceptibility curves for samples(A) 2379, (B) 2375, (C) 2367 and (D) 2373.
500 A.I.R. Herries et al. / Physics and Chemistry of the Earth 33 (2008) 496–510
of PD. As with samples 2377–2379, samples 2367 and 2373also show less consistent declination values but are consis-tent in inclination and magnetic mineralogy with the othersamples and so are included in the final data. The mean PDof samples from the Zlatna Livada is 15.8o declination and61.9o inclination (Table 2). Fig. 7 shows a comparison ofthermal and alternating field (AF) demagnetisation forsample 2373. Specimen 2373v was thermally demagnetisedbefore using the zero field cleaning method (Banerjee,1981) and shows a secondary viscous component. Theother specimens are AF demagnetized after the zero fieldcleaning. This shows that the zero field method removesany viscous component as seen in sample 2373v (Fig. 8).All the zero field cleaned samples show good correlationand a single component of magnetisation with no VRM
evident. Samples show low coercivity behaviour duringdemagnetisation but the directions are stable up to fieldsof 100 mT.
4.3. Heating alteration tests
During thermal demagnetisation remanence instabilityoccurs above 480 �C and this may roughly represent thetemperature of ancient heating. In 3-axes IRM and SIRMtests remanence is removed and alteration occurs at around480–520 �C, and again, suggests that the ancient tempera-ture of heating was roughly in this range. During SIRMtests all the samples showed a similar behaviour with asmall change (10–30% drop or increase) in SIRM (2 T)and K between 120 �C and 520 �C (Fig. 9). Above 520 �C
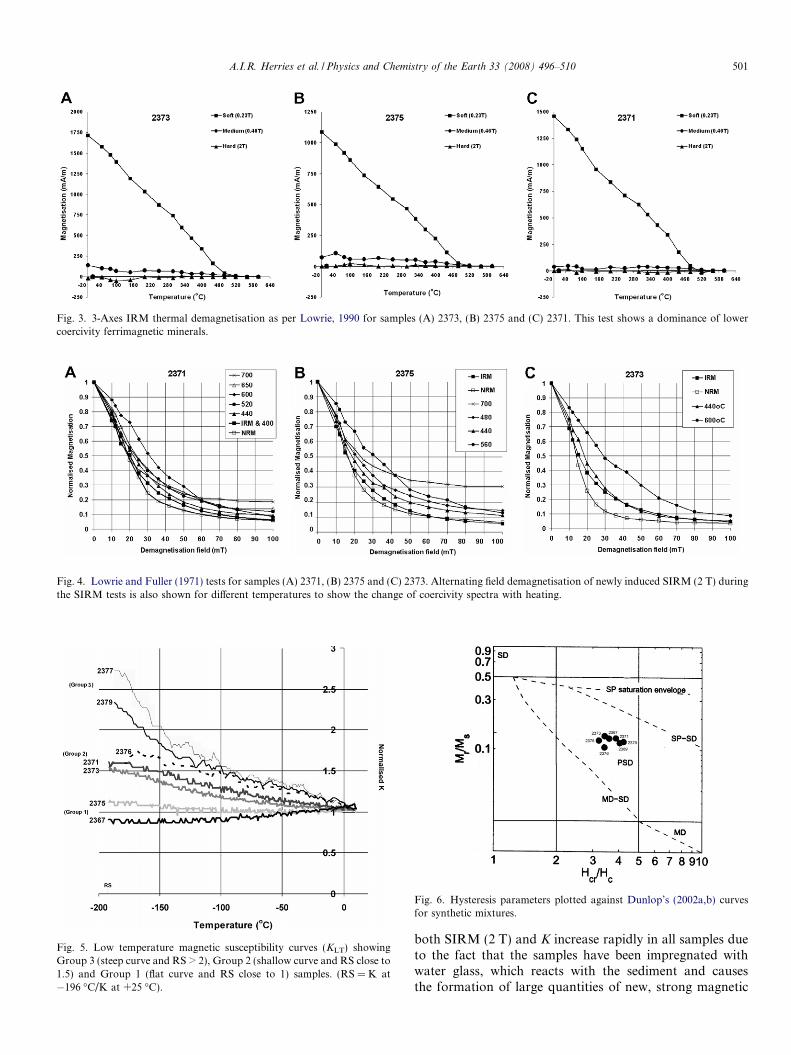
Fig. 3. 3-Axes IRM thermal demagnetisation as per Lowrie, 1990 for samples (A) 2373, (B) 2375 and (C) 2371. This test shows a dominance of lowercoercivity ferrimagnetic minerals.
Fig. 4. Lowrie and Fuller (1971) tests for samples (A) 2371, (B) 2375 and (C) 2373. Alternating field demagnetisation of newly induced SIRM (2 T) duringthe SIRM tests is also shown for different temperatures to show the change of coercivity spectra with heating.
Fig. 5. Low temperature magnetic susceptibility curves (KLT) showingGroup 3 (steep curve and RS > 2), Group 2 (shallow curve and RS close to1.5) and Group 1 (flat curve and RS close to 1) samples. (RS = K at�196 �C/K at +25 �C).
Fig. 6. Hysteresis parameters plotted against Dunlop’s (2002a,b) curvesfor synthetic mixtures.
A.I.R. Herries et al. / Physics and Chemistry of the Earth 33 (2008) 496–510 501
both SIRM (2 T) and K increase rapidly in all samples dueto the fact that the samples have been impregnated withwater glass, which reacts with the sediment and causesthe formation of large quantities of new, strong magnetic
Table 2Directional archaeomagnetic data for Zlatna Livada
Sample No/N Dec (o) Inc (o) a95 (o)
2367 5/6 8.8 60.7 2.6
2368 5/5 15.9 59.6 3.5
2369 4/10 16.1 64.1 1.6
2370 6/6 17.6 64.6 1.8
2371 9/9 16.9 61.5 1.7
2372 5/6 16.3 62.4 1.7
2373 8/13 13.9 60.5 1
2374 6/7 17.7 61.4 1.7
2375 8/9 15.5 62.5 1.3
2376 12/14 18.1 60.9 1.6
2377 6/6 10.2 68.8 8.3
2378 6/6 12.3 65.9 9.1
2379 7/7 13.8 65.9 10.6
Mean 10 15.8 61.9 1.1
No/N = number of specimens accepted/measured, a95 is a precisionparameter, Inc = inclination, Dec = declination. Mean values conductedapplying weighted Fisher (1953) statistics using a mixed average of spec-imens results from viscous cleaning of NRM, alternating field and thermaldemagnetisation.
502 A.I.R. Herries et al. / Physics and Chemistry of the Earth 33 (2008) 496–510
mineral phases. Thermal demagnetisation curves of 2 TSIRM (induced only once during the 3IRM experiment)and SIRMleft after each 2 T SIRM induction show closesimilarity for some samples (2373, Fig. 8A). This consti-tutes a positive SIRM test. In contrast, other samples(2375 and 2371; Fig. 8B and C) show an evident differencebetween the two curves and SIRM (2 T) increases withheating. These samples have a higher SIRMleft than the3IRM curve. This suggests the production of new magneticmineral phases during heating and constitutes a failedSIRM test. AF demagnetisation of SIRM (2 T) confirmsthis formation of new minerals in these samples with anincrease in coercivity up to 600 �C (Fig. 4). The same hap-pens in samples that have a positive SIRM test (Fig. 4C),but this new mineral formation occurs at highertemperatures.
4.4. Palaeointensity data
Classic Thellier (Thellier and Thellier, 1959) PI experi-ments, with an additional heating to perform the pTRMchecks, were applied on nine specimens from the collection.The selection of specimens was based on the calculated vis-cosity index (Sv), mineral magnetic characteristics (Table 1)and consolidation. Despite failed SIRM tests for somesamples (e.g. 2371 and 2375), a range of samples fromacross the oven were used. This was done in part to testthe evaluation criteria. The results of the PI experimentsare presented in Fig. 9 and Table 3. The majority of sam-ples show a consistent behaviour and altered at tempera-tures between 300 and 400 �C (Figs. 8 and 9).
Based on supposedly favourable mineral magnetic datathree specimens from sample 2373 were used. Specimen2373d has a curved Arai plot with no linearity and speci-men 2373j also has a curved Arai plot along with instabilityof remanence directions. Specimen 2373z gave the only
usable PI determination (Table 3). Of two specimens fromsample 2376, 2376d gave a poor result with bad pTRMchecks, while 2376a gave acceptable results up to 320 �Cand had a PI consistent with other accepted samples. Spec-imens 2371v and 2375v appeared to provide the most reli-able PI values despite the fact that their sister specimensfailed the SIRM test (Fig. 9). From nine PI experimentsthe results of only five were accepted (56%, Table 3). Thiswas due to failure of pTRM checks and nonlinearity andcurvature of the Arai plot that is indicative of MD behav-iour. PI estimates are recorded between 67.90 and80.05 lT. The weighted (Kovacheva and Kanarchev,1986) mean is 72.13 lT.
5. Discussion
There are five basic factors that can cause the estimatedPI to be different from the true ancient field: (1) mineralog-ical change can occur during the experiment.; (2) magneticanisotropy; (3) cooling rate dependence of the impartedTRM in the laboratory; (4) the relationship between thelaboratory field direction and the direction of the NRM;and (5) the MD state of the magnetic carriers.
Problem one can be diminished by monitoring mineral-ogical change through the pTRM checks. Pre-selection isalso attempted based on mineral magnetic studies. Kova-cheva et al. (in press) show that the effect of anisotropyof TRM on the value of PI is negligible for baked plasterfrom such ovens. As far as the cooling rate dependence isconcerned, the PI experiment is performed without a fanand the specimens are left to cool naturally, which takesbetween 2 and 4 h depending on the temperature step.Thus, we consider that the cooling rate was essentiallythe same in both antiquity and the laboratory. Accordingto the recent study of Yu et al. (2004), the direction of Flab
is not a problem because the classical Thellier method is theonly method which is not influenced by the Flab orienta-tion. Therefore, the greatest problem in this analysis isthe presence of MD grains in the Zlatna Livada samples,as shown by mineral magnetic measurements (Figs. 4 and5).
Dunlop and Ozdemir (1997) have shown that if MDgrains are the major carriers of the TRM, lower unblockingtemperatures (Tub) called low-Tub tails are observed. Alow-Tub spectrum results in a large demagnetisation ofNRM during the low-temperature heating steps. On theother hand, MD carriers of TRM can also show higherTub up to the Curie point (Shcherbakova et al., 2000).Besides the possible presence of MD grains, mineralogicalchanges may also occur during the Thellier experiment.Both the formation of magnetic phases and the lowerand higher Tub act in the same direction and increase thevisual appearance of the concave NRM–TRM relationship(Arai diagram) (Levi, 1977). Similar features are observedto a greater or lesser extent in our results (Fig. 9). For thisreason the regression line calculation fraction ‘‘f” of thecarried NRM is listed in Table 3 (Coe, 1967; Biggin and
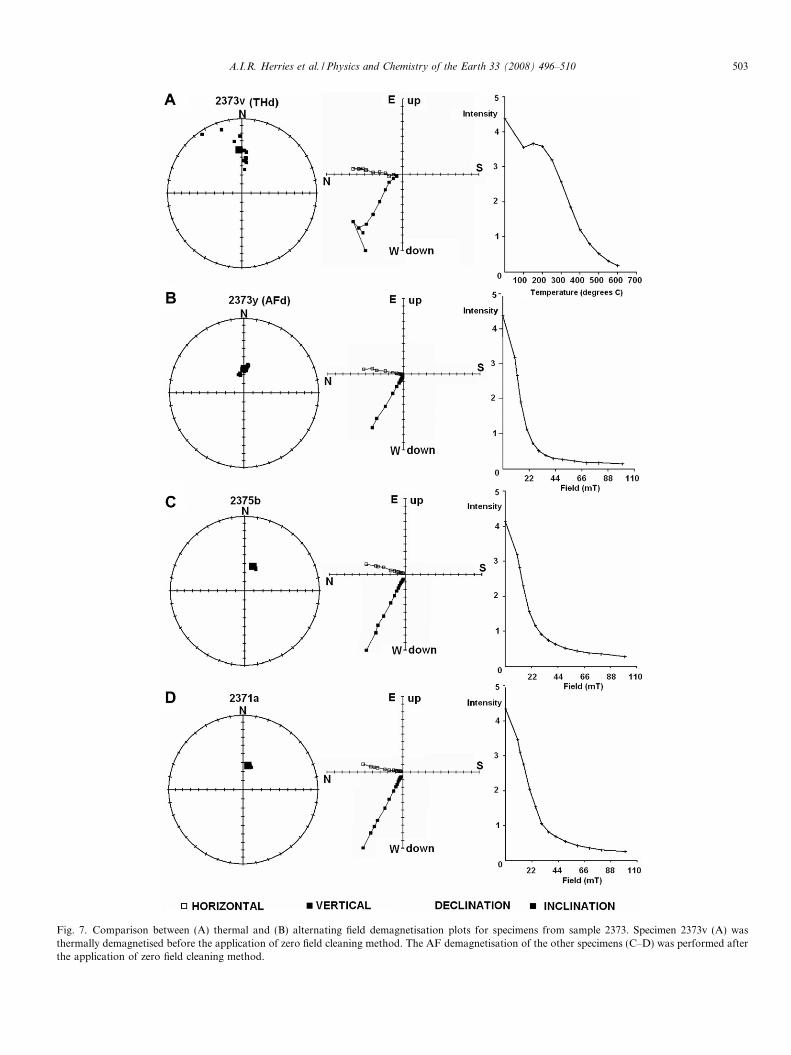
Fig. 7. Comparison between (A) thermal and (B) alternating field demagnetisation plots for specimens from sample 2373. Specimen 2373v (A) wasthermally demagnetised before the application of zero field cleaning method. The AF demagnetisation of the other specimens (C–D) was performed afterthe application of zero field cleaning method.
A.I.R. Herries et al. / Physics and Chemistry of the Earth 33 (2008) 496–510 503
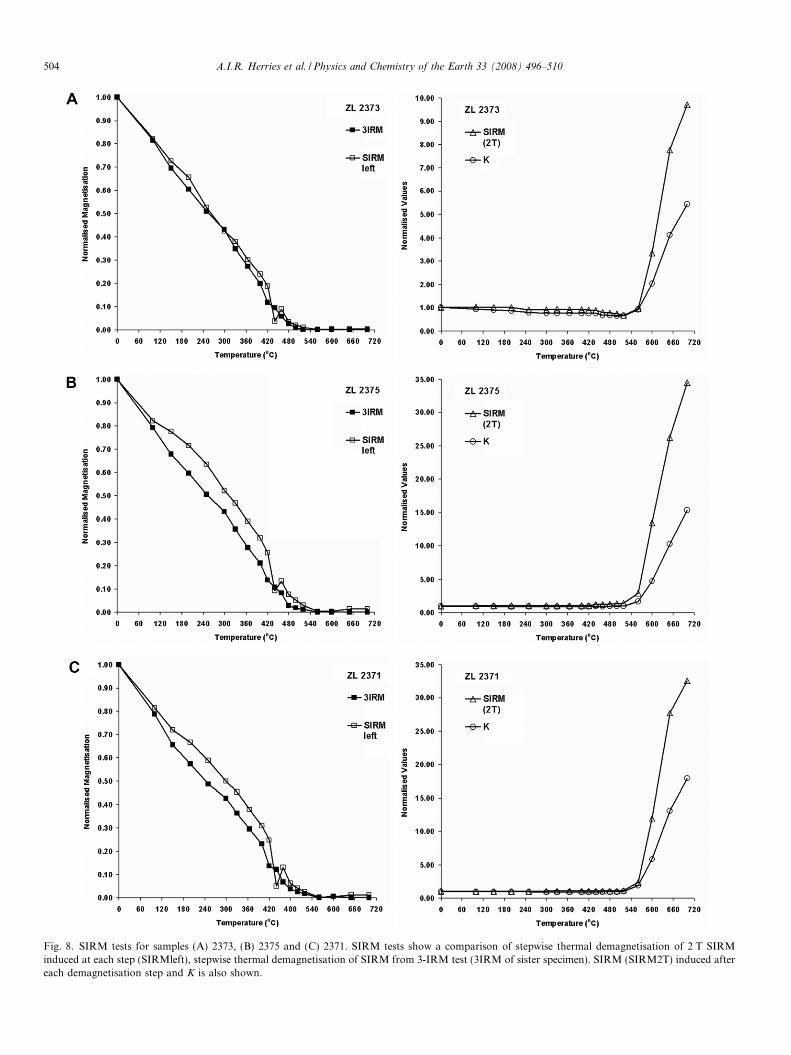
Fig. 8. SIRM tests for samples (A) 2373, (B) 2375 and (C) 2371. SIRM tests show a comparison of stepwise thermal demagnetisation of 2 T SIRMinduced at each step (SIRMleft), stepwise thermal demagnetisation of SIRM from 3-IRM test (3IRM of sister specimen). SIRM (SIRM2T) induced aftereach demagnetisation step and K is also shown.
504 A.I.R. Herries et al. / Physics and Chemistry of the Earth 33 (2008) 496–510
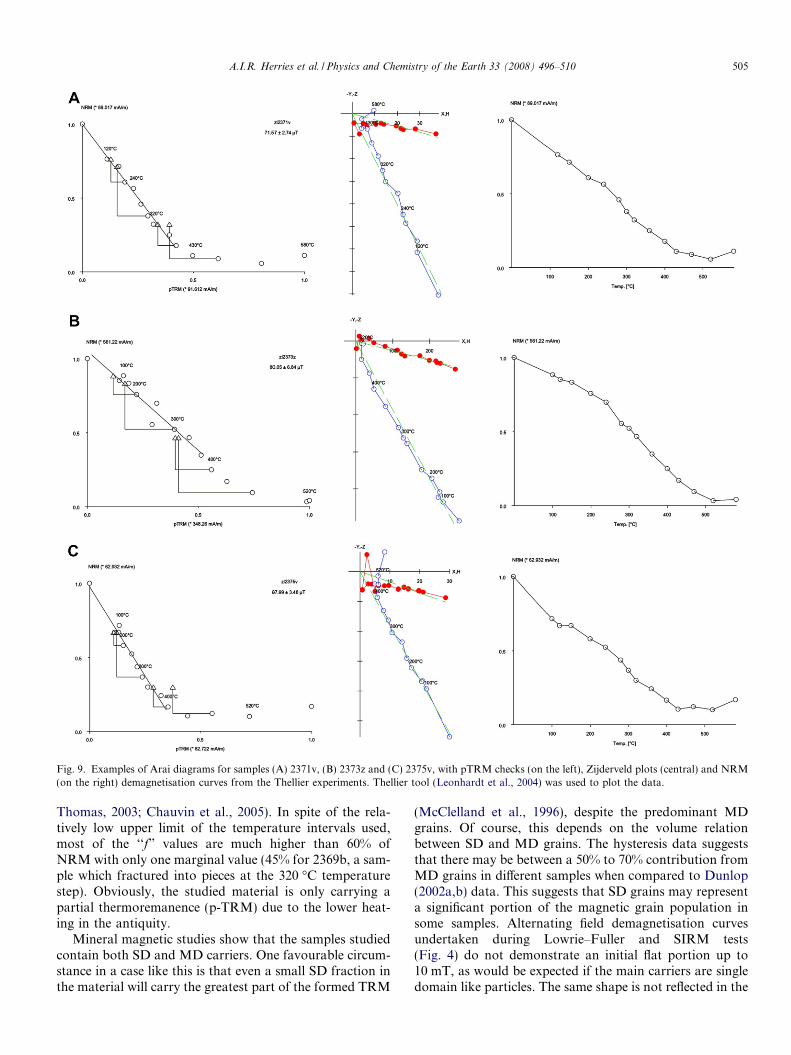
Fig. 9. Examples of Arai diagrams for samples (A) 2371v, (B) 2373z and (C) 2375v, with pTRM checks (on the left), Zijderveld plots (central) and NRM(on the right) demagnetisation curves from the Thellier experiments. Thellier tool (Leonhardt et al., 2004) was used to plot the data.
A.I.R. Herries et al. / Physics and Chemistry of the Earth 33 (2008) 496–510 505
Thomas, 2003; Chauvin et al., 2005). In spite of the rela-tively low upper limit of the temperature intervals used,most of the ‘‘f” values are much higher than 60% ofNRM with only one marginal value (45% for 2369b, a sam-ple which fractured into pieces at the 320 �C temperaturestep). Obviously, the studied material is only carrying apartial thermoremanence (p-TRM) due to the lower heat-ing in the antiquity.
Mineral magnetic studies show that the samples studiedcontain both SD and MD carriers. One favourable circum-stance in a case like this is that even a small SD fraction inthe material will carry the greatest part of the formed TRM
(McClelland et al., 1996), despite the predominant MDgrains. Of course, this depends on the volume relationbetween SD and MD grains. The hysteresis data suggeststhat there may be between a 50% to 70% contribution fromMD grains in different samples when compared to Dunlop(2002a,b) data. This suggests that SD grains may representa significant portion of the magnetic grain population insome samples. Alternating field demagnetisation curvesundertaken during Lowrie–Fuller and SIRM tests(Fig. 4) do not demonstrate an initial flat portion up to10 mT, as would be expected if the main carriers are singledomain like particles. The same shape is not reflected in the
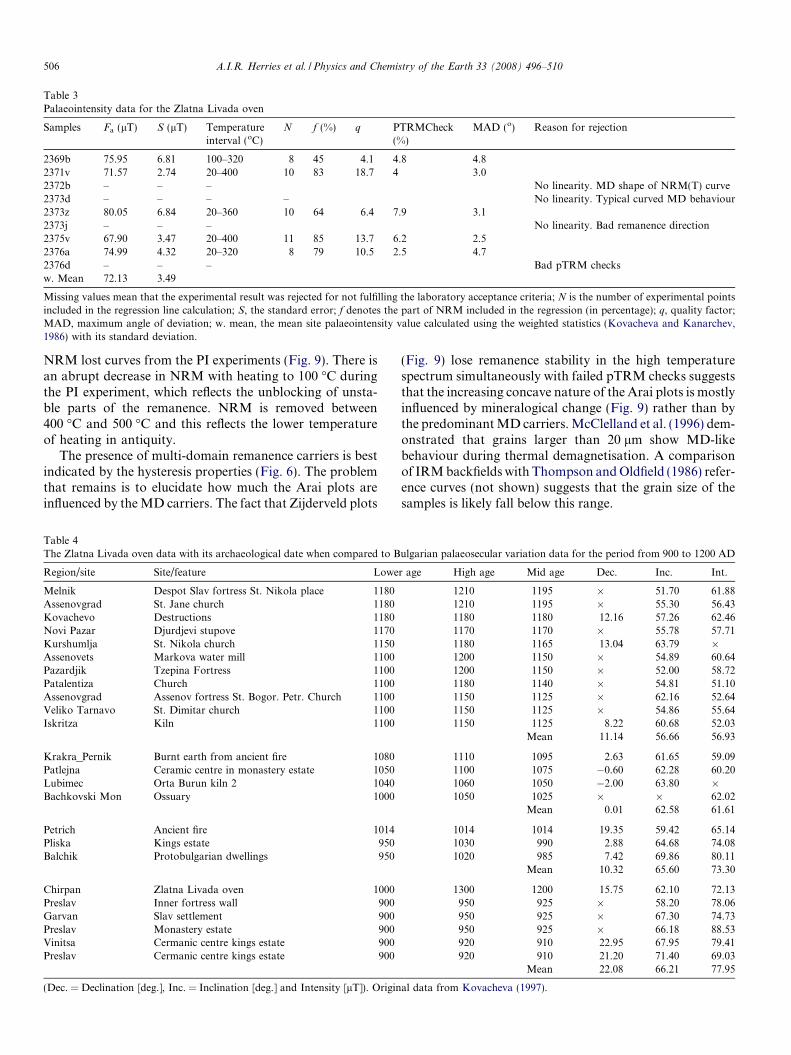
Table 3Palaeointensity data for the Zlatna Livada oven
Samples Fa (lT) S (lT) Temperatureinterval (oC)
N f (%) q PTRMCheck(%)
MAD (o) Reason for rejection
2369b 75.95 6.81 100–320 8 45 4.1 4.8 4.82371v 71.57 2.74 20–400 10 83 18.7 4 3.02372b – – – No linearity. MD shape of NRM(T) curve2373d – – – – No linearity. Typical curved MD behaviour2373z 80.05 6.84 20–360 10 64 6.4 7.9 3.12373j – – – No linearity. Bad remanence direction2375v 67.90 3.47 20–400 11 85 13.7 6.2 2.52376a 74.99 4.32 20–320 8 79 10.5 2.5 4.72376d – – – Bad pTRM checksw. Mean 72.13 3.49
Missing values mean that the experimental result was rejected for not fulfilling the laboratory acceptance criteria; N is the number of experimental pointsincluded in the regression line calculation; S, the standard error; f denotes the part of NRM included in the regression (in percentage); q, quality factor;MAD, maximum angle of deviation; w. mean, the mean site palaeointensity value calculated using the weighted statistics (Kovacheva and Kanarchev,1986) with its standard deviation.
506 A.I.R. Herries et al. / Physics and Chemistry of the Earth 33 (2008) 496–510
NRM lost curves from the PI experiments (Fig. 9). There isan abrupt decrease in NRM with heating to 100 �C duringthe PI experiment, which reflects the unblocking of unsta-ble parts of the remanence. NRM is removed between400 �C and 500 �C and this reflects the lower temperatureof heating in antiquity.
The presence of multi-domain remanence carriers is bestindicated by the hysteresis properties (Fig. 6). The problemthat remains is to elucidate how much the Arai plots areinfluenced by the MD carriers. The fact that Zijderveld plots
Table 4The Zlatna Livada oven data with its archaeological date when compared to B
Region/site Site/feature Lowe
Melnik Despot Slav fortress St. Nikola place 1180Assenovgrad St. Jane church 1180Kovachevo Destructions 1180Novi Pazar Djurdjevi stupove 1170Kurshumlja St. Nikola church 1150Assenovets Markova water mill 1100Pazardjik Tzepina Fortress 1100Patalentiza Church 1100Assenovgrad Assenov fortress St. Bogor. Petr. Church 1100Veliko Tarnavo St. Dimitar church 1100Iskritza Kiln 1100
Krakra_Pernik Burnt earth from ancient fire 1080Patlejna Ceramic centre in monastery estate 1050Lubimec Orta Burun kiln 2 1040Bachkovski Mon Ossuary 1000
Petrich Ancient fire 1014Pliska Kings estate 950Balchik Protobulgarian dwellings 950
Chirpan Zlatna Livada oven 1000Preslav Inner fortress wall 900Garvan Slav settlement 900Preslav Monastery estate 900Vinitsa Cermanic centre kings estate 900Preslav Cermanic centre kings estate 900
(Dec. = Declination [deg.], Inc. = Inclination [deg.] and Intensity [lT]). Origin
(Fig. 9) lose remanence stability in the high temperaturespectrum simultaneously with failed pTRM checks suggeststhat the increasing concave nature of the Arai plots is mostlyinfluenced by mineralogical change (Fig. 9) rather than bythe predominant MD carriers. McClelland et al. (1996) dem-onstrated that grains larger than 20 lm show MD-likebehaviour during thermal demagnetisation. A comparisonof IRM backfields with Thompson and Oldfield (1986) refer-ence curves (not shown) suggests that the grain size of thesamples is likely fall below this range.
ulgarian palaeosecular variation data for the period from 900 to 1200 AD
r age High age Mid age Dec. Inc. Int.
1210 1195 � 51.70 61.881210 1195 � 55.30 56.431180 1180 12.16 57.26 62.461170 1170 � 55.78 57.711180 1165 13.04 63.79 �1200 1150 � 54.89 60.641200 1150 � 52.00 58.721180 1140 � 54.81 51.101150 1125 � 62.16 52.641150 1125 � 54.86 55.641150 1125 8.22 60.68 52.03
Mean 11.14 56.66 56.93
1110 1095 2.63 61.65 59.091100 1075 �0.60 62.28 60.201060 1050 �2.00 63.80 �1050 1025 � � 62.02
Mean 0.01 62.58 61.61
1014 1014 19.35 59.42 65.141030 990 2.88 64.68 74.081020 985 7.42 69.86 80.11
Mean 10.32 65.60 73.30
1300 1200 15.75 62.10 72.13950 925 � 58.20 78.06950 925 � 67.30 74.73950 925 � 66.18 88.53920 910 22.95 67.95 79.41920 910 21.20 71.40 69.03
Mean 22.08 66.21 77.95
al data from Kovacheva (1997).
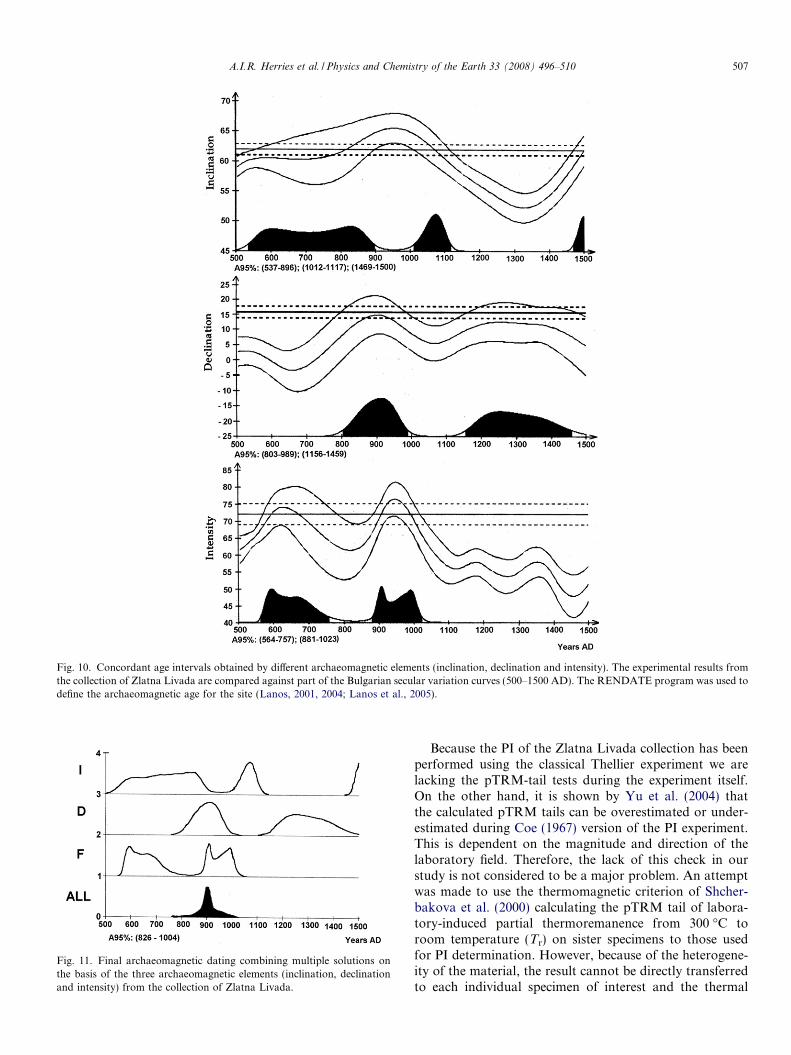
Fig. 10. Concordant age intervals obtained by different archaeomagnetic elements (inclination, declination and intensity). The experimental results fromthe collection of Zlatna Livada are compared against part of the Bulgarian secular variation curves (500–1500 AD). The RENDATE program was used todefine the archaeomagnetic age for the site (Lanos, 2001, 2004; Lanos et al., 2005).
Fig. 11. Final archaeomagnetic dating combining multiple solutions onthe basis of the three archaeomagnetic elements (inclination, declinationand intensity) from the collection of Zlatna Livada.
A.I.R. Herries et al. / Physics and Chemistry of the Earth 33 (2008) 496–510 507
Because the PI of the Zlatna Livada collection has beenperformed using the classical Thellier experiment we arelacking the pTRM-tail tests during the experiment itself.On the other hand, it is shown by Yu et al. (2004) thatthe calculated pTRM tails can be overestimated or under-estimated during Coe (1967) version of the PI experiment.This is dependent on the magnitude and direction of thelaboratory field. Therefore, the lack of this check in ourstudy is not considered to be a major problem. An attemptwas made to use the thermomagnetic criterion of Shcher-bakova et al. (2000) calculating the pTRM tail of labora-tory-induced partial thermoremanence from 300 �C toroom temperature (Tr) on sister specimens to those usedfor PI determination. However, because of the heterogene-ity of the material, the result cannot be directly transferredto each individual specimen of interest and the thermal
508 A.I.R. Herries et al. / Physics and Chemistry of the Earth 33 (2008) 496–510
instability of the material also means that the data does notreflect the real tail (Shcherbakov et al., 2001). This variabil-ity in the behaviour of specimens from the same sample isthought to be due to the heterogeneous heating in antiquityand the heterogeneous base material that was heated.
The heterogeneity of specimens is also an obstacle forusing different rock magnetic tests for real pre-selectionof specimens for PI experiments. Nevertheless, withoutthem, the samples’ behaviour during the PI experimentremains much more obscure. Unfortunately, it is nearlyimpossible to make a perfect pre-selection of samples forPI experiment. The Thellier experiment itself is quite diag-nostic and that is why the internal consistency of values fora studied collection is important. Unfortunately for thissmall collection, in spite of good internal consistency, themean PI value can be altered from the true ancient PIdue to the presence of MD grains.
6. Archaeomagnetic estimates
The proposed archaeological date for the Zlatna Livadasettlement is sometime in the 11th–12th C. AD. The oven isthought to date to the early phase of the site (11th C. AD),although an earlier date is possible (Koleva, personal com-munication). While large amounts of archaeomagnetic fielddata exist for the 10th and 12th C. AD, little data exists forthe 11th C. AD (Kovacheva, 1997). Palaeosecular variationdata for Bulgaria in the 10th to 12th C. AD is shown inTable 4 (Kovacheva, 1997). The missing declination valuesare from sites represented only by bricks used to determinethe palaeoinclination and palaeointensity. Archaeomagnet-ic data for this period are obviously not sufficient to formmore precise reference curves which would constrain thedating intervals obtained (Table 4; Fig. 10). The REN-DATE program was used to define the archaeomagneticage for the site (Lanos, 2001, 2004; Lanos et al., 2005).In Fig. 10, the Zlatna Livada archaeomagnetic values (hor-izontal lines with their error limits) are compared with thecurrent Bulgarian secular variation curves. Multiple solu-tions obtained on the basis of different geomagnetic ele-ments are given on the horizontal axis of time, where theblack areas represent the probability density. The com-bined definitive age is given in Fig. 11 where the datinginterval is 826–1004 AD. The archaeomagnetic data con-firms that the oven dates to the early period of site use,although the date is perhaps slightly younger thanexpected. Based on both the archaeomagnetic age assess-ment and the archaeological evidence the site is optimallydated to the very end of the 10th C. AD or first few yearsof the 11th C. AD.
Because of the extreme difficulties encountered duringthe Thellier experiments and the remaining doubt aboutthe true value of PI, let us consider what the archaeomag-netic age estimate would be using only the directionalresults. The application of the RENDATE software usingonly directional results (not shown) leads to an intervalof 777–967 AD. This date overlaps with the estimate
including PI results and is even younger than suggestedby the archaeological data. If our PI determination is over-estimated and the true value is lower, the suggested age forthe site is even further from the estimated archaeologicalage. At present, the Bulgarian reference curve has a lowdensity of data points between the 7th to 9th centuries.These are ‘‘dark” ages in our archaeological discoveriesand this is reflected in the archaeomagnetic studies. Thusit is suggested that the archaeomagnetic age estimateobtained using both palaeo-directional and -intensity datais the most reliable based on current field data. Only thefuture accumulation of independently dated archaeologicalmaterials will refine the geomagnetic reference curves forthis period and other low density periods.
7. Conclusions
Archaeomagnetic palaeo-directional and -intensity andmineral magnetic results from an oven at the mediaeval siteof Zlatna Livada reveal a number of different conclusions.
1. The oven was not heated to high temperatures in antiq-uity (<320–400 �C) and some areas were heated morethan others. This is shown by the heterogeneity of thesamples, lack of consolidation and mineral magneticcharacteristics.
2. Magnetite and two forms of maghaemite (the first ther-mally stable to around 620 �C and the second which isunstable and inverts between 300 and 400 �C) are themain minerals present.
3. Negligible fine-grained ferrimagnetic material and anti-ferromagnetic material are present. This again pointsto a low temperature of heating in antiquity.
4. The samples from the upper level show a mixture of SDand MD ferrimagnetic grains, while those from thelower levels appear to have a greater proportion ofMD grains.
5. Consequently, samples with higher MD fractions failedthe PI experiments. Those that gave consistent pTRMchecks, good remanence stability and a linear Arai plotare considered to have been successful.
6. The oven has a mean PI determination of 72.13 lT, amean declination of 15.8� and a mean inclination of61.9�. The archaeomagnetic dating for the last usageof the oven suggests a date between 826 and 1004 AD.The archaeological evidence suggests an early 11th C.AD date and this is partly confirmed by the archaeo-magnetic estimate, although the site might be earlierthan expected.
Acknowledgements
This work was undertaken as part of the EUImproving Human Potential Programme Contract No.HPRN-CT-2002-00219EC – Archaeomagnetic Applica-tions for the Rescue of Cultural Heritage (AARCH)
A.I.R. Herries et al. / Physics and Chemistry of the Earth 33 (2008) 496–510 509
Training Network. Mineral magnetic studies using theVFTB (funded by NERC JREI Grant GR3/E0069Granted to John Shaw) and Bartington Susceptibilityequipment were undertaken at the University of LiverpoolGeomagnetism Laboratory as part of the AARCH inter-laboratory networking. Sampling was undertaken atZlatna Livada by Neli Jordanova and Maria Kostadinovaand archaeological information was provided by site exca-vator Rumjana Koleva. The authors are extremely thank-ful to Dr. Bohnel and one anonymous reviewer for thethorough revision of the initial text, useful criticism andmany valuable suggestions given. Thanks to Kate Russellfor proof reading.
References
Aitken, M., 1978. Archaeological involvement of physics. Phys. Lett.(Section C) 5, 277–351.
Bailey, M.E., Dunlop, D.J., 1983. Alternating field characteristics ofpseudo-single-domain (2–24 lm) and multidomain magnetite. EarthPlanet Sci. Lett. 63, 335–352.
Banerjee, S., 1981. Experimental methods of rock magnetism andpalaeomagnetism. Adv. Geophys. 23, 25–99.
Biggin, A., Thomas, D.N., 2003. The application of acceptance criteria toresults of Thellier palaeointensity experiments performed on sampleswith pseudo-single-domain-like characteristics. Phys. Earth PlanetInter. 138, 279–287.
Carvallo, C., 2000. Archaeomagnetism of Ontario potsherds: applicationsto the dating and orientation of pottery. Unpublished MSc thesis.University of Toronto.
Chauvin, A., Roperch, P., Levi, S., 2005. Reliability of geomagneticpaleointensity data: the effects of the NRM fraction and concave-upbehaviour on palaeointensity determinations by the Thellier method.Phys. Earth Planet Inter. 150, 265–286.
Coe, R.S., 1967. The determination of paleo-intensities of the Earth’smagnetic field with emphasis on mechanisms which could cause non-ideal behaviour in Thellier’s method. J. Geomag. Geoelectr. 19, 157–179.
De Boer, C.B., Mullender, T.A.T., Dekkers, M.J., 2001. Low-temperaturebehaviour of haematite: susceptibility and magnetization increase oncycling through the Morin transition. Geophys. J .Int. 146, 201–216.
Dekkers, M.J., 1988. Some rock magnetic parameters for natural goethite,pyrrhotite and fine-grained hematite. Geol. Ultraiectina 51, Utrecht.
Dunlop, D.J., 2002a. Theory and application of the Day plot (Mrs/Msversus Hcr/Hc) 1. Theoretical curves and tests using titanomagnetitedata. J. Geophys. Res. 107 (B3). doi:10.1029/2001JB000486.
Dunlop, D.J., 2002b. Theory and application of the Day plot (Mrs/Msversus Hcr/Hc). 2. Application to data for rocks, sediments and soils.J. Geophys. Res. 107 (B3). doi:10.1029/2001JB000487.
Dunlop, D., Ozdemir, O., 1997. Rock magnetism. Fundamentals andfrontiers. In: Cambridge Studies in Magnetism. Cambridge UniversityPress.
Fisher, R.A., 1953. Dispersion on a Sphere. Proceedings of Royal Society,London, p. 295.
Jordanova, N., 1996. Rock magnetic studies in archaeomagnetism andtheir contribution to the problem of reliable determination of theancient geomagnetic field intensity. PhD thesis, Sofia University,Bulgaria (in Bulgarian).
Jordanova, N., Petrovski, E., Kovacheva, M., 1997. Preliminary rockmagnetic study of archaeomagnetic samples from Bulgarian prehis-toric sites. J. Geomag. Geoel. 49, 543–566.
Jordanova, N., Petrovski, E., Kovacheva, M., Jordanova, D., 2001.Factors determining magnetic enhancement of burnt clay fromarchaeological sites. J. Archaeol. Sci. 28, 1137–1148.
Jordanova, N., Kovacheva, M., Hedley, I., Kostadinova, M., 2003. On thesuitability of baked clay for archaeomagnetic studies as deduced fromdetailed rock-magnetic studies. Geophys. J. Int. 153, 146–158.
Kirschvink, J., 1980. The least-squares line and plane and the analysis ofpalaeomagnetic data. Geophys. J. Roy. Astron. Soc. 62, 699–718.
Kostadinova, M., Jordanova, N., Jordanova, D., Kovacheva, M., 2004.Preliminary study on the effect of water glass impregnation on therock-magnetic properties of baked clay. Stud. Geophys. Geod. 48,637–646.
Kovacheva, M., 1997. Archaeomagnetic database from Bulgaria: the last8000 years. Phys. Earth Planet. Interiors. 102, 145–151.
Kovacheva, M., Kanarchev, M., 1986. Revised archaeointensity data fromBulgaria. J. Geomag. Geoel. 38, 1297–1310.
Kovacheva, M., Chauvin, A., Jordanova, N., Lanos, Ph., Karloukovski,V., in press. Remanence anisotropy effect on the palaeointensity resultsobtained from pottery and archaelogical materials. Earth. Planets.Space.
Lanos, P., 2001. L’pproche bayesienne en chronometrie: application al’archeomagnetisme. In: Barrandon, J.-N., Guilbert, P., Michel, V.(Eds.), Datation, XXIe rencontres internationales d’archeologie etd’histoire d’Antibes, sous la dir. de. Editions APDCA, Antibes, pp.113–139.
Lanos, P., 2004. Bayesian inference of calibration curves, application toarchaeomagnetism, In: Buck, C.E., Millard, A.R. (Eds.), Tools forChronology, Crossing Disciplinary Boundaries, pp. 43–82.
Lanos, Ph., Kovacheva, M., Chauvin, A., 1999. Archaeomagnetism:methodology and applications – implementing and practice of thearchaeomagnetic method in France and Bulgaria. Eur. J. Archaeol. 2,327–354.
Lanos, Ph., Le Goff, M., Kovacheva, M., Schnepp, E., 2005. Hierarchicalmodelling of archaeomagnetic data and curve estimation by movingaverage technique. Geophys. J. Int. 160, 440–476.
Leonhardt, R., 2006. Analyzing rock magnetic measurements: theRockMagAnalyzer 1.0 software. Computer Geosci. 32, 1420–1431.
Leonhardt, R., Heunemann, C., Krasa, D., 2004. Analyzing absolutepaleointensity determinations: acceptance criteria and the softwareThellierTool4.0. Geochem. Geophys. Geosystems (G3), 5. doi:10.1029/2004GC00080.
Levi, S., 1977. The effect of magnetic particle size on paleointensitydeterminations of the geomagnetic field. Phys. Earth Planet Inter. 13,245–259.
Lowrie, W., 1990. Identification of ferromagnetic minerals in a rock bycoercivity and unblocking temperature properties. Geophys. Res. Lett.17, 159–162.
Lowrie, W., Fuller, M., 1971. On the alternating field demagnetisationcharacteristics of multi-domain thermoremanent magnetization inmagnetite. J. Geophys. Res. 76, 6339–6349.
McClelland, E., Muxworthy, A.R., Thomas, R.M., 1996. Magneticproperties of the stable fraction of remanence in large multidomain(MD) magnetite grains: single-domain or MD? Geophys. Res. Lett. 23,2831–2934.
Moringa, H., Inokuchi, H., Yamashita, H., Ono, A., Inada, T., 1999.Magnetic detection of heated soils at Palaeolithic sites in Japan.Geoarchaeology 14, 377–399.
Oldfield, F., 1991. Environmental magnetism – a personal perspective.Quat. Sci. Revs. 10, 73–85.
Ozdemir, O., Dunlop, D.J., Moskowitz, B.M., 1993. The effect ofoxidation on the Verwey transition in magnetite. Geophys. Res. Lett.20, 1671–1674.
Parry, L.G., 1982. Magnetisation of immobilized particle dispersions withtwo distinct particle sizes. Phys. Earth. Planet. Inter. 28, 230–241.
Shcherbakova, V., Shcherbakov, V., Heider, F., 2000. Properties of partialthermoremanent magnetization in pseudosingle domain and multido-main magnetic grains. J. Geophys. Res., 105, N0 B1, pp. 767–781.
Shcherbakov, V.P., Shcherbakova, V.V., Vinogradov, Y.K., Heider, F.,2001. Thermal stability of pTRMs created from different magneticstates. Phys. Earth Planet. Int. 126, 59–73.
510 A.I.R. Herries et al. / Physics and Chemistry of the Earth 33 (2008) 496–510
Thellier, E., Thellier, O., 1959. Sur L’intensite du champ magnetiqueterrestre dans le passe historique et geologique. Ann. Geophys. 15,285–376.
Thomas, N., 1992. Rock magnetic and palaeomagnetic investigations ofthe gardar lava succession, South Greenland. PhD thesis. Dept. EarthSciences, University of Liverpool, U.K.
Thompson, R., Oldfield, F., 1986. Environmental Magnetism. Allen &Unwin, London.
Van Velzen, A.J., Zijderveld, J.D.A., 1992. A method to study alterationsof magnetic minerals during thermal demagnetization applied to a fine-grained marine marl (Trubi formation, Sicily). Geophys. J. Int. 110,79–90.
Yu, Y., Tauxe, L., Genevey, A., 2004. Toward and optimal geomagneticfield intensity determination technique. Geochem. Geophy. Geosyst. 5(2), Q02H0. doi:10.1029/2003GC00063. An Electronic Journal of theEarth Sciences.