Design, Fabrication and Performance Analysis of Solar oVen
140
i DECLARATION I hereby declare that this thesis, submitted to Universiti Malaysia Sabah as partial fulfillment of the requirements for the degree of Bachelor of Mechanical Engineering, has not been submitted to any other university for any degree. I also certify that the work described herein is entirely my own, except for quotations and summaries sources of which have been duly acknowledged. This thesis may be made available within the university library and may be photocopied or loaned to other libraries for the purposes of consultation. 19 MAY 2014 MOHD FAZRIN BIN JAMMA@JAMAL CERTIFIED BY Dr. Nancy Julius Siambun SUPERVISOR
-
Upload
independent -
Category
Documents
-
view
1 -
download
0
Transcript of Design, Fabrication and Performance Analysis of Solar oVen

i
DECLARATION
I hereby declare that this thesis, submitted to Universiti Malaysia Sabah as partial fulfillment of the requirements for the degree of Bachelor of Mechanical Engineering, has not been submitted to any other university for any degree. I also certify that the work described herein is entirely my own, except for quotations and summaries sources of which have been duly acknowledged.
This thesis may be made available within the university library and may be photocopied or loaned to other libraries for the purposes of consultation.
19 MAY 2014 MOHD FAZRIN BIN JAMMA@JAMAL
CERTIFIED BY
Dr. Nancy Julius Siambun
SUPERVISOR
ii
ACKNOWLEDGEMENT
Foremost, I would like express my sincere gratitude to my supervisor, Dr. Nancy Julius Siambun, for her excellent guidance, caring, patience help and support during completing this project. Her guidance helped me in all the time of research and writing of this thesis.
Next, my gratitude goes to Dr Tamber A. Tabet, my previous supervisor for his continuous support during completing my project 1. Without your supervising, I will not able to accomplish this research.
My sincere thanks also goes to my friend Nurzarinah Suharin, Kenny Vincent ,Jamaluddin Saparuddin who have been working together with me and help each other in the problems we faced. My research would not have been possible without their helps.
Last but not least, I would like to thank to my supportive parents and understanding family members that gives so much encouragement and help to finish this research.

iii
ABSTRACT
Malaysia has been regarded as country that has favorable climate for implementation of solar cooking. Solar cooking has been considered as simplest, safest, most convenient way to cook food. Therefore, in this research, a new solar oven has been designed, fabricated and experimentally examined. During the process, all factors such as material selection and design were considered accordingly in order to build finest solar oven. For comparison, a conventional solar box oven was also built. Both ovens were experimentally tested under no load condition, water as load and engine oil as load. By using thermocouple, temperature of load in both ovens was taken and from that calculation was able to be made. The difference in term of efficiency was regarded as improved efficiency. From all six experiments, it can conclude that a new design of solar oven has proved its ability in terms of thermal performance.
iv
ABSTRAK
Malaysia telah diklasifikasikan sebagai sebuah negara yang mempunya cuaca yang berpotensi bagi penggunaan cahaya matahari untuk tujuan memasak.Kaedah ini telah dianggap sebagai suatu alternatif yang dikira sebagai mudah, selamat dan tidak rumit. Oleh itu, melalui kajian ini, oven yang menggunakan cahaya matahari sebagai kaedah untuk memasak telah direka, dibina dan diuji melalui experimen. Semasa kajian dijalankan, faktor seperti pemilihan bahan dan rekaan telah diambilkira secara terperinci bagi menghasilkan oven yang baik. Bagi tujuan perbandingan, sebuah oven konvensional turut dibina. Semasa eksperimen dijalankan, kedua dua oven telah diuji dengan menggunakan air, minyak enjin dan akhirnya sekali tanpa sebarang beban. Suhu setiap medium telah diukur dengan menggunakan thermocouple dan berdasarkan suhu yang diambi,l penggiran telah dibuat. Perbezaan pada keberkesan oven telah diambil kira sebagai peningkatan keberkesanan daripada rekaan sebelumnya. Daripada keenam-enam eksperimen, kajian berjaya disimpulkan bahawa rekaan yang baru telah terbukti keberkesanannya daripada rekaan sebelumnya.

v
CONTENTS
Page
DECLARATION i
ACKNOWLEDGEMENT ii
ABSTRACT iii
ABSTRAK iv
CONTENTS v
LIST OF TABLE ix
LIST OF FIGURES xii
LIST OF SYMBOL xvi
LIST OF ABBREVIATIONS xvii
CHAPTER 1 1
1.1 Introduction 1
1.2 Problem Statement 3
1.3 Objective 4
1.4 Scope of Work 4
CHAPTER 2 5
2.1 Introduction 5
2.2 Solar Oven Concept 5
2.2.1 Heat Gain 6
2.2.2 Heat Loss 7
vi
2.2.2.1 Conduction 8
2.2.2.2 Convection 8
2.2.2.3 Radiation 9
2.2.3 Heat Storage 9
2.3 Principle of Light Reflection in Solar Oven 9
2.4 Type of Solar Cooker 11
2.4.1 Direct Solar Cooker 12
2.4.1.1 Box Type Cookers 12
2.4.1.2 Concentrating Type Cookers 13
2.4.2 Indirect Solar Cookers 15
2.5 Parameter that Enhances the Performance of Solar Oven 17
2.5.1 Booster Mirror 18
2.5.2 Absorber Plate 19
2.5.3 Cooking Equipment and Cooking Chamber 20
2.5.4 Insulation 21
CHAPTER 3 23
3.1 Introduction 23
3.2 Project task 24
3.3 Selection of Criteria 24
3.3.1 Material Selection for Component 25
3.3.1.1 Main body 25
3.3.1.2 Insulator 25
vii
3.3.1.3 Cooking Pot 26
3.3.2 Design selection for component 27
3.3.2.1 Main Body 27
3.3.2.2 Reflector 27
3.3.2.3 Cooking Chamber 28
3.3.2.4 Cover of the Oven 28
3.4 Experimental Method and Procedure 29
3.4.1 Procedure 29
3.4 Calculation 30
CHAPTER 4 36
4.1 Overview of the Design 36
4.2 Design of Cooking Chamber 36
4.3 Design of Solar Reflector (Mirrors) 44
4.4 Structure Analysis of New Prototype (Prototype 2). 53
4.4.1 Mirror 1 ,2 and 5 55
4.4.2 Mirror 3 and 4 59
4.5 Design of Cooking Chamber for Prototype 1(Conventional Solar Box Oven) 62
4.5.1 Structure Analysis of Prototype 1 67
CHAPTER 5 70
5.1 Analysis of Results 70
5.2 Design and Prototype 70
5.2.1Material 70

viii
5.2.1.1 Main Body 71
5.2.1.2 Cooking Chamber 71
5.2.1.3Reflector 72
5.2.1.4 Insulator 73
5.3 Experimental Data and Analysis 73
5.3.1 Experiment 1 (Without Load, Duration 11:05am – 1:05pm) 75
5.3.2 Experiment 2 (Without Load, Duration 2:05pm – 4.05pm) 77
5.3.3 Experiment 3 (Water as Load, Duration 11:05am – 13:05pm) 79
5.3.4 Experiment 4 (Water as Load, Duration 2.05pm – 4:05pm) 81
5.3.5 Experiment 5 (Engine Oil as Load, Duration 11.05am – 1:05pm) 83
5.3.6 Experiment 6 (Engine Oil as Load, Duration 1.05pm – 4:05pm) 86
5.4 Effect of Additional Mirror and Insulator 89
5.4.1 Effect of Additional Mirror 89
5.4.2 Effect of Insulator 89
5.5 Energy Balance for New Prototype (Prototype 2) 89
CHAPTER 6 91
6.1 Overview 91
6.2 Conclusion 91
6.2 Future Work 92
REFERENCES 93
Appendix A 97
Appendix B 99

ix
Appendix C 101
Appendix D 104
Appendix E 106
Appendix F 108
Appendix G 111
Appendix H 114
Appendix J 117
x
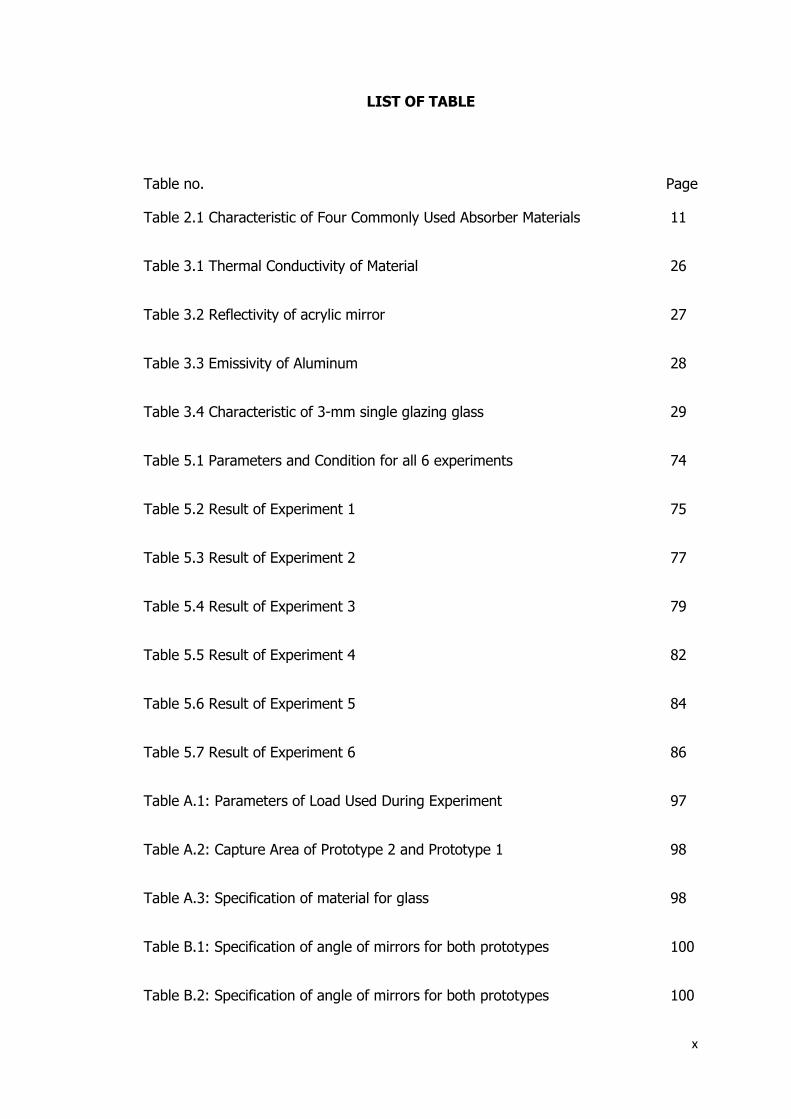
LIST OF TABLE
Table no. Page
Table 2.1 Characteristic of Four Commonly Used Absorber Materials 11
Table 3.1 Thermal Conductivity of Material 26
Table 3.2 Reflectivity of acrylic mirror 27
Table 3.3 Emissivity of Aluminum 28
Table 3.4 Characteristic of 3-mm single glazing glass 29
Table 5.1 Parameters and Condition for all 6 experiments 74
Table 5.2 Result of Experiment 1 75
Table 5.3 Result of Experiment 2 77
Table 5.4 Result of Experiment 3 79
Table 5.5 Result of Experiment 4 82
Table 5.6 Result of Experiment 5 84
Table 5.7 Result of Experiment 6 86
Table A.1: Parameters of Load Used During Experiment 97
Table A.2: Capture Area of Prototype 2 and Prototype 1 98
Table A.3: Specification of material for glass 98
Table B.1: Specification of angle of mirrors for both prototypes 100
Table B.2: Specification of angle of mirrors for both prototypes 100
xi
Table B.3: Concentrate factor of respective experiment at given time 101
Table B.4: Time duration of each experiment 101
Table C.1 Highest Temperature Reached by the Cooking Chamber Surface 102
Table D.1 Highest Temperature Reached by the Cooking Chamber Surface 104
Table E.1 Time Taken by Load in Prototype 1 and Prototype 2 107
Table F.1 Time Taken by Load in Prototype 1 and Prototype 2 110
Table G.1 Time Taken by Load in Prototype 1 and Prototype 2 113
Table H.1 Time Taken by Load in Prototype 1 and Prototype 2 116
Table J.1 Thermal Conductivity of Aluminum and Alumina Wool 119
xii
LIST OF FIGURES
Figure No. Page
2.1 The Principle of Light Reflection 10
2.2 Different Types of Solar Oven 13
2.3 Example of Concentrating Solar Cooker 15
2.4 Example of Indirect Solar Cooker 17
2.5 Concept of Light Reflection in Concave Mirror 21
3.1 Flow of Research 24
3.2 Cooking Pot Used in this Project 26
4.1 Full Design of New Prototype (Prototype 2) using Solid Work 37
4.2 Isometric View of Cooking Chamber for New Prototype (Prototype 2) 37
using SolidWork
4.3 Top View of Cooking Chamber for New Prototype (Prototype 2) 38
using SolidWork
4.4 Side view of Cooking Chamber for Prototype 2 using SolidWork 39
4.5 Illustration of Light Reflection inside Cooking Chamber 42
4.6 Position of Cooking Pot inside Cooking Chamber in New Prototype 43
(Prototype 2)
4.7 Design of mirrors for New Prototype (Prototype 2) 45

xiii
4.8 Mirror at the 1st side of New Prototype (Prototype 2) with Labels 46
4.9 Mirror at the 5th Side of New Prototype (Prototype 2) with Labels 48
4.10 Illustration of Triangle at the 5th Side of New Prototype (Prototype 2) 49
4.11 Mirror at the 3rd Side of New Prototype (Prototype 2) with Labels 51
4.12 Illustration of Triangle at the 3rd Side of New Prototype (Prototype 2) 52
4.13 Illustration of Force Exerted at the 2nd and 5th Side of New Prototype 55
(Prototype 2)
4.14 Illustration of Force Exerted at the 1st Side of New Prototype 55
(Prototype 2)
4.15 Isometric View of Bolts Used in New Prototype (Prototype 2) 57
4.16 Illustration of Force Exerted at the 3rd and 4th Side of New Prototype 59
(Prototype 2)
4.17 Top View of Bolts Used to Support Mirror at 3rd and 4th Side of New 61
Prototype (Prototype 2)
4.18 Design of Conventional Prototype (Prototype 1) 62
4.19 Top and Front View of Conventional Prototype (Prototype 1) 63
4.20 Illustration of Triangle to Find Optimum Mirror’s Angle of Conventional 65
Prototype (Prototype 1)
4.21 Illustration of Force Exerted at the mirror of Conventional 67

xiv
Prototype (Prototype 1)
4.22 Bolts Used to Support Mirror of Conventional Prototype (Prototype 1) 68
5.1 Frame of Prototype 2 71
5.2 Cooking Chamber for Prototype 2 72
5.3 Mirrors Used for Prototype 2 72
5.4 Alumina Wool Placed in Prototype 2 73
5.5 Conventional Prototype (Prototype 1) and New Prototype (Prototype 2) 74
During Experiment.
5.6 Graph of Temperature for Conventional Prototype (Prototype 1) and 76
New Prototype (Prototype 2) in Experiment 1
5. 7 Graph of Temperature for Conventional Prototype (Prototype 1) and 78
New Prototype (Prototype 2) in Experiment 2
5.8 Graph of Temperature for Conventional Prototype (Prototype 1) and 80
New Prototype (Prototype 2) in Experiment 3
5.9 Graph of Temperature for Conventional Prototype (Prototype 1) and 82
New Prototype (Prototype 2) in Experiment 4
5.10 Graph of Temperature for Conventional Prototype (Prototype 1) and 84
New Prototype (Prototype 2) in Experiment 5
5.11 Graph of Temperature for Conventional Prototype (Prototype 1) and 87
xv
New Prototype (Prototype 2) in Experiment 6
5.12 Graph of All Conducted Experiment 88
B.3 Illustration of Parameters to Calculate the Concentrate Factor 99
J.1 Thickness of Cooking Chamber from Side View 118
J.2 Thickness of Cooking Chamber from Side View 121

xvi
LIST OF SYMBOL
Gravitational force
Thermal Conductivity m mass t Time
F Force
Density
Temperature
Shear stress
Absorptance C Specific heat capacity
Emissivity R Thermal resistance
U Overall heat transfer coefficient
Stefan-Boltzmann constant
Transmissivity

xvii
LIST OF ABBREVIATIONS
vs. (versus) means against
1
CHAPTER 1
INTRODUCTION
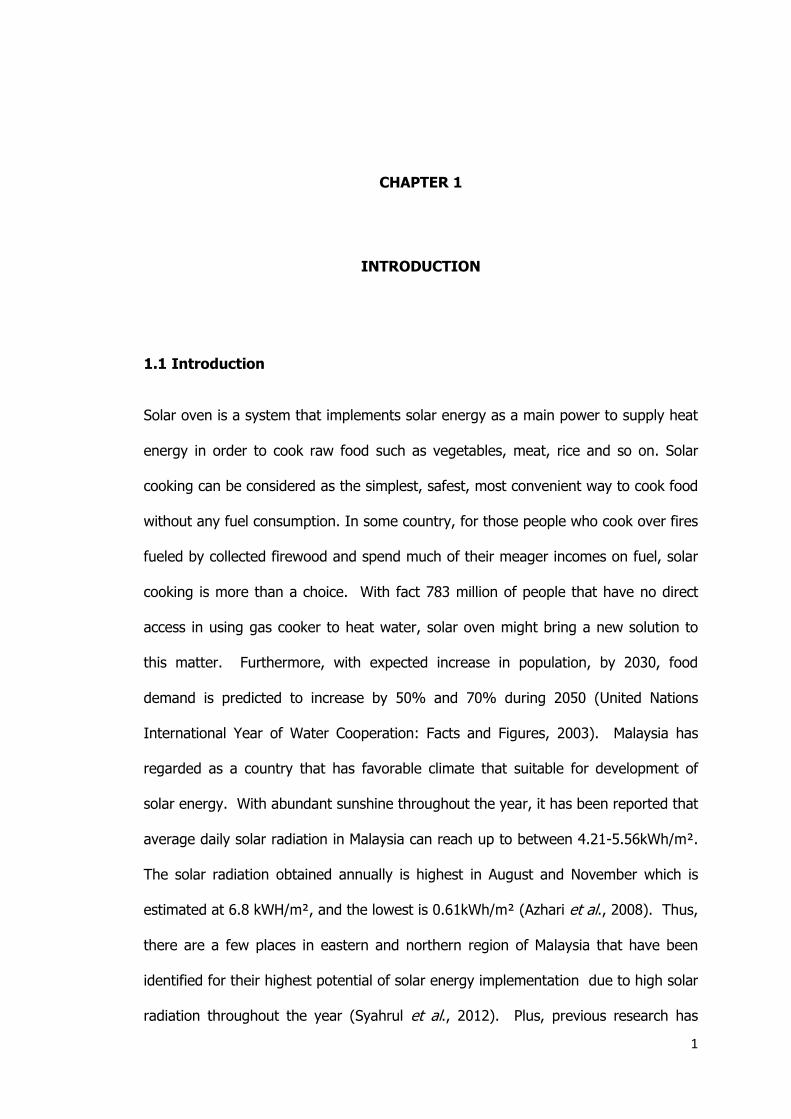
1.1 Introduction
Solar oven is a system that implements solar energy as a main power to supply heat
energy in order to cook raw food such as vegetables, meat, rice and so on. Solar
cooking can be considered as the simplest, safest, most convenient way to cook food
without any fuel consumption. In some country, for those people who cook over fires
fueled by collected firewood and spend much of their meager incomes on fuel, solar
cooking is more than a choice. With fact 783 million of people that have no direct
access in using gas cooker to heat water, solar oven might bring a new solution to
this matter. Furthermore, with expected increase in population, by 2030, food
demand is predicted to increase by 50% and 70% during 2050 (United Nations
International Year of Water Cooperation: Facts and Figures, 2003). Malaysia has
regarded as a country that has favorable climate that suitable for development of
solar energy. With abundant sunshine throughout the year, it has been reported that
average daily solar radiation in Malaysia can reach up to between 4.21-5.56kWh/m².
The solar radiation obtained annually is highest in August and November which is
estimated at 6.8 kWH/m², and the lowest is 0.61kWh/m² (Azhari et al., 2008). Thus,
there are a few places in eastern and northern region of Malaysia that have been
identified for their highest potential of solar energy implementation due to high solar
radiation throughout the year (Syahrul et al., 2012). Plus, previous research has

2
supported the fact of Malaysia’s suitability for harnessing solar energy and developing
technology due to the availability of sunshine (Ali et al., 2009).
The differences of energy consumption in some countries caused some of the
solution are often not applicable. In some industrialized countries, energy
consumption is supplied by fossil fuels and nuclear. However for some places with
low humidity such as Africa, firewood is the main energy supply for the food cooking.
Due to ecological problems, somehow, firewood is hard to obtain and becomes
expensive in some regions. As a consequence, the continuous of fuel wood
consumption has caused exceeding upon its replacement, proportionally contributing
to deforestation, soil erosion and so on. Thus, the use of solar energy might
contribute much as an alternative energy supply since it does not have to be
replenished.
Solar cooker was first invented by Horase de Saussure, a Swiss naturalist. On
his first attempt, he managed to cook fruits in a primitive solar box cooker that
reached temperature of 190°F. Starting from that, many people started to use this
device at some places in India and China. However, since the cookers were not
affordable and too complicated designs, people have to continue to use the
traditional way of cooking. In 1950, the solar cooker started to evolve. Many top
engineers were hired to study different aspects of solar cooking designs. From that,
they came out with a conclusion that a proper constructed solar cooker not only can
cooked food thoroughly, but were quite easy to be used (Radabaugh, 1998).
There are three types of most common solar cooker which are heat-trap
boxes solar cooker, parabolic solar cooker and panel solar cookers. Heat box
cookers work by reflecting the sunlight into the box and trap the heat inside it.
Basically, this cooker cooks at moderate to high temperature and often
3
accommodates with multiple pots. The second type of cooker is parabolic solar
cooker which has the ability to cook fast at high temperatures. However, this type of
cooker often need frequent adjustment and supervision, making it slightly
complicated compared to any other type of cookers. The last one is panel cookers.
Panel cookers incorporate elements of box and curved concentrator cookers. With
simple and relatively inexpensive, it becomes the most widely used combination solar
cooker.
Undeniable, to design a solar oven with high efficiency is quite impossible
since there are many uncontrollable factors that affect the performance. With a new
design of solar oven, this, probably might changes people’s perception toward this
device which indirectly solve the current problem encountered by the end user.
1.2 Problem Statement
Most of the end user of solar box cooker complained on the time consumption during
cooking the meal due to poor energy utilization. This poor energy utilization may be
caused by the design and material selection. As a consequence, people became less
interested towards solar cooker. Besides that, the concept of solar cooking has not
widely applied in Malaysia compared to other countries which has started using this
cooker. With a new design of solar oven, it may motivate people to practice solar
cooking.
4
1.3 Objective
1. To develop a new design of solar oven.
2. To obtain a better performance of solar oven through proper material
selection and design.
3. To compare the heating performance between a new design of solar oven
with the conventional design solar oven.
1.4 Scope of Work
In order to achieve all objectives stated, there is few scope of work that needs to be
accomplished in this project. This research was started by doing a wide review on the
solar oven principle. From that, lots of idea was able to be pointed out and through
the study of literature, ideas of improving the solar oven system managed to be
decided.
Basically, material and design are the main key element in determining the
performance of solar oven. Thus, material was selected properly based on criteria
such as properties, availability and cost.
Meanwhile, in designing the prototype, factors such as dimension, endurance
and reliability was identified and evaluated in detail. Few designs were made and
from that the best design was selected. Evaluation was made based on method that
being used by previous researcher.
After finalizing everything, proposed design was fabricated accordingly. For
comparison, a conventional solar box oven was built. At the end phase of this
research, experiment was conducted to test and analyze the performance of both
prototype and efficiency was determined.
5
CHAPTER 2
LITERATURE REVIEW
2.1 Introduction
This section consists of discussions of solar oven with adequate knowledge to pursue
improvements on the factor that affecting the performance. Improvement of the
solar oven requires common knowledge from understanding concept, component
functions and utilizations and critical decision. Further details will be discussed in the
literature review as stated below.
2.2 Solar Oven Concept
Solar cooking defined as a concept that utilizes solar energy to cook food. Solar
cooking also aid some significant processes such as pasteurization and sterilization
(Cuce and Cuce, 2013 ). The history of solar cookers dates back to the 18th century.
Solar cooker is first introduced by a French-Swiss Physicist Horace de Saussure on his
first attempt to cook food by means of solar energy. He constructed a miniature
green house with 5 layers of glass boxes turned upside down on a black table and
reported cooking fruit (Cuce and Cuce, 2013). As time passes by, many countless
styles of solar cooker has been developed and continually improved by researchers
6
and manufacturers. Solar has been regarded a clean energy generation that getting
more crucial day by day. Solar cookers are no longer presented as a total solution to
cooking problems but are being promoted as an add-on cooking device with specific
potential benefits and offering more choice and flexibility to consumers.
Implementation of solar cooker has found to bring many benefits to the environment
beside propose a better technique of energy utilization. Approximately, over one
third of the total primary energy consumption is used as the energy requirement for
cooking in many countries in the South East Asia (Muthusivagami et al., 2010).
Cooking is regarded as a major share of energy consumption in developing countries
(Pohekar et al., 2005). Besides that, solar cooking also has been well thought-out as
a key item to deal with environmental issues.
In the research made on the principle of cooking, the energy requirement is
at the peak during the sensible heating period. The energy required for a specific
cooking operation is not at a fixed value, depending with the cooking methods used.
During cooking, 20% of heat is spent in bringing food to boiling temperature, 35% is
spent in vaporization of water and 45% of heat is spent in convection losses from
cooking utensils (Muthusivagami et al., 2010). Basically, the performance of solar
cooker is controlled entirely by three main parameters which are heat gain, heat loss
and heat storage.
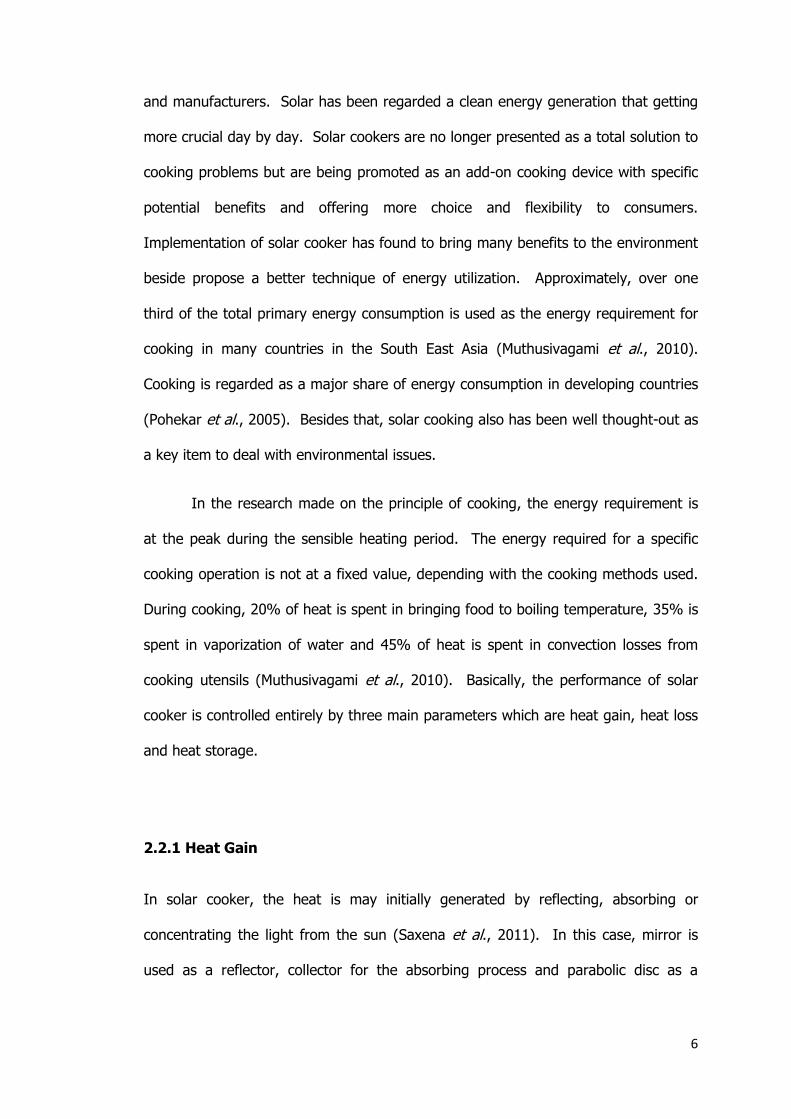
2.2.1 Heat Gain
In solar cooker, the heat is may initially generated by reflecting, absorbing or
concentrating the light from the sun (Saxena et al., 2011). In this case, mirror is
used as a reflector, collector for the absorbing process and parabolic disc as a
7
concentrator. These factors have become the main role in determining the
performance of energy utilization.
Most of the radiant energy has a longer wavelength and thus inhibits them
from pass back out through the glass. Due to that, the reflected light is either can be
absorbed by other materials within the space or passes back out through the glass.
In solar cooker, heat gained can be controlled by the total of area for the glass faces
to the sun. It is because, the greater the area exposed, the greater the solar heat
gain.
At some circumstances, reflectors act a medium to bounce additional sunlight
through the glass, into the solar box. In a report made by researcher, the addition of
side mirror boosters can increase the output of solar Flat Plate Collector to permit
higher working temperatures and enhance the efficiency (Saxena et al., 2011).
2.2.2 Heat Loss
Heat transfer is thermal energy in transit due to a temperature difference and
become one of the most common physical phenomena in the world. Estimation of all
the worldwide energy utilization suffer more than 80% involve heat transfer
processes (Chen et al., 2013). According to the theory for thermal non-equilibrium, a
total system enclosing reactants and products is thermally isolated from its
surrounding and is in thermal non equilibrium (Chen et al., 2013). Heat loss is a
common natural problem that encountered by the user of solar cooker. Heat may
loss by conduction, conduction and radiation. In second law of thermodynamic
definite that heat always travels from high to low energy. The sunlight-to-heat
conversion occurs when photons (particles of light) moving around within light waves
8
interact with molecules moving around in a substance. The energy exists in
electromagnetic rays made the solid or liquid to vibrate when they strike matter. As
they started to vibrate, apparently this will generate heat that will cook the food.
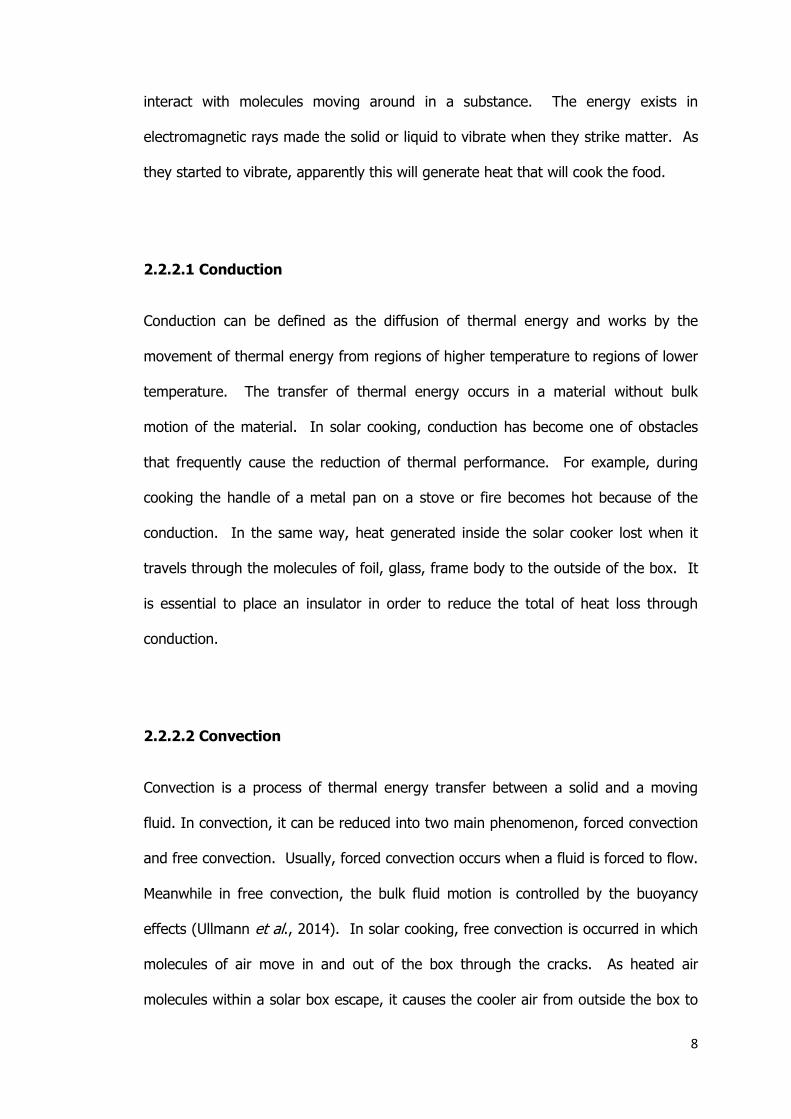
2.2.2.1 Conduction
Conduction can be defined as the diffusion of thermal energy and works by the
movement of thermal energy from regions of higher temperature to regions of lower
temperature. The transfer of thermal energy occurs in a material without bulk
motion of the material. In solar cooking, conduction has become one of obstacles
that frequently cause the reduction of thermal performance. For example, during
cooking the handle of a metal pan on a stove or fire becomes hot because of the
conduction. In the same way, heat generated inside the solar cooker lost when it
travels through the molecules of foil, glass, frame body to the outside of the box. It
is essential to place an insulator in order to reduce the total of heat loss through
conduction.
2.2.2.2 Convection
Convection is a process of thermal energy transfer between a solid and a moving
fluid. In convection, it can be reduced into two main phenomenon, forced convection
and free convection. Usually, forced convection occurs when a fluid is forced to flow.
Meanwhile in free convection, the bulk fluid motion is controlled by the buoyancy
effects (Ullmann et al., 2014). In solar cooking, free convection is occurred in which
molecules of air move in and out of the box through the cracks. As heated air
molecules within a solar box escape, it causes the cooler air from outside the box to
9
enter. As a result, it reduces the total of heat inside the solar cooker and eventually
reduces the thermal performance of solar cooker.
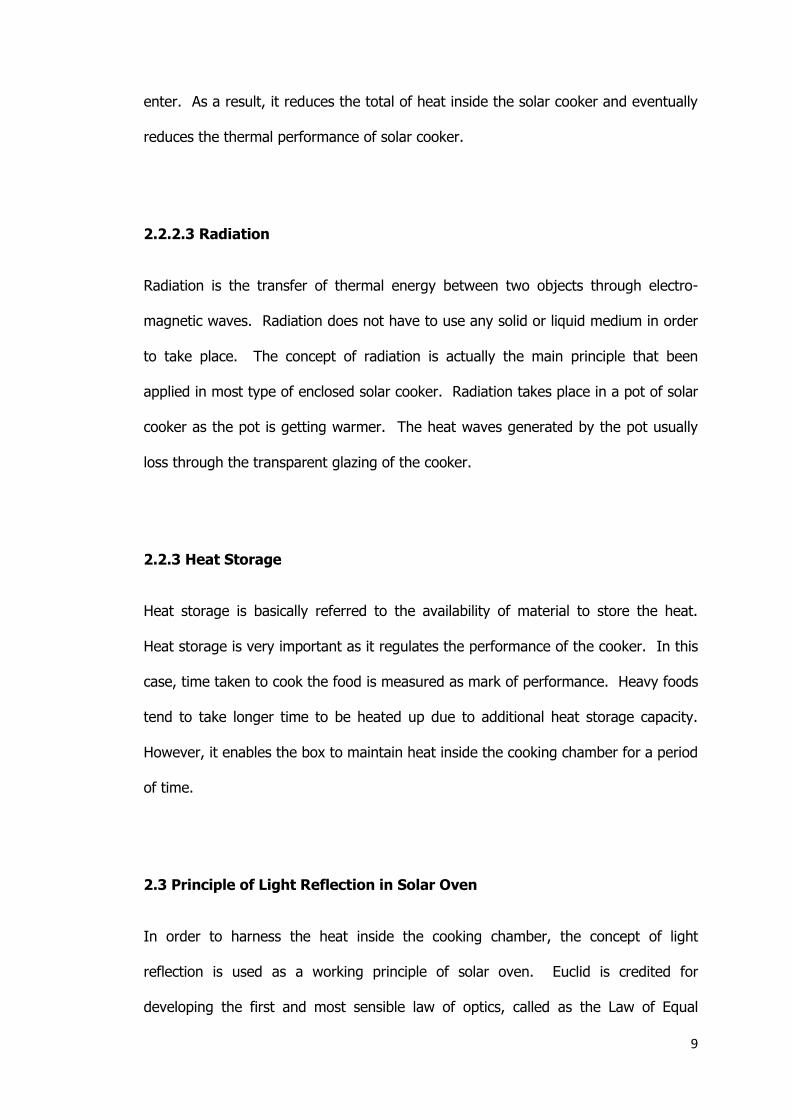
2.2.2.3 Radiation
Radiation is the transfer of thermal energy between two objects through electro-
magnetic waves. Radiation does not have to use any solid or liquid medium in order
to take place. The concept of radiation is actually the main principle that been
applied in most type of enclosed solar cooker. Radiation takes place in a pot of solar
cooker as the pot is getting warmer. The heat waves generated by the pot usually
loss through the transparent glazing of the cooker.
2.2.3 Heat Storage
Heat storage is basically referred to the availability of material to store the heat.
Heat storage is very important as it regulates the performance of the cooker. In this
case, time taken to cook the food is measured as mark of performance. Heavy foods
tend to take longer time to be heated up due to additional heat storage capacity.
However, it enables the box to maintain heat inside the cooking chamber for a period
of time.
2.3 Principle of Light Reflection in Solar Oven
In order to harness the heat inside the cooking chamber, the concept of light
reflection is used as a working principle of solar oven. Euclid is credited for
developing the first and most sensible law of optics, called as the Law of Equal
10
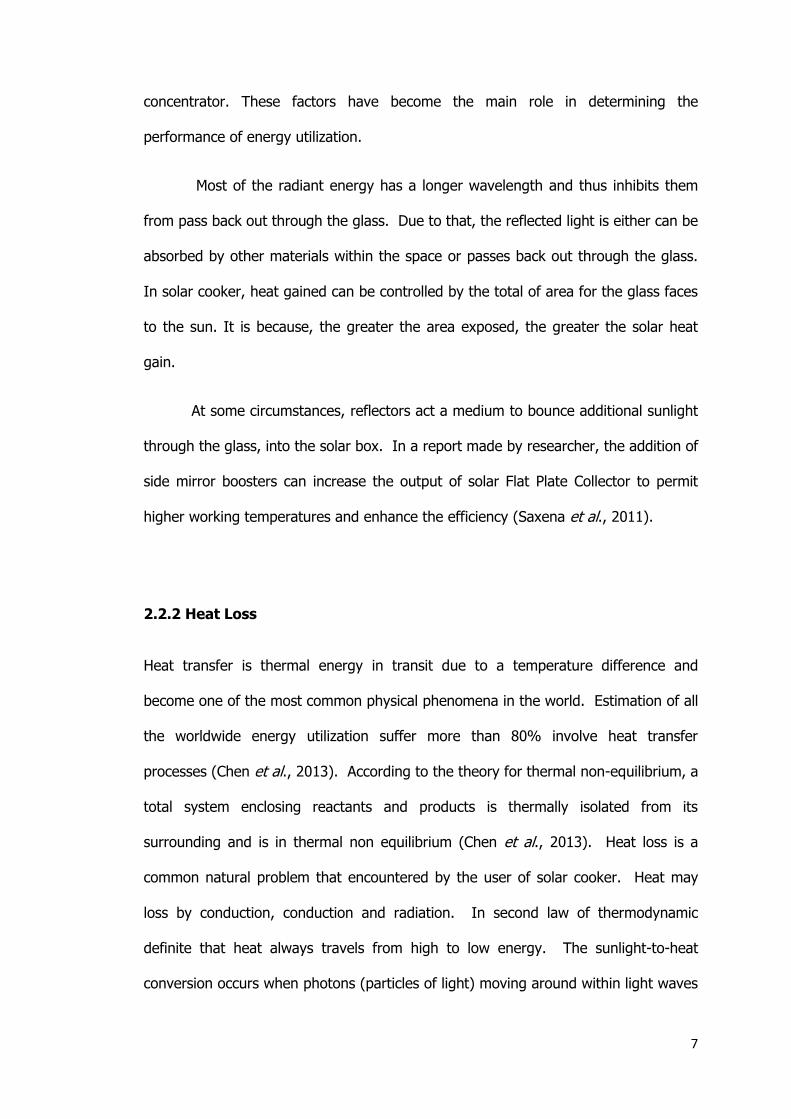
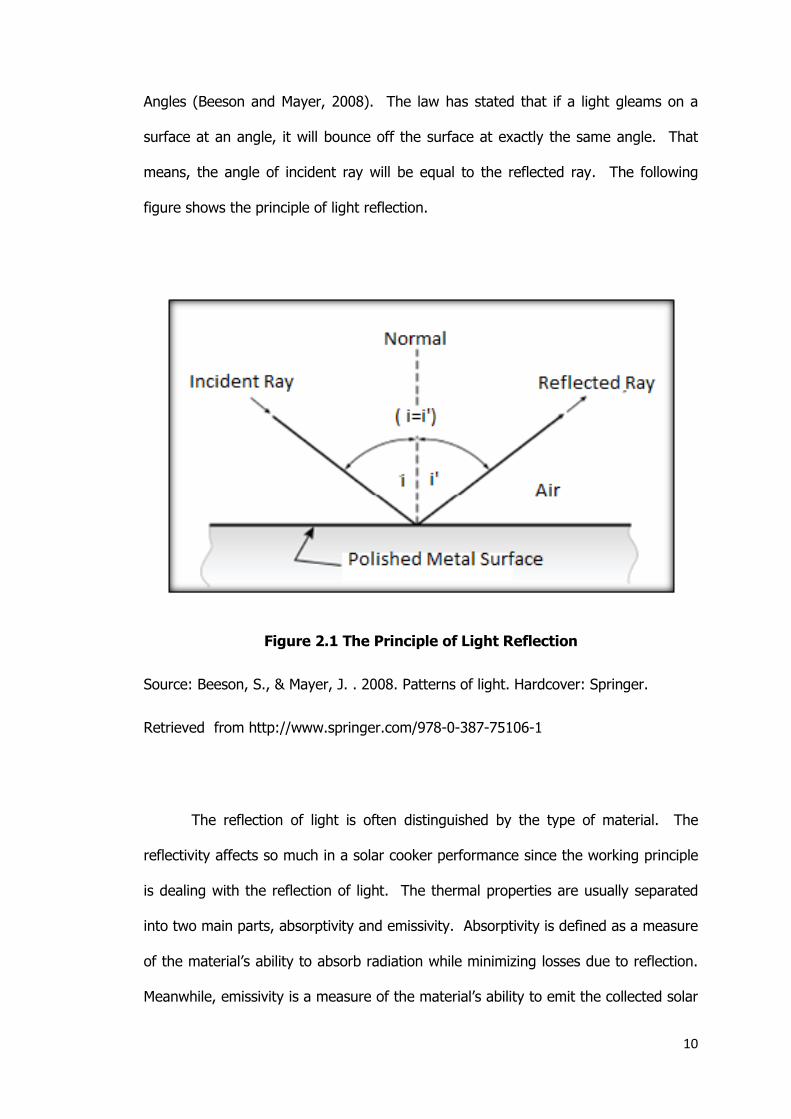
Angles (Beeson and Mayer, 2008). The law has stated that if a light gleams on a
surface at an angle, it will bounce off the surface at exactly the same angle. That
means, the angle of incident ray will be equal to the reflected ray. The following
figure shows the principle of light reflection.
Figure 2.1 The Principle of Light Reflection
Source: Beeson, S., & Mayer, J. . 2008. Patterns of light. Hardcover: Springer.
Retrieved from http://www.springer.com/978-0-387-75106-1
The reflection of light is often distinguished by the type of material. The
reflectivity affects so much in a solar cooker performance since the working principle
is dealing with the reflection of light. The thermal properties are usually separated
into two main parts, absorptivity and emissivity. Absorptivity is defined as a measure
of the material’s ability to absorb radiation while minimizing losses due to reflection.
Meanwhile, emissivity is a measure of the material’s ability to emit the collected solar
11
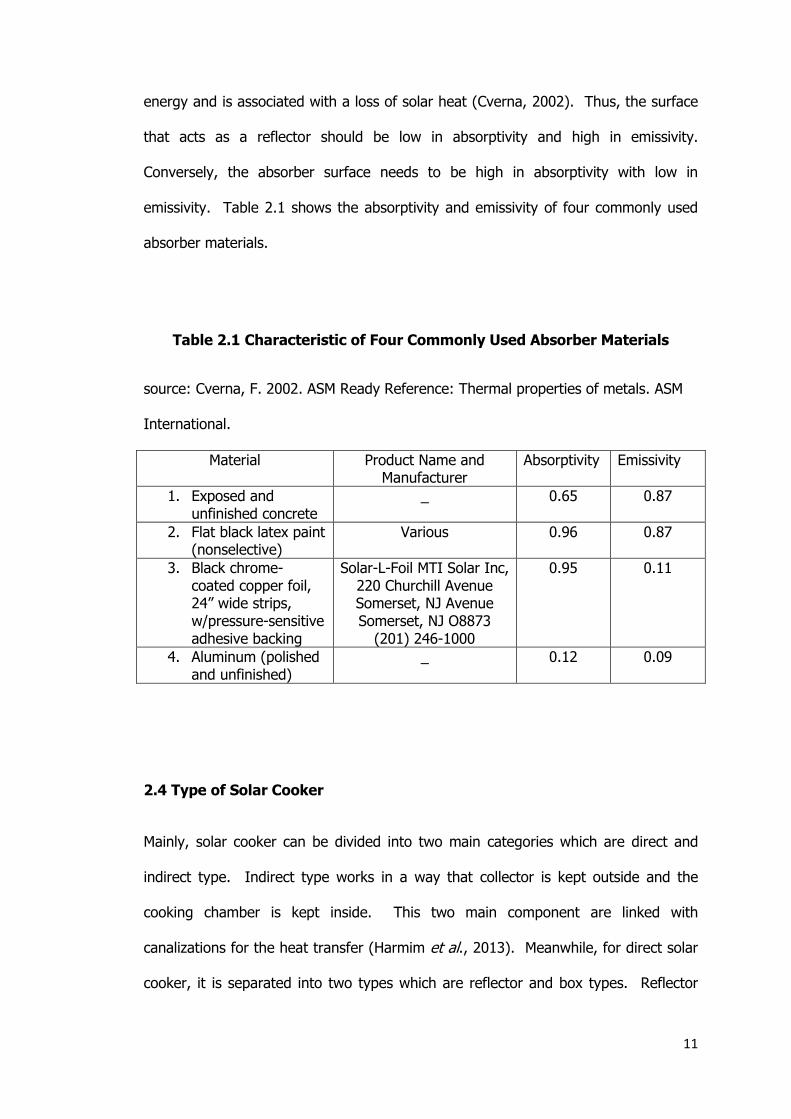
energy and is associated with a loss of solar heat (Cverna, 2002). Thus, the surface
that acts as a reflector should be low in absorptivity and high in emissivity.
Conversely, the absorber surface needs to be high in absorptivity with low in
emissivity. Table 2.1 shows the absorptivity and emissivity of four commonly used
absorber materials.
Table 2.1 Characteristic of Four Commonly Used Absorber Materials
source: Cverna, F. 2002. ASM Ready Reference: Thermal properties of metals. ASM
International.
Material Product Name and Manufacturer
Absorptivity Emissivity
1. Exposed and unfinished concrete
_ 0.65 0.87
2. Flat black latex paint (nonselective)
Various 0.96 0.87
3. Black chrome-coated copper foil, 24” wide strips, w/pressure-sensitive adhesive backing
Solar-L-Foil MTI Solar Inc, 220 Churchill Avenue Somerset, NJ Avenue Somerset, NJ O8873
(201) 246-1000
0.95 0.11
4. Aluminum (polished and unfinished)
_ 0.12 0.09
2.4 Type of Solar Cooker
Mainly, solar cooker can be divided into two main categories which are direct and
indirect type. Indirect type works in a way that collector is kept outside and the
cooking chamber is kept inside. This two main component are linked with
canalizations for the heat transfer (Harmim et al., 2013). Meanwhile, for direct solar
cooker, it is separated into two types which are reflector and box types. Reflector
12
solar cooker works by concentrating the incident solar radiation on the focus where
the pot is placed. However, these types of solar cooker need a frequent adjustment
to optimize its operation. On the other hand, for box type solar cooker, it operates
by reflecting the collected solar radiation on plane reflectors.
2.4.1 Direct Solar Cooker
2.4.1.1 Box Type Cookers
Box type solar cooker is an insulated container with a multiple or single glass cover.
A box cooker can be defined as an enclosed box that heats up and seals in the heat.
In other words, solar box may also be referred to solar oven, where the same
concept of solar cooking is applied. This type of cooker is highly depending on the
greenhouse effect in which the transparent glazing permits the passage of shorter
wavelength solar radiation, but is opaque to most of the longer wavelength solar
radiation coming from relatively low temperature heated objects (Muthusivagami et
al., 2010). The cooking principle of this type of solar cooker is as follows, sunlight
enters the box through the top of the glass, the light waves strike the bottom and
thus making the cooking chamber hot. In order to hold the heat inside the cooker, a
double-walled insulated box will be used. Also, mirrors may be equipped on the solar
cooker to reflect additional solar radiation into the cooking chamber.
All the components play a major role to speed up the cooking time. The
advantages of box cooker have been recognized including the simplicity of its
construction and operations (Muthusivagami et al., 2010). Moreover, the cooker
claims to be more stable and able to keep food remains warm for a long period of
time compared to other type of solar cooker. On the adverse side, it can only reach

13
low temperatures and may only be used in certain condition. The following figures
show solar oven with multiple and single reflector.
(a) Solar oven with multiple reflector (b) Conventional solar oven with
single reflector
Figure 2.2 Different Types of Solar Oven
source: Muthusivagami, R. ., Velraj, R., & Sethumadhavan, R. 2010. Solar cookers
with and without thermal storage-A Review. In Renewable and Sustainable Energy
Reviews 14 (2): 691–701
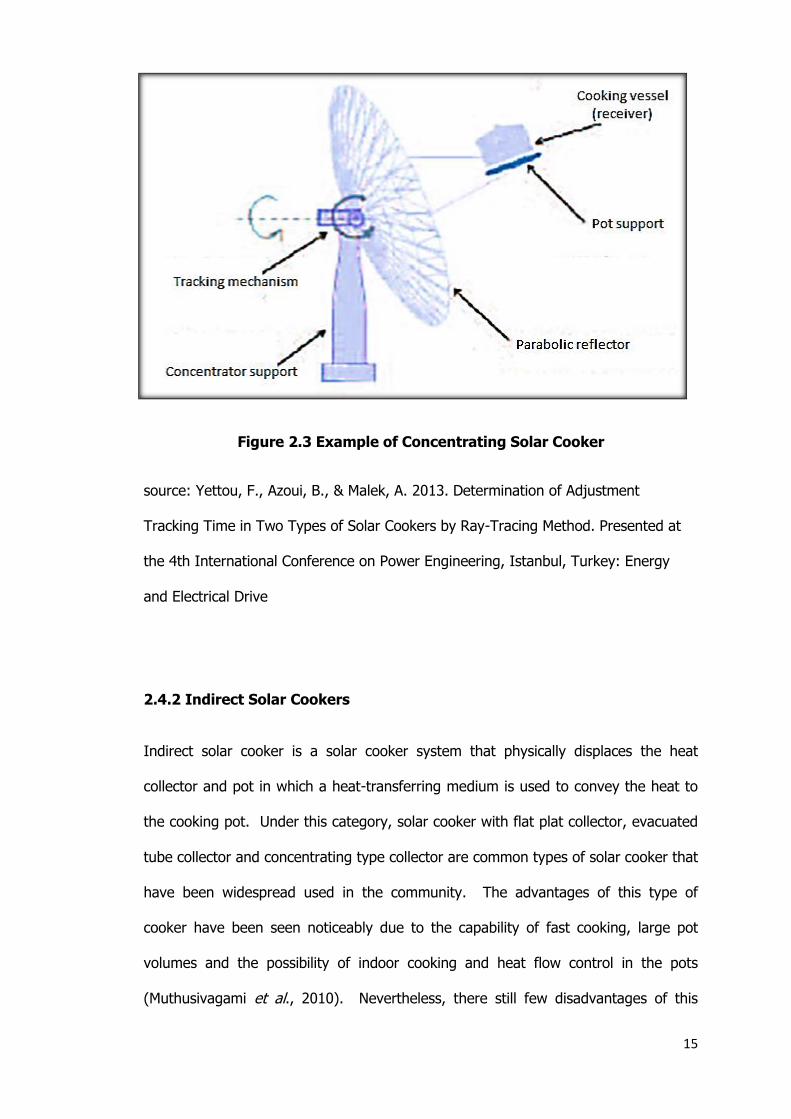
2.4.1.2 Concentrating Type Cookers
This type of solar cooker operates by placing the cooking pot on the focus of a
concentrating mirror. Basically, concentrating type solar cooker is working on two
axis tracking with a concentration ratio up to 50 and temperature up to 300° C
(Muthusivagami et al., 2010). Multifaceted mirrors, Fresnel lenses or parabolic
14
concentrators are the component that aids the modulus operands of this type of
cooker. In concentrating solar cooker type, it can be categorized into two types. For
the first type, the light is intense from above. This type of cooker obliges a dark
covered pot and a high temperature plastic bag. Within few hours of direct sunshine,
the meal can be ready without burning or drying out. For the second type, light is
penetrated from below. This can be regarded as the simplest type of concentrator
and quite easy to operate and to be built. The cooker mechanism is regulated
through a proper position between the cooking vessel and the tripod. The reason is
to concentrate the light and yet provide sufficient temperature for the cooking
purpose. This type of concentrating cooker is very popular due to sharper focus than
that of other types of reflectors but is very sensitive and still need a constant tracking
with the position of the sun. Although the parabolic reflector is a perfect design, it is
found difficult to be constructed. The following figure 2.3 show a concentrating solar
cooker.
15
Figure 2.3 Example of Concentrating Solar Cooker
source: Yettou, F., Azoui, B., & Malek, A. 2013. Determination of Adjustment
Tracking Time in Two Types of Solar Cookers by Ray-Tracing Method. Presented at
the 4th International Conference on Power Engineering, Istanbul, Turkey: Energy
and Electrical Drive
2.4.2 Indirect Solar Cookers
Indirect solar cooker is a solar cooker system that physically displaces the heat
collector and pot in which a heat-transferring medium is used to convey the heat to
the cooking pot. Under this category, solar cooker with flat plat collector, evacuated
tube collector and concentrating type collector are common types of solar cooker that
have been widespread used in the community. The advantages of this type of
cooker have been seen noticeably due to the capability of fast cooking, large pot
volumes and the possibility of indoor cooking and heat flow control in the pots
(Muthusivagami et al., 2010). Nevertheless, there still few disadvantages of this
16
solar cooker including the non-removable pots that makes cleaning and dishing food
difficult.
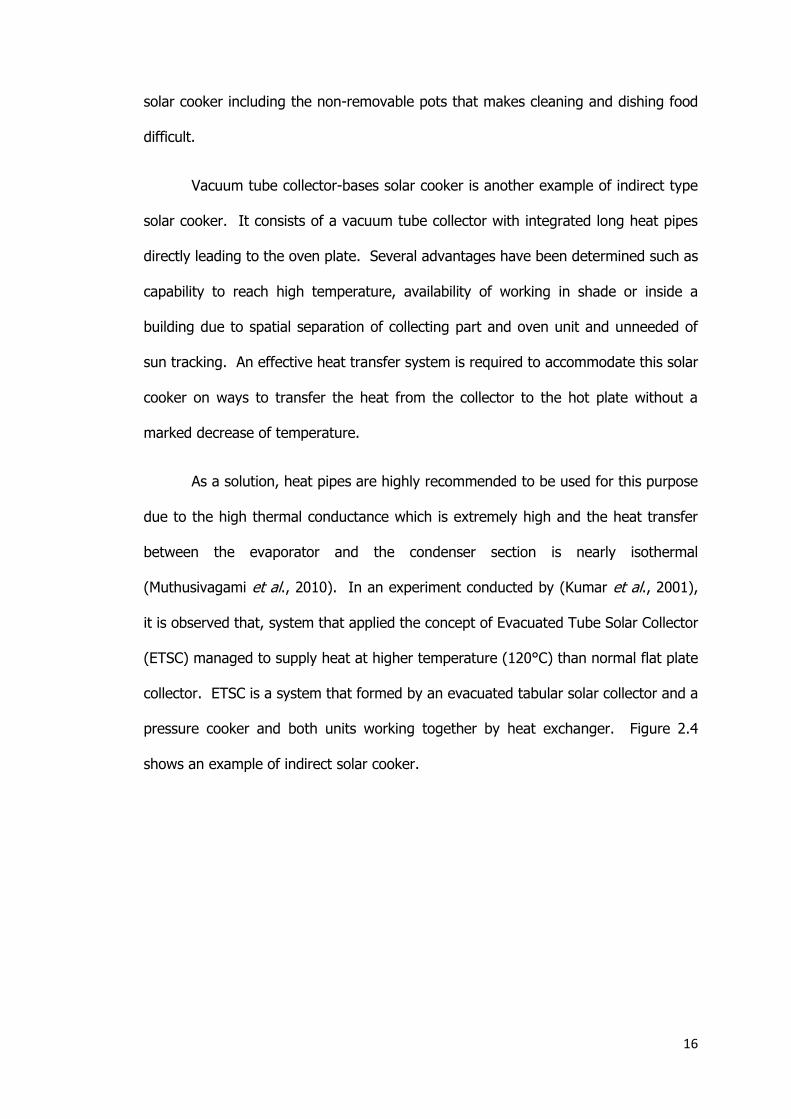
Vacuum tube collector-bases solar cooker is another example of indirect type
solar cooker. It consists of a vacuum tube collector with integrated long heat pipes
directly leading to the oven plate. Several advantages have been determined such as
capability to reach high temperature, availability of working in shade or inside a
building due to spatial separation of collecting part and oven unit and unneeded of
sun tracking. An effective heat transfer system is required to accommodate this solar
cooker on ways to transfer the heat from the collector to the hot plate without a
marked decrease of temperature.
As a solution, heat pipes are highly recommended to be used for this purpose
due to the high thermal conductance which is extremely high and the heat transfer
between the evaporator and the condenser section is nearly isothermal
(Muthusivagami et al., 2010). In an experiment conducted by (Kumar et al., 2001),
it is observed that, system that applied the concept of Evacuated Tube Solar Collector
(ETSC) managed to supply heat at higher temperature (120°C) than normal flat plate
collector. ETSC is a system that formed by an evacuated tabular solar collector and a
pressure cooker and both units working together by heat exchanger. Figure 2.4
shows an example of indirect solar cooker.
17
Figure 2.4 Example of Indirect Solar Cooker
source: Klemens, S., Maria, E., & Vieira, d. . 2008. Characterization and design
methods of solar cookers. Solar Energy, 82, 157–163.
2.5 Parameter that Enhances the Performance of Solar Oven
Solar cooker or solar oven is highly dependent on the main components of the
cookers. After the 1980s, researcher started to focus on the optimization of geometry
parameters of solar oven since they have a dominant effect on performance (Cuce
and Cuce, 2013). The oven performance is basically controlled on how well the heat
lost is controlled through all the side of the oven. In this case, the heat lost may be
caused by radiation and conduction. Thus, it is important to maximize the top area
relative to the other sides. For solar oven, the parts that being considers are booster
mirror, absorber tray, cooking vessel, and insulation. Moreover, the characteristic
features of the reflective surfaces also play the main role if it is evaluated.

18
2.5.1 Booster Mirror
Previous research has been proved that booster mirrors can be utilized in order to
increase the efficiency of solar collectors since it provides extra solar radiation (Cuce
and Cuce, 2013). Mirrors also help to reduce the wind losses as wind will not be in
direct contact to the glazed surface. As a solution, an oven type-approached was
introduced as an alternate for collecting the solar energy that would drastically boost
the overall cooker efficiency (Saxena et al., 2011). Various curves were drawn which
proved the mirror boosters in addition has a good enhancement of efficiency of solar
collectors (Saxena et al., 2011). Supporting mirror boosters depends greatly upon
the incidence angle. However, at some point mirrors become less effective when the
solar incidence angle increases. Thus it is important to coordinate the incidence
angle and the position of sun accordingly.
At least two booster mirrors should be equipped in solar oven in order to
maximize the incoming solar radiation. In a research made by Ibrahim and Elreidy
on the performance of a solar cooker integrated with a plane booster mirror reflector
under the climatic conditions of Egypt, it shows that the position and the tilt angle of
the booster mirror are very important in order to maximize the sunlight
concentration. It was observed that, within 3 to 4 hours, a good meal for a family of
four can be ready (Cuce and Cuce, 2013). Meanwhile , in Indian institute of
Technology, Shukla and Gupta have made energy and energy analysis of a
concentrating solar cooker which is integrated with a linear parabolic concentrator of
concentration ratio of 20 (Shukla and Gupta, 2008). The experiments were
conducted in both summer and winter conditions and result had shown that the
average efficiency of their solar cooker was 14%. The main reason of the low
efficiency was because of heat losses due to 16 % of optical losses, 30% of
geometrical losses and 35 % of thermal losses. This shows that a proper utilization
19
of thermal is very important in order to form a good solar cooker. On the other
hand, an experiment that carried out by the Solar Thermal Application Research
Laboratory (STARlab) between December 2005 and April 2006 concluded that the
solar oven with external mirror panels had a higher efficiency compared to other
solar cooker that had not equipped with external mirrors (Shukla and Gupta, 2008).
2.5.2 Absorber Plate
Absorber plate is a plate that placed at the bottom of the pot in order to harness
better distribution and use of heat. Absorber tray of a box cooker is a simple FPC.
When solar radiation passes through a transparent cover (glazing) and impinges on
the black painted or coated absorber surface of high absorptivity, a large portion of
this energy is absorbed by the tray, transferred to the cooking vessels and cook the
food (Curlydock, 2007). Absorber tray enhances a good heat transfer to the food in
cooking pot. Theoretically, the nature and the color of the coating play the rate of
the heat absorption. Various colors coatings have been proposed over the solar
absorber in a ways to achieve better heat conductivity. As well as its materials,
copper, aluminum and steel are recommended to be used (Saxena et al., 2011). In a
research made by Harmim et al., solar box cooker or solar oven that integrated with
fins was approximately 7% more efficient than the conventional solar box cooker
(Harmim et al., 2010). On the other experiment conducted by Ozkaymak , the result
has revealed that absorber plate managed to reach 100°C during a period of 5 h,
apparently shows the possibility to cook most of the foods (Ozkaymak, 2007).
20
2.5.3 Cooking Equipment and Cooking Chamber
The role of cooking pots has been seen to be extremely important as it acts as a
medium that control the success of solar cooker. Cooking pots are generally defined
as items which air in conduction with the absorber tray (Cuce and Cuce, 2013). In
solar oven or solar box cooker, cylindrical shaped cooking chamber is recommended.
Black paint will be coated outside of the cooker in order to increase the conduction
rate of heat. In the experiment made by Joshi et al., solar cooking efficiency may be
increase from 10-25% to 60%. He added that the optimum heat flux should be in a
range of 16,200- 25,000 kcal/h m² where m² is the bottom surface area of the
cooking system (Joshi et al., 2012) . Besides that, the number of cooking pots in a
solar box cooker may vary depending on the quantity and the type of food (Saxena
et al., 2011). Performance may increase if the cooking vessel or cooking chamber is
designed in a concave shape instead of plain shape (Cuce and Cuce, 2013). This is
because of the reflected light is focus in a single point that may called as a focal
point. The focal point made the light focuses at the center of cooking chamber
eventually made the heat concentrated at the cooking area. The result has been
supported by the experiment done by Gaur et al. where the result had shown that a
concave shape of the lid of utensil reduces the time of cooking to 10-13% (Saxena et
al., 2011). Malhotra et al. have tested four solar ovens with different volumes and
fabricated for performance study. It was experimentally observed that the reduced
volume of a cooking chamber results in a good temperature rise and the results in
less cooking time as well as possibility of cooking most eatables (Saxena et al.,
2011). Figure 2.5 shows each ray of light is reflected to a focal point made the heat
concentrated at the center.
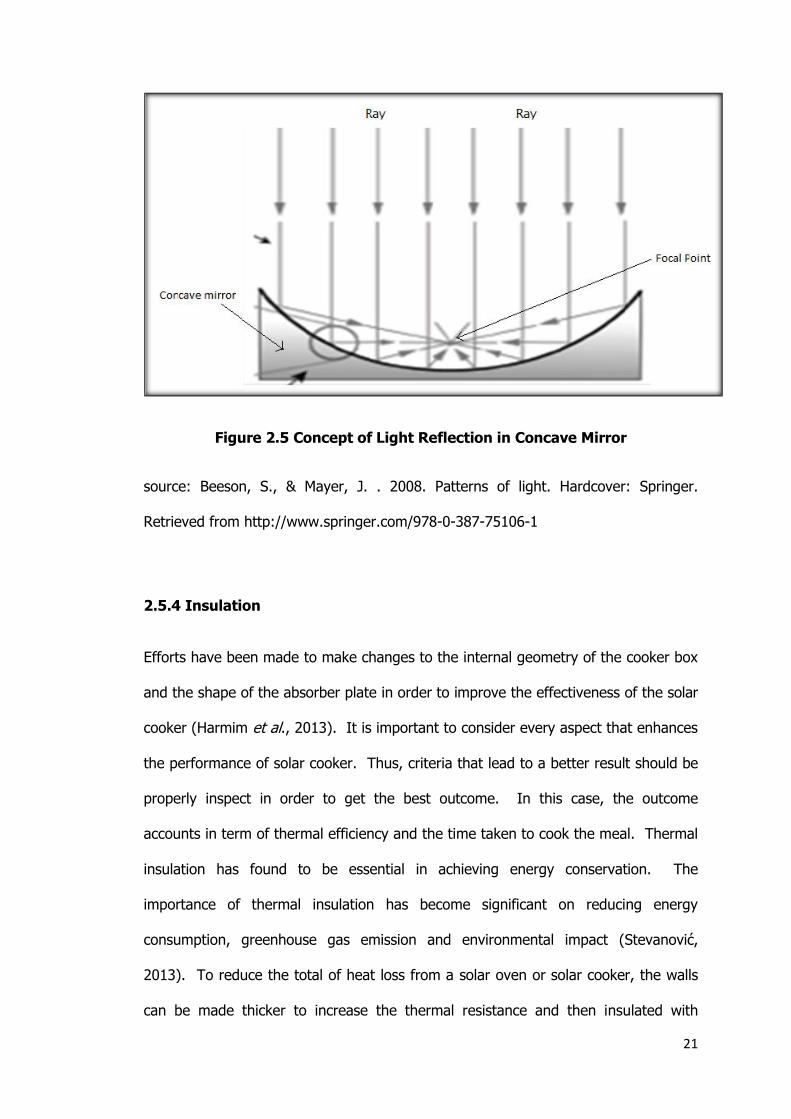
21
Figure 2.5 Concept of Light Reflection in Concave Mirror
source: Beeson, S., & Mayer, J. . 2008. Patterns of light. Hardcover: Springer.
Retrieved from http://www.springer.com/978-0-387-75106-1
2.5.4 Insulation
Efforts have been made to make changes to the internal geometry of the cooker box
and the shape of the absorber plate in order to improve the effectiveness of the solar
cooker (Harmim et al., 2013). It is important to consider every aspect that enhances
the performance of solar cooker. Thus, criteria that lead to a better result should be
properly inspect in order to get the best outcome. In this case, the outcome
accounts in term of thermal efficiency and the time taken to cook the meal. Thermal
insulation has found to be essential in achieving energy conservation. The
importance of thermal insulation has become significant on reducing energy
consumption, greenhouse gas emission and environmental impact (Stevanović,
2013). To reduce the total of heat loss from a solar oven or solar cooker, the walls
can be made thicker to increase the thermal resistance and then insulated with

22
material that have low thermal conductivities like glass- wool, foam, fiberglass,
corkboard, wool felt, cotton, sawdust, and paper which approximately has thermal
conductivities between 0.03 to 0.06 W/m/° C (Saxena et al., 2011). Besides that,
two plates of glass with a small gap between them also can be used as an insulator
to prevent heat from escaping back through the glass that eventually increase the
efficiency (Saxena et al., 2011).
23
CHAPTER 3
METHODOLOGY
3.1 Introduction
This section consists of review on the work done to accomplish this research. In
order to increase the performance of solar oven, a detailed review is done to achieve
the goal of this research. Basically, the performance of solar oven can be enhanced
by the controlling of four major parameters which are mirrors, cooking chamber,
cooking equipment and insulation. These components are marked as a key of
success of solar oven.
24
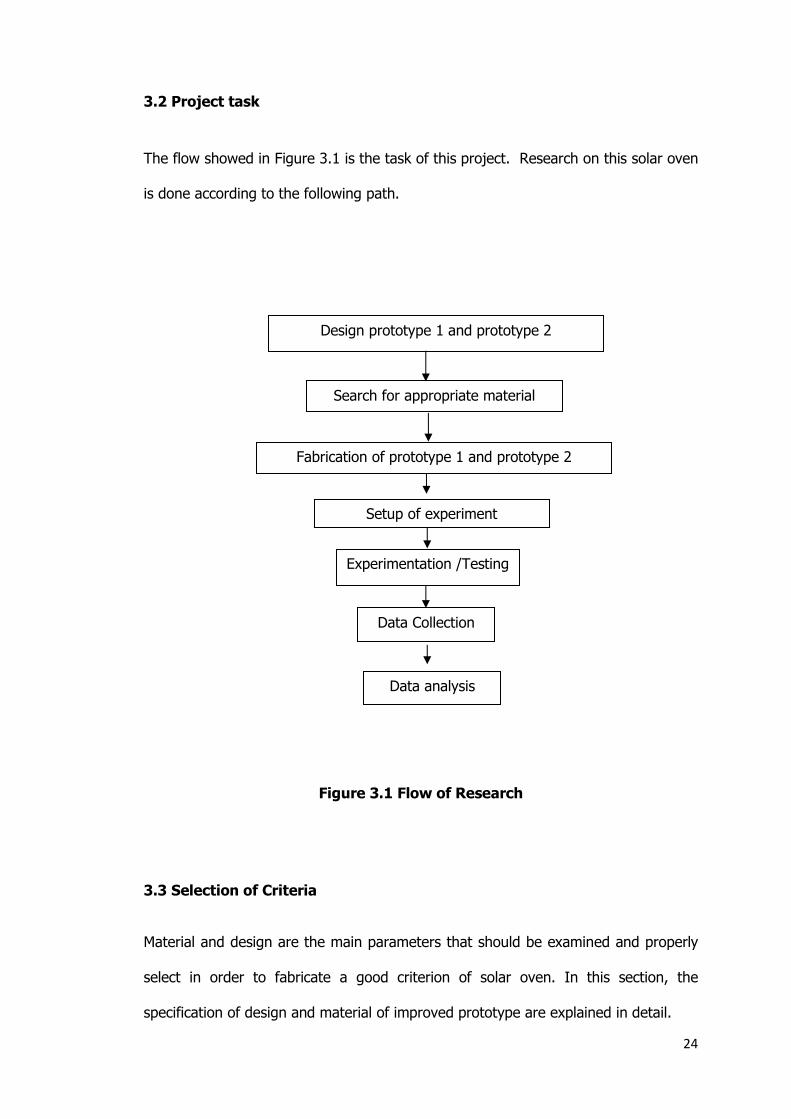
3.2 Project task
The flow showed in Figure 3.1 is the task of this project. Research on this solar oven
is done according to the following path.
Figure 3.1 Flow of Research
3.3 Selection of Criteria
Material and design are the main parameters that should be examined and properly
select in order to fabricate a good criterion of solar oven. In this section, the
specification of design and material of improved prototype are explained in detail.
Design prototype 1 and prototype 2
Experimentation /Testing
Data analysis
Setup of experiment
Fabrication of prototype 1 and prototype 2
Search for appropriate material
Data Collection
25
3.3.1 Material Selection for Component
This section consists of material selection for the main body and insulator of new
prototype.
3.3.1.1 Main body
The main frame body of this solar oven was built by using slotted angle bar. The slot
on the angle bar which is easy to be jointed has giving an advantage for fabrication
work. Due to malleable material characteristic, aluminum sheet metal has been
selected. The complex geometry of this solar oven has made aluminum become a
good choice in order to undergo work that involving on complex shaping process.
Next, the aluminum all inside the cooker was polished to increase the surface
reflectivity.
3.3.1.2 Insulator
As a mean to insulate the cooking chamber, alumina wool was used due to its
availability and low thermal conductivity. It was placed in all sides of the cooking
chamber. Thermal conductivity of material used for new prototype is shown in table
3.1 .

26
Table 3.1 Thermal Conductivity of Material
source: http://www.engineeringtoolbox.com/thermal-conductivity-d_429.html
Layer Material Thermal Conductivity
1 ,3 Aluminium
2 Alumina Wool
3.3.1.3 Cooking Pot
To enhance the total heat transfer into load, the surface area of cooking pot should
be black to increase the absorptivity of heat. However, due to some limitation,
cooking pot was not able to be fabricated. Thus, non-stick 16-cm maxim saucepan
made up from aluminum was used.
Figure 3.2 Cooking Pot Used in this Project
27
source: http://www.homebase.co.uk/en/homebaseuk/non-stick-aluminium-3-piece-
pan-set---grey192800?_$ja=tsid%3A21719%7Cprd%3A1609763&cm_mmc=Affiliate-
_-Cojun-_-TheFind.com-_-1609763
3.3.2 Design selection for component
Design selection covers in designing the main body, cooking chamber, and reflector.
3.3.2.1 Main Body
In this research, all the designing process involved was done by using SolidWork.
Previous study has proven that mirror boosters in addition has a good enhancement
of efficiency of solar collectors (Saxena et al., 2011). Thus, prototype was fabricated
with 5 sides for its reflector, yet increase total of heat reflection into the cooking
chamber of solar oven.
3.3.2.2 Reflector
Plane mirror is suggested to be used as medium to reflect the light into cooking
chamber.
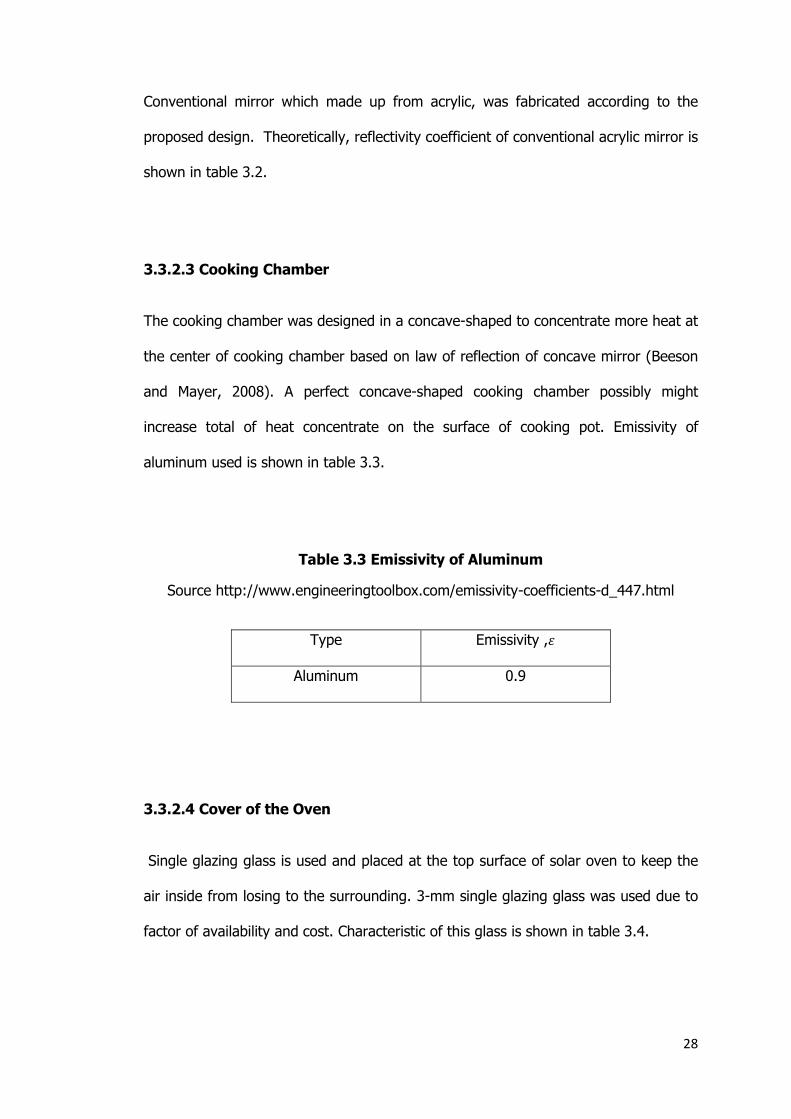
Table 3.2 Reflectivity of acrylic mirror
source: http://www.engineeringtoolbox.com
Type Reflectivity,r
Acrylic mirror 0.9
28
Conventional mirror which made up from acrylic, was fabricated according to the
proposed design. Theoretically, reflectivity coefficient of conventional acrylic mirror is
shown in table 3.2.
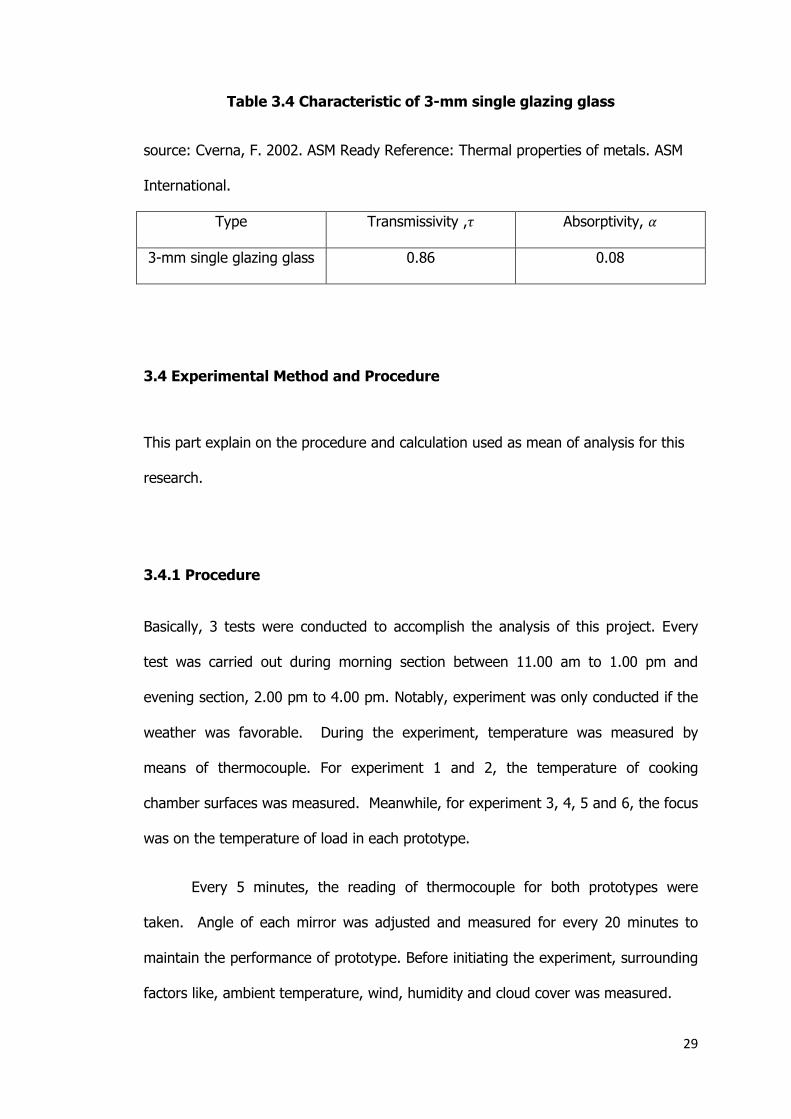
3.3.2.3 Cooking Chamber
The cooking chamber was designed in a concave-shaped to concentrate more heat at
the center of cooking chamber based on law of reflection of concave mirror (Beeson
and Mayer, 2008). A perfect concave-shaped cooking chamber possibly might
increase total of heat concentrate on the surface of cooking pot. Emissivity of
aluminum used is shown in table 3.3.
Table 3.3 Emissivity of Aluminum
Source http://www.engineeringtoolbox.com/emissivity-coefficients-d_447.html
Type Emissivity ,
Aluminum 0.9
3.3.2.4 Cover of the Oven
Single glazing glass is used and placed at the top surface of solar oven to keep the
air inside from losing to the surrounding. 3-mm single glazing glass was used due to
factor of availability and cost. Characteristic of this glass is shown in table 3.4.
29
Table 3.4 Characteristic of 3-mm single glazing glass
source: Cverna, F. 2002. ASM Ready Reference: Thermal properties of metals. ASM
International.
Type Transmissivity , Absorptivity,
3-mm single glazing glass 0.86 0.08
3.4 Experimental Method and Procedure
This part explain on the procedure and calculation used as mean of analysis for this
research.
3.4.1 Procedure
Basically, 3 tests were conducted to accomplish the analysis of this project. Every
test was carried out during morning section between 11.00 am to 1.00 pm and
evening section, 2.00 pm to 4.00 pm. Notably, experiment was only conducted if the
weather was favorable. During the experiment, temperature was measured by
means of thermocouple. For experiment 1 and 2, the temperature of cooking
chamber surfaces was measured. Meanwhile, for experiment 3, 4, 5 and 6, the focus
was on the temperature of load in each prototype.
Every 5 minutes, the reading of thermocouple for both prototypes were
taken. Angle of each mirror was adjusted and measured for every 20 minutes to
maintain the performance of prototype. Before initiating the experiment, surrounding
factors like, ambient temperature, wind, humidity and cloud cover was measured.

30
3.4 Calculation
Analysis in experiment 1 and 2 was done by making comparison between the highest
temperature reached between prototype 2 and prototype 1. The difference between
these temperatures was evaluated and marked as improved efficiency.
For experiment 2 and 3, analysis was focused on heat utilization between
heat input and heat output. Time taken by prototype 2 to reach the boiling point of
water was taken and used as reference in order to get the temperature in prototype
1. Total of energy input at given period in each prototype was calculated. Next, total
of energy used by load in both prototypes also evaluated. From that, ratio between
energy input and used was determined and become the efficiency. The difference
between the efficiency was evaluated and marked as improved efficiency.
For experiment 4 and 6, analysis was conducted by taking time taken by
prototype 1 to reach its stagnation temperature. Next the same temperature was
used as reference to get the time taken in prototype 2.Total of energy input at given
period in each prototype was calculated. Next, total of energy used by load in both
prototypes also evaluated. From that, ratio between energy input and used was
determined and become the efficiency. The difference between the efficiency was
evaluated and marked as improved efficiency.
To begin the analysis according to Michael (2008), total of power input was
determined by following formula 3.1.Formula is basically calculate total of input
power into the cooking chamber regardless the concentration factor made by
reflector

31
(3.1)
Next, the concentrate factor of each reflector for both prototypes was
calculated based on angle at desired time. To calculate, the following formula 3.2 is
used.
(3.2)
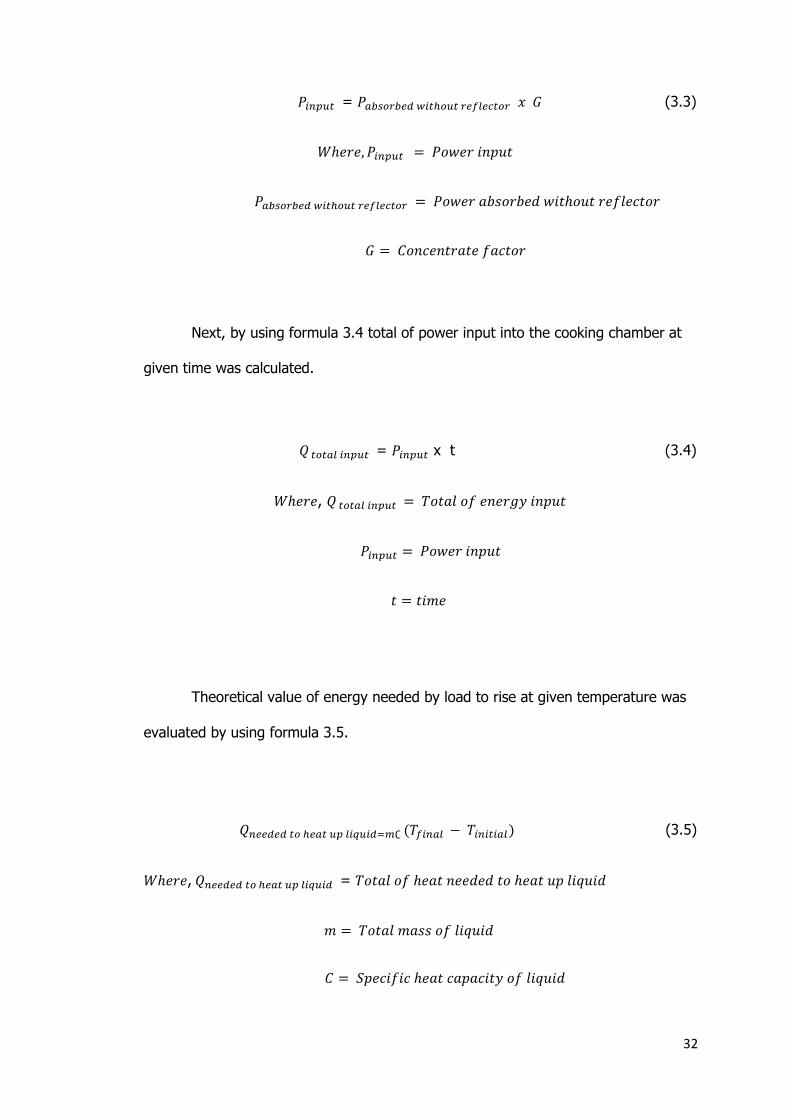
After the concentrate factor was obtained, power input with consideration of
concentrated factor was evaluated by using formula 3.3.
32
= (3.3)
Next, by using formula 3.4 total of power input into the cooking chamber at
given time was calculated.
= x t (3.4)
,
Theoretical value of energy needed by load to rise at given temperature was
evaluated by using formula 3.5.
(3.5)
, =
33
=
=
For experiment 1 and 2 the efficiency was evaluated by using formula 3.6
(Improved efficiency) 𝛈
(3.6)
, =
=
Meanwhile, for experiment 3,4,5 and 6 the efficiency was evaluated by using formula
3.7.
Efficiency of prototype , 𝛈=
(3.7)
, =
=
Improved efficiency= - (3.8)
, =
=

34
Energy balance in new prototype (prototype 2) was determined by using
formula 3.8 (A.Chengel & J.Ghafar ,2011). However due to lack of parameters, total
of heat loss caused by convection was not determined.
= + (3.9)
, =
=
=
=
=
Conduction occurs in cooking chamber was determined by using formula 3.9.
)]t (3.10)
, =
=
=
35
Meanwhile, radiation in cooking chamber was determined by using formula 3.10.
= A t (3.11)
, =
=
=
=
=
36
CHAPTER 4
DESIGN
4.1 Overview of the Design
In this project, design process covered in designing the cooking chamber, mirrors,
mirror’s support and main body. All these parts are designed based on factors that
have been review in chapter 2. Besides that, calculation is made to meet the
specification of good solar oven. The stress acting on the bolt used to support mirror
also calculated to make sure the joint is robust to support the weight of mirror.
4.2 Design of Cooking Chamber
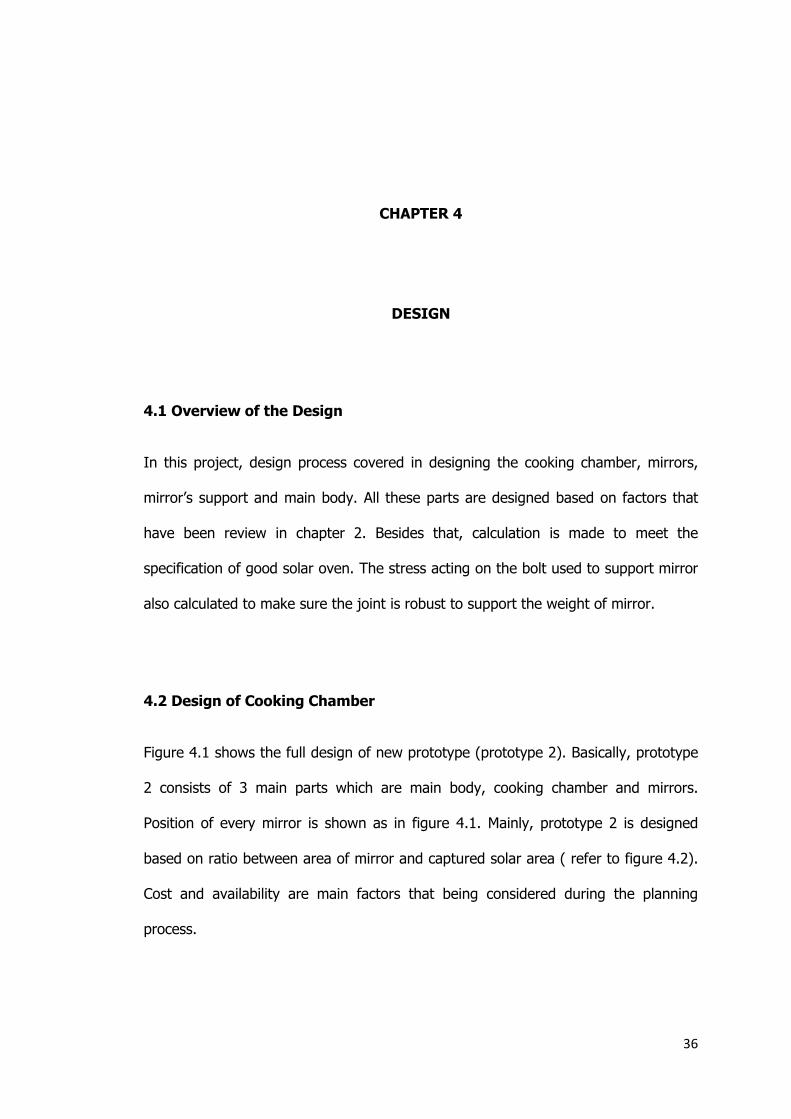
Figure 4.1 shows the full design of new prototype (prototype 2). Basically, prototype
2 consists of 3 main parts which are main body, cooking chamber and mirrors.
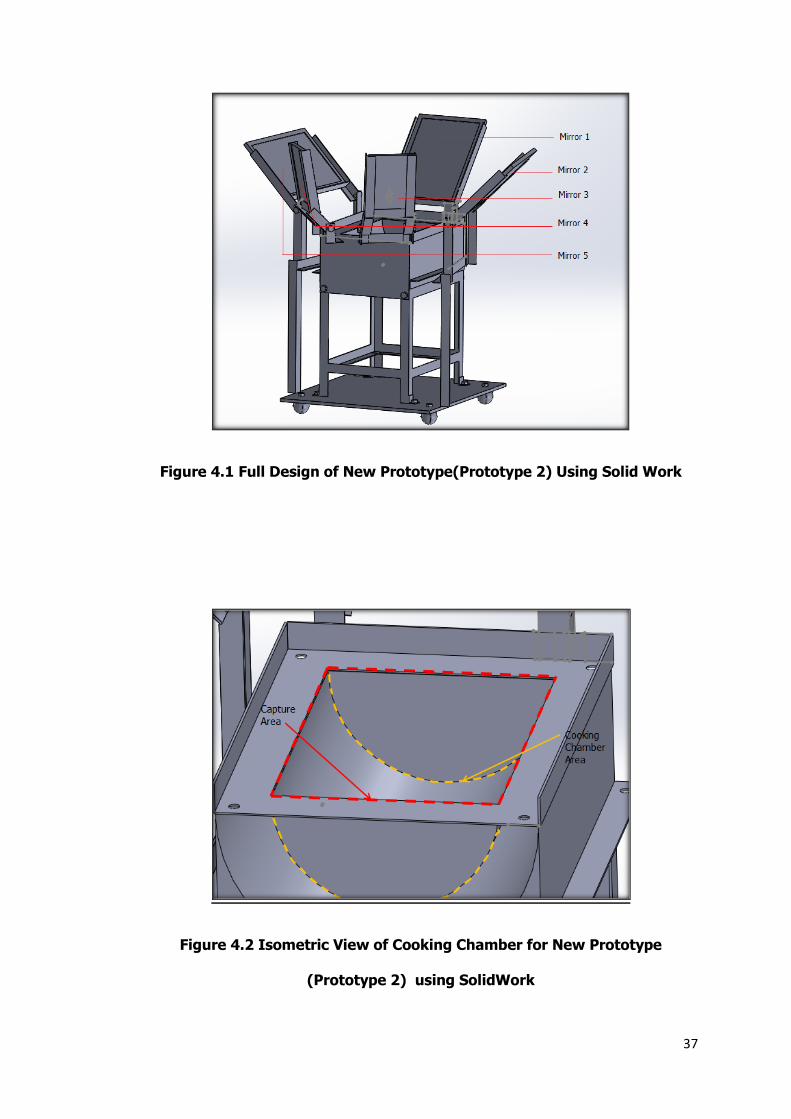
Position of every mirror is shown as in figure 4.1. Mainly, prototype 2 is designed
based on ratio between area of mirror and captured solar area ( refer to figure 4.2).
Cost and availability are main factors that being considered during the planning
process.
37
Figure 4.1 Full Design of New Prototype(Prototype 2) Using Solid Work
Figure 4.2 Isometric View of Cooking Chamber for New Prototype
(Prototype 2) using SolidWork

38
Due to malleable properties of material, aluminum sheet is used to build the cooking
chamber of this cooker. Two layers of aluminum sheet are constructed whereby the
gap between these layers is reserved as a place for insulator (alumina wool).
Dimension of oven is as shown in figure 4.3.Total capture area for new prototype in
figure 4.2 is evaluated by using formula shown in 4.1.
(4.1)
Figure 4.3 Top View of Cooking Chamber for New Prototype (Prototype 2)
using SolidWork
39
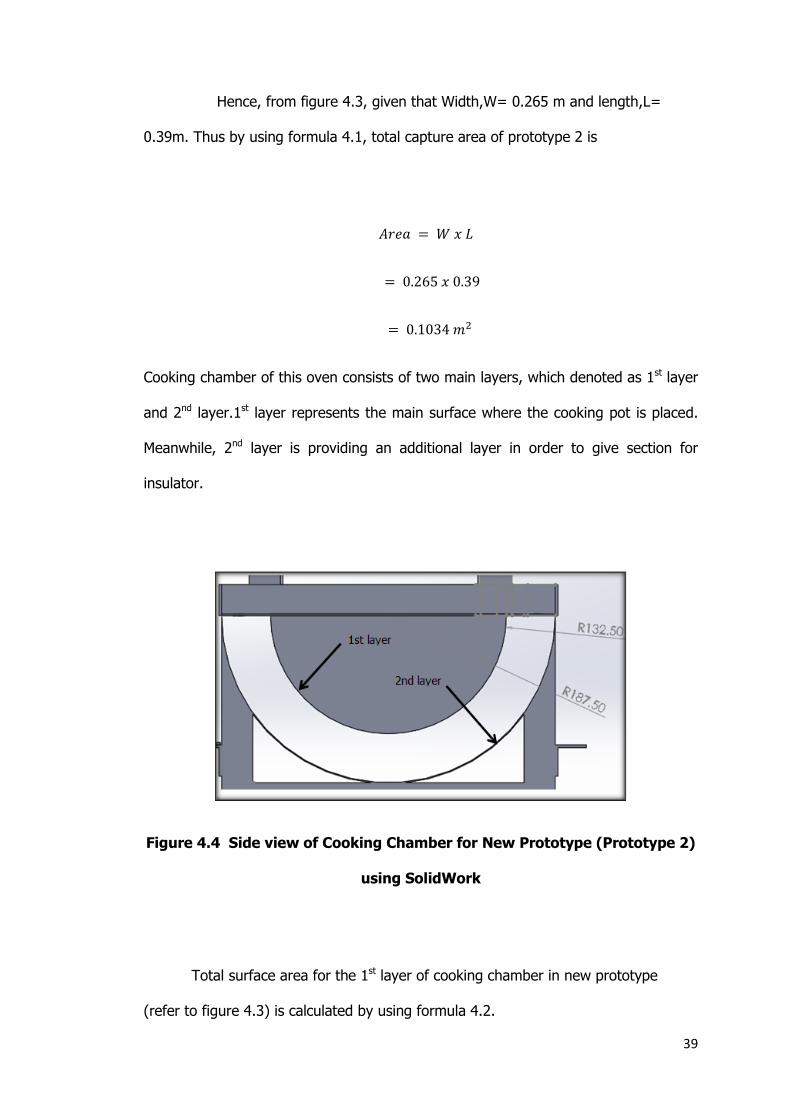
Hence, from figure 4.3, given that Width,W= 0.265 m and length,L=
0.39m. Thus by using formula 4.1, total capture area of prototype 2 is
Cooking chamber of this oven consists of two main layers, which denoted as 1st layer
and 2nd layer.1st layer represents the main surface where the cooking pot is placed.
Meanwhile, 2nd layer is providing an additional layer in order to give section for
insulator.
Figure 4.4 Side view of Cooking Chamber for New Prototype (Prototype 2)
using SolidWork
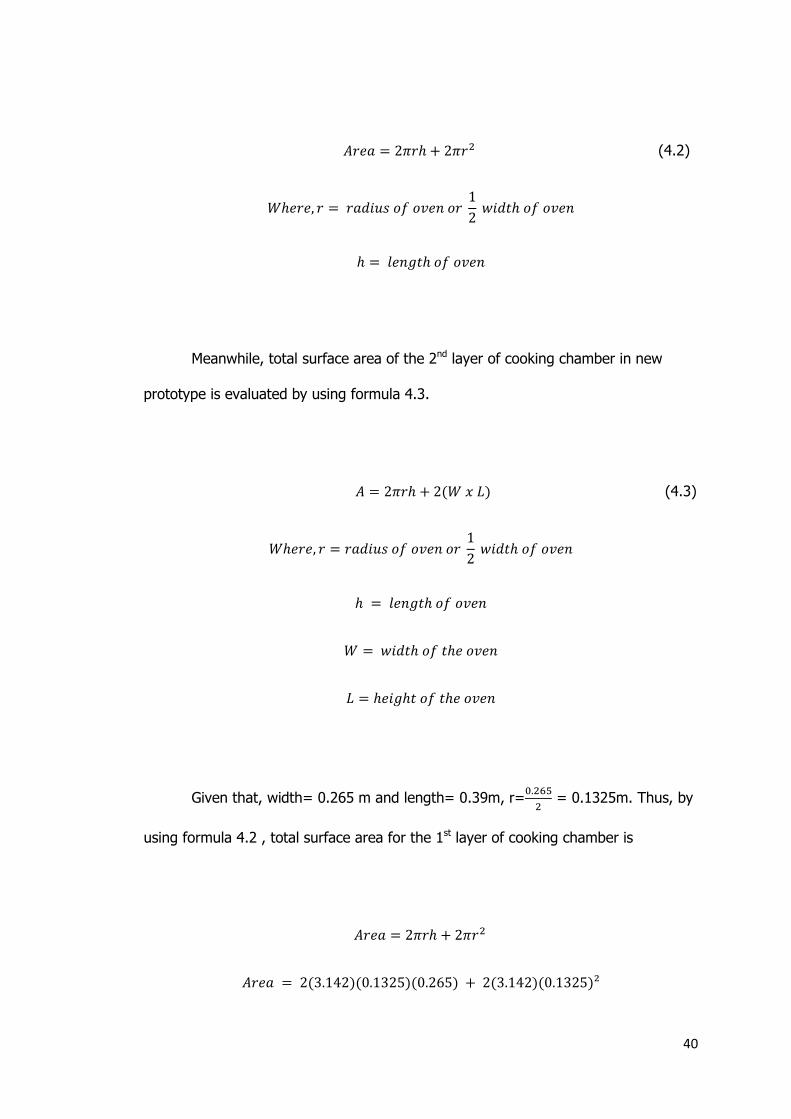
Total surface area for the 1st layer of cooking chamber in new prototype
(refer to figure 4.3) is calculated by using formula 4.2.
40
(4.2)
Meanwhile, total surface area of the 2nd layer of cooking chamber in new
prototype is evaluated by using formula 4.3.
(4.3)
Given that, width= 0.265 m and length= 0.39m, r=
= 0.1325m. Thus, by
using formula 4.2 , total surface area for the 1st layer of cooking chamber is

41
Since the cooking chamber is half of a cylinder, thus
For the 2nd layer, given that, width= 0.375 m and length= 0.5m, r=
=
0.1875m. Thus, by using formula 4.3, total surface area for the 2nd layer of cooking
chamber is
Since the cooking chamber is half of a cylinder, thus
= 0.5891/2
= 0.1655 m²
42
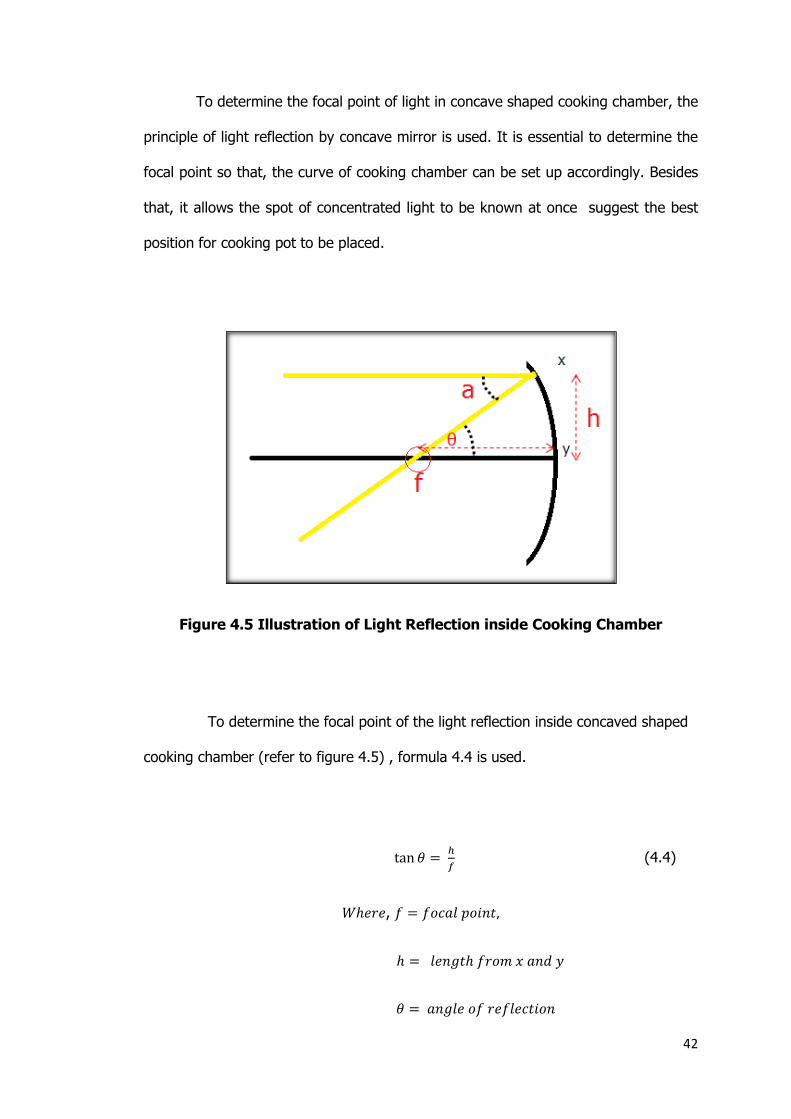
To determine the focal point of light in concave shaped cooking chamber, the
principle of light reflection by concave mirror is used. It is essential to determine the
focal point so that, the curve of cooking chamber can be set up accordingly. Besides
that, it allows the spot of concentrated light to be known at once suggest the best
position for cooking pot to be placed.
Figure 4.5 Illustration of Light Reflection inside Cooking Chamber
To determine the focal point of the light reflection inside concaved shaped
cooking chamber (refer to figure 4.5) , formula 4.4 is used.
(4.4)
,
43
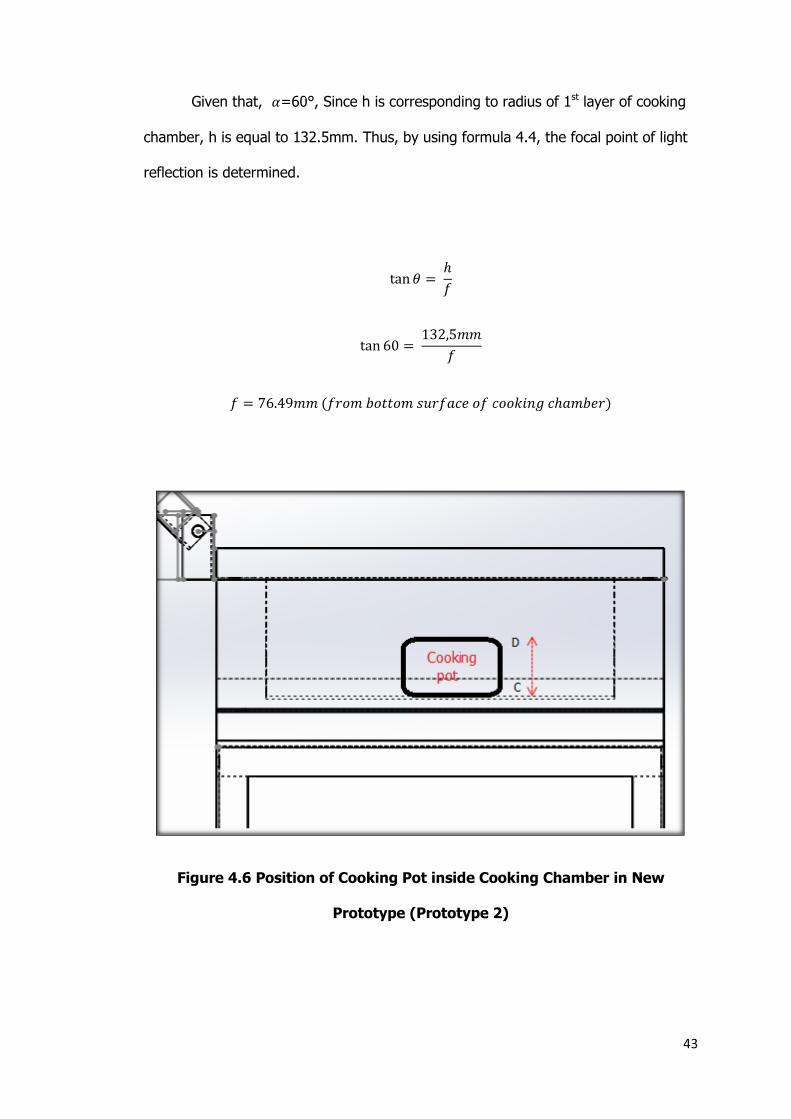
Given that, =60°, Since h is corresponding to radius of 1st layer of cooking
chamber, h is equal to 132.5mm. Thus, by using formula 4.4, the focal point of light
reflection is determined.
Figure 4.6 Position of Cooking Pot inside Cooking Chamber in New
Prototype (Prototype 2)
44
By referring to figure 4.5, height of cooking pot from C to D is 90mm.
From calculation, the focal point of reflected light (60°) lies at distance of 76.49mm
from the surface of cooking chamber, it can be safely assumed that, light that lies on
the surface of concave shaped cooking chamber might be able to be reflected back
onto surface of cooking pot. It is important to maintain the relationship between f, h,
θ and so that ideal solar oven can be designed.
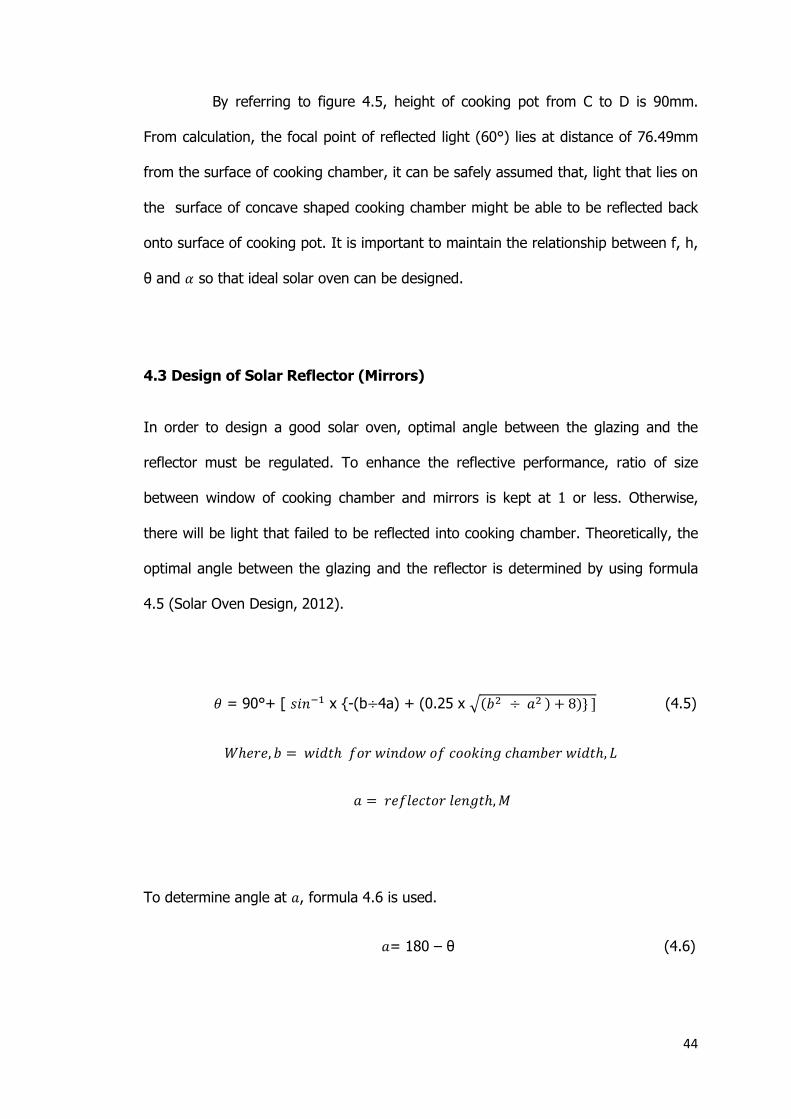
4.3 Design of Solar Reflector (Mirrors)
In order to design a good solar oven, optimal angle between the glazing and the
reflector must be regulated. To enhance the reflective performance, ratio of size
between window of cooking chamber and mirrors is kept at 1 or less. Otherwise,
there will be light that failed to be reflected into cooking chamber. Theoretically, the
optimal angle between the glazing and the reflector is determined by using formula
4.5 (Solar Oven Design, 2012).
= 90°+ [ x {-(b 4a) + (0.25 x √ (4.5)
To determine angle at , formula 4.6 is used.
= 180 – θ (4.6)
45
Hence, at given angle , and width, the optimum height from the top surface
of the oven is determined by using formula 4.7
(4.7)
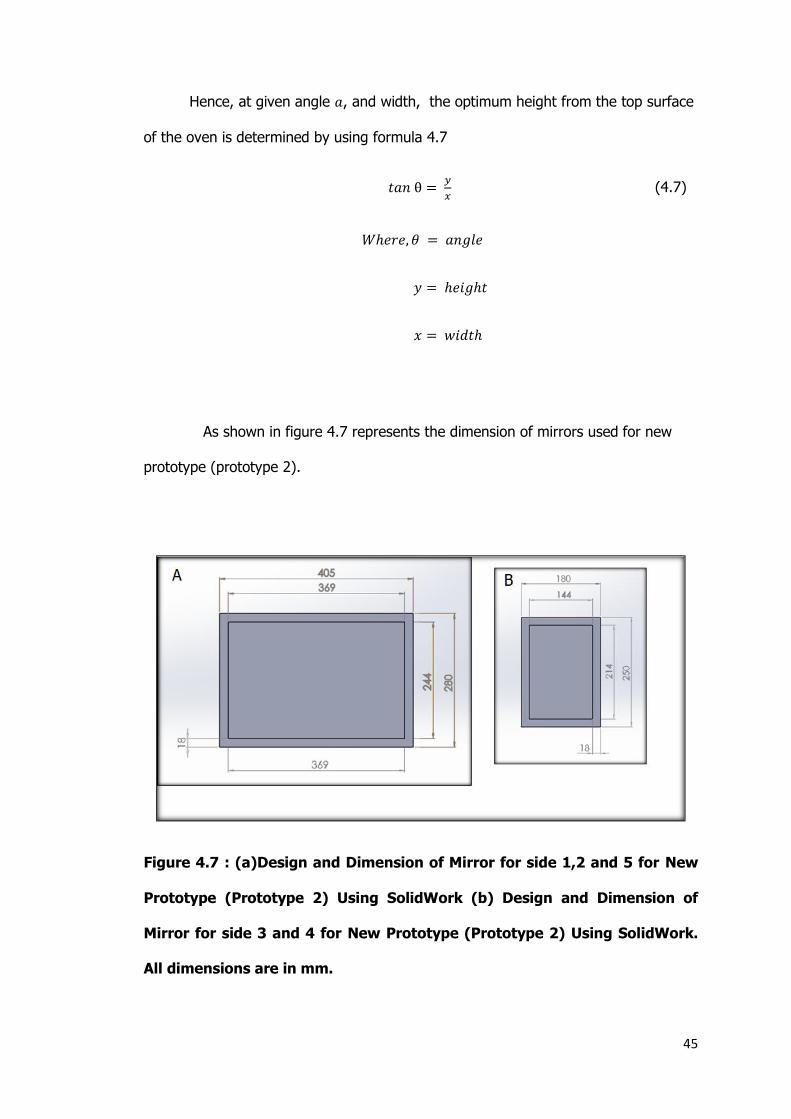
As shown in figure 4.7 represents the dimension of mirrors used for new
prototype (prototype 2).
Figure 4.7 : (a)Design and Dimension of Mirror for side 1,2 and 5 for New
Prototype (Prototype 2) Using SolidWork (b) Design and Dimension of
Mirror for side 3 and 4 for New Prototype (Prototype 2) Using SolidWork.
All dimensions are in mm.
46
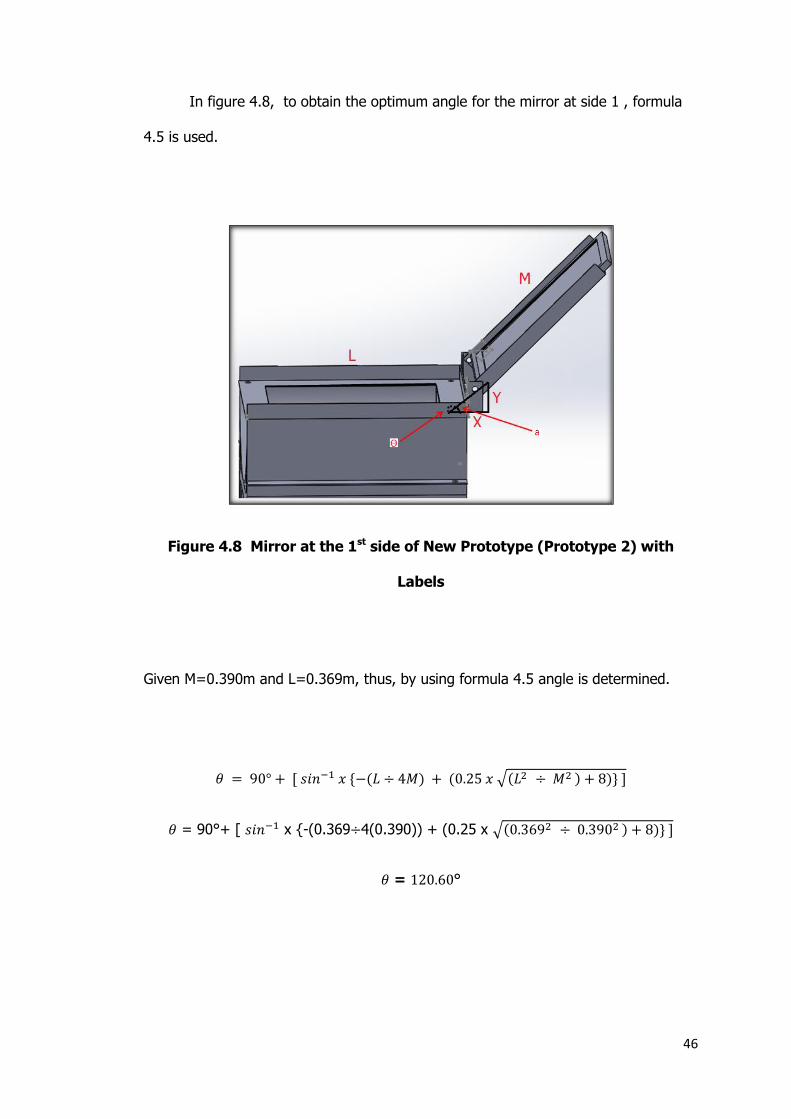
In figure 4.8, to obtain the optimum angle for the mirror at side 1 , formula
4.5 is used.
Figure 4.8 Mirror at the 1st side of New Prototype (Prototype 2) with
Labels
Given M=0.390m and L=0.369m, thus, by using formula 4.5 angle is determined.
√
= 90°+ [ x {-(0.369 4(0.390)) + (0.25 x √
= °
47
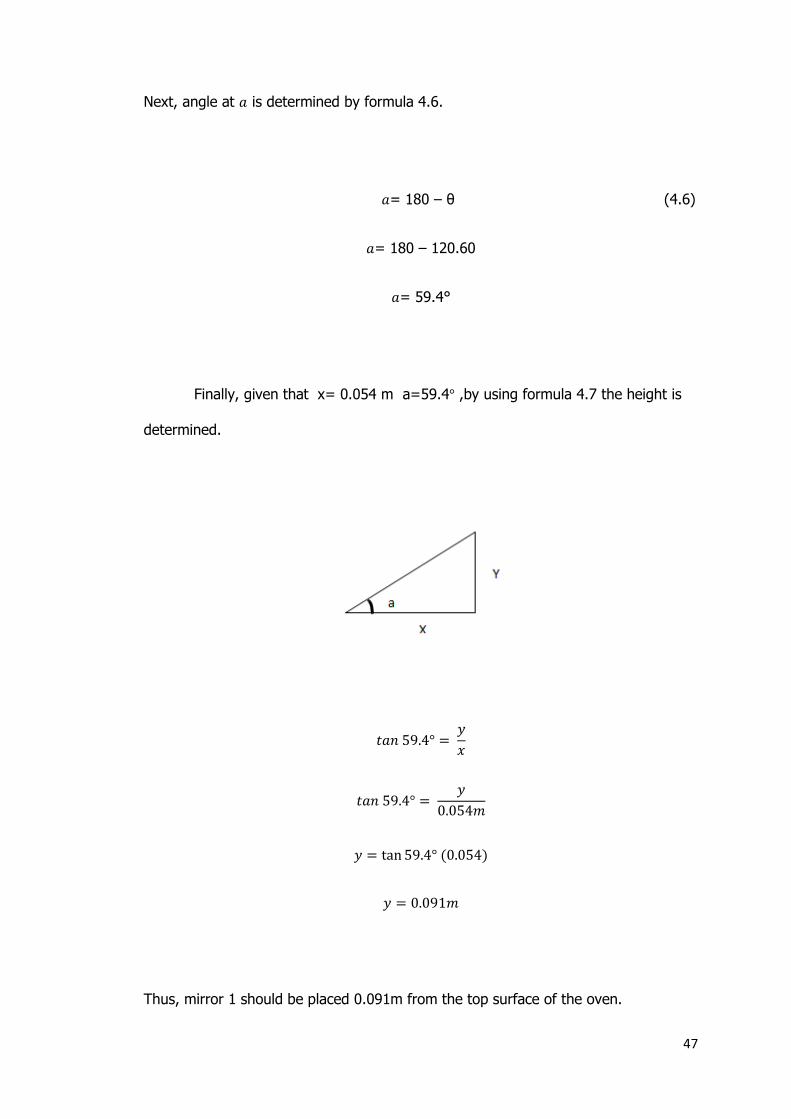
Next, angle at is determined by formula 4.6.
= 180 – θ (4.6)
= 180 – 120.60
= 59.4°
Finally, given that x= 0.054 m a=59.4 ,by using formula 4.7 the height is
determined.
Thus, mirror 1 should be placed 0.091m from the top surface of the oven.

48
In figure 4.9, to obtain the optimum angle for the mirror at side 2 and 5 ,
formula 4.5 is used.
Figure 4.9 Mirror at the 5th Side of New Prototype (Prototype 2) with
Labels
Given M=0.244m and L=0.265m, by using formula 4.5.
√
= 90°+ [ x {-(0.265 4(0.244)) + (0.25 x √
= °

49
Figure 4.10 Illustration of Triangle at the 5th Side of New Prototype
(Prototype 2)
Next, angle at in figure 4.10 is determined by using formula 4.6.
a= 180 – θ
a= 180 – 116.19
a= 63.81

50
Finally, given that x= 0.0128m a=63.1 ,by using formula 4.7 the height is
determined.
Since mirror 2 and 5 are identical to each other, thus, mirror 2 and 5 should be
placed 0.252m from the top surface of the oven.
In figure 4.11, to obtain the optimum angle for the mirror at side 1 , formula
4.5 is used.
51
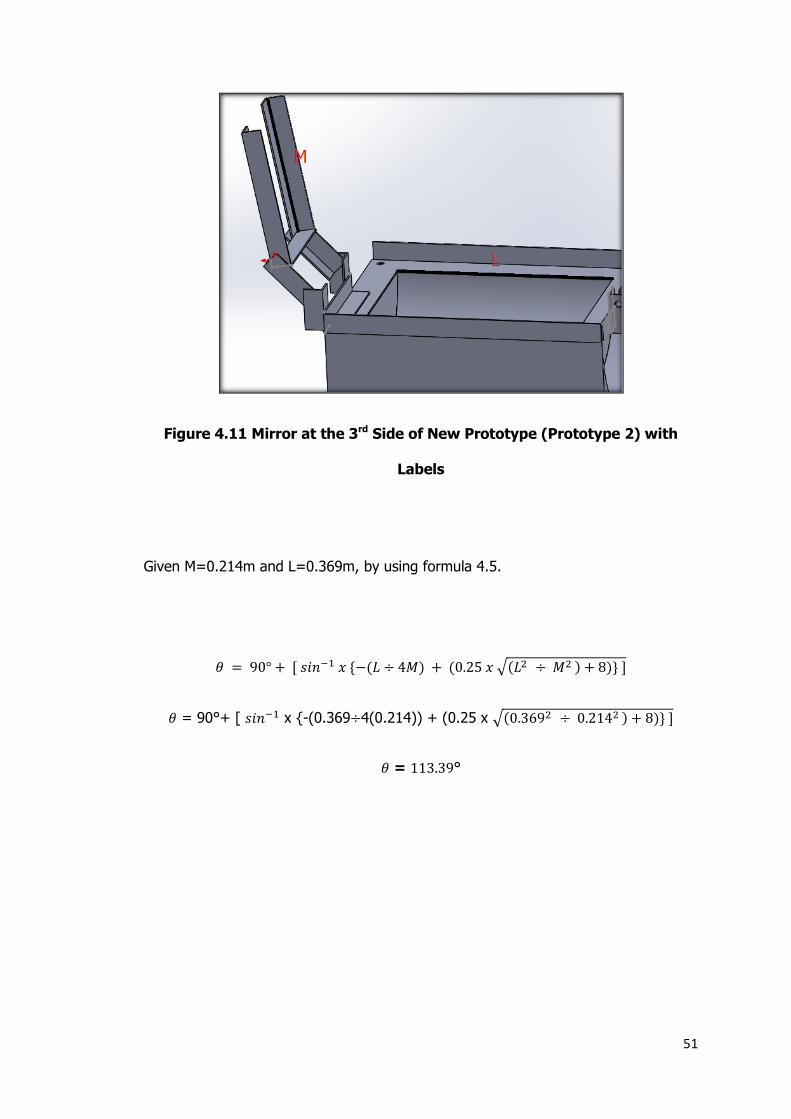
Figure 4.11 Mirror at the 3rd Side of New Prototype (Prototype 2) with
Labels
Given M=0.214m and L=0.369m, by using formula 4.5.
√
= 90°+ [ x {-(0.369 4(0.214)) + (0.25 x √
= °
52
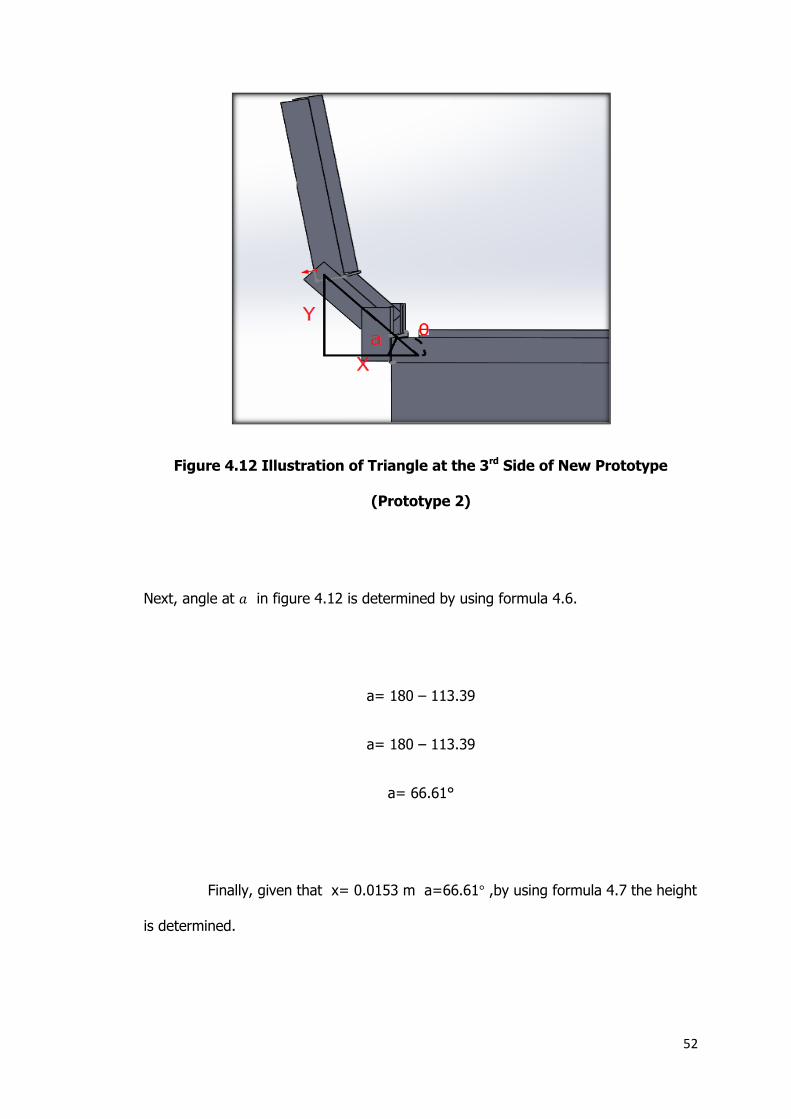
Figure 4.12 Illustration of Triangle at the 3rd Side of New Prototype
(Prototype 2)
Next, angle at in figure 4.12 is determined by using formula 4.6.
a= 180 – 113.39
a= 180 – 113.39
a= 66.61°
Finally, given that x= 0.0153 m a=66.61 ,by using formula 4.7 the height
is determined.

53
Thus, mirror 3 and 4 should be placed 0.035m from the top surface of the oven.
4.4 Structure Analysis of New Prototype (Prototype 2).
In this section, structure analysis is done at bolts joint for all mirrors. Firstly, force
exerted caused by mirror is determined by using formula 4.1
= (4.8)

54
Next, after making assumption, area of each bolts is determined by using
formula 4.2.
=
(4.9)
Where, A= Area
D= Diameter of bolt
After that, shear stress for each bolt is determined by using formula 4.3.
(4.10)
55
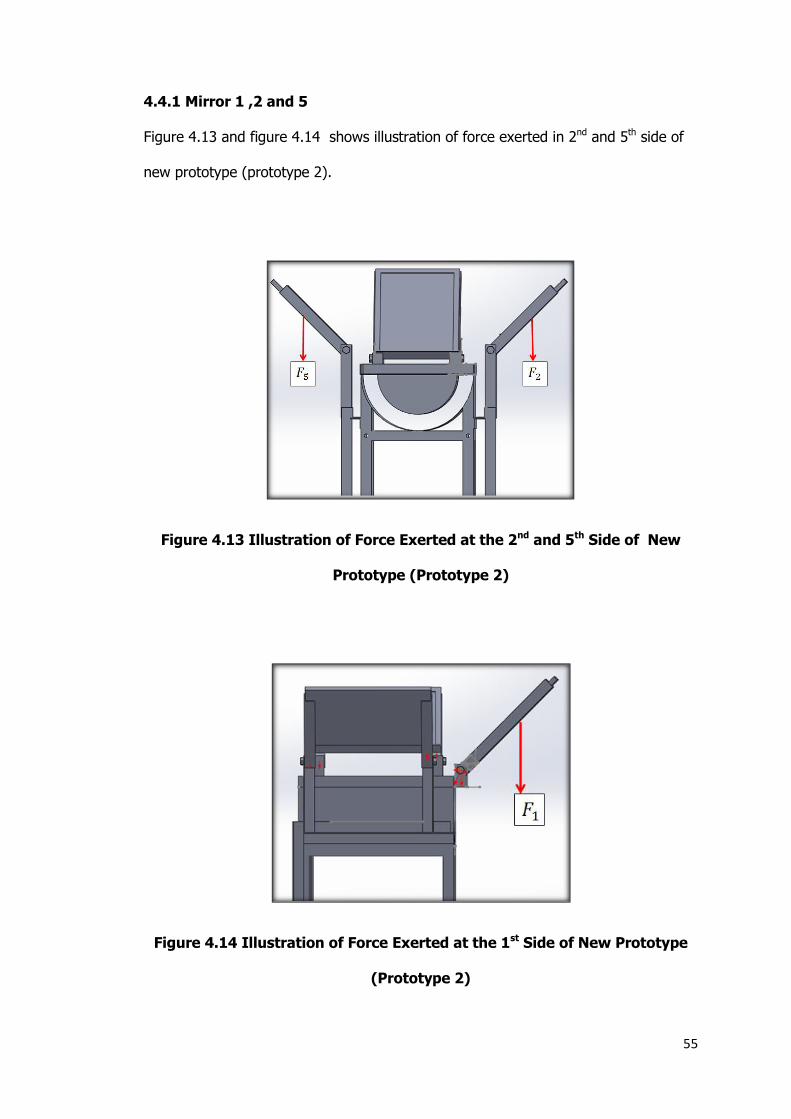
4.4.1 Mirror 1 ,2 and 5
Figure 4.13 and figure 4.14 shows illustration of force exerted in 2nd and 5th side of
new prototype (prototype 2).
Figure 4.13 Illustration of Force Exerted at the 2nd and 5th Side of New
Prototype (Prototype 2)
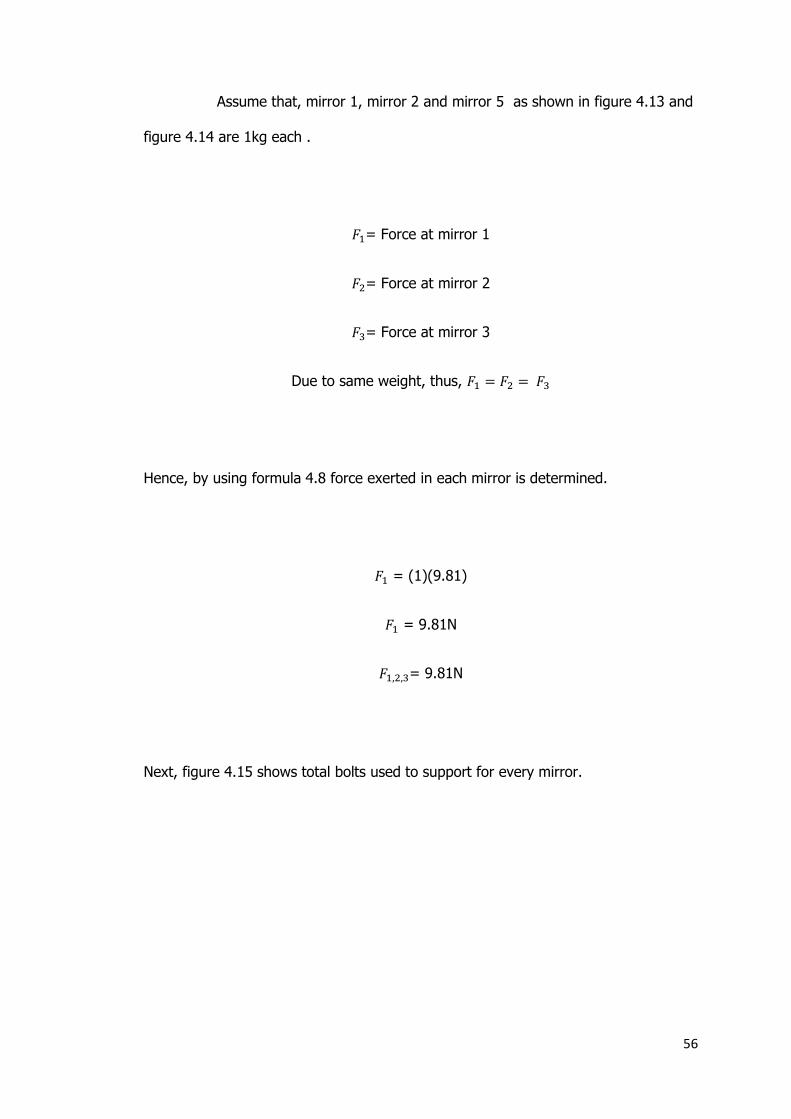
Figure 4.14 Illustration of Force Exerted at the 1st Side of New Prototype
(Prototype 2)
56
Assume that, mirror 1, mirror 2 and mirror 5 as shown in figure 4.13 and
figure 4.14 are 1kg each .
= Force at mirror 1
= Force at mirror 2
= Force at mirror 3
Due to same weight, thus,
Hence, by using formula 4.8 force exerted in each mirror is determined.
= (1)(9.81)
= 9.81N
= 9.81N
Next, figure 4.15 shows total bolts used to support for every mirror.
57
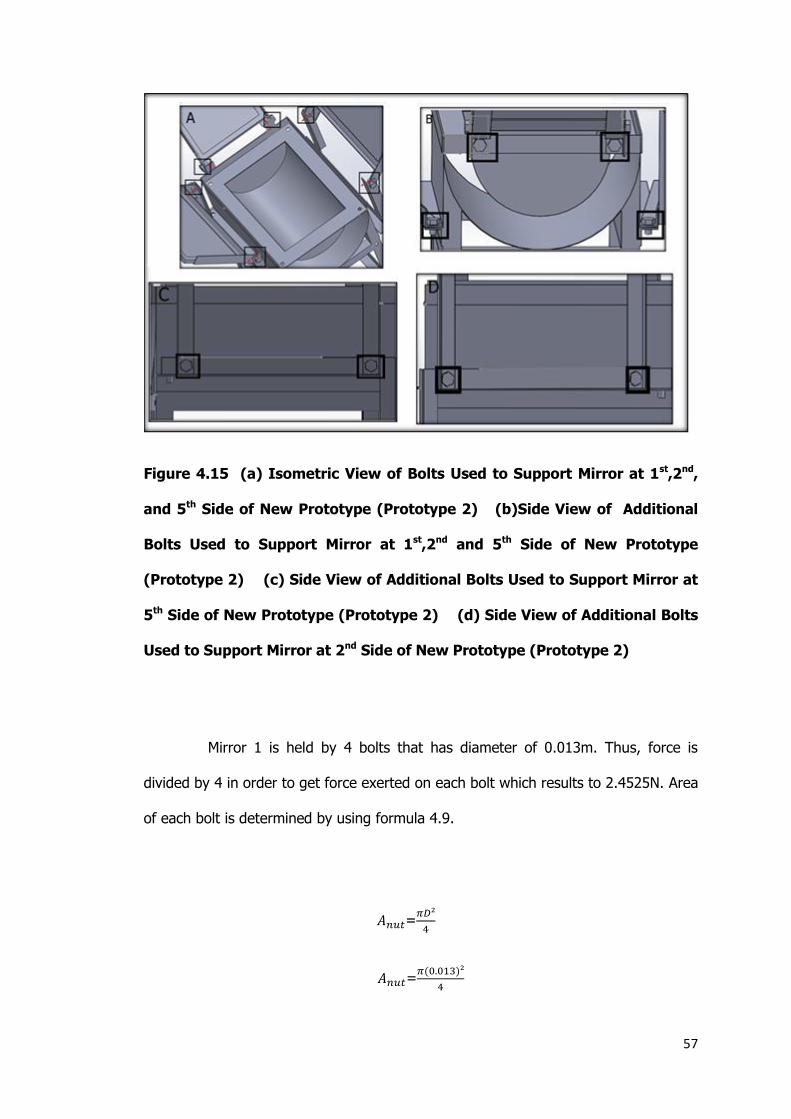
Figure 4.15 (a) Isometric View of Bolts Used to Support Mirror at 1st,2nd,
and 5th Side of New Prototype (Prototype 2) (b)Side View of Additional
Bolts Used to Support Mirror at 1st,2nd and 5th Side of New Prototype
(Prototype 2) (c) Side View of Additional Bolts Used to Support Mirror at
5th Side of New Prototype (Prototype 2) (d) Side View of Additional Bolts
Used to Support Mirror at 2nd Side of New Prototype (Prototype 2)
Mirror 1 is held by 4 bolts that has diameter of 0.013m. Thus, force is
divided by 4 in order to get force exerted on each bolt which results to 2.4525N. Area
of each bolt is determined by using formula 4.9.
=
=
58
= 1.327 x
Hence, by using formula 4.10, shear stress in each bolt is determined.
Thus, each bolt in at mirror 1 is, =
Meanwhile, for mirror 2 and mirror 5 , they are held by 5 bolts that has
diameter of 0.013m. Thus, by using formula 4.10, force is divided by 5 in order to
get force exerted on each bolt which results to 1.962N. Area of each bolt is
determined by using formula 4.9.
=
=
= 1.327 x

59
Hence, by using formula 4.11 shear stress is determined.
Thus, shear stress of each bolt at mirror 2 and mirror 5 is, =
4.4.2 Mirror 3 and 4
Figure 4.16 shows illustration of force exerted in 3th and 4th side of new prototype
(prototype 2).
Figure 4.16 Illustration of Force Exerted at the 3rd and 4th Side of New
Prototype (Prototype 2)

60
Assume that, mirror 3 and mirror 4 are 0.5kg each .
= Force at mirror 3
= Force at mirror 4
Due to same weight, thus,
Hence, by using formula 4.8 force exerted in each mirror is determined.
= mg
= (0.5kg)(9.81)
= 4.905 N
= 4.905 N
61
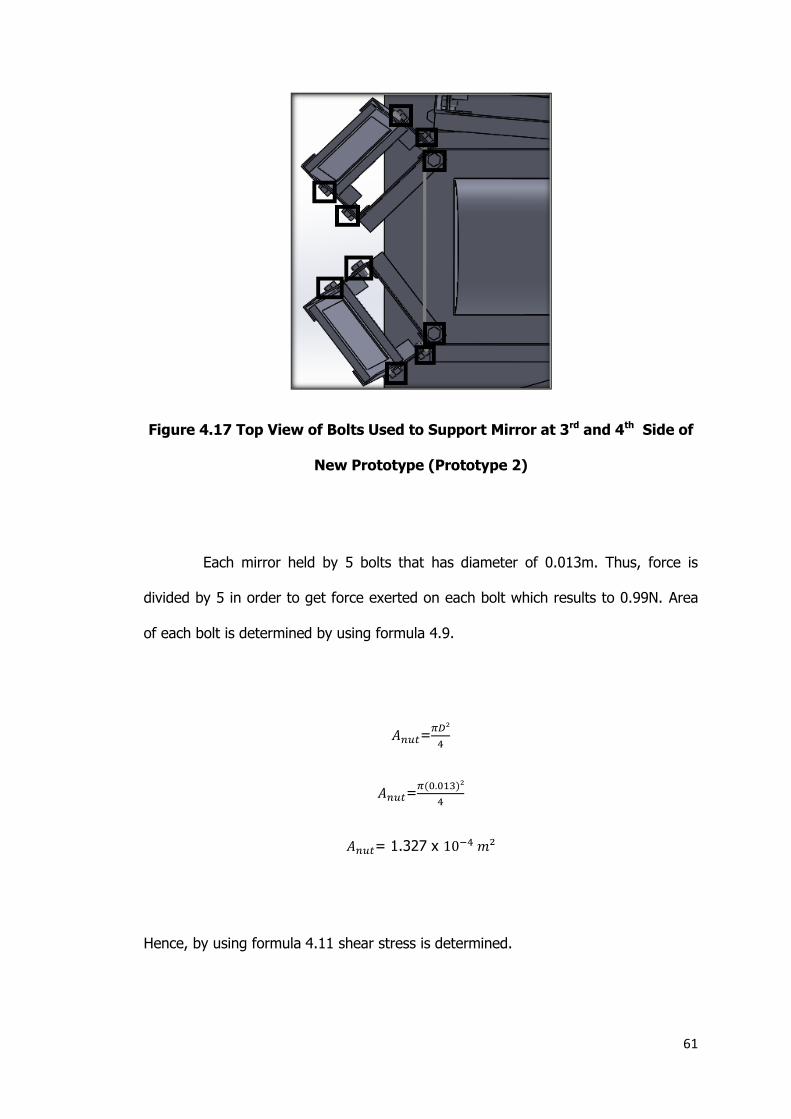
Figure 4.17 Top View of Bolts Used to Support Mirror at 3rd and 4th Side of
New Prototype (Prototype 2)
Each mirror held by 5 bolts that has diameter of 0.013m. Thus, force is
divided by 5 in order to get force exerted on each bolt which results to 0.99N. Area
of each bolt is determined by using formula 4.9.
=
=
= 1.327 x
Hence, by using formula 4.11 shear stress is determined.
62
Thus, shear stress of each bolt at mirror 3 and mirror 4 is, =
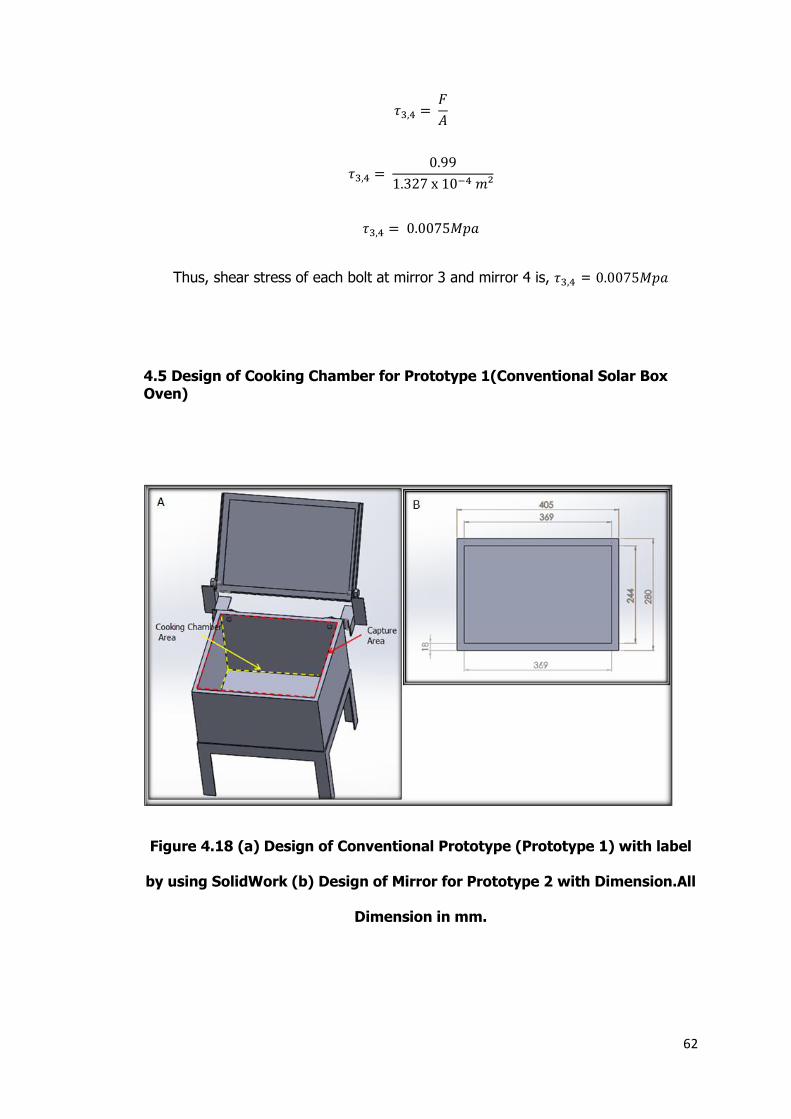
4.5 Design of Cooking Chamber for Prototype 1(Conventional Solar Box Oven)
Figure 4.18 (a) Design of Conventional Prototype (Prototype 1) with label
by using SolidWork (b) Design of Mirror for Prototype 2 with Dimension.All
Dimension in mm.
63
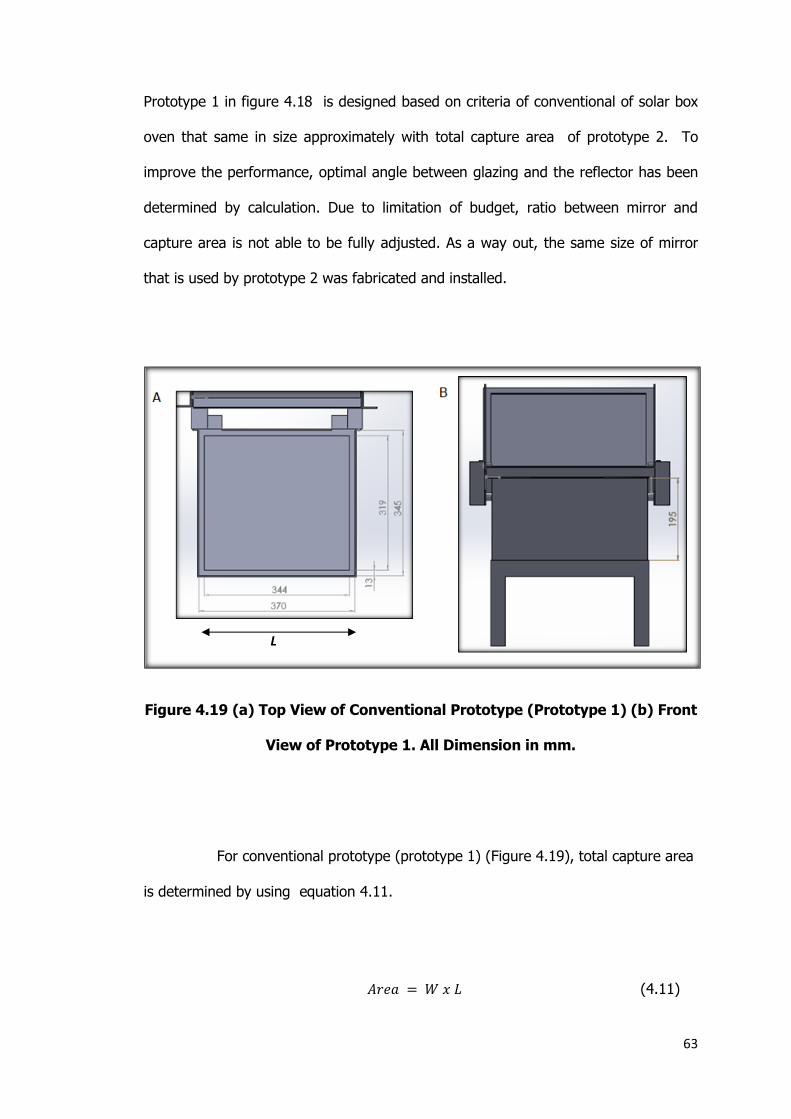
Prototype 1 in figure 4.18 is designed based on criteria of conventional of solar box
oven that same in size approximately with total capture area of prototype 2. To
improve the performance, optimal angle between glazing and the reflector has been
determined by calculation. Due to limitation of budget, ratio between mirror and
capture area is not able to be fully adjusted. As a way out, the same size of mirror
that is used by prototype 2 was fabricated and installed.
Figure 4.19 (a) Top View of Conventional Prototype (Prototype 1) (b) Front
View of Prototype 1. All Dimension in mm.
For conventional prototype (prototype 1) (Figure 4.19), total capture area
is determined by using equation 4.11.
(4.11)
L
64
Given, Width= 0.319 m and length= 0.344m,by using formula 4.11 total
capture area of conventional prototype (prototype 1) is determined .
Area
Area
65
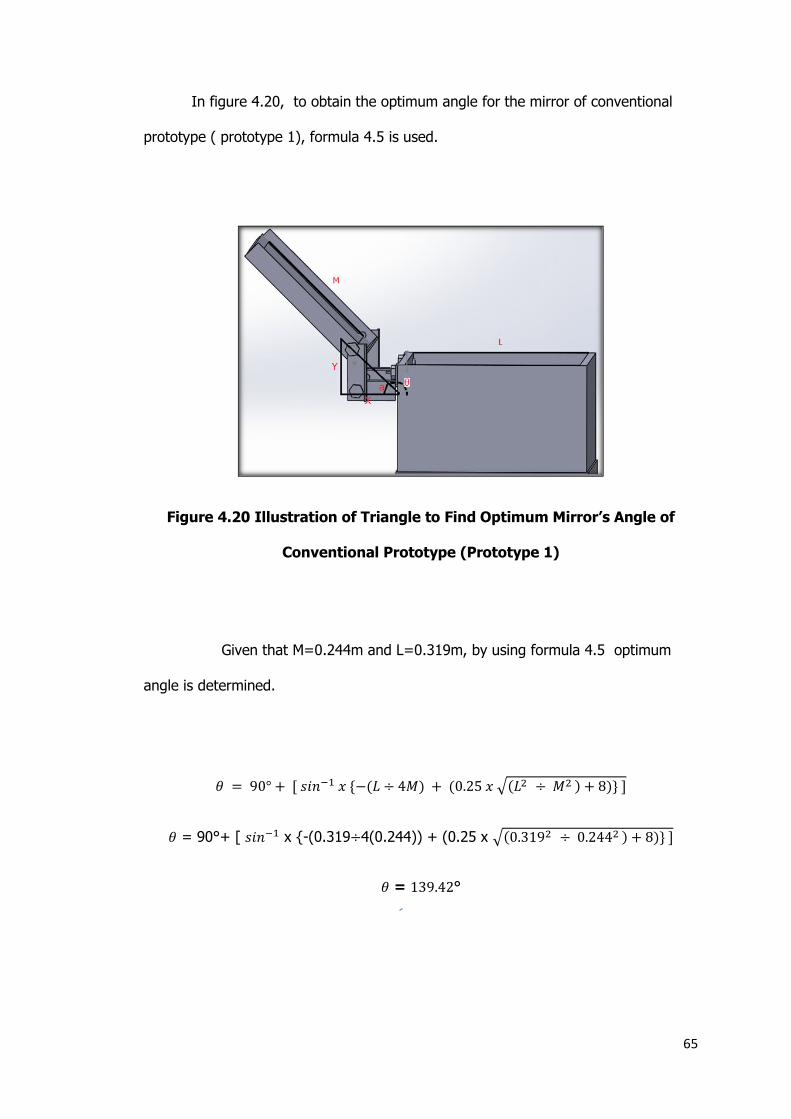
In figure 4.20, to obtain the optimum angle for the mirror of conventional
prototype ( prototype 1), formula 4.5 is used.
Figure 4.20 Illustration of Triangle to Find Optimum Mirror’s Angle of
Conventional Prototype (Prototype 1)
Given that M=0.244m and L=0.319m, by using formula 4.5 optimum
angle is determined.
√
= 90°+ [ x {-(0.319 4(0.244)) + (0.25 x √
= °
66
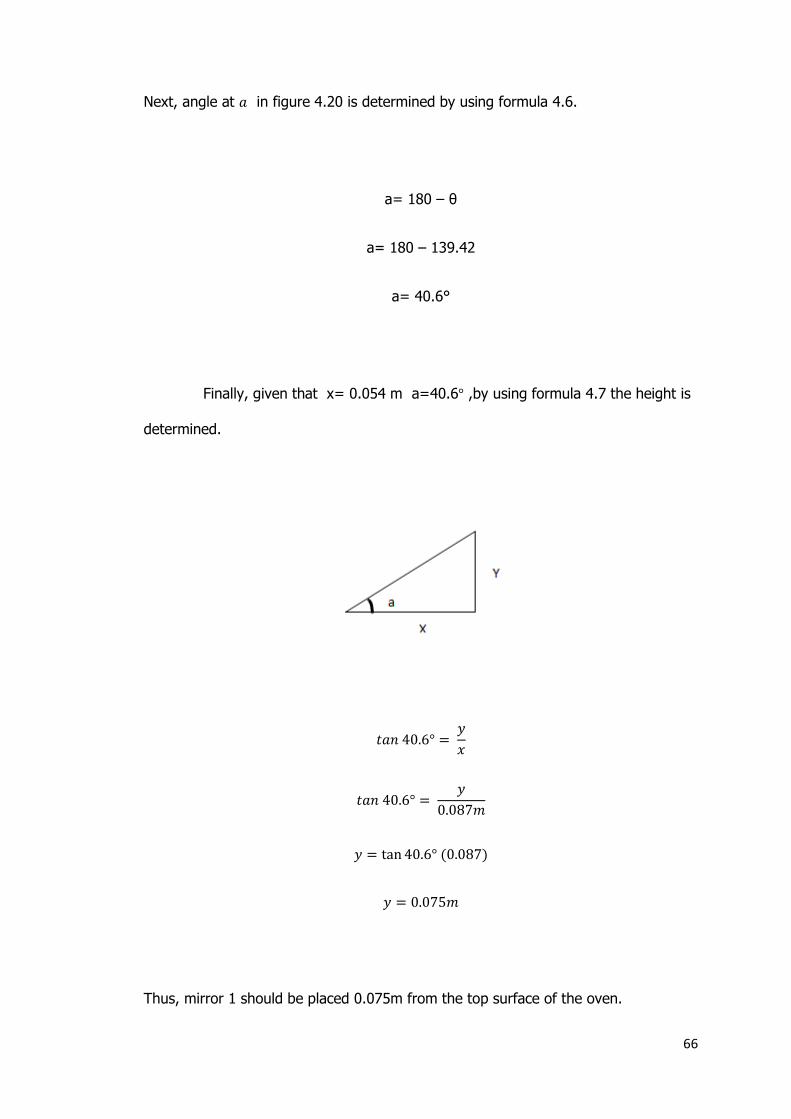
Next, angle at in figure 4.20 is determined by using formula 4.6.
a= 180 – θ
a= 180 – 139.42
a= 40.6°
Finally, given that x= 0.054 m a=40.6 ,by using formula 4.7 the height is
determined.
Thus, mirror 1 should be placed 0.075m from the top surface of the oven.
67
4.5.1 Structure Analysis of Prototype 1
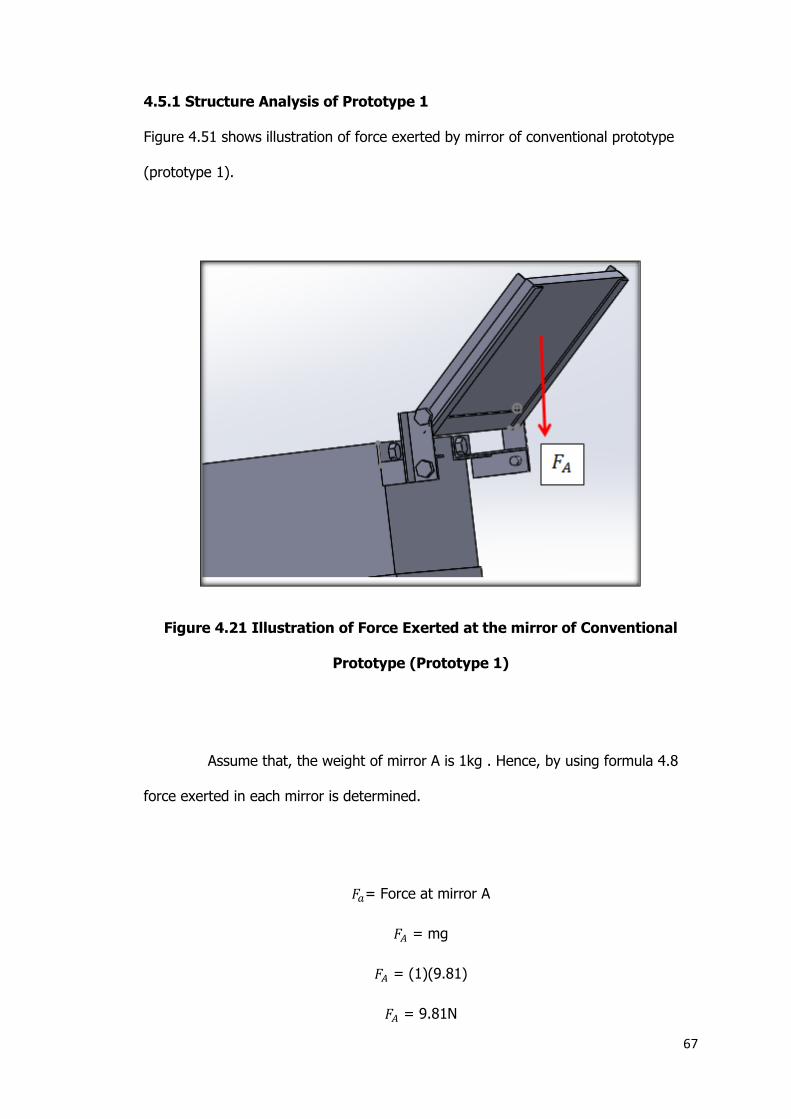
Figure 4.51 shows illustration of force exerted by mirror of conventional prototype
(prototype 1).
Figure 4.21 Illustration of Force Exerted at the mirror of Conventional
Prototype (Prototype 1)
Assume that, the weight of mirror A is 1kg . Hence, by using formula 4.8
force exerted in each mirror is determined.
= Force at mirror A
= mg
= (1)(9.81)
= 9.81N

68
Figure 4.22 Bolts Used to Support Mirror of Conventional Prototype
(Prototype 1)
Mirror A is held by 6 bolts that has diameter of 0.013m. Thus, force is
divided by 4 in order to get force exerted on each bolt which results to 1.635N.Area
of each bolt is determined by using formula 4.9.
=
=
= 1.327 x
Hence, by using formula 4.11 shear stress is determined.

69
Thus, shear stress of each bolt at mirror A is, =
70
CHAPTER 5
RESULT AND DISCUSSION
5.1 Analysis of Results
In this section, design and result obtained will be discussed. Sets of data obtained
during the experiment have been used to analyze and determine the efficiency of
solar oven. Both data gained from prototype I and II are tabulated and graphs are
plotted. Results are wrapped up based on consideration of all factors that affecting
the performance of cooking.
5.2 Design and Prototype
This section covers on the material and design result. Further discussion is made for
new prototype (prototype 2).
5.2.1Material
During fabrication process, materials to construct both prototypes were selected
based on various factor like availability, cost and so on. Due to limitation of budget, it
is important to choose material that is low in cost but able to fulfill the desired
requirement.

71
5.2.1.1 Main Body
Main body of prototype 2 shown in figure 5.1 was constructed by the slotted angle
bar in order to ease the process of construction. By means of bolt and nuts,
measured slotted angle bar were joint together and prototype able to be built.
Figure 5.1 Frame of Prototype 2
5.2.1.2 Cooking Chamber
As shown in figure 5.2, to construct the cooking chamber, aluminum sheet has been
used due to properties of this material which is lighter and reflective. Besides that,
the material of aluminum which is malleable has made the shaping process become
easier. Special glue was being used to keep the aluminum sheet in shape.

72
Figure 5.2 Cooking Chamber for Prototype 2
5.2.1.3Reflector
As shown in figure 5.3, mirrors were used as mean to reflect the sunlight towards
cooking chamber. 5 mirrors were used to equip every side of this prototype. All
mirrors were fabricated according to the proposed design.
Figure 5.3 Mirrors Used for Prototype 2
73
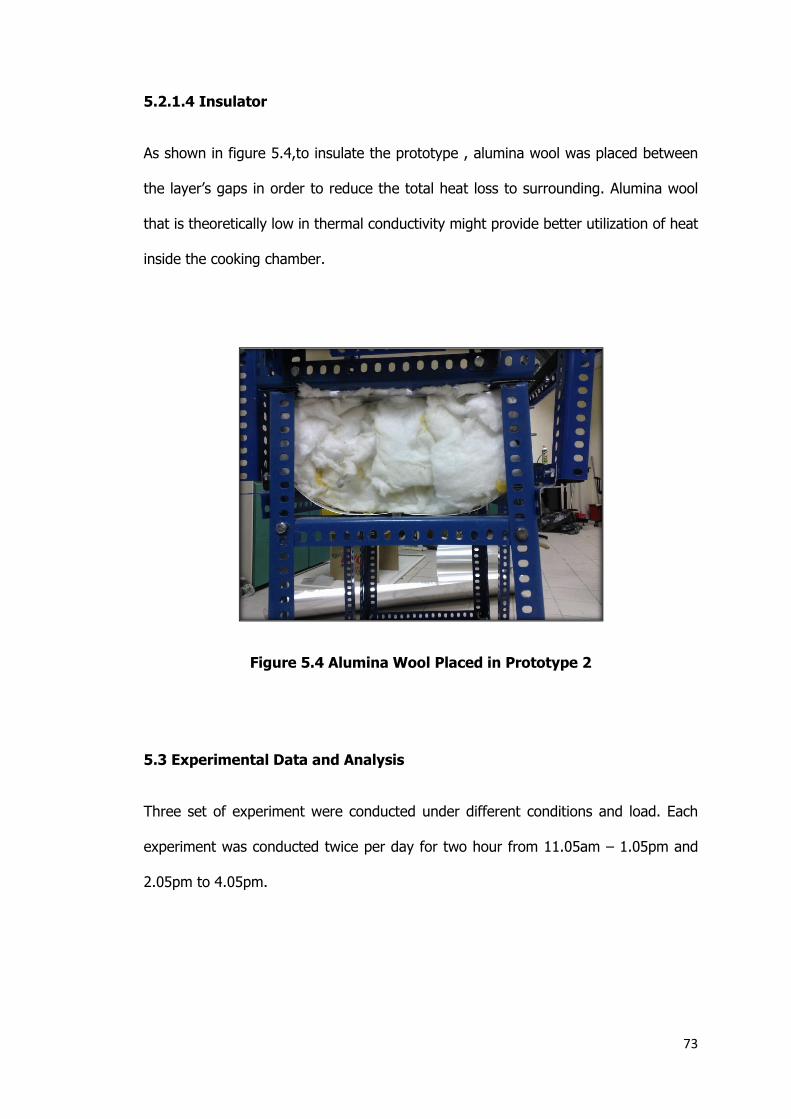
5.2.1.4 Insulator
As shown in figure 5.4,to insulate the prototype , alumina wool was placed between
the layer’s gaps in order to reduce the total heat loss to surrounding. Alumina wool
that is theoretically low in thermal conductivity might provide better utilization of heat
inside the cooking chamber.
Figure 5.4 Alumina Wool Placed in Prototype 2
5.3 Experimental Data and Analysis
Three set of experiment were conducted under different conditions and load. Each
experiment was conducted twice per day for two hour from 11.05am – 1.05pm and
2.05pm to 4.05pm.

74
Table 5.1 Parameters and Condition for all 6 experiments
Table 5.1 shows parameters and condition used for all 6 experiments for
this research. Basically all experiments are set up exactly as shown in figure 5.5.
Figure 5.5 Conventional Prototype (Prototype 1) and New Prototype
(Prototype 2) During Experiment
Experiment Sample Ambient
temperature
Humidity Wind
speed
Cloud
cover
Time
1 No load 38.0° C 66% 5km/h 60% 11.05 AM
2 No load 32.8° C 63% 6km/h 75% 2.05 PM
3 250ml of
water
33.8° C 60% 6km/h 66% 11.05 AM
4 250ml of
water
32.8° C 69% 9km/h 73% 2.05 PM
5 250ml of oil 31.2° C 66% 6km/h 66% 11.05 AM
6 250ml of oil 33.7° C 55% 7km/h 75% 2.05 PM
75
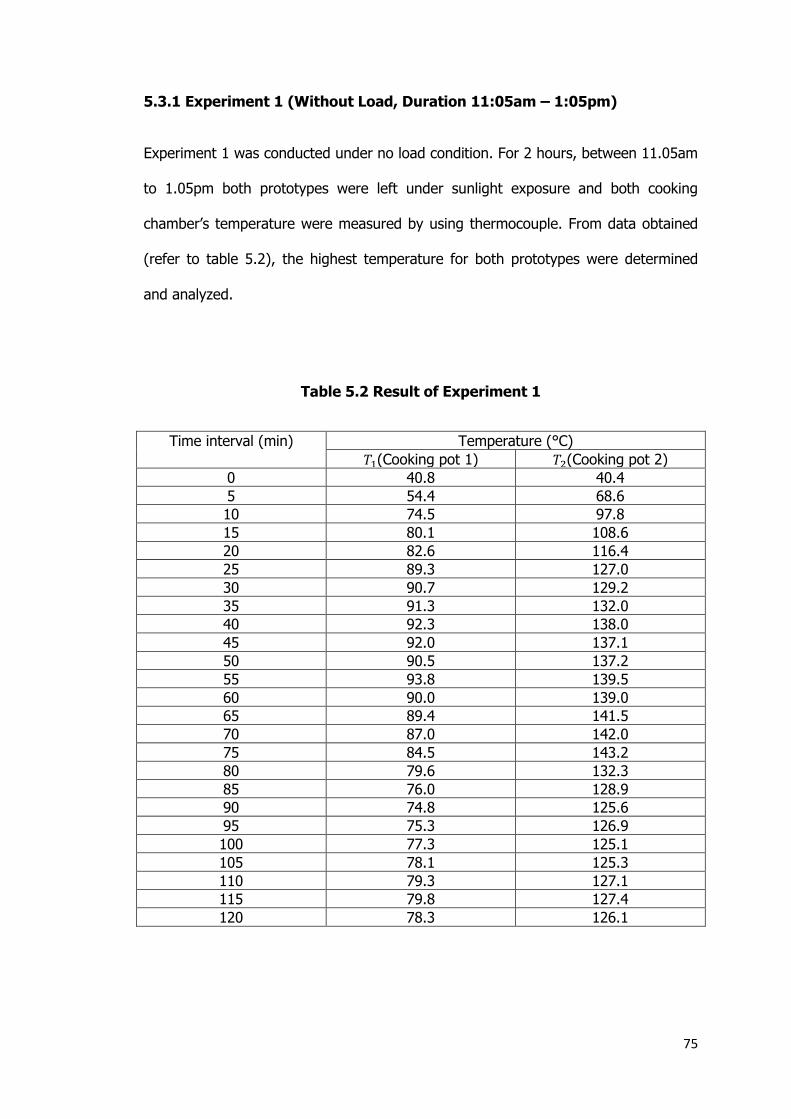
5.3.1 Experiment 1 (Without Load, Duration 11:05am – 1:05pm)
Experiment 1 was conducted under no load condition. For 2 hours, between 11.05am
to 1.05pm both prototypes were left under sunlight exposure and both cooking
chamber’s temperature were measured by using thermocouple. From data obtained
(refer to table 5.2), the highest temperature for both prototypes were determined
and analyzed.
Table 5.2 Result of Experiment 1
Time interval (min) Temperature (°C)
(Cooking pot 1) (Cooking pot 2)
0 40.8 40.4
5 54.4 68.6
10 74.5 97.8
15 80.1 108.6
20 82.6 116.4
25 89.3 127.0
30 90.7 129.2
35 91.3 132.0
40 92.3 138.0
45 92.0 137.1
50 90.5 137.2
55 93.8 139.5
60 90.0 139.0
65 89.4 141.5
70 87.0 142.0
75 84.5 143.2
80 79.6 132.3
85 76.0 128.9
90 74.8 125.6
95 75.3 126.9
100 77.3 125.1
105 78.1 125.3
110 79.3 127.1
115 79.8 127.4
120 78.3 126.1

76
Figure 5.6 Graph of Temperature for Conventional Prototype (Prototype 1)
and New Prototype (Prototype 2) in Experiment 1
Graph in figure 5.6 shows tabulation of data between temperature for both
prototype 1 and 2 under no load condition. During the experiment, temperature of
both cooking chamber was measured. Under sunlight exposure, the highest
temperature gained by prototype 1 and 2 was 93.8°C and 143.2°C respectively. At
the beginning of the experiment, both prototypes’ temperature increased
continuously with their respective time. As they reached the peak temperature, both
systems became thermally equilibrium. After that, temperature became averagely
constant and reduced. The decreasing and increasing in temperature is probably
caused by unsteady weather. Under no load condition, the highest temperature
observed in prototype 2 was 143.2°C which was achieved within 75minutes.
Prototype 1 was not able to reach 100°C; however, the highest temperature
recorded was 93.8°C. From calculation (refer to appendix C), efficiency in term of
improved temperature made by prototype 2 over prototype 1 is 34.49%.
93.8
143.2
0
20
40
60
80
100
120
140
160
0 51
01
52
02
53
03
54
04
55
05
56
06
57
07
58
08
59
09
51
00
10
51
10
11
51
20
Tem
pe
ratu
re
Time
Graph of temprature vs time
Prototype 1
Prototype 2

77
5.3.2 Experiment 2 (Without Load, Duration 2:05pm – 4.05pm)
For experiment 2, the experimental method was conducted based on what had been
done during experiment 1. Experiment 2 was conducted from 2.05pm to 4.05pm, the
same day as experiment 1 .
Table 5.3 Result of Experiment 2
Time interval (min) Temperature (°C)
(Cooking pot 1) (Cooking pot 2)
0 40.4 40.8
5 63.6 73.5
10 75.5 89.9
15 80.7 100.7
20 80.2 106.2
25 81.0 112.2
30 82.0 115.7
35 84.7 119.0
40 88.0 119.7
45 91.0 120.7
50 88.2 125.5
55 89.2 127.0
60 88.4 123.0
65 83.8 121.1
70 82.5 120.8
75 80.9 117.8
80 81.2 119.6
85 80.0 117.4
90 76.8 115.7
95 75.6 114.5
100 74.3 113.6
105 78.9 116.7
110 79.2 116.9
115 81.0 118.4
120 82.0 121.1
78
Figure 5.7 Graph of Temperature for Conventional Prototype (Prototype 1)
and New Prototype (Prototype 2) in Experiment 2
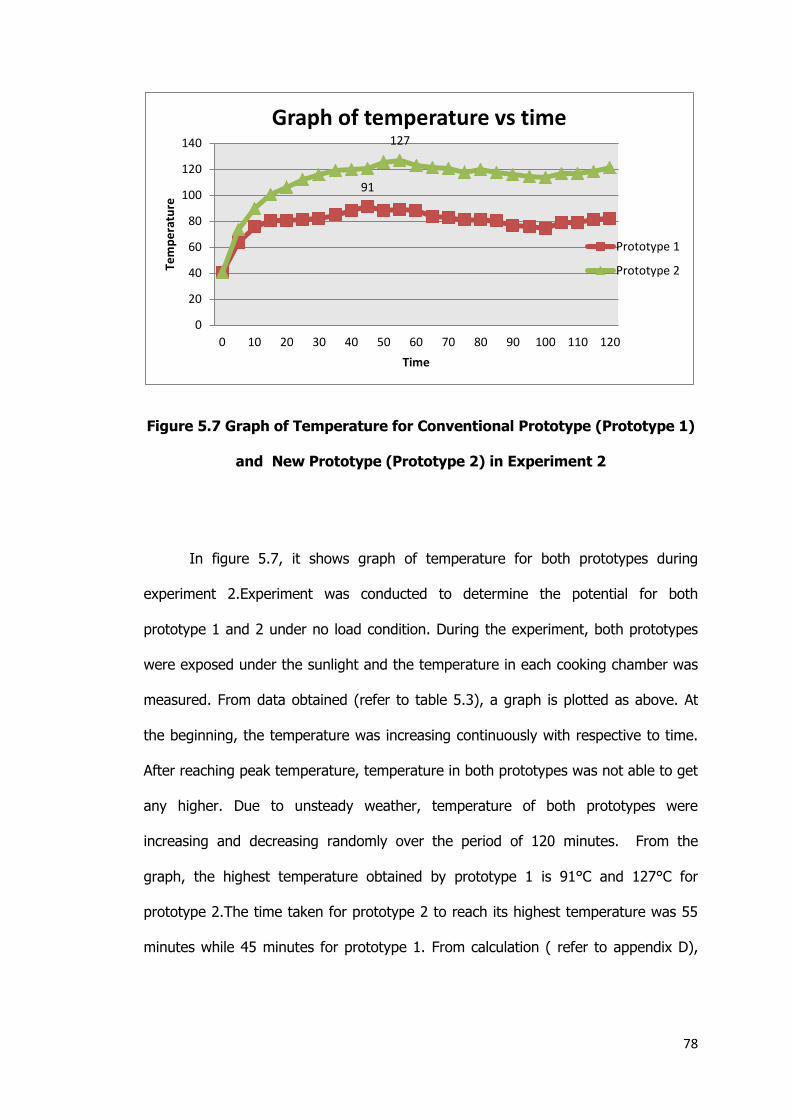
In figure 5.7, it shows graph of temperature for both prototypes during
experiment 2.Experiment was conducted to determine the potential for both
prototype 1 and 2 under no load condition. During the experiment, both prototypes
were exposed under the sunlight and the temperature in each cooking chamber was
measured. From data obtained (refer to table 5.3), a graph is plotted as above. At
the beginning, the temperature was increasing continuously with respective to time.
After reaching peak temperature, temperature in both prototypes was not able to get
any higher. Due to unsteady weather, temperature of both prototypes were
increasing and decreasing randomly over the period of 120 minutes. From the
graph, the highest temperature obtained by prototype 1 is 91°C and 127°C for
prototype 2.The time taken for prototype 2 to reach its highest temperature was 55
minutes while 45 minutes for prototype 1. From calculation ( refer to appendix D),
91
127
0
20
40
60
80
100
120
140
0 10 20 30 40 50 60 70 80 90 100 110 120
Tem
pe
ratu
re
Time
Graph of temperature vs time
Prototype 1
Prototype 2
79
efficiency in term of improved temperature made by prototype 2 over prototype 1 is
28.35%.
5.3.3 Experiment 3 (Water as Load, Duration 11:05am – 13:05pm)
Experiment 3 was conducted to test the performance of prototype 2 and 1 under
load of 250ml water. During the experiment, water was selected in order to see the
prototype’s capability to boil the water. Experiment 3 was carried out within 2hours
between 11.05am to 1.05pm.
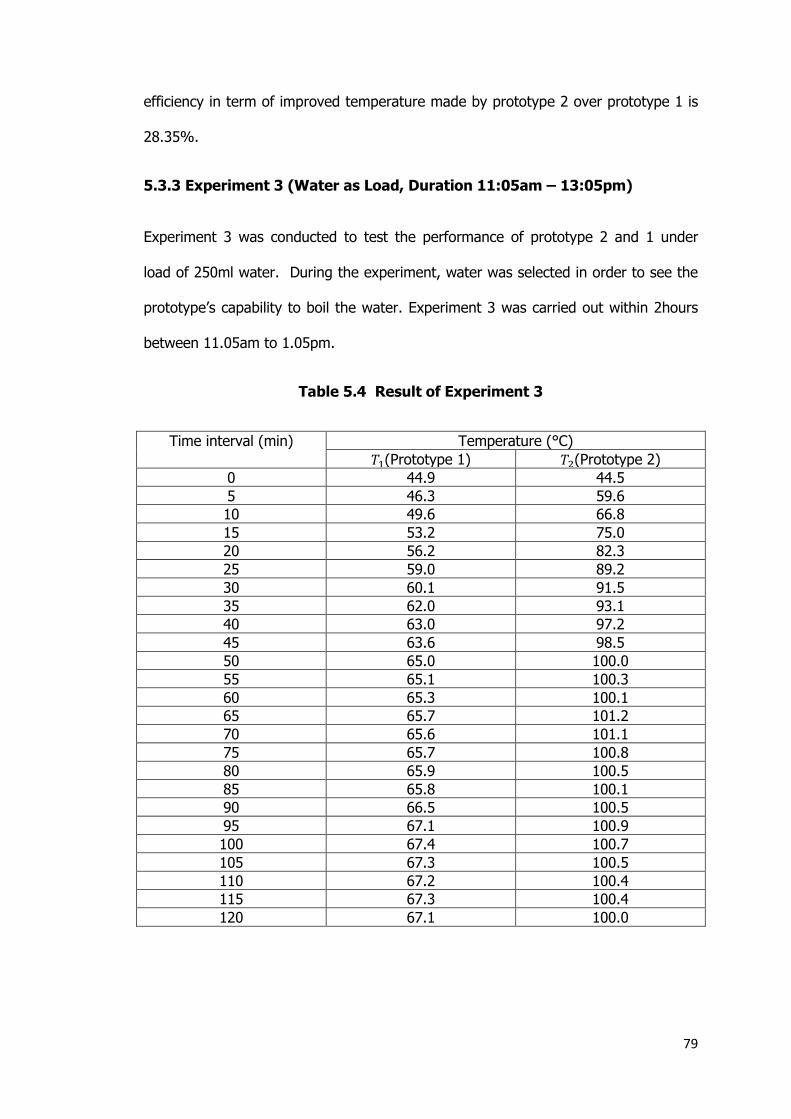
Table 5.4 Result of Experiment 3
Time interval (min) Temperature (°C)
(Prototype 1) (Prototype 2)
0 44.9 44.5
5 46.3 59.6
10 49.6 66.8
15 53.2 75.0
20 56.2 82.3
25 59.0 89.2
30 60.1 91.5
35 62.0 93.1
40 63.0 97.2
45 63.6 98.5
50 65.0 100.0
55 65.1 100.3
60 65.3 100.1
65 65.7 101.2
70 65.6 101.1
75 65.7 100.8
80 65.9 100.5
85 65.8 100.1
90 66.5 100.5
95 67.1 100.9
100 67.4 100.7
105 67.3 100.5
110 67.2 100.4
115 67.3 100.4
120 67.1 100.0
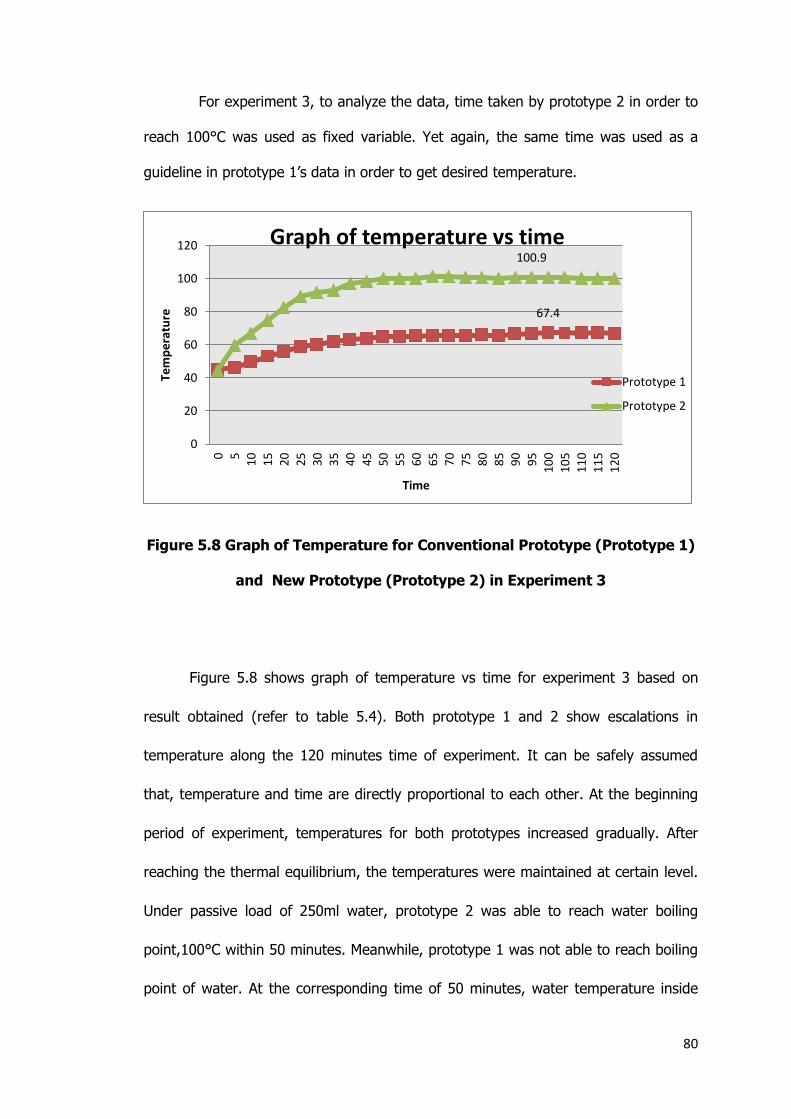
80
For experiment 3, to analyze the data, time taken by prototype 2 in order to
reach 100°C was used as fixed variable. Yet again, the same time was used as a
guideline in prototype 1’s data in order to get desired temperature.
Figure 5.8 Graph of Temperature for Conventional Prototype (Prototype 1)
and New Prototype (Prototype 2) in Experiment 3
Figure 5.8 shows graph of temperature vs time for experiment 3 based on
result obtained (refer to table 5.4). Both prototype 1 and 2 show escalations in
temperature along the 120 minutes time of experiment. It can be safely assumed
that, temperature and time are directly proportional to each other. At the beginning
period of experiment, temperatures for both prototypes increased gradually. After
reaching the thermal equilibrium, the temperatures were maintained at certain level.
Under passive load of 250ml water, prototype 2 was able to reach water boiling
point,100°C within 50 minutes. Meanwhile, prototype 1 was not able to reach boiling
point of water. At the corresponding time of 50 minutes, water temperature inside
67.4
100.9
0
20
40
60
80
100
120
0 51
01
52
02
53
03
54
04
55
05
56
06
57
07
58
08
59
09
51
00
10
51
10
11
51
20
Tem
pe
ratu
re
Time
Graph of temperature vs time
Prototype 1
Prototype 2

81
prototype 1 was 65.0°C. The highest water’s temperature recorded for prototype 2
was 100.9°C. Additional of 0.9°C is may be due to presence of impurities which
eventually made the boiling point of water higher from theoretical value. For
prototype 1, highest temperature recorded was 67.4°C. Theoretically, energy needed
by 250ml of water for prototype 2 to increase from 44.5 °C to 100°C is 57,831 . For
prototype 1, water acquires 20,944.2 of energy to increase from 44.9°C to 65.0°C.
Through calculation, prototype 2 managed to draw higher efficiency than prototype
1. From calculation ( refer to appendix E), it showed that, efficiency for both
prototype 1 and 2 is 41.63% and 47.39% respectively. Experiment 3 concludes that,
the efficiency of prototype 2 is 5.76% better than prototype 1.
5.3.4 Experiment 4 (Water as Load, Duration 2.05pm – 4:05pm)
In experiment 4, it had been conducted within period between 2.05pm to 4.00pm,
the same day as experiment 3 was conducted. Experimental method was exactly
what had been done in experiment 3.
Graph in figure 5.9 shows the plotted graph of experiment 4 based on data
obtained during the experiment (refer to table 5.5). During the 120 minutes duration
of experiment, both prototype 1 and 2 had shown constant increase of temperature.
After reaching the thermal equilibrium, both prototypes’ temperatures were
maintained at stagnation temperature. After minute 65, temperature of loads in both
prototypes started to drop until the end of experiment. Prototype 2 able to reach
100°C just 60 minutes after the experiment was initiated. At the corresponding time
of 60 minutes, the water temperature of prototype 1 was 57.4°C.

82
Table 5.5 Result of Experiment 4
Time interval (min) Temperature (°C)
(Cooking pot 1) (Cooking pot 2)
0 40.1 37.4
5 43.1 47.0
10 45.3 55.5
15 48.6 62.4
20 50.9 67.3
25 52.6 71.2
30 53.1 73.8
35 54.6 76.6
40 55.3 82.3
45 56.3 89.7
50 56.8 93.3
55 57.1 98.7
60 57.4 100.0
65 58.6 100.4
70 59.3 100.1
75 58.2 100.3
80 57.4 100.2
85 56.5 100.0
90 55.3 99.8
95 54.8 99.5
100 52.3 99.2
105 52.1 99.1
110 52.0 98.7
115 51.9 98.4
120 51.6 97.9
Figure 5.9 Graph of Temperature for Conventional Prototype (Prototype 1)
and New Prototype (Prototype 2) in Experiment 4
59.3
100.4
0
20
40
60
80
100
120
0 51
01
52
02
53
03
54
04
55
05
56
06
57
07
58
08
59
09
51
00
10
51
10
11
51
20
Tem
pe
ratu
re
Time
Graph of temperature vs time
Prototype 1
Prototype 2
83
Results have shown that the performances of both ovens are slightly reduced
compared in experiment 1. This may be due to surrounding factors such as light
intensity, humidity, wind and so on. The highest load temperature recorded for
prototype 2 was 100.8°C. Additional 0.8°C is due to impurities that present inside the
water. Load in prototype 1 has recorded 59.3°C as its highest temperature. By
calculation (refer to appendix F), for prototype 2, of energy is required in
order to rise the water temperature from 37.4°C to 100°C. Meanwhile, for prototype
1, water needs of energy to increase from 40.9°C to 57.4°C. From
calculation prototype 2 was able to get higher efficiency which is 42.88% compared
to prototype 1, 27.68%. Efficiency for both prototypes was likely to reduce during
this period of time due to surrounding factors. In this experiment, prototype 2 is
leading the efficiency by 15.2%.
5.3.5 Experiment 5 (Engine Oil as Load, Duration 11.05am – 1:05pm)
Experiment 5 was carried out under load of 250ml engine oil. It was conducted to
observe the performance in term of time taken to reach stagnation temperature.
Due to high boiling point, engine oil has been used as load. In addition, it also
provided chances to observe highest possible temperature that might be reached by
prototype under given load. Method of analysis for this experiment was by taking the
time taken for load in prototype 1 once it reached its stagnation temperature. Next,
the same time was marked as guideline and from that temperature of load in
prototype 2 was determine.

84
Table 5.6 Result of Experiment 5
Time interval Temperature (°C)
(Cooking pot 1) (Cooking pot 2)
0 39.3 39.2
5 43.6 66.6
10 51.2 76.3
15 55.8 81.0
20 61.9 91.6
25 65.6 96.9
30 70.2 100.5
35 72.8 107.2
40 75.5 111.0
45 78.0 115.0
50 79.4 116.3
55 80.5 119.4
60 80.7 120.4
65 80.6 121.4
70 80.5 121.6
75 80.4 121.7
80 80.6 121.6
85 80.8 121.8
90 80.7 121.6
95 80.8 121.2
100 80.9 120.2
105 80.5 118.3
110 79.6 118.9
115 80.0 118.4
120 69.7 102.4
Figure 5.10 Graph of Temperature for Conventional Prototype (Prototype
1) and New Prototype (Prototype 2) in Experiment 5
80.9
121.8
0
20
40
60
80
100
120
140
0 51
01
52
02
53
03
54
04
55
05
56
06
57
07
58
08
59
09
51
00
10
51
10
11
51
20
Tem
pe
ratu
re
Time
Graph of temperature vs time
Prototype 1
Prototype 2
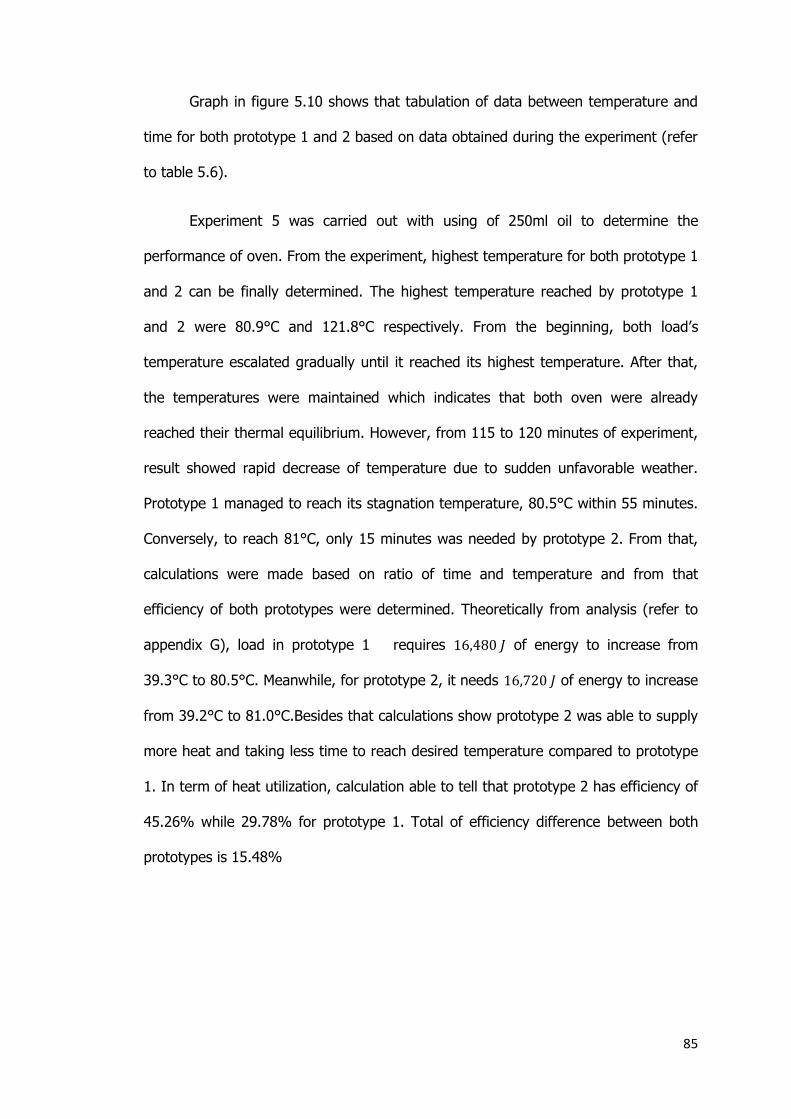
85
Graph in figure 5.10 shows that tabulation of data between temperature and
time for both prototype 1 and 2 based on data obtained during the experiment (refer
to table 5.6).
Experiment 5 was carried out with using of 250ml oil to determine the
performance of oven. From the experiment, highest temperature for both prototype 1
and 2 can be finally determined. The highest temperature reached by prototype 1
and 2 were 80.9°C and 121.8°C respectively. From the beginning, both load’s
temperature escalated gradually until it reached its highest temperature. After that,
the temperatures were maintained which indicates that both oven were already
reached their thermal equilibrium. However, from 115 to 120 minutes of experiment,
result showed rapid decrease of temperature due to sudden unfavorable weather.
Prototype 1 managed to reach its stagnation temperature, 80.5°C within 55 minutes.
Conversely, to reach 81°C, only 15 minutes was needed by prototype 2. From that,
calculations were made based on ratio of time and temperature and from that
efficiency of both prototypes were determined. Theoretically from analysis (refer to
appendix G), load in prototype 1 requires of energy to increase from
39.3°C to 80.5°C. Meanwhile, for prototype 2, it needs of energy to increase
from 39.2°C to 81.0°C.Besides that calculations show prototype 2 was able to supply
more heat and taking less time to reach desired temperature compared to prototype
1. In term of heat utilization, calculation able to tell that prototype 2 has efficiency of
45.26% while 29.78% for prototype 1. Total of efficiency difference between both
prototypes is 15.48%
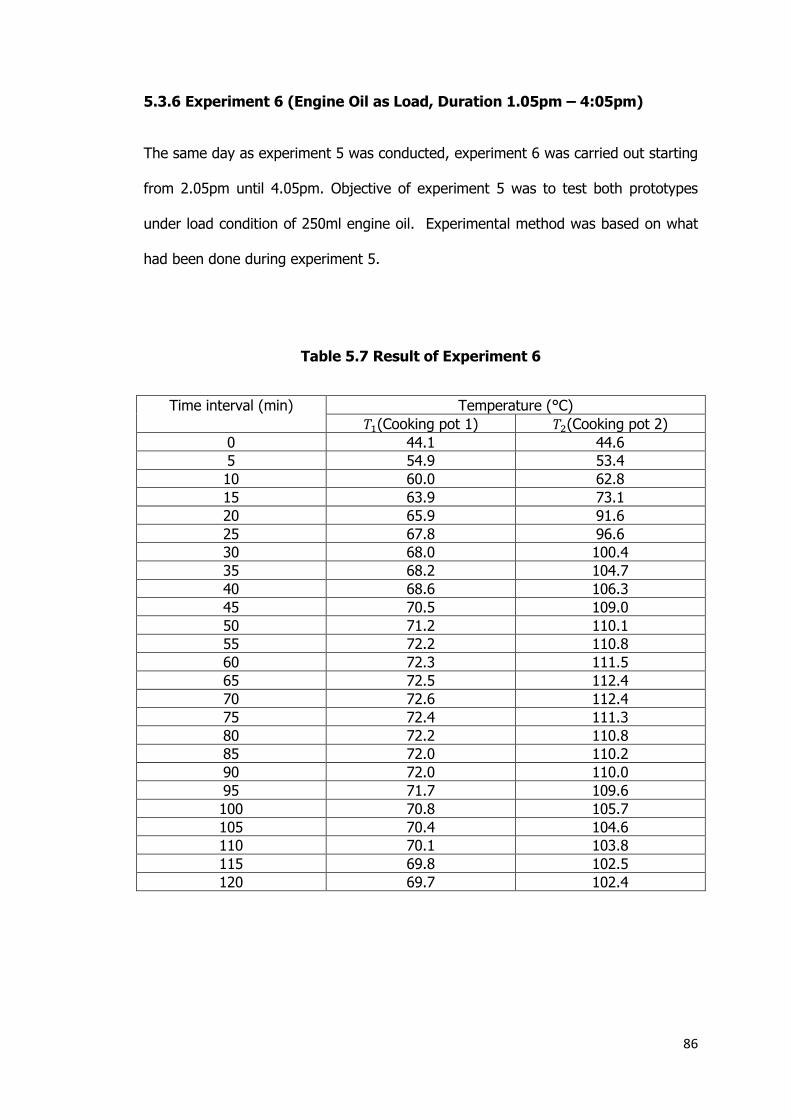
86
5.3.6 Experiment 6 (Engine Oil as Load, Duration 1.05pm – 4:05pm)
The same day as experiment 5 was conducted, experiment 6 was carried out starting
from 2.05pm until 4.05pm. Objective of experiment 5 was to test both prototypes
under load condition of 250ml engine oil. Experimental method was based on what
had been done during experiment 5.
Table 5.7 Result of Experiment 6
Time interval (min) Temperature (°C)
(Cooking pot 1) (Cooking pot 2)
0 44.1 44.6
5 54.9 53.4
10 60.0 62.8
15 63.9 73.1
20 65.9 91.6
25 67.8 96.6
30 68.0 100.4
35 68.2 104.7
40 68.6 106.3
45 70.5 109.0
50 71.2 110.1
55 72.2 110.8
60 72.3 111.5
65 72.5 112.4
70 72.6 112.4
75 72.4 111.3
80 72.2 110.8
85 72.0 110.2
90 72.0 110.0
95 71.7 109.6
100 70.8 105.7
105 70.4 104.6
110 70.1 103.8
115 69.8 102.5
120 69.7 102.4
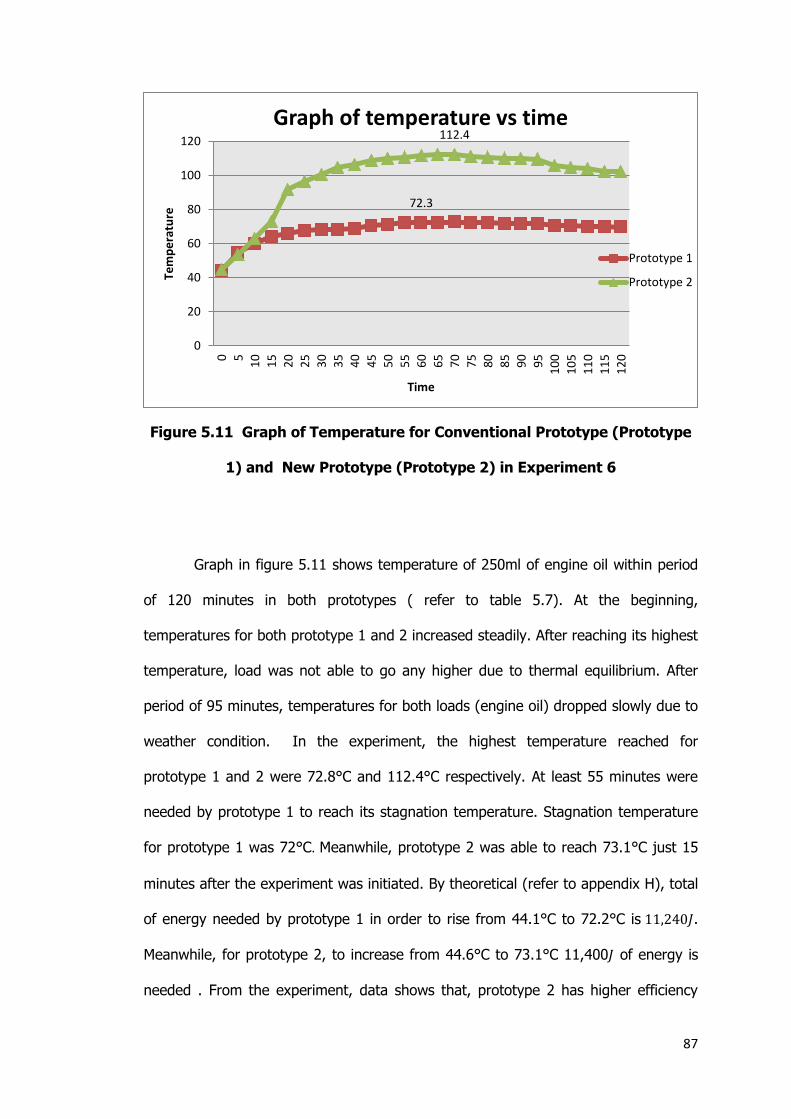
87
Figure 5.11 Graph of Temperature for Conventional Prototype (Prototype
1) and New Prototype (Prototype 2) in Experiment 6
Graph in figure 5.11 shows temperature of 250ml of engine oil within period
of 120 minutes in both prototypes ( refer to table 5.7). At the beginning,
temperatures for both prototype 1 and 2 increased steadily. After reaching its highest
temperature, load was not able to go any higher due to thermal equilibrium. After
period of 95 minutes, temperatures for both loads (engine oil) dropped slowly due to
weather condition. In the experiment, the highest temperature reached for
prototype 1 and 2 were 72.8°C and 112.4°C respectively. At least 55 minutes were
needed by prototype 1 to reach its stagnation temperature. Stagnation temperature
for prototype 1 was 72°C. Meanwhile, prototype 2 was able to reach 73.1°C just 15
minutes after the experiment was initiated. By theoretical (refer to appendix H), total
of energy needed by prototype 1 in order to rise from 44.1°C to 72.2°C is .
Meanwhile, for prototype 2, to increase from 44.6°C to 73.1°C 11,400 of energy is
needed . From the experiment, data shows that, prototype 2 has higher efficiency
72.3
112.4
0
20
40
60
80
100
120
0 5
10
15
20
25
30
35
40
45
50
55
60
65
70
75
80
85
90
95
10
0
10
5
11
0
11
5
12
0
Tem
pe
ratu
re
Time
Graph of temperature vs time
Prototype 1
Prototype 2
88
compared to prototype 1.Under load of 250ml engine oil, prototype 2 managed to
reach 30.10% of efficiency 19.54% for prototype 1. To conclude, prototype 2 is
10.56% more efficient than prototype 1.
Figure 5.12 Graph of All Conducted Experiment
From all 6 experiments, by observation, it shows that, in term of performance,
prototype 2 has proved its higher efficiency compared to prototype 1. This may be
due to design and additional mirror booster that concentrate amount of heat inside
the cooking chamber. Besides that, result from graph in figure 5.12 shows that
experiment which is conducted within period of 11.05am to 1.05pm has tendency to
get better result compared that being conducted from 2.05pm to 4.05pm.
0
20
40
60
80
100
120
140
160
0 5
10
15
20
25
30
35
40
45
50
55
60
65
70
75
80
85
90
95
10
0
10
5
11
0
11
5
12
0
Tem
pe
ratu
re
Time
Graph of temperature vs time
Experiment 1
Experiment 2
Experiment 3
Experiment 4
Experiment 5
Experiment 6
89
5.4 Effect of Additional Mirror and Insulator
5.4.1 Effect of Additional Mirror
From calculation, it showed that total of heat supplied by prototype 2 was
theoretically higher compared to prototype 1. Additional mirror has proved its ability
to concentrate more heat into the cooking chamber. In order to maximize the
potential of improved prototype ( prototype 2), mirrors were designed in optimum
position of angle. To maintain the performance, all five mirrors were adjusted
manually every 20 minutes. Calculation has theoretically proved that total of heat
supplied by prototype 2 is higher than prototype 1.
5.4.2 Effect of Insulator
Conduction, radiation and convection are all the factors that cause the heat loss. To
reduce the total of heat loss, alumina wools were placed all over the sides and
bottom of cooking chamber. Calculations have shown that the use of alumina wool
able to conserve heat from loss to the surroundings.
5.5 Energy Balance for New Prototype (Prototype 2)
In order to calculate the energy balance of prototype 2, heat transfer by conduction,
convection and radiation is determined. However, due to lack of parameter,
convection is not able to be evaluated. Thus, only conduction and convection are
able to be find. Energy balance is calculated based on data during experiment 3
.From calculation (refer to appendix J), total of heat loss by conduction and radiation
is 26,600.85 J and 25,032.68 J respectively. Meanwhile, total of energy input is
122,040 J. From theoretical calculation, energy needed by water to rise the

90
temperature from Heat loss by convection is not able to be calculated due to lack of
parameters.

91
CHAPTER 6
CONCLUSION AND FUTURE WORKS
6.1 Overview
This section covers on the conclusion made for this project. Recommendation is
provided in this part that might be used for further improvement.
6.2 Conclusion
Throughout the project, it shows that, in term of performance, prototype 2 has
verified its ability to attain better efficiency compared to prototype 1. Ideal design
and additional mirror booster has analytically prove its contribution in concentrating
amount of heat inside the cooking chamber. Based on various calculations, an
improved design was finalized and fabricated successfully. For comparison, a
conventional solar box cooker that approximately same in size was also fabricated. 6
experiments had been carried out and all data were analyzed. By analysis, it shows
that, experiment that conducted at early of the day has tendency to come with better
result outcome. Improved solar oven has proven to succeed for being able to keep
higher temperature throughout the day and eventually able to show its potential to
be implemented under tropical climate of Malaysia.
92
6.2 Future Work
For this project, the recommendations include on equipping each mirror with
automatic sun tracking system. During conduction of the experiment, each mirror
had to be adjusted manually for every 20 minutes in order to keep the high level of
reflected light. Therefore, by adding automatic sun tracking system, the mirror can
be adjusted significantly and accommodate the prototype itself efficiently at once in
maintaining its optimum performance. Besides that, to gain higher intensity of light,
additional mirror can be added along the interior sides of cooking chamber. It can be
concluded that the additional mirror helps to increase light supply to surface of
cooking pot. Due to limitation of budget, prototype 2 had been built with heavy
materials which make it less portable due to heavy weight. Thus, for it to become
portable, lighter material can be used to replace the angle bar which is used to build
the prototype.
93
REFERENCES
2013 - United Nations International Year of Water Cooperation: Facts and Figures. (n.d.). Retrieved October 4, 2013, from http://www.unwater.org/water-cooperation-2013/water-cooperation/facts-and-figures
A.Cengel, Y., & J.Ghafar,A.2011. HEAT and MASS TRANSFER, Americas, NewYork :Mc Graw Hill
Ali, B., Sopian, K., Al-Ghoul, M., Othman, M. ., & Razali, A. . 2009. Economics of domestic solar hot water heating systems in Malaysia. Eur.J.Sci.Res, 26, 13–21. Retrieved 7 December 2013, from http://www.sciencedirect.com
Azhari, A. ., Sopian, K., Zaharim, A., & Al-Ghoul, M. 2008. A new approach for predicting solar radiation in tropical environment using satellite - Case study of Malaysia. WSEAS Trans. Environ. Dev, 4, 373–378. Retrieved 21 November 2006, from http://www.sciencedirect.com
Beeson, S., & Mayer, J. . 2008. Patterns of light. Hardcover: Springer. Retrieved 5 December 2013,from http://www.springer.com/978-0-387-75106-1
Chen, Q., Liang, X.-G., & Guo, Z.-Y. 2013. Entransy theory for the optimization of heat transfer – A review and update. International Journal of Heat and Mass Transfer, 63, 65–81. Retrieved 4 December 2013, from http://www.sciencedirect.com
Cuce, E., & Cuce, P. M. 2013. A comprehensive review on solar cookers. Applied Energy, 102, 1399–1421. Retrieved 2 December 2013, from http://www.sciencedirect.com
Curlydock. 2007. Some experiments on solar oven stimulation test. Green Man Waiting. Retrieved 21 November 2013, from http://www.sciencedirect.com
Cverna, F. 2002. ASM Ready Reference: Thermal properties of metals. ASM International. Retrieved 4 December 2013, from http://books.google.com.my
94
Harmim, A., Belhamel, M., Boukar, M., & Amar, M. 2010. Experimental investigation of a box type solar cooker with a finned absorber plate. Energy, 35, 3799–802. Retrieved 4 December 2013, from http://www.sciencedirect.com
Harmim, A., Merzouk, M., Boukar, M., & Amar, M. 2013. Design and experimental testing of an innovative building-integrated box type solar cooker. Solar Energy, 98, Part C, 422–433. Retrieved 21 November 2013, from http://www.sciencedirect.com
Joshi, J., Pandit, A., Patel, S., Singhal, R., Bhide, G., & Mariwala, K. 2012. Development of efficient designs of cooking systems. Ind Eng Chem Res, 51(4), 1878–96. Retrieved 4 December 2013, from http://www.sciencedirect.com
Klemens, S., Maria, E., & Vieira, d. . 2008. Characterization and design methods of solar cookers. Solar Energy, 82, 157–163. Retrieved 5 December 2013, from http://www.sciencedirect.com
Kumar, A., Adhli karl, R., Garg, H. P., & Kumar, A. 2001. Thermal performance of a solar pressure cooker based on evacuated tube solar collector. Applied Thermal Engineering, 7, 1699–706. Retrieved 3 December 2013, from http://www.sciencedirect.com
Michael, J. N. 2008. Solar Ovens Equations. College of Optical Sciences. Retrieved 10
March 2014, from http://azmesa.arizona.edu/sites/azmesa.arizona.edu
/files/Solar%20Oven%20Design.pdf
Muthusivagami, R. M., Velraj, R., & Sethumadhavan, R. 2010. Solar cookers with and without thermal storage—A review. Renewable and Sustainable Energy Reviews, 14(2), 691–701. Retrieved 1 December 2013, from http://www.sciencedirect.com
Naveen, K., Sagar, A., Tilak, C., & Mistry, H. . 2008. Design and development of efficient multipurpose domestic solar cookers/dryers. Elsevier.Ltd, 2207–2211. Retrieved 5 December 2013, from http://www.sciencedirect.com

95
Ozkaymak, M. (2007). Theoritical and experimental investigation of a hot box-type solar cooker performance. J Power Energy, 221, 91–7. Retrieved 4 December 2013, from http://www.sciencedirect.com
Pohekar, S., Kumar, D., & Ramachandran, M. 2005. Dissemination of cooking energy alternatives in India. Dissemination of cooking energu alternatives in India- a review, 379–93. Retrieved 2 December 2013, from http://www.sciencedirect.com
Radabaugh, J. 1998. Heaven’s Flame: A Guidebook to Solar Cookers. Joseph Radabaugh. Retrieved 4 October 2013, from http://books.google.com.my
Saxena, A., Varun, Pandey, S. P., & Srivastav, G. 2011. A thermodynamic review on solar box type cookers. Renewable and Sustainable Energy Reviews, 15(6), 3301–3318. Retrieved 21 November 2013, from http://www.sciencedirect.com
Shukla, S., & Gupta, S. 2008. Performance evaluation of concentrating solar cooker under Indian climatic conditions. Presented at the In: Second international conference on energy sustainability, Jacksonville, Florida, USA. Retrieved 19 November 2013, from http://www.sciencedirect.com
Solar Oven Design:Calculating Optiman Angle Between Glazing and Reflector. Retrieved 15 march 20014 , from http://www.omick.net/solar_ovens/solar_oven_design.htmECTOR
Stevanović, S. 2013. Optimization of passive solar design strategies: A review. Renewable and Sustainable Energy Reviews, 25, 177–196. Retrieved 21 November 2013, from http://www.sciencedirect.com
Syahrul, N. ., Hamzah, A. ., Chen, W., Saipol, B. ., & Tien, Y. . 2012. Solar technology and builiding implementation in Malaysia: A national paradigm shift. Maejo Int. J. Sci. Technol, 6(02), 192–215. Retrieved 7 November 2013, from http://www.sciencedirect.com

96
The Engineering Toolbox. 2011. Water and Engine Oil Propertied. Retrieved 5 May
2013, from http:// www.engineeringtoolboc.vom
The Engineering Toolbox. 2011. Acrylic Mirror Propertied. Retrieved 5 May 2013, from http:// www.engineeringtoolboc.vom
The Engineering Toolbox. 2011. Glass Propertied. Retrieved 5 May 2013, from http:// www.engineeringtoolboc.vom
Ullmann, A., Maevski, K., & Brauner, N. 2014. Enhancement of forced and free convection heat transfer rates by inducing liquid–liquid phase separation of a partially-miscible equal-density binary liquid system. International Journal of Heat and Mass Transfer, 70, 363–377. Retrieved 7 December 2013, from http://www.sciencedirect.com
Yettou, F., Azoui, B., & Malek, A. 2013. Determination of adjustment tracking time in two types of solar cookers by ray-tracing method. Presented at the 4th International Conference on Power Engineering, Istanbul, Turkey: Energy and Electrical Drives. Retrieved 3 November 2013, from http://www.sciencedirect.com
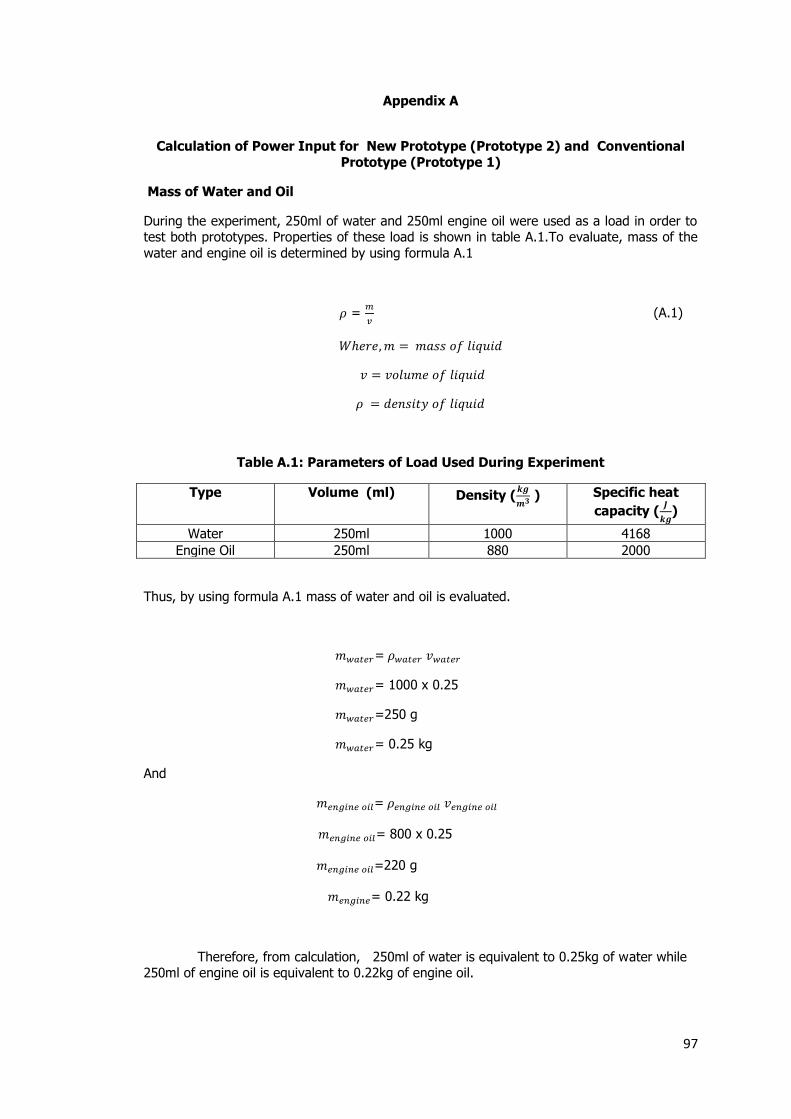
97
Appendix A
Calculation of Power Input for New Prototype (Prototype 2) and Conventional
Prototype (Prototype 1)
Mass of Water and Oil
During the experiment, 250ml of water and 250ml engine oil were used as a load in order to test both prototypes. Properties of these load is shown in table A.1.To evaluate, mass of the
water and engine oil is determined by using formula A.1
=
(A.1)
Table A.1: Parameters of Load Used During Experiment
Type Volume (ml) Density (
) Specific heat
capacity (
)
Water 250ml 1000 4168
Engine Oil 250ml 880 2000
Thus, by using formula A.1 mass of water and oil is evaluated.
=
= 1000 x 0.25
=250 g
= 0.25 kg
And
=
= 800 x 0.25
=220 g
= 0.22 kg
Therefore, from calculation, 250ml of water is equivalent to 0.25kg of water while 250ml of engine oil is equivalent to 0.22kg of engine oil.
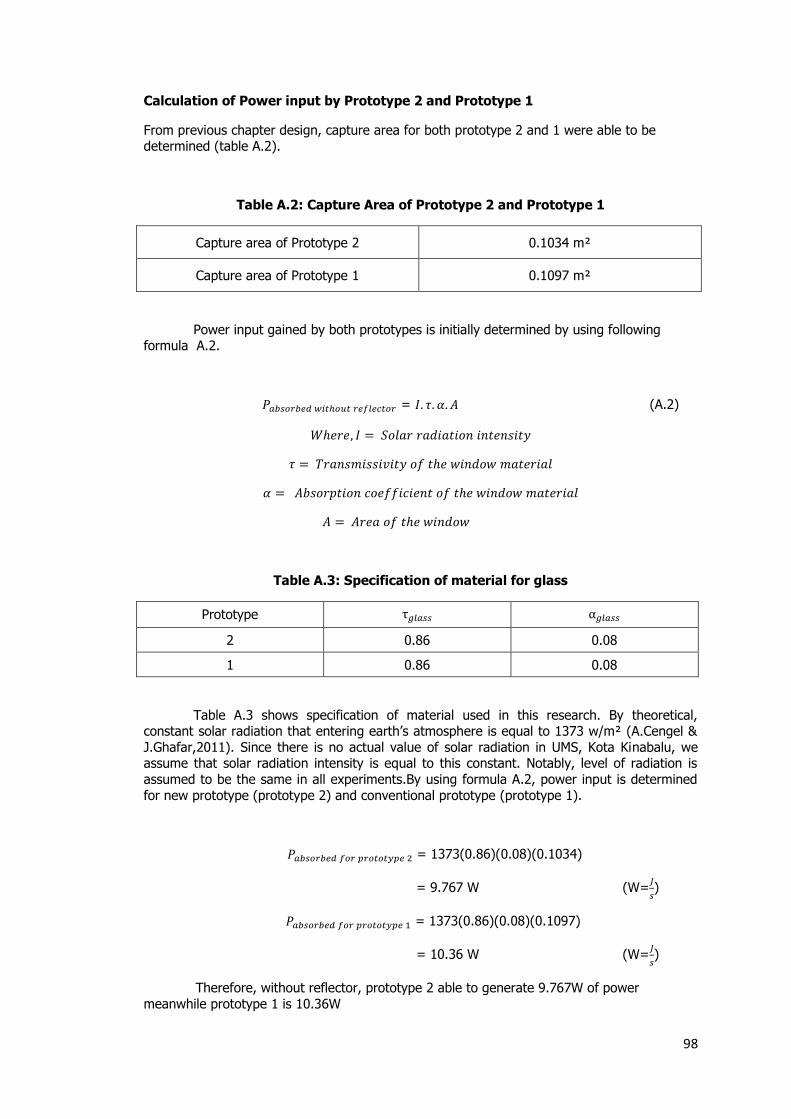
98
Calculation of Power input by Prototype 2 and Prototype 1
From previous chapter design, capture area for both prototype 2 and 1 were able to be determined (table A.2).
Table A.2: Capture Area of Prototype 2 and Prototype 1
Capture area of Prototype 2 0.1034 m²
Capture area of Prototype 1 0.1097 m²
Power input gained by both prototypes is initially determined by using following formula A.2.
= (A.2)
Table A.3: Specification of material for glass
Prototype
2 0.86 0.08
1 0.86 0.08
Table A.3 shows specification of material used in this research. By theoretical, constant solar radiation that entering earth’s atmosphere is equal to 1373 w/m² (A.Cengel &
J.Ghafar,2011). Since there is no actual value of solar radiation in UMS, Kota Kinabalu, we assume that solar radiation intensity is equal to this constant. Notably, level of radiation is
assumed to be the same in all experiments.By using formula A.2, power input is determined
for new prototype (prototype 2) and conventional prototype (prototype 1).
= 1373(0.86)(0.08)(0.1034)
= 9.767 W (W=
)
= 1373(0.86)(0.08)(0.1097)
= 10.36 W (W=
)
Therefore, without reflector, prototype 2 able to generate 9.767W of power
meanwhile prototype 1 is 10.36W

99
Appendix B
Calculation of Concentrate Factor by the Reflector of Prototype 2 and Prototype 1
To calculate the concentrate factor at given time, data of angle measured during conducting
the experiment is tabulated as in table B.1 ( 11.05 AM to 1.05 PM) and table B.2 (2.05PM to
4.05PM).As shown in figure B.1, concentrate factor is calculated by using formula B.1 . Assume that, all mirrors are parallel to top surface of oven.
Figure B.1 Illustration of Parameters to Calculate the Concentrate Factor
(B.1)

100
Table B.1: Specification of angle of mirrors for both prototypes between 11.05 AM
to 1.05PM
Angle of every mirror in both prototype (°)
Prototype 1 Prototype 2
Time Mirror 1 Mirror 1 Mirror 2 Mirror 3 Mirror 4 Mirror 5
0 102 102 111 136 136 111
20 108 108 113 133 133 113
40 116 116 113 133 133 113
60 120 120 110 130 130 110
80 116 116 113 126 126 113
100 108 108 113 124 124 113
120 102 102 111 122 122 111
Table B.2: Specification of angle of mirrors for both prototypes between 2.05 PM
to 4.05PM
Angle of every mirror in both prototype (°)
Prototype 1 Prototype 2
Time 1 1 2 3 4 5
0 90 90 110 130 130 110
20 85 85 108 132 132 108
40 80 80 100 132 132 100
60 75 75 100 132 132 100
80 70 70 110 132 132 110
100 70 70 110 132 132 110
120 70 70 110 132 132 110
Experiment 1
To analyze experiment 1 for prototype 2, all angles angle at minute 75 are taken and
calculated. Meanwhile, for prototype 1,all angles at minute 55 are chosen.All data are referred from table B.1.Thus, by using formula B.1 concentrate factor is calculated.
At minute 75
=
1+ [ (2)(0.9) (
)sin 110 + (2)(0.9) (
)sin 130 +(1)(0.9) (
)sin 120]
= 4.1805
And at minute 55
=
= 1+(1)(0.9)(
)sin 116
= 1.6187
Therefore, concentrate factor made by reflector in prototype 2 and 1 is 4.1805 and 1.6187 respectively.
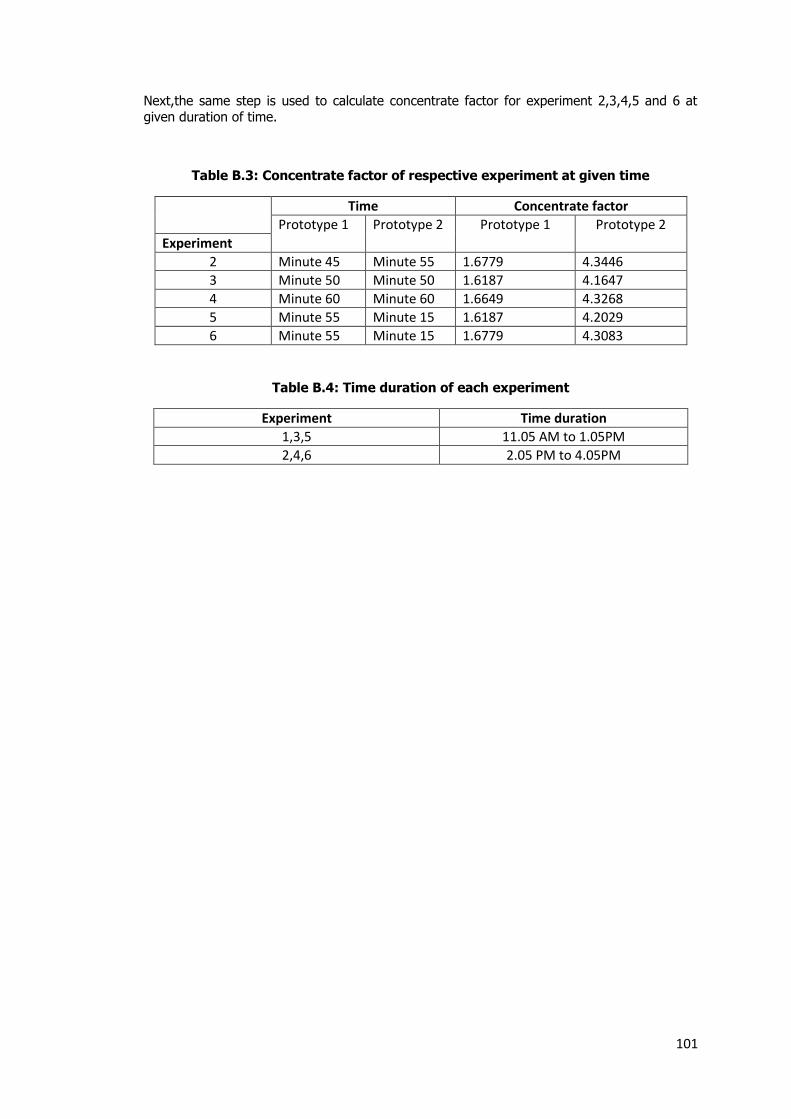
101
Next,the same step is used to calculate concentrate factor for experiment 2,3,4,5 and 6 at
given duration of time.
Table B.3: Concentrate factor of respective experiment at given time
Time Concentrate factor
Prototype 1 Prototype 2 Prototype 1 Prototype 2
Experiment
2 Minute 45 Minute 55 1.6779 4.3446
3 Minute 50 Minute 50 1.6187 4.1647
4 Minute 60 Minute 60 1.6649 4.3268
5 Minute 55 Minute 15 1.6187 4.2029
6 Minute 55 Minute 15 1.6779 4.3083
Table B.4: Time duration of each experiment
Experiment Time duration
1,3,5 11.05 AM to 1.05PM
2,4,6 2.05 PM to 4.05PM
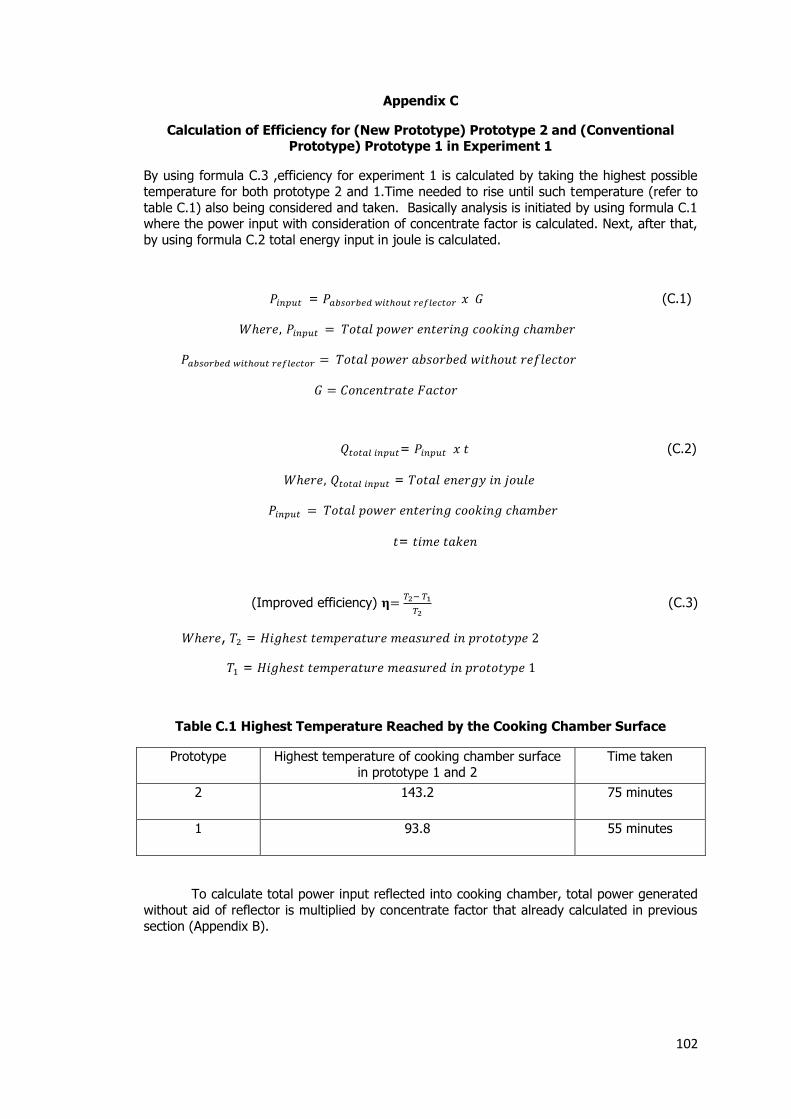
102
Appendix C
Calculation of Efficiency for (New Prototype) Prototype 2 and (Conventional Prototype) Prototype 1 in Experiment 1
By using formula C.3 ,efficiency for experiment 1 is calculated by taking the highest possible
temperature for both prototype 2 and 1.Time needed to rise until such temperature (refer to
table C.1) also being considered and taken. Basically analysis is initiated by using formula C.1 where the power input with consideration of concentrate factor is calculated. Next, after that,
by using formula C.2 total energy input in joule is calculated.
= (C.1)
= (C.2)
=
=
(Improved efficiency) 𝛈
(C.3)
, =
=
Table C.1 Highest Temperature Reached by the Cooking Chamber Surface
Prototype Highest temperature of cooking chamber surface in prototype 1 and 2
Time taken
2 143.2 75 minutes
1 93.8 55 minutes
To calculate total power input reflected into cooking chamber, total power generated
without aid of reflector is multiplied by concentrate factor that already calculated in previous
section (Appendix B).

103
By using formula C.1, power input for prototype 2 is calculated.
= x G
= 9.767 W x 4.1805
= 40.83W
By using formula C.1, power input for prototype 1 is calculated.
= x G
= W x 1.6187
= W
Next, by using formula C.2 ,total power input for prototype 2 and 1 is multiplied by the time (refer to table C.1) to determine total of energy generated for given period of time.
Total power input for 75 minutes or 4500s for prototype 2
= x 4500
= 42.08 x 4500
= 189,360 J
Total power input for 55 minutes or 3300s for prototype 1
= x 3300
= 17.06 x 3300
= 56,298 J
Improved efficiency of prototype 2 over prototype 1 is evaluated by using formula C.3.
𝛈
x 100%
𝛈
x 100%
𝛈 34.49%
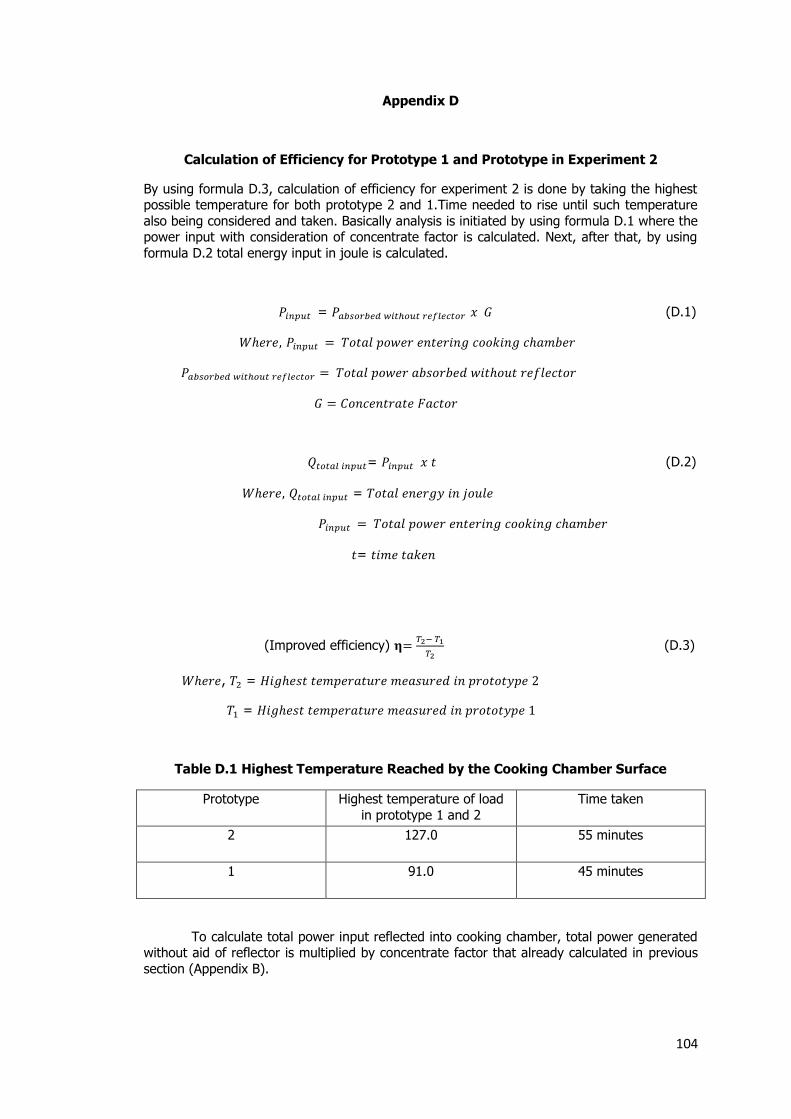
104
Appendix D
Calculation of Efficiency for Prototype 1 and Prototype in Experiment 2
By using formula D.3, calculation of efficiency for experiment 2 is done by taking the highest possible temperature for both prototype 2 and 1.Time needed to rise until such temperature
also being considered and taken. Basically analysis is initiated by using formula D.1 where the power input with consideration of concentrate factor is calculated. Next, after that, by using
formula D.2 total energy input in joule is calculated.
= (D.1)
= (D.2)
=
=
(Improved efficiency) 𝛈
(D.3)
, =
=
Table D.1 Highest Temperature Reached by the Cooking Chamber Surface
Prototype Highest temperature of load
in prototype 1 and 2
Time taken
2 127.0 55 minutes
1 91.0 45 minutes
To calculate total power input reflected into cooking chamber, total power generated without aid of reflector is multiplied by concentrate factor that already calculated in previous
section (Appendix B).
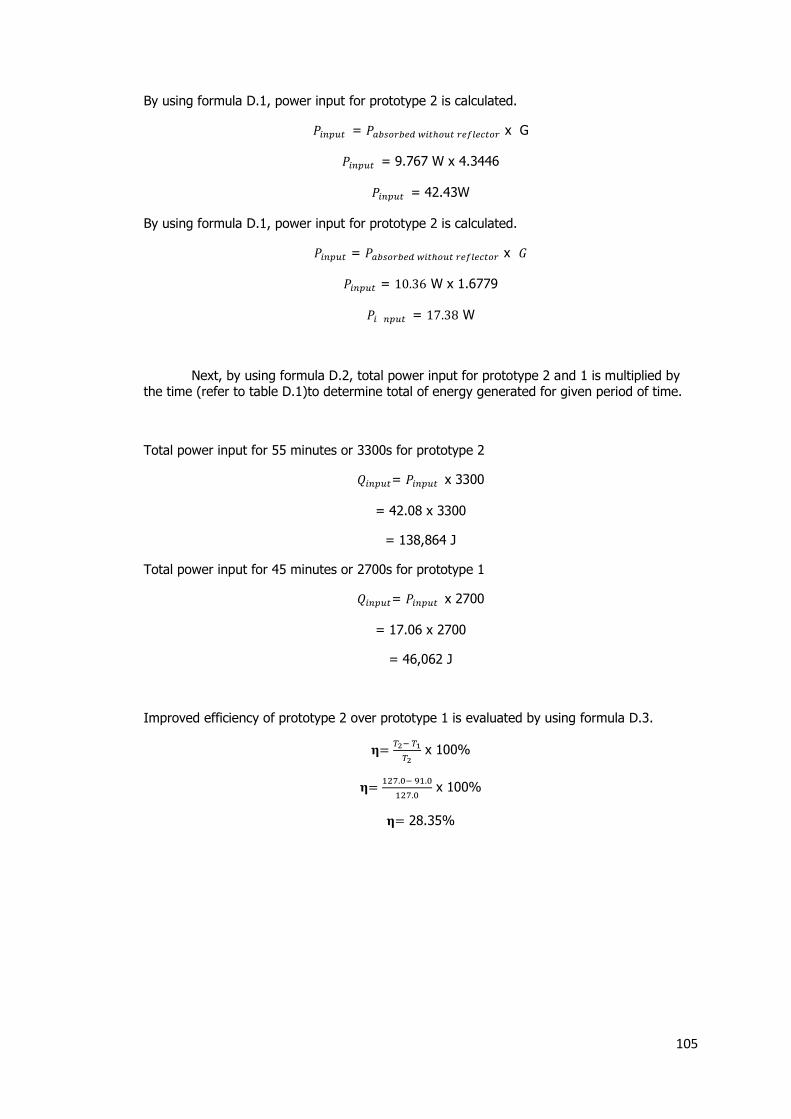
105
By using formula D.1, power input for prototype 2 is calculated.
= x G
= 9.767 W x 4.3446
= 42.43W
By using formula D.1, power input for prototype 2 is calculated.
= x
= W x 1.6779
= W
Next, by using formula D.2, total power input for prototype 2 and 1 is multiplied by the time (refer to table D.1)to determine total of energy generated for given period of time.
Total power input for 55 minutes or 3300s for prototype 2
= x 3300
= 42.08 x 3300
= 138,864 J
Total power input for 45 minutes or 2700s for prototype 1
= x 2700
= 17.06 x 2700
= 46,062 J
Improved efficiency of prototype 2 over prototype 1 is evaluated by using formula D.3.
𝛈
x 100%
𝛈
x 100%
𝛈 28.35%
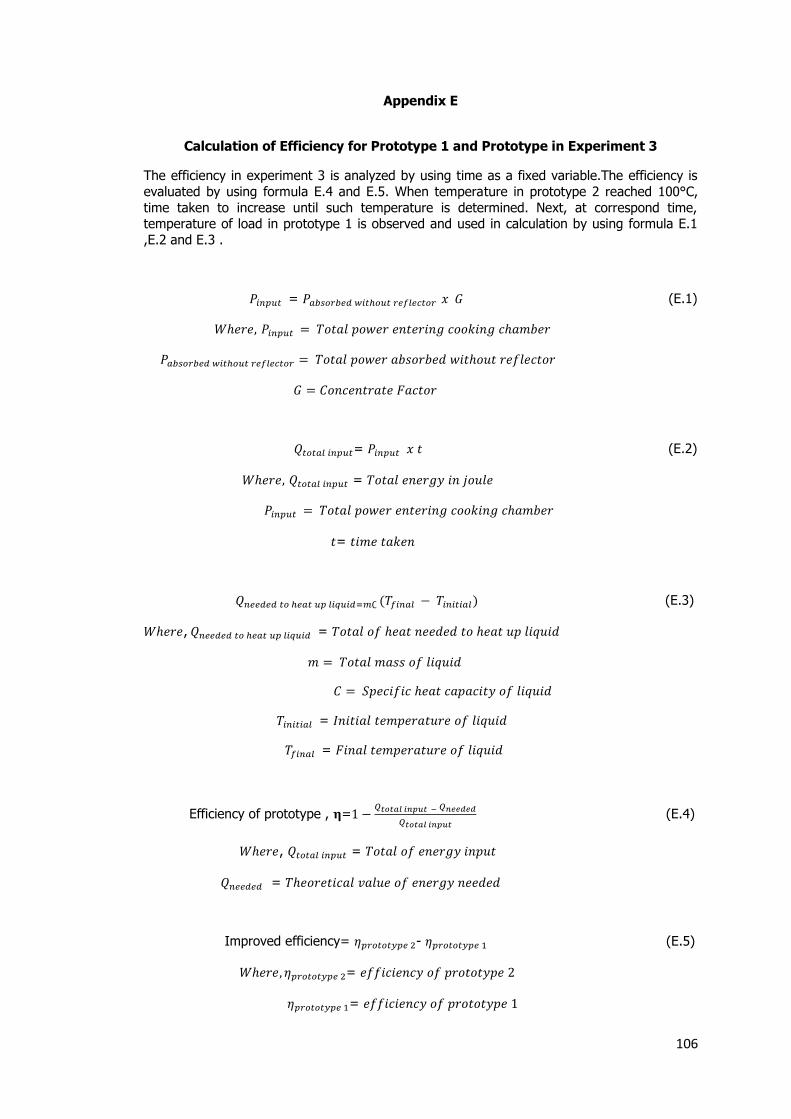
106
Appendix E
Calculation of Efficiency for Prototype 1 and Prototype in Experiment 3
The efficiency in experiment 3 is analyzed by using time as a fixed variable.The efficiency is
evaluated by using formula E.4 and E.5. When temperature in prototype 2 reached 100°C,
time taken to increase until such temperature is determined. Next, at correspond time, temperature of load in prototype 1 is observed and used in calculation by using formula E.1
,E.2 and E.3 .
= (E.1)
= (E.2)
=
=
(E.3)
, =
=
=
Efficiency of prototype , 𝛈=
(E.4)
, =
=
Improved efficiency= - (E.5)
=
=

107
Table E.1 Time Taken by Load in Prototype 1 and Prototype 2
Time Temperature of load in
prototype 2
Temperature of load in
prototype 1
50 minutes 100 65.0
To calculate total power input reflected into cooking chamber, total power generated
without aid of reflector is multiplied by concentrate factor that already calculated in previous
section ( Appendix B).
By using formula E.1, power input for prototype 2 is calculated.
= x G
= 9.767 W x 4.1647
= 40.68W
By using formula E.1, power input for prototype 1 is calculated.
= x G
= W x 1.6187
=
Next, by using formula E.2, total power input for prototype 2 and 1 is multiplied by
the time( refer to table E.1) to determine total of energy generated for given period of time.
Total power input for 50 minutes or 3000s for prototype 2
= x 3000
= 40.68 x 3000
= 122,040 J
Total power input for 50 minutes or 3000s for prototype 1
= x 3000
= 16.77 x 3000
= 50,310 J
By theoretical, total energy needed to rise the water at given temperature for prototype 2 and prototype 1 is calculated by using formula E.3.
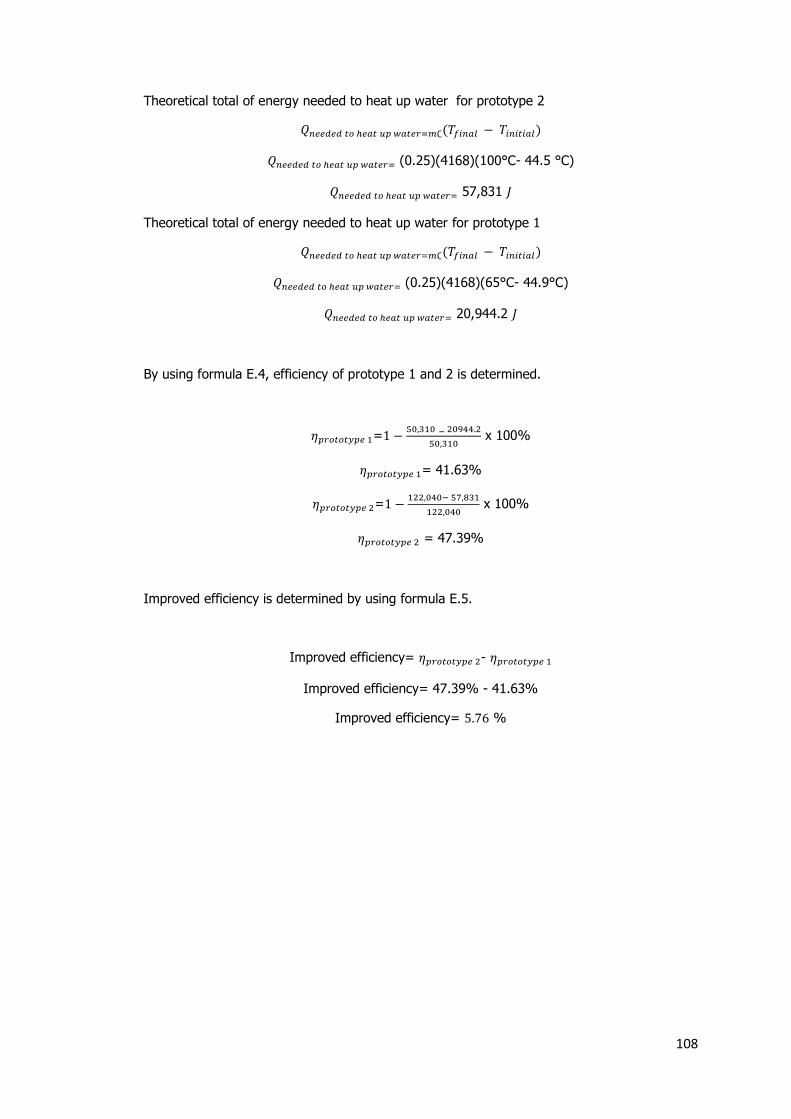
108
Theoretical total of energy needed to heat up water for prototype 2
(0.25)(4168)(100°C- 44.5 °C)
57,831
Theoretical total of energy needed to heat up water for prototype 1
(0.25)(4168)(65°C- 44.9°C)
20,944.2
By using formula E.4, efficiency of prototype 1 and 2 is determined.
=
x 100%
= 41.63%
=
x 100%
= 47.39%
Improved efficiency is determined by using formula E.5.
Improved efficiency= -
Improved efficiency= 47.39% - 41.63%
Improved efficiency= %
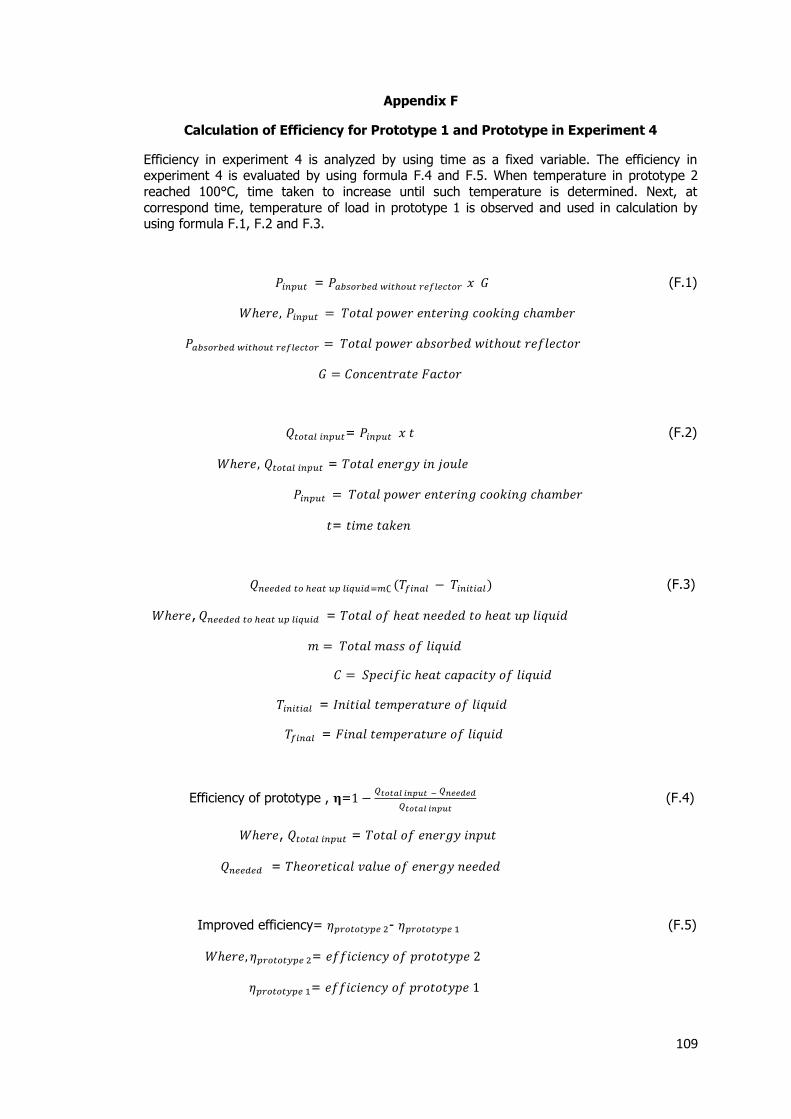
109
Appendix F
Calculation of Efficiency for Prototype 1 and Prototype in Experiment 4
Efficiency in experiment 4 is analyzed by using time as a fixed variable. The efficiency in experiment 4 is evaluated by using formula F.4 and F.5. When temperature in prototype 2
reached 100°C, time taken to increase until such temperature is determined. Next, at
correspond time, temperature of load in prototype 1 is observed and used in calculation by using formula F.1, F.2 and F.3.
= (F.1)
= (F.2)
=
=
(F.3)
, =
=
=
Efficiency of prototype , 𝛈=
(F.4)
, =
=
Improved efficiency= - (F.5)
=
=
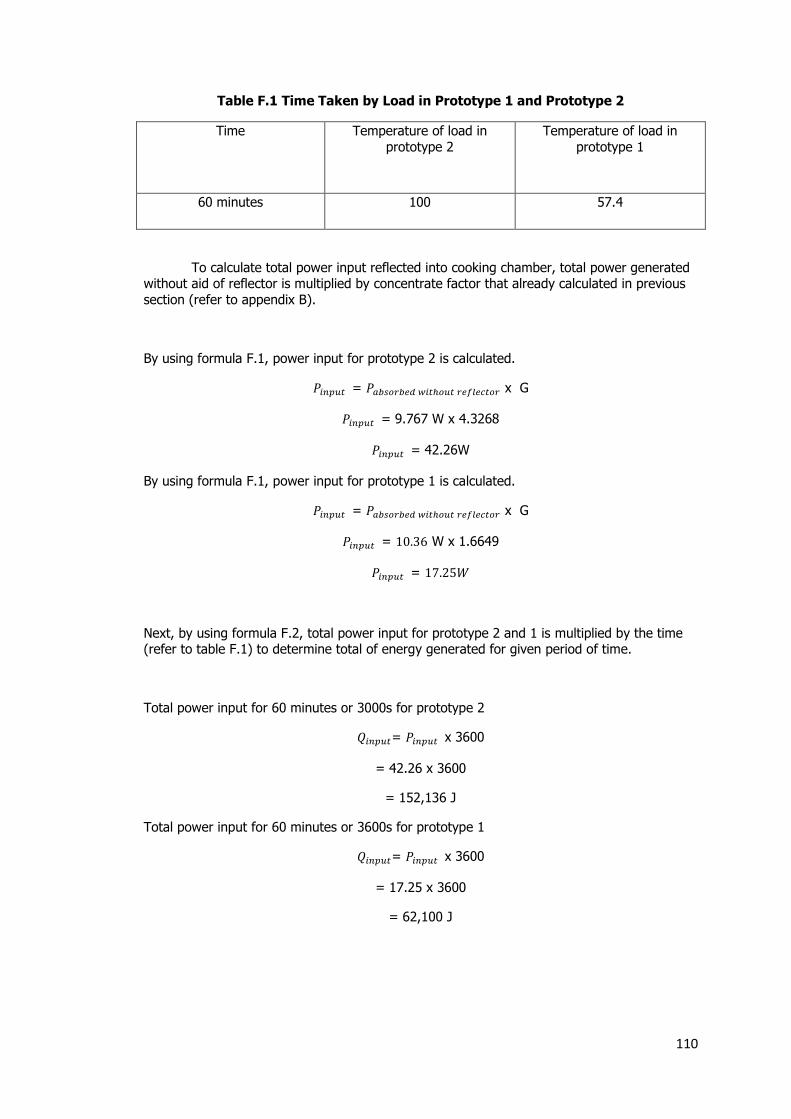
110
Table F.1 Time Taken by Load in Prototype 1 and Prototype 2
Time Temperature of load in
prototype 2
Temperature of load in
prototype 1
60 minutes 100 57.4
To calculate total power input reflected into cooking chamber, total power generated without aid of reflector is multiplied by concentrate factor that already calculated in previous
section (refer to appendix B).
By using formula F.1, power input for prototype 2 is calculated.
= x G
= 9.767 W x 4.3268
= 42.26W
By using formula F.1, power input for prototype 1 is calculated.
= x G
= W x 1.6649
=
Next, by using formula F.2, total power input for prototype 2 and 1 is multiplied by the time (refer to table F.1) to determine total of energy generated for given period of time.
Total power input for 60 minutes or 3000s for prototype 2
= x 3600
= 42.26 x 3600
= 152,136 J
Total power input for 60 minutes or 3600s for prototype 1
= x 3600
= 17.25 x 3600
= 62,100 J

111
By theoretical, total energy needed to rise the water at given temperature for prototype 2
and prototype 1 is calculated by using formula F.3.
(0.25)(4168)(100°C- 37.4°C)
65,229.2
Theoretical total of energy needed to heat up water for prototype 1
(0.25)(4168)(57.4°C- 40.9°C)
17,193
By using formula F.4, efficiency of prototype 1 and 2 is determined.
=
x 100%
= 27.68%
=
x 100%
= 42.88%
Improved efficiency is determined by using formula F.5.
Improved efficiency= -
Improved efficiency= 42.88% - 27.68%
Improved efficiency= %
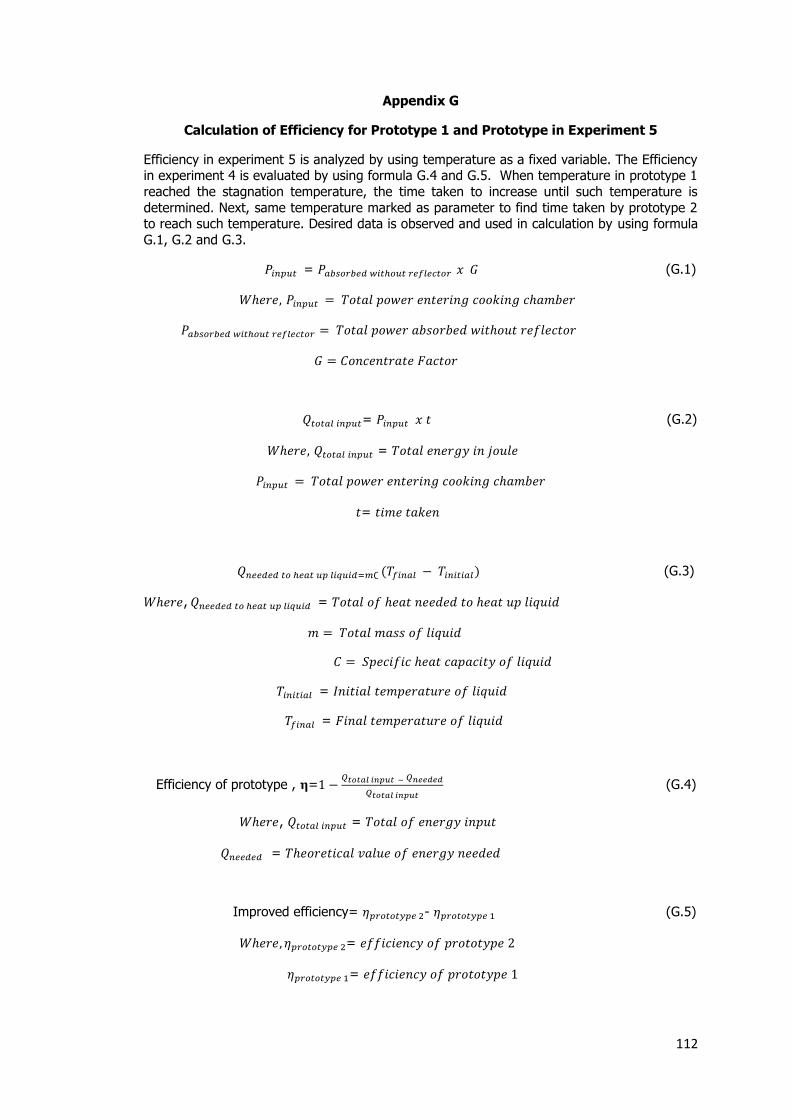
112
Appendix G
Calculation of Efficiency for Prototype 1 and Prototype in Experiment 5
Efficiency in experiment 5 is analyzed by using temperature as a fixed variable. The Efficiency in experiment 4 is evaluated by using formula G.4 and G.5. When temperature in prototype 1
reached the stagnation temperature, the time taken to increase until such temperature is
determined. Next, same temperature marked as parameter to find time taken by prototype 2 to reach such temperature. Desired data is observed and used in calculation by using formula
G.1, G.2 and G.3.
= (G.1)
= (G.2)
=
=
(G.3)
, =
=
=
Efficiency of prototype , 𝛈=
(G.4)
, =
=
Improved efficiency= - (G.5)
=
=

113
Table G.1 Time Taken by Load in Prototype 1 and Prototype 2
Temperature of load in prototype 2
and 1
Time needed for
prototype 1 to reach 80.5°C
Time needed for
prototype 2 to reach 81°C
80°C-81°C 55minutes 15minutes
To calculate total power input reflected into cooking chamber, total power generated without aid of reflector is multiplied by concentrate factor that already calculated in previous section (
Appendix B).
By using formula G.1, power input for prototype 2 is calculated.
= x G
= 9.767 W x 4.2029
= 41.05W
By using formula G.1, power input for prototype 1 is calculated.
= x G
= W x 1.6187
=
Next, by using formula G.2 total power input for prototype 2 and 1 is multiplied by the time(refer to table G.1) to determine total of energy generated for given period of time.
Total power input for 15 minutes or 900s for prototype 2
= x 900
= 41.05 x 900
= 36,945 J
Total power input for 55 minutes or 3300s for prototype 1
= x 3300
= 16.77 x 3300
= 55,341 J
By theoretical, total energy needed to rise the engine oil at given temperature for prototype 2
and prototype 1 is calculated by using formula G.3.
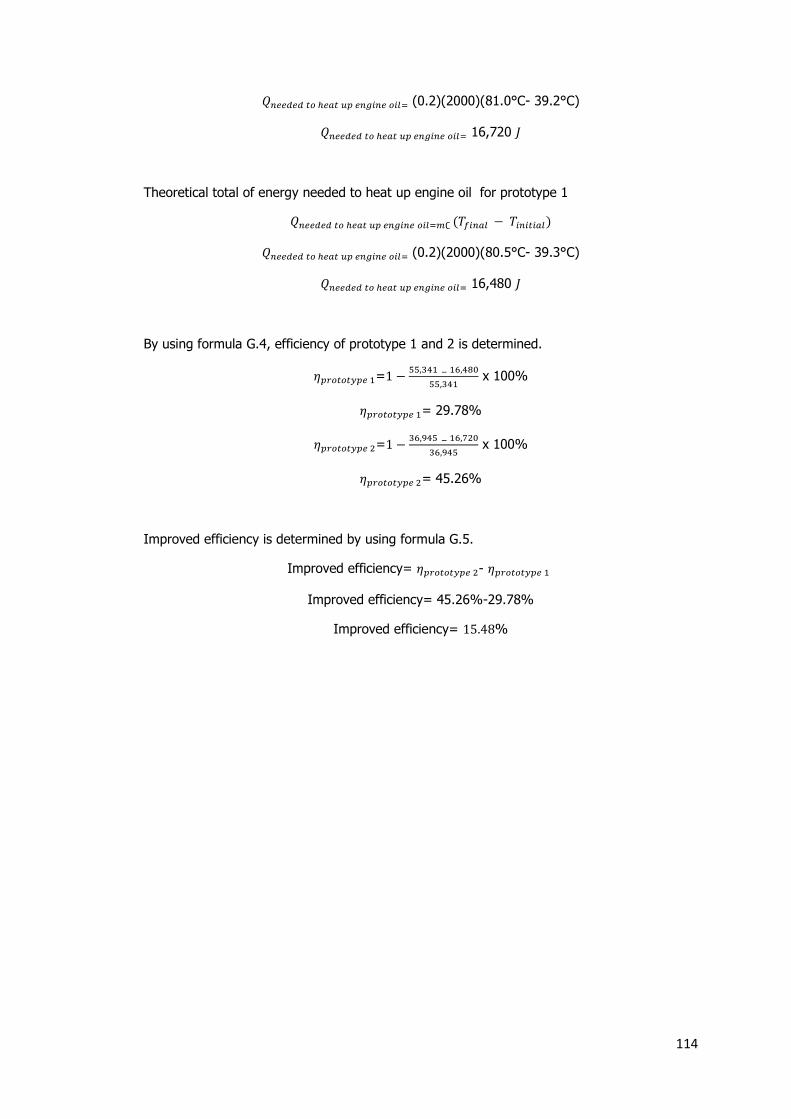
114
(0.2)(2000)(81.0°C- 39.2°C)
16,720
Theoretical total of energy needed to heat up engine oil for prototype 1
(0.2)(2000)(80.5°C- 39.3°C)
16,480
By using formula G.4, efficiency of prototype 1 and 2 is determined.
=
x 100%
= 29.78%
=
x 100%
= 45.26%
Improved efficiency is determined by using formula G.5.
Improved efficiency= -
Improved efficiency= 45.26%-29.78%
Improved efficiency= %

115
Appendix H
Calculation of Efficiency for Prototype 1 and Prototype in Experiment 6
Efficiency in experiment 6 is analyzed by using temperature as a fixed variable. Efficiency in experiment 4 is evaluated by using formula H.4 and H.5. When temperature in prototype 1
reached the stagnation temperature, the time taken to increase until such temperature is
determined. Next, same temperature marked as parameter to find time taken by prototype 2 to reach such temperature. Desired data is observed and used in calculation by using formula
H.1, H.2 and H.3.
= (H.1)
= (H.2)
=
=
(H.3)
, =
=
=
Efficiency of prototype , 𝛈=
(H.4)
, =
=
Improved efficiency= - (H.5)
=
=

116
Table H.1 Time Taken by Load in Prototype 1 and Prototype 2
Temperature of load in prototype 2
and 1
Time needed for
prototype 1 to reach 72.2°C
Time needed for
prototype 2 to reach 73.1°C
73°C-72°C 55minutes 15minutes
To calculate total power input reflected into cooking chamber, total power generated without aid of reflector is multiplied by concentrate factor that already calculated in previous section
(Appendix B).
By using formula H.1, power input for prototype 2 is calculated.
= x G
= 9.767 W x 4.3083
= 42.08W
By using formula H.1, power input for prototype 1 is calculated.
= x G
= W x 1.6779
=
Next, by using formula H.2, total power input for prototype 2 and 1 is multiplied by the time (refer to table H.1) to determine total of energy generated for given period of time.
Total power input for 15 minutes or 900s for prototype 2
= x 900
= 42.08 x 900
= 37,872 J
Total power input for 55 minutes or 3300s for prototype 1
= x 3300
= 17.43 x 3300
= 57,519 J
By theoretical, total energy needed to rise the engine oil at given temperature for prototype 2
and prototype 1 is calculated by using formula H.3.

117
(0.2)(2000)(73.1°C- 44.6°C)
11,400
Theoretical total of energy needed to heat up engine oil for prototype 1
(0.2)(2000)(72.2°C- 44.1°C)
11,240
By using formula H.4, efficiency of prototype 1 and 2 is determined.
=
x 100%
= 19.54%
=
x 100%
= 30.10%
Improved efficiency is determined by using formula H.5.
Improved efficiency= -
Improved efficiency= 30.10% - 19.54%
Improved efficiency=
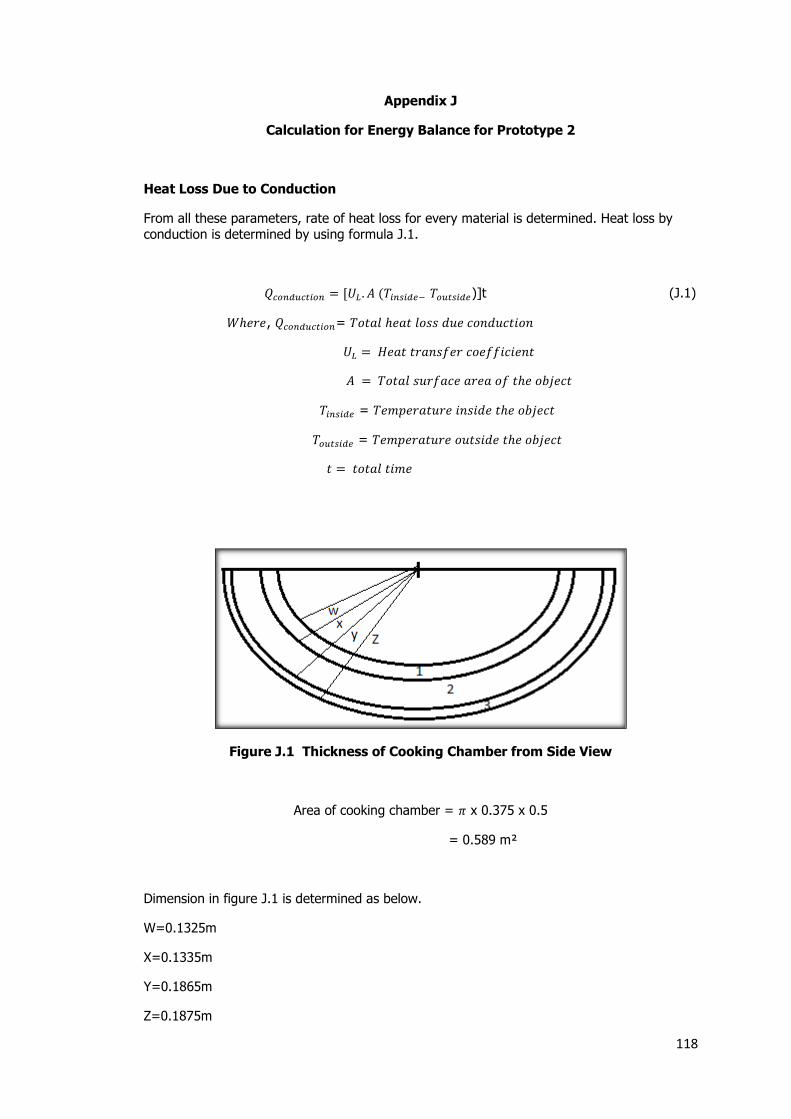
118
Appendix J
Calculation for Energy Balance for Prototype 2
Heat Loss Due to Conduction
From all these parameters, rate of heat loss for every material is determined. Heat loss by conduction is determined by using formula J.1.
)]t (J.1)
, =
=
=
Figure J.1 Thickness of Cooking Chamber from Side View
Area of cooking chamber = x 0.375 x 0.5
= 0.589 m²
Dimension in figure J.1 is determined as below.
W=0.1325m
X=0.1335m
Y=0.1865m
Z=0.1875m

119
Table J.1 Thermal Conductivity of Aluminum and Alumina Wool
Layer Material Thermal Conductivity
1 ,3 Aluminum
2 Alumina Wool
By referring to table J.1, thermal resistance in circular material is determined as below.
=
(J.2)
Where, A= Outer diameter of material x
B= Inner diameter of material x
L= Length of object
K= Thermal conductivity of material x
Thus, by using formula J.2 thermal resistance is calculated for material used in cooking chamber.
= 100°C = 40°C
=
= 2.33x
=
= 5.32
=
= 2.36x
Next, thermal resistance of every material is added together. Total of heat loss is
obtained by dividing the temperature difference with rate of heat loss by materials shown in
formula J.3.
=
(J.3)
= Rate of heat loss in surface A
= Rate of heat loss in surface B
= Rate of heat loss in surface C
= Temperature inside the object
= Temperature outside the object
Hence,
120
=
= 9.40W ( for full circle)
Since cooking chamber is designed in half circle, thus, heat loss is divided by
=
= 4.70 W ( for half circle)
From experiment 3, to increase the water temperature to 100°C , prototype 2 need 3000s to heat it up.Assume that, wall of cooking chamber is the same as water temperature due to
thermal equilibrium.At the moment , temperature at the outside surface of cooking chamber is 50°C.Assume by average = 100°C, = 50°C. In order to obtain the
coefficient of heat loss in cooking chamber, formula J.4 is used.
) (J.4)
4.70 = )
= 0.3186 W/m².K
Thus, total of heat loss by the curved surface of cooking chamber,
)t
)(3000)
J
At the 2 of the side of cooking chamber, flat –square aluminum is used to insulate this part.By
measuring, the parameters stated as shown in figure J.2.

121
Figure J.2 Thickness of Cooking Chamber from Side View
From that coefficient of heat transfer by materials on the side of the cooking chamber is
determined by using formula J.5.
U=
(J.5)
Where, = Thickness of material
= Thermal conductivity of material
Hence
U=
U= 0.755 w/m².K
For both sides of cooking chamber, the area is calculated as below. Given radius is 0.1875m,
(
)
= 0.1104 m²
To calculate the total heat loss at the sides part of cooking chamber, formula J.1 is
used. Given that, = 100°C, = 50°C
122
)t
)(3000)
12,502.8 J
Therefore total heat loss due to conduction inside the cooking chamber is
= 14,098.05 J +12,502.8J
= 26,600.85 J
Heat loss due to radiation
To calculate the total loss due to radiation, formula 5.11 is used. Given that, = 100°C,
= 50°C , = 0.03, =(5.67 x W/m². ) =0.579 m²
= A t (J.6)
, =
=
=
=
=
=
Thus, by using formula J.6, heat loss due to radiation is determined.
= 100+273= 373K, = 40+273= 313K
= A t
=(5.67 x W/m². ) ( )
(0.579) (0.03) (3000)
= 25,032.68 J
Hence, overall total heat loss inside cooking chamber due to conduction and radiation
is evaluated by adding both the value.

123
= 25,032.68 J +26,600.85 J
= 51,633.53 J
To determine the energy balance of prototype 2, it is evaluated by using formula J.7.
= + (J.7)
, =
=
=
=
=
Hence, by using formula J.7, energy balance is evaluated.
= +
122,040 J= 57,831J+26,600.85+25,032.68+
= 12,575.47 J