
Mineral Carbonation as an Educational Investigation of Green ...
22
sustainability Concept Paper Mineral Carbonation as an Educational Investigation of Green Chemical Engineering Design Hugo Fantucci 1 , Jaspreet S. Sidhu 2 and Rafael M. Santos 1,2, * 1 School of Engineering, University of Guelph, Guelph, ON N1G 2W1, Canada 2 School of Applied Chemical and Environmental Sciences, Sheridan College Institute of Technology and Advanced Learning, Brampton, ON L6Y 5H9, Canada * Correspondence: [email protected]; Tel.: +1-519-824-4120 (Ext. 52902) Received: 7 July 2019; Accepted: 24 July 2019; Published: 1 August 2019 Abstract: Engaging students in the experimental design of “green” technology is a challenge in Chemical Engineering undergraduate programs. This concept paper demonstrates an educational methodology to investigate accelerated mineral carbonation, which is a promising technology related to mitigation of climate change by sequestering carbon dioxide (CO 2 ) from industrial sources as stable solid carbonates. An experimental investigation is conceived, whereby students test the effect of two process parameters (CO 2 pressure and mixing rate) on the extent of carbonation reaction. The carbonation reaction has been performed using a mineral called wollastonite (CaSiO 3 ). The experimental study and laboratory report cover principles of reaction kinetics and mass transfer, while illustrating the steps to develop and investigate a green process technology. The results from the experimental investigation, which is carried out by multiple teams of students, are then pooled and used to guide a subsequent design project. Students would conceive a flowsheet, size equipment, and estimate the energy demand and net CO 2 sequestration efficiency of a full-scale implementation of the mineral carbonation technology. This educational investigation aims to help undergraduate students to acquire deeper experiential learning and greater awareness of future green technologies by applying fundamental engineering principles into an engaging experimental and design exercise. Keywords: mineral carbonation; reaction kinetics; mass transfer; wollastonite; experimental investigation; process design; green chemical engineering; climate change mitigation 1. Introduction Sustainability planning requires fundamental investment on education, moving towards training students in innovative environmental technologies that they should be aware of to develop cleaner production processes, and to be capable of participating in and promoting continuous improvements in the economy, environment, and society [1]. Green Chemistry is a scientific field created as a consequence of pollution prevention initiatives, and it is based on principles that reduce waste production, promote efficient use of resources, and decrease demands on energy while improving environmental sustainability [2]. The implementation of Green Chemistry has provided many opportunities for professors to design innovative and environmentally friendly experiments as well as developing their secondary courses, to educate and guide the next generation of chemistry professionals [3,4]. This common practice of incorporating Green Chemistry into curricular activities and the design of novel experiments assists students in developing comprehensive perspectives skills, moving them beyond simple yields calculations to environmentally sustainable practices [5]. In the study of applied chemistry and chemical engineering, practical work has unquestionable importance, given its relevance for professional job preparation, and can certainly provide unique opportunities to develop investigative skills [6,7]. However, most laboratory experiments performed by Sustainability 2019, 11, 4156; doi:10.3390/su11154156 www.mdpi.com/journal/sustainability
-
Upload
khangminh22 -
Category
Documents
-
view
5 -
download
0
Transcript of Mineral Carbonation as an Educational Investigation of Green ...
sustainability
Concept Paper
Mineral Carbonation as an Educational Investigationof Green Chemical Engineering Design
Hugo Fantucci 1, Jaspreet S. Sidhu 2 and Rafael M. Santos 1,2,*1 School of Engineering, University of Guelph, Guelph, ON N1G 2W1, Canada2 School of Applied Chemical and Environmental Sciences,
Sheridan College Institute of Technology and Advanced Learning, Brampton, ON L6Y 5H9, Canada* Correspondence: [email protected]; Tel.: +1-519-824-4120 (Ext. 52902)
Received: 7 July 2019; Accepted: 24 July 2019; Published: 1 August 2019�����������������
Abstract: Engaging students in the experimental design of “green” technology is a challenge inChemical Engineering undergraduate programs. This concept paper demonstrates an educationalmethodology to investigate accelerated mineral carbonation, which is a promising technology relatedto mitigation of climate change by sequestering carbon dioxide (CO2) from industrial sources asstable solid carbonates. An experimental investigation is conceived, whereby students test theeffect of two process parameters (CO2 pressure and mixing rate) on the extent of carbonationreaction. The carbonation reaction has been performed using a mineral called wollastonite (CaSiO3).The experimental study and laboratory report cover principles of reaction kinetics and mass transfer,while illustrating the steps to develop and investigate a green process technology. The results fromthe experimental investigation, which is carried out by multiple teams of students, are then pooledand used to guide a subsequent design project. Students would conceive a flowsheet, size equipment,and estimate the energy demand and net CO2 sequestration efficiency of a full-scale implementationof the mineral carbonation technology. This educational investigation aims to help undergraduatestudents to acquire deeper experiential learning and greater awareness of future green technologiesby applying fundamental engineering principles into an engaging experimental and design exercise.
Keywords: mineral carbonation; reaction kinetics; mass transfer; wollastonite; experimentalinvestigation; process design; green chemical engineering; climate change mitigation
1. Introduction
Sustainability planning requires fundamental investment on education, moving towards trainingstudents in innovative environmental technologies that they should be aware of to develop cleanerproduction processes, and to be capable of participating in and promoting continuous improvementsin the economy, environment, and society [1]. Green Chemistry is a scientific field created asa consequence of pollution prevention initiatives, and it is based on principles that reduce wasteproduction, promote efficient use of resources, and decrease demands on energy while improvingenvironmental sustainability [2]. The implementation of Green Chemistry has provided manyopportunities for professors to design innovative and environmentally friendly experiments aswell as developing their secondary courses, to educate and guide the next generation of chemistryprofessionals [3,4]. This common practice of incorporating Green Chemistry into curricular activitiesand the design of novel experiments assists students in developing comprehensive perspectives skills,moving them beyond simple yields calculations to environmentally sustainable practices [5].
In the study of applied chemistry and chemical engineering, practical work has unquestionableimportance, given its relevance for professional job preparation, and can certainly provide uniqueopportunities to develop investigative skills [6,7]. However, most laboratory experiments performed by
Sustainability 2019, 11, 4156; doi:10.3390/su11154156 www.mdpi.com/journal/sustainability
Sustainability 2019, 11, 4156 2 of 22
students in undergraduate programs (at universities, polytechnic institutes, and colleges) are based onwell-established reactions and physical phenomena that were originally developed based on industrialpractices that are now decades old. The lack of coherent learning objectives and the observed studentisolation in laboratories could cause to disengage them from the learning process [8]. Although facultymembers have decreased student isolation over the years, assigning students to work in collaborativeteams is more effective [8].
In the authors’ experiences as teachers and students, it is noticed that many laboratory experimentsand design projects used in coursework (apart from capstone projects) are disconnected from oneanother, and students often perform identical experiments to other students or are not allowed orencouraged to share data. This results in students not having the opportunity to further utilize andbuild on the experimental data they produce, and the experimental dataset the class produces. Time (i.e.,experiment duration), the high cost of laboratory equipment, and, in some cases, excessive proceduralcomplexity, represent constraints to explore innovative ideas and collaborative and progressive workin the educational setting.
It is the authors’ conception that students are more likely to feel engaged in this experientiallearning when they can see the importance of what they are required to do, be it a skill that theythink they will use in the future, or knowledge they will gain about real-world issues and solutionsfor them. Martínez and Campos [9] discuss how the level of accomplishment between students isdirectly linked to the commitment level they demonstrate, which is reflected by how they addresstheir inquiry questions and the quality of the concept studied before starting the experimental activity,also improving the scientific thinking ability.
There are plenty of Green Chemistry and sustainable technology topics that are or have recentlystarted finding their way into real-world implementation [10,11]. Carbon sequestration is one of themain strategies available for climate change mitigation via reduction of greenhouse gas emissions,and among the many options for carbon sequestration, mineral carbonation is one that has a potentialto sequester significant amounts of carbon dioxide (CO2) [12–16]. This technology has a high potentialto capture and safely store massive amounts of CO2 to mitigate the increase of the atmosphericconcentration, which has risen from around 280 ppm, at the beginning of the industrial revolution,to over 410 ppm, according to National Oceanic and Atmospheric Administration [17] and TheInternational Panel for Climate Change [18].
Mineral carbonation is the reaction between CO2 and alkaline minerals (i.e., those that containalkaline earth elements) that produce geologically stable carbonate minerals, such as calcite (CaCO3),dolomite (CaMg(CO3)2), magnesite (MgCO3), and, in some cases, even siderite (FeCO3) [12,13].Alkaline minerals come in different varieties: they include mafic and ultramafic igneous rocks, such asbasalt, wollastonite, olivine, and serpentine, but also solid residues from the steelmaking industry,waste incineration, and building demolition, such as slags, ashes, or asbestos [19–22].
Mineral carbonation is a challenging theme to demonstrate to students because the chemicalreaction at ambient conditions, also referred by geologists as “weathering”, proceeds extremely slowlyover a geological time scale, consequently demanding accelerated process conditions for experimentalanalysis. This also relates to the need for accelerated carbonation for industrial implementation.To mitigate anthropogenic CO2 emissions, the reaction must be sped up to the point where CO2
can be fixated at the same rate that it is generated in the burning of fossil fuels (or calcination oflimestone), to create an economically and environmentally sustainable process. Still, after many yearsof research and development, mineral carbonation is beginning to be implemented at the industrialscale. Examples of companies around the world using mineral carbonation, primarily to producebuilding materials, include CarbonCure Technologies in Canada [23]; Carbon8 Systems in the UnitedKingdom [24]; Mineral Carbonation International in Australia [25]; Solidia Technologies in the UnitedStates [26].
Sustainability 2019, 11, 4156 3 of 22
Aims and Objectives
Given its strong link to concepts of sustainability and Green Chemistry and process requirementsthat apply principles of reaction kinetics, transport phenomena, and materials characterization,the present work aimed to find a way for accelerated mineral carbonation to earn a place in chemicalengineering curricula. To this end, an experimental investigation laboratory procedure and a designproject outline were conceived and applied (for the first time in Summer 2017) in the ChemicalEngineering Technologist Advanced Diploma program at the Sheridan College Institute of Technologyand Advanced Learning. As a way to further engage students in this learning experience, the processconditions for the laboratory work were varied between groups of students, and the experimental dataobtained were pooled to be used by every group for the subsequent design exercise. This was meantto give students motivation to generate accurate data that they knew would be useful for the entireclass and, at the same time, provide students with the opportunity to use data generated by colleagues,much in the same way the design work is done in the industry.
The experimental investigation and design project, herein presented, are suitable forimplementation in upper-year undergraduate (Bachelor or Advanced Diploma) engineering andengineering technology programs, and also for graduate courses at the Master’s level. For example,in 3rd or 4th year of University undergraduate degrees and 3rd year of College diplomas in NorthAmerica, or the 3rd, 4th, or 5th years of higher education programs in countries that follow the BolognaAccord (i.e., Europe).
The ultimate objective was to better train chemical engineering students given their future careers.Graduates with experience in mineral carbonation investigation and design would potentially be bettertrained to develop engineering solutions that take into account sustainability criteria. Also, havinggone through a memorable undergraduate exercise in mineral carbonation investigation and designwould potentially reinforce learned concepts of chemical engineering fundamentals, and make it morelikely that graduate would recall those fundamental concepts in their future careers.
Section 2, 3, 4, and 5.1 of this concept paper, along with the two Supplementary Materials files,present the information that was provided to students in their laboratory investigation procedure anddesign project outline. Section 2 gives the background of the mineral carbonation process, which helpsstudents to become familiar with the subject and to see links with fundamental concepts they learned inthe classroom, including in previous classes. Section 3 and Supplementary_Material_1 provide studentswith the knowledge and step-by-step instructions on how to perform the experimental investigation.Section 4 details the calculations required to process the experimental data, and additional questionsstudents must answer related to the investigation and the subject matter to interpret and explainthe achieved results. Section 5.1 and Supplementary_Material_2 provide students guidance on thedesign project (to be implemented in a future course), both in terms of requirements and a generalprocedure (allowing student some freedom on how they set-up and analyze their design). In Section 5,the experience with running the experimental investigation at Sheridan College is discussed, and,in Section 6, conclusions are offered.
2. Experimental Investigation Part A: Background of Mineral Carbonation
Fundamentally, mineral carbonation occurs when carbon dioxide reacts with metal oxides ornatural alkaline silicates (containing calcium or magnesium). The corresponding carbonate is formed,releasing heat, according to the following chemical reaction (Equation (1)), where M representsa divalent metal [27]:
MO +CO2→MCO3 + heat (1)
Silicates rocks are available in vast amounts worldwide and represent the ideal material formineral carbonation. Often used minerals include olivine ((Mg,Fe)SiO4) [28], forsterite (Mg2SiO4) [29],serpentine (Mg3Si2O5(OH)4) [30], and wollastonite (CaSiO3) [31]. Several industrial residues (such ascombustion/incineration ashes, mining tailings, and metallurgical slags) also contain alkaline silicates,
Sustainability 2019, 11, 4156 4 of 22
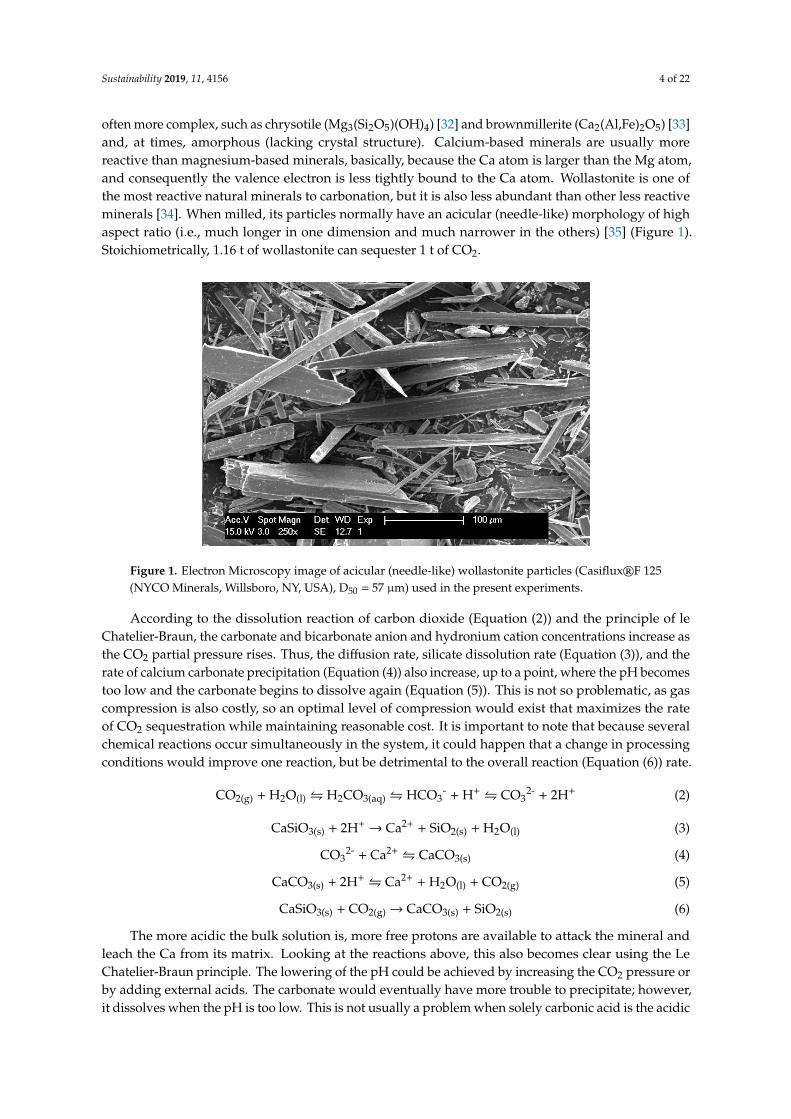
often more complex, such as chrysotile (Mg3(Si2O5)(OH)4) [32] and brownmillerite (Ca2(Al,Fe)2O5) [33]and, at times, amorphous (lacking crystal structure). Calcium-based minerals are usually morereactive than magnesium-based minerals, basically, because the Ca atom is larger than the Mg atom,and consequently the valence electron is less tightly bound to the Ca atom. Wollastonite is one ofthe most reactive natural minerals to carbonation, but it is also less abundant than other less reactiveminerals [34]. When milled, its particles normally have an acicular (needle-like) morphology of highaspect ratio (i.e., much longer in one dimension and much narrower in the others) [35] (Figure 1).Stoichiometrically, 1.16 t of wollastonite can sequester 1 t of CO2.
Sustainability 2019, 11, x FOR PEER REVIEW 4 of 22
the Mg atom, and consequently the valence electron is less tightly bound to the Ca atom. Wollastonite 144
is one of the most reactive natural minerals to carbonation, but it is also less abundant than other less 145 reactive minerals [34]. When milled, its particles normally have an acicular (needle-like) morphology 146 of high aspect ratio (i.e., much longer in one dimension and much narrower in the others) [35] (Figure 147 1). Stoichiometrically, 1.16 t of wollastonite can sequester 1 t of CO2. 148
149
Figure 1. Electron Microscopy image of acicular (needle-like) wollastonite particles (Casiflux® F 125 150 (NYCO Minerals, Willsboro, NY, USA), D50 = 57 µm) used in the present experiments. 151
According to the dissolution reaction of carbon dioxide (Equation (2)) and the principle of le 152 Chatelier-Braun, the carbonate and bicarbonate anion and hydronium cation concentrations increase 153 as the CO2 partial pressure rises. Thus, the diffusion rate, silicate dissolution rate (Equation (3)), and 154 the rate of calcium carbonate precipitation (Equation (4)) also increase, up to a point, where the pH 155 becomes too low and the carbonate begins to dissolve again (Equation (5)). This is not so problematic, 156
as gas compression is also costly, so an optimal level of compression would exist that maximizes the 157 rate of CO2 sequestration while maintaining reasonable cost. It is important to note that because 158 several chemical reactions occur simultaneously in the system, it could happen that a change in 159 processing conditions would improve one reaction, but be detrimental to the overall reaction 160 (Equation (6)) rate. 161
CO2(g) + H2O(l) ⇋ H2CO3(aq) ⇋ HCO3– + H+ ⇋ CO32– + 2H+ (2)
CaSiO3(s) + 2H+ → Ca2+ + SiO2(s) + H2O(l) (3)
CO32– + Ca2+ ⇋ CaCO3(s) (4)
CaCO3(s) + 2H+ ⇋ Ca2+ + H2O(l) + CO2(g) (5)
CaSiO3(s) + CO2(g) → CaCO3(s) + SiO2(s) (6)
The more acidic the bulk solution is, more free protons are available to attack the mineral and 162 leach the Ca from its matrix. Looking at the reactions above, this also becomes clear using the Le 163 Chatelier-Braun principle. The lowering of the pH could be achieved by increasing the CO2 pressure 164 or by adding external acids. The carbonate would eventually have more trouble to precipitate; 165
however, it dissolves when the pH is too low. This is not usually a problem when solely carbonic acid 166 is the acidic species since the dissolution of the silicate (Equation (3)) consumes the acid formed 167 (Equation (2)). Daval et al. [36] reported that, with pCO2 = 250 bar and T= 90 °C, the equilibrium pH 168 of an aqueous solution of CO2 was 3.07, but increased to 4.61 in the presence of carbonating 169
wollastonite. 170 Because the mineral carbonation reaction (illustrated in Figure 2 for steelmaking slag) proceeds by 171 the diffusion of carbonate anions into a solid mineral matrix, it is imperative that a high surface-to-172 volume ratio is created by first crushing the mined ore and subsequently milling the particles to a 173
Figure 1. Electron Microscopy image of acicular (needle-like) wollastonite particles (Casiflux®F 125(NYCO Minerals, Willsboro, NY, USA), D50 = 57 µm) used in the present experiments.
According to the dissolution reaction of carbon dioxide (Equation (2)) and the principle of leChatelier-Braun, the carbonate and bicarbonate anion and hydronium cation concentrations increase asthe CO2 partial pressure rises. Thus, the diffusion rate, silicate dissolution rate (Equation (3)), and therate of calcium carbonate precipitation (Equation (4)) also increase, up to a point, where the pH becomestoo low and the carbonate begins to dissolve again (Equation (5)). This is not so problematic, as gascompression is also costly, so an optimal level of compression would exist that maximizes the rateof CO2 sequestration while maintaining reasonable cost. It is important to note that because severalchemical reactions occur simultaneously in the system, it could happen that a change in processingconditions would improve one reaction, but be detrimental to the overall reaction (Equation (6)) rate.
CO2(g) + H2O(l) � H2CO3(aq) � HCO3- + H+� CO3
2- + 2H+ (2)
CaSiO3(s) + 2H+→ Ca2+ + SiO2(s) + H2O(l) (3)
CO32- + Ca2+� CaCO3(s) (4)
CaCO3(s) + 2H+� Ca2+ + H2O(l) + CO2(g) (5)
CaSiO3(s) + CO2(g)→ CaCO3(s) + SiO2(s) (6)
The more acidic the bulk solution is, more free protons are available to attack the mineral andleach the Ca from its matrix. Looking at the reactions above, this also becomes clear using the LeChatelier-Braun principle. The lowering of the pH could be achieved by increasing the CO2 pressure orby adding external acids. The carbonate would eventually have more trouble to precipitate; however,it dissolves when the pH is too low. This is not usually a problem when solely carbonic acid is the acidic
Sustainability 2019, 11, 4156 5 of 22
species since the dissolution of the silicate (Equation (3)) consumes the acid formed (Equation (2)).Daval et al. [36] reported that, with pCO2 = 250 bar and T= 90 ◦C, the equilibrium pH of an aqueoussolution of CO2 was 3.07, but increased to 4.61 in the presence of carbonating wollastonite.
Because the mineral carbonation reaction (illustrated in Figure 2 for steelmaking slag) proceedsby the diffusion of carbonate anions into a solid mineral matrix, it is imperative that a highsurface-to-volume ratio is created by first crushing the mined ore and subsequently milling theparticles to a specified particle size [37–39]. To further improve the overall reaction rate, aside fromreducing the particle size and increasing the CO2 pressure, another strategy is to introduce chemicaladditives to the aqueous phase. These additives could help to increase the CO2 solubility and carbonicacid dissociation (by shifting Equation (2) equilibrium), increase the mineral dissolution rate (byshifting Equation (3) equilibrium), or reduce the acidification (to avoid the reaction of Equation (5)).Chemicals, such as NaOH, NaHCO3, NH4Cl, and acetic acid, have been used for these purposes [40].Additives do pose challenges; however, they can be costly and need to be separated and regenerated tobe recycled.
Sustainability 2019, 11, x FOR PEER REVIEW 5 of 22
specified particle size [37–39]. To further improve the overall reaction rate, aside from reducing the 174
particle size and increasing the CO2 pressure, another strategy is to introduce chemical additives to 175 the aqueous phase. These additives could help to increase the CO2 solubility and carbonic acid 176 dissociation (by shifting Equation (2) equilibrium), increase the mineral dissolution rate (by shifting 177 Equation (3) equilibrium), or reduce the acidification (to avoid the reaction of Equation (5)). 178
Chemicals, such as NaOH, NaHCO3, NH4Cl, and acetic acid, have been used for these purposes [40]. 179 Additives do pose challenges; however, they can be costly and need to be separated and regenerated 180 to be recycled. 181
182
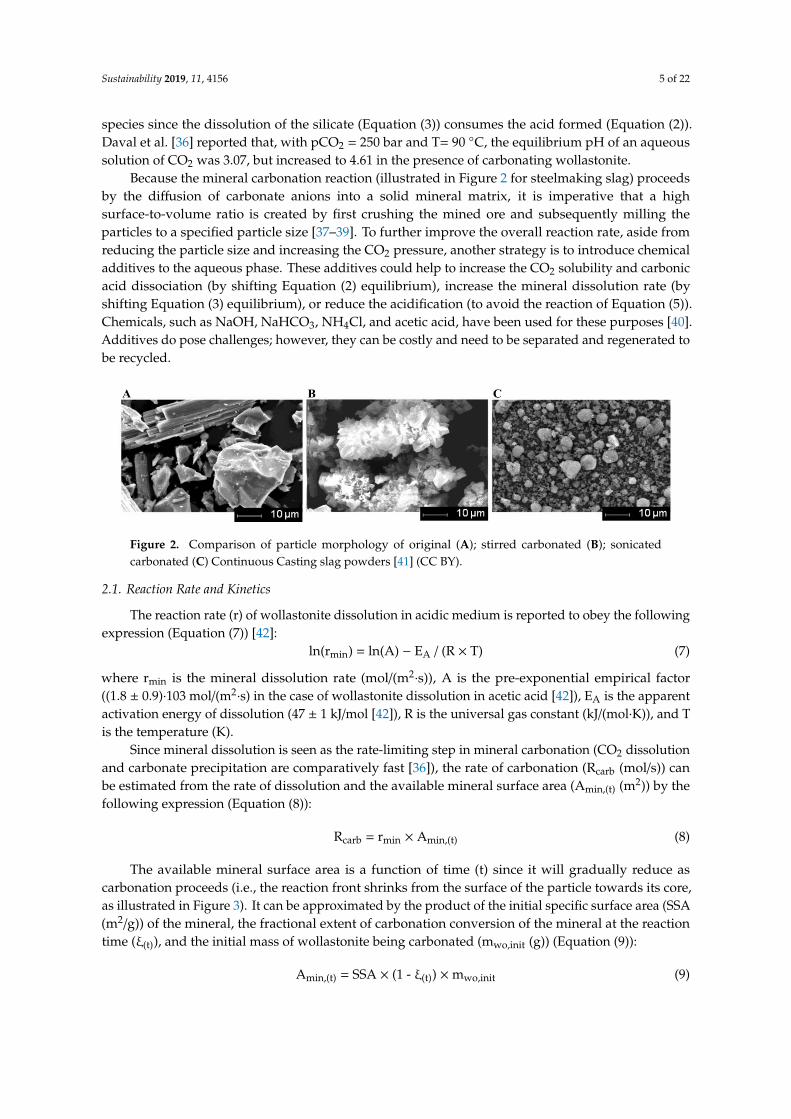
Figure 2. Comparison of particle morphology of original (A); stirred carbonated (B); sonicated 183 carbonated (C) Continuous Casting slag powders [41] (CC BY). 184
2.1. Reaction Rate and Kinetics 185
The reaction rate (r) of wollastonite dissolution in acidic medium is reported to obey the 186 following expression (Equation (7)) [42]: 187
ln(rmin) = ln(A) − EA / (R × T) (7)
where rmin is the mineral dissolution rate (mol/(m2∙s)), A is the pre-exponential empirical factor ((1.8 188
± 0.9)∙103 mol/(m2∙s) in the case of wollastonite dissolution in acetic acid [42]), EA is the apparent 189 activation energy of dissolution (47 ± 1 kJ/mol [42]), R is the universal gas constant (kJ/(mol∙K)), and 190 T is the temperature (K). 191
Since mineral dissolution is seen as the rate-limiting step in mineral carbonation (CO2 192
dissolution and carbonate precipitation are comparatively fast [36]), the rate of carbonation (Rcarb 193 (mol/s)) can be estimated from the rate of dissolution and the available mineral surface area (Amin,(t) 194 (m2)) by the following expression (Equation (8)): 195
Rcarb = rmin × Amin,(t) (8)
The available mineral surface area is a function of time (t) since it will gradually reduce as 196 carbonation proceeds (i.e., the reaction front shrinks from the surface of the particle towards its core, 197 as illustrated in Figure 3). It can be approximated by the product of the initial specific surface area 198
(SSA (m2/g)) of the mineral, the fractional extent of carbonation conversion of the mineral at the 199 reaction time (ξ(t)), and the initial mass of wollastonite being carbonated (mwo,init (g)) (Equation (9)): 200
Amin,(t) = SSA × (1 – ξ(t)) × mwo,init (9)
Figure 2. Comparison of particle morphology of original (A); stirred carbonated (B); sonicatedcarbonated (C) Continuous Casting slag powders [41] (CC BY).
2.1. Reaction Rate and Kinetics
The reaction rate (r) of wollastonite dissolution in acidic medium is reported to obey the followingexpression (Equation (7)) [42]:
ln(rmin) = ln(A) − EA / (R × T) (7)
where rmin is the mineral dissolution rate (mol/(m2·s)), A is the pre-exponential empirical factor
((1.8 ± 0.9)·103 mol/(m2·s) in the case of wollastonite dissolution in acetic acid [42]), EA is the apparent
activation energy of dissolution (47 ± 1 kJ/mol [42]), R is the universal gas constant (kJ/(mol·K)), and Tis the temperature (K).
Since mineral dissolution is seen as the rate-limiting step in mineral carbonation (CO2 dissolutionand carbonate precipitation are comparatively fast [36]), the rate of carbonation (Rcarb (mol/s)) canbe estimated from the rate of dissolution and the available mineral surface area (Amin,(t) (m2)) by thefollowing expression (Equation (8)):
Rcarb = rmin × Amin,(t) (8)
The available mineral surface area is a function of time (t) since it will gradually reduce ascarbonation proceeds (i.e., the reaction front shrinks from the surface of the particle towards its core,as illustrated in Figure 3). It can be approximated by the product of the initial specific surface area (SSA(m2/g)) of the mineral, the fractional extent of carbonation conversion of the mineral at the reactiontime (ξ(t)), and the initial mass of wollastonite being carbonated (mwo,init (g)) (Equation (9)):
Amin,(t) = SSA × (1 - ξ(t)) ×mwo,init (9)

Sustainability 2019, 11, 4156 6 of 22
Sustainability 2019, 11, x FOR PEER REVIEW 6 of 22
201
Figure 3. Illustration of the partially carbonated mineral particle, according to shrinking core model 202 [43], where rx is the original particle radius, R is the radius of the unreacted core of the particle, and 203 tcarb is the thickness of the carbonated shell. Re-used with permission from John Wiley and Sons 204 (4592190232399). 205
The fractional extent of carbonation conversion of the mineral at the reaction time is the ratio of 206
the number of mols of calcium that have become CaCO3 at the reaction time (nCaCO3,(t)) over the total 207 number of mols of calcium in the wollastonite being carbonated (nwo,init), according to Equation (10): 208
ξ(t) = nCaCO3,(t) / nwo,init (10)
2.1.1. Reacted Particle Morphology 209
When wollastonite carbonates, two solid products form: calcium carbonate (typically as the 210 calcite polymorph) and amorphous silica. The behavior of these two product phases, in terms of 211
where they end up, differs. Daval et al. [44] observed that at the micrometer-scale, wollastonite 212 replacement occurred pseudomorphically: the acicular shape of the wollastonite grains was 213 preserved, as the silica product remained in the place where wollastonite originally existed. Thus, in 214 each particle, the silica layer remains adjacent to the unaltered wollastonite core. Daval et al. [44] 215 postulated that the pseudomorphic texture implied an intrinsic silica precipitation rate much greater 216
than the dissolution reaction. As a result, silica product that detaches from the reacting wollastonite 217 interface is immediately reprecipitated by the silica layer-wollastonite core interfacial region, thus 218 preserving the original particle morphology. 219
In cases where the wollastonite particle contains secondary phases (such as diopside 220 (MgCaSi2O6), this phase may further slow the carbonation reaction, especially if it is inert to 221
carbonation, or has much slower carbonation kinetics (which tends to be true for magnesium-based 222 silicates). Depending on the degree of mixing of wollastonite with diopside, the diopside may appear 223 as separate grains upon milling, or as micro-crystals within the wollastonite matrix [34]. In the former 224 case, its effect on carbonation kinetics of wollastonite should be minimal, but in the latter, where it 225 would accumulate in the calcium-depleted layer surrounding the unreacted core, it could have a 226
significant effect in hindering ion diffusion. 227
2.2. Effects of Process Parameters 228
2.2.1. Temperature and CO2 Pressure 229
Temperature is an important process parameter that can be adjusted to improve the overall rate 230
of reaction. There are two phenomena that are dependent on temperature: (i) the solubility of carbon 231 dioxide, which decreases with higher temperatures, and this results in a higher pH, which is 232
Figure 3. Illustration of the partially carbonated mineral particle, according to shrinking core model [43],where rx is the original particle radius, R is the radius of the unreacted core of the particle, and tcarb is thethickness of the carbonated shell. Re-used with permission from John Wiley and Sons (4592190232399).
The fractional extent of carbonation conversion of the mineral at the reaction time is the ratio ofthe number of mols of calcium that have become CaCO3 at the reaction time (nCaCO3,(t)) over the totalnumber of mols of calcium in the wollastonite being carbonated (nwo,init), according to Equation (10):
ξ(t) = nCaCO3,(t) / nwo,init (10)
Reacted Particle Morphology
When wollastonite carbonates, two solid products form: calcium carbonate (typically as the calcitepolymorph) and amorphous silica. The behavior of these two product phases, in terms of wherethey end up, differs. Daval et al. [44] observed that at the micrometer-scale, wollastonite replacementoccurred pseudomorphically: the acicular shape of the wollastonite grains was preserved, as thesilica product remained in the place where wollastonite originally existed. Thus, in each particle,the silica layer remains adjacent to the unaltered wollastonite core. Daval et al. [44] postulated that thepseudomorphic texture implied an intrinsic silica precipitation rate much greater than the dissolutionreaction. As a result, silica product that detaches from the reacting wollastonite interface is immediatelyreprecipitated by the silica layer-wollastonite core interfacial region, thus preserving the originalparticle morphology.
In cases where the wollastonite particle contains secondary phases (such as diopside (MgCaSi2O6),this phase may further slow the carbonation reaction, especially if it is inert to carbonation, or hasmuch slower carbonation kinetics (which tends to be true for magnesium-based silicates). Dependingon the degree of mixing of wollastonite with diopside, the diopside may appear as separate grainsupon milling, or as micro-crystals within the wollastonite matrix [34]. In the former case, its effect oncarbonation kinetics of wollastonite should be minimal, but in the latter, where it would accumulatein the calcium-depleted layer surrounding the unreacted core, it could have a significant effect inhindering ion diffusion.
2.2. Effects of Process Parameters
2.2.1. Temperature and CO2 Pressure
Temperature is an important process parameter that can be adjusted to improve the overallrate of reaction. There are two phenomena that are dependent on temperature: (i) the solubility of

Sustainability 2019, 11, 4156 7 of 22
carbon dioxide, which decreases with higher temperatures, and this results in a higher pH, which isdetrimental for the mineral dissolution rate; (ii) the dissolution rate of silicate minerals, which, on theother hand, increases with higher temperatures.
Because of the opposite direction of these two concurrent effects, an optimum temperature existsfor the carbonation of each mineral. In the case of wollastonite, it has been reported that the processshould be conducted below 200 ◦C [45], depending on the CO2 pressure [46]. The higher the pressure,the higher the optimum temperatures would be.
2.2.2. Agitation
CO2 in the gas phase is transported across a gas-liquid interface, as it dissolves from the headspaceinto the slurry below. The mechanism of calcium ions reaction is less clear; there are two scenarios.In one scenario, calcium ions move as ions from the surface of the solid particles to the liquid phaseand then react with carbonate ions to precipitate as calcium carbonate crystals. Another scenario isthat calcium ions precipitate at the surface of particles, where they meet the carbonate coming from theliquid phase, and later calcium carbonate crystals are dislodged from the surface due to agitation [47].
Mass transfer can be improved in the liquid phase, to aid in CO2 dissolution and calcium carbonatecrystallization, by agitation. Agitation improves the convective mass transfer mechanism, which ismore important than diffusion in the liquid phase [48]. Convection enhances mass transfer acrossinterfaces by reducing the thickness of boundary layers (the region near an interface where ionsaccumulate), thus increasing the driving force: the concentration difference. Ideally, for ions to leachout from a solid surface, the concentration of that ion in the liquid phase, at the interface, should be asclose to zero as possible, which is possible in a system where the ion later precipitates in the liquid [49].
2.3. Determination of the Reaction Extent
As wollastonite (and any other calcium- or magnesium-rich mineral) reacts with CO2,solid carbonates form. These carbonates can be Ca-carbonates, Mg-carbonates, and a variety ofCa-Mg-carbonates [50]. The most common Ca-carbonate is CaCO3, referred to as calcium carbonate,which forms under a range of process conditions. Calcium carbonate is particularly special as it canhave three polymorphs: calcite, aragonite, and vaterite. All have the same chemical composition,but different crystal structures (and consequently particle morphologies). A less common Ca-carbonatewould be monohydrocalcite (CaCO3·H2O). When magnesium is also present in appreciable quantitiesin the mineral ore, calcium can co-precipitate with magnesium to form Mg-rich carbonates, such ashuntite (Mg3Ca(CO3)4), and Ca-rich carbonates, such as magnesian-calcite (Mg0–0.15Ca0.85–1CO3).Finally, when Mg-carbonates are the predominant carbonation products, possible forms includeanhydrous MgCO3 (magnesite), its hydrated form as nesquehonite (MgCO3·3H2O), among others.
For CO2 sequestration by wollastonite, and for kinetics and mass transfer determinations,the principal need is to determine the total amount of CO2 bound in mineral form. Also, given thechemical composition of wollastonite ore, it can be assumed that CaCO3 is the predominant carbonateproduct. Thus, how does one determine the amount of CaCO3 in a solid sample? Four commonapproaches are briefly described next. In addition to these, other more specialized techniques exist thatcan identify and/or quantify the presence of carbonates. Some are standalone techniques, and others areused in combination with other techniques; examples include: Energy Dispersive Spectrometry (candetect elemental carbon and its spatial association with other elements), Fourier Transform Infrared(can detect chemical bonding of carbonates in solid phase, and CO2 in gas phase), Mass Spectrometry(can detect CO2 in gas phase), Total Carbon Analyzers (can determine total carbon, total organic carbon,and total inorganic carbon contents), among others.
2.3.1. X-ray Diffraction (XRD)
The most direct method of detection is by X-ray Diffraction (XRD) analysis. This is a techniquethat determines the distance between atoms in a crystal, thus allowing precise determination of the
Sustainability 2019, 11, 4156 8 of 22
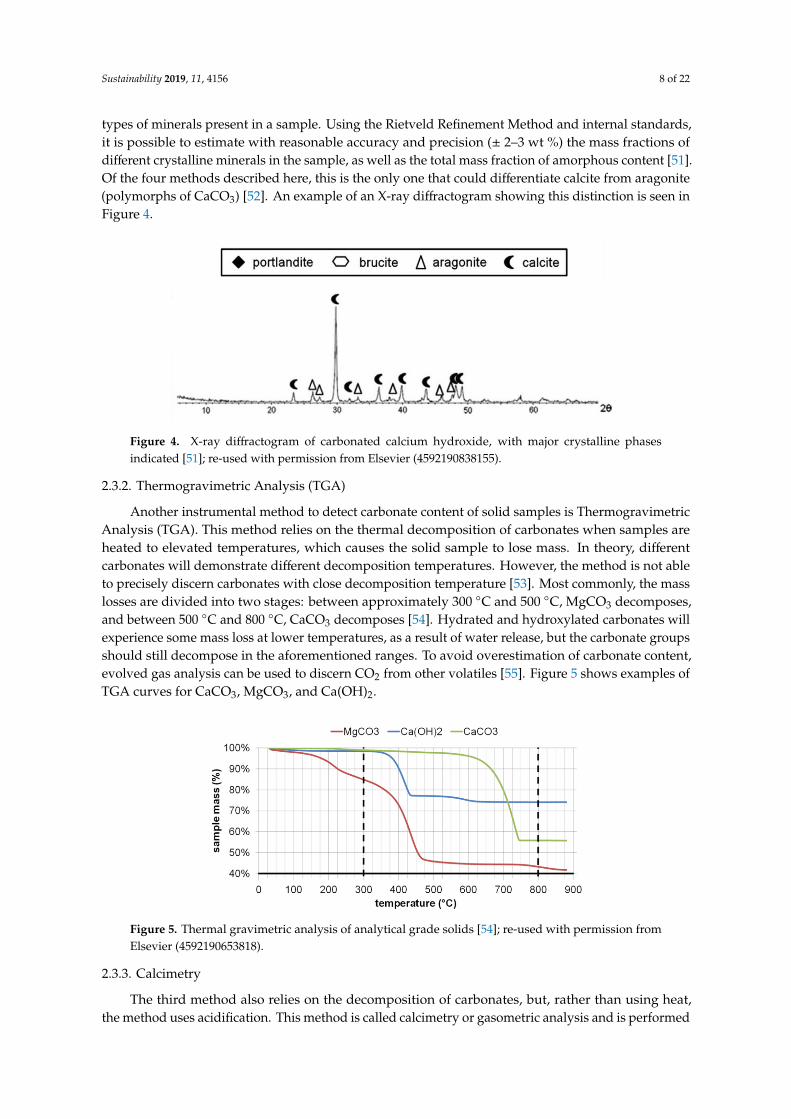
types of minerals present in a sample. Using the Rietveld Refinement Method and internal standards,it is possible to estimate with reasonable accuracy and precision (± 2–3 wt %) the mass fractions ofdifferent crystalline minerals in the sample, as well as the total mass fraction of amorphous content [51].Of the four methods described here, this is the only one that could differentiate calcite from aragonite(polymorphs of CaCO3) [52]. An example of an X-ray diffractogram showing this distinction is seen inFigure 4.
Sustainability 2019, 11, x FOR PEER REVIEW 8 of 22
types of minerals present in a sample. Using the Rietveld Refinement Method and internal standards, 281
it is possible to estimate with reasonable accuracy and precision (± 2–3 wt %) the mass fractions of 282 different crystalline minerals in the sample, as well as the total mass fraction of amorphous content 283 [51]. Of the four methods described here, this is the only one that could differentiate calcite from 284 aragonite (polymorphs of CaCO3) [52]. An example of an X-ray diffractogram showing this 285
distinction is seen in Figure 4. 286
287
Figure 4. X-ray diffractogram of carbonated calcium hydroxide, with major crystalline phases 288 indicated [51]; re-used with permission from Elsevier (4592190838155). 289
2.3.2. Thermogravimetric analysis (TGA) 290
Another instrumental method to detect carbonate content of solid samples is Thermogravimetric 291 Analysis (TGA). This method relies on the thermal decomposition of carbonates when samples are 292 heated to elevated temperatures, which causes the solid sample to lose mass. In theory, different 293 carbonates will demonstrate different decomposition temperatures. However, the method is not able 294
to precisely discern carbonates with close decomposition temperature [53]. Most commonly, the mass 295 losses are divided into two stages: between approximately 300 °C and 500 °C, MgCO3 decomposes, 296 and between 500 °C and 800 °C, CaCO3 decomposes [54]. Hydrated and hydroxylated carbonates will 297 experience some mass loss at lower temperatures, as a result of water release, but the carbonate 298 groups should still decompose in the aforementioned ranges. To avoid overestimation of carbonate 299
content, evolved gas analysis can be used to discern CO2 from other volatiles [55]. Figure 5 shows 300 examples of TGA curves for CaCO3, MgCO3, and Ca(OH)2. 301
302
Figure 5. Thermal gravimetric analysis of analytical grade solids [54]; re-used with permission from 303 Elsevier (4592190653818). 304
2.3.3. Calcimetry 305
The third method also relies on the decomposition of carbonates, but, rather than using heat, the 306 method uses acidification. This method is called calcimetry or gasometric analysis and is performed 307 using a calcimeter. The working principle is based on Equation (5); when a carbonate is exposed to a 308
Figure 4. X-ray diffractogram of carbonated calcium hydroxide, with major crystalline phasesindicated [51]; re-used with permission from Elsevier (4592190838155).
2.3.2. Thermogravimetric Analysis (TGA)
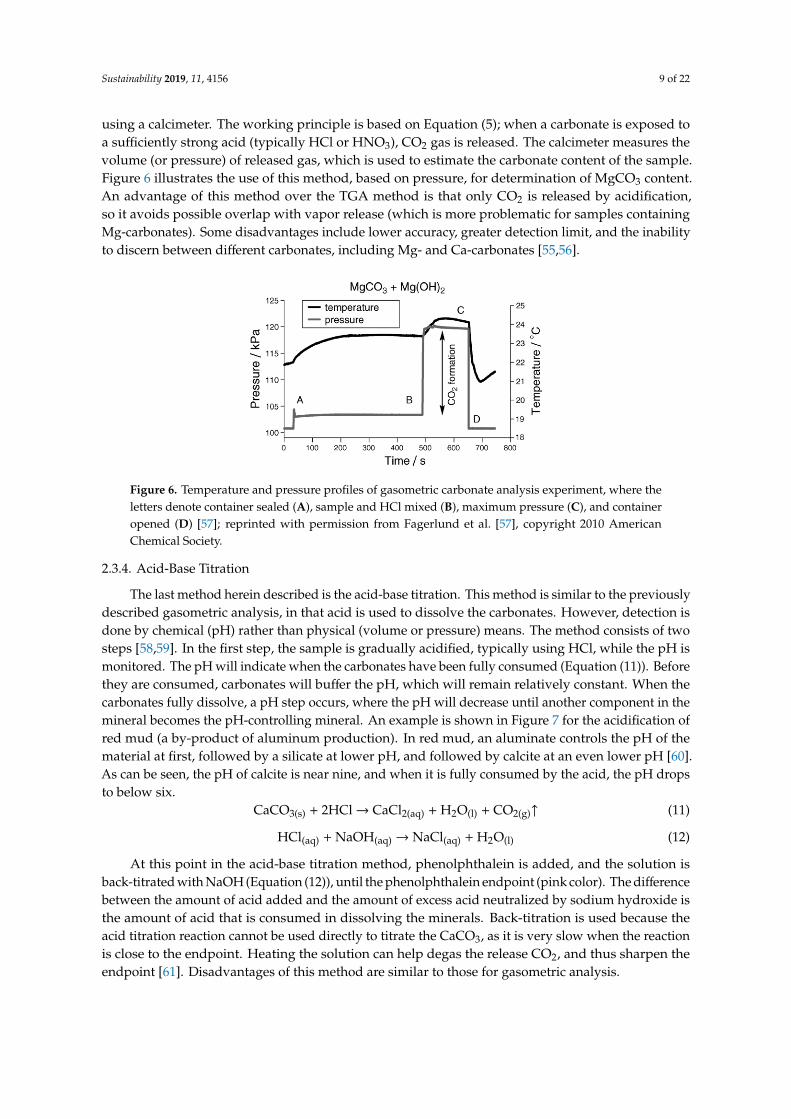
Another instrumental method to detect carbonate content of solid samples is ThermogravimetricAnalysis (TGA). This method relies on the thermal decomposition of carbonates when samples areheated to elevated temperatures, which causes the solid sample to lose mass. In theory, differentcarbonates will demonstrate different decomposition temperatures. However, the method is not ableto precisely discern carbonates with close decomposition temperature [53]. Most commonly, the masslosses are divided into two stages: between approximately 300 ◦C and 500 ◦C, MgCO3 decomposes,and between 500 ◦C and 800 ◦C, CaCO3 decomposes [54]. Hydrated and hydroxylated carbonates willexperience some mass loss at lower temperatures, as a result of water release, but the carbonate groupsshould still decompose in the aforementioned ranges. To avoid overestimation of carbonate content,evolved gas analysis can be used to discern CO2 from other volatiles [55]. Figure 5 shows examples ofTGA curves for CaCO3, MgCO3, and Ca(OH)2.
Sustainability 2019, 11, x FOR PEER REVIEW 8 of 22
types of minerals present in a sample. Using the Rietveld Refinement Method and internal standards, 281
it is possible to estimate with reasonable accuracy and precision (± 2–3 wt %) the mass fractions of 282 different crystalline minerals in the sample, as well as the total mass fraction of amorphous content 283 [51]. Of the four methods described here, this is the only one that could differentiate calcite from 284 aragonite (polymorphs of CaCO3) [52]. An example of an X-ray diffractogram showing this 285
distinction is seen in Figure 4. 286
287
Figure 4. X-ray diffractogram of carbonated calcium hydroxide, with major crystalline phases 288 indicated [51]; re-used with permission from Elsevier (4592190838155). 289
2.3.2. Thermogravimetric analysis (TGA) 290
Another instrumental method to detect carbonate content of solid samples is Thermogravimetric 291 Analysis (TGA). This method relies on the thermal decomposition of carbonates when samples are 292 heated to elevated temperatures, which causes the solid sample to lose mass. In theory, different 293 carbonates will demonstrate different decomposition temperatures. However, the method is not able 294
to precisely discern carbonates with close decomposition temperature [53]. Most commonly, the mass 295 losses are divided into two stages: between approximately 300 °C and 500 °C, MgCO3 decomposes, 296 and between 500 °C and 800 °C, CaCO3 decomposes [54]. Hydrated and hydroxylated carbonates will 297 experience some mass loss at lower temperatures, as a result of water release, but the carbonate 298 groups should still decompose in the aforementioned ranges. To avoid overestimation of carbonate 299
content, evolved gas analysis can be used to discern CO2 from other volatiles [55]. Figure 5 shows 300 examples of TGA curves for CaCO3, MgCO3, and Ca(OH)2. 301
302
Figure 5. Thermal gravimetric analysis of analytical grade solids [54]; re-used with permission from 303 Elsevier (4592190653818). 304
2.3.3. Calcimetry 305
The third method also relies on the decomposition of carbonates, but, rather than using heat, the 306 method uses acidification. This method is called calcimetry or gasometric analysis and is performed 307 using a calcimeter. The working principle is based on Equation (5); when a carbonate is exposed to a 308
Figure 5. Thermal gravimetric analysis of analytical grade solids [54]; re-used with permission fromElsevier (4592190653818).
2.3.3. Calcimetry
The third method also relies on the decomposition of carbonates, but, rather than using heat,the method uses acidification. This method is called calcimetry or gasometric analysis and is performed
Sustainability 2019, 11, 4156 9 of 22
using a calcimeter. The working principle is based on Equation (5); when a carbonate is exposed toa sufficiently strong acid (typically HCl or HNO3), CO2 gas is released. The calcimeter measures thevolume (or pressure) of released gas, which is used to estimate the carbonate content of the sample.Figure 6 illustrates the use of this method, based on pressure, for determination of MgCO3 content.An advantage of this method over the TGA method is that only CO2 is released by acidification,so it avoids possible overlap with vapor release (which is more problematic for samples containingMg-carbonates). Some disadvantages include lower accuracy, greater detection limit, and the inabilityto discern between different carbonates, including Mg- and Ca-carbonates [55,56].
Sustainability 2019, 11, x FOR PEER REVIEW 9 of 22
sufficiently strong acid (typically HCl or HNO3), CO2 gas is released. The calcimeter measures the 309
volume (or pressure) of released gas, which is used to estimate the carbonate content of the sample. 310 Figure 6 illustrates the use of this method, based on pressure, for determination of MgCO3 content. 311 An advantage of this method over the TGA method is that only CO2 is released by acidification, so it 312 avoids possible overlap with vapor release (which is more problematic for samples containing Mg-313
carbonates). Some disadvantages include lower accuracy, greater detection limit, and the inability to 314 discern between different carbonates, including Mg- and Ca-carbonates [55,56]. 315
316
Figure 6. Temperature and pressure profiles of gasometric carbonate analysis experiment, where the 317 letters denote container sealed (A), sample and HCl mixed (B), maximum pressure (C), and container 318 opened (D) [57]; reprinted with permission from Fagerlund et al. [57], copyright 2010 American 319 Chemical Society. 320
2.3.4. Acid-Base Titration 321
The last method herein described is the acid-base titration. This method is similar to the 322 previously described gasometric analysis, in that acid is used to dissolve the carbonates. However, 323
detection is done by chemical (pH) rather than physical (volume or pressure) means. The method 324 consists of two steps [58,59]. In the first step, the sample is gradually acidified, typically using HCl, 325 while the pH is monitored. The pH will indicate when the carbonates have been fully consumed 326 (Equation (11)). Before they are consumed, carbonates will buffer the pH, which will remain relatively 327
constant. When the carbonates fully dissolve, a pH step occurs, where the pH will decrease until 328 another component in the mineral becomes the pH-controlling mineral. An example is shown in 329 Figure 7 for the acidification of red mud (a by-product of aluminum production). In red mud, an 330 aluminate controls the pH of the material at first, followed by a silicate at lower pH, and followed by 331 calcite at an even lower pH [60]. As can be seen, the pH of calcite is near nine, and when it is fully 332
consumed by the acid, the pH drops to below six. 333
CaCO3(s) + 2HCl → CaCl2(aq) + H2O(l) + CO2(g)↑ (11)
HCl(aq) + NaOH(aq) → NaCl(aq) + H2O(l) (12)
At this point in the acid-base titration method, phenolphthalein is added, and the solution is 334
back-titrated with NaOH (Equation (12)), until the phenolphthalein endpoint (pink color). The 335 difference between the amount of acid added and the amount of excess acid neutralized by sodium 336 hydroxide is the amount of acid that is consumed in dissolving the minerals. Back-titration is used 337 because the acid titration reaction cannot be used directly to titrate the CaCO3, as it is very slow when 338
the reaction is close to the endpoint. Heating the solution can help degas the release CO2, and thus 339 sharpen the endpoint [61]. Disadvantages of this method are similar to those for gasometric analysis. 340
Figure 6. Temperature and pressure profiles of gasometric carbonate analysis experiment, where theletters denote container sealed (A), sample and HCl mixed (B), maximum pressure (C), and containeropened (D) [57]; reprinted with permission from Fagerlund et al. [57], copyright 2010 AmericanChemical Society.
2.3.4. Acid-Base Titration
The last method herein described is the acid-base titration. This method is similar to the previouslydescribed gasometric analysis, in that acid is used to dissolve the carbonates. However, detection isdone by chemical (pH) rather than physical (volume or pressure) means. The method consists of twosteps [58,59]. In the first step, the sample is gradually acidified, typically using HCl, while the pH ismonitored. The pH will indicate when the carbonates have been fully consumed (Equation (11)). Beforethey are consumed, carbonates will buffer the pH, which will remain relatively constant. When thecarbonates fully dissolve, a pH step occurs, where the pH will decrease until another component in themineral becomes the pH-controlling mineral. An example is shown in Figure 7 for the acidification ofred mud (a by-product of aluminum production). In red mud, an aluminate controls the pH of thematerial at first, followed by a silicate at lower pH, and followed by calcite at an even lower pH [60].As can be seen, the pH of calcite is near nine, and when it is fully consumed by the acid, the pH dropsto below six.
CaCO3(s) + 2HCl→ CaCl2(aq) + H2O(l) + CO2(g)↑ (11)
HCl(aq) + NaOH(aq)→ NaCl(aq) + H2O(l) (12)
At this point in the acid-base titration method, phenolphthalein is added, and the solution isback-titrated with NaOH (Equation (12)), until the phenolphthalein endpoint (pink color). The differencebetween the amount of acid added and the amount of excess acid neutralized by sodium hydroxide isthe amount of acid that is consumed in dissolving the minerals. Back-titration is used because theacid titration reaction cannot be used directly to titrate the CaCO3, as it is very slow when the reactionis close to the endpoint. Heating the solution can help degas the release CO2, and thus sharpen theendpoint [61]. Disadvantages of this method are similar to those for gasometric analysis.

Sustainability 2019, 11, 4156 10 of 22
Sustainability 2019, 11, x FOR PEER REVIEW 10 of 22
341
Figure 7. Hydrochloric acid titration curve of red mud, re-plotted using data as simulated by 342 Khaitan et al. [62]. 343
3. Experimental Investigation Part B: Materials and Methods 344
In the following sub-sections, the materials and equipment utilized for the accelerated mineral 345
carbonation experimental investigation developed and performed at Sheridan College are described. 346 Several other types of alkaline minerals and different types of pressurized reactors can replace those 347 specified below, though process conditions may need to be altered from those described here. 348
3.1. Mineral 349
The wollastonite material used in this lab was obtained from NYCO Minerals (Willsboro, NY, 350 USA). The chemical composition of the material was determined by X-ray Fluorescence (XRF) and is 351 presented in Table 1. It consists mainly of calcium and silicon oxides, consistent with the chemical 352 formula of wollastonite, CaSiO3. The Ca:Si molar ratio is 1.18, slightly higher than that of pure 353 wollastonite mineral, which is 1. The maximum CO2 sequestration capacity, based on the calcium 354
and magnesium contents (i.e., if they all become carbonated), would be 409.9 grams of CO2 per 355 kilogram of wollastonite material. (i.e., if all calcium is carbonated). The resulting product would 356 contain 29.1 wt. % CO2. Additional characterization data (mineralogical and particle size analyses) 357 are presented in the Appendix. 358
Table 1. Chemical composition of wollastonite material, determined by XRF (X-ray Fluorescence) and 359 expressed as oxides. 360
Oxide Wt %
CaO 51.2 ± 0.6
SiO2 46.4 ± 0.3
Al2O3 0.79 ± 0.04
MgO 0.70 ± 0.05
Fe2O3 0.52 ± 0.06
K2O 0.14 ± 0.02
3.2. Pressurized Reactor 361
The reactor used for carbonation was from Parr Instrument Company (Moline, IL, USA), model 362 4525, which is a continuously stirred, pressurized, and jacket-heated tank reactor. The nominal 363 reactor volume is 1000 mL, and the material of construction of the head, cylinder, and internal wetted 364
parts is Alloy C-276 (commonly referred to as Hastelloy). The reactor sits on a bench-top stand, and 365 is removable, including the head. Figure 8 shows the reactor, with major components indicated, and 366 additional details are illustrated in Supplementary_Material_1. This reactor is capable of 367 withstanding temperatures up to 300 °C (using PTFE flat gasket) and pressures up to 200 bar 368 (2900 psi). The carbon dioxide compressed gas cylinder is supplied by Praxair (Guildford, United 369
Kingdom) (CAS 12-38-9) and is of industrial grade (min. 99.5% purity). Heating is provided by an 370
Figure 7. Hydrochloric acid titration curve of red mud, re-plotted using data as simulated by Khaitanet al. [62].
3. Experimental Investigation Part B: Materials and Methods
In the following sub-sections, the materials and equipment utilized for the accelerated mineralcarbonation experimental investigation developed and performed at Sheridan College are described.Several other types of alkaline minerals and different types of pressurized reactors can replace thosespecified below, though process conditions may need to be altered from those described here.
3.1. Mineral
The wollastonite material used in this lab was obtained from NYCO Minerals (Willsboro, NY,USA). The chemical composition of the material was determined by X-ray Fluorescence (XRF) and ispresented in Table 1. It consists mainly of calcium and silicon oxides, consistent with the chemicalformula of wollastonite, CaSiO3. The Ca:Si molar ratio is 1.18, slightly higher than that of purewollastonite mineral, which is 1. The maximum CO2 sequestration capacity, based on the calcium andmagnesium contents (i.e., if they all become carbonated), would be 409.9 grams of CO2 per kilogram ofwollastonite material. (i.e., if all calcium is carbonated). The resulting product would contain 29.1 wt.% CO2. Additional characterization data (mineralogical and particle size analyses) are presented inthe Appendix.
Table 1. Chemical composition of wollastonite material, determined by XRF (X-ray Fluorescence) andexpressed as oxides.
Oxide Wt %
CaO 51.2 ± 0.6SiO2 46.4 ± 0.3
Al2O3 0.79 ± 0.04MgO 0.70 ± 0.05Fe2O3 0.52 ± 0.06K2O 0.14 ± 0.02
3.2. Pressurized Reactor
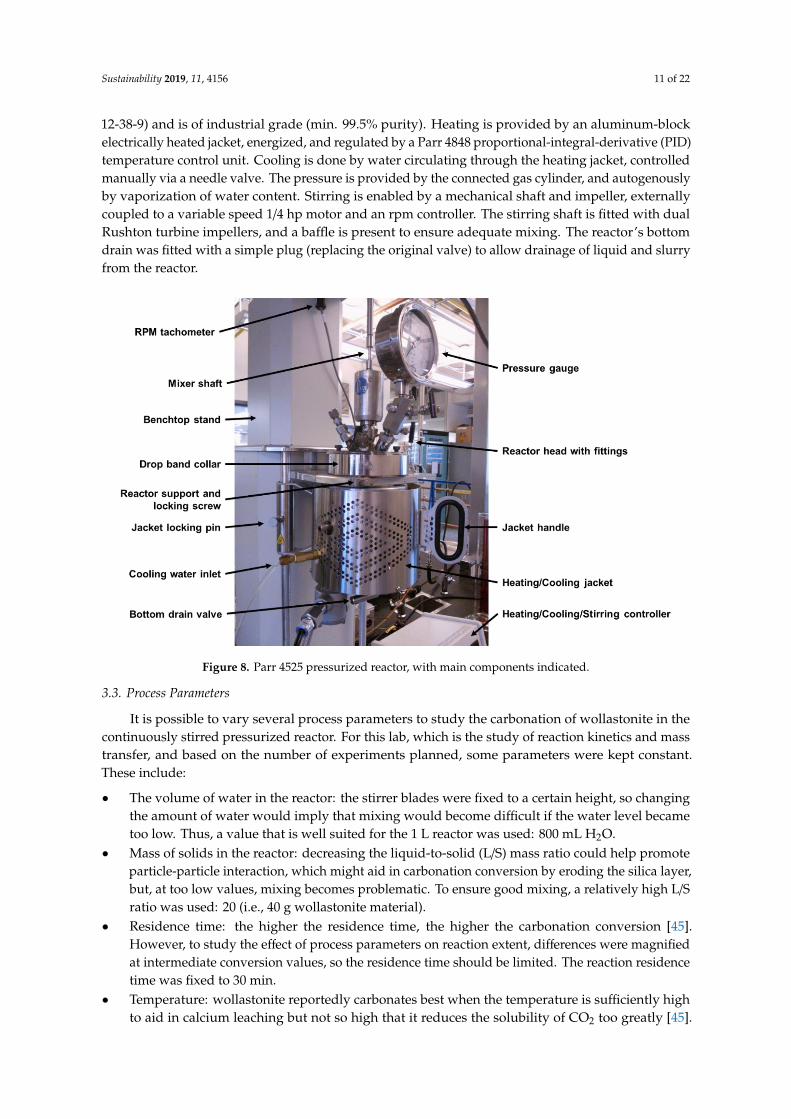
The reactor used for carbonation was from Parr Instrument Company (Moline, IL, USA),model 4525, which is a continuously stirred, pressurized, and jacket-heated tank reactor. The nominalreactor volume is 1000 mL, and the material of construction of the head, cylinder, and internalwetted parts is Alloy C-276 (commonly referred to as Hastelloy). The reactor sits on a bench-topstand, and is removable, including the head. Figure 8 shows the reactor, with major componentsindicated, and additional details are illustrated in Supplementary_Material_1. This reactor is capable ofwithstanding temperatures up to 300 ◦C (using PTFE flat gasket) and pressures up to 200 bar (2900 psi).The carbon dioxide compressed gas cylinder is supplied by Praxair (Guildford, United Kingdom) (CAS
Sustainability 2019, 11, 4156 11 of 22
12-38-9) and is of industrial grade (min. 99.5% purity). Heating is provided by an aluminum-blockelectrically heated jacket, energized, and regulated by a Parr 4848 proportional-integral-derivative (PID)temperature control unit. Cooling is done by water circulating through the heating jacket, controlledmanually via a needle valve. The pressure is provided by the connected gas cylinder, and autogenouslyby vaporization of water content. Stirring is enabled by a mechanical shaft and impeller, externallycoupled to a variable speed 1/4 hp motor and an rpm controller. The stirring shaft is fitted with dualRushton turbine impellers, and a baffle is present to ensure adequate mixing. The reactor’s bottomdrain was fitted with a simple plug (replacing the original valve) to allow drainage of liquid and slurryfrom the reactor.
Sustainability 2019, 11, x FOR PEER REVIEW 11 of 22
aluminum-block electrically heated jacket, energized, and regulated by a Parr 4848 proportional-371
integral-derivative (PID) temperature control unit. Cooling is done by water circulating through the 372 heating jacket, controlled manually via a needle valve. The pressure is provided by the connected gas 373 cylinder, and autogenously by vaporization of water content. Stirring is enabled by a mechanical 374 shaft and impeller, externally coupled to a variable speed 1/4 hp motor and an rpm controller. The 375
stirring shaft is fitted with dual Rushton turbine impellers, and a baffle is present to ensure adequate 376 mixing. The reactor’s bottom drain was fitted with a simple plug (replacing the original valve) to 377 allow drainage of liquid and slurry from the reactor. 378
379
Figure 8. Parr 4525 pressurized reactor, with main components indicated. 380
3.3. Process Parameters 381
It is possible to vary several process parameters to study the carbonation of wollastonite in the 382 continuously stirred pressurized reactor. For this lab, which is the study of reaction kinetics and mass 383 transfer, and based on the number of experiments planned, some parameters were kept constant. 384 These include: 385
• The volume of water in the reactor: the stirrer blades were fixed to a certain height, so changing 386 the amount of water would imply that mixing would become difficult if the water level became 387 too low. Thus, a value that is well suited for the 1 L reactor was used: 800 mL H2O. 388
• Mass of solids in the reactor: decreasing the liquid-to-solid (L/S) mass ratio could help promote 389 particle-particle interaction, which might aid in carbonation conversion by eroding the silica 390
layer, but, at too low values, mixing becomes problematic. To ensure good mixing, a relatively 391 high L/S ratio was used: 20 (i.e., 40 g wollastonite material). 392
• Residence time: the higher the residence time, the higher the carbonation conversion [45]. 393 However, to study the effect of process parameters on reaction extent, differences were 394
magnified at intermediate conversion values, so the residence time should be limited. The 395 reaction residence time was fixed to 30 min. 396
• Temperature: wollastonite reportedly carbonates best when the temperature is sufficiently high 397 to aid in calcium leaching but not so high that it reduces the solubility of CO2 too greatly [45]. 398 The temperature choice also impacts the duration of start-up, since heating from room 399
temperature to the reaction temperature takes time, and of shut-down, since the reactor must be 400 sufficiently cooled before it can be depressurized (<100 °C) and before its contents can be drained 401
Figure 8. Parr 4525 pressurized reactor, with main components indicated.
3.3. Process Parameters
It is possible to vary several process parameters to study the carbonation of wollastonite in thecontinuously stirred pressurized reactor. For this lab, which is the study of reaction kinetics and masstransfer, and based on the number of experiments planned, some parameters were kept constant.These include:
• The volume of water in the reactor: the stirrer blades were fixed to a certain height, so changingthe amount of water would imply that mixing would become difficult if the water level becametoo low. Thus, a value that is well suited for the 1 L reactor was used: 800 mL H2O.
• Mass of solids in the reactor: decreasing the liquid-to-solid (L/S) mass ratio could help promoteparticle-particle interaction, which might aid in carbonation conversion by eroding the silica layer,but, at too low values, mixing becomes problematic. To ensure good mixing, a relatively high L/Sratio was used: 20 (i.e., 40 g wollastonite material).
• Residence time: the higher the residence time, the higher the carbonation conversion [45].However, to study the effect of process parameters on reaction extent, differences were magnifiedat intermediate conversion values, so the residence time should be limited. The reaction residencetime was fixed to 30 min.
• Temperature: wollastonite reportedly carbonates best when the temperature is sufficiently highto aid in calcium leaching but not so high that it reduces the solubility of CO2 too greatly [45].
Sustainability 2019, 11, 4156 12 of 22
The temperature choice also impacts the duration of start-up, since heating from room temperatureto the reaction temperature takes time, and of shut-down, since the reactor must be sufficientlycooled before it can be depressurized (<100 ◦C) and before its contents can be drained safely(<80 ◦C). Hence the temperature to be used was 120 ◦C (at this temperature, the steam pressurewas 0.974 bar, gauge).
• Particle size: particle size is one of the most important parameters for mineral carbonation,as an increase in surface area (i.e., particle size reduction) contributes to the rate of carbonation(Equation (8)). However, reducing the particle size of mined minerals is costly, and the moremilling is done, the lower the net CO2 sequestration for the process (the process can even becomea net CO2 emitter). The material used in this project was milled by NYCO Minerals to themaximum extent that the company still deems economical for commercialization of the mineral;particle size data is presented in the Appendix. According to the results of Huijgen et al. [45],an average particle size below 100 µm is needed for satisfactory kinetics, which is the case for thepresent material. Hence, the material was used as is, and the initial particle size was constant forall experiments.
Two important process parameters remain for the study of reaction kinetics and mass transferof wollastonite carbonation: (a) the CO2 partial pressure, and (b) the stirring rate. Based on thefindings of Huijgen et al. [45], the following conditions (two factors with four levels) were used in thisexperimental investigation:
• CO2 gauge pressure (barg): 2, 5, 10, 40.• Stirring rate (rpm): 100, 200, 400, 600.
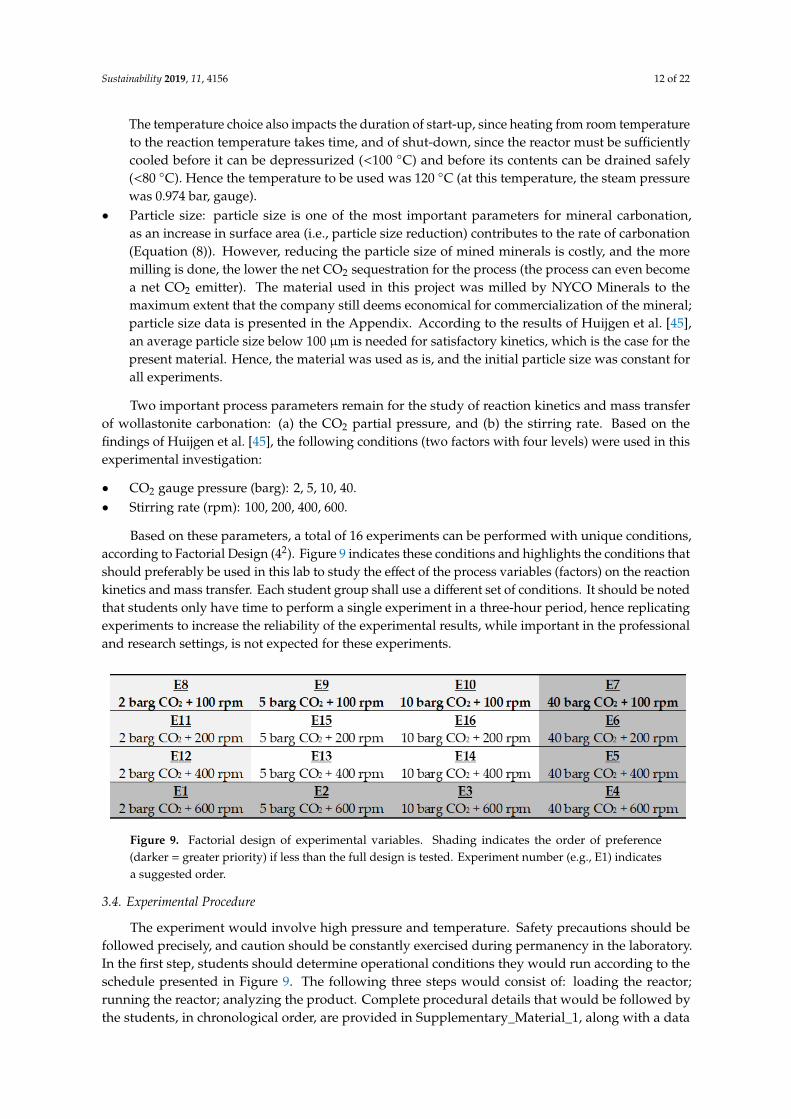
Based on these parameters, a total of 16 experiments can be performed with unique conditions,according to Factorial Design (42). Figure 9 indicates these conditions and highlights the conditions thatshould preferably be used in this lab to study the effect of the process variables (factors) on the reactionkinetics and mass transfer. Each student group shall use a different set of conditions. It should be notedthat students only have time to perform a single experiment in a three-hour period, hence replicatingexperiments to increase the reliability of the experimental results, while important in the professionaland research settings, is not expected for these experiments.
Sustainability 2019, 11, x FOR PEER REVIEW 12 of 22
safely (<80 °C). Hence the temperature to be used was 120 °C (at this temperature, the steam 402
pressure was 0.974 bar, gauge). 403 • Particle size: particle size is one of the most important parameters for mineral carbonation, as an 404
increase in surface area (i.e., particle size reduction) contributes to the rate of carbonation 405 (Equation (8)). However, reducing the particle size of mined minerals is costly, and the more 406
milling is done, the lower the net CO2 sequestration for the process (the process can even become 407 a net CO2 emitter). The material used in this project was milled by NYCO Minerals to the 408 maximum extent that the company still deems economical for commercialization of the mineral; 409 particle size data is presented in the Appendix. According to the results of Huijgen et al. [45], an 410 average particle size below 100 µm is needed for satisfactory kinetics, which is the case for the 411
present material. Hence, the material was used as is, and the initial particle size was constant for 412 all experiments. 413 Two important process parameters remain for the study of reaction kinetics and mass transfer 414
of wollastonite carbonation: (a) the CO2 partial pressure, and (b) the stirring rate. Based on the 415 findings of Huijgen et al. [45], the following conditions (two factors with four levels) were used in 416
this experimental investigation: 417 • CO2 gauge pressure (barg): 2, 5, 10, 40. 418 • Stirring rate (rpm): 100, 200, 400, 600. 419
Based on these parameters, a total of 16 experiments can be performed with unique conditions, 420
according to Factorial Design (42). Figure 9 indicates these conditions and highlights the conditions 421 that should preferably be used in this lab to study the effect of the process variables (factors) on the 422 reaction kinetics and mass transfer. Each student group shall use a different set of conditions. It 423 should be noted that students only have time to perform a single experiment in a three-hour period, 424 hence replicating experiments to increase the reliability of the experimental results, while important 425
in the professional and research settings, is not expected for these experiments. 426
427
Figure 9. Factorial design of experimental variables. Shading indicates the order of preference (darker 428 = greater priority) if less than the full design is tested. Experiment number (e.g., E1) indicates a 429 suggested order. 430
3.4. Experimental Procedure 431
The experiment would involve high pressure and temperature. Safety precautions should be 432 followed precisely, and caution should be constantly exercised during permanency in the laboratory. 433 In the first step, students should determine operational conditions they would run according to the 434 schedule presented in Figure 9. The following three steps would consist of: loading the reactor; 435 running the reactor; analyzing the product. Complete procedural details that would be followed by 436
the students, in chronological order, are provided in Supplementary_Material_1, along with a data 437 table (Table S1) for recording observations and values obtained during the experiment. The duration 438 of each experiment would be approximately 3 hours, and the work would be ideally carried out in 439 groups of 2 or 3 students. 440
4. Experimental Investigation Part C: Calculations and Questions 441
4.1. Moisture Content in Collected Filter Cake 442
Figure 9. Factorial design of experimental variables. Shading indicates the order of preference(darker = greater priority) if less than the full design is tested. Experiment number (e.g., E1) indicatesa suggested order.
3.4. Experimental Procedure
The experiment would involve high pressure and temperature. Safety precautions should befollowed precisely, and caution should be constantly exercised during permanency in the laboratory.In the first step, students should determine operational conditions they would run according to theschedule presented in Figure 9. The following three steps would consist of: loading the reactor;running the reactor; analyzing the product. Complete procedural details that would be followed bythe students, in chronological order, are provided in Supplementary_Material_1, along with a data
Sustainability 2019, 11, 4156 13 of 22
table (Table S1) for recording observations and values obtained during the experiment. The durationof each experiment would be approximately 3 hours, and the work would be ideally carried out ingroups of 2 or 3 students.
4. Experimental Investigation Part C: Calculations and Questions
4.1. Moisture Content in Collected Filter Cake
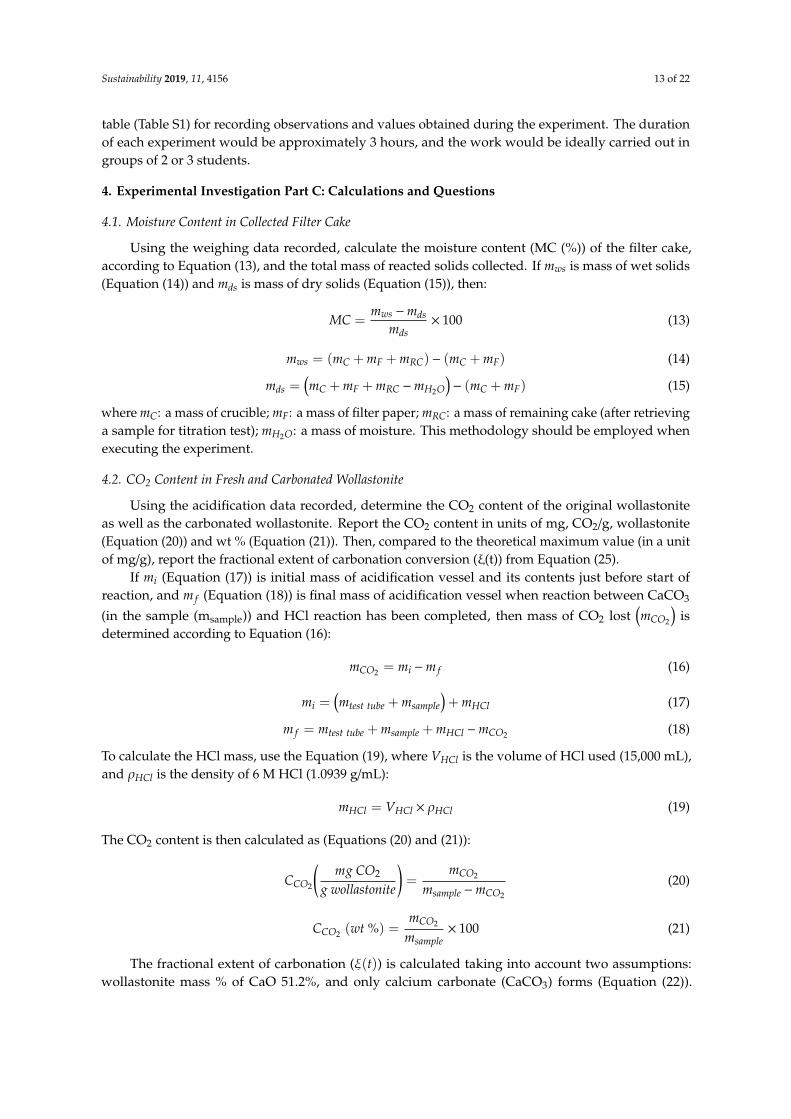
Using the weighing data recorded, calculate the moisture content (MC (%)) of the filter cake,according to Equation (13), and the total mass of reacted solids collected. If mws is mass of wet solids(Equation (14)) and mds is mass of dry solids (Equation (15)), then:
MC =mws −mds
mds× 100 (13)
mws = (mC + mF + mRC) − (mC + mF) (14)
mds =(mC + mF + mRC −mH2O
)− (mC + mF) (15)
where mC: a mass of crucible; mF: a mass of filter paper; mRC: a mass of remaining cake (after retrievinga sample for titration test); mH2O: a mass of moisture. This methodology should be employed whenexecuting the experiment.
4.2. CO2 Content in Fresh and Carbonated Wollastonite
Using the acidification data recorded, determine the CO2 content of the original wollastoniteas well as the carbonated wollastonite. Report the CO2 content in units of mg, CO2/g, wollastonite(Equation (20)) and wt % (Equation (21)). Then, compared to the theoretical maximum value (in a unitof mg/g), report the fractional extent of carbonation conversion (ξ(t)) from Equation (25).
If mi (Equation (17)) is initial mass of acidification vessel and its contents just before start ofreaction, and m f (Equation (18)) is final mass of acidification vessel when reaction between CaCO3
(in the sample (msample)) and HCl reaction has been completed, then mass of CO2 lost(mCO2
)is
determined according to Equation (16):
mCO2 = mi −m f (16)
mi =(mtest tube + msample
)+ mHCl (17)
m f = mtest tube + msample + mHCl −mCO2 (18)
To calculate the HCl mass, use the Equation (19), where VHCl is the volume of HCl used (15,000 mL),and ρHCl is the density of 6 M HCl (1.0939 g/mL):
mHCl = VHCl × ρHCl (19)
The CO2 content is then calculated as (Equations (20) and (21)):
CCO2
(mg CO2
g wollastonite
)=
mCO2
msample −mCO2
(20)
CCO2 (wt %) =mCO2
msample× 100 (21)
The fractional extent of carbonation (ξ(t)) is calculated taking into account two assumptions:wollastonite mass % of CaO 51.2%, and only calcium carbonate (CaCO3) forms (Equation (22)).

Sustainability 2019, 11, 4156 14 of 22
The theoretical maximum concentration of CO2 is defined as the concentration of CO2 present inwollastonite if all CaO present is converted into CaCO3, as described by Equations (23–25):
CaO(s) + CO2(g)→ CaCO3(s) (22)
CCO2,max =51.2 g CaO
100 gwollastonite ×1 gmole CaO56.077 g CaO ×
1 gmole CO21 gmole CaO ×
44.009 g CO21 gmole CO2
×103mg CO2
1g CO2=
401.8155 mg CO2g wollastonite (23)
CCO2,reacted = CCO2(Carbonated Wollastonite) −CCO2(Fresh Wollastonite) (24)
ξ(t) =Reacted concentration o f CO2
(mg CO2g sample
)Theoretical concentration o f CO2
(mg CO2g Sample
) =CCO2,reacted
CCO2,max(25)
4.3. Laboratory Report Questions
After the initial calculations, the students answer several questions, as part of their experimentalinvestigation report, to evaluate their progress and knowledge. The following is a list of questions usedat Sheridan College. Some questions directly relate to the experiment conducted and data collected,while others challenge students to hypothesize based on fundamental engineering concepts and toexplore available literature.
1. Present all experimental data in well-formatted lists and/or tables (in addition to the photocopyof your lab notebook notes).
2. Present answers to the calculation questions and show calculations.3. Comment on your confidence in the acidification results for the original and carbonated solids,
and make any additional remark about using this method for CO2 uptake determination.4. Comment on the carbonation extent achieved. Is it as expected based on the theory on process
conditions and mechanism?5. How can the reaction progress be followed in real-time (on-line)? Research and summarize at
least two instrumental methods that can be coupled to a pressurized high-temperature reactor.6. Would it make any difference to the reaction if impure CO2 was used (e.g. direct flue gas, or CO2
of lower purity than used)? Think about chemical and physical aspects.7. Explain the function of a rupture disk and how it is selected for a reactor. In what cases is a rupture
disk used versus a relief valve?8. Research literature to find out what the pH and CO2 solubility (mol/L) at the operating temperature
and pressure you used would be if the reaction medium was pure water (i.e. no mineral).9. Following up on question 8, do you think the pH and CO2 solubility with the reacting wollastonite
present (as in the experiment) would be higher or lower than the values you found for pure water?
5. Discussion
The experimental investigation presented in this paper was conducted in Summer 2017 for thefirst time, with three two-member groups of students, as a laboratory assignment in the “Air PollutionChemistry” course at Sheridan College. However, this conceptualized experiment can be applied ina range of multidisciplinary courses at the 3rd or 4th-year levels in Bachelor or Advanced Diplomaprograms and the 1st or 2nd-year levels of a Master’s program. Suitable courses include titles, such as“Reaction Kinetics”, “Reactor Design”, “Unit Operations”, “Mass Transfer Operations”, “MaterialsChemistry”, among others. It is crucial that students performing the conceptualized lab possessprior knowledge, and preferably laboratory experience, in fundamental topics that include physicalchemistry and transport phenomena.
In the first implementation of this methodology, students were required to perform thisinvestigation within an approximately three-hours duration in the laboratory, and write a report (oneper student) with the data and results obtained that was due one week after the lab. Lab experiments

Sustainability 2019, 11, 4156 15 of 22
in this course are alternated between groups, so each week one group performed the AcceleratedCarbonation lab. As this was the most comprehensive lab students performed in the course, all groupswere scheduled to perform the lab during the last three weeks of the course, so that students wouldbe experienced in air pollution experiments before attempting this lab. Students were also requiredto read the extensive lab procedure before arriving in the lab and were required to show notes theyhad made in preparation for the lab. This was done to ensure students worked efficiently to be ableto conclude the experiment in the allotted time and to ensure students were well aware of the safetyprecautions that had to be taken. All six students who experimented understood and concluded theexperiment in the time proposed, describing the procedures, data, calculations (Sections 4.2 and 4.3)in detail in the report, adequately answering the questions (Section 4.3), and correctly filling out thedata table (Table S1). It is thus concluded that the conceptualized experimental investigation has beenvalidated both procedurally and pedagogically. Furthermore, this experimental investigation showed(from the instructor’s perspective based on lab performance and quality of reports) that students weremore engaged when they had a clear purpose and knew the value of the experimental data.
After the collection of the student’s results obtained using different parameter conditions,the reaction efficiency obtained in the experiments, which is the relation between the maximumtheoretical and actual experimental CO2 uptake values, was on average 22.5%, ranging from 17 to 28%.These results are in good agreement with those of Huijgen et al. [45]. They reported an efficiency of 39%for the same reaction duration used herein (30 min.), and using the following parameters: particle size<106 µm (D(4,3) = 51.1 µm), T = 150 ◦C, PCO2 = 20 bar, L/S = 5 kg/kg, 500 rpm. The higher efficiencyobtained in that study compared to the students’ results could be attributed primarily to the particlesize. The students used material with 75 wt % having particle size below 100 µm and D(4,3) equal to82.7 µm. Thus, it was expected that the students’ coarser material would carbonate less in the samereaction duration, and hence could be said that their results were adequate.
The fact that all groups obtained reasonable efficiency values is also evidence that students notonly performed the experiments adequately but were able to apply the required calculations correctly,even though such calculations were different from the calculations they performed in prior labs. Strongstudent performance in this experimental lab is evidence of strong student engagement. Studentengagement was also verified by inspecting their laboratory procedures at the beginning of the labperiod. Students were asked to highlight and make hand-written notes on the procedure before comingto the lab to be well prepared, and all students turned up with significantly marked up copies ofthe procedure.
Students were also able to provide thoughtful answers to the questions presented in Section 4.3;the following are some examples of the answers provided for selected questions:
Q3) Students commented on the increase in the CO2 content of wollastonite after reaction versus theoriginal mineral. Comments were also made regarding possible vapor losses from the acidificationtube due to heating, and water condensation into the tube due to an ice bath, as potential sourcesof error in the quantitative determination.
Q5) Two approaches to follow reaction progress in real-time were commonly mentioned. One is touse instrumentation that analyzes the reaction medium in-situ, such as in-situ FTIR. The otheris by collecting samples while the reactor operates at elevated temperatures and pressures,using appropriate sampling techniques.
Q6) Students recalled the concepts of partial and total pressures to answer this question. They realizedthat it is the CO2 partial pressure that drives the carbonation reaction, thus impure CO2, in theform of flue gases, would require greater total pressure to achieve similar reactivity as pureCO2. From a physical perspective, the implication of this includes the need for reactors that canwithstand higher pressures and compressors that can pressure flue gases to very high pressures,both of which affect process costing.
Q7) This question about rupture disks and relief valves can easily be answered by searching theinternet, but it was selected for this lab for a special purpose. Sheridan students perform another
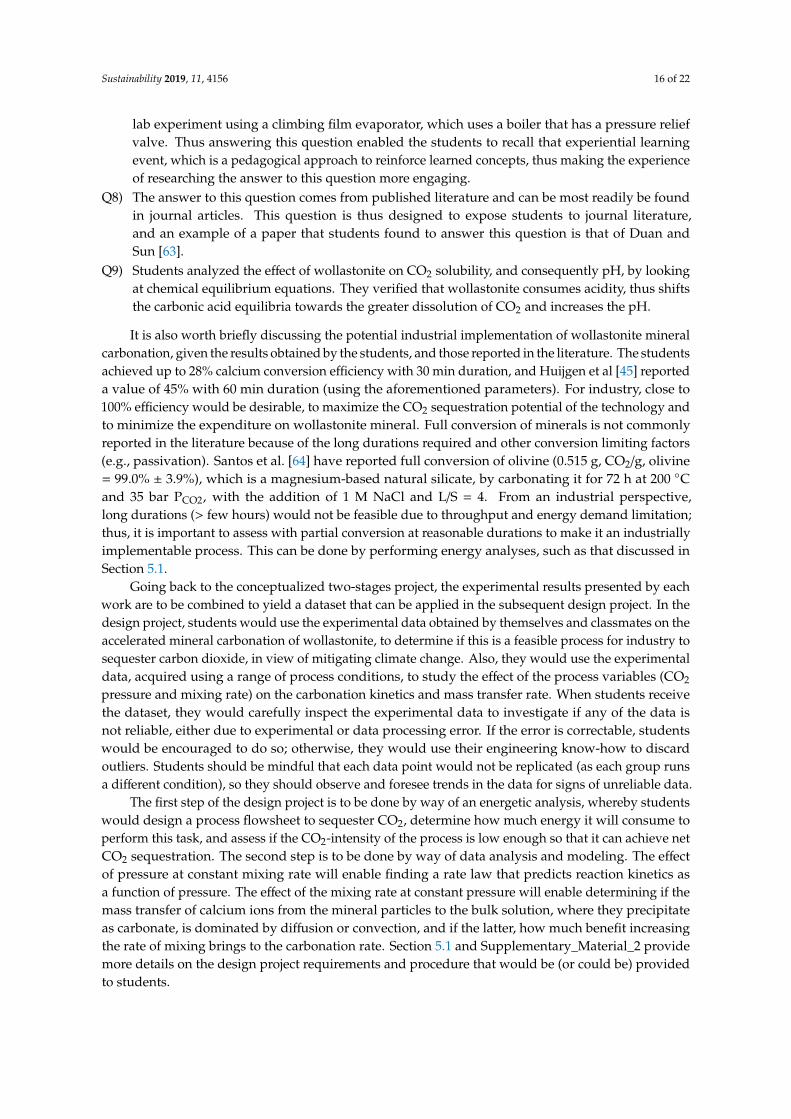
Sustainability 2019, 11, 4156 16 of 22
lab experiment using a climbing film evaporator, which uses a boiler that has a pressure reliefvalve. Thus answering this question enabled the students to recall that experiential learningevent, which is a pedagogical approach to reinforce learned concepts, thus making the experienceof researching the answer to this question more engaging.
Q8) The answer to this question comes from published literature and can be most readily be foundin journal articles. This question is thus designed to expose students to journal literature,and an example of a paper that students found to answer this question is that of Duan andSun [63].
Q9) Students analyzed the effect of wollastonite on CO2 solubility, and consequently pH, by lookingat chemical equilibrium equations. They verified that wollastonite consumes acidity, thus shiftsthe carbonic acid equilibria towards the greater dissolution of CO2 and increases the pH.
It is also worth briefly discussing the potential industrial implementation of wollastonite mineralcarbonation, given the results obtained by the students, and those reported in the literature. The studentsachieved up to 28% calcium conversion efficiency with 30 min duration, and Huijgen et al [45] reporteda value of 45% with 60 min duration (using the aforementioned parameters). For industry, close to100% efficiency would be desirable, to maximize the CO2 sequestration potential of the technology andto minimize the expenditure on wollastonite mineral. Full conversion of minerals is not commonlyreported in the literature because of the long durations required and other conversion limiting factors(e.g., passivation). Santos et al. [64] have reported full conversion of olivine (0.515 g, CO2/g, olivine= 99.0% ± 3.9%), which is a magnesium-based natural silicate, by carbonating it for 72 h at 200 ◦Cand 35 bar PCO2, with the addition of 1 M NaCl and L/S = 4. From an industrial perspective,long durations (> few hours) would not be feasible due to throughput and energy demand limitation;thus, it is important to assess with partial conversion at reasonable durations to make it an industriallyimplementable process. This can be done by performing energy analyses, such as that discussed inSection 5.1.
Going back to the conceptualized two-stages project, the experimental results presented by eachwork are to be combined to yield a dataset that can be applied in the subsequent design project. In thedesign project, students would use the experimental data obtained by themselves and classmates on theaccelerated mineral carbonation of wollastonite, to determine if this is a feasible process for industry tosequester carbon dioxide, in view of mitigating climate change. Also, they would use the experimentaldata, acquired using a range of process conditions, to study the effect of the process variables (CO2
pressure and mixing rate) on the carbonation kinetics and mass transfer rate. When students receivethe dataset, they would carefully inspect the experimental data to investigate if any of the data isnot reliable, either due to experimental or data processing error. If the error is correctable, studentswould be encouraged to do so; otherwise, they would use their engineering know-how to discardoutliers. Students should be mindful that each data point would not be replicated (as each group runsa different condition), so they should observe and foresee trends in the data for signs of unreliable data.
The first step of the design project is to be done by way of an energetic analysis, whereby studentswould design a process flowsheet to sequester CO2, determine how much energy it will consume toperform this task, and assess if the CO2-intensity of the process is low enough so that it can achieve netCO2 sequestration. The second step is to be done by way of data analysis and modeling. The effectof pressure at constant mixing rate will enable finding a rate law that predicts reaction kinetics asa function of pressure. The effect of the mixing rate at constant pressure will enable determining if themass transfer of calcium ions from the mineral particles to the bulk solution, where they precipitateas carbonate, is dominated by diffusion or convection, and if the latter, how much benefit increasingthe rate of mixing brings to the carbonation rate. Section 5.1 and Supplementary_Material_2 providemore details on the design project requirements and procedure that would be (or could be) providedto students.

Sustainability 2019, 11, 4156 17 of 22
5.1. Energetic Analysis and Design Project
One of the biggest concerns with the accelerated mineral carbonation technology is that if it isimplemented as an industrial process, it will not deliver net CO2 sequestration. The reason behindthis is that all process equipment in the industry requires energy to function, and, in most cases,that energy is supplied from CO2-intensive processes. Even so-called “green energy” has a CO2
footprint. Hydroelectric fares the best, at 4 g, CO2-eq/kWhe, while wind and solar emit (over thelife-cycle) 12 and 22 g, CO2-eq/kWhe, respectively (CO2-eq stands for CO2-equivalent, and kWhe is therate of electrical energy generation) [65]. At the other end of the spectrum, the median CO2 intensity ofcoal power generation, the worst performer, is a whopping 1001 g, CO2-eq/kWhe. Thus, if too muchenergy is used for accelerating mineral carbonation, the process may end up emitting more CO2 thansequestering it.
Due to the energetic challenges posed, it is vital to conduct an energetic analysis of anyproposed accelerated mineral carbonation process. For example, Santos et al. [66] found that,for an ultrasound-enhanced mineral carbonation process (at lab-scale), for every 2.3 g of CO2 sequestered,79.2 g would be emitted (based on the energy-mix of Belgium). They proposed some strategies to reducethe CO2 emissions further at the industrial-scale, such as securing a less CO2-intensive energy source,increasing the solids loading in the reactor (i.e., more solids per volume of liquid), and improvingthe design of the reactor to maximize the utilization of sonication energy. Still, a 100-factor reductionin CO2-intensity would be necessary to achieve net CO2 sequestration, so it is not easy and perhapsnot feasible.
More recently, for a more conventional carbonation process, utilizing steelmaking slag as thecarbon sink, Costa et al. [67] estimated an energy requirement of 272−1750 kWh/tonne CO2 sequestered.Based on the aforementioned energy-intensity of wind power generation, this would represent 38 kg,CO2 emitted per 1000 kg, CO2 sequestered. Hence, this would be a feasible process for net CO2
sequestration. It should be noted, however, that steelmaking slags require less intense carbonationconditions compared to wollastonite (as the material is more reactive). Unfortunately, there is far lesssteelmaking slag being produced than CO2 being emitted by steelmaking, so this material alone cannotsubstantially reduce emissions from this CO2-intensive industry. Thus, natural materials, such aswollastonite, more abundantly available (though more expensive due to mining and transportationcosts), are required to curtail industrial emissions.
So the question is, can accelerated carbonation of wollastonite become a feasible industrial processfor net CO2 sequestration? This would be addressed in the design project, that should include thefollowing analyses:
• Energetic analysis: (a) explain how you adapted the proposed procedure to reach the energyconsumption and net CO2 sequestration results (what assumptions had to be made, what changesyou made, if any, to the proposed procedure, etc.); (b) show values (and sources) of allparameters used in the equations; (c) show the energy consumption value of each individualprocess/equipment; (d) show the calculation procedure of converting energy consumption toCO2 emissions (footprint) and compare the CO2 emissions rate to the CO2 sequestration rateto determine if net CO2 sequestration is achieved; (e) discuss what process changes you maymake, if more experimental or modeling information, to improve the efficiency of the process;(f) write conclusions and recommendations on whether accelerated mineral carbonation canbecome an industrially feasible process for CO2 sequestration.
• Reaction rate law: (a) explain the procedure used to develop the rate law(s), including data andgraphs used; (b) explain assumptions taken and any limitation of the applicability of the ratelaw(s); (c) comment on what you learned about the mineral carbonation reaction based on the ratelaw(s) obtained; (d) comment on how the rate law(s) can aid in improving the process design andenergy consumption presented earlier.

Sustainability 2019, 11, 4156 18 of 22
• Mass transfer analysis: (a) explain the procedure used in the analysis, including data andgraphs used; (b) explain assumptions taken and any limitation on validity of the analysis results;(c) comment on what you learned about the mineral carbonation reaction based on the resultsobtained; (d) comment on how the analysis can aid in improving the process design and energyconsumption presented earlier.
More detail on the design procedure can be found in Supplementary_Material_2.
6. Conclusions
The experimental approach and formulas presented in this work demonstrated a potentialpedagogic complement, introducing students to the mineral carbonation process and helping toincrease interest in this subject. This methodology is easy to apply, with the possibility of different typesof reactor available in the market and minerals (i.e., olivine, serpentine, etc.) or residues (i.e., ashes,tailings, and slags) and could be used to expose students to an environmental concept and engage intoopportunities of application of this technology with the visible results obtained after the investigation.
After working in small groups, the learning outcomes for this practical experiment are thatstudents should also be able to design experiments, to test a hypothesis, and work in groups tosolve a shared problem. This work demonstrates the importance of the practical investigation toget a deeper understanding and engage students in chemical engineering or other courses related toapplied chemistry.
Supplementary Materials: The following are available online at http://www.mdpi.com/2071-1050/11/15/4156/s1,Supplementary_Material_1 and Supplementary_Material_2.
Author Contributions: Conceptualization, R.M.S.; Methodology, R.M.S., J.S.S.; Validation, J.S.S.; Writing—OriginalDraft Preparation, H.F., R.M.S.; Writing—Review and Editing, R.M.S.; Supervision, R.M.S.
Funding: The work of H.F. and the APC were funded by a Barrett Sustainable Food Engineering Grant(Barrett2018-14) at the University of Guelph, and the work of J.S.S. was funded by a Scholarship, Research andCreative Activities Growth Grant at Sheridan College.
Acknowledgments: The authors are grateful to the assistance provided by Terence Davison, Nausheen Zehra,Daniel Liao, and Jaspreet Chauhan at Sheridan College to make it possible to develop the laboratory experiment.R.M.S. is also thankful for the funding provided by Sheridan College that covered the Co-op stipend of J.S.S.,for the funding provided by the Barrett Family that covered the research assistantship stipend of H.F., and to theTeaching and Learning Academy program at Sheridan College for initially incentivizing this work.
Conflicts of Interest: The authors declare no conflict of interest.
Appendix A
The mineralogical composition of the wollastonite material was determined by XRD.The diffractogram is presented in Figure A1. The diffraction peaks match well with those of wollastonite1A (the most common polymorph of CaSiO3, which crystallizes in the triclinic system). Quantificationby Rietveld Refinement indicates the presence of 82 wt % wollastonite, with minor quantities of quartz(SiO2), portlandite (Ca(OH)2), and merwinite (MgCa3(SiO4)2). The pH of a wollastonite material–waterslurry at a liquid-to-solid ratio of 10 kg/kg was determined to be 10.6, after 24 h shaking, which is closeto the theoretical value for wollastonite of 10.7.
The particle size distribution of the wollastonite material was determined by wet Laser DiffractionAnalysis (LDA) and is presented in Figure A2. The material has a relatively wide particle sizedistribution (as observed in Figure 1), ranging from sub-micron to ~600 µm, which partly owes tothe acicular shape of the material (i.e., a combination of long needles and small needle fragments).The average particle size (D(4,3)) of this material was 82.7 µm, with a D50 (median diameter) by volumeof 44.5 µm. The specific surface area (SSA) was determined to be 0.8903 m2/g.
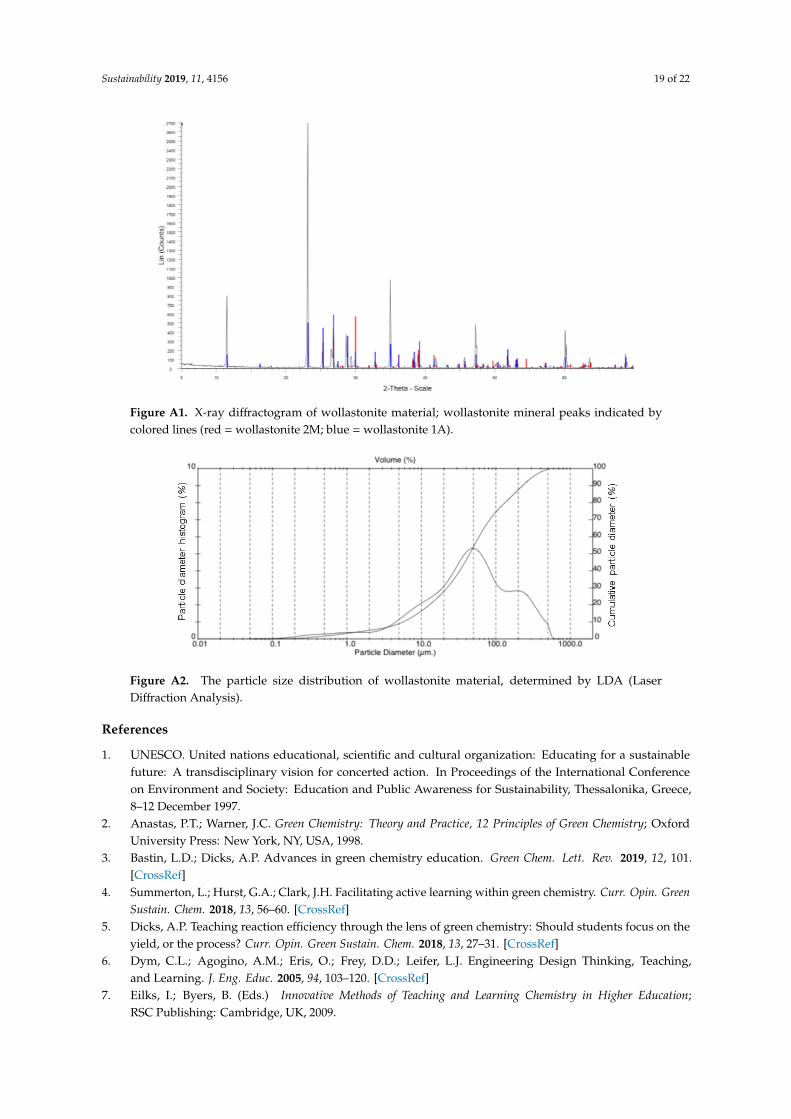
Sustainability 2019, 11, 4156 19 of 22
Sustainability 2019, 11, x FOR PEER REVIEW 18 of 22
Funding: The work of H.F. and the APC were funded by a Barrett Sustainable Food Engineering Grant 673 (Barrett2018-14) at the University of Guelph, and the work of J.S.S. was funded by a Scholarship, Research and 674 Creative Activities Growth Grant at Sheridan College. 675
Acknowledgments: The authors are grateful to the assistance provided by Terence Davison, Nausheen Zehra, 676 Daniel Liao, and Jaspreet Chauhan at Sheridan College to make it possible to develop the laboratory experiment. 677 R.M.S. is also thankful for the funding provided by Sheridan College that covered the Co-op stipend of J.S.S., for 678 the funding provided by the Barrett Family that covered the research assistantship stipend of H.F., and to the 679 Teaching and Learning Academy program at Sheridan College for initially incentivizing this work. 680
Conflicts of Interest: The authors declare no conflict of interest. 681
Appendix 682
The mineralogical composition of the wollastonite material was determined by XRD. The 683 diffractogram is presented in Figure A1. The diffraction peaks match well with those of wollastonite 684
1A (the most common polymorph of CaSiO3, which crystallizes in the triclinic system). Quantification 685 by Rietveld Refinement indicates the presence of 82 wt % wollastonite, with minor quantities of 686 quartz (SiO2), portlandite (Ca(OH)2), and merwinite (MgCa3(SiO4)2). The pH of a wollastonite 687 material–water slurry at a liquid-to-solid ratio of 10 kg/kg was determined to be 10.6, after 24 h 688
shaking, which is close to the theoretical value for wollastonite of 10.7. 689
690
Figure A1. X-ray diffractogram of wollastonite material; wollastonite mineral peaks indicated by 691 colored lines (red = wollastonite 2M; blue = wollastonite 1A). 692
The particle size distribution of the wollastonite material was determined by wet Laser 693
Diffraction Analysis (LDA) and is presented in Figure A2. The material has a relatively wide particle 694 size distribution (as observed in Figure 1), ranging from sub-micron to ~600 µm, which partly owes 695 to the acicular shape of the material (i.e., a combination of long needles and small needle fragments). 696 The average particle size (D(4,3)) of this material was 82.7 µm, with a D50 (median diameter) by 697 volume of 44.5 µm. The specific surface area (SSA) was determined to be 0.8903 m2/g. 698
Figure A1. X-ray diffractogram of wollastonite material; wollastonite mineral peaks indicated bycolored lines (red = wollastonite 2M; blue = wollastonite 1A).Sustainability 2019, 11, x FOR PEER REVIEW 19 of 22
699
Figure A2. The particle size distribution of wollastonite material, determined by LDA (Laser 700 Diffraction Analysis). 701
References 702
1. UNESCO. United nations educational, scientific and cultural organization: Educating for a sustainable 703 future: A transdisciplinary vision for concerted action. In Proceedings of the International Conference on 704 Environment and Society: Education and Public Awareness for Sustainability, Thessalonika, Greece, 8–12 705 December 1997. 706
2. Anastas, P.T.; Warner, J.C. Green Chemistry: Theory and Practice, 12 Principles of Green Chemistry; Oxford 707 University Press: New York, NY, USA, 1998. 708
3. Bastin, L.D.; Dicks, A.P. Advances in green chemistry education. Green Chem. Lett. Rev. 2019, 12, 101, 709 doi:10.1080/17518253.2019.1621059. 710
4. Summerton, L.; Hurst, G.A.; Clark, J.H. Facilitating active learning within green chemistry. Curr. Opin. 711 Green Sustain. Chem. 2018, 13, 56–60, doi:10.1016/j.cogsc.2018.04.002. 712
5. Dicks, A.P. Teaching reaction efficiency through the lens of green chemistry: Should students focus on the 713 yield, or the process? Curr. Opin. Green Sustain. Chem. 2018, 13, 27–31, doi:10.1016/j.cogsc.2018.03.009. 714
6. Dym, C.L.; Agogino, A.M.; Eris, O.; Frey, D.D.; Leifer, L.J. Engineering Design Thinking, Teaching, and 715 Learning. J. Eng. Educ. 2005, 94, 103–120, doi:10.1002/j.2168-9830.2005.tb00832.x. 716
7. Eilks, I.; Byers, B. (Eds.) Innovative Methods of Teaching and Learning Chemistry in Higher Education; RSC 717 Publishing: Cambridge, UK, 2009. 718
8. Feisel, L.D.; Rosa, A.J. The Role of the Laboratory in Undergraduate Engineering Education. J. Eng. Educ. 719 2005, 94, 121–130, doi:10.1002/j.2168-9830.2005.tb00833.x. 720
9. Martínez, K.P.; Campos, J.L.B. Developing scientific thinking skills through teaching chemical reaction 721 with inquiry based teaching. Educ. Quím. 2019, 30, 93, doi:10.22201/fq.18708404e.2019.1.64614. 722
10. McKim, A.S. Overcoming sustainability barriers within the chemical industry. Curr. Opin. Green Sustain. 723 Chem. 2018, 14, 10–13, doi:10.1016/j.cogsc.2018.04.020. 724
11. Parmentier, M.; Gabriel, C.M.; Guo, P.; Isley, N.A.; Zhou, J.; Gallou, F. Switching from organic solvents to 725 water at an industrial scale. Curr. Opin. Green Sustain. Chem. 2017, 7, 13–17, doi:10.1016/j.cogsc.2017.06.004. 726
12. Metz, B.; Davidson, O.; de Coninck, H.; Loos, M.; Meyer, L. (Eds.) IPCC Special Report on Carbon Dioxide 727 Capture and Storage; Cambridge University Press: New York, NY, USA, 2005. 728
13. Oelkers, E.H.; Gislason, S.R.; Matter, J. Mineral Carbonation of CO2. Elements 2008, 4, 333–337, 729 doi:10.2113/gselements.4.5.333. 730
14. Saran, R.K.; Arora, V.; Yadav, S. CO2 sequestration by mineral carbonation: A review. Glob. Nest J. 2018, 20, 731 497–503, doi:10.30955/gnj.002597. 732
15. Baena-Moreno, F.M.; Rodríguez-Galán, M.; Vega, F.; Alonso-Fariñas, B.; Vilches Arenas, L.F.; Navarrete, B. 733 Carbon capture and utilization technologies: A literature review and recent advances. Energy Sources, Part 734 A Recover. Util. Environ. Eff. 2019, 41, 1403–1433, doi:10.1080/15567036.2018.1548518. 735
16. Kelektsoglou, K. Carbon capture and storage: A review of mineral storage of CO2 in Greece. Sustainability 736 2018, 10, 4400, doi:10.3390/su10124400. 737
17. National Oceanic and Atmospheric Administration (NOAA). Available online: https://www.noaa.gov 738 (accessed 18 May 2019). 739
Figure A2. The particle size distribution of wollastonite material, determined by LDA (LaserDiffraction Analysis).
References
1. UNESCO. United nations educational, scientific and cultural organization: Educating for a sustainablefuture: A transdisciplinary vision for concerted action. In Proceedings of the International Conferenceon Environment and Society: Education and Public Awareness for Sustainability, Thessalonika, Greece,8–12 December 1997.
2. Anastas, P.T.; Warner, J.C. Green Chemistry: Theory and Practice, 12 Principles of Green Chemistry; OxfordUniversity Press: New York, NY, USA, 1998.
3. Bastin, L.D.; Dicks, A.P. Advances in green chemistry education. Green Chem. Lett. Rev. 2019, 12, 101.[CrossRef]
4. Summerton, L.; Hurst, G.A.; Clark, J.H. Facilitating active learning within green chemistry. Curr. Opin. GreenSustain. Chem. 2018, 13, 56–60. [CrossRef]
5. Dicks, A.P. Teaching reaction efficiency through the lens of green chemistry: Should students focus on theyield, or the process? Curr. Opin. Green Sustain. Chem. 2018, 13, 27–31. [CrossRef]
6. Dym, C.L.; Agogino, A.M.; Eris, O.; Frey, D.D.; Leifer, L.J. Engineering Design Thinking, Teaching,and Learning. J. Eng. Educ. 2005, 94, 103–120. [CrossRef]
7. Eilks, I.; Byers, B. (Eds.) Innovative Methods of Teaching and Learning Chemistry in Higher Education;RSC Publishing: Cambridge, UK, 2009.
Sustainability 2019, 11, 4156 20 of 22
8. Feisel, L.D.; Rosa, A.J. The Role of the Laboratory in Undergraduate Engineering Education. J. Eng. Educ.2005, 94, 121–130. [CrossRef]
9. Martínez, K.P.; Campos, J.L.B. Developing scientific thinking skills through teaching chemical reaction withinquiry based teaching. Educ. Quím. 2019, 30, 93. [CrossRef]
10. McKim, A.S. Overcoming sustainability barriers within the chemical industry. Curr. Opin. Green Sustain.Chem. 2018, 14, 10–13. [CrossRef]
11. Parmentier, M.; Gabriel, C.M.; Guo, P.; Isley, N.A.; Zhou, J.; Gallou, F. Switching from organic solvents towater at an industrial scale. Curr. Opin. Green Sustain. Chem. 2017, 7, 13–17. [CrossRef]
12. Metz, B.; Davidson, O.; de Coninck, H.; Loos, M.; Meyer, L. (Eds.) IPCC Special Report on Carbon DioxideCapture and Storage; Cambridge University Press: New York, NY, USA, 2005.
13. Oelkers, E.H.; Gislason, S.R.; Matter, J. Mineral Carbonation of CO2. Elements 2008, 4, 333–337. [CrossRef]14. Saran, R.K.; Arora, V.; Yadav, S. CO2 sequestration by mineral carbonation: A review. Glob. Nest J. 2018, 20,
497–503. [CrossRef]15. Baena-Moreno, F.M.; Rodríguez-Galán, M.; Vega, F.; Alonso-Fariñas, B.; Vilches Arenas, L.F.; Navarrete, B.
Carbon capture and utilization technologies: A literature review and recent advances. Energy Sources, Part ARecover. Util. Environ. Eff. 2019, 41, 1403–1433. [CrossRef]
16. Kelektsoglou, K. Carbon capture and storage: A review of mineral storage of CO2 in Greece. Sustainability2018, 10, 4400. [CrossRef]
17. National Oceanic and Atmospheric Administration (NOAA). Available online: https://www.noaa.gov(accessed on 18 May 2019).
18. The Intergovernmental Panel on Climate Change (IPCC). Summary for Policymakers. In Climate Change2014: Mitigation of Climate Change. Contribution of Working Group III to the Fifth Assessment Report of theIntergovernmental Panel on Climate Change; Edenhofer, O., Pichs-Madruga, R., Sokona, Y., Farahani, E.,Kadner, S., Seyboth, K., Adler, A., Baum, I., Brunner, S., Eickemeier, P., et al., Eds.; Cambridge UniversityPress: Cambridge, UK; New York, NY, USA, 2014.
19. Georgakopoulos, E.; Santos, R.M.; Chiang, Y.W.; Manovic, V. Two-way Valorization of Blast Furnace Slag:Synthesis of Precipitated Calcium Carbonate and Zeolitic Heavy Metal Adsorbent. J. Vis. Exp. 2017, 120,e55062. [CrossRef] [PubMed]
20. Azadi, M.; Edraki, M.; Farhang, F.; Ahn, J. Opportunities for mineral carbonation in Australia’s miningindustry. Sustainability 2019, 11, 1250. [CrossRef]
21. Ibrahim, M.; El-Naas, M.; Benamor, A.; Al-Sobhi, S.; Zhang, Z. Carbon Mineralization by Reaction withSteel-Making Waste: A Review. Processes 2019, 7, 115. [CrossRef]
22. Dindi, A.; Quang, D.V.; Vega, L.F.; Nashef, E.; Abu-Zahra, M.R.M. Applications of fly ash for CO2 capture,utilization, and storage. J. CO2 Util. 2019, 29, 82–102. [CrossRef]
23. Carbon cure Technologies. Available online: https://www.carboncure.com/ (accessed on 28 June 2019).24. Carbon8 Systems. Available online: http://c8s.co.uk/ (accessed on 28 June 2019).25. Mineral Carbonation International. Available online: https://www.mineralcarbonation.com/ (accessed on 28
June 2019).26. Solidia Technologies. Available online: https://solidiatech.com/ (accessed on 28 June 2019).27. Olajire, A.A. A review of mineral carbonation technology in sequestration of CO2. J. Pet. Sci. Eng. 2013, 109,
364–392. [CrossRef]28. Li, J.; Jacobs, A.D.; Hitch, M. Direct aqueous carbonation on olivine at a CO2 partial pressure of 6.5 MPa.
Energy 2019, 173, 902–910. [CrossRef]29. Farhang, F.; Oliver, T.K.; Rayson, M.S.; Brent, G.F.; Molloy, T.S.; Stockenhuber, M.; Kennedy, E.M. Dissolution
of heat activated serpentine for CO2 sequestration: The effect of silica precipitation at different temperatureand pH values. J. CO2 Util. 2019, 30, 123–129. [CrossRef]
30. Haque, F.; Santos, R.M.; Dutta, A.; Thimmanagari, M.; Chiang, Y.W. Co-Benefits of Wollastonite Weatheringin Agriculture: CO2 Sequestration and Promoted Plant Growth. ACS Omega 2019, 4, 1425–1433. [CrossRef]
31. Stopic, S.; Dertmann, C.; Modolo, G.; Kegler, P.; Neumeier, S.; Kremer, D.; Wotruba, H.; Etzold, S.; Telle, R.;Rosani, D.; et al. Synthesis of Magnesium Carbonate via Carbonation under High Pressure in an Autoclave.Metals 2018, 8, 993. [CrossRef]

Sustainability 2019, 11, 4156 21 of 22
32. Nowamooz, A.; Dupuis, J.C.; Beaudoin, G.; Molson, J.; Lemieux, J.M.; Horswill, M.; Fortier, R.; Larachi, F.;Maldague, X.; Constantin, M.; et al. Atmospheric Carbon Mineralization in an Industrial-Scale ChrysotileMining Waste Pile. Environ. Sci. Technol. 2018, 52, 8050–8057. [CrossRef] [PubMed]
33. Kim, H.-J.; Lee, H.-K. Mineral Sequestration of Carbon Dioxide in Circulating Fluidized Bed CombustionBoiler Bottom Ash. Minerals 2017, 7, 237. [CrossRef]
34. Haque, F.; Chiang, E.; Santos, R.M. Alkaline Mineral Soil Amendment: A Climate Change ‘StabilizationWedge’? Energies 2019, 12, 2299. [CrossRef]
35. Casiflux F Technical Data; Sibelco Specialty Minerals Europe: Antwerp, Belgium, 2011.36. Daval, D.; Martinez, I.; Corvisier, J.; Findling, N.; Goffé, B.; Guyot, F. Carbonation of Ca-bearing silicates,
the case of wollastonite: Experimental investigations and kinetic modeling. Chem. Geol. 2009, 265, 63–78.[CrossRef]
37. Liu, W.; Song, L.; Xu, C.; Rohani, S.; Chen, M.; Liang, B.; Li, C. Combined synthesis of Li4SiO4 sorbent withhigh CO2 uptake in the indirect carbonation of blast furnace slag process. Chem. Eng. J. 2019, 370, 71–80.[CrossRef]
38. Rashid, M.I.; Benhelal, E.; Farhang, F.; Oliver, T.K.; Rayson, M.S.; Brent, G.F.; Stockenhuber, M.; Kennedy, E.M.Development of Concurrent grinding for application in aqueous mineral carbonation. J. Clean. Prod. 2019,212, 151–161. [CrossRef]
39. Rigopoulos, I.; Ioannou, I.; Delimitis, A.; Efstathiou, A.; Kyratsi, T. Ball Milling Effect on the CO2 Uptake ofMafic and Ultramafic Rocks: A Review. Geosciences 2018, 8, 406. [CrossRef]
40. Wang, F.; Dreisinger, D.B.; Jarvis, M.; Hitchins, T. The technology of CO2 sequestration by mineral carbonation:Current status and future prospects. Can. Metall. Q. 2018, 57, 46–58. [CrossRef]
41. Dudhaiya, A.; Santos, R.M. How Characterization of Particle Size Distribution Pre- and Post-ReactionProvides Mechanistic Insights into Mineral Carbonation. Geosciences 2018, 8, 260. [CrossRef]
42. Ptácek, P.; Nosková, M.; Brandštetr, J.; Šoukal, F.; Opravil, T. Mechanism and kinetics of wollastonite fibredissolution in the aqueous solution of acetic acid. Powder Technol. 2011, 206, 338–344. [CrossRef]
43. Georgakopoulos, E.; Santos, R.M.; Chiang, Y.W.; Manovic, V. Influence of process parameters on carbonationrate and conversion of steelmaking slags—Introduction of the ‘carbonation weathering rate’. GreenhouseGases Sci. Technol. 2016, 6, 470–491. [CrossRef]
44. Daval, D.; Martinez, I.; Guigner, J.-M.; Hellmann, R.; Corvisier, J.; Findling, N.; Dominici, C.; Goffé, B.; Guyot, F.Mechanism of wollastonite carbonation deduced from micro- to nanometer length scale observations. Am.Mineral. 2009, 94, 1707–1726. [CrossRef]
45. Huijgen, W.J.J.; Witkamp, G.J.; Comans, R.N.J. Mechanisms of aqueous wollastonite carbonation as a possibleCO2 sequestration process. Chem. Eng. Sci. 2006, 64, 4242–4251. [CrossRef]
46. Peuble, S.; Godard, M.; Gouze, P.; Leprovost, R.; Martinez, I.; Shilobreeva, S. Control of CO2 on flow andreaction paths in olivine-dominated basements: An experimental study. Geochim. Cosmochim. Acta 2019, 252,16–38. [CrossRef]
47. Zhao, Q.; Liu, C.J.; Jiang, M.F.; Saxén, H.; Zevenhoven, R. Preparation of magnesium hydroxide fromserpentinite by sulfuric acid leaching for CO2 mineral carbonation. Miner. Eng. 2015, 79, 116–124. [CrossRef]
48. Abu Fara, A.; Rayson, M.R.; Brent, G.F.; Oliver, T.K.; Stockenhuber, M.; Kennedy, E.M. Formation of magnesiteand hydromagnesite from direct aqueous carbonation of thermally activated lizardite. Environ. Prog. Sustain.Energy 2019. [CrossRef]
49. Helgeson, H.C. Kinetics of mass transfer among silicates and aqueous solutions. Geochim. Cosmochim. Acta1971, 35, 421–469. [CrossRef]
50. Bodor, M.; Santos, R.M.; Kriskova, L.; Elsen, J.; Vlad, M.; Van Gerven, T. Susceptibility of mineral phases ofsteel slags towards carbonation: Mineralogical, morphological and chemical assessment. Eur. J. Mineral.2013, 25, 533–549. [CrossRef]
51. Santos, R.M.; Van Bouwel, J.; Vandevelde, E.; Mertens, G.; Elsen, J.; Van Gerven, T. Accelerated mineralcarbonation of stainless steel slags for CO2 storage and waste valorization: Effect of process parameters ongeochemical properties. Int. J. Greenhouse Gas Control 2013, 17, 32–45. [CrossRef]
52. Santos, R.M.; Thijs, J.; Georgakopoulos, E.; Chiang, Y.W.; Creemers, A.; Van Gerven, T. Improving the Yieldof Sonochemical Precipitated Aragonite Synthesis by Scaling up Intensified Conditions. Chem. Eng. Commun.2016, 203, 1671–1680. [CrossRef]
53. Faust, G.T. Thermal analysis studies on carbonates I. aragonite and calcite. Am. Mineral. 1950, 35, 207–224.
Sustainability 2019, 11, 4156 22 of 22
54. Santos, R.M.; Bodor, M.; Dragomir, P.N.; Vraciu, A.; Vlad, M.; Gerven, T.V. Magnesium chloride as a leachingand aragonite-promoting self-regenerative additive for the mineral carbonation of calcium-rich materials.Miner. Eng. 2014, 59, 71–81. [CrossRef]
55. Santos, R.M.; Ling, D.; Sarvaramini, A.; Guo, M.; Elsen, J.; Larachi, F.; Beaudoin, G.; Blanpain, B.; Van Gerven, T.Stabilization of basic oxygen furnace slag by hot-stage carbonation treatment. Chem. Eng. J. 2012, 203,239–250. [CrossRef]
56. Apesteguia, M.; Plante, A.F.; Virto, I. Methods assessment for organic and inorganic carbon quantification incalcareous soils of the Mediterranean region. Geoderma Reg. 2018, 12, 39–48. [CrossRef]
57. Fonnesbeck, B.B.; Boettinger, J.L.; Lawley, J.R. Improving a Simple Pressure-Calcimeter Method for InorganicCarbon Analysis. Soil Sci. Soc. Am. J. 2013, 77, 1553–1562. [CrossRef]
58. Rajesh, R.; Brindha, K.; Elango, L. Groundwater Quality and its Hydrochemical Characteristics in a ShallowWeathered Rock Aquifer of Southern India. Water Qual. Expo. Heal. 2015, 7, 515–524. [CrossRef]
59. Harvey, D. Section 9.2: Acid-Base Titrations. Modern Analytical Chemistry 2.0. Available online: http://dpuadweb.depauw.edu/harvey_web/eTextProject/pdfFiles/AnalChem2.0.pdf (accessed on 25 July 2019).
60. Fagerlund, J.; Son, M. Gasometric determination of CO2 released from carbonate materials. J. Chem. Educ.2010, 87, 1372–1376. [CrossRef]
61. Bajpai, P. Pulping Calculations. In Biermann’s Handbook of Pulp and Paper, 3rd ed; Elsevier: Dehradun, India,2018; Volume 1, pp. 353–373.
62. Khaitan, S.; Dzombak, D.A.; Lowry, G.V. Chemistry of the Acid Neutralization Capacity of Bauxite Residue.Environ. Eng. Sci. 2009, 26, 873–881. [CrossRef]
63. Duan, Z.; Sun, R. An improved model calculating CO2 solubility in pure water and aqueous NaCl solutionsfrom 273 to 533 K and from 0 to 2000 bar. Chem. Geol. 2003, 193, 257–271. [CrossRef]
64. Santos, R.M.; Van Audenaerde, A.; Chiang, Y.W.; Iacobescu, R.I.; Knops, P.; Van Gerven, T. Nickel Extractionfrom Olivine: Effect of Carbonation Pre-Treatment. Metals 2015, 5, 1620–1644. [CrossRef]
65. Moomaw, W.; Burgherr, P.; Heath, G.; Lenzen, M.; Nyboer, J.; Verbruggen, A. Annex II: Methodology. In IPCCSpecial Report on Renewable Energy Sources and Climate Change Mitigation; Edenhofer, O., Pichs-Madruga, R.,Sokona, Y., Seyboth, K., Matschoss, P., Kadner, S., Zwickel, T., Eickemeier, P., Hansen, G., Schlömer, S., et al.,Eds.; Cambridge University Press: Cambridge, UK; New York, NY, USA, 2011.
66. Santos, R.M.; Francois, D.; Mertens, G.; Elsen, J.; Van Gerven, T. Ultrasound-intensified mineral carbonation.Appl. Therm. Eng. 2013, 57, 154–163. [CrossRef]
67. Costa, G.; Polettini, A.; Pomi, R.; Stramazzo, A.; Zingaretti, D. Energetic assessment of CO2 sequestrationthrough slurry carbonation of steel slag: A factorial study. Greenhouse Gases Sci. Technol. 2016, 7, 530–541.[CrossRef]
© 2019 by the authors. Licensee MDPI, Basel, Switzerland. This article is an open accessarticle distributed under the terms and conditions of the Creative Commons Attribution(CC BY) license (http://creativecommons.org/licenses/by/4.0/).