
MilxXplore: a web-based system to explore large imaging datasets
17
MilxXplore: A web‐based system to explore large imaging datasets Bourgeat P 1 , Dore V 1 , Villemagne VL 2 , Rowe CC 2 , Salvado S 1 , Fripp J 1 1. CSIRO Preventative Health National Research Flagship ICTC, The Australian e‐Health Research Centre, Royal Brisbane and Women's Hospital, Herston, QLD, Australia. 2. Dept of Nuclear Medicine and Centre for PET, Austin Health, VIC, Australia Corresponding author: Pierrick Bourgeat Address: Level 5, UQ Health Sciences Building 901/16, Royal Brisbane and Women's Hospital ,Herston, Queensland 4029, Australia Tel: +61 7 3253 3600 Email: [email protected] Keywords: Image analysis, Reporting Word count: 4113
-
Upload
independent -
Category
Documents
-
view
0 -
download
0
Transcript of MilxXplore: a web-based system to explore large imaging datasets

MilxXplore: A web‐based system to explore large imaging datasets
Bourgeat P1, Dore V1, Villemagne VL2, Rowe CC2, Salvado S1, Fripp J1
1. CSIRO Preventative Health National Research Flagship ICTC, The Australian e‐Health
Research Centre, Royal Brisbane and Women's Hospital, Herston, QLD, Australia.
2. Dept of Nuclear Medicine and Centre for PET, Austin Health, VIC, Australia
Corresponding author:
Pierrick Bourgeat
Address: Level 5, UQ Health Sciences Building 901/16, Royal Brisbane and Women's Hospital,Herston, Queensland 4029, Australia
Tel: +61 7 3253 3600
Email: [email protected]
Keywords: Image analysis, Reporting
Word count: 4113

Abstract
Objective As large scale medical imaging studies are becoming more common, there is an increasing reliance
on automated software to extract quantitative information from these images. As the size of the cohorts keeps
increasing with large studies, there is a also a need for tools that allow results from automated image
processing and analysis to be presented in a way that enables fast and efficient quality checking, tagging and
reporting on cases where automatic processing failed or was problematic.
Materials and Methods MilxXplore is an open source visualisation platform, which provides an interface to
navigate and explore imaging data in a web‐browser, giving the end user the opportunity to perform quality
control and reporting in a user friendly, collaborative and efficient way.
Discussion Compared to existing software solutions which often provide an overview of the results at the
subject’s level, MilxXplore pools the results of individual subjects and timepoints together, allowing easy and
efficient navigation and browsing through the different acquisitions of a subject over time, and comparing the
results against the rest of the population.
Conclusion MilxXplore is fast, flexible and allows remote quality checks of processed imaging data, facilitating
data sharing and collaboration across multiple locations, and can be easily integrated into a cloud computing
pipeline. With the growing trend of open data and open science, such tool will become increasingly important
to share and publish results of imaging analysis.
BACKGROUND AND SIGNIFICANCE
Large scale imaging studies focusing on a particular disease have become a powerful investigation tool in
medical research. They often include hundreds, and sometimes thousands of subjects who are imaged using
multiple imaging modalities and contrasts acquired over multiple timepoints. For example, the Alzheimer’s
Disease Neuroimaging Initiative (ADNI ) [1] was one of the first large scale imaging study investigating
Alzheimer’s disease comprising 800 subjects imaged with Magnetic Resonance Imaging (MRI) and Positron
Emission Tomography (PET) over several years at multiple timepoints. It was followed by the Australian
Imaging, Biomarkers and Lifestyle Flagship study of Ageing (AIBL) [2] where close to 250 subjects were imaged
with MRI and PET using an Amyloid marker (PiB). Both studies were subsequently extended to increase the size
of the cohort and the number of timepoints. Similar clinical studies of Alzheimer’s were then initiated in
Europe, Japan, Taiwan, Korea and China. Several other large scale open access imaging studies are investigating
neurological disorders such as Parkinson [3] (N= 600), Autism [4] (N=1112) and Fronto‐temporal dementia [5]
(N=240), looking at individuals with and without dementia across the adult life span [6,7] (N=416), or looking at
brain connectivity in healthy controls [8] (N=1200). The availability of these large open source datasets has had
a tremendous effect on the scientific outputs in the medical image analysis community, with ADNI, for
example, reporting over 340 journal publications resulting from the use of their data.

With ever more data available to the research community arises the issues of analysing and extracting
quantitative information from each image to perform clinical and statistical analysis on the entire cohort. As a
result, there’s has been a strong motivation in the medical image analysis community to develop integrated
software or processing pipelines to analyse large datasets, and extract clinically relevant measurements, such
as the volume or thickness of specific structures in the brain or the retention of PET tracers in such regions.
A great challenge for the medical imaging community developing these software is to communicate the results
of the image analysis to the clinical research community, who relies on these results to support their own
research. Most image analysis software generate new images (such as an image registered to an atlas or the
labelling of anatomical structures), and some quantitative metrics (often in text format such as volume,
thickness, etc... ) for whole organ, areas within those organs, or even for each pixel. Clinicians are often
overwhelmed by the complexity of the image processing algorithms and can use the results without any clear
understanding of the methods used or the ability to check intermediate processing steps. This often leads to
blind acceptance of the results, or tedious and time consuming visual inspection of image registration or
segmentation for example, a solution only feasible for small cohorts of subjects or for obvious outliers. As the
size of the cohorts keeps increasing, there is a need for tools allowing to present results (as well as automated
quality controls) from image processing and analysis in a way that enables fast and efficient quality check,
tagging cases where automatic processing failed, customising options, or performing some manual
intervention if needed.
The commonly used neuroimaging software, as described in Table 1, have inexistent or limited reviewing
capabilities. They also have a rigid framework, which limits customisation of the reports for specific needs or
cross comparison. To address these shortcomings, a reporting software should have the following
requirements: quick, easy and efficient reviewing of various image processing actions; summary of user defined
metrics (usually provided by the software or extracted from the data); web‐based interface to add user
generated reports which can be used for collaborative work; adaptable to various imaging software.
With the growing availability of supercomputers, and cloud computing interfaces, some of these software
solutions are now starting to be available through web portals, facilitating and accelerating the processing for
the end user without the need to maintain a large computing facility on site. A typical setup involves a
datastore to remotely manage/share/serve the data (PACS, XNAT [9], etc...). A processing pipeline
(MilxView[10], Freesurfer[11], LONI Pipeline[12], etc...) will then query the datastore to access a dataset,
process the data, and send back the results to the end user, typically through the datastore (Figure 1). Quality
control in such setup becomes even more problematic as a large volume of data needs to be downloaded for
review, and intermediate results might not be necessarily saved, or made available to the end user. A web‐
based solution would alleviate some of the issues with quality control for remotely processed data.

Generates
Reports
Reporting at various stages
of the processing pipeline
Subject/population based Report
format
FreeSurfer No Manual review of
individual images and
meshes
NA NA
NeuroQuant Yes Limited to a fixed
reporting template
Population based: graphs
show selected metric of the
subject with regard to a
fixed reference population
FSL Yes Application dependant Subject based: the report
only shows the subject
html
SPM Yes Manual review of
individual images
Population based: glass
brain show t‐values with
regard to the reference
population
Table 1: Review of existing software’s capability for review of processed data.
With these requirements in mind, we have developed MilxXplore (pronounced “milx explore”), a tool designed
to explore the results of a processing pipeline via a web browser in a fast, simple and intuitive way. MilxXplore
gives the option to assess the results qualitatively and quantitatively, and has support for recording quality
control checks and marking images for reprocessing. MilxXplore is designed to be called at the end of the
processing pipeline (Figure 1), to summarise and extract relevant information from the generated results
(images/meshes/spreadsheets) via thumbnails, tables and graphs. The resulting report is light‐weight and can
be accessed remotely by a web browser without the need to download large quantity of data.
OBJECTIVE
The aim of MilxXplore is to simplify the representation of data, and to aggregate the results for fast and user
friendly exploration of imaging data. In simple analysis, 3D volumes are converted to 2D thumbnails of
representative slices, segmentations are overlayed on the source images, 3D meshes are summarised by 2D
projections, quantitative measurements are presented in tables and graphs showing the changes over time,
and when possible compared to a normative metrics from a control population.
In this paper we present an overview of MilxXplore, discuss the design choices, and will show how MilxXplore
can be integrated in the workflow of an imaging study. Example reports showcasing the capabilities of
MilxXplore on a subset of the AIBL study and the Open Access Series of Imaging Studies (OASIS) [6,7] can be
accessed at http://milxview.csiro.au/MilxXplore.
MATERIALS AND METHODS
MilxXplore is a PHP (http://php.net) web‐application implemented within the Symfony (http://symfony.com)
framework. The Symfony framework provides a core set of libraries that are easily extended and utilized for a
diverse set of applications including content management.
A general overview of MilxXplore is provided in Figure 2. The MilxXplore core libraries generate all the 2D
thumbnails, multi‐slice extraction and various fused / augmented / rendered visualization from high
dimensional volumes (typically 3 dimensions), the generation of graphs (using the statistical package R), and
the inclusion of these graphs in the resulting html pages.
The reporting utilized by each experiment in a study, is generated from a user customizable configuration file.
This file describes the type of visualization and graphs required, the metrics to be displayed on the report and
the images to be displayed. A configuration wizard provides an intuitive interface to generate the configuration
file, and provides standard default options tailored to the software used to process the data (the current
release provides pre‐configured templates for MilxView and FreeSurfer).
A database (currently populated from csv formatted text files) contains all the demographic information of the
subjects (Age, diagnosis, sex, etc...), the metric that have been extracted by the imaging analysis pipeline
(volume, thickness, PET retention, etc...) and other relevant information/metrics (scores from
neuropsychological evaluation, genotyping, etc...), a subject CaseID, and the time points. The information is
queried by PHP from the database to dynamically populate tables, graphs and generate the html pages,
allowing dynamic web reporting.
RESULTS
Study/Experiment management and security
User authentication is handled by the Symfony framework: ”Symfony's security system works by determining
who a user is (i.e. authentication) and then checking to see if that user should have access to a specific
resource or URL”. It would be possible, however, to extend this and utilize external authentication provided by
other data management software.
Using the obtained authentication, MilxXplore then provides access controls for each ‘experiment’ in a study.
This allows the sharing of specific study or experiment with a user or defining studies as being private or public.
Users can also be given privileges, such as validating (usually some type of quality control) the data or editing
the database. For increased safety, information about each studies (demographics, statistics) are kept in

separate databases using SQLite, so that there is never one database containing all the information about all
studies. Security can be enhanced by enabling SSL encryption on all traffic. As with all remote application, there
remains a security risk when sharing data on the internet, and it is recommended to use MilxXplore on a
(virtual) private network.
When setting up a new study, the user starts by adding a new study/experiment, setting up permissions and
adding a summary/description of the study. There are multiple levels of permission defined for each study:
1. Private: Access is restricted to the owner
2. ProtectedPlus: Access is restricted to the owner and authorised users (not publically listed or
searchable)
3. Protected: Similar to ProtectedPlus, but the experiment summary is publicly available so that other
users can request access
4. Public: Accessible to all users.
The permissions are defined when the study is created, but can be changed at a later time.
Experiment Setup
After setting up a new experiment within a study, the owner uploads a demographic file (currently a csv), which
gives information about the subjects (such as age, sex, years of education, diagnosis, etc...) and one or more
statistics file (such as volumes in various regions of interest, cortical thickness, PET retention, etc...) which were
generated by the processing pipeline. These files are then added to the database. The next step is to configure
the rendering of the study, which is done through a configuration wizard. The wizard will guide the users
through the various steps of configuring the image and mesh rendering, parameters of the graphs (with the
axis defined by drop‐down boxes, populated using the database entries), and other information to be displayed
on the summary page and subject page. At the end of the wizard, the user can render a test page for a given
subject to verify that all the parameters are correct, and once satisfied with the results, run the rendering on
the entire study. The rendering is run in the background, and the user can start browsing the website and view
the results as they are being processed.
One important aspect of medical image visualisation is that the rendering profiles needs to be customised for
each modality. For example, a greyscale colour map is most suitable for most MRI acquisition, whereas a colour
map is more suitable for PET images, and a colour map with a discrete set of non sequential colours will be
more suitable to display a parcellation. Also, the intensity of an MR image is not quantitative, and therefore its
intensity needs to be rescaled for display, whereas PET images, after normalisation (e.g. normalised uptake to a
reference region), are quantitative and do not require any additional rescaling.

Defining the best options for image rendering can be quite time consuming, and the approach used by
MilxXplore is to used predefined rendering profiles, which can be selected by the user through the
configuration wizard. These rendering profiles have been preset based on previous experience on the best
visualisation for each modalities. For more advanced users, these profiles can be easily extended and added as
an additional template type (using a text editor). This leaves the user to select the rendering profile, image
overlay if required, and text to be overlayed on the rendered screenshots in the configuration wizard. The text
can be a simple string or any field queried from the database for that subject. Reference masks (or label
images) can also be declared in the configuration, and are then used to perform the appropriate normalization
(such as trimming the top N% of the intensity within a mask, which is most robust way to normalise the
intensity of a brain T1W MRI using the white matter mask).
This configuration means that most use cases can be achieved and applied to the whole experiment. The
example presented in Figure 3 shows a T1W image, along with its corresponding whole brain segmentation,
with the total gray matter volume overlayed on the display.
Data exploration
Figure 4 shows the experiment page of MilxXplore, which contains links to various imaging reports (Figure 4.A)
with each report showing the thumbnails of all subjects corresponding to a specific representation (for
example showing the hippocampus segmentations of the entire population). Below (Figure 4.B) is a link to the
extracted measurements in a text file. Then (Figure 4.C) is a link to all the subject’s reports, each containing all
the measurements and images of all acquisitions for the subject of interest (Figure 5). The tables contain the
selected measures for all timepoints so that the end user can quickly assess the evolution of the subject over
time. Links at the top of the page allows the navigation between the reports at each time point. The graphs
also represent the evolution of the metrics over time, and against the selected population of reference. Below
the graphs, representative 2D views in axial, saggital and coronal views of the 3D volumes are included. These
can be either simple 2D views to show a particular MRI or PET image, or overlays of one image on the top of
another to illustrate for example the accuracy of a registration or segmentation of a region of interest (Fig 5).
By clicking on one image, the user can navigate between the images representing the same information in all
timepoints. This is particularly useful to visually check the changes over time, such as brain atrophy over time,
and changes in PET retention.
Data validation
A validation tab can be defined for each experiment (Figure 6.A) and then become available on each subject’s
page. This allows the end user to validate the analysis for each subject, or to report problems and mark the
subject for re‐analysis. The choice is then recorded in the database, and this can be used as a check before the
analysis for this subject is externally published. An example of the validation tab is presented in Figure 6. The
results of the validation are then summarised on the study summary page in the form of small icons next to
each subject ID (Figure 4.C).

In addition to the manual validation, automated tests can be set‐up on the detect outliers based on the metrics
provided in the statistics files, and stored in the database. The user can define an acceptable lower and upper
bound on these metrics, and any case falling outside these bounds will tagged as an outlier.
Integration in the analysis workflow of an imaging study
Using XNAT as an example of datastore, new images are first de‐identified, uploaded by the clinical research
sites to XNAT. At this stage, the processing pipeline can be automatically started and the MilxXplore study
website is updated. An approved investigator can log on the secured website, where he can see the entire
cohort with the clinically relevant information. He can then access the reports of the new subjects that have
been tagged as “Unverified” on the main page, and visually check the registration of the PET to the MRI, the
segmentation of the brain, ventricles, and the hippocampus, or check that the regions used for intensity
normalisation of the PET images are properly defined. He can also navigate between time points to verify
consistency of the registrations or segmentations over time. He can further investigate the subject’s
hippocampus volume as a function of age with respect to the control population, and recognize that its volume
is close to the 95% confidence interval line, suggesting accelerated atrophy. To inspect the hippocampus more
closely he can download the 3D image and visualize it with a standard viewer. This could be confirmed by the
clinical information on top of the page showing a low MMSE score for example. If he is satisfied with the image
analysis he would validate the processed images using the side menu and also add a comment. The files are
flagged as “Verified” and locked. On the main page he can download the measurements spreadsheet to study
the correlation of the hippocampus with PiB retention.
DISCUSSION
To further illustrate the need for reporting tool, we looked at the three most commonly used free software
packages for neuroimaging analysis: the Statistical Parametric Mapping toolbox (SPM) [13] for volumetric
analysis and FMRI studies, FreeSurfer for cortical thickness measurements, and FSL [14] for volumetric analysis.
Freesurfer does not offer any reporting capability, the user has to manually load all the meshes and results in
the FreeSurfer viewer. A commercial software derived from FreeSurfer (NeuroQuant), provides a morphometric
report for each subject in pdf format, containing representative screenshots of the segmented structures,
overlayed on the MRI, and volume measurements of the hippocampus and the ventricles. An example of such
report can be found on NeuroQuant’s website
(http://www.cortechs.net/includes/getPDF.php?p=NeuroQuantAgeReport.pdf). One of the interesting features
of such report is the Age‐related atrophy reporting which includes a graph showing the normal volume for the
population with lines representing the 50% and 95% percentiles. This provides a good overview of the overall
status of the subject of interest in the general population and gives some extra mean to perform quality
control. There are however several limitations to this approach as the output cannot be customised, and it can
only be run with NeuroQuant processing pipeline; there is a single pdf report per subject, which can make it
tedious to review the results; it is limited to MRI morphometry (it cannot include other modalities such as PET
imaging); it does not include information about longitudinal changes; the reference population is predefined,
and cannot be changed.
For population analysis, SPM generates a pdf file for each subject showing the regions of significant
difference on a “glass” brain, and p‐values for the identified clusters. This approach allows the user to quickly
visualise the regions of importance on a template. It does not, however, give the user the ability to easily check
the accuracy of the different steps that were accomplished before the final result, such as the normalisation to
the template, or the segmentation of the gray matter for volumetric analysis. The user has to load and visualize
individual files that have been saved during the processing. The generation of one pdf file per subject can also
be cumbersome and time consuming to review.
FSL offers automatic reporting, generating an html page showing the results of the each of the steps
involved in the analysis with one or multiple slices of the image of interest in axial, coronal and saggital views.
For example, running the “Structural Image Evaluation, using Normalisation, of Atrophy” tool (SIENA), will
generate an html page showing the resulting of the following tools: the brain extraction tool (BET) with the
extracted brain mask overlayed on the MRI of the brain; FMRIB's Linear Image Registration Tool (FLIRT) with an
animation alternating between the baseline and follow‐up MRI after co‐registration; FMRIB's Automated
Segmentation Tool (FAST) showing the segmentation overlayed on the MRI; SIENA showing the regions of
atrophy. An example of such report can be seen on the FSL website
(http://www.fmrib.ox.ac.uk/fslcourse/fsl_course_data/seg_struc/siena_problems/eg3/S2_080_ax_to_S2_121_
ax_siena/report.html). This approach however lacks the higher level of analysis (provided for example by
NeuroQuant) giving no general overview of the metrics derived from the subject of interest with regards of the
general population. This reporting is also part of the execution of the application, which means that it cannot
easily be integrated into other applications.
Whereas the FSL tool generates a standard report per application, independent for each subject,
MilxXplore is study based, which means that the results are driven by the population being analysed. It
includes tools to easily browse through the different acquisitions of a subject over time, allowing for example
to show the atrophy on an MRI, the change in PET retention or the cortical thinning on a 3D mesh. The derived
measurements are also used to build graphs, showing the evolution of these measures over time, and how do
they compare with the population of interest. Another important aspect of MilxXplore is adding a layer of
flexibility so that it can be run on the results generated by most tools that write images in a format that
MilxXplore can use, with minimal human intervention and customisation. Even though MilxXplore has been
presented in a neuroimaging context, it has been applied to other studies, including prostate cancer
segmentation, musculo‐skeletal segmentation of hip, shoulder, knees and spine [15], and even plants
phenotyping with 3D representations of meshes of plants scanned over‐time [16]. MilxXplore can also be easily
extended to include more complicated visualization or analysis (eg. Shape analysis, kinematic analysis,
diffusion).
Limitations
MilxXplore has only been customised to a few studies using our processing pipeline in MilxView and FreeSurfer.
We are planning to extend it to be used with the most commonly used neuro‐imaging softwares such as FSL
and SPM
Review of image processing quality using 2D thumbnails is usually sufficient to detect problems and estimate
the quality of image registration, or whole brain segmentation, but it is not always sufficient to see all the
details of the segmentation of small structures, such as the hippocampus. In such cases, a 3D viewer embedded
inside the webpage that allows slice by slice visualization and zooming may be more suitable (and is planned
for future releases).
Even though MilxXplore is designed to work with any data, even clinical, it is limited to researcher applications,
and is currently not suitable or aimed at clinical applications.
CONCLUSION
As technology evolves, increasingly complex algorithms and pipelines with numerous parameters are employed
in the analysis of imaging data. As the size of studies keep growing, so does the reliance on these automated
methods to extract information from the images. There is a growing need for better tools to explore and
validate data and to perform quality control. MilxXplore aims to fill the missing gap and provide a transparent
reporting and publishing of the results obtained from the automatic data processing before quantitative
numbers are extracted and used in large statistical analysis by clinicians or scientists not expert in computer
science.
We have presented a new tool to allow the efficient investigation of the results of a processing pipeline. It is
fast, flexible and allows remote quality checks of processed imaging data, facilitating data sharing and
collaboration across multiple locations. With the growing trend of open data and open science, such tool will
become increasingly important to share and publish results of imaging analysis.
The source code for MilxXplore is available at: http://milxview.csiro.au/MilxXplore/?q=content/download
ACKNOWLEGDMENT
AIBL is a large collaborative study and a complete list of contributors can be found at our website
www.aibl.csiro.au. We thank all who took part in the study.
COMPETING INTERESTS
We declared to have no competing interests.
FUNDING
This research is supported by the Science and Industry Endowment Fund.
CONTRIBUTORSHIP STATEMENT
PB, JF and VD contributed to the conception and design of the study/software and drafting the article.
OS,CR and VV contributed to critically revising the manuscript for important intellectual content.
REFERENCES
1. Mueller SG, Weiner MW, Thal LJ, Petersen RC, Jack CR, Jagust W, Trojanowski JQ, Toga AW, Beckett L.
Ways towards an early diagnosis in Alzheimer's disease: The Alzheimer's Disease Neuroimaging Initiative
(ADNI). Alzheimers Dement 2005;1:55‐66,
2. Ellis KA, Bush AI, Darby D, De Fazio D, Foster J, Hudson P, Lautenschlager NT, Lenzo N, Martins RN,
Maruff P, Masters C, Milner A, Pike K, Rowe C, Savage G, Szoeke C, Taddei K, Villemagne V, Woodward M, Ames
D and the AIBL Research Group. The Australian Imaging, Biomarkers and Lifestyle (AIBL) study of aging:
methodology and baseline characteristics of 1112 individuals recruited for a longitudinal study of Alzheimer’s
disease. Int Psychogeriatr 2009;21:672‐687.
3. Foundation, T.M.J.F. The Parkinson Progression Marker Initiative (PPMI). Prog Neurobiol 2011;95:629‐
635.
4. Di Martino A, Castellanos X, Anderson J, et al. The Autism Brain Imaging Data Exchange (ABIDE)
consortium: open sharing of autism resting state fMRI [abstract]. OHBM. 2012
5. Frontotemporal‐lobar‐degeneration‐neuroimaging‐initiative:
http://www.radiology.ucsf.edu/cind/research/grants/frontotemporal‐lobar‐degeneration‐neuroimaging‐
initiative
6. Marcus D.S., Wang T.H., Parker J., Csernansky J.G., Morris J.C., Buckner R.L. Open Access Series of
Imaging Studies (OASIS): Cross‐Sectional MRI Data in Young, Middle Aged, Nondemented, and Demented Older
Adults. J Cogn Neurosci 2007;19:1498‐1507.
7. Marcus, DS, Fotenos, AF, Csernansky, JG, Morris, JC, Buckner, RL, 2009. Open Access Series of Imaging
Studies (OASIS): Longitudinal MRI Data in Nondemented and Demented Older Adults. J Cogn Neurosci
2007;22:2677‐2684.
8. Toga A.W., Clark, Kristi A., Thompson, P.M., Shattuck D.W., Van Horn J.D. Mapping the Human
Connectome. Neurosurgery 2012;71:1‐5.
9. Marcus D.S., Olsen T., Ramaratnam M., and Buckner, R.L. The Extensible Neuroimaging Archive Toolkit
(XNAT): An informatics platform for managing, exploring, and sharing neuroimaging data. Neuroinformatics
2007;5:11‐34.
10. Burdett N., Fripp J., Bourgeat P., and Salvado O. MILXView: A Medical Imaging, Analysis and
Visualization Platform. In IFIP Advances in Information and Communication Technology 2010;335:177‐186.

11. Fischl B. FreeSurfer, NeuroImage 2012;62:774‐781.
12. Torri F, Dinov ID, Zamanyan A, Hobel S, Genco A, Petrosyan P, Clark AP, Liu Z, Eggert P, Pierce J, Knowles
JA, Ames J, Kesselman C, Toga AW, Potkin SG, Vawter MP, Macciardi F. Next Generation Sequence Analysis and
Computational Genomics Using Graphical Pipeline Workflows. Genes 2012;3:545‐575.
13. Ashburner J. SPM: a history. Neuroimage 2012;62:791‐800.
14. M. Jenkinson, C.F. Beckmann, T.E. Behrens, M.W. Woolrich, S.M. Smith. FSL. NeuroImage 2012;62:782‐
790.
15. A. Neubert, J. Fripp, C. Engstrom, R. Schwarz, L. Lauer, O. Salvado, S. Crozier. Automated detection, 3D
segmentation and analysis of high resolution spine MR images using statistical shape models. Phys Med Biol.
2012;57:8357‐76
16. A. Paproki, X. Sirault, S. Berry, R. Furbank, and J. Fripp. A novel mesh processing based technique for
3D plant analysis. BMC Plant Biology 2012 12:63.
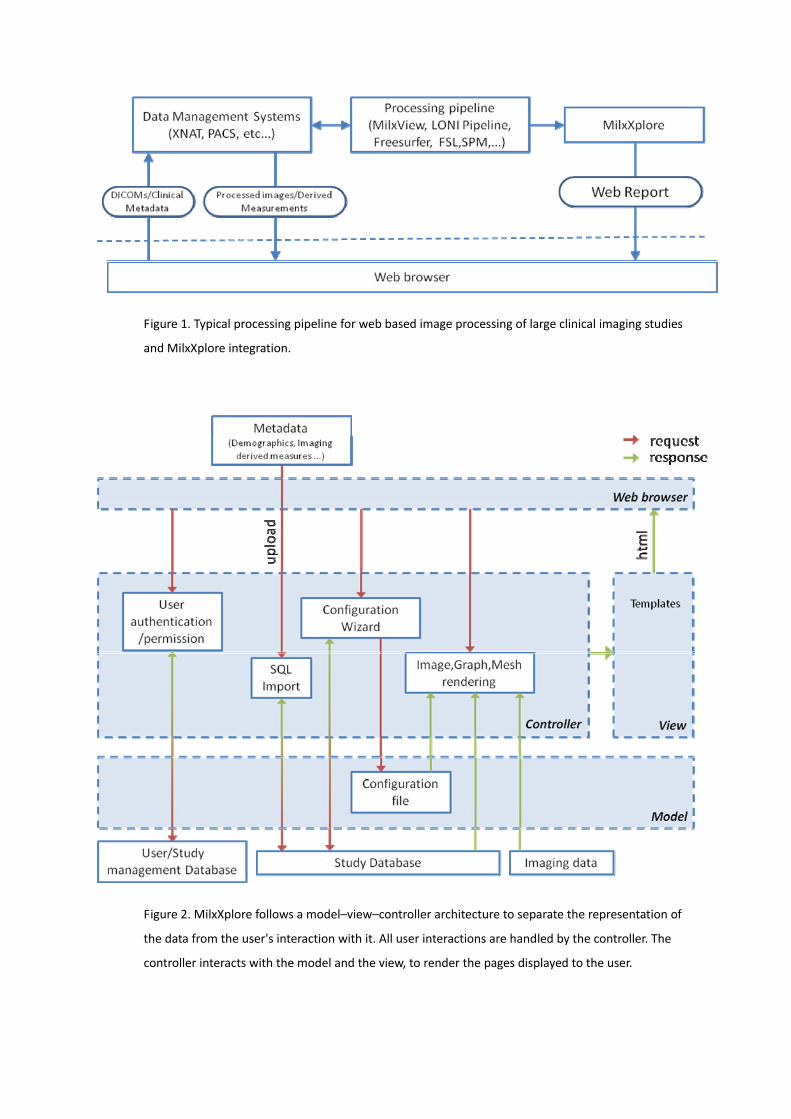
Figure 1. Typical processing pipeline for web based image processing of large clinical imaging studies
and MilxXplore integration.
Figure 2. MilxXplore follows a model–view–controller architecture to separate the representation of
the data from the user's interaction with it. All user interactions are handled by the controller. The
controller interacts with the model and the view, to render the pages displayed to the user.

Figure 3. Example display of the T1 weighted MRI and its corresponding whole brain segmentation
and the total gray matter volume overlayed on the image. These images were automatically generated
by MilxXplore.
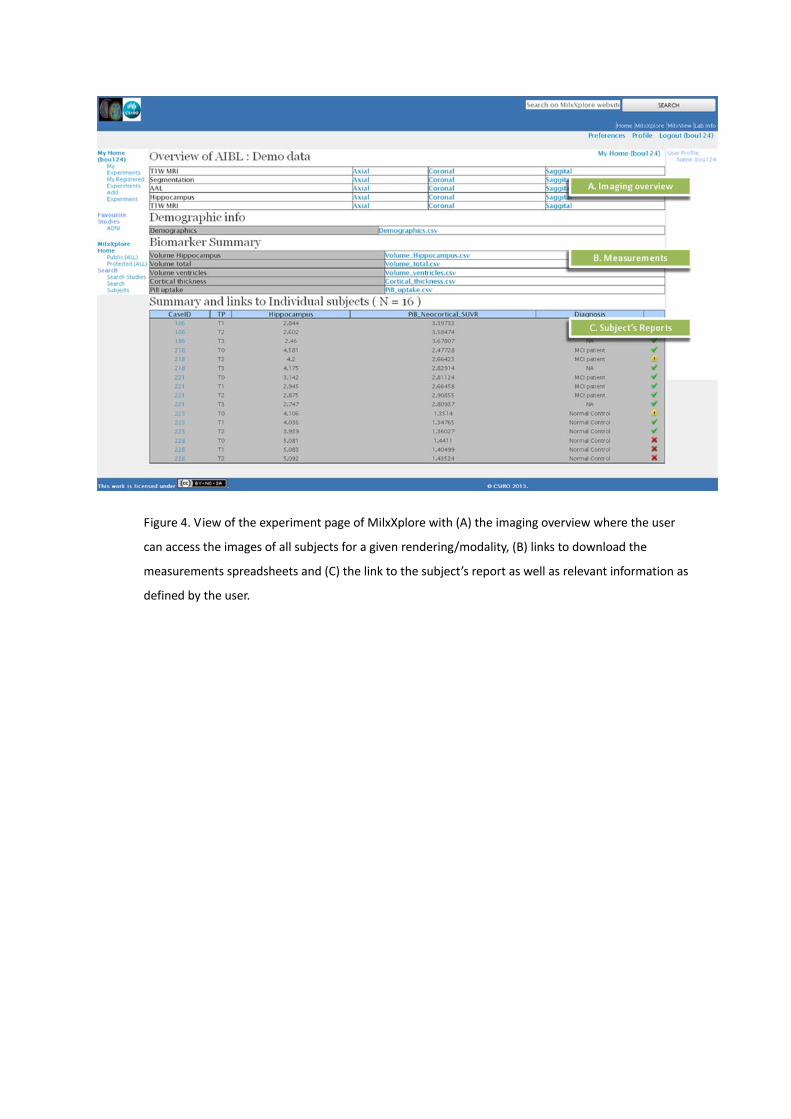
Figure 4. View of the experiment page of MilxXplore with (A) the imaging overview where the user
can access the images of all subjects for a given rendering/modality, (B) links to download the
measurements spreadsheets and (C) the link to the subject’s report as well as relevant information as
defined by the user.
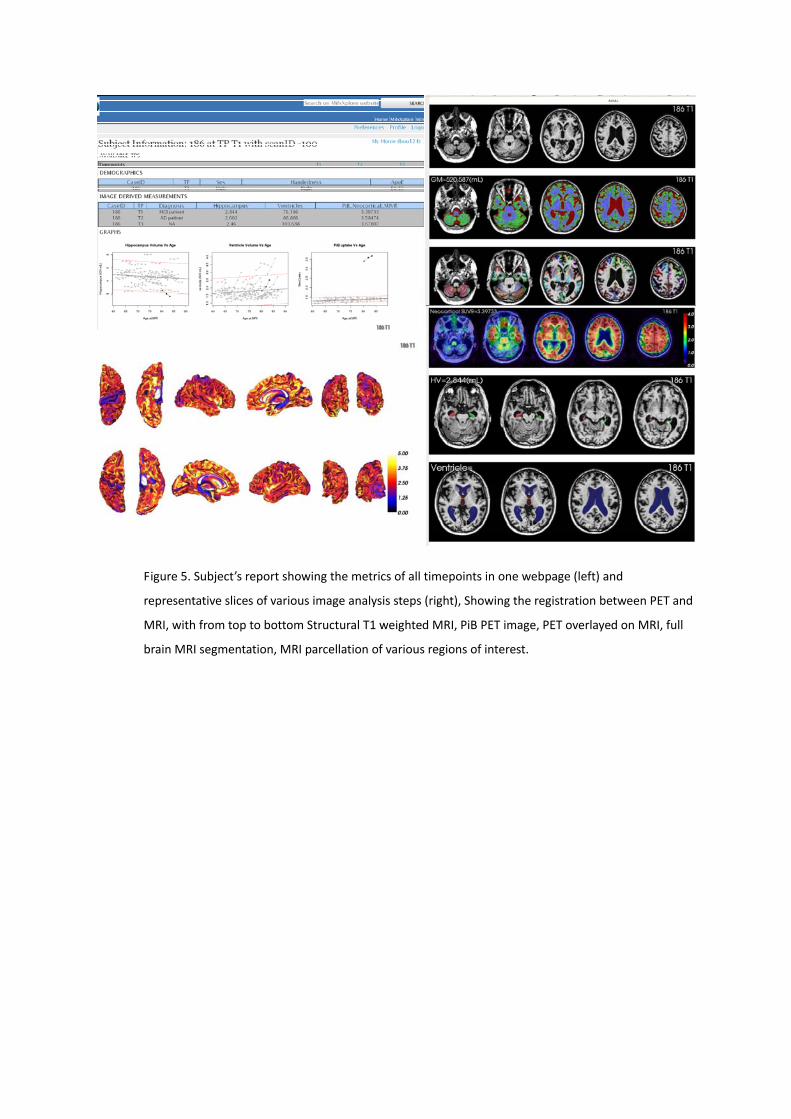
Figure 5. Subject’s report showing the metrics of all timepoints in one webpage (left) and
representative slices of various image analysis steps (right), Showing the registration between PET and
MRI, with from top to bottom Structural T1 weighted MRI, PiB PET image, PET overlayed on MRI, full
brain MRI segmentation, MRI parcellation of various regions of interest.

A. Setting up the data verification in the
configuration wizard
B. The resulting data verification on the subject’s page
Figure 6. (A) The page used to define the questions which will be part of the manual validation and (B)
the resulting validation form used to record quality checks on various image processing steps.