Millimetre wave spectra for solid samples in pulsed magnetic fields
9
J. Phys. E: Sci. Instrum., Vol. 14, 1981. Printed in Great Britain Mi Ili metre wave spectra for solid samples in pulsed magnetic fields A Z Tirkel,? G J Troup, J L A Francey and S S San Department of Physics, Monash University, Clayton, Victoria 3168, Australia Received 23 July 1980, in final form 3 March 1981 Abstract A description is given of a method of obtaining dispersion and absorption spectra from single shot experiments at millimetre wave frequencies. The technique is applied to solid samples placed in limited access cryostats and selected results are shown to illustrate the technique. 1 Introduction The object of many microwave experiments is to determine the reflective and absorptive properties of specimens. In con- tinuous experiments this is relatively easy, because the opera- tor is free to adjust phases and amplitudes within the system, and thus gain information necessary to completely specify the complex refractive index. However, in pulsed experiments this is not so, because in general no adjustments can be made during the period of interest. It is hoped that the method described in this paper will help overcome this problem. The system used was a millimetre wave reflection bridge, where the sample was subjected to intense pulsed magnetic fields (up to 30 T) and a range of temperatures 273-4.2 K. The sample arm was virtually inaccessible, making it the most difficult system encountered so far, and hence attention was focused on it. A transmission bridge was also tested using the method, but this was much easier because the incident and transmitted waves travel through different sections of the guide, and thus could be phase shifted and attenuated separately. 2 Analysis of dispersion and absorption measurements From a schematic point of view, the reflection bridge used was of a very common design as shown in figure 1. The note- worthy feature is the inclusion of the ferrite modulator in the signal arm ; as the following paragraphs will demonstrate, this is the key component used in order to separate dispersion and absorption in the sample. The crux of the method is to prepare the system before the experiment so that it is in either of two known and defined states. State A - the system is primarily sensitive to changes in the real part of the reflection coefficient R. t Present address : Defence and Space Systems Group, TRW Inc., Redondo Beach, Ca. 90278, ,USA. 0-2 MHz ampl. +U Slide - screw $IF] Phase shifter -Y coil Speiimen Specimen chamber Figure 1 Reflection bridge (70 GHz). Components: detector, 1N53B (Parametric Industries Inc.) ; mount, MC 26/17 (Mid-Century Microwave Gear); slide screw tuner, W450 (Hilger); hybrid tee, PM 7260 (Phillips) ; E-H tuner, MC 26/13D (Mid-Century); ferrite modulator, E130 (TRG); phase shifter, MC 26/7 (Mid-century); attenuators MC 26/3 (Mid-Century) ; isolator, PM 7040E (Philips). State B - the system is primarily sensitive to changes in the imaginary part of the reflection coefficient. 2.1 Systempreparation The two types of measuring system used in the experiments were : (i) travelling wave method; (ii) standing wave method (for description see 82.3). The former was considerably easier to set up experimentally, as well as being more readily amenable to theoretical analysis. Of course in general a system contains both travelling as well as standing waves, but by careful alignment, the energy stored in standing wave modes can be reduced sufficiently to render them negligible. 2.1.1 Travelling waue system alignment. Such a system is shown in figure 1. The signal guide length is approximately 400 mm or 100 wavelengths. Reflections from all components 0022-3735/81/101183+09 $01.50 0 1981 The Institute of Physics 1183
Transcript of Millimetre wave spectra for solid samples in pulsed magnetic fields

J. Phys. E : Sci. Instrum., Vol. 14, 1981. Printed in Great Britain
Mi Ili metre wave spectra for solid samples in pulsed magnetic fields
A Z Tirkel,? G J Troup, J L A Francey and S S San Department of Physics, Monash University, Clayton, Victoria 3168, Australia
Received 23 July 1980, in final form 3 March 1981
Abstract A description is given of a method of obtaining dispersion and absorption spectra from single shot experiments at millimetre wave frequencies. The technique is applied to solid samples placed in limited access cryostats and selected results are shown to illustrate the technique.
1 Introduction The object of many microwave experiments is to determine the reflective and absorptive properties of specimens. In con- tinuous experiments this is relatively easy, because the opera- tor is free to adjust phases and amplitudes within the system, and thus gain information necessary to completely specify the complex refractive index. However, in pulsed experiments this is not so, because in general no adjustments can be made during the period of interest. It is hoped that the method described in this paper will help overcome this problem.
The system used was a millimetre wave reflection bridge, where the sample was subjected to intense pulsed magnetic fields (up to 30 T) and a range of temperatures 273-4.2 K. The sample arm was virtually inaccessible, making it the most difficult system encountered so far, and hence attention was focused on it. A transmission bridge was also tested using the method, but this was much easier because the incident and transmitted waves travel through different sections of the guide, and thus could be phase shifted and attenuated separately.
2 Analysis of dispersion and absorption measurements From a schematic point of view, the reflection bridge used was of a very common design as shown in figure 1. The note- worthy feature is the inclusion of the ferrite modulator in the signal arm ; as the following paragraphs will demonstrate, this is the key component used in order to separate dispersion and absorption in the sample. The crux of the method is to prepare the system before the experiment so that it is in either of two known and defined states.
State A - the system is primarily sensitive to changes in the real part of the reflection coefficient R.
t Present address : Defence and Space Systems Group, TRW Inc., Redondo Beach, Ca. 90278, ,USA.
0-2 MHz ampl. +U
Slide - s c r e w $ I F ]
P h a s e shi f ter -Y c o i l
Speiimen Spec imen c h a m b e r
Figure 1 Reflection bridge (70 GHz). Components: detector, 1N53B (Parametric Industries Inc.) ; mount, MC 26/17 (Mid-Century Microwave Gear); slide screw tuner, W450 (Hilger); hybrid tee, PM 7260 (Phillips) ; E-H tuner, MC 26/13D (Mid-Century); ferrite modulator, E130 (TRG); phase shifter, MC 26/7 (Mid-century); attenuators MC 26/3 (Mid-Century) ; isolator, PM 7040E (Philips).
State B - the system is primarily sensitive to changes in the imaginary part of the reflection coefficient.
2.1 Systempreparation The two types of measuring system used in the experiments were : (i) travelling wave method; (ii) standing wave method (for description see 82.3).
The former was considerably easier to set up experimentally, as well as being more readily amenable to theoretical analysis. Of course in general a system contains both travelling as well as standing waves, but by careful alignment, the energy stored in standing wave modes can be reduced sufficiently to render them negligible.
2.1.1 Travelling waue system alignment. Such a system is shown in figure 1. The signal guide length is approximately 400 mm or 100 wavelengths. Reflections from all components
0022-3735/81/101183+09 $01.50 0 1981 The Institute of Physics 1183

A Z Tirkel, G J Troup, J L A Francey and S S San
and joints in that arm have been minimised and the matching of the arms of the magic Tee has been optimised. (The signal guide is that length of guide leading from the E-H tuner to the specimen chamber - the latter being a very low Q cavity with good coupling.)
When operating in square law mode, the receiver detects the beat between the reference beam (that beam which has reached the detector without being influenced by the sample) and the signal beam (that which has been reflected from the sample or perturbed by it in some way). The exact details of the detection process are outlined in 82.2. The output of the receiver is then described by
Vout CC Vref Vsig COS 9
where Vref is the amplitude of the reference, Vsig is the ampli- tude of the signal, rp is the phase difference between the two waves.
The first alignment concerns the requirement that Vref as well as its phase should be independent of the changes in impedance of the signal arm. This can be acheived by adjusting the short circuit in the Tee and the slide screw tuner in the ‘detection arm’ until VrefS 10 Vsig, where Vsig is the maximum variation produced by the E-H tuner, and phase shifter.
The second alignment concerns the phase angle y . However, in order to understand its relation to the preparation of the system (State A or State B of §2), we must consider the pro- cesses going on in the signal guide in more detail.
2.1.2 Signal guide properties. In the ideal situation, the empty signal guide could be represented by a perfect, slightly lossy guide with a short circuit termination.
The loaded guide presents a more complex impedance. Two types of samples were used:
(i) insulators e.g. MnC03, YIG; (ii) semiconductor e.g. InSb.
The equivalent load for the insulator is purely reactive, whilst for the semiconductor a resistive as well as reactive com- ponent is present. None of the samples actually filled the guide, so that these equivalent reactances would vary greatly. Contact with the walls was through GE varnish which would cause its own perturbations.
In spite of all this, the following simplifying assumptions can be made.
(i) There are no self resonant components in the sample. This can be ensured by leaving the back face of the crystal quite rough or irregular in shape, whilst keeping the front polished and regular.
(ii) The specimen thickness is hg/4 where hg is the guide wavelength and the effective impedance is substantially diff- erent from the characteristic impedance of the guide, thus ensuring that the specimen presents a severe mismatch so that one may ignore (for the time being) the effect of the short circuit behind the specimen.
In view of this, the bulk of the wave reflected from the signal guide does originate from the specimen, though two effects tend to complicate the situation in cryogenic experi- ments. In these the cryogenic end of the guide, i.e. the end containing the specimen, must be sealed and pumped to prevent condensation. Therefore spurious reflections occur as a result of (i) presence of vacuum windows (25.4 pm melinex was used) and pump inlet and (ii) gradual change in the impedance of the guide caused by temperature gradients affecting the conductivity of the walls.
These effects are a nuisance in alignment but cause minimal errors in pulsed measurements unless a resonant reflection is excited during the pulse, (such cases are discussed in 82.3). This is because these spurious reflections themselves are not
likely to be affected by the magnetic field during the pulse. Therefore they will be disregarded in the discussion that follows.
2.1.3 Separation of absorption fiom dispersion. The next step in the alignment procedure is to switch on the ferrite modula- tor, and observe the modulation envelope in the detected output of the bridge. The modulator produces square wave power modulation with variable depth set by the driver current. The modulator and driver are described in $3.1 and 53.2. With the modulation depth set high (?go%) the bridge can be used to single out reflections from the sample as opposed to those from the series or shunt arms of the E-H tuner.
The size of the modulation envelope depends on Vref Vsamp cos rp, where Vsamp is the reflection from the sample only. By using the E-H tuner and the phase shifter the size of this envelope can be maximised. It is helpful to use the mode sweep (or some other form of klystron modulation) and ‘zero in’ on the maximum gradually. Once this condition is reached, the signal guide is suffering maximum mismatch. To check that this mismatch is indeed due to the sample, we rotated the sample using a standard gear drive and observed the change in modulation amplitude. If it is significant then we have achieved the worst possible mismatch of the sample (V,,,, = maximum) and at the same time maximised cos y. This means that the reflection must be in phase or out of phase with the reference, (sample rotation determines which).
The system is now prepared to measure amplitude changes in the reflected wave (cosy is not sensitive to changes in y about 0 or 180’). These in turn are mostly affected by changes in the resistive component of the sample impedance i.e. State B of $2. A closer identification of this is presented in 82.2.1 where the ray optics approach is used.
In order to prepare the system for State A, the phase shifter is manipulated until the detected modulation amplitude is zero. There are three possibilities:
(i) Vsamp = 0 ; (ii)cos y=O; (iii) spurious reflections add to cancel the reflected wave.
The first can occur only if the signal guide is perfectly matched by itself. Matching with the E-H tuner does not produce this effect because the reflections from the series and shunt arms of the tuner are not modulated whereas the signal guide reflection is. The third possibility should be avoided by minimising spurious reflections.
In conclusion, it can be seen that phase quadrature is the most likely cause for this condition. Once again we may see qualitatively that the system in quadrature (cos y=O) will be sensitive to changes in 9, and that these depend primarily on changes in reactance of the sample. Hence the system is indeed in State A, which is further described in 82.2.1.
2.2. Analysis of the travelling wave method The analysis of field configurations around semiconductor or insulator obstacles in waveguides is a difficult problem even under steady state conditions. A tried and tested approach is to assume some field configuration within the sample, neglect the displacement current, and solve Maxwell’s equations consistent with the boundary conditions (Steele and Vural, 1969). This yields approximate fields, but the technique can- not easily incorporate displacement currents, and their effects may be important in pulsed experiments. Also, the solutions may not converge rapidly owing to an unfortunate choice of initial conditions, and their physical meaning may be obscure.
A much simpler, though not as accurate approach is to
1184

Figure 2 Wave transmission, reflection and absorption for a sample mounted in a waveguide.
consider the TEOI mode (which is the primary excitation applied to the signal guide) as a linear superposition of two plane waves travelling at right angles to each other. If the travelling wave condition applies, and the sample is positioned more or less symmetrically within the guide, the transmission, reflection and absorption processes in the sample can be summarised by figure 2. Notice that the reflected waves super- pose to yield a reflected TEOI mode.
With this picture in mind, we can visualise a power division scheme as shown in figure 3. Here, the higher order modes (primarily due to the asymmetry of the sample and its position- ing) and the 'leakage' are all lumped together as a first approximation.
Within the framework of this description, we can use the plane wave analysis or ray optics to give us the approximate
Figure 3 Schematic power division in the reflection bridge.
results. We can also use the standard formulae for the reflection coefficient of the sample
(1) (1 - nR2 - x2) - 2ix
R = (1 + f l R ) ' + X 2
where nR and x are the real and imaginary parts of the com- plex refractive index, whose dependence on B is usually predicted by theory. The phase shift of the primary reflected
Millimetre wave spectra .for solid samples in pulsed magnetic fields
Figure 4 Paramagnetic resonance spectra in MnC03. (a) Absorption (top) and dispersion (bottom). (b) Absorption with d = w (top) and d=O (bottom).
1185

A Z Tirkel, G J Troup, J L A Francey and S S San
beam is given by
2x tan g,= x 2 + (nR‘ - 1)‘
An example of pulsed paramagnetic resonance of MnC03 is shown in figure 4.
2.2.1 Signal analysis. Now let us examine the effect of ampli- tude modulation introduced in the signal arm on the detected crystal voltage. Assuming the crystal is biased correctly for square law detection and the modulation has a frequency w and depth a, the detected voltage can be split up into time- variant and synchronous components - VDC and Vsynch. The voltages involved before detection are
(i) signal
V ~ ~ = l R l V z ( l - a ) withphaseangleg, (3) 1 VSynch= alKl V’ with phase angle e,
(ii) leakage
VDC = V3 (1 - a) with phase angle x (4) VSynch= V3 with phase angle x
(iii) reference
VDC= Vl i VSynch = o ( 5 )
where the symbols used are those that appear in figure 3.
response is The detected invariant voltage according to square law
VDC = k [ V12 + R 2 V’’(1- a)2+ V32(1 - a)’
+ 1 R VI Vz(1- 3) COS g,+ VI V3(1- a) COS x + IR 1/2V3(1 -a)’ COS (g,-x)] (6)
where k is the conversion efficiency, proportional to the second order coefficient of the crystal response function.
Assuming that the leakage and its phase remain constant during the experiment, the expression can be simplified by collecting all the terms independent of the sample properties.
T/oc = k[A2 + /RI V‘’(1 - a)’ + IR/ v1 v2(1 - %) COS g,
+ / ~ l v ~ ~ 3 ( 1 - ~ ) C O S ( g , - ~ ) ] (7)
where A2 or the bias term is much greater than the rest. Now consider the synchronous voltage.
T/synch=ka[lRi VIV~ COS p+ IR12v2z((1 - a) + 2 1 4 V2 V3(1- a) cos (g, - x) + v1 v3 cos x
+ V3‘((1 -a)]. (8)
In practice VI> 10 VZ and VI> 10 V3, and the modulation index was kept as high as possible (approximately 0.9). Therefore neglecting the smaller terms we obtain
T/synch=kaVl [IRI v2 cos g,+ V3 cos X]. (9)
2.2.2 Preparation of system for desired response. It is easy to see that by using the phase shifter, we can bring VSynch towards (i) zero or towards (ii) a maximum.
Case (i) If V3< IRi V2, then in the first instance the equation becomes
COS pnew = 0 (10)
where F n e n = g,+ $ and 3 is the difference in phase shifter settings required in order to make the synchronous signal vanish. Substituting in equation (9) and neglecting terms
involving V3 we obtain
Voc=k[A2+IR12v22(1-a)2+IRIVl/1V ~ ( 1 - a) COS g,newl. (11)
The response to small changes in /RI and g, can be character- ised by
~ V D C = ~ [ ~ ~ R I S I R I V22(1-a)2+61R1T/1V2(1-ol)COSg,new]
- /RI ViVz(1- a) sin g ,ne ,Sg , ] (12)
since COS q n e n = 0 and sin g,nem = + 1,
Sv~c=k jRIV’ ( l -a ) [2V~( l -a ) SlRl- ViSg,]. (13)
Since V I $ V2 and 1 - a ~ O . l the first term is negligible. Hence
SVDC= -kVlVz(l -a)IRISg,. (14) Note that during the experiment, there is no modulation so CY + 0. Hence if the pulsed experiment is performed on the sample, the system will respond primarily to the change in phase angle of the reflection coefficient. If the latter is not too large
In case (2), I/Synch is brought to a maximum if cos Fneu.= 1 , provided that VZ% V3. Then
vDc=k[A2+IR 2 ( 1 - ~ ) a V ~ 2 f i ~ ~ T / i ~ ~ ( l - % ) C O S g , n e w ] . (16)
Once again evaluating the response to changes in IRI and g,,
S V D C = ~ [ ~ / R ~ S ~ R / (1-a)2V22+81R’ V1v2(1-a)]. (17)
Since VI$ V2
(18) 8 VDc = k VI V2( 1 - 01)s 1 RI. Therefore, the system is now tuned to the changes in the modulus of R. This information may once again be trans- lated into changes in x and nR, thus yielding a second equation. This together with the information from case (i) is sufficient to calculate n R and x throughout the experiment, provided the two shots are made and VDC followed and recorded on the same display system. However in most cases it is sufficient to know 61 R I and 8 ~ , which are easily available upon calibra- tion, for the system has a reasonably linear response to these quantities.
2.2.3 Effects of leakage. In the analysis in $2.2.2 it was assumed that V z S V 3 . If the leakage cannot be kept low enough to satisfy that criterion, we may resort to a graphical method of finding where v n e w = O . A plot of VS’Synch against $ (the phase shifter setting) is made, and since this is a sum of two cos terms, it is easy (in principle) to determine the zeros. Then one has a 50% chance of choosing the correct zero from the plot. (The guesswork can be eliminated by introducing a bucking arm and having some variation in this ‘controlled leakage’ but this is not very practical.) Once the zero (or maxi- mum) in cos ynew is determined the settings can be made as before, and the leakage does not enter into the equations, except as an extra bias term (that is of course, provided that it does not change during the running of the experiment, but this is a reasonable assumption). In cases where the deter- mination of correct settings is made difficult by the similar size of the two components (i.e. P‘z z V3), the situation may be clarified by deliberately increasing the leakage by detuning the system.
1186

Millimetre wave spectra for solid samples in pursed magnetic fields
2.3 The standing wave experiment In this section we shall examine the effects of multiple reflec- tions or standing waves, all of which were tacitly assumed to be negligible in the foregoing discussion. This was justified in the previous experiments because the signal guide was well matched to the Tee, whilst the sample in the guide was severely mismatched. This meant that the reflection from the sample was the only major reflection in the signal guide. Of course there are always some reflections from components such as the phase shifter which contains a dielectric vane, the ferrite modulator, the E-H tuner, misaligned waveguide joints etc. Most of these are either small or else they can be adjusted to become negligible.
A more serious problem occurs if the signal guide itself contains resonant sections, such as the space between the sample faces, the space between the sample faces and the guide short circuit, or the specimen chamber itself. AS men- tioned in 52.2.3 these resonances have been intentionally suppressed. However, there are circumstances where this is not possible. In fact, this proved to be the case for a pulsed field experiment on YIG and MnC03 which was performed in a special insert into a liquid helium cryostat. (It is believed to be the first experiment of this type and will be described elsewhere.)
2.3.1 The resonating signal guide. The microwave apparatus used in this experiment is similar to that shown in figure 1. The main difference lies in the fact that here the signal guide is an overmoded section of waveguide (WR22), which together with a mode transformer (taper) forms a coupled multicavity system. Because all the ‘cavities’ are many times longer than the free space wavelength (e.g. the separation of the sample from the front of the taper is approximately 250 wavelengths) the analogy with optical resonators can be invoked for qualitative analysis - see figure 5. Strictly speak- ing, the mirrors should be producing phase shifts upon reflec- tion and transmission, the phase shift being related to the reactance of the discontinuity and the distance from the generator and load. Also, they should be rough, or localised within a region AI=I/QL rather than perfectly specular.
2.3.2 Analysis- The static case. From the ray optical point of view the signal guide contains six cavities capable of resonating. However, since the bridge is sensitive to the reflec- tion back from the signal guide, the effect of each resonance will be dependent on the coupling between the cavities as well as the transfer and distribution of power between them.
Clearly the most sensitive way of detecting changes in the sample properties would be to prepare the bridge before the pulse so that either cavity M1M3 or cavity MZM3 was resonant. The ultimate choice from these two depends on the reflection coefficients of the discontinuities, and they in turn depend on the coupling to the rest of the bridge.
An attempt to achieve this preparation is shown in the spectra presented in figure 6. It should be pointed out that the preparation is easy in principle, but difficult in practice and even harder to test. Considerable work remains to be done to clarify such a preparation as well as the analysis of line shapes of the spectra (a purely subjective analysis is given in 55.)
Figure 6 YIG resonances in overmoded bridge for different mismatch values. Measurements at 77 K.
Figure 5 Optical analogue of signal waveguide. MI, MZ and M3 are partially reflecting mirrors. M4 is a perfect mirror.
A quantitative analysis of such a complex set of coupled cavities and guide is a hopelessly complicated problem - a single cavity coupled to a waveguide is analysed by Slater (1950) and that is tedious enough. Therefore we shall present the picture by using the ray optical approach, with occasional references to microwave field analysis. The limitations of this method are obviously quite severe and they will be pointed out wherever possible.
The difficulties arise on the practical level from the inability to identify every resonance which can be displayed on a mode sweep pattern. The picture is further confused by the existence of antiresonances. They occur when the reflections from various discontinuities add in phase to produce a large reflec- ted signal. If the maximum reflected modulation method of 52.2 is used, we cannot be sure of whether this is caused by a mismatched resonance or an antiresonance. (A single resonant cavity coupled to others can produce an overall impedance mismatch of variable degree.)
Another difficulty stems from the fact that not all the resonances can be detected owing to low Q values or small reflection coefficients. The Q factors actually estimated from a mode display ranged from 100-1OOO which is quite high considering the frequency involved. This is attributed to the large volume to surface area ratios of the longer sections, although this effect is opposed by the poor quality of the reflection and interelement coupling and resultant frequency pulling, and the thermal gradients along the guide.
2.3.3 Transient response. In theory there are two basic differ- ences between the steady state resonant processes just des- cribed, and their transient counterpart. Firstly, it should be recalled that each of the cavity resonances may have a fine structure i.e. a multimode response is called for. The excitation
1187

A Z Tirkel, G J Troup, J L A Francey and S S San
of various modes may alter during a pulsed experiment invol- ving rapid changes in the electromagnetic properties of the sample. Non-dominant modes may become important.
As an example consider the difference between TEI.O,400 and TE1.o. 401 modes. Their resonant frequencies in this case differ by about 100 MHz at an excitation frequency of 70 GHz. Since their Q factors are not expected to exceed IO00 the over- lap in response between these two can be considerable, and the static experiment (or a mode sweep) might reveal a slightly double-humped response. However, in a pulsed experiment, the excitation of resonant modes depends on the klystron frequency and FM noise at the particular instants when con- ditions for resonances are rendered suitable by a change in the sample properties.
Secondly, in transient analysis the modes are either decay- ing or growing and hence a complex frequency response of the waveguides and cavities is necessary to evaluate the power flow during the pulse. The calculation of this frequency response for forced oscillatory behaviour involving competition between modes and time dependent boundary conditions (i.e. sample properties) is a forbidding task, and its effect remains unknown.
2.3.4 Results. The YIG spectrum shown in figure 6 displays the detected signal from the bridge (vertical axis) against the applied magnetic field (horizontal axis) during the pulse. The magnetic pulse can be described approximately as a half sinusoid. Hence there are effectively two spectra per pulse - one for the field increasing and the other for the field decreasing.
Observe that these do not retrace each other in figure 6, whilst the travelling wave spectrum (see 52.2) taken under similar conditions as shown in figure 7 exhibits a good retrace. This was also found to be true for the other samples under a variety of conditions. It suggests that cavity mode transitions or ‘mode hops’ are responsible for this behaviour rather than time lag or hysteresis effects in the sample.
Figure 7 YIG resonance in the travelling wave bridge at 77 K.
High values of dzB/dt2 during the firing and extinction of the ignition discharge are responsible for horizontal hysteresis. However, it is not a likely mechanism for shape distortion as in figure 12. The only result should be horizontal displace- ment of the retrace spectrum (figures 4 and 7).
The peculiar inversion symmetry on retrace could be caused
1188
by excitation of a certain mode on the upward field sweep, followed by its deexcitation on the way down. This may be accompanied by energy transfers to other modes. The decay times of these transitions appear rather long, (even though the horizontal scale of the spectra is linear in field, not in time) which may be attributed to them being forced, and to the sample changing its properties rather slowly. This interpreta- tion is only tentative, owing to the errors involved in the field measurement.
Field measurement error analysis is a sufficiently involved topic to be dealt with elsewhere. Apart from insufficient fre- quency response of the integrator circuitry, the whole field sampling procedure (test coil outside the pulse coil) is subject to considerable spatial and temporal error. The test coil samples the total flux through its cross section. It ignores inhomogeneities in the field distribution at and around the sample, and dynamic screening effects due to the waveguide walls and the coil former. The only sure way of calibrating the display is to obtain several diverse samples with previously measured resonance spectra spread over the whole range of magnetic fields of interest. In this work DPPH was the only primary standard with YIG serving as the secondary standard. A tunable frequency source would have enabled calibration using just one sample (say YIG), however, such was not available at the time.
It is clear that the method is sensitive to changes in electro- magnetic properties of the sample, though it is all but impossible to separate dispersion from absorption.
3 Apparatus The millimetre wave bridge and components list shown in figure 1 is self explanatory. However, the ancilliary apparatus associated with the ferrite modulator is unusual, and so a brief description of it will follow.
Although it was mentioned that the modulation waveform is not important as far as the analysis is concerned, it was found that square wave modulation was preferable because it was easier to detect without lock-in amplifiers. Also, the stability and reproducibility are better because a square wave system is relatively insensitive to the nonlinearities of the ferrite and associated driving system.
3.1 Ferrite driver - Constraints resulting from modulator char- acterist ics There are basically two problems associated with square wave modulation using a Faraday Rotator such as the TRG E130.
(a) Owing to the hysteresis effects in the ferrite and the nonlinearity of Faraday rotation in a rectangular guide sup- porting the TEOl mode, the current through the magnetising coil must swing above a cut-in value in order to produce appreciable modulation. The characteristics are shown in figure 8 where the shaded region shows the area of useful operation.
(b) The coil has an impedance which rises more or less linearly with frequency. The reasons for the deviations, which occur at high frequencies are:
(i) above 100 kHz dynamic effects inside the ferrite and skin depth effects within the coil and waveguide render the reac- tance and resistance complex functions of frequency;
(ii) cable and stray impedances become noticeable. The problem mentioned in (b) can be overcome by using a
high supply voltage and a series resistor, the value of which is chosen to swamp the coil reactance. A compromise must be made in order to satisfy the requirements of (a) (i.e. to remain within the correct operating region) and to take into a account the high frequency complications mentioned above.
Millimetre wave spectra for solid samples in pulsed magnetic fields
160 - Tsw- A
I ( m A )
Figure 8 Ferrite attentuation as a function of current.
After some experimentation a 300V source was decided upon (to allow for transistor compatibility) and the values of the resistors were chosen empirically (5.3 kQ for f < 300 Hz, 10.3 k Q for 300 Hz <f< 3 kHz 2.5 kQ for 3 kHz < f < 300 kHz, 310 Q for f> 300 kHz where f refers to the square wave or switching frequency).
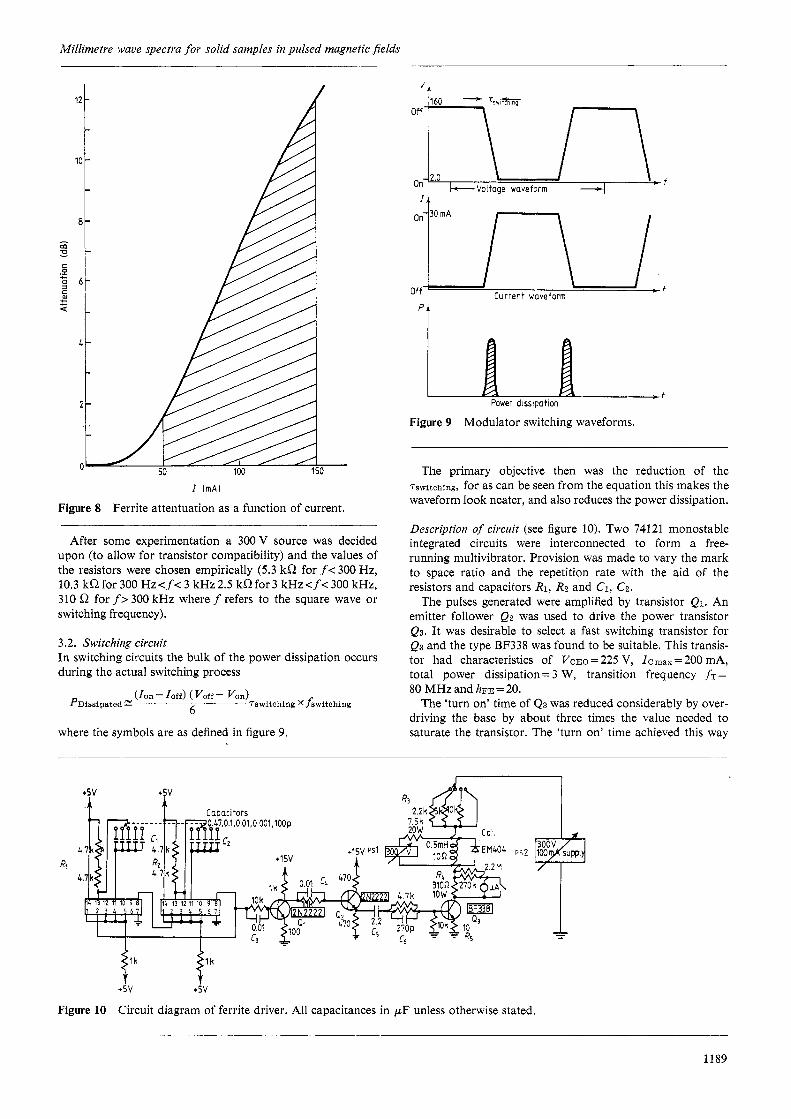
3.2. Switching circuit In switching circuits the bulk of the power dissipation occurs during the actual switching process
(Ion - I o d (Volofe - Von) 6 Tswitching Xfswitohing PDissiprtted 2:
where the symbols are as defined in figure 9.
‘t
Figure 9 Modulator switching waveforms.
The primary objective then was the reduction of the Tswitching, for as can be seen from the equation this makes the waveform look neater, and also reduces the power dissipation.
Description of circuit (see figure 10). Two 74121 monostable integrated circuits were interconnected to form a free- running multivibrator. Provision was made to vary the mark to space ratio and the repetition rate with the aid of the resistors and capacitors RI , RZ and C1, CZ.
The pulses generated were amplified by transistor Ql. An emitter follower Q2 was used to drive the power transistor Q3. It was desirable to select a fast switching transistor for Q 3 and the type BF338 was found to be suitable. This transis- tor had characteristics of VCEO = 225 V, IC max = 200 mA, total power dissipation = 3 W, transition frequency fT = 80 MHZ and h m = 20.
The ‘turn on’ time of Q3 was reduced considerably by over- driving the base by about three times the value needed to saturate the transistor. The ‘turn on’ time achieved this way
4
Rl 4
‘1“ +5v .A
I I
P S 2 loo suppi T Figure 10 Circuit diagram of ferrite driver. All capacitances in pF unless otherwise stated.
1189

A Z Tirkel, G J Troup, J L A Francey and S S San
was about 300 ns. This was further reduced to 25 ns by bypassing the interstage coupling resistors with speed-up capacitors C3, C4 and c6.
Once the base was driven as hard as this, pulse stretching took place, due to the excessive charge stored in the base capacitance Cbt. (See high frequency equivalent circuit shown in figure 11.) In order to speed up the discharge of Cbe a negative pulse was needed. This was achieved by removing the DC level of the emitter follower Q2, with capacitor C5. The negative excursion of the pulse assisted quicker discharge of Cbe and thus pulse stretching was virtually eliminated.
Figure 11 Equivalent switching circuit (HF approximation). The region in the box represents the BF 338.
The 'turn-off' time of the transistor 4 3 depended mainly on the values of the capacitor Cce, R3, R4, R5 and L. The coil caused ringing, but this was easily stopped by connecting diode DI across it.
The average collector current of Q3 was monitored by the meter M. Owing to the characteristics of the ferrite etc. a bias current of about 50mA was required. This was introduced using the floating power supply Ps1 Resistor R6 was used to prevent the coil from being shunted by the power supply PSI.
4 Samples The MnC03 was a single crystal aligned optically. It is a ferrimagnet with a compensation temperature about 40 K. Unfortunately the spectra obtained for it ranged only down to 54 K and thus only the paramagnetic phase was observed.
The YIG was a pressed powder of standard purity, cleaved manually and oriented in the guide to optimise reflections (travelling wave method). It was irregular in shape.
Figure 12 YIG spectrum at 4.2 K.
1190
The InSb was a highly pure, polished single crystal with parallel faces.
5 spectra The physical processes investigated in the three samples were quite different.
MnC03 showed a standard paramagnetic resonance at an induction of about 2.5 T (figure 4).
The YIG spectra above 50 K (figures 6 and 7) showed con- siderable detail which was attributed to the following:
(i) the two large peaks at 2 T and 2.5 T in figure 7 occur at the greatest changes in the propagation constant of the ferrite. The position of the peaks is consistent with the fact that the saturation magnetisation of YIG is 0.24 T, and therefore the separation of the peaks for a pressed powder is expected to be of the order of 0.5 T;
(ii) the effects between 0.5T and 1.5T are attributed to dimensional resonances as described by Lax and Button (1962). All other causes such as spin wave effects, anisotropy fields, Faraday rotation, non-linear mixing and dielectric losses were calculated for this region and found negligible.
The YIG spectrum at 4.2 K (figure 12) is puzzling. Popula- tion inversion, and long lived modes have been suggested as possible explanations, but this is purely guesswork.
The InSb spectra showed a low field helicon resonance and for some samples (see figure 13) the high field magneto- plasma transmission edge. These effects have been discussed in detail by Tirkel (1975).
Figure 13 InSb spectrum.
The maximum applied field shown in the spectra is 6 T (figure 4). The materials whose spectra are displayed do not possess any interesting properties at higher fields at 60 GHz. However, the same apparatus was used to study anti- ferromagnetic and weak ferromagnetic resonances and the fields applied in those experiments ranged up to 35T. In addition, experiments at higher frequencies were planned, and these would have required even higher fields. These were hampered by lack of components in the range 100-300 GHz, a situation which is being remedied currently. The highest field produced by the apparatus was 65-70T, although no spectra were taken with it. The whole subject of high pulsed fields and their mechanics will be dealt with in a separate paper.

Millimetre wave spectra for solid samples in pulsed magnetic fields
6 Conclusion The amount of investigation and manipulation required to prepare the system using the described method was con- siderable. However, it was well worth the trouble, especially at liquid He temperatures, where only one or two pulses were possible during a run. It is believed that the technique could be of some value in other single shot experiments.
Acknowledgments The authors would like to thank the Physics Department of Monash University for their assistance, the Radio Research Board for their equipment grant, and the Commonwealth Government for providing one of us (AZT) with a scholarship.
References Lax B J and Button K J 1962 Microwave Ferrites and Ferromagnctics Lincoln Laboratory Publication (New York : McGraw-Hill) Slater J C 1950 Microwave Electronics (New York: McGraw- Hill) Steel M C and Vural B 1969 Wave Interactions in Solid State Plasmas Advanced Physics Monograph Series (New York: McGraw-Hill) Tirkel A Z 1975 Electromagnetic waves in solid state plasmas PhD Thesis Monash University
1191