Middle School NWEA MAP Results
11
March 7, 2017 Middle School NWEA MAP Results
-
Upload
khangminh22 -
Category
Documents
-
view
1 -
download
0
Transcript of Middle School NWEA MAP Results
March 7, 2017
Middle School NWEA MAP Results
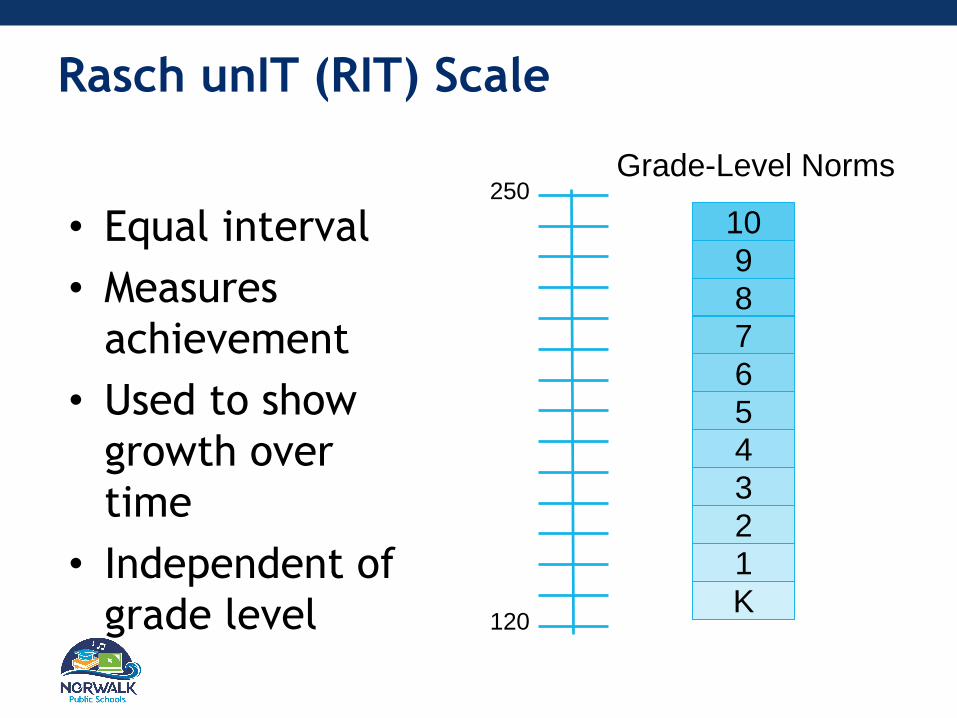
Rasch unIT (RIT) Scale
• Equal interval
• Measures
achievement
• Used to show
growth over
time
• Independent of
grade level
10
9
8
7
6
5
4
3
2
1
K120
250Grade-Level Norms

The MAP test:
• Provides information about
the instructional level of the
student
• Provides a road map for
students toward achieving
mastery
• Is not a test for determining
mastery of skills
Instructional Levelversus Mastery

Normative Data: Bringing Context to the Data
Status Norms• Compares student
achievement to typical
performance
– Beginning, Middle and End
of Year
• Grade-level percentiles
put student RIT scores in
context
Growth Norms• Projects growth for every
student based on:
– Grade level
– Starting score
– Instructional time

How is MAP Data Used?
5

2016-17 Reading MAP Scores Grades 6-8
Comparison: Norwalk to NWEA Norm
6
Gr. 6Fall
Gr. 6Winter
Gr. 7Fall
Gr. 7Winter
Gr. 8Fall
Gr. 8Winter
Norwalk 208.4 212.7 0 211.8 217.2 0 217.0 222.0
Norm 210.5 213.7 0 214.1 216.5 0 217.0 218.8
200.0
205.0
210.0
215.0
220.0
225.0
RIT
Sco
res

2016-17 Math MAP Scores Grades 6-8
Comparison: Norwalk to NWEA Norm
7
Gr. 6Fall
Gr. 6Winter
Gr. 7Fall
Gr. 7Winter
Gr. 8Fall
Gr. 8Winter
Norwalk 209.8 216.0 0 216.2 222.0 0 221.8 227.2
Norm 217.1 221.2 0 222.2 225.5 0 225.9 228.7
200.0
205.0
210.0
215.0
220.0
225.0
230.0
RIT
Sco
res

Fall to Winter MAP Growth – RIT Points
8
4.9
5.75.4
3.2
2.5
1.8
GR. 6 GR. 7 GR. 8
Reading
Actual Growth Projected growth
6.25.7 5.5
3.9
3.12.6
GR. 6 GR. 7 GR. 8
Math
Actual Growth Projected growth

Fall to Winter - Percent of Students who
Met/Exceeded Growth Projections
9
62
68
68
64
65
69
50 55 60 65 70
Gr. 6
Gr. 7
Gr. 8
Math Read

Reading: % of Students by Percentile Bands
10
23 19
0
2316
0
17 13
1517
19
1619
14
2321
21
2221
18
2325
22
27 24
32
16 18 15 19 19 23
0
20
40
60
80
100
Gr. 6 Fall Gr. 6 Winter Gr. 7 Fall Gr. 7 Winter Gr. 8 Fall Gr. 8 Winter
Low Low Avg Avg Hi Avg High

Math: % of Students by Percentile Bands
11
31 28
0
3025
0
2822
2525
0
24
21
0
21
21
2320 20
2019
20
14
13 1521 17
20
714 11 13 15 17
0
20
40
60
80
100
Gr. 6 Fall Gr. 6 Winter Gr. 7 Fall Gr. 7 Winter Gr. 8 Fall Gr. 8 Winter
Low Low Avg Avg Hi Avg High