MID-INFRARED GALAXY MORPHOLOGY FROM THE SPITZER SURVEY OF STELLAR STRUCTURE IN GALAXIES (S 4 G): THE...
269
arXiv:1008.0805v1 [astro-ph.CO] 4 Aug 2010 Mid-Infrared Galaxy Morphology from the Spitzer Survey of Stellar Structure in Galaxies (S 4 G): The Imprint of the de Vaucouleurs Revised Hubble-Sandage Classification System at 3.6μm Ronald J. Buta 1 , Kartik Sheth 2,3,4 , Michael Regan 5 , Joannah L. Hinz 6 , Armando Gil de Paz 7 , Karin Men´ endez-Delmestre 8 , Juan-Carlos Munoz-Mateos 7 , Mark Seibert 8 , Eija Laurikainen 9 , Heikki Salo 9 , Dimitri A. Gadotti 10 , E. Athanassoula 11 , Albert Bosma 11 , Johan H. Knapen 12,13 , Luis C. Ho 8 , Barry F. Madore 8 , Debra M. Elmegreen 14 Karen L. Masters 15 , Sebastien Comer´ on 16 , Manuel Aravena 2
Transcript of MID-INFRARED GALAXY MORPHOLOGY FROM THE SPITZER SURVEY OF STELLAR STRUCTURE IN GALAXIES (S 4 G): THE...

arX
iv:1
008.
0805
v1 [
astr
o-ph
.CO
] 4
Aug
201
0
Mid-Infrared Galaxy Morphology from the Spitzer Survey of Stellar
Structure in Galaxies (S4G): The Imprint of the de Vaucouleurs
Revised Hubble-Sandage Classification System at 3.6µm
Ronald J. Buta1, Kartik Sheth2,3,4, Michael Regan5, Joannah L. Hinz6, Armando Gil de
Paz7, Karin Menendez-Delmestre8, Juan-Carlos Munoz-Mateos7, Mark Seibert8, Eija
Laurikainen9, Heikki Salo9, Dimitri A. Gadotti10, E. Athanassoula11, Albert Bosma11,
Johan H. Knapen12,13, Luis C. Ho8, Barry F. Madore8, Debra M. Elmegreen14 Karen L.
Masters15, Sebastien Comeron16, Manuel Aravena2
– 2 –
Received ; accepted
1Department of Physics and Astronomy, University of Alabama, Box 870324, Tuscaloosa,
AL 35487
2National Radio Astronomy Observatory / NAASC, 520 Edgemont Road, Charlottesville,
VA 22903
3Spitzer Science Center, 1200 East California Boulevard, Pa sadena, CA 91125
4California Institute of Technology, 1200 East California B oulevard, Pasadena, CA 91125
5Space Telescope Science Institute, 3700 San Martin Drive, Baltimore,MD 212185721
6Steward Observatory, University of Arizona, 933 N. Cherry Ave., Tucson, AZ 85721
7Departamento de Astrofsica y CC. de la Atmsfera, Universidad Complutense de Madrid,
Avda. de la Complutense, s/n, E-28040 Madrid, Spain
8The Observatories of the Carnegie Institution for Science, California Institute of Tech-
nology, MC 249-17, Pasadena, CA 91125
9Division of Astronomy, Department of Physical Sciences, University of Oulu, Oulu, FIN-
90014, Finland
10European Southern Observatory, Casilla 19001, Santiago 19, Chile
11Laboratoire d’Astrophysique de Marseille, Universite de Provence/CNRS UMR 6110, 38
rue Frederic Joliot Curie, 13388 Marseille Cedex 4, France
12Instituto de Astrofısica de Canarias, E-38200 La Laguna, Tenerife, Spain
13Departamento de Astrofısica, Universidad de La Laguna, E-38205 La Laguna, Tenerife,
Spain
14Department of Physics & Astronomy, Vassar College, Poughkeepsie, NY 12604
15Institute for Cosmology and Gravitation, University of Portsmouth, Dennis Sciama
Building, Burnaby Road, Portsmouth, PO1 3FX, UK
16Korea Astronomy and Space Science Institute 838, Daedeokdae-ro, Yuseong- gu, Daejeon
Republic of Korea 305-38

– 3 –
ABSTRACT
Spitzer Space Telescope Infrared Array Camera (IRAC) imaging provides an
opportunity to study all known morphological types of galaxies in the mid-IR at
a depth significantly better than ground-based near-infrared and optical images.
The goal of this study is to examine the imprint of the de Vaucouleurs classifica-
tion volume in the 3.6µm band, which is the best Spitzer waveband for galactic
stellar mass morphology owing to its depth and its reddening-free sensitivity
mainly to older stars. For this purpose, we have prepared classification images
for 207 galaxies from the Spitzer archive, most of which are formally part of the
Spitzer Survey of Stellar Structure in Galaxies (S4G), a Spitzer post-cryogenic
(“warm”) mission Exploration Science Legacy Program survey of 2,331 galaxies
closer than 40 Mpc. For the purposes of morphology, the galaxies are inter-
preted as if the images are blue light, the historical waveband for classical galaxy
classification studies. We find that 3.6µm classifications are well-correlated with
blue-light classifications, to the point where the essential features of many galaxies
look very similar in the two very different wavelength regimes. Drastic differences
are found only for the most dusty galaxies. Consistent with a previous study by
Eskridge et al. (2002), the main difference between blue light and mid-IR types
is an ≈1 stage interval difference for S0/a to Sbc or Sc galaxies, which tend to
appear “earlier” in type at 3.6µm due to the slightly increased prominence of
the bulge, the reduced effects of extinction, and the reduced (but not completely
eliminated) effect of the extreme population I stellar component. We present
an atlas of all of the 207 galaxies analyzed here, and bring attention to special
features or galaxy types, such as nuclear rings, pseudobulges, flocculent spiral
galaxies, I0 galaxies, double-stage and double-variety galaxies, and outer rings,
that are particularly distinctive in the mid-IR.
– 4 –
Subject headings: galaxies: spiral; galaxies: morphology; galaxies: structure
1. Introduction
The Spitzer Survey of Stellar Structure in Galaxies (S4G, Sheth et al. 2010) is a
systematic imaging survey with the Infrared Array Camera (IRAC, Fazio et al. 2004a) of
2,331 galaxies in 3.6 and 4.5µm bands. The goal of the project is to derive basic photometric
parameters for quantitative analysis of these galaxies for a variety of studies. Independent
of these studies, however, the S4G database is an obvious goldmine for new investigations of
galaxy morphology in the mid-infrared, if only because the images are deeper than anything
achievable from reasonable ground-based near-IR observations and also because the images
are homogeneous with respect to the point-spread function (PSF).
In this paper, we examine the imprint of the de Vaucouleurs revised Hubble-Sandage
classification system on galaxy morphology at 3.6µm, using a subset of Spitzer archival
images of galaxies that meet the selection criteria of the S4G (or are prominent companions
to those galaxies). These images have been processed through the S4G Pipeline as described
in Sheth et al. (2010), and have significantly improved quality compared to the post-Basic
Calibrated Data (PBCD) mosaics provided in the SSC archive for photometric analysis.
The goal of our analysis is not merely general Hubble classifications, but detailed types as
described in the de Vaucouleurs Atlas of Galaxies (Buta, Corwin & Odewahn 2007, hereafter
the dVA). We want to know how closely optical galaxy morphology maps into the mid-IR.
Section 2 gives some background to IR morphological studies, while section 3 describes how
we prepared the S4G Pipeline processed Spitzer images for detailed morphological study.
Section 4 summarizes our analysis of the Spitzer archival 3.6µm images. Our conclusions
are summarized in section 5.
– 5 –
2. Near- and Mid-IR Galaxy Morphology
Galaxy morphology in the near- and mid-IR, as in other wavebands, is important to
examine because of the information morphology carries on processes of galactic evolution.
Morphology is strongly correlated with galactic star formation history, environmental density
and interaction/merger history, and the effectiveness with which internal perturbations
(such as bars) interact with other internal components (such as the halo and the basic
state of the disk). Early evolution was probably dominated by merger events, and this
has found support in recent studies of the merger rate (e.g., Mihos & Hernquist 1996).
Slower internal secular evolution has been increasingly invoked to explain the disk-like
properties of “pseudobulges” (e.g., Kormendy & Kennicutt 2004, Athanassoula 2005) and
to account for the development of other features, such as rings and spiral arms, in response
to perturbations such as bars and ovals. Together, these processes appear to combine to
produce the wide range of galaxy types that we see nearby.
Galaxy classification is still an important part of modern extragalactic studies.
Catalogues of galaxy Hubble types or Hubble-related types are often the starting point
of observational investigations, and nearly 80 years of research have not negated or made
obsolete the classification systems (e.g., Hubble 1926, 1936; Sandage 1961; Sandage &
Bedke 1994; de Vaucouleurs 1959) that form the basis of catalogued types. The frequency
and statistical properties of structures in galaxies need to be known in order to determine
how these structures fit into the general scheme of galaxy evolution. As noted by Fukugita
et al. (2007), who used Sloan Digital Sky Survey (SDSS) color images to classify 2253 bright
galaxies, visual classification “remains the best approach for classifying each galaxy into a
Hubble type with high confidence, at least for bright galaxies.” This survey was followed up
by a more detailed morphological analysis by Nair & Abraham (2010), who recorded rings,
bars, Hubble types, and other features for more than 14,000 SDSS galaxies, as a means

– 6 –
of facilitating automatic classification. In addition, the Galaxy Zoo project (Lintott et
al. 2008) has provided basic morphological information for nearly a million galaxies, from
citizen science participation (see also Banerj et al. 2010).
Although as a topic of research galaxy morphological studies began with blue-sensitive
photographic plates, in recent years the emphasis has shifted considerably towards longer
wavelengths. Early red and near-infrared imaging showed that galaxies which, in blue
light, show a patchiness due to dust and complexes of recent star formation, become
smoother at the longer wavelengths owing to the reduced effects of extinction and the
de-emphasis of the younger component. The longer wavelengths emphasize the older stellar
components, including old disk giants and Population II stars. Although photographic red
and near-infrared imaging were possible in the 1950s-1980s, and were even the subjects of
large sky surveys, no large-scale systematic galaxy morphological studies were ever based
on these surveys. Only the blue surveys were used for systematic galaxy classification
(e.g., Nilson 1973; Lauberts 1982; Corwin et al. 1985; Buta 1995), because the original
Hubble system was based on blue light photographs. Even so, it was already known that
features like inner bars (e.g., Hackwell & Schweizer 1983; Scoville et al. 1988; Thronson et
al. 1989; Telesco et al. 1991; Block & Wainscoat 1991; Rix & Rieke 1993), triaxial nuclear
bulges (e.g., Zaritsky & Lo 1986), and regular bars (e.g., Talbot et al.1979) could be partly
obscured or simply less prominent in blue light images, but become more visible in the red
and infrared. Detailed studies of bar fractions in the near-IR have shown a comparable (or
sometimes slightly larger) fraction to that given by the early blue light studies. This issue
is further discussed in section 4.6.
It was also known that spiral structure which may appear “flocculent” in blue light
and at 0.8µm (Elmegreen 1981) could appear more global (i.e., continuous and large-scale,
or “grand design”) at 2.2µm (Thornley 1996). The differences between optical and near-IR

– 7 –
morphologies for some galaxies appeared to be so great that in early studies, it was
suggested that there is a “duality” of galactic structure, in the sense that the Population I
and II morphologies are decoupled (Block & Wainscoat 1991; Block et al. 1994, 2004).
Several developments brought large-scale digital IR imaging to the forefront of galaxy
morphological studies. The first was extending near-IR imaging from individual galaxies or
parts of galaxies to statistical-sized samples. This began with near-IR surface photometry
of 50 spirals by Elmegreen & Elmegreen (1984, 1987) and of 86 galaxies by de Jong & van
der Kruit (1994). The first major near-IR survey designed for large-scale morphological
studies was the Ohio State University Bright Spiral Galaxy Survey (OSUBSGS, Eskridge et
al. 2002), which included optical BV RI and near-IR JHK images of 205 bright galaxies of
types S0/a to Sm in a statistically well-defined sample selected to have total blue magnitude
BT≤12.0 and isophotal diameter D25≤6.′5. This survey allowed a direct demonstration of
how galaxy morphology actually changes from optical to near-IR wavelengths, not merely
for a small, selected sample of galaxies, but for a large sample covering all spiral subtypes.
The OSUBSGS was later complemented by the Near-Infrared S0 Survey (NIRS0S,
Laurikainen et al. 2005, 2006, 2010; Buta et al. 2006), a Ks-band imaging survey of about
180 early-type galaxies in the type range S0− to Sa, but mostly including S0s, some of
which were misclassified as ellipticals in the Third Reference Catalogue of Bright Galaxies
(RC3, de Vaucouleurs et al. 1991; see below). Although S0 galaxies are dominated by old
stars and are smooth even in blue light images, the Ks band was chosen to complement
the OSUBSGS sample of spirals in order to make a fair comparison between bar strengths
and bulge properties of S0s and spirals. Also, S0 galaxies are not necessarily dust-free, and
near-IR imaging is still necessary to penetrate what dust they have.
The second development was the Two-Micron All-Sky Survey (2MASS, Skrutskie et al.
1997), which provided JHKs images of a much larger galaxy sample, although these lack

– 8 –
the depth of the OSUBSGS and NIRS0S images in general. 2MASS provided considerable
information on near-infrared galaxy morphology, which led to the extensive 2MASS Large
Galaxy Atlas (Jarrett et al. 2003). 2MASS images were also used by Menendez-Delmestre
et al. (2007) to study quantitative near-IR bar classification and its comparison to RC3
classifications.
The third development was the launch of the Spitzer Space Telescope (Werner et al.
2004) and subsequent IRAC imaging surveys such as the Spitzer Infrared Nearby Galaxies
Survey (SINGS, Kennicutt et al. 2003). SINGS provided both optical and mid-IR imaging
of 75 galaxies of all types at a depth much greater than that of the OSUBSGS, NIRS0S,
or 2MASS. SINGS was followed by the Local Volume Legacy project (LVL, Kennicutt et
al. 2007), which will provide IRAC images (as well as images in other passbands) of 258
mostly late-type galaxies nearer than 11 Mpc.
Among these various sets of data, the NIRS0S is the only IR imaging survey carried out
to a significant extent with 4-m class telescopes. The full width at half maximum (FWHM)
of the stellar PSF for these images is generally <1′′ compared to 1.′′5-2′′ for OSUBSGS
images, 3′′ for 2MASS images, and 1.′′75 for SINGS images.
The S4G has been designed to provide a set of very deep mid-IR images at good
spatial resolution of an unprecedentedly large sample of nearby galaxies: 2,331 galaxies of
all Hubble types within a distance of 40Mpc. The images are being obtained in the IRAC
3.6 and 4.5µm bands. Of this sample, 597 galaxies are already in the Spitzer archive, and
the goal of the S4G is to add the 1,734 remaining sample galaxies as part of the Spitzer
Warm Mission. The advantages of Spitzer images lie in their homogeneity and, most of
all, in their considerable depth at wavelengths where ground-based observations (e.g., at
2.2µm) would suffer very high background (sky) emission. Also, the IRAC 3.6 and 4.5µm
bands are in a regime where extinction is even lower than in the near-IR JHK bands, and
– 9 –
where contamination by dust heated by stellar processes is also still low, so that the bands
are largely sampling the backbone of stellar mass in galaxies (Pahre et al. 2004). However,
there is a still a contribution from young stars, the nature of which is discussed in section
4.5.
We use a subsample of 167 S4G-pipeline processed Spitzer archival 3.6µm images to
classify 207 bright galaxies (including 24 pairs and 16 additional galaxies in small groups) in
the formal framework of the de Vaucouleurs revised Hubble-Sandage classification system, as
revised and updated in the dVA. This subset has no distinguishing characteristics other than
being archival galaxies selected by S4G team members for initial study and analysis. Such
a sample will have the selections of a variety of programs that were granted observing time.
Figure 2 shows the frequency distributions (solid histograms) of RC3 classifications (stages,
families, and varieties), absolute blue magnitudes MoB, total extinction-corrected color
indices (B − V )oT , and extinction-corrected mean blue light effective surface brightnesses
(m′
e)o, the latter three parameters also from, or based on, RC3 data. These plots show that
the sample galaxies cover a broad range of properties. The full range of galaxy types, from
E to Im, as well as giants and dwarfs, is represented. For comparison, Figure 2 also shows
the frequency distributions (dashed histograms) of the same parameters for the full S4G
sample. The distrbutions are similar except that our subset has relatively more E and S0
galaxies ahd high luminosity galaxies than the full S4G sample.
A partial attempt to classify galaxies using the de Vaucouleurs system was also made
by Eskridge et al. (2002), who applied the system using OSUBSGS near-IR H-band
(1.65µm) images as if they were blue light images. That is, the framework of the de
Vaucouleurs system was used without regard to the wavelength used to actually define
the system. Eskridge et al. showed that although some galaxies can look very different
in the near-IR as compared to the B-band, in general the differences are not so large as
– 10 –
to make near-IR types uncorrelated with optical types. As we will show here also, the
imprint of the de Vaucouleurs B-band classification volume holds well in the Spitzer 3.6µm
band, and the classifications correlate closely. The same was also found to hold true in the
mid/near-UV, at least for later type galaxies (e.g., Windhorst et al. 2002). Taylor-Mager
et al. (2007) also found only a mild dependence of concentration-asymmetry-star formation
(CAS) parameters on wavelength, suggesting that good morphological correlation between
different wavelength regimes is probably valid at all wavelengths dominated by the emission
from stellar photospheres.
3. Preparation of the Images
The goals of the S4G project are described by Sheth et al. (2010). One goal was the
processing of the Spitzer images of all archival galaxies with the same S4G pipeline as the
new Warm Mission data in the S4G sample. This processing was done to prepare the
images for detailed studies such as photometric decompositions, Fourier analysis, and color
index analysis. Like the SINGS images, the scale of the final S4G pipeline-processed images
is 0.′′75 per pixel, with a FWHM of ≈1.′′8.
The requirements for galaxy morphological classification are no less stringent than they
would be for photometric analysis. The images must be accurately background-subtracted,
and the point-spread function should be reasonably narrow (FWHM < 2.′′5), allowing about
100 resolution elements across the major axis. The background in Spitzer images is low, but
variations due to zodiacal light are sometimes present. Bright foreground stars can affect
some archival images, but scattered light from such stars should be less of a problem for the
1,734 Warm Mission galaxies because special precautions are being taken to prevent bright
stars from falling into scattering zones.

– 11 –
In order to classify the galaxies, each processed image was converted to units of
magnitudes per square arcsecond (the same approach as used in the dVA). Because all the
pipeline-processed images are in the same final physical units, MJy/sr, this conversion was
performed using the same zero point, 17.69, based on the Vega magnitude calibration given
in the IRAC Instrument Handbook. The images were then displayed in ds9 using IRAF
routine DISPLAY with a faint limit of 28.0 mag arcsec−2 and a bright limit depending on
the galaxy, ranging from as bright as 11.0 mag arcsec−2 to 18.0 mag arcsec−2 or fainter.
The classification images prepared in this manner are illustrated in Figures 1.1 - 1.197.
The reason for using this approach is that images in units of mag arcsec−2 reveal the
morphology over the whole range of surface brightnesses, from the center to the outer
disk, much better than do linear intensity images. In early classifications, photographic
plates gave a limited range in the linear relation between photographic density and the
logarithm of the intensity. IRAC data have a much larger dynamic range, and hence all
the details of a galaxy, including subtle ones, can be displayed at once. This is useful
for accurate classification, and especially for recognizing the subtle distinctions between
elliptical galaxies and very early S0 galaxies. We examined all images using a 24-bit image
display, and in each case a stretch was chosen (by varying contrast and brightness) that
maximized the morphological information visible. This display setting was then saved in
uncompressed jpeg format. Thus, the present survey is based on a variable dynamic range,
as opposed to the surveys based on homogeneous photographic material, i.e. the dwarfs are
displayed with a shorter dynamic range, and higher contrast, than the bright spirals.
4. 3.6µm Morphological Classification
With a final set of images in hand, the galaxies were classified using the three
dimensions of the de Vaucouleurs revised Hubble-Sandage system (de Vaucouleurs 1959).
– 12 –
Full types include the stage (E, E+, S0−, S0o, S0+, Sa, Sab, Sb, Sbc, Sc, Scd, Sd, Sdm,
Sm, and Im), the family (SA, SAB, SB), the variety (r, rs, s), the outer ring or pseudoring
classification (R or R′, if present), and indications of a spindle shape (sp, meaning edge-on
or near edge-on orientation) and the presence of any peculiarity (pec, often referring to
unusual and likely interaction-driven asymmetries).
The classifications were made by RB and independently verified by JK, and are
consistent with the dVA and RC3 classification systems. Any systematic differences
between the actual blue light classification and the mid-IR classification can then be mostly
attributed to the effects of bandpass. The “scatter” in type classifications by individual
observers is quantified by Naim et al. (1995).
4.1. Assigning Stage, Family, and Variety
In de Vaucouleurs’s classification approach, the implication for bars, inner rings, and
stages is a continuum of forms (de Vaucouleurs 1959). The stage for spirals is based on the
appearance of the spiral arms (degree of openness and resolution) and also on the relative
prominence of the bulge or central concentration. These are the criteria originally applied
by Hubble (1926, 1936). Sa, Sb, and Sc spirals are mostly as defined by Hubble, with the
additional stages Sd, Sm, and Im as appended by de Vaucouleurs. Intermediate stages
(Sab, Sbc, Scd, Sdm) are almost as common as the main types. In some cases, the three
spiral criteria are inconsistent, or other factors enter in that affect the type (Sandage 1961;
Sandage & Bedke 1994). In general, the bulge-to-total luminosity ratio is directly related to
Hubble type, but there is considerable scatter at a given type (see Simien & de Vaucouleurs
1986; Laurikainen et al. 2007, Graham & Worley 2008).
The family classifications SA, SAB, and SB are the purely visual estimates of bar
– 13 –
strength. The intermediate bar classification SAB is one of the hallmarks of the de
Vaucouleurs system, and is used to recognize galaxies having characteristics intermediate
between barred and nonbarred galaxies. Underline notation SAB and SAB (de Vaucouleurs
1963) is used to further underscore the continuity of this characteristic.
Although a bar that looks relatively weak in blue light can appear stronger in the
near- or mid-IR, IR imaging does not necessarily change the rankings of bars. A bar
which appears strong in blue light may also appear even stronger in the IR. Studies of the
maximum relative bar torque parameter Qb (e. g., Buta et al. 2005), show that what we
usually call “SB” has a wide range of strengths. Qb is the maximum relative bar torque per
unit mass per unit square of the circular speed, and has been found to range from 0 for
no bar to at least 0.7 for the strongest bars. Buta et al. (2005; see also the dVA) defined
the Qb family as follows: SA types have Qb < 0.05; SAB types have 0.05 ≤ Qb < 0.10;
SAB types have 0.10 ≤ Qb < 0.20; SAB types have 0.20 ≤ Qb < 0.25, while SB types have
Qb ≥ 0.25. The Qb family is an approximate quantitative representation of the visual bar
strength classes.
Variety is also treated as a continuous classification parameter, ranging from closed
inner rings (r) to open spirals (s). The intermediate variety (rs) is also well-defined. As for
family, underline notation rs and rs is used to underscore further continuity.
The classification of S0 galaxies depends on recognizing the presence of a disk and
a bulge at minimum, and usually a lens as well, and no spiral arms. A lens is a galaxy
component having a shallow brightness distribution interior to a sharp edge. Even if a lens
isn’t obvious, a galaxy could still be an S0. (Lenses are also not exclusive to S0s.) Other
structures, such as bars and rings, can enter in the classification of S0s. The stage sequence
S0−, S0o, S0+ is a sequence of increasing detail. Exceptionally early nonbarred S0s can
look very much like ellipticals, and in fact some galaxies classified as ellipticals in RC3 are
– 14 –
classified as S0 galaxies in the Revised Shapley-Ames Catalogue (RSA, Sandage & Tammann
1981). The transition type S0/a is the formal beginning of the spiral stage sequence.
In mag arcsec−2 units, luminous elliptical galaxies usually have very smooth light
distributions with no trace of a lens or any other structures. In principle, we should be able
to classify ellipticals more consistently with digital images than with photographic plates,
but the distinction from early S0s can still be very subtle in some cases as we have noted.
de Souza et al. (2004) found that about a third of elliptical galaxies can be misclassified as
S0s, and that it is equally easy to misclassify an elliptical as an S0 as the other way around.
Type E+ was originally intended by de Vaucouleurs (1959) to describe “late” ellipticals, or
“the first stage of the transition to the S0 class.”
Outer ring and pseudoring classifications are made in the same manner as in blue light:
the more closed outer rings are classified as (R) preceding the main type symbols, while
large pseudorings made of outer spiral arms whose variable pitch angle causes them to
close together are classified as (R′). In general, these classifications are not very sensitive
to the difference between blue and near-IR bands, although one or the other may facilitate
detecting the structures better.
A spindle is a highly inclined disk galaxy. For blue-light images, usually an “sp”
after the classification would almost automatically imply considerable uncertainty in the
interpretation, because stage, family, and variety are not easily distinguished when the
inclination is high. Even in the near-IR, classifying spindles is still difficult, but nevertheless
can be better than in blue light because planar absorption lanes are far less significant.
One important development in the classification of edge-on galaxies has been the ability
to recognize edge-on bars through boxy/peanut and “X”-shapes. Boxy/peanut bulges in
edge-on galaxies were proven to be bars seen edge-on from kinematic considerations (cf.
Kuijken & Merrifield 1995; see also Bureau & Freeman 1999). These shapes can be more
– 15 –
clearly evident in Spitzer images than in blue-light images. An example here is NGC 2683
(Figure 1.47).
A few classification details are used here that were not originally part of the de
Vaucouleurs system, but were used or discussed in the dVA. For example, the notation
“E (shells/ripples)” or “S0 (shells/ripples)” is used to denote an elliptical or S0 galaxy
that shows faint arc-like or curved enhancements (Malin & Carter 1980, 1983). The term
“shells” implies a particular three-dimensional geometry that Schweizer & Seitzer (1988)
argued imposes a prejudice on the interpretation of the structures. They proposed instead
the alternate term “ripples,” which implies less of a restrictive geometry. The Spitzer
images are deep enough to reveal even the inner shells in ellipticals well, if they are there,
and at least 4 shell galaxies were identified in the relatively small subsample of the S4G
studied here. We use the notation E(d) for disky ellipticals and E(b) for boxy ellipticals,
after Kormendy & Bender (1996). Although quantifiable in terms of Fourier analysis, our
classification is by eye and thus selects the most obvious cases. These distinctions, which
relate to velocity anisotropy, can be seen mainly in ellipticals harboring edge-on disks.
Following Kormendy (1979), we also recognize both inner lenses (l) and outer lenses
(L). We also recognize the “outer Lindblad resonance (OLR)” subcategories of outer rings
and pseudorings, R1, R′
1, R′
2, and R1R′
2, following Buta & Crocker (1991) and Buta (1995).
An R′
1 outer pseudoring is defined by a 180o winding of two spiral arms relative to the
bar ends, while an R′
2 outer pseudoring is defined by a 270o winding. R1 outer rings are
more detached versions of R′
1 outer pseudorings, while the double outer ring/pseudoring
morphology R1R′
2 is a distinctive combination of features including an R1 component
surrounded by an R′
2 pseudoring.
The prominence of nuclear rings and bars in 3.6µm images further necessitates
additional classification symbols beyond those just described. The nuclear rings in our

– 16 –
sample are so distinctive that we have used notation suggested by Buta & Combes (1996)
to recognize them. For example, NGC 3351 is classified as (R′)SB(r,nr)a, where “nr” is
the symbol for nuclear ring (“nl” if a lens instead). Comeron et al. (2010) have compiled
an atlas of known nuclear rings and made a statistical study of their sizes and other
characteristics. In addition, nuclear bars are seen in several of the sample galaxies, and are
distinctive enough features that we have also recognized them with the type classification
“nb.” Thus, the classification of NGC 5850 is (R′)SB(r,nr,nb)ab. We caution, however, that
we cannot provide these classifications for all S4G galaxies where nuclear rings and bars
may be present because the resolution (in parsecs) is critical for detecting them, and as a
result we can never make a claim that the classification is complete.
4.2. Comparison of Classifications
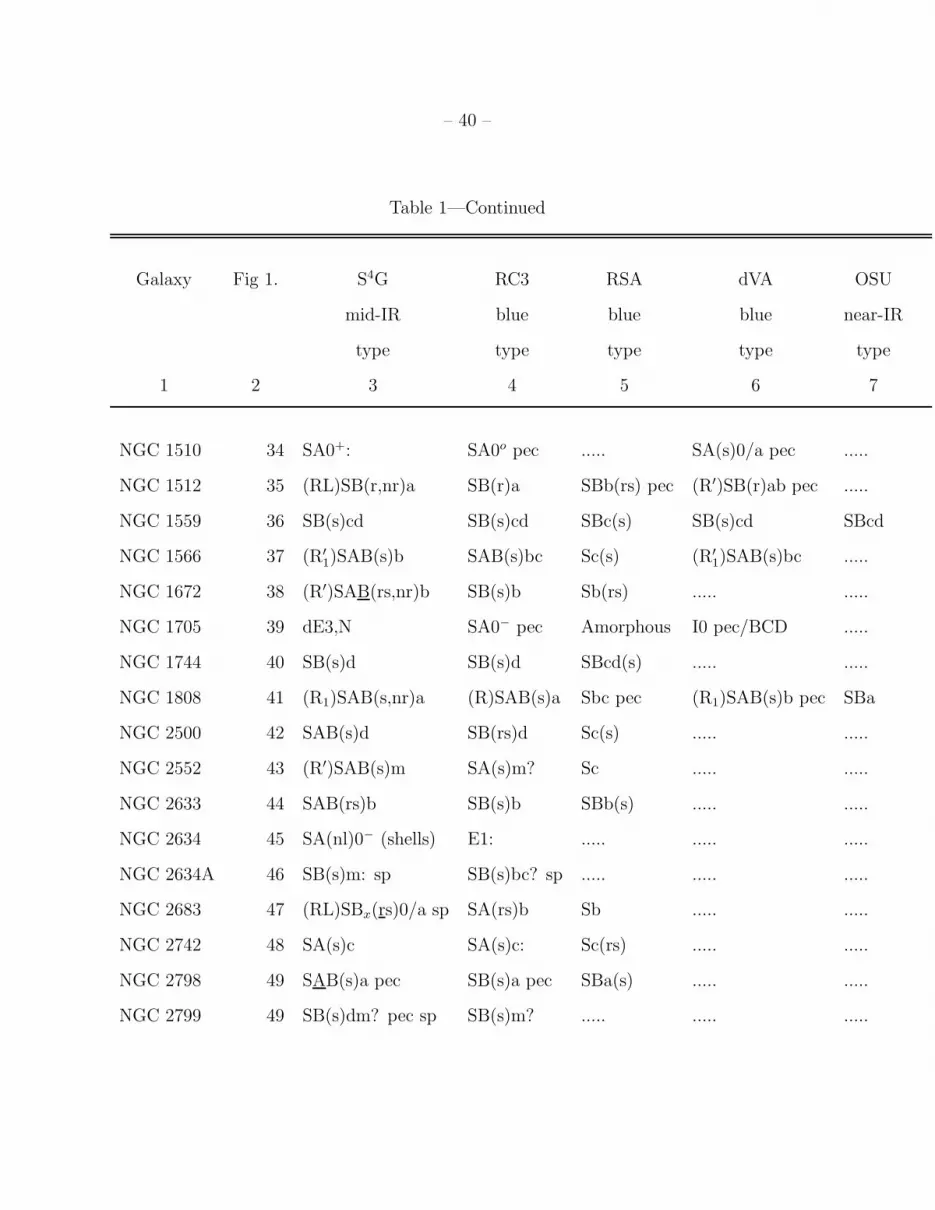
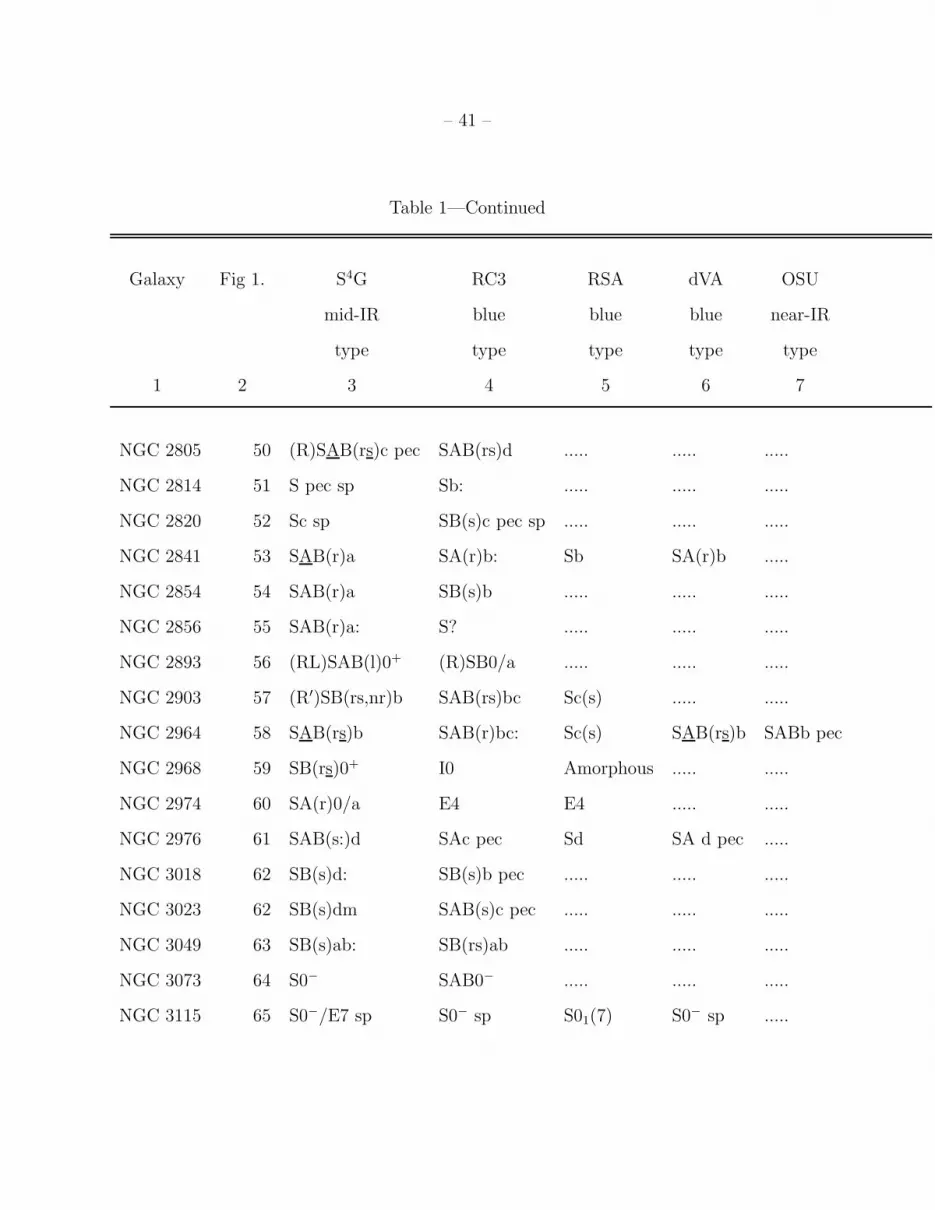
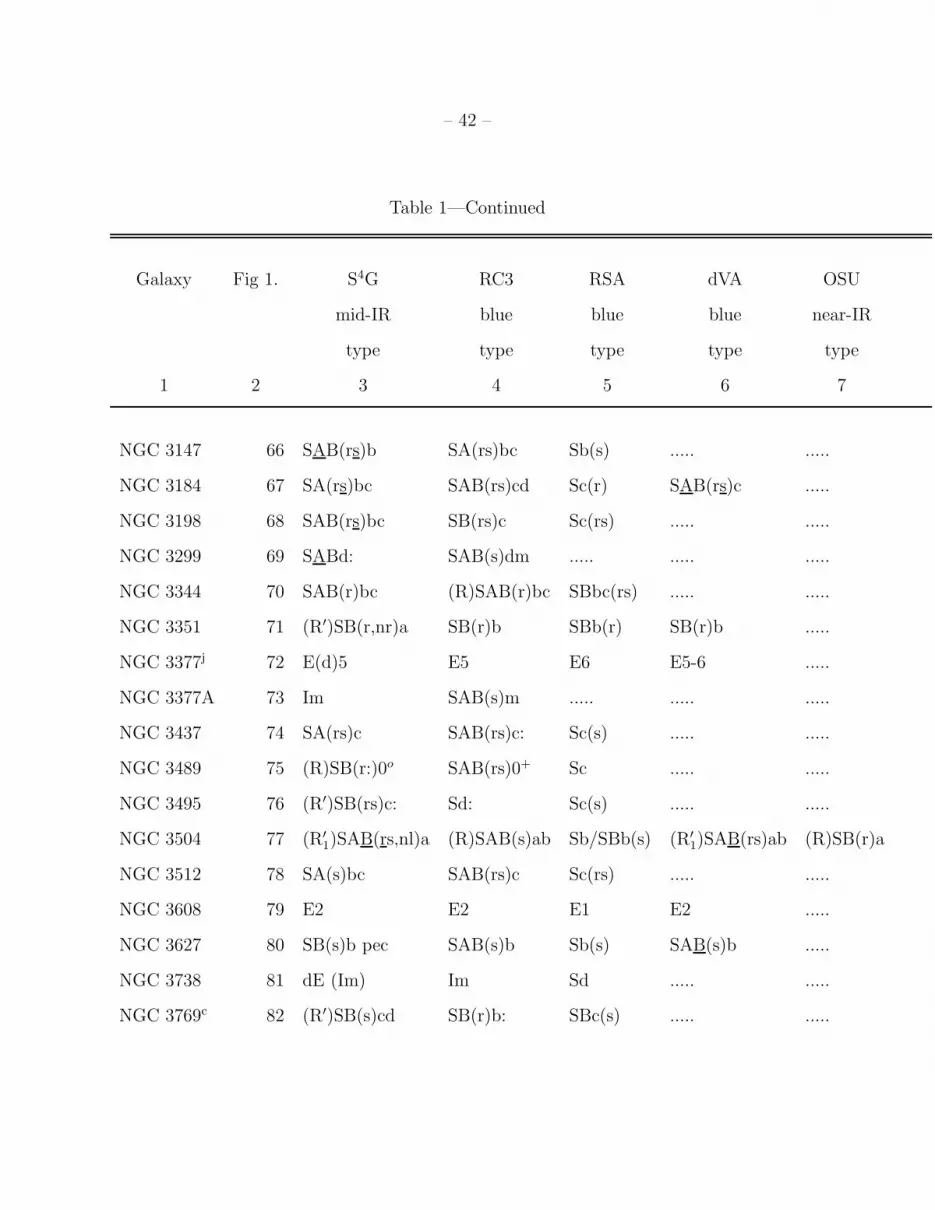
Our 3.6µm classifications are listed in Table 1, together with the classifications for the
same galaxies given in the RC3, the RSA, the dVA, and also in Eskridge et al. (2002),
which has 22 galaxies in common with our sample. Following de Vaucouleurs (1963), we use
”:” or ”?” to indicate different levels of uncertainty, with ”?” implying greater uncertainty.
In order to compare the 3.6µm stages, families, and varieties with those listed in the RC3,
the RSA, and the dVA, we use convenient numerical indices. For the stage, the 15 types
from E to Im are assigned numerical T values as follows: −5 (E), −4 (E+), −3 (S0−), −2
(S0o), −1 (S0+), 0 (S0/a), 1 (Sa), 2 (Sab), 3 (Sb), 4 (Sbc), 5 (Sc), 6 (Scd), 7 (Sd), 8 (Sdm),
9 (Sm), and 10 (Im) (de Vaucouleurs & de Vaucouleurs 1964). For family and variety, we
use the numerical indices adopted by de Vaucouleurs & Buta (1980): F=−1 for SA, 0
for SAB, and +1 for SB familes, and V= −1 for (r), 0 for (rs), and +1 for (s) varieties.
Underline notations in all cases are assigned half steps. The comparisons are plotted as
histograms of the numerical index difference, ∆(T, F, V ) = T, F, V (S4G)− T, F, V (other)

– 17 –
in Figures 3 - 5. All of the top frames in these figures are ∆(T ) comparisons. If ∆(T ) < 0,
the S4G classification is earlier than the other source’s classification, while if ∆(T ) > 0, the
S4G classification is later. The ∆(F ) comparisons are in the two lower left frames. If ∆(F )
< 0, the S4G bar classification is more nonbarred than the other source’s classification,
while if ∆(F ) > 0, the S4G bar classification is more barred. The ∆(V ) comparisons are in
the two lower right frames. If ∆(V ) < 0, the S4G variety classification is more ringed than
the other source’s classification, while if ∆(V ) > 0, the S4G variety classification is more
spiral-shaped.
The RC3 stage comparisons in Figure 3 (top left frame and lower three frames) show
first that the bin with the largest number of galaxies has ∆(T ) = 0, meaning the 3.6µm
stage and the RC3 stage are the same. The largest difference is found for RC3 stages
S0/a-Sc, where many galaxies are classified 1 stage interval earlier than in RC3. This is very
similar to what was found by Eskridge et al. (2002) using ground-based 1.65µm H-band
images for classifications, where galaxies with RC3 types Sab to Sc were classified about
1 stage interval earlier at 1.65µm than in RC3. The same systematic effect was found for
types Sa to Scd when these authors compared their 1.65µm types with their own B-band
types estimated from OSUBSGS images.
In the family and variety comparisons (upper right panels of Figure 3), the most
populated bins again have ∆=0. In fact, in these the concentration in the ∆=0 bin is much
larger than that in the stage comparisons in the upper panels. The plots show considerable
consistency between RC3 families and varieties and our Table 1 judgments. Surprisingly, in
this comparison we do not see a tendency for ∆(F ) to be greater than zero (the “stronger
bar” effect), which is what we would see if many 3.6µm bar classifications advanced to
higher bar strengths compared to RC3 classifications. That is, a big shift of SA to SAB and
SAB to SB is not seen. In contrast, Eskridge et al. (2000) report a factor of 2 more SBs
– 18 –
than in RC3. The problem with this kind of comparison is that blue light SB-type bars, as
seen in the IR, do not have a new classification bin to be placed in if they look stronger
in the IR, while blue light SAB-type bars do have a new bin - type SB. This appears to
increase the number of strong bars when in fact there is little change in bar rankings. In
Table 1 there are 16 galaxies in common with Eskridge et al., and of those, 12/16 are
classified as SB by Eskridge et al., 8/16 are SB in Table 1, and 7/16 are SB in RC3. The
difference between Eskridge et al. on one hand, and the Table 1 classifications on the other,
is likely not due to small number statistics in the Eskridge et al. sample, but to a difference
in what is called an SB. Our result is more consistent with Menendez-Delmestre et al.
(2007) and Sheth et al. (2008), who found the same bar frequency from the B-band to the
K-band, based on a semi-automated method of bar detection.
The comparisons shown in Figure 4 for RSA galaxies are different because the RSA
represents a different classification system. There are very few RSA galaxies classified as
later than Sc, and the classification of S0s is somewhat different. Nevertheless, we assigned
the same numerical indices to types S0/a to Im as for RC3, and we assigned values of
−3, −2, and −1 for types S01, S02, and S03, the same as for types S0−, S0o, and S0+,
respectively. Ellipticals are assigned T=−5, just as in RC3. Classifications like “E7/S0−
were assigned T=−4. The comparison shows that for the full range of RSA types, there
is little systematic difference between RSA and 3.6µm stages. However, for RSA stages
Sab-Sbc, the “earlier effect” is definitely seen, while for RSA stages Sc-Im, the 3.6µm types
are actually later. Only for types E-Sa is little or no systematic difference seen. The family
comparison shows that bar classifications are definitely stronger on average in the 3.6µm
types as compared to the RSA, and inner rings are classified more often in the 3.6µm
sample than in the RSA. Most of these differences are due to differences between the RSA
and de Vaucouleurs classification systems, and not to wavelength effects. The use of the
SAB symbolism allows RC3 types to be more discriminatory on bar classifications than
– 19 –
RSA types; a “stronger bar” effect is seen even in a comparison of RC3 and RSA blue light
classifications, due mainly to RC3 SAB galaxies classified mostly as S in the RSA. In the
case of variety, any inner ring that is made of tightly-wrapped spiral arms is classified as (s)
variety in the RSA, and usually as (r) in RC3 or (r) or (rs) in Table 1.
The dVA comparisons in Figure 5 are similar to the RC3 comparisons, but show
slightly more prominent “earlier type” and “stronger bar” effects. The comparisons of dVA
and 3.6µm types show less scatter not because of greater precision, but because the same
observer classified both data sets. Thus, Figure 5 is more of an internal, rather than an
external, comparison.
4.3. Noteworthy Examples
The results from the previous section are illustrated in Figures 6- 10. These compare
S4G 3.6µm images in mag arcsec−2 units with B-band images in the same units. Most of
the B-band images are from the dVA.
The four galaxies shown in Figure 6 cover a wide range of types. The images of the
Sdm/Sm galaxy NGC 428 are barely different. This is true also for the Sc galaxy NGC 628,
although its inner arms are smoother in the 3.6µm image than in the B-band image. The
image of NGC 1097 definitely looks a little earlier at 3.6µm, but still the differences are
relatively small. NGC 584 is an early-type galaxy shown in the figure that highlights the
greater depth of the 3.6µm image compared to a typical optical image. Although classified
as type E in RC3, NGC 584 is definitely an early S0 galaxy.
The four ringed galaxies in Figure 7 all show the “earlier effect”: S0/a galaxy NGC
1291 becomes type S0+; SBab galaxies NGC 1433 and NGC 1512 become type SBa; and
SBb galaxy NGC 3351 becomes type SBa. Even with these type changes, the overall

– 20 –
morphology of all four galaxies looks nearly the same in the two filters.
Figure 8 and the top panels of Figure 9 show three classic “flocculent” spirals, NGC
2841, 5055, and 7793 (Elmegreen 1981). In blue light all three have rather piece-wise
continuous spiral structures, but not the global patterns characteristic of grand design
spirals. In NGC 2841 and 5055, dust is a major factor in the appearance of the spiral
structure.
NGC 2841 changes from type Sb in the B-band to type Sa at 3.6µm, mostly because of
the penetration of this dust. Even so, the overall appearance of the more coherent B-band
spiral features in NGC 2841 is about the same at 3.6µm. The 3.6µm image also reveals a
weak bar in NGC 2841, ≈30′′ in radius and with a position angle of ≈160◦ (compared to
the galaxy major axis position angle of 147◦ listed in RC3). This is not the same bar-like
feature described by Varela et al. (1996), who identified a nuclear bar-like structure about
10′′ in radius. The inner ring in NGC 2841 recognized in Table 1 is a large feature, 3.′1 in
angular diameter, but the structure of the whole galaxy is very much a series of ring-like
features.
In NGC 5055, the flocculent spiral pattern looks more global at 3.6µm. However, the
appearance of the main arms still favors an Sbc classification, the same as the RC3 B-band
type. The main difference is that the feature classified as an inner pseudoring in RC3 [the
type is SA(rs)bc] is a smooth inner spiral at 3.6µm. The ring/lens (rl) feature recognized in
the Table 1 classification lies inside the RC3 pseudoring (as seen also in the 2.2µm image
shown in Thornley 1996). In the inner parts of NGC 5055, and throughout the disk of NGC
2841, star-forming regions are not prominent, but throughout the outer disk of NGC 5055,
the 3.6µm image reveals many large star-forming complexes.
The images of NGC 7793 in Figure 9 show a slightly more coherent spiral pattern in
the 3.6µm as compared to B, but which is still largely flocculent. The most noticeable
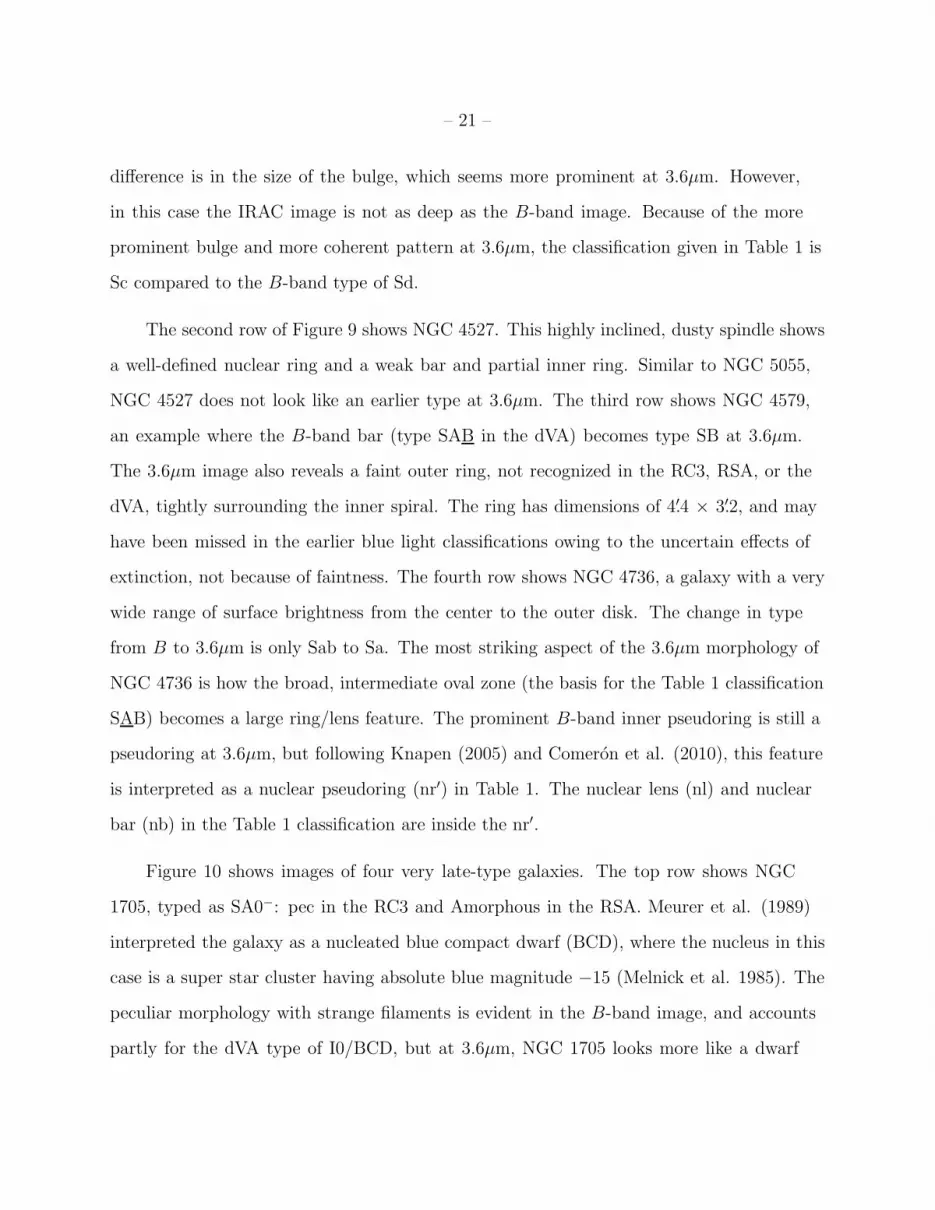
– 21 –
difference is in the size of the bulge, which seems more prominent at 3.6µm. However,
in this case the IRAC image is not as deep as the B-band image. Because of the more
prominent bulge and more coherent pattern at 3.6µm, the classification given in Table 1 is
Sc compared to the B-band type of Sd.
The second row of Figure 9 shows NGC 4527. This highly inclined, dusty spindle shows
a well-defined nuclear ring and a weak bar and partial inner ring. Similar to NGC 5055,
NGC 4527 does not look like an earlier type at 3.6µm. The third row shows NGC 4579,
an example where the B-band bar (type SAB in the dVA) becomes type SB at 3.6µm.
The 3.6µm image also reveals a faint outer ring, not recognized in the RC3, RSA, or the
dVA, tightly surrounding the inner spiral. The ring has dimensions of 4.′4 × 3.′2, and may
have been missed in the earlier blue light classifications owing to the uncertain effects of
extinction, not because of faintness. The fourth row shows NGC 4736, a galaxy with a very
wide range of surface brightness from the center to the outer disk. The change in type
from B to 3.6µm is only Sab to Sa. The most striking aspect of the 3.6µm morphology of
NGC 4736 is how the broad, intermediate oval zone (the basis for the Table 1 classification
SAB) becomes a large ring/lens feature. The prominent B-band inner pseudoring is still a
pseudoring at 3.6µm, but following Knapen (2005) and Comeron et al. (2010), this feature
is interpreted as a nuclear pseudoring (nr′) in Table 1. The nuclear lens (nl) and nuclear
bar (nb) in the Table 1 classification are inside the nr′.
Figure 10 shows images of four very late-type galaxies. The top row shows NGC
1705, typed as SA0−: pec in the RC3 and Amorphous in the RSA. Meurer et al. (1989)
interpreted the galaxy as a nucleated blue compact dwarf (BCD), where the nucleus in this
case is a super star cluster having absolute blue magnitude −15 (Melnick et al. 1985). The
peculiar morphology with strange filaments is evident in the B-band image, and accounts
partly for the dVA type of I0/BCD, but at 3.6µm, NGC 1705 looks more like a dwarf
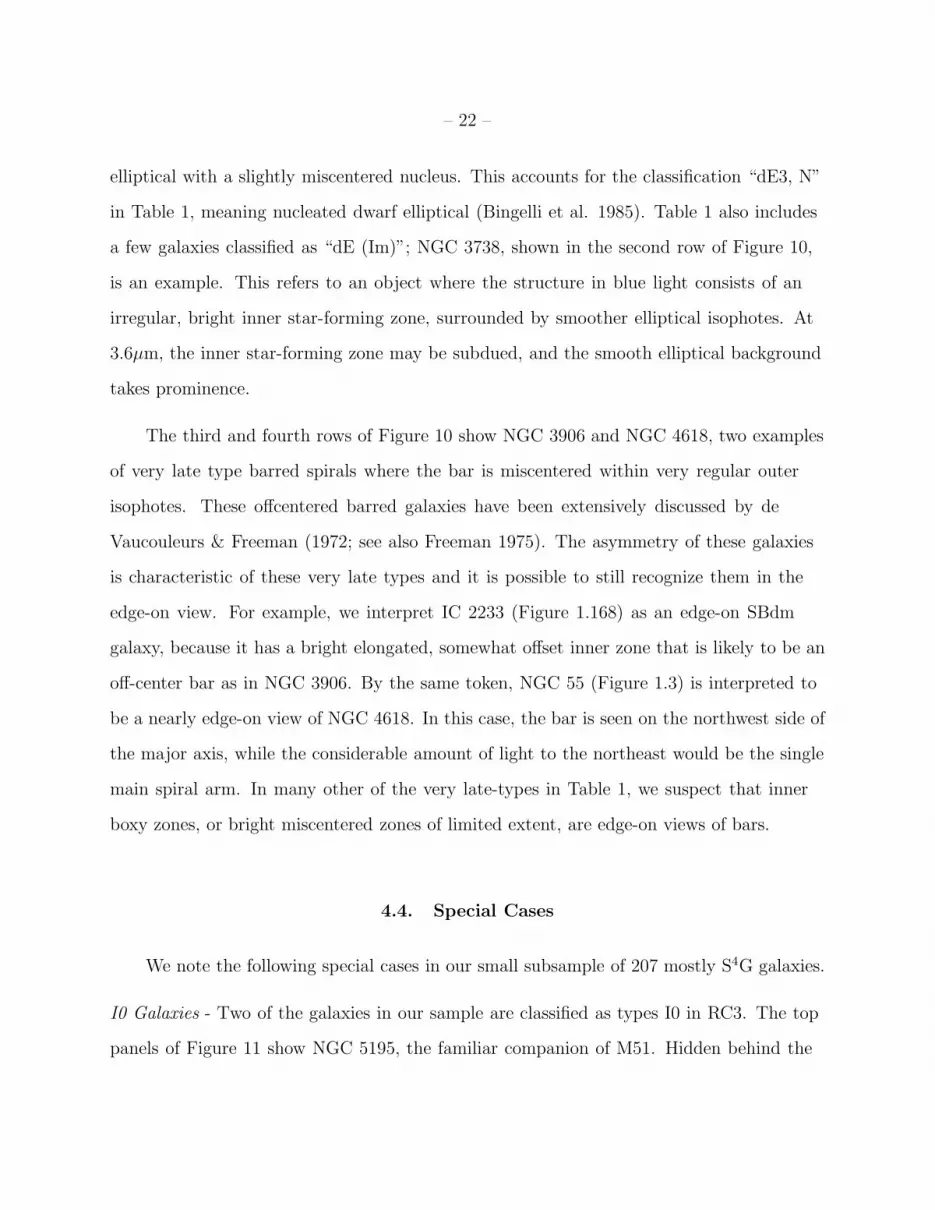
– 22 –
elliptical with a slightly miscentered nucleus. This accounts for the classification “dE3, N”
in Table 1, meaning nucleated dwarf elliptical (Bingelli et al. 1985). Table 1 also includes
a few galaxies classified as “dE (Im)”; NGC 3738, shown in the second row of Figure 10,
is an example. This refers to an object where the structure in blue light consists of an
irregular, bright inner star-forming zone, surrounded by smoother elliptical isophotes. At
3.6µm, the inner star-forming zone may be subdued, and the smooth elliptical background
takes prominence.
The third and fourth rows of Figure 10 show NGC 3906 and NGC 4618, two examples
of very late type barred spirals where the bar is miscentered within very regular outer
isophotes. These offcentered barred galaxies have been extensively discussed by de
Vaucouleurs & Freeman (1972; see also Freeman 1975). The asymmetry of these galaxies
is characteristic of these very late types and it is possible to still recognize them in the
edge-on view. For example, we interpret IC 2233 (Figure 1.168) as an edge-on SBdm
galaxy, because it has a bright elongated, somewhat offset inner zone that is likely to be an
off-center bar as in NGC 3906. By the same token, NGC 55 (Figure 1.3) is interpreted to
be a nearly edge-on view of NGC 4618. In this case, the bar is seen on the northwest side of
the major axis, while the considerable amount of light to the northeast would be the single
main spiral arm. In many other of the very late-types in Table 1, we suspect that inner
boxy zones, or bright miscentered zones of limited extent, are edge-on views of bars.
4.4. Special Cases
We note the following special cases in our small subsample of 207 mostly S4G galaxies.
I0 Galaxies - Two of the galaxies in our sample are classified as types I0 in RC3. The top
panels of Figure 11 show NGC 5195, the familiar companion of M51. Hidden behind the
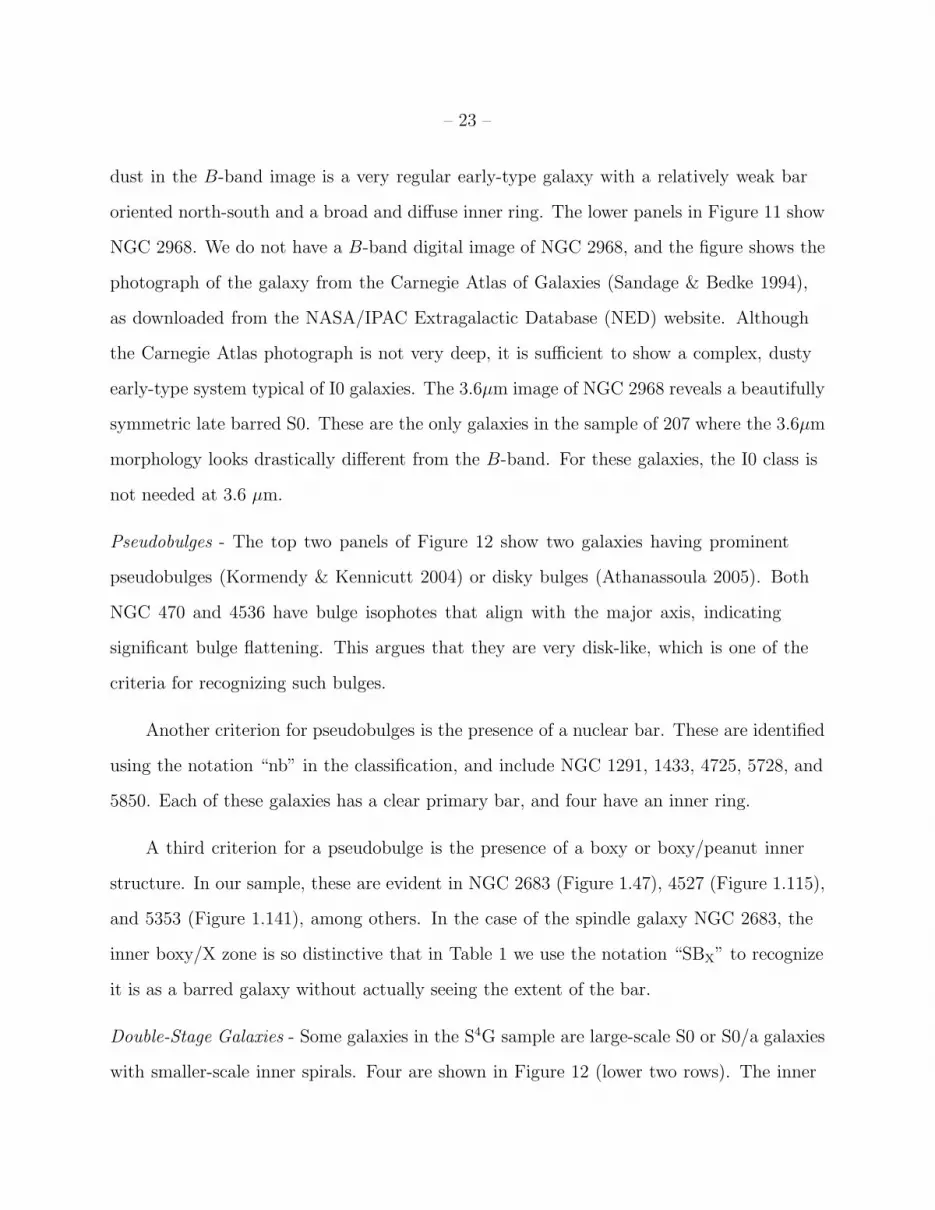
– 23 –
dust in the B-band image is a very regular early-type galaxy with a relatively weak bar
oriented north-south and a broad and diffuse inner ring. The lower panels in Figure 11 show
NGC 2968. We do not have a B-band digital image of NGC 2968, and the figure shows the
photograph of the galaxy from the Carnegie Atlas of Galaxies (Sandage & Bedke 1994),
as downloaded from the NASA/IPAC Extragalactic Database (NED) website. Although
the Carnegie Atlas photograph is not very deep, it is sufficient to show a complex, dusty
early-type system typical of I0 galaxies. The 3.6µm image of NGC 2968 reveals a beautifully
symmetric late barred S0. These are the only galaxies in the sample of 207 where the 3.6µm
morphology looks drastically different from the B-band. For these galaxies, the I0 class is
not needed at 3.6 µm.
Pseudobulges - The top two panels of Figure 12 show two galaxies having prominent
pseudobulges (Kormendy & Kennicutt 2004) or disky bulges (Athanassoula 2005). Both
NGC 470 and 4536 have bulge isophotes that align with the major axis, indicating
significant bulge flattening. This argues that they are very disk-like, which is one of the
criteria for recognizing such bulges.
Another criterion for pseudobulges is the presence of a nuclear bar. These are identified
using the notation “nb” in the classification, and include NGC 1291, 1433, 4725, 5728, and
5850. Each of these galaxies has a clear primary bar, and four have an inner ring.
A third criterion for a pseudobulge is the presence of a boxy or boxy/peanut inner
structure. In our sample, these are evident in NGC 2683 (Figure 1.47), 4527 (Figure 1.115),
and 5353 (Figure 1.141), among others. In the case of the spindle galaxy NGC 2683, the
inner boxy/X zone is so distinctive that in Table 1 we use the notation “SBX” to recognize
it is as a barred galaxy without actually seeing the extent of the bar.
Double-Stage Galaxies - Some galaxies in the S4G sample are large-scale S0 or S0/a galaxies
with smaller-scale inner spirals. Four are shown in Figure 12 (lower two rows). The inner

– 24 –
spirals in these galaxies are only a small fraction of the size of the system. In effect, these
are “double-stage” galaxies, because the large-scale structure is that of an early-type galaxy
and the inner structure is that of a later-type galaxy. The final type we have adopted
is usually a compromise unless one characteristic dominates (see notes to Table 1). The
double-stage character in NGC 5713, where an inner asymmetric star-forming component
lies within a smooth, asymmetric outer ring, could be linked to an interaction (Vergani et
al. 2007). Double-stage spirals were described by Vorontsov-Velyaminov (1987) as cases
where an inner spiral pattern gives a different type from an outer spiral pattern.
Double-Variety Galaxies - We have already described NGC 5055 as having an inner
pseudoring and an inner ring/lens in the 3.6µm image, which makes the galaxy an unusual
case of a double variety system. This characteristic was not readily evident in blue light.
Both features, especially the inner pseudoring, are visible in the 3.6µm radial luminosity
profile of NGC 5055 shown by de Blok et al. (2008). While the two variety patterns
are completely separated in this case, they can also overlap. For example, NGC 986
(Figure 1.21) has a very strong s-shaped spiral superposed on a diffuse inner ring. The two
varieties in this case do not seem related, i.e., there is an inner ring but the main arms are
not related to the ring.
Inner Disks - Among the spindles in our sample, NGC 24 (Figure 1.1) is unique in showing
a very bright, well-centered inner component that aligns almost exactly with the major
axis, suggesting that the component is an inner disk and not an inner bar. The galaxy is
not exactly edge-on, and a ring is recognizable in the spiral morphology. The inner disk
component greatly underfills this ring, another characteristic that suggests the feature is
not a bar. This shows the advantage of the mid-IR for morphological studies of edge-on
disks (see also Fazio et al. 2004b).
Outer Rings - One of the stated goals of the S4G project was to take advantage of the

– 25 –
considerable depth of Warm Mission images to detect previously unrecognized outer rings,
especially rings so faint that optical images failed to reveal them. In blue light, such rings
tend to have surface brightnesses µB ≥ 25.0 mag arcsec−2, and some could be lost due to
extinction or exceptional intrinsic faintness. Although we expect that some faint outer rings
will be found when the entire survey is completed, none were identified in the subsample of
S4G that we have examined here. The main new outer ring we detected is in NGC 4579
(Figure 9), but, as we have already noted, it was missed in the RC3, RSA, and dVA only
because of the uncertain effects of internal extinction, not because of exceptional faintness.
The main reason few outer rings were detected in our sample here is probably because
the sample has a large fraction of late-type galaxies, where outer rings are infrequently
seen (Buta & Combes 1996). The images of NGC 1291 in Figure 7 show that even an
exceptionally bright outer ring in blue light can have considerably reduced contrast at
3.6µm. The outer ring in NGC 1291 is where most of the recent star formation is taking
place, and is prominent in blue light as a result, but at 3.6µm, the feature barely stands out
as a broadly oval enhancement in a rounder diffuse background.
4.5. The Nature of Resolved 3.6µm Objects
The strong similarity between B-band and 3.6 micron images in many of the galaxies
we show here is one of the most important findings from this study. It is perhaps surprising
that at 3.6µm, the “degree of resolution” effect can still play a role in the classification of
spirals, when the common assumption is that IR light traces mass and de-emphasizes the
massive OB star complexes that line the arms in blue light. Nevertheless, young stars can
impact morphology in the near- and mid-IR. Rix & Rieke (1993) and Rhoads (1998) showed
using the CO index that young red supergiant stars no more than 107 yr old may contribute
substantial local flux at 2µm even if the global 2µm flux is dominated by old stars.

– 26 –
Detailed comparison of resolved objects in B-band and 3.6µm images shows that, in
many cases, the same complexes are being seen. An especially good illustration of this
is provided by NGC 1559, whose type [SB(s)cd] is essentially the same in the two filters
(Figure 13). Although the considerably reduced sky background in 3.6µm images allows a
flurry of faint foreground stars to appear, the resolved objects we see in NGC 1559 follow
the spiral arms closely and are not randomly scattered. A color index map (not shown)
reveals that most of the resolved sources are redder in the [3.6]−[4.5] color index than the
galaxy background light.
Figure 14 shows a color-magnitude plot of 159 of these objects as compared to a
similar-sized sample of surrounding field objects (foreground stars and background galaxies).
A redshift-independent distance modulus of 30.95 (NED) has been used for the absolute
magnitude scale. Photometry was performed with IRAF routine PHOT using a measuring
aperture of 2 pix and background estimates taken from 3-5 pix for each object. A bright
foreground star off the galaxy was used to determine an aperture correction of 0.88 mag,
which has been subtracted from the 2 pix radius 3.6µm magnitude [3.6]. These graphs
can be compared to Figures 7 and 8 of Mould et al. (2008), who analyzed IRAC data for
the resolved stellar population in M31 and a comparison SWIRE control field. Mould et
al. detected luminous red supergiants in M31, some showing evidence of mass loss. As
also shown by Mould et al., field objects will overlap the distribution of galaxy objects in
such plots. The asymptotic giant branch reaches to only M [3.6]≈−10 (see also Jackson et
al. 2007), while the brightest evolved supergiants in M31 reach [3.6]=9.5, or M [3.6]≈−15.
Figure 14 shows that most of the resolved objects in NGC 1559 are more luminous than
this, which is consistent with their slightly fuzzy appearance; these are complexes rather
than merely individual stars, although some of the faintest objects could be individual
stars. The individual AGB population is largely out of reach at the distance of NGC 1559,
and we conclude that the resolved objects in the arms are likely groups of massive young

– 27 –
stars. However, it is not clear that we can think of the resolved objects entirely in terms of
groups of young red stars.
Mentuch et al. (2009) modeled the spectral energy distributions of high redshift
galaxies and concluded that a previously discovered excess of infrared flux in the 2-5µm
region can be best interpreted in terms of modified blackbody emission from dust at 850K
together with the well-known polycyclic aromatic hydrocarbon (PAH) emission at 3.3µm.
The excess emission is believed to come from the puffed up inner edges of circumstellar
disks in massive star-forming regions. Given what we have described above, this mechanism
could account for some of the light of the resolved sources we see in S4G images. Further
studies should be able to clarify this issue.
Note that use of 4.5µm images will not necessarily avoid the effects of the resolved
objects on morphological interpretations. Comparison between the 3.6 and 4.5µm images
of virtually all the galaxies in our sample shows little difference in apparent morphology.
The resolved objects are just as conspicuous at 4.5µm as they are at 3.6µm. Given this,
the question arises: which IR domain, near or mid, might be better for revealing the true
“stellar backbone,” or what is called the “star-dominated Population II disk” by Block et
al. (2004). Figure 15 shows the IRAC 3.6µm image of M51 (right frame) as compared to
a 2.2µm Ks-band image obtained in May 2009 by RB using the FLAMINGOS IR imaging
camera attached to the Kitt Peak 2.1m telescope. The on-source exposure time of the
latter image was 30min. The comparison shows that the spiral arms of M51 are smoother
and less affected by star-forming regions in the Ks band than in the 3.6 µm Spitzer band,
perhaps arguing in favor of the Ks band for stellar mass studies. However, this comparison
also displays the considerably greater depth of the 3.6µm image compared with a typical,
Ks-band image. Although the 3.6µm image is affected by star formation, the light is still
dominated by the “stellar backbone” of old stars and the best approach to getting at this

– 28 –
background would be to find ways to correct 3.6µm images for the younger “contaminants.”
This will be extensively discussed in a future S4G paper (S. Meidt et al., in preparation).
4.6. Bar Fraction
We conclude our analysis by examining the bar fraction in our subsample of S4G
galaxies. The bar fraction has cosmological signficance (Sheth et al. 2008), and has been
the topic of many recent optical and near-IR studies (e.g., Knapen et al. 2000; Eskridge
et al. 2000; Laurikainen et al. 2004; Menendez-Delmestre et al. 2007; Marinova & Jogee
2007; Barazza et al. 2008; Sheth et al. 2008; Aguerri et al. 2009; Marinova et al. 2009;
Mendez-Abreu et al. 2010; Masters et al. 2010). In general, these studies are in fairly
good agreement on this parameter, in spite of different methodologies. Some find a slightly
higher bar fraction in the near-IR than in the optical (e. g., Knapen et al 2000, Eskridge et
al 2000), while others do not (e. g., Menendez-Delmestre et al. 2007; Sheth et al. 2008).
Eskridge et al. (2000) found that the fraction of strongly barred galaxies (i.e., classified
as SB) rises by almost a factor of 2 from the optical to the near-IR. The rise is mainly
due to reclassification of SAB-type bars to SBs because bars are often more prominent at
near-IR than at blue wavelengths, but the overall SAB+SB bar fraction is similar in the two
wavelength domains as shown by Whyte et al. (2002), Menendez-Delmestre et al. (2007),
and Sheth et al. (2008), among others. Menendez-Delmestre et al. (2007) and Sheth et al.
(2008) also found that almost as many galaxies in the near-IR get classified from barred
to nonbarred as are classified from nonbarred to barred. However, these constituted only
a small percentage of the sample. In fact, 127/139 galaxies did not change bar type when
these authors compared G to IR images, 7 went from SA to SAB, 4 from SAB to SA, and 1
from SB to SA. Thus, over 90% looked the same. The ones that did not were faint, small,
or close to the inclination cut-off, and as a consequence were hard to classify.
– 29 –
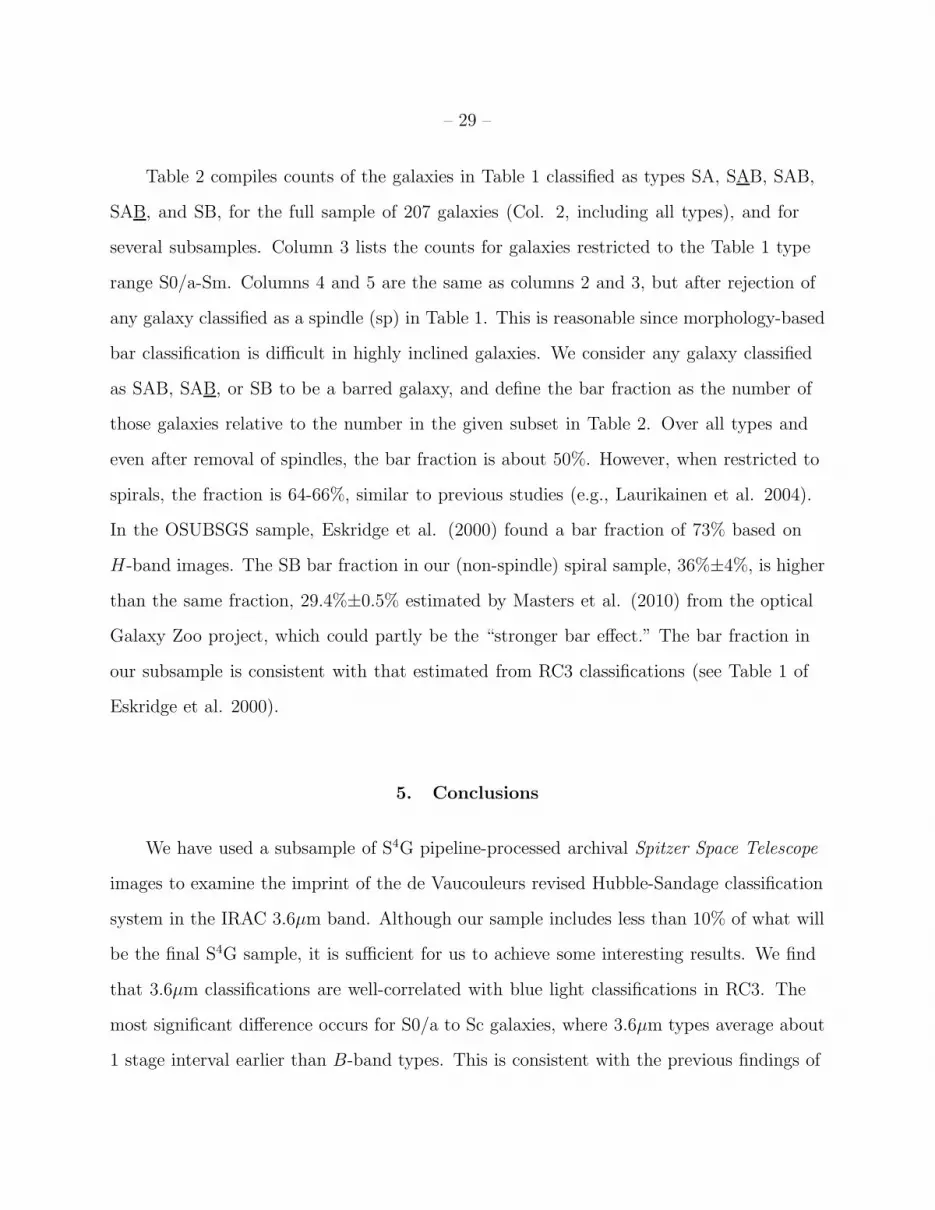
Table 2 compiles counts of the galaxies in Table 1 classified as types SA, SAB, SAB,
SAB, and SB, for the full sample of 207 galaxies (Col. 2, including all types), and for
several subsamples. Column 3 lists the counts for galaxies restricted to the Table 1 type
range S0/a-Sm. Columns 4 and 5 are the same as columns 2 and 3, but after rejection of
any galaxy classified as a spindle (sp) in Table 1. This is reasonable since morphology-based
bar classification is difficult in highly inclined galaxies. We consider any galaxy classified
as SAB, SAB, or SB to be a barred galaxy, and define the bar fraction as the number of
those galaxies relative to the number in the given subset in Table 2. Over all types and
even after removal of spindles, the bar fraction is about 50%. However, when restricted to
spirals, the fraction is 64-66%, similar to previous studies (e.g., Laurikainen et al. 2004).
In the OSUBSGS sample, Eskridge et al. (2000) found a bar fraction of 73% based on
H-band images. The SB bar fraction in our (non-spindle) spiral sample, 36%±4%, is higher
than the same fraction, 29.4%±0.5% estimated by Masters et al. (2010) from the optical
Galaxy Zoo project, which could partly be the “stronger bar effect.” The bar fraction in
our subsample is consistent with that estimated from RC3 classifications (see Table 1 of
Eskridge et al. 2000).
5. Conclusions
We have used a subsample of S4G pipeline-processed archival Spitzer Space Telescope
images to examine the imprint of the de Vaucouleurs revised Hubble-Sandage classification
system in the IRAC 3.6µm band. Although our sample includes less than 10% of what will
be the final S4G sample, it is sufficient for us to achieve some interesting results. We find
that 3.6µm classifications are well-correlated with blue light classifications in RC3. The
most significant difference occurs for S0/a to Sc galaxies, where 3.6µm types average about
1 stage interval earlier than B-band types. This is consistent with the previous findings of
– 30 –
Eskridge et al. (2002), which were based on OSUBSGS H-band 1.65µm images. The great
advantage of the IRAC 3.6µm images is their considerably better depth than any previous
ground-based IR images, allowing a more complete picture of global IR galaxy morphology,
rather just the inner regions which were all that were revealed in earlier studies.
The use of the same classification methods for 3.6µm images as for blue light images
is a strength of our analysis. Had we used different methods we likely would have
found spurious differences. This is actually illustrated by our comparison of our 3.6µm
classifications, evaluated as in the RC3/dVA, and the classifications for the same galaxies
given in the RSA. This comparison revealed large systematic differences that are only partly
attributable to the wavelength difference between blue light photographic plates and S4G
images. Instead, most of the differences are due to methodological differences between RSA
and RC3/dVA classifications. Another issue is that morphological classification is based
on important properties, not minor details. In classifying a galaxy, we look at whether a
particular feature exists, is predominant, secondary or non-existent, and to the extent that
we see these features, the structure of the old and the young populations do not differ that
wildly.
Deep 3.6µm galaxy morphology provides an effective, dust-penetrated alternative to
historical blue light morphology, and in principle could one day fully replace blue light as
the standard passband for galaxy classification. However, the band is not completely free of
the effects of young star forming regions, and thus may not show the “stellar backbone” of
galactic disks as effectively as in other bands, such as the K-band (e.g., Block et al. 2004).
For the future, our goal is to classify the entire S4G sample in the same manner as described
here, to facilitate statistical studies of various morphological features, and to provide a
morphological backdrop to the quantitative analyses that will come out of the survey.
We thank the referee for many helpful comments that improved the presentation of
– 31 –
this paper. We also thank D. L. Block for additional comments and for pointing us to
a useful reference, as well as the other members of the S4G Team for helping to make
the project possible. RB acknowledges the support of NSF Grant AST 05-07140. EA
and AB thank the Centre National d’Etudes Spatiales for financial support. K.L.M.
acknowledges funding from the Peter and Patricia Gruber Foundation as the 2008 IAU
Fellow, from the University of Portsmouth and from SEPnet (www.sepnet.ac.uk). HS and
EL acknowledge the Academy of Finland for support. JHK acknowledges support by the
Instituto de Astrofisica de Canarias (312407). KMD is supported by an NSF Astronomy
and Astrophysics Postdoctoral Fellowship under award AST-0802399. A.G.dP and J.C.M.M
are partially financed by the Spanish Programa Nacional de Astronomıa y Astrofısica
under grants AyA2006-02358 and AyA2009-10368, and by the Spanish MEC under the
Consolider-Ingenio 2010 Program grant CSD2006-00070: first Science with the GTC.
A.G.dP is also financed by the Spanish Ramon y Cajal program. J.C.M.M. acknowledges
the receipt of a Formacion del Profesorado Universitario fellowship. SC is supported by a
KASI Postdoctoral Fellowship. This work is based [in part] on archival data obtained with
the Spitzer Space Telescope, which is operated by the Jet Propulsion Laboratory, California
Institute of Technology under a contract with NASA. Support for this work was provided by
an award issued by JPL/Caltech. Funding for the OSUBSGS was provided by grants from
the NSF (grants AST 92-17716 and AST 96-17006), with additional funding from the Ohio
State University. Funding for the creation and distribution of the SDSS Archive has been
provided by the Alfred P. Sloan Foundation, the Participating Institutions, NASA, NSF,
the U.S. Department of Energy, the Japanese Monbukagakusho, and Max Planck Society.
NED is operated by the Jet Propulsion Laboratory, California Institute of Technology,
under contract with NASA.
– 32 –
REFERENCES
Athanassoula, E. 2005, MNRAS, 358, 1477
Aguerri, J. A. L., Mendez-Abreu, J., & Corsini, E. M. 2009, A&A, 495, 491
Banerj, M. et al. 2010, astro-ph 0908.2033
Barazza, F. D., Jogee, S., & Marinova, I. 2008, ApJ, 675, 1194
Bingelli, B., Sandage, A., & Tammann, G. A. 1985, AJ, 90, 1681
Block, D. L., Bertin, G., Stockton, A., Grosbol, P., Moorwood, A. F. M., Peletier, R. F.
1994, A&A, 288, 365
Block, D., Freeman, K. C., Puerari, I., Combes, F., Buta, R., Jarrett, T., & Worthey, G.
2004, in Penetrating Bars Through Masks of Cosmic Dust, eds. D. L. Block, I. Puerari, K.
C. Freeman, R. Groess, & E. Block, Springer, Kluwer, p. 15
Block, D. L. & Wainscoat, R. J. 1991, Nature, 353, 48
Bureau, M. & Freeman, K. C. 1999, AJ, 118, 126
Buta, R. 1995, ApJS, 96, 39
Buta, R. & Combes, F. 1996, Fund. Cosmic Phys. 17, 95
Buta, R. & Crocker, D. A. 1991, AJ, 102, 1715
Buta, R. J., Corwin, H. G., & Odewahn, S. C. 2007, The de Vaucouleurs Atlas of Galaxies,
Cambridge: Cambridge U. Press (dVA)
Buta, R., Vasylyev, S., Salo, H., & Laurikainen, E. 2005, AJ, 130, 506
Buta, R., Laurikainen, E., Salo, H., Block, D. L., & Knapen, J. H. 2006, AJ, 132, 1859
Comeron, S., Knapen, J. H., Beckman, J. E., Laurikainen, E., Salo, H., Martinez-Valpuesta,

– 33 –
I., & Buta, R. J. 2010, MNRAS, 402, 2462
Corwin, H., de Vaucouleurs, A., & de Vaucouleurs, G. 1985, Southern Galaxy Catalogue,
Univ. Texas Monographs, No. 4.
Davidge, T. J. 2003, AJ, 125, 30
de Blok, W. J. G., Walter, F., Brinks, E., Trachternach, C., Oh, S.-H., & Kennicutt, R. C.
2008, AJ, 136, 2648
de Jong, R. S. & van der Kruit, P. C. 1994, A&AS, 106, 451
de Souza, R. E., Gadotti, D. A., & dos Anjos, S. 2004, ApJS, 153, 411
de Vaucouleurs, G. 1959, Handbuch der Physik, 53, 275
de Vaucouleurs, G. 1963, ApJS, 8, 31
de Vaucouleurs, G. & Buta, R. 1980, ApJS, 44, 451
de Vaucouleurs, G. & de Vaucouleurs 1964, Reference Catalog of Bright Galaxies, University
of Texas Monographs in Astronomy, No. 1 (RC1)
de Vaucouleurs, G. & Freeman, K. C. 1972, Vista in Astr. 14, 163
de Vaucouleurs, G., de Vaucouleurs, A., Corwin, H. G., Buta, R. J., Paturel, G., & Fouque,
P. 1991, Third Reference Catalog of Bright Galaxies (New York: Springer) (RC3)
Elmegreen, D. 1981, ApJS, 47, 229
Elmegreen, D. M. & Elmegreen, B. G. 1984, ApJS, 54, 127
Elmegreen, D. M. & Elmegreen, B. G. 1987, ApJ, 314, 3
Eskridge, P. et al. 2000, AJ, 119, 536
Eskridge, P. et al. 2002, ApJS, 143, 73
– 34 –
Fazio, G. G. et al. 2004, ApJS, 154, 10
Fazio, G. G., Pahre, M. A., Willner, S. P., & Ashby, M. L. N. 2004b, in Penetrating Bars
Through Masks of Cosmic Dust, eds. D. L. Block, I. Puerari, K. C. Freeman, R. Groess, &
E. Block, Springer, Kluwer, p. 389
Freeman, K.C.1975, in Galaxies and the Universe, A. Sandage, M. Sandage, & J. Kristian,
eds., cHIcago, University of Chicago Press, p. 409
Fukugita, M. et al. 2007, AJ, 134, 570
Graham, A. W. & Worley, C. C. 2008, MNRAS, 388, 1708
Hackwell, J. & Schweizer, F. 1983, ApJ, 265, 643
Holmberg, E. 1950, Medd. Lunds. Astron. Obs., Ser. II, No. 128
Hubble, E. 1926, ApJ, 64, 321
Hubble, E. 1936, The Realm of the Nebulae, Yale, Yale University Press
Jackson, D. C., Skillman, E. D., Gehrz, R. D., Polomski, E., & Woodward, C. E. 2007,
ApJ, 656, 818
Jarrett, T. H. et al. 2003, AJ, 125, 525
Kennicutt, R. C. et al. 2003, PASP, 115, 928
Kennicutt, R. C. et al. 2007, BAAS, 211, 9502
Knapen, J. H. 2005, A&A, 429, 141
Knapen, J., Shlosman, I., & Peletier, R. 2007, ApJ, 529, 93
Kormendy, J. 1979, ApJ, 227, 714
Kormendy, J. & Bender, R. 1996, ApJ, 464, L119

– 35 –
Kormendy, J. & Kennicutt, R. 2004, ARAA, 42, 603 (KK04)
Lauberts, A. 1982, The ESO-Uppsala Survey of the ESO (B) Atlas, ESO
Laurikainen, E., Salo, H., & Buta, R. 2004, ApJ, 607, 103
Laurikainen, E., Salo, H., & Buta, R. 2005, MNRAS, 362, 1319
Laurikainen, E., Salo, H., Buta, R., Knapen, J., Speltincx, T., & Block, D. L. 2006,
MNRAS, 132, 2634
Laurikainen, E., Salo, H., Buta, R., Knapen, J. H., & Comeron, S. 2010, MNRAS, in press
(astro-ph 1002.4370)
Lintott, C. et al. 2008, MNRAS, 389, 1179
Malin, D. & Carter, D. 1980, Nature, 285, 643
Malin, D. & Carter, D. 1983, ApJ, 274, 534
Marinova, I. & Jogee, S. 2007, ApJ, 659, 1176
Marinova, I. et al. 2009, ApJ, 698, 1639
Masters, K. et al. 2010, astro-ph 1003.0449
Mendez-Abreu, J. Sanchez-Janssen, & Aguerri, J. A. L. 2010, ApJ, 711, L61
Mentuch, E. et al. 2009, ApJ, 706, 1020
Menendez-Delmestre, K., Sheth, K., Schinnerer, E., Jarrett, T., & Scoville, N. Z. 2007,
ApJ, 657, 790
Meurer, G., Freeman, K. C., & Dopita, M. A. 1989, Ap&SS, 156, 141
Melnick, J., Moles, M., & Terlevich, R. 1985, AJ, 149, L24
– 36 –
Mihos, J. C. & Hernquist, L. 1996, ApJ, 464, 641
Naim, A. et al. 1995, MNRAS, 274, 1107
Nair, P. B. & Abraham, R. G. 2010, ApJS, 186, 427
Pahre, M., Ashby, M. L. N., Fazio, G. G., & Willner, S. P. 2004, ApJS, 154, 235
Rhoads, J. E. 1998, AJ, 115, 472
Rix, H.-W. & Rieke, M. J. 1993, ApJ, 418, 123
Sandage, A. 1961, The Hubble Atlas of Galaxies, Carnegie Inst. of Wash. Publ. No. 618
Sandage, A. and Bedke, J. 1994, The Carnegie Atlas of Galaxies, Carnegie Institute of
Washington Publ. No. 638
Schweizer, F. & Seitzer, P. 1988, ApJ, 328, 88
Scoville, N. Z., Matthews, K., Carico, D. P., & Sanders, D. B. 1988, ApJ, 327, L61
Sheth, K. et al. 2008, ApJ, 675, 1141
Sheth, K. et al. 2010, PASP, submitted
Simien, F. & de Vaucouleurs, G. 1986, ApJ, 302, 564
Skrutskie, M. et al. 1997, ASSL, 210, 25
Talbot, R. J., Jensen, E. B., & Dufour, R. J. 1979, ApJ, 229, 91
Taylor, V. A., Jansen, R. A., Windhorst, R. A., Odewahn, S. C., & Hibbard, J. E. 2005,
ApJ, 630, 784
Taylor-Mager, V. A., Conselice, C. J., Windhorst, R. A., & Jansen, R. A. ApJ, 659, 162
Telesco, C. M., Joy, M., Dietz, K., Decher, R., & Campins, H. 1991, ApJ, 369, 135

– 37 –
Thornley, M. 1996, ApJ, 469, L45
Thronson, H. A., Hereld, M., Majewski, S., Greenhouse, M., Johnson, P., Spillar, E.,
Woodward, C. E., Harper, D. A., & Rauscher, B. J. 1989, ApJ, 343, 158
Varela, A. M., Munoz-Tunon, C., & Simmoneau, E. 1996, A&A, 306, 381
Vergani, D., Pizzella, A., Corsini, E. M., van Driel, W., Buson, L. M., Dettmar, R.-J., &
Bertola, F. 2007, A&A, 463, 883
Vorontsov-Velyaminov, B. A. 1987, Extragalactic Astronomy, New york, Harwood Academic
Publishers
Werner, M. W. et al. 2004, ApJS, 154, 1
Whitmore, B. C., Lucas, R. A., McElroy, D. B., Steiman-Cameron, T. Y., Sackett, P. D., &
Olling, R. P. 1990, AJ, 100, 1489
Whyte, L. F., Abraham, R. G., Merrifield, M. R., Eskridge, P. B., Frogel, J. A., Pogge, R.
W. 2002, MNRAS, 336, 1281
Windhorst, R. et al. 2002, ApJS, 143, 113
Zaritsky, D. & Lo, K. Y. 1986, ApJ, 303, 66

– 38 –
Table 1. 3.6µm Morphological Classificationsa
Galaxy Fig 1. S4G RC3 RSA dVA OSU
mid-IR blue blue blue near-IR
type type type type type
1 2 3 4 5 6 7
NGC 24 1 S(rs)d: sp SA(s)c Sc(s) ..... .....
NGC 45 2 SA(s)dm SA(s)dm Scd(s) SA(s)d .....
NGC 55 3 SB(s)m sp SB(s)m: sp Sc ..... .....
NGC 59 4 dE5,N SA(rs)0−: ..... ..... .....
NGC 247 5 SAB(s)d SAB(s)d Sc(s) SAB(s)d .....
NGC 274 6 (R)SA(l)0− SAB(r)0− pec S01(0) ..... .....
NGC 275 6 S pec SB(rs)cd pec S pec ..... .....
NGC 300 7 SA(s)dm SA(s)d Sc SA(s)d .....
NGC 337 8 SAB(s)cd: pec SB(s)d Sc(s) pec ..... .....
NGC 428 9 SAB(s)dm SAB(s)m Sc(s) SAB(s)m SBm
NGC 470 10 SAB(rs)ab SA(rs)b Sbc(s) ..... .....
NGC 474 11 (R)SAB0/a (shells) pec SA(s)0o RS0/a ..... .....
NGC 584 12 SAB0− E4 S01(3,5) SA0− .....
NGC 628 13 SA(s)c SA(s)c Sc(s) SA(s)c .....
NGC 660b 14 PRG SB(s)a pec ..... ..... .....
NGC 672 15 (R′)SB(s)d SB(s)cd SBc(s) ..... .....
NGC 691 16 (R)SA(r)ab SA(rs)bc ..... ..... .....

– 39 –
Table 1—Continued
Galaxy Fig 1. S4G RC3 RSA dVA OSU
mid-IR blue blue blue near-IR
type type type type type
1 2 3 4 5 6 7
NGC 784 17 SBm: sp SBdm: sp ..... ..... .....
NGC 814 18 SAB0−: ..... ..... .....
NGC 855 19 SA0− E ..... ..... .....
NGC 941 20 (R’:)SAB(r:)c SAB(rs)c Scd ..... .....
NGC 986 21 (R′)SB(rs,nb)ab SB(rs)ab SBb(rs) ..... .....
NGC 1068 22 (R)SA(s,nr)a (R)SA(rs)b Sb(rs) (R)SA(rs)b .....
NGC 1097 23 (R′)SB(rs,nr)ab pec SB(s)b SBbc(rs) (R′
1)SB(rs)b .....
NGC 1097A 24 dE5 E pec ..... ..... .....
NGC 1291 25 (R)SAB(l,nb)0+ (R)SB(s)0/a SBa (R)SAB(l)0/a .....
NGC 1311 26 SBdm: sp SB(s)m? sp ..... ..... .....
NGC 1313 27 SB(s)dm pec SB(s)d SBc(s) SB(s)dm .....
NGC 1365 28 SB(rs,nr)bc SB(s)b SBb(s) SB(s)bc .....
NGC 1433 29 (R′
1)SB(r,nr,nb)a (R′)SB(r)ab SBb(s) (R′
1)SB(r)ab .....
NGC 1448 30 SA(rs)c sp SAcd: sp Sc ..... .....
NGC 1481 31 SA(l)0−: pec SA0−: ..... ..... .....
NGC 1482 32 Sa: sp SA0+ pec sp ..... ..... .....
NGC 1487 33 Pec Pec S pec(merger) ..... .....
– 40 –
Table 1—Continued
Galaxy Fig 1. S4G RC3 RSA dVA OSU
mid-IR blue blue blue near-IR
type type type type type
1 2 3 4 5 6 7
NGC 1510 34 SA0+: SA0o pec ..... SA(s)0/a pec .....
NGC 1512 35 (RL)SB(r,nr)a SB(r)a SBb(rs) pec (R′)SB(r)ab pec .....
NGC 1559 36 SB(s)cd SB(s)cd SBc(s) SB(s)cd SBcd
NGC 1566 37 (R′
1)SAB(s)b SAB(s)bc Sc(s) (R′
1)SAB(s)bc .....
NGC 1672 38 (R′)SAB(rs,nr)b SB(s)b Sb(rs) ..... .....
NGC 1705 39 dE3,N SA0− pec Amorphous I0 pec/BCD .....
NGC 1744 40 SB(s)d SB(s)d SBcd(s) ..... .....
NGC 1808 41 (R1)SAB(s,nr)a (R)SAB(s)a Sbc pec (R1)SAB(s)b pec SBa
NGC 2500 42 SAB(s)d SB(rs)d Sc(s) ..... .....
NGC 2552 43 (R′)SAB(s)m SA(s)m? Sc ..... .....
NGC 2633 44 SAB(rs)b SB(s)b SBb(s) ..... .....
NGC 2634 45 SA(nl)0− (shells) E1: ..... ..... .....
NGC 2634A 46 SB(s)m: sp SB(s)bc? sp ..... ..... .....
NGC 2683 47 (RL)SBx(rs)0/a sp SA(rs)b Sb ..... .....
NGC 2742 48 SA(s)c SA(s)c: Sc(rs) ..... .....
NGC 2798 49 SAB(s)a pec SB(s)a pec SBa(s) ..... .....
NGC 2799 49 SB(s)dm? pec sp SB(s)m? ..... ..... .....
– 41 –
Table 1—Continued
Galaxy Fig 1. S4G RC3 RSA dVA OSU
mid-IR blue blue blue near-IR
type type type type type
1 2 3 4 5 6 7
NGC 2805 50 (R)SAB(rs)c pec SAB(rs)d ..... ..... .....
NGC 2814 51 S pec sp Sb: ..... ..... .....
NGC 2820 52 Sc sp SB(s)c pec sp ..... ..... .....
NGC 2841 53 SAB(r)a SA(r)b: Sb SA(r)b .....
NGC 2854 54 SAB(r)a SB(s)b ..... ..... .....
NGC 2856 55 SAB(r)a: S? ..... ..... .....
NGC 2893 56 (RL)SAB(l)0+ (R)SB0/a ..... ..... .....
NGC 2903 57 (R′)SB(rs,nr)b SAB(rs)bc Sc(s) ..... .....
NGC 2964 58 SAB(rs)b SAB(r)bc: Sc(s) SAB(rs)b SABb pec
NGC 2968 59 SB(rs)0+ I0 Amorphous ..... .....
NGC 2974 60 SA(r)0/a E4 E4 ..... .....
NGC 2976 61 SAB(s:)d SAc pec Sd SA d pec .....
NGC 3018 62 SB(s)d: SB(s)b pec ..... ..... .....
NGC 3023 62 SB(s)dm SAB(s)c pec ..... ..... .....
NGC 3049 63 SB(s)ab: SB(rs)ab ..... ..... .....
NGC 3073 64 S0− SAB0− ..... ..... .....
NGC 3115 65 S0−/E7 sp S0− sp S01(7) S0− sp .....
– 42 –
Table 1—Continued
Galaxy Fig 1. S4G RC3 RSA dVA OSU
mid-IR blue blue blue near-IR
type type type type type
1 2 3 4 5 6 7
NGC 3147 66 SAB(rs)b SA(rs)bc Sb(s) ..... .....
NGC 3184 67 SA(rs)bc SAB(rs)cd Sc(r) SAB(rs)c .....
NGC 3198 68 SAB(rs)bc SB(rs)c Sc(rs) ..... .....
NGC 3299 69 SABd: SAB(s)dm ..... ..... .....
NGC 3344 70 SAB(r)bc (R)SAB(r)bc SBbc(rs) ..... .....
NGC 3351 71 (R′)SB(r,nr)a SB(r)b SBb(r) SB(r)b .....
NGC 3377j 72 E(d)5 E5 E6 E5-6 .....
NGC 3377A 73 Im SAB(s)m ..... ..... .....
NGC 3437 74 SA(rs)c SAB(rs)c: Sc(s) ..... .....
NGC 3489 75 (R)SB(r:)0o SAB(rs)0+ Sc ..... .....
NGC 3495 76 (R′)SB(rs)c: Sd: Sc(s) ..... .....
NGC 3504 77 (R′
1)SAB(rs,nl)a (R)SAB(s)ab Sb/SBb(s) (R′
1)SAB(rs)ab (R)SB(r)a
NGC 3512 78 SA(s)bc SAB(rs)c Sc(rs) ..... .....
NGC 3608 79 E2 E2 E1 E2 .....
NGC 3627 80 SB(s)b pec SAB(s)b Sb(s) SAB(s)b .....
NGC 3738 81 dE (Im) Im Sd ..... .....
NGC 3769c 82 (R′)SB(s)cd SB(r)b: SBc(s) ..... .....

– 43 –
Table 1—Continued
Galaxy Fig 1. S4G RC3 RSA dVA OSU
mid-IR blue blue blue near-IR
type type type type type
1 2 3 4 5 6 7
NGC 3794d 83 SAB(s)dm SAB(s)d ..... ..... .....
NGC 3870 84 SB(rs)0o? S0? ..... ..... .....
NGC 3906 85 SB(l)dm SB(s)d ..... SB(rs)dm .....
NGC 3938 86 SA(s)c SA(s)c Sc(s) SA(s)c Sb
NGC 3953 87 SB(r)bc SB(r)bc SBbc(r) SB(r)bc .....
NGC 4020 88 SAB(s)d SBd? sp ..... ..... .....
NGC 4068 89 Im IAm ..... ..... .....
NGC 4117 90 S0− sp S0o: ..... ..... .....
NGC 4118 91 dE3-4: S0+ ..... ..... .....
NGC 4157 92 SAB(s)c: SAB(s)b? sp Sbc Sc sp .....
NGC 4163 93 dE (Im) IAm ..... ..... .....
NGC 4178 94 (R′
2)SB(s)d SB(rs)dm SBc(s) SB(s)d SBc? edge-on
NGC 4203 95 SAB0− SAB0−: S02(1) ..... .....
NGC 4244 96 Sd sp SA(s)cd: sp Scd ..... .....
NGC 4245 97 (RL)SB(r,nr)0+ SB(r)0/a: SBa(s) SB(r)0/a .....
NGC 4254 98 SA(s)c pec SA(s)c Sc(s) SA(s)c SABc
NGC 4266 99 S0o sp SB(s)a? sp ..... ..... .....

– 44 –
Table 1—Continued
Galaxy Fig 1. S4G RC3 RSA dVA OSU
mid-IR blue blue blue near-IR
type type type type type
1 2 3 4 5 6 7
NGC 4268 100 SA:(rs)0+ sp SB0/a: sp ..... ..... .....
NGC 4270 101 S0+ sp? S0 S01(6) ..... .....
NGC 4273 102 SAB(s)c pec SB(s)c SBc(s) ..... .....
NGC 4277 103 SAB(rs)0+ SAB(rs)0/a: ..... ..... .....
NGC 4281 104 E(d)5 S0+: sp S03(6) ..... .....
NGC 4294 105 SB(s)d SB(s)cd SBc(s) ..... .....
NGC 4299 106 SA(s)dm SAB(s)dm: Sd(s) ..... .....
NGC 4314 107 (R′
1)SB(rl,nr)a SB(rs)a SBa(rs) pec (R′
1)SB(r′l)a (R)SBa
NGC 4321 108 SAB(rs,nr)bc SAB(s)bc Sc(s) SAB(s)bc .....
NGC 4323 109 dE3,N ..... ..... ..... .....
NGC 4328 110 dSA(l)0− SA0−: ..... ..... .....
NGC 4369e 111 (R)SB(rs)0/a: pec (R)SA(rs)a Sc(s) ..... .....
NGC 4383k 112 E(twist?)/SAB0−: Sa? pec S0: ..... .....
NGC 4396 113 Scd: pec sp SAd: sp ..... ..... .....
NGC 4437f 114 Sc sp SA(s)cd: sp Sc ..... .....
NGC 4527 115 (R′
2)SAB(rs,nr)bc SAB(s)bc Sb(s) SAB(s)bc SABab
NGC 4536 116 SAB(rs)bc SAB(rs)bc Sc(s) SAB(rs)bc .....
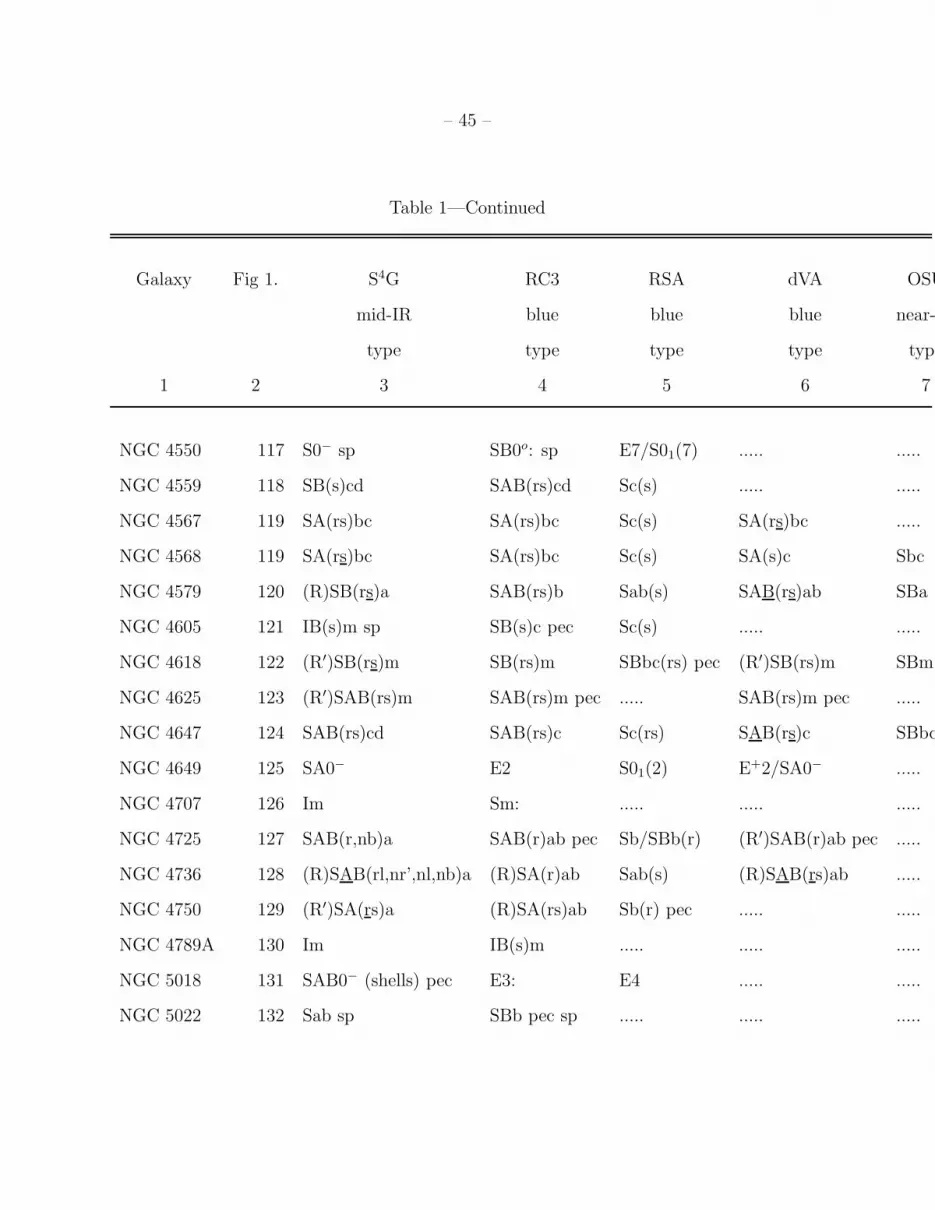
– 45 –
Table 1—Continued
Galaxy Fig 1. S4G RC3 RSA dVA OSU
mid-IR blue blue blue near-IR
type type type type type
1 2 3 4 5 6 7
NGC 4550 117 S0− sp SB0o: sp E7/S01(7) ..... .....
NGC 4559 118 SB(s)cd SAB(rs)cd Sc(s) ..... .....
NGC 4567 119 SA(rs)bc SA(rs)bc Sc(s) SA(rs)bc .....
NGC 4568 119 SA(rs)bc SA(rs)bc Sc(s) SA(s)c Sbc
NGC 4579 120 (R)SB(rs)a SAB(rs)b Sab(s) SAB(rs)ab SBa
NGC 4605 121 IB(s)m sp SB(s)c pec Sc(s) ..... .....
NGC 4618 122 (R′)SB(rs)m SB(rs)m SBbc(rs) pec (R′)SB(rs)m SBm
NGC 4625 123 (R′)SAB(rs)m SAB(rs)m pec ..... SAB(rs)m pec .....
NGC 4647 124 SAB(rs)cd SAB(rs)c Sc(rs) SAB(rs)c SBbc
NGC 4649 125 SA0− E2 S01(2) E+2/SA0− .....
NGC 4707 126 Im Sm: ..... ..... .....
NGC 4725 127 SAB(r,nb)a SAB(r)ab pec Sb/SBb(r) (R′)SAB(r)ab pec .....
NGC 4736 128 (R)SAB(rl,nr’,nl,nb)a (R)SA(r)ab Sab(s) (R)SAB(rs)ab .....
NGC 4750 129 (R′)SA(rs)a (R)SA(rs)ab Sb(r) pec ..... .....
NGC 4789A 130 Im IB(s)m ..... ..... .....
NGC 5018 131 SAB0− (shells) pec E3: E4 ..... .....
NGC 5022 132 Sab sp SBb pec sp ..... ..... .....
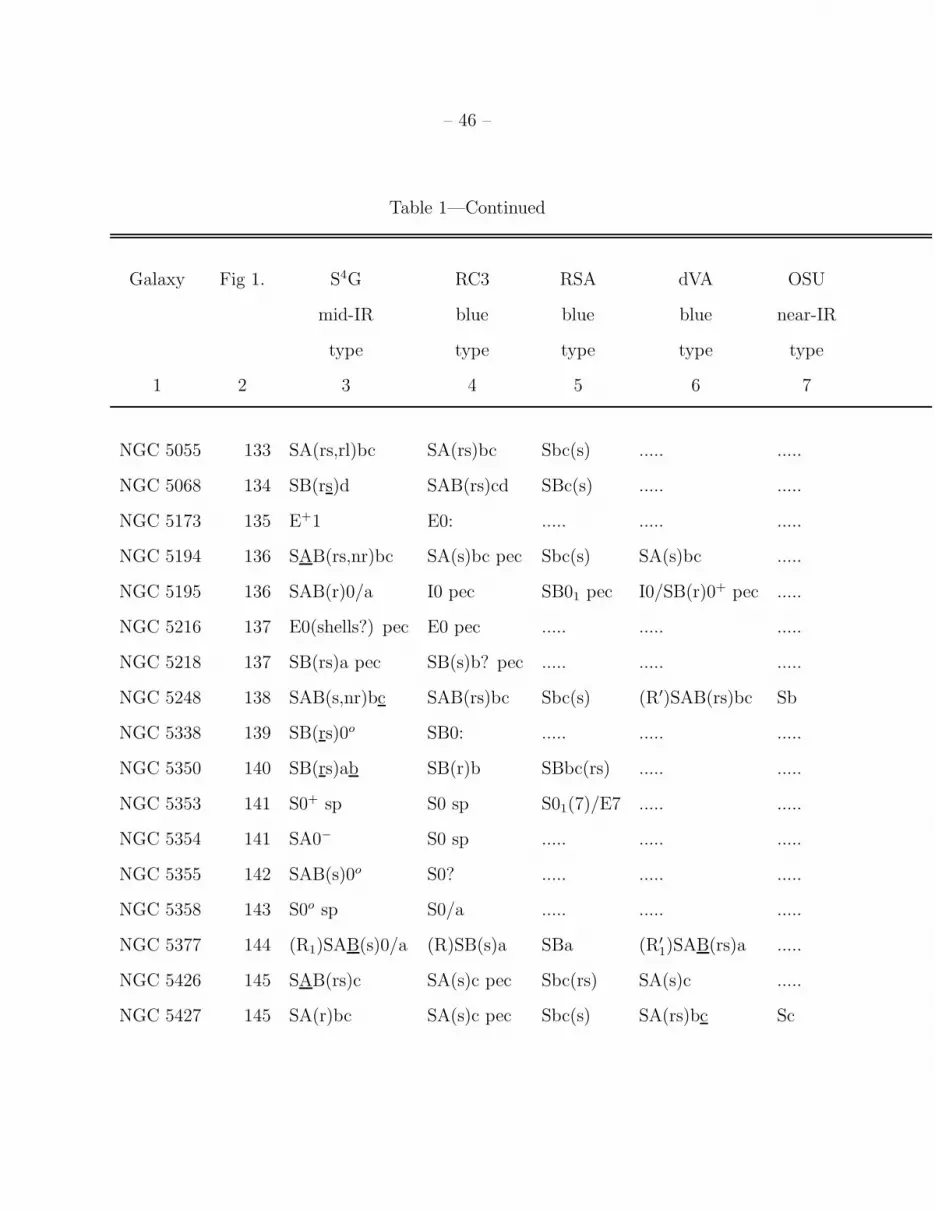
– 46 –
Table 1—Continued
Galaxy Fig 1. S4G RC3 RSA dVA OSU
mid-IR blue blue blue near-IR
type type type type type
1 2 3 4 5 6 7
NGC 5055 133 SA(rs,rl)bc SA(rs)bc Sbc(s) ..... .....
NGC 5068 134 SB(rs)d SAB(rs)cd SBc(s) ..... .....
NGC 5173 135 E+1 E0: ..... ..... .....
NGC 5194 136 SAB(rs,nr)bc SA(s)bc pec Sbc(s) SA(s)bc .....
NGC 5195 136 SAB(r)0/a I0 pec SB01 pec I0/SB(r)0+ pec .....
NGC 5216 137 E0(shells?) pec E0 pec ..... ..... .....
NGC 5218 137 SB(rs)a pec SB(s)b? pec ..... ..... .....
NGC 5248 138 SAB(s,nr)bc SAB(rs)bc Sbc(s) (R′)SAB(rs)bc Sb
NGC 5338 139 SB(rs)0o SB0: ..... ..... .....
NGC 5350 140 SB(rs)ab SB(r)b SBbc(rs) ..... .....
NGC 5353 141 S0+ sp S0 sp S01(7)/E7 ..... .....
NGC 5354 141 SA0− S0 sp ..... ..... .....
NGC 5355 142 SAB(s)0o S0? ..... ..... .....
NGC 5358 143 S0o sp S0/a ..... ..... .....
NGC 5377 144 (R1)SAB(s)0/a (R)SB(s)a SBa (R′
1)SAB(rs)a .....
NGC 5426 145 SAB(rs)c SA(s)c pec Sbc(rs) SA(s)c .....
NGC 5427 145 SA(r)bc SA(s)c pec Sbc(s) SA(rs)bc Sc
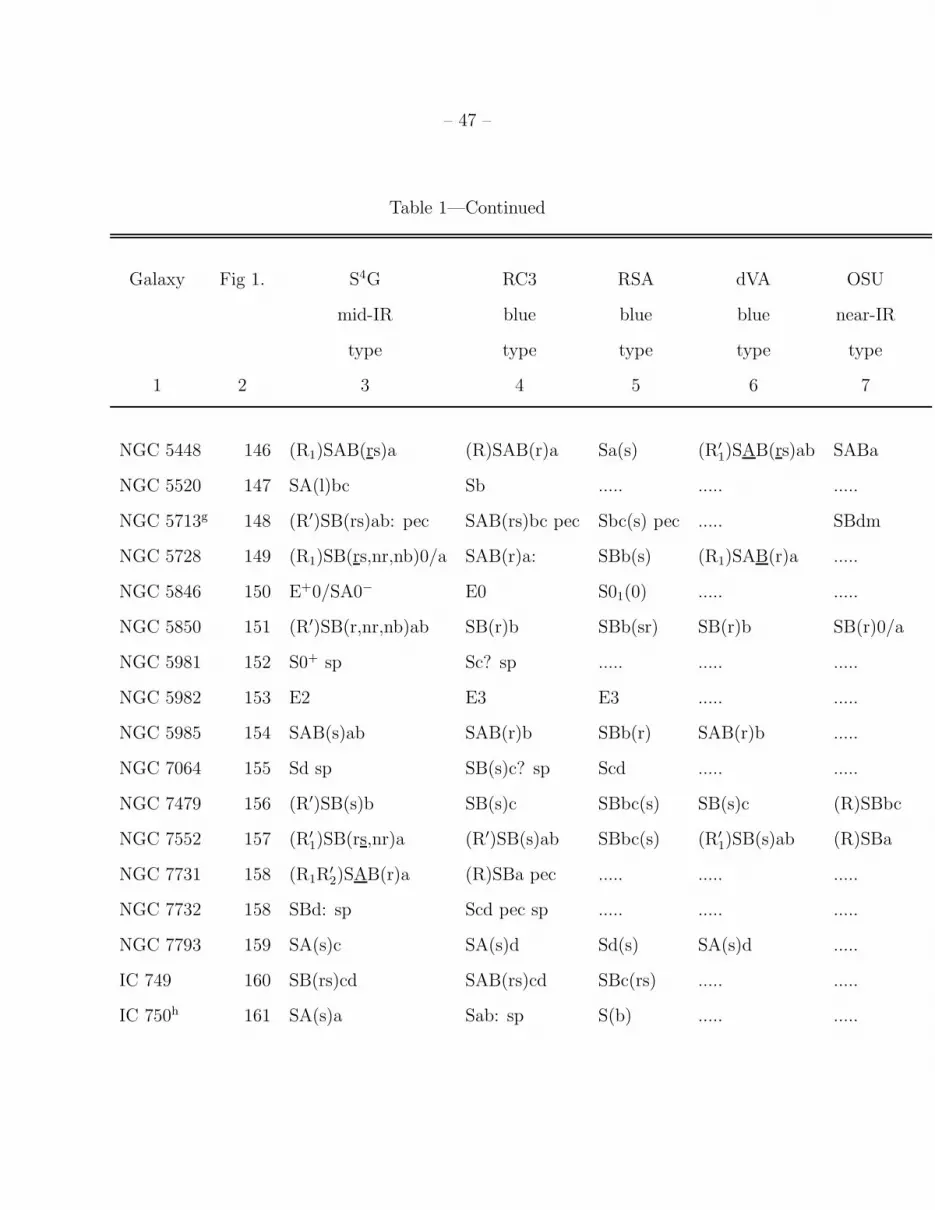
– 47 –
Table 1—Continued
Galaxy Fig 1. S4G RC3 RSA dVA OSU
mid-IR blue blue blue near-IR
type type type type type
1 2 3 4 5 6 7
NGC 5448 146 (R1)SAB(rs)a (R)SAB(r)a Sa(s) (R′
1)SAB(rs)ab SABa
NGC 5520 147 SA(l)bc Sb ..... ..... .....
NGC 5713g 148 (R′)SB(rs)ab: pec SAB(rs)bc pec Sbc(s) pec ..... SBdm
NGC 5728 149 (R1)SB(rs,nr,nb)0/a SAB(r)a: SBb(s) (R1)SAB(r)a .....
NGC 5846 150 E+0/SA0− E0 S01(0) ..... .....
NGC 5850 151 (R′)SB(r,nr,nb)ab SB(r)b SBb(sr) SB(r)b SB(r)0/a
NGC 5981 152 S0+ sp Sc? sp ..... ..... .....
NGC 5982 153 E2 E3 E3 ..... .....
NGC 5985 154 SAB(s)ab SAB(r)b SBb(r) SAB(r)b .....
NGC 7064 155 Sd sp SB(s)c? sp Scd ..... .....
NGC 7479 156 (R′)SB(s)b SB(s)c SBbc(s) SB(s)c (R)SBbc
NGC 7552 157 (R′
1)SB(rs,nr)a (R′)SB(s)ab SBbc(s) (R′
1)SB(s)ab (R)SBa
NGC 7731 158 (R1R′
2)SAB(r)a (R)SBa pec ..... ..... .....
NGC 7732 158 SBd: sp Scd pec sp ..... ..... .....
NGC 7793 159 SA(s)c SA(s)d Sd(s) SA(s)d .....
IC 749 160 SB(rs)cd SAB(rs)cd SBc(rs) ..... .....
IC 750h 161 SA(s)a Sab: sp S(b) ..... .....
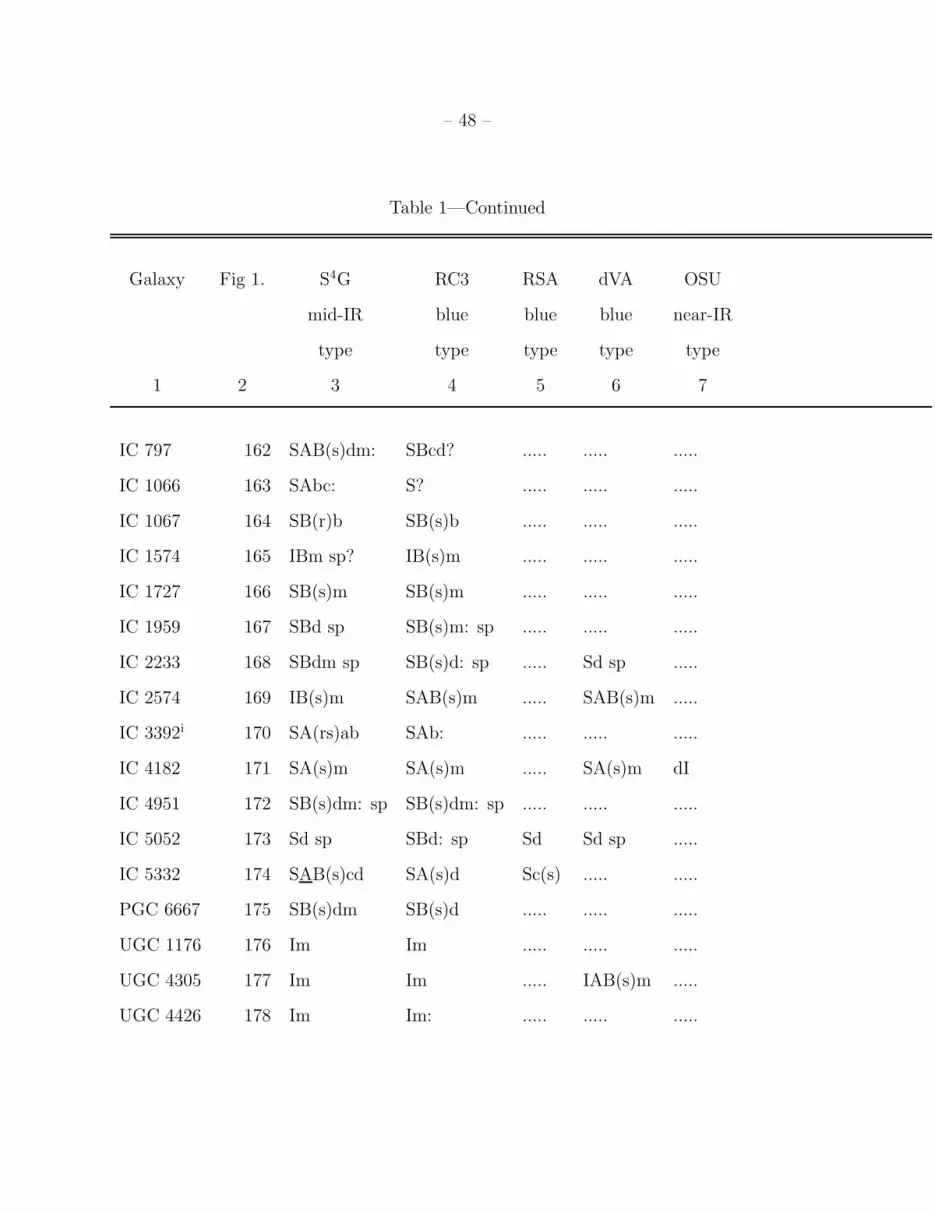
– 48 –
Table 1—Continued
Galaxy Fig 1. S4G RC3 RSA dVA OSU
mid-IR blue blue blue near-IR
type type type type type
1 2 3 4 5 6 7
IC 797 162 SAB(s)dm: SBcd? ..... ..... .....
IC 1066 163 SAbc: S? ..... ..... .....
IC 1067 164 SB(r)b SB(s)b ..... ..... .....
IC 1574 165 IBm sp? IB(s)m ..... ..... .....
IC 1727 166 SB(s)m SB(s)m ..... ..... .....
IC 1959 167 SBd sp SB(s)m: sp ..... ..... .....
IC 2233 168 SBdm sp SB(s)d: sp ..... Sd sp .....
IC 2574 169 IB(s)m SAB(s)m ..... SAB(s)m .....
IC 3392i 170 SA(rs)ab SAb: ..... ..... .....
IC 4182 171 SA(s)m SA(s)m ..... SA(s)m dI
IC 4951 172 SB(s)dm: sp SB(s)dm: sp ..... ..... .....
IC 5052 173 Sd sp SBd: sp Sd Sd sp .....
IC 5332 174 SAB(s)cd SA(s)d Sc(s) ..... .....
PGC 6667 175 SB(s)dm SB(s)d ..... ..... .....
UGC 1176 176 Im Im ..... ..... .....
UGC 4305 177 Im Im ..... IAB(s)m .....
UGC 4426 178 Im Im: ..... ..... .....

– 49 –
Table 1—Continued
Galaxy Fig 1. S4G RC3 RSA dVA OSU
mid-IR blue blue blue near-IR
type type type type type
1 2 3 4 5 6 7
UGC 5139 179 Im IAB(s)m ..... ..... .....
UGC 5459 180 SBdm sp SB(s)c? sp ..... ..... .....
UGC 6817 181 Im Im ..... ..... .....
UGC 6956 182 SB(s)dm: SB(s)m ..... ..... .....
UGC 7504 183 S0− ..... ..... .....
ESO 115- 21 184 SB(s)m sp SBdm: sp ..... ..... .....
ESO 119- 16 185 (R′)SAB(s)dm: IB(s)m ..... ..... .....
ESO 149- 3 186 IBm: sp IB(s)m: sp ..... ..... .....
ESO 154- 23 187 SB(s)d sp SB(s)m ..... ..... .....
ESO 245- 5 188 IAB(s)m IB(s)m ..... ..... .....
ESO 245- 7 189 Im IAm ..... ..... .....
ESO 362- 9 190 SAB(s)dm SAB(s)m ..... ..... .....
ESO 418- 8 191 (R′)SB(s)dm: SAB(rs)dm ..... ..... .....
ESO 471- 6 192 SBd: sp SB(s)m: sp ..... ..... .....
ESO 483- 13 193 dE4,N/SA0− SA0−: ..... ..... .....
ESO 486- 21 194 dE (Im) S? ..... ..... .....
ESO 503- 22 195 SB(s)m: IB(s)m: pec ..... ..... .....

– 50 –
Table 1—Continued
Galaxy Fig 1. S4G RC3 RSA dVA OSU
mid-IR blue blue blue near-IR
type type type type type
1 2 3 4 5 6 7
ESO 544- 30 196 SAB(s)m SB(s)dm pec ..... ..... .....
MCG8-21-76 82 IBm: ..... ..... ..... .....
CGCG265-55 197 dE (Im) ..... ..... ..... .....
aCol. 1: galaxy name; col. 2: Figure 1 plate number; col. 3: mid-IR classification using the precepts
and notation of the dVA; col. 4: decoded RC3 blue light classification; index; col 5: RSA blue light
classification; col. 6: dVA classification (mostly blue, some visual); col. 7: Eskridge et al. (2002)
OSUBGS H-band classificationbPRG=polar ring galaxy (see Whitmore et al. 1990)
cdouble-stage: SB(s)cd/S0−
dNGC 3804 in RC3
edouble-stage: SB(s)m/S0/a
fNGC 4517 in RC3 and RSA
gdouble-stage: SB(rs)m/S0/a
hdouble-stage: SA(rs)ab/S0/a
idouble-stage: SA(s)b/S0o
jdisky inner regions only; boxy at larger radii
kapparent bar could also be inner disk
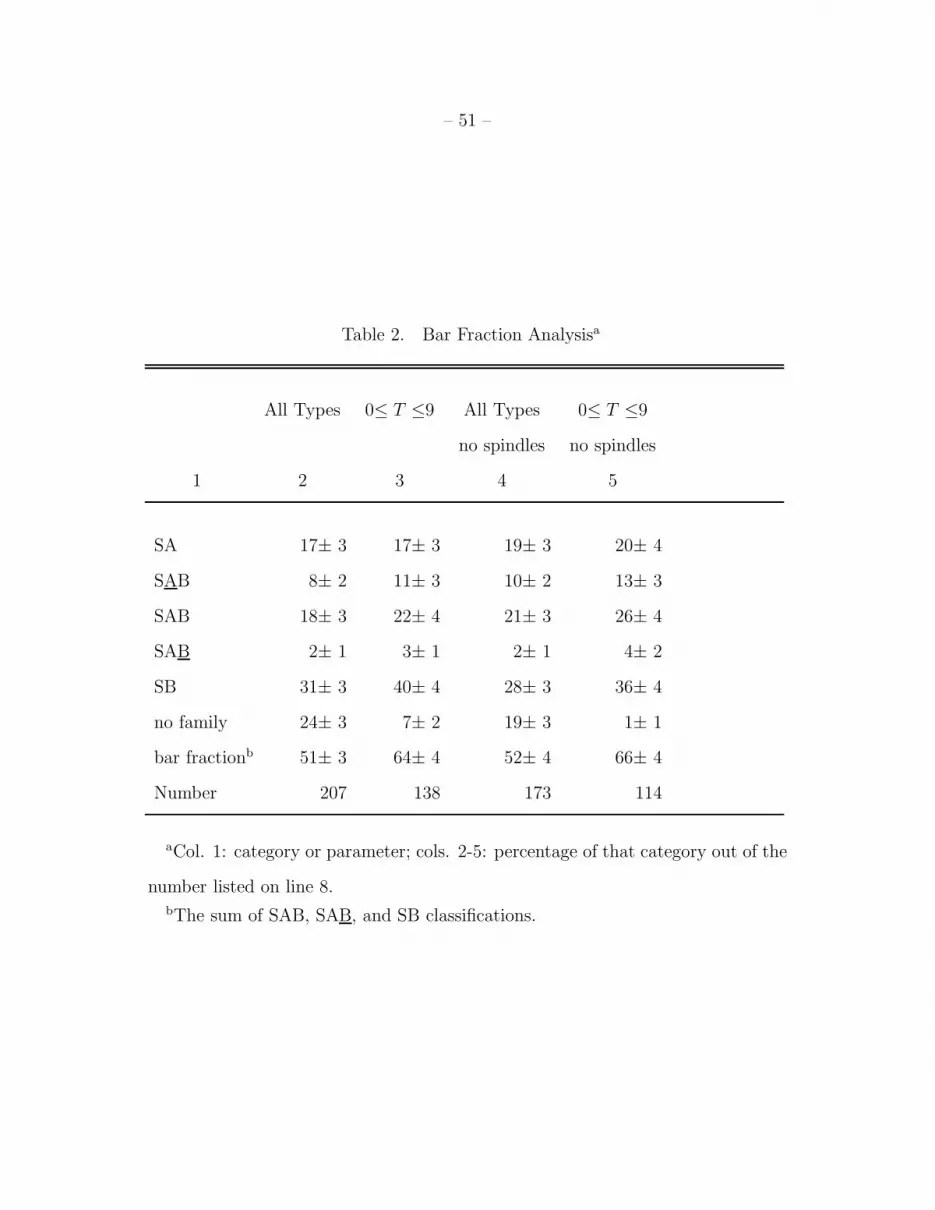
– 51 –
Table 2. Bar Fraction Analysisa
All Types 0≤ T ≤9 All Types 0≤ T ≤9
no spindles no spindles
1 2 3 4 5
SA 17± 3 17± 3 19± 3 20± 4
SAB 8± 2 11± 3 10± 2 13± 3
SAB 18± 3 22± 4 21± 3 26± 4
SAB 2± 1 3± 1 2± 1 4± 2
SB 31± 3 40± 4 28± 3 36± 4
no family 24± 3 7± 2 19± 3 1± 1
bar fractionb 51± 3 64± 4 52± 4 66± 4
Number 207 138 173 114
aCol. 1: category or parameter; cols. 2-5: percentage of that category out of the
number listed on line 8.bThe sum of SAB, SAB, and SB classifications.

– 52 –
Fig. 1.1.— NGC 24 - S4G mid-IR classification: S(rs)d: sp ; Filter: IRAC 3.6µm;
North: up, East: left; Field dimensions: 7.9× 5.8 arcmin; Surface brightness range displayed:
16.5−28.0 mag arcsec−2
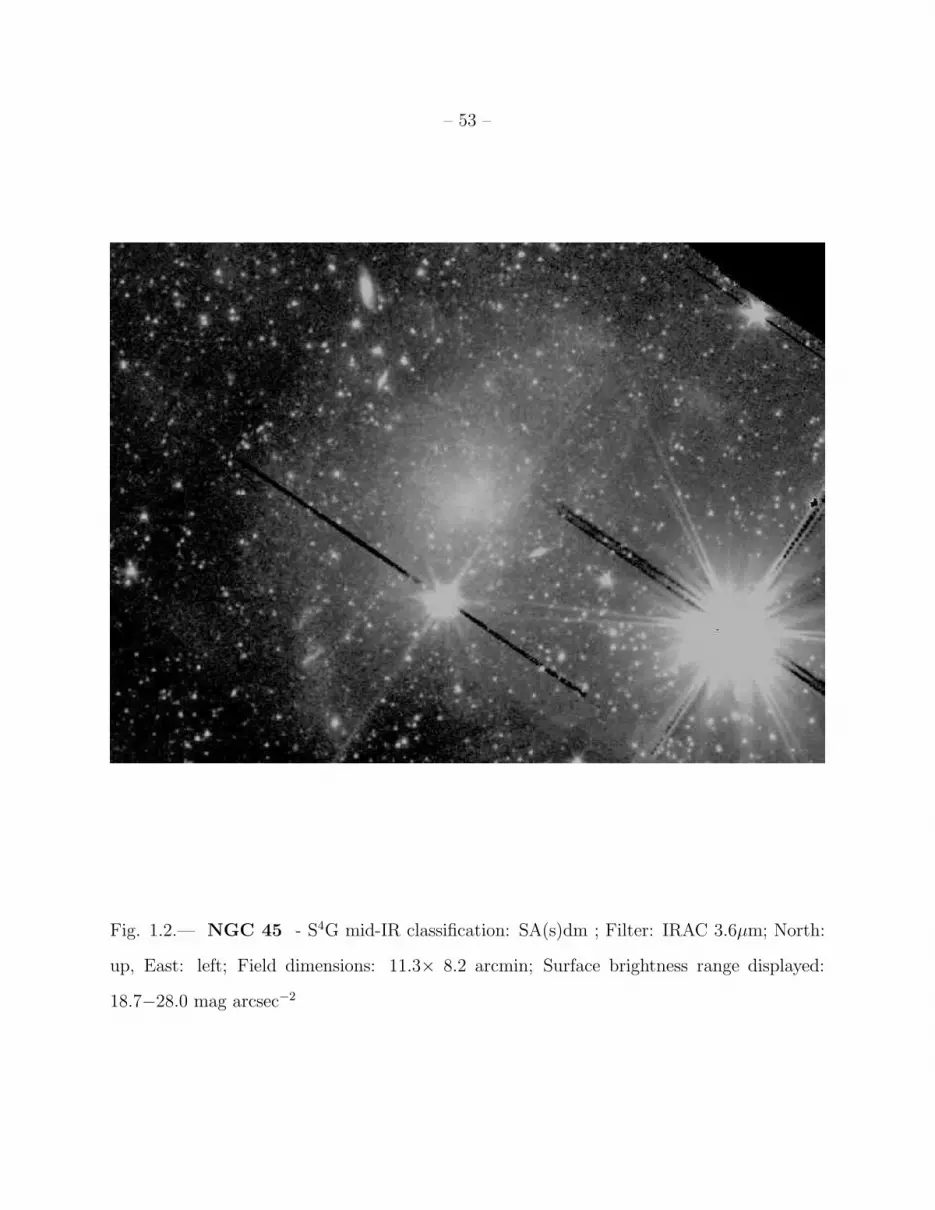
– 53 –
Fig. 1.2.— NGC 45 - S4G mid-IR classification: SA(s)dm ; Filter: IRAC 3.6µm; North:
up, East: left; Field dimensions: 11.3× 8.2 arcmin; Surface brightness range displayed:
18.7−28.0 mag arcsec−2
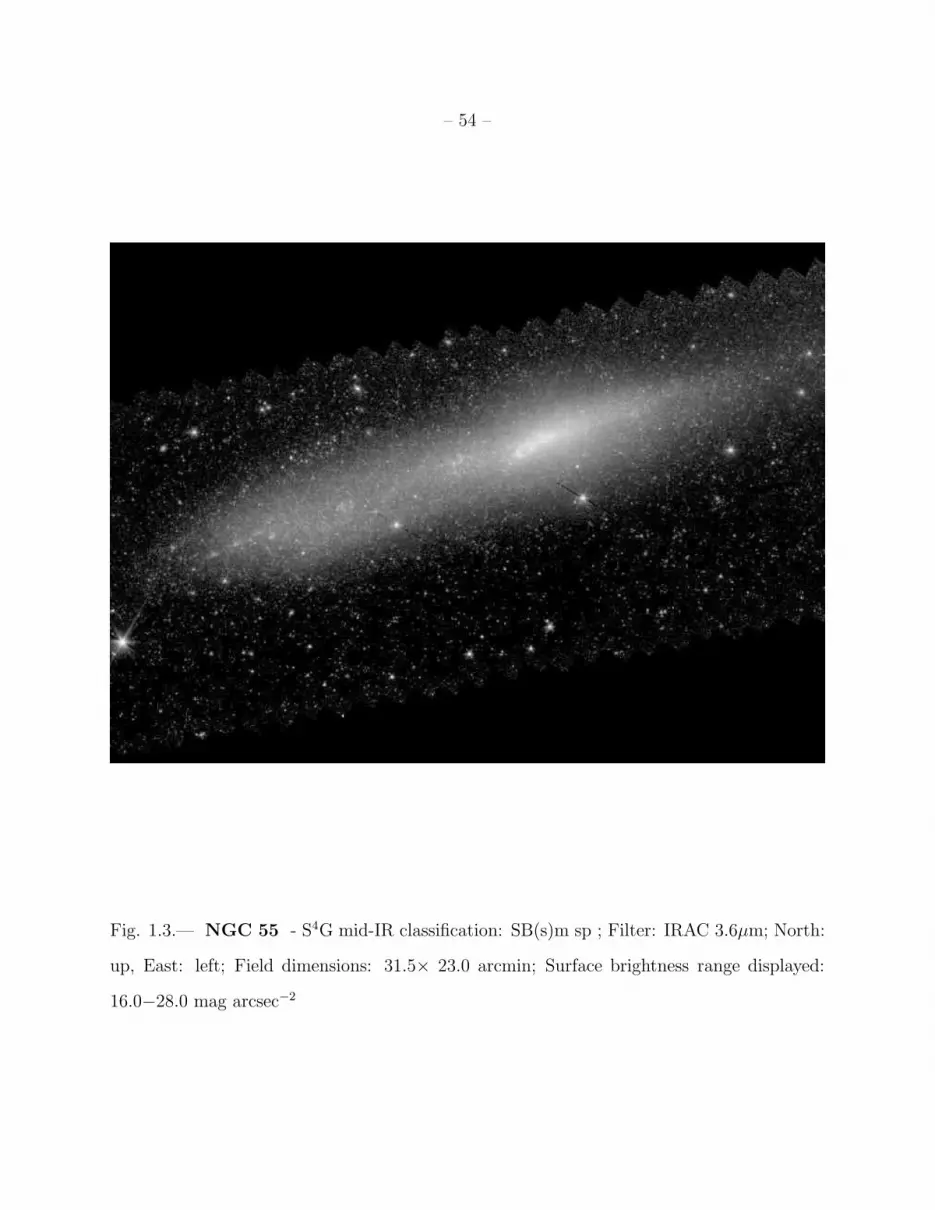
– 54 –
Fig. 1.3.— NGC 55 - S4G mid-IR classification: SB(s)m sp ; Filter: IRAC 3.6µm; North:
up, East: left; Field dimensions: 31.5× 23.0 arcmin; Surface brightness range displayed:
16.0−28.0 mag arcsec−2

– 55 –
Fig. 1.4.— NGC 59 - S4G mid-IR classification: dE5,N ; Filter: IRAC 3.6µm; North: up,
East: left; Field dimensions: 4.2× 3.1 arcmin; Surface brightness range displayed: 16.0−28.0
mag arcsec−2
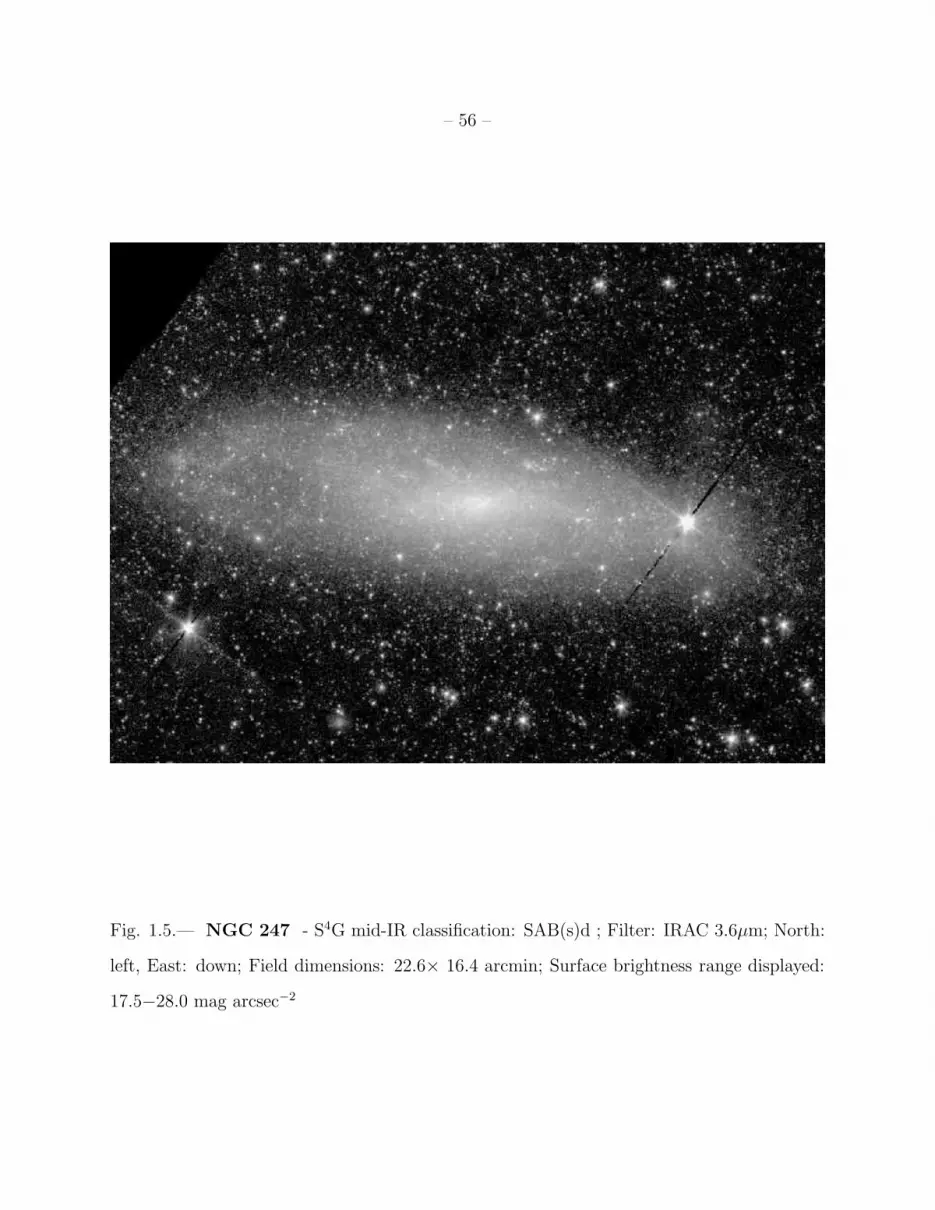
– 56 –
Fig. 1.5.— NGC 247 - S4G mid-IR classification: SAB(s)d ; Filter: IRAC 3.6µm; North:
left, East: down; Field dimensions: 22.6× 16.4 arcmin; Surface brightness range displayed:
17.5−28.0 mag arcsec−2

– 57 –
Fig. 1.6.— NGC 274 (upper right) and NGC 275 (lower left) - S4G mid-IR classifica-
tions: (R)SA(l)0−, S pec, respectively; Filter: IRAC 3.6µm; North: up, East: left; Field
dimensions: 5.3× 3.8 arcmin; Surface brightness range displayed: 13.5−28.0 mag arcsec−2
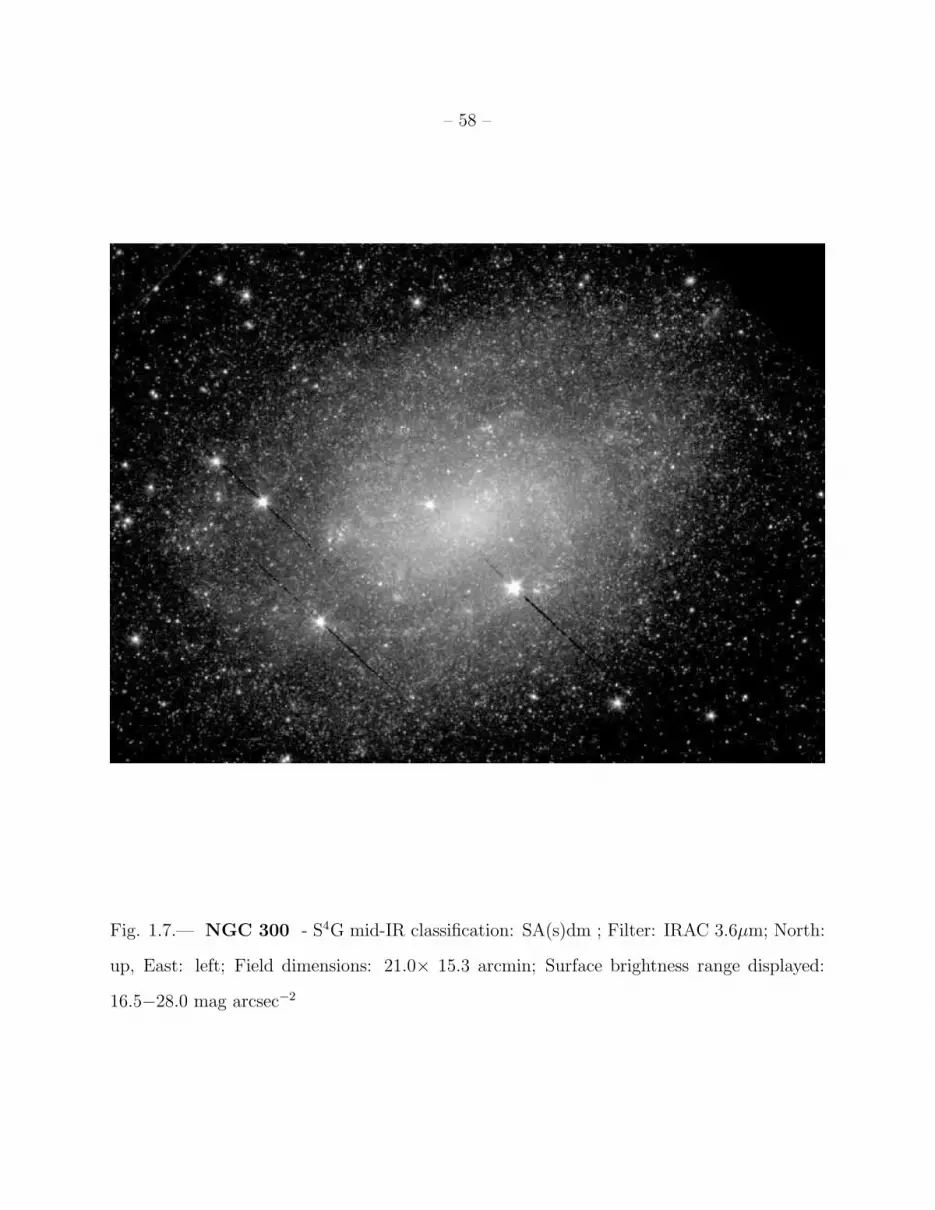
– 58 –
Fig. 1.7.— NGC 300 - S4G mid-IR classification: SA(s)dm ; Filter: IRAC 3.6µm; North:
up, East: left; Field dimensions: 21.0× 15.3 arcmin; Surface brightness range displayed:
16.5−28.0 mag arcsec−2

– 59 –
Fig. 1.8.— NGC 337 - S4G mid-IR classification: SAB(s)cd: pec ; Filter: IRAC 3.6µm;
North: up, East: left; Field dimensions: 4.0× 2.9 arcmin; Surface brightness range displayed:
15.5−28.0 mag arcsec−2
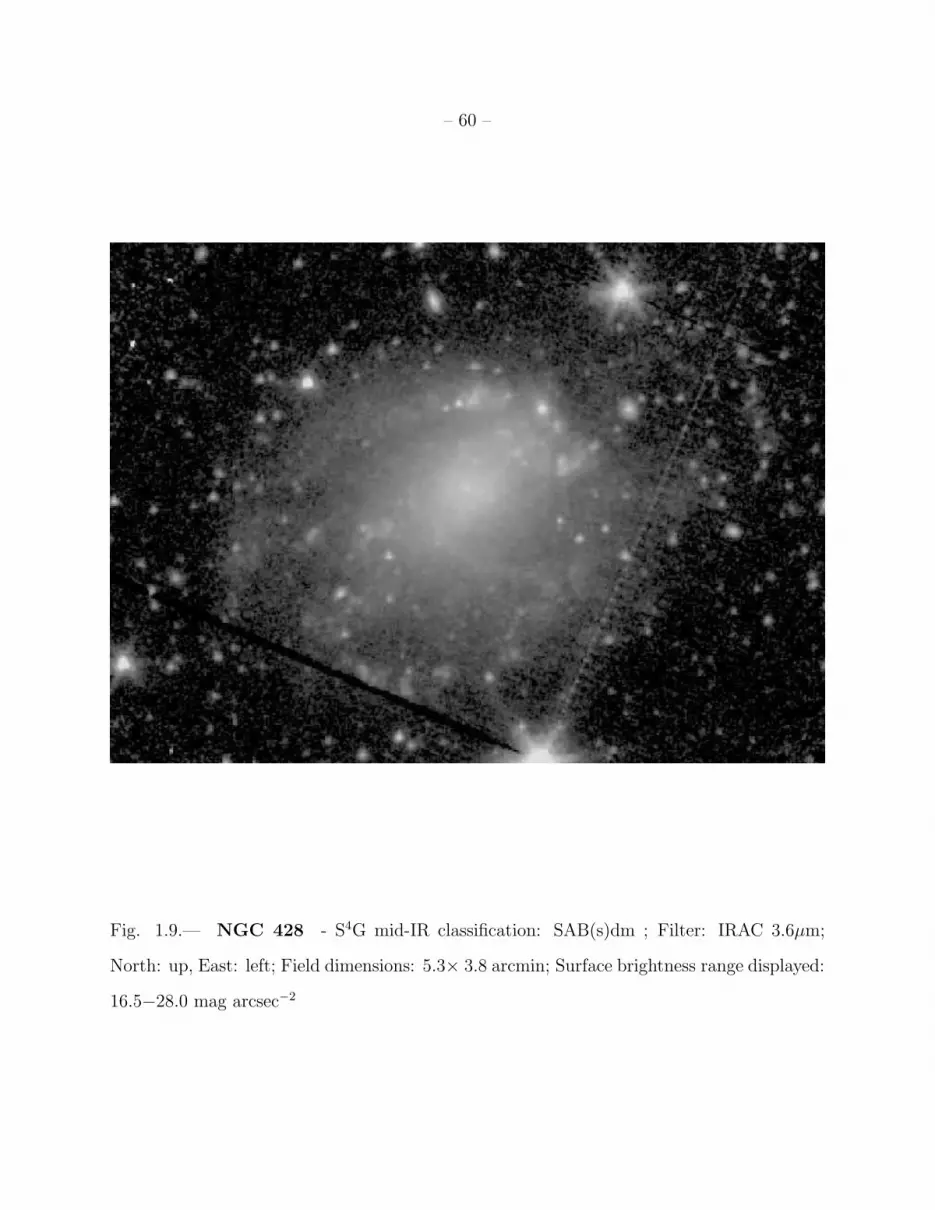
– 60 –
Fig. 1.9.— NGC 428 - S4G mid-IR classification: SAB(s)dm ; Filter: IRAC 3.6µm;
North: up, East: left; Field dimensions: 5.3× 3.8 arcmin; Surface brightness range displayed:
16.5−28.0 mag arcsec−2

– 61 –
Fig. 1.10.— NGC 470 - S4G mid-IR classification: SAB(rs)ab ; Filter: IRAC 3.6µm;
North: left, East: down; Field dimensions: 3.5× 2.6 arcmin; Surface brightness range dis-
played: 13.0−28.0 mag arcsec−2

– 62 –
Fig. 1.11.— NGC 474 - S4Gmid-IR classification: (R)SAB0/a (shells/ripples) pec ; Filter:
IRAC 3.6µm; North: up, East: left; Field dimensions: 7.0× 5.1 arcmin; Surface brightness
range displayed: 13.5−28.0 mag arcsec−2

– 63 –
Fig. 1.12.— NGC 584 - S4G mid-IR classification: SAB0− ; Filter: IRAC 3.6µm;
North: up, East: left; Field dimensions: 6.3× 4.6 arcmin; Surface brightness range dis-
played: 12.0−28.0 mag arcsec−2

– 64 –
Fig. 1.13.— NGC 628 - S4G mid-IR classification: SA(s)c ; Filter: IRAC 3.6µm; North:
up, East: left; Field dimensions: 14.4× 10.5 arcmin; Surface brightness range displayed:
15.0−28.0 mag arcsec−2
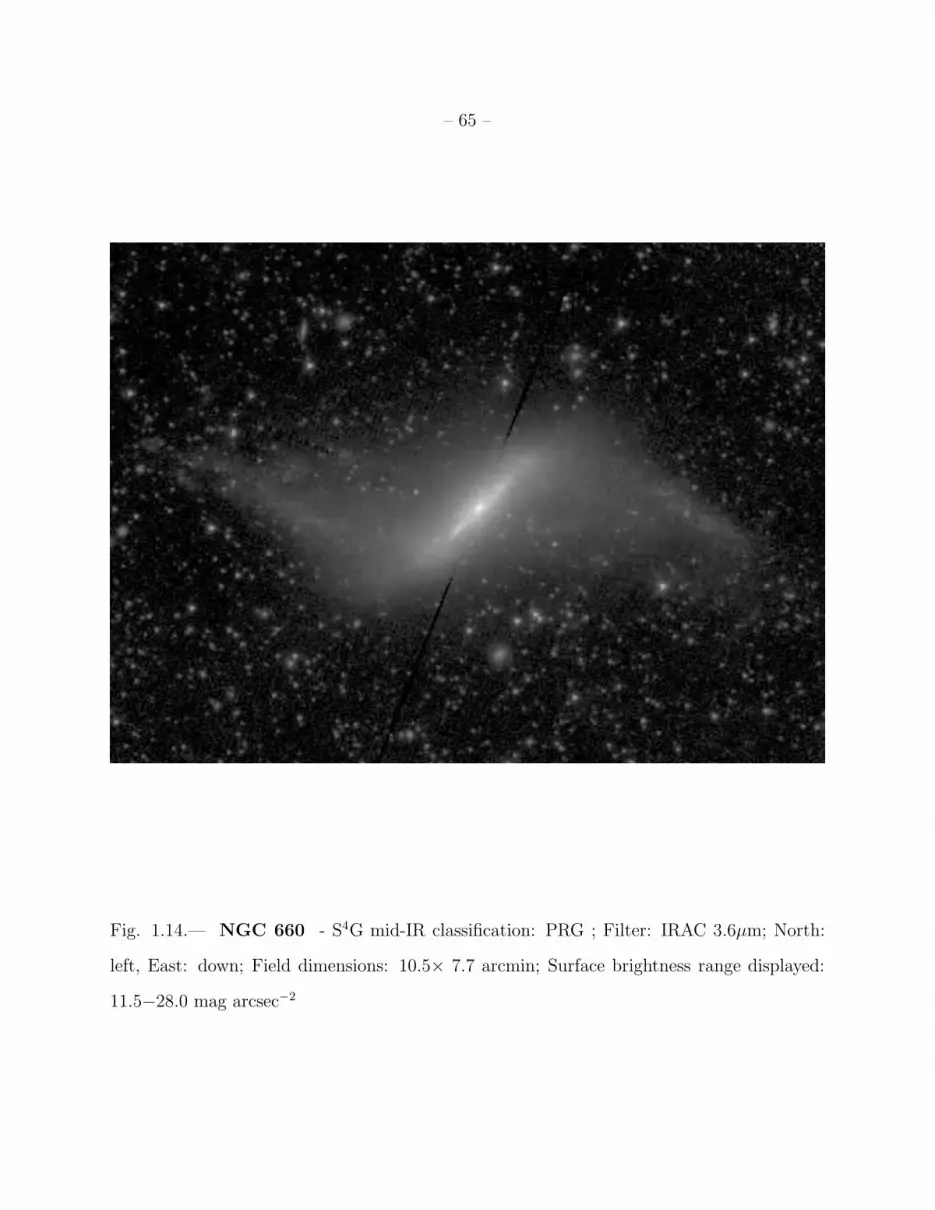
– 65 –
Fig. 1.14.— NGC 660 - S4G mid-IR classification: PRG ; Filter: IRAC 3.6µm; North:
left, East: down; Field dimensions: 10.5× 7.7 arcmin; Surface brightness range displayed:
11.5−28.0 mag arcsec−2
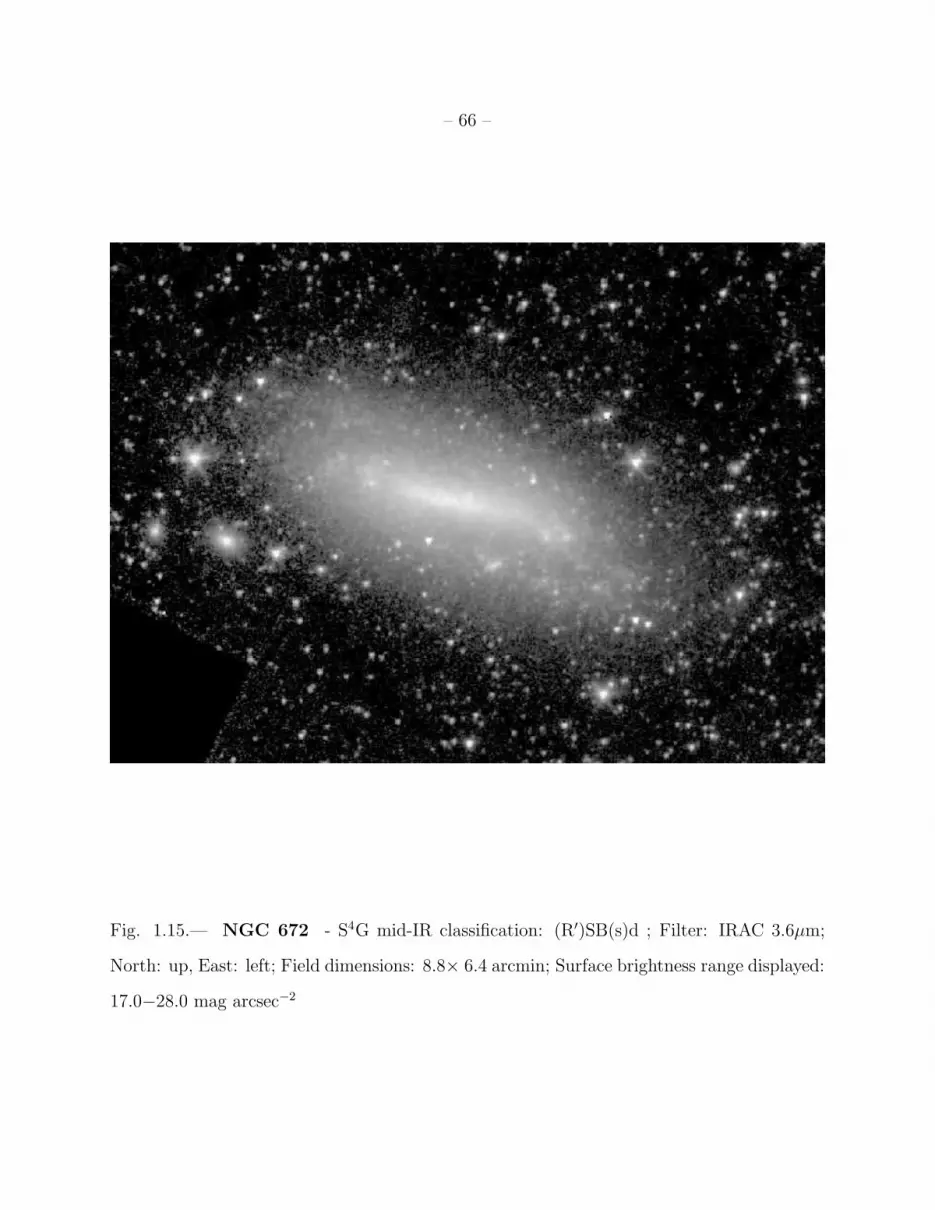
– 66 –
Fig. 1.15.— NGC 672 - S4G mid-IR classification: (R′)SB(s)d ; Filter: IRAC 3.6µm;
North: up, East: left; Field dimensions: 8.8× 6.4 arcmin; Surface brightness range displayed:
17.0−28.0 mag arcsec−2
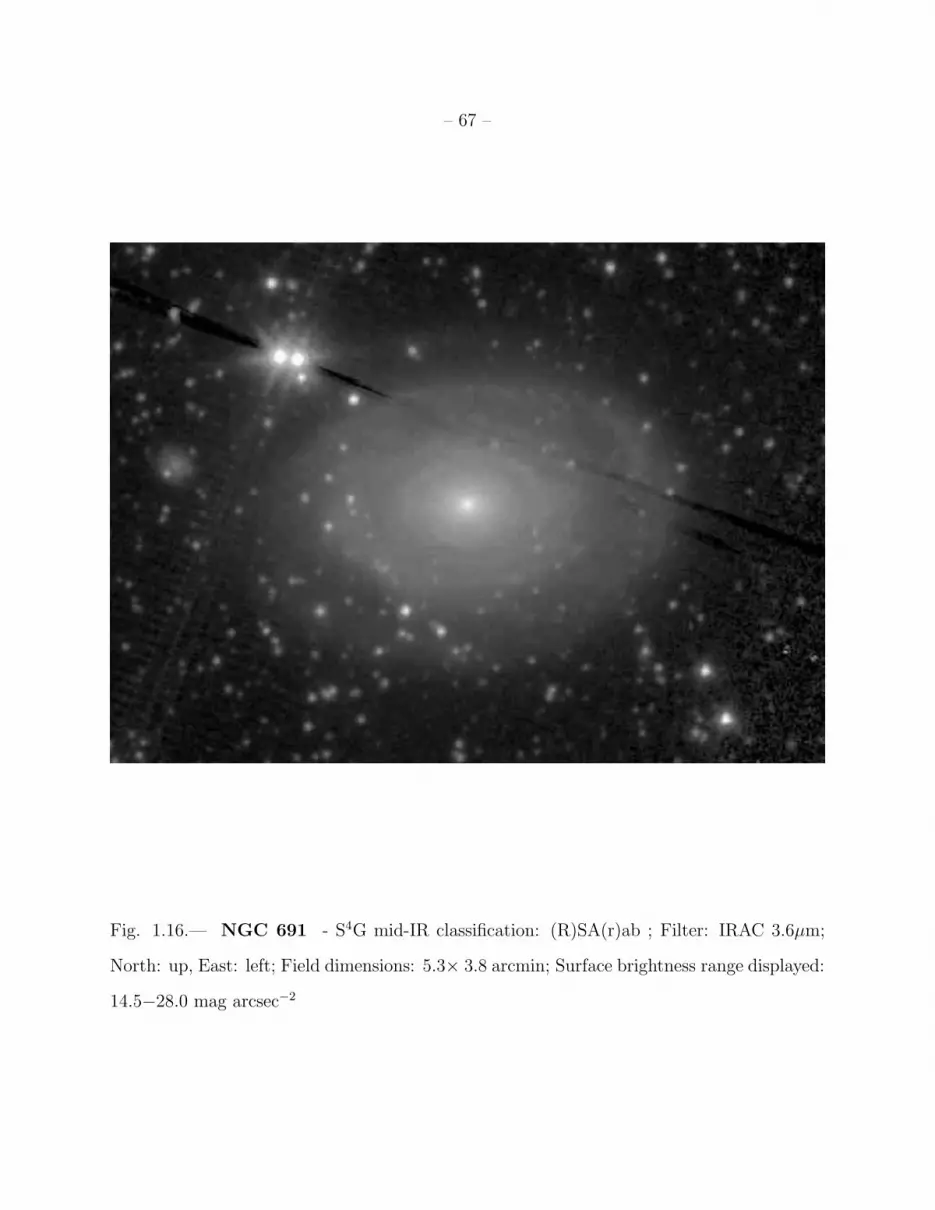
– 67 –
Fig. 1.16.— NGC 691 - S4G mid-IR classification: (R)SA(r)ab ; Filter: IRAC 3.6µm;
North: up, East: left; Field dimensions: 5.3× 3.8 arcmin; Surface brightness range displayed:
14.5−28.0 mag arcsec−2

– 68 –
Fig. 1.17.— NGC 784 - S4G mid-IR classification: SBm: sp ; Filter: IRAC 3.6µm; North:
left, East: down; Field dimensions: 7.9× 5.8 arcmin; Surface brightness range displayed:
18.5−28.0 mag arcsec−2
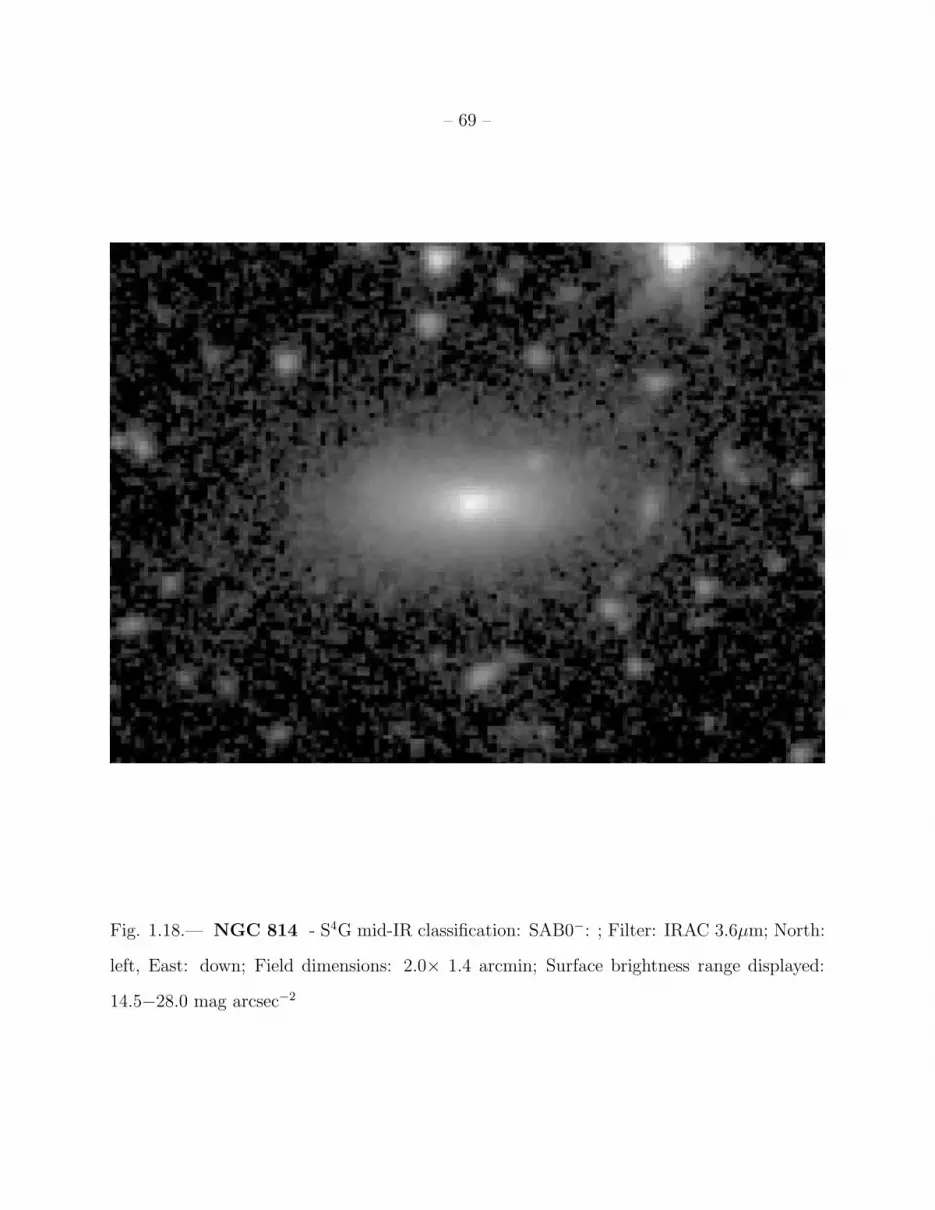
– 69 –
Fig. 1.18.— NGC 814 - S4G mid-IR classification: SAB0−: ; Filter: IRAC 3.6µm; North:
left, East: down; Field dimensions: 2.0× 1.4 arcmin; Surface brightness range displayed:
14.5−28.0 mag arcsec−2
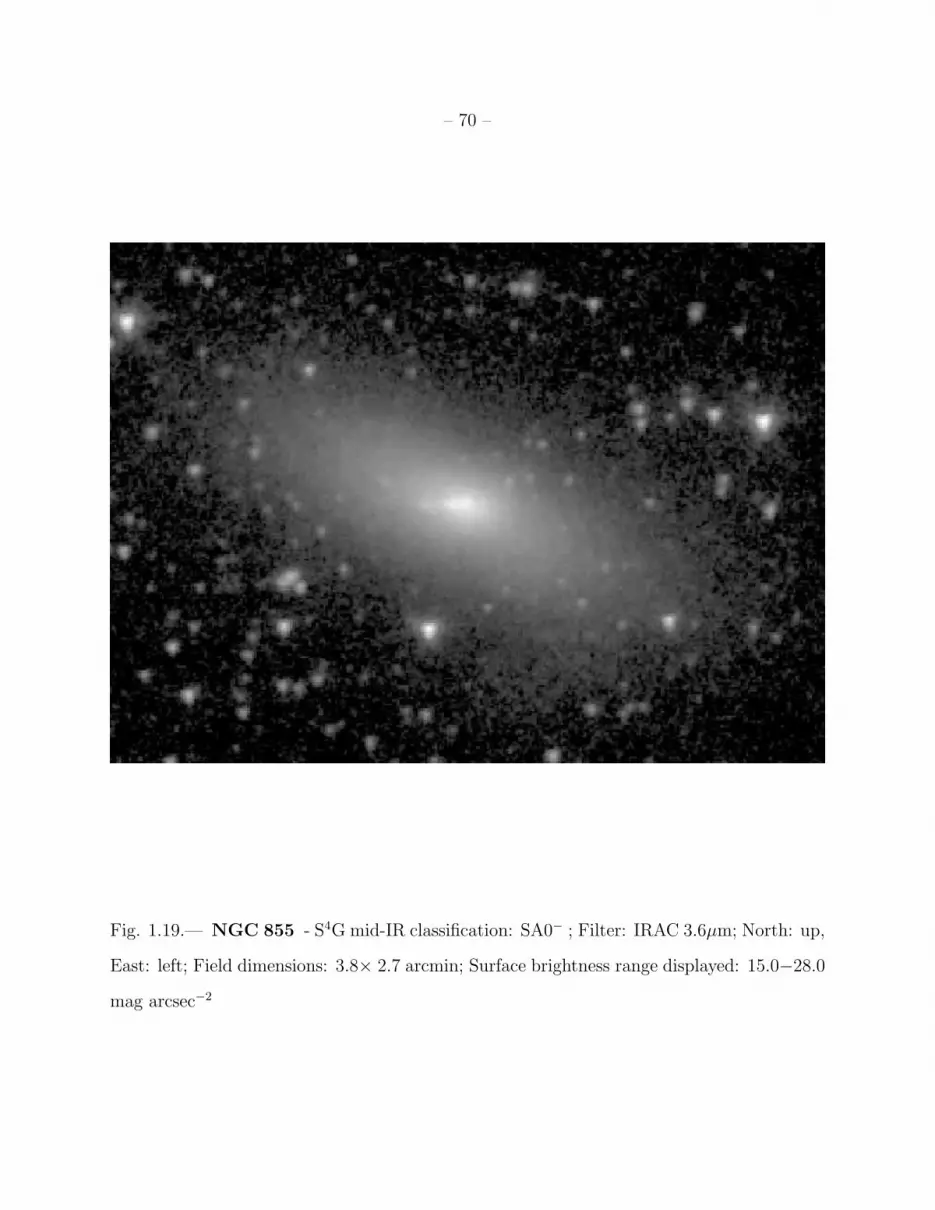
– 70 –
Fig. 1.19.— NGC 855 - S4G mid-IR classification: SA0− ; Filter: IRAC 3.6µm; North: up,
East: left; Field dimensions: 3.8× 2.7 arcmin; Surface brightness range displayed: 15.0−28.0
mag arcsec−2
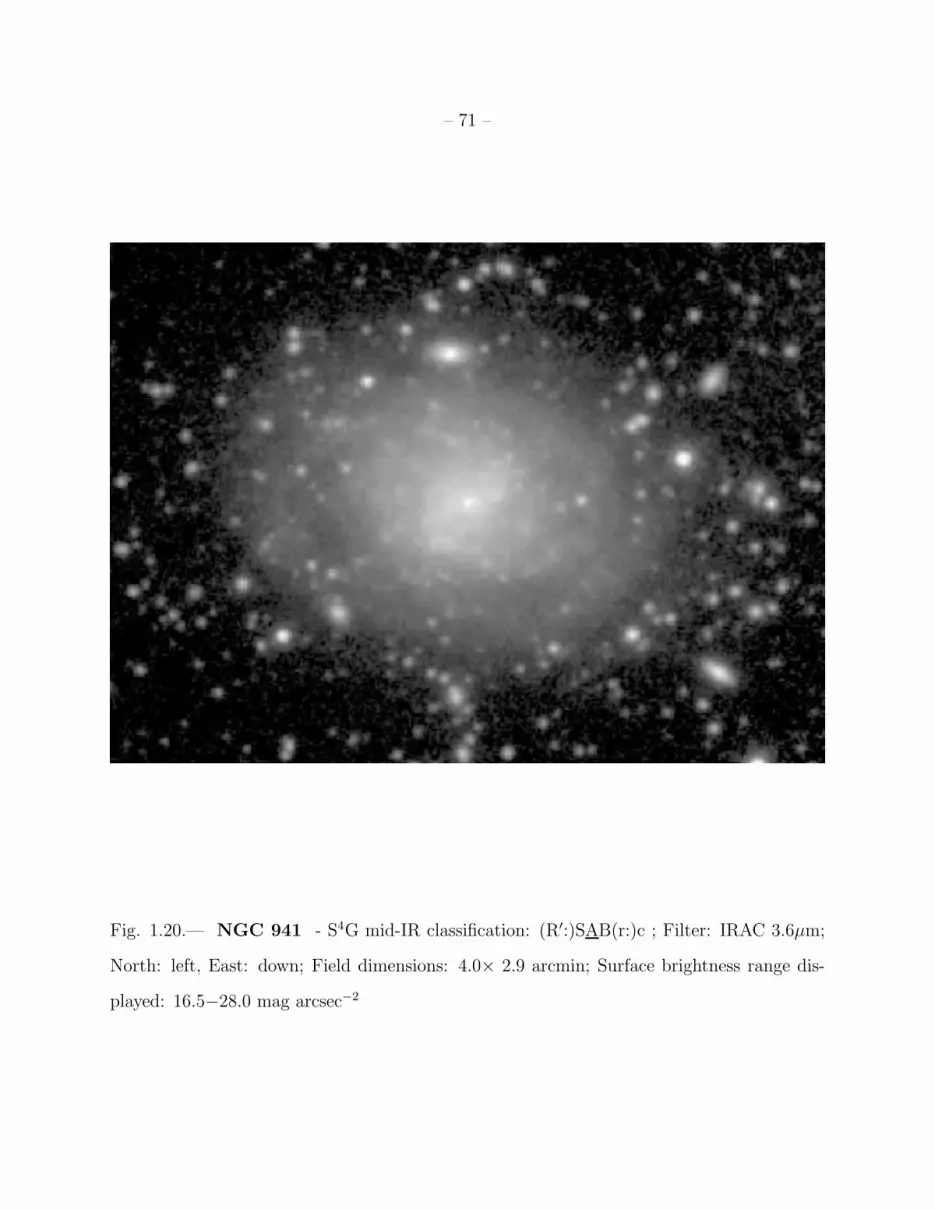
– 71 –
Fig. 1.20.— NGC 941 - S4G mid-IR classification: (R′:)SAB(r:)c ; Filter: IRAC 3.6µm;
North: left, East: down; Field dimensions: 4.0× 2.9 arcmin; Surface brightness range dis-
played: 16.5−28.0 mag arcsec−2
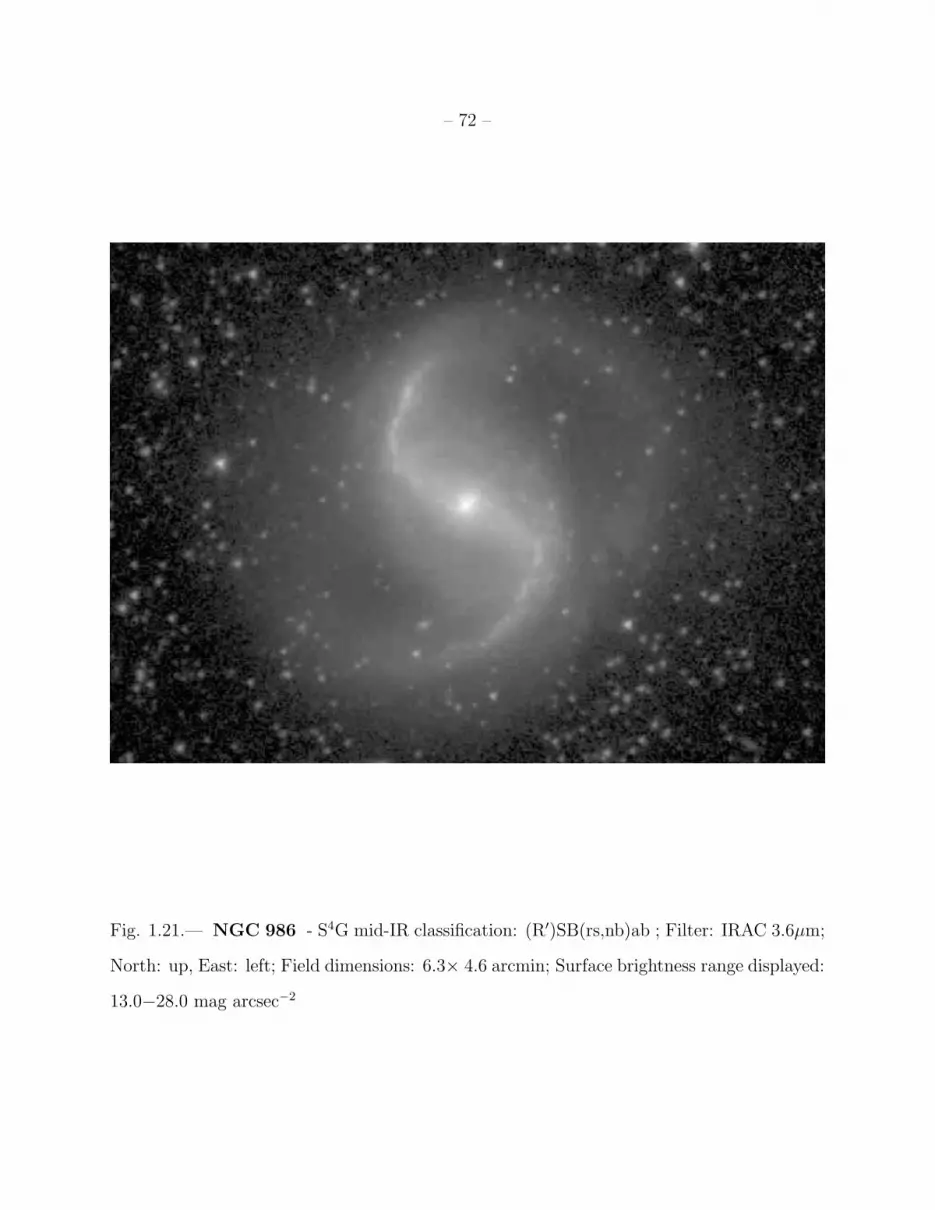
– 72 –
Fig. 1.21.— NGC 986 - S4G mid-IR classification: (R′)SB(rs,nb)ab ; Filter: IRAC 3.6µm;
North: up, East: left; Field dimensions: 6.3× 4.6 arcmin; Surface brightness range displayed:
13.0−28.0 mag arcsec−2

– 73 –
Fig. 1.22.— NGC 1068 - S4G mid-IR classification: (R)SA(s,nr)a ; Filter: IRAC 3.6µm;
North: up, East: left; Field dimensions: 10.5× 7.7 arcmin; Surface brightness range dis-
played: 11.0−28.0 mag arcsec−2
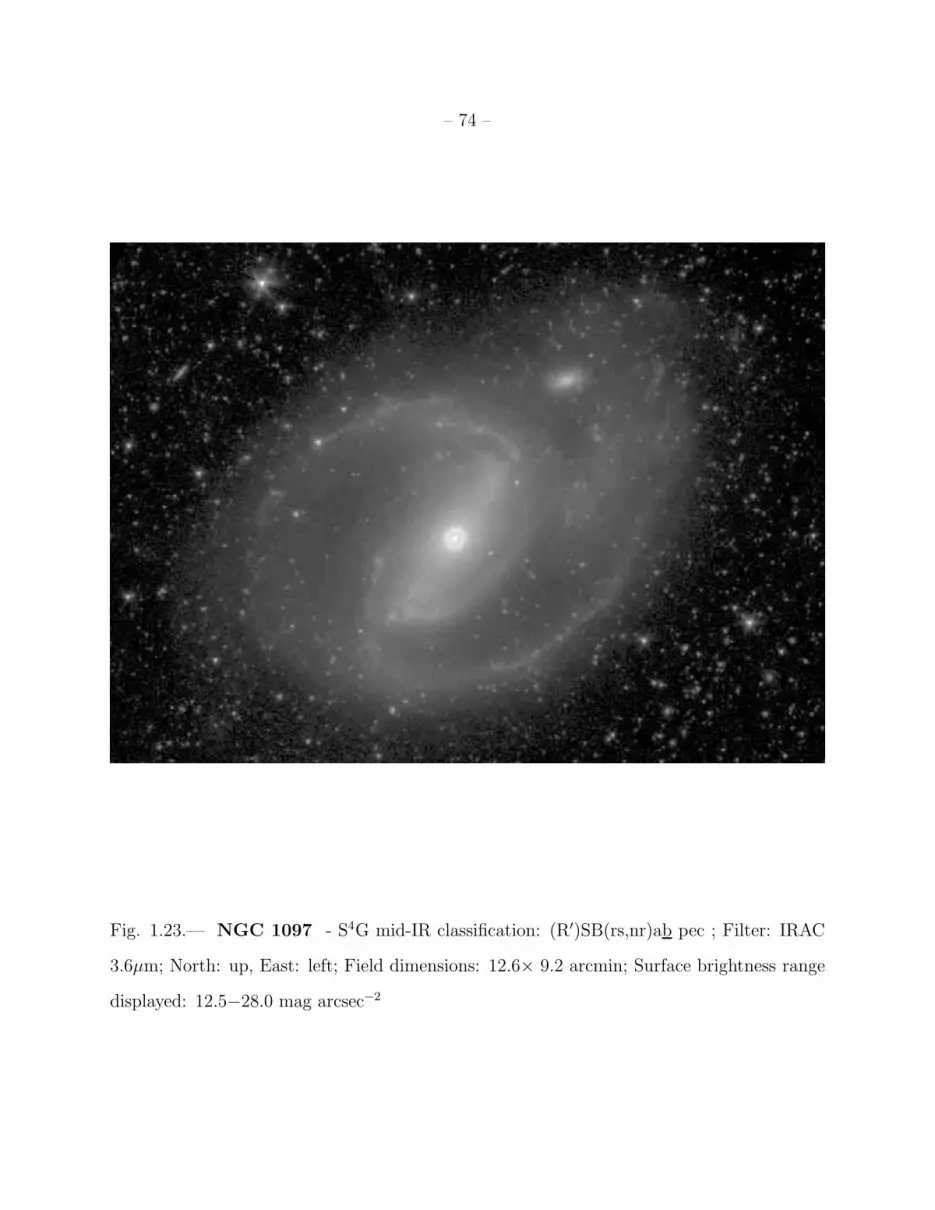
– 74 –
Fig. 1.23.— NGC 1097 - S4G mid-IR classification: (R′)SB(rs,nr)ab pec ; Filter: IRAC
3.6µm; North: up, East: left; Field dimensions: 12.6× 9.2 arcmin; Surface brightness range
displayed: 12.5−28.0 mag arcsec−2
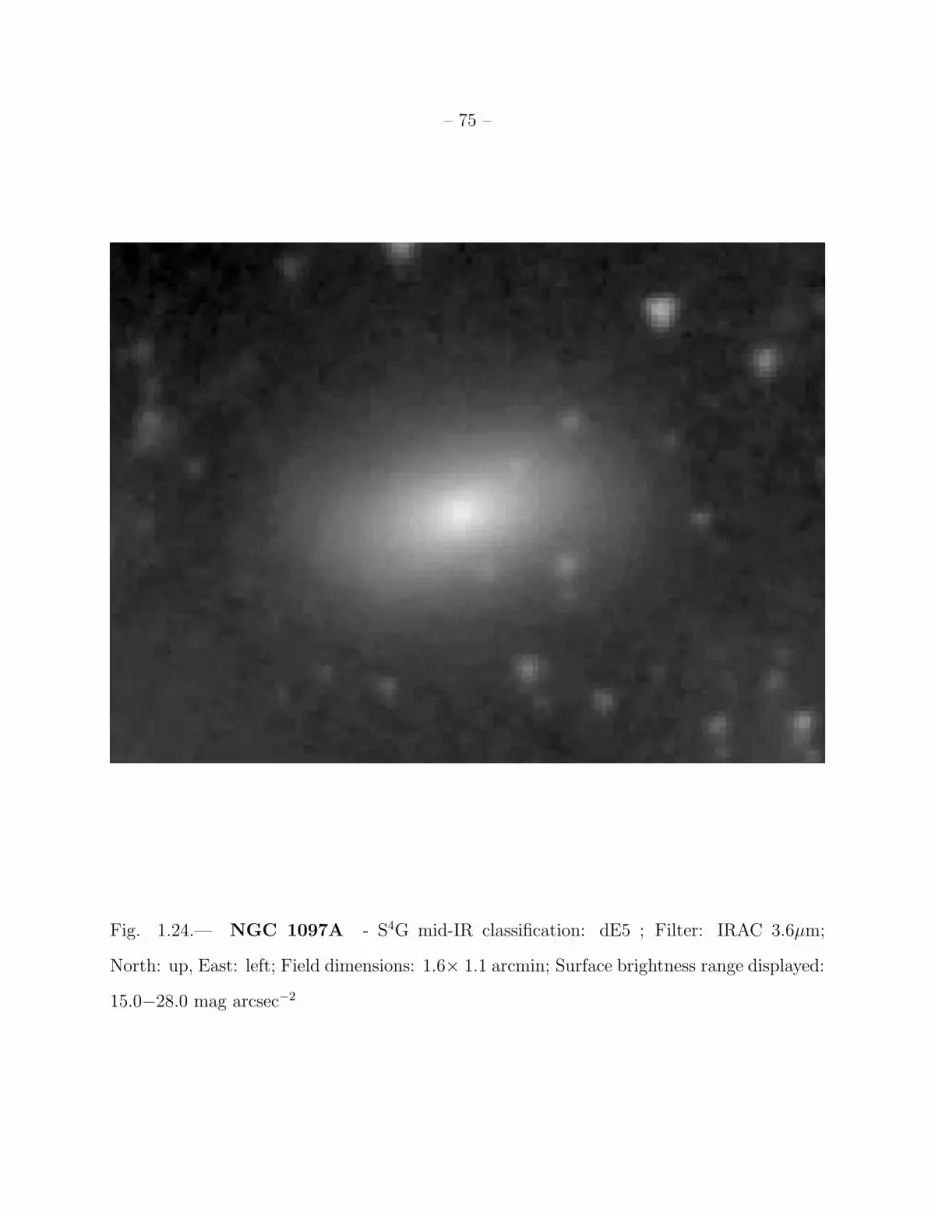
– 75 –
Fig. 1.24.— NGC 1097A - S4G mid-IR classification: dE5 ; Filter: IRAC 3.6µm;
North: up, East: left; Field dimensions: 1.6× 1.1 arcmin; Surface brightness range displayed:
15.0−28.0 mag arcsec−2

– 76 –
Fig. 1.25.— NGC 1291 - S4G mid-IR classification: (R)SAB(l,nb)0+ ; Filter: IRAC
3.6µm; North: up, East: left; Field dimensions: 18.5× 13.5 arcmin; Surface brightness range
displayed: 11.5−28.0 mag arcsec−2
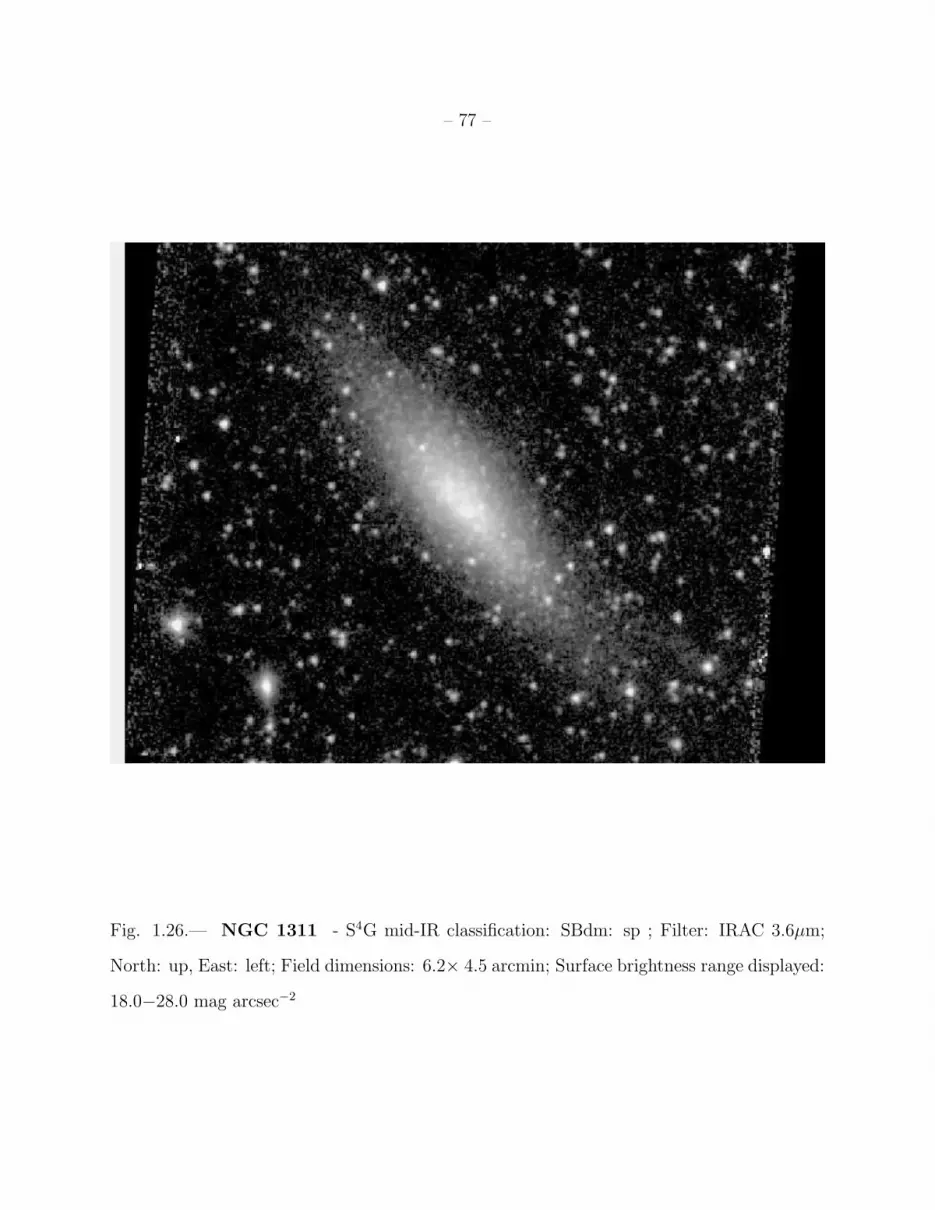
– 77 –
Fig. 1.26.— NGC 1311 - S4G mid-IR classification: SBdm: sp ; Filter: IRAC 3.6µm;
North: up, East: left; Field dimensions: 6.2× 4.5 arcmin; Surface brightness range displayed:
18.0−28.0 mag arcsec−2
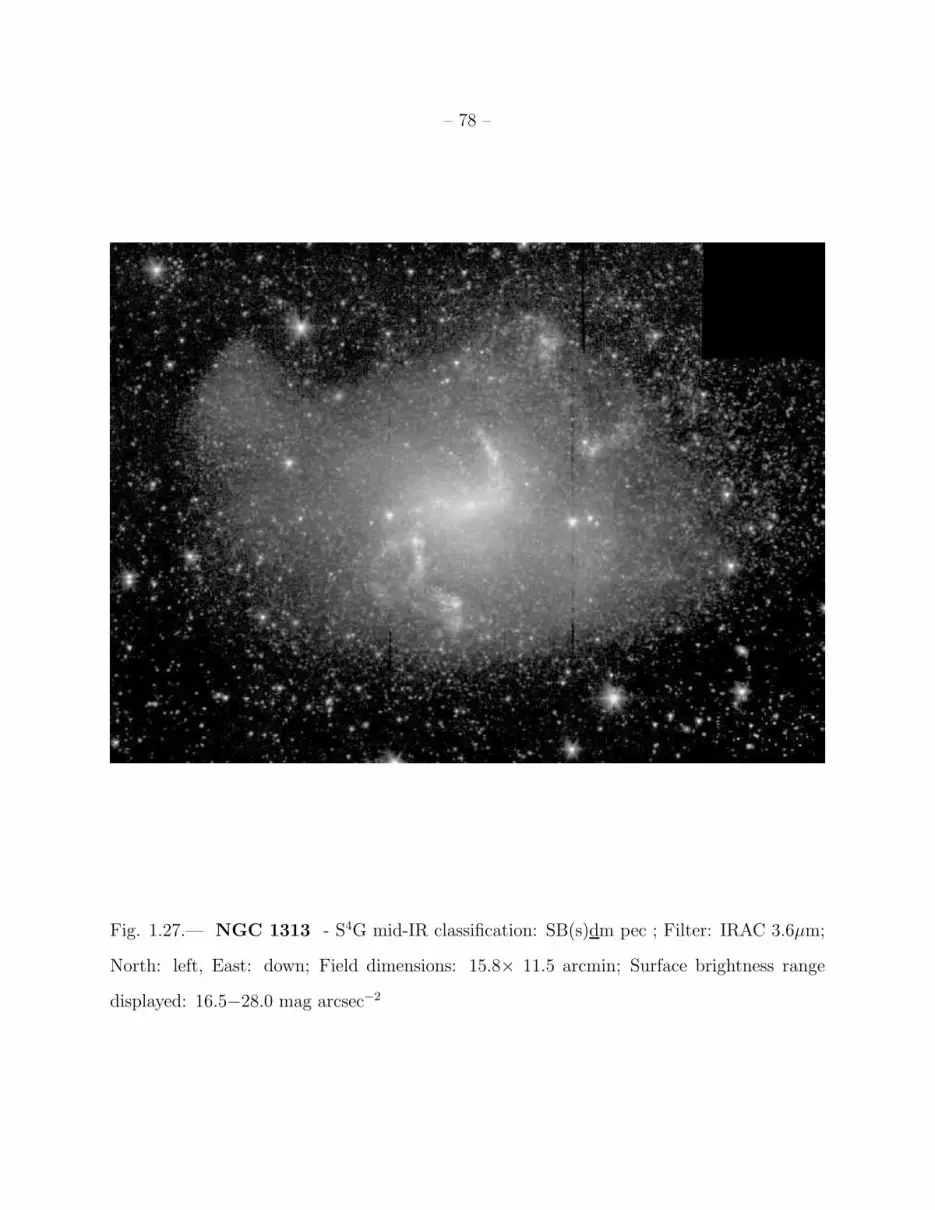
– 78 –
Fig. 1.27.— NGC 1313 - S4G mid-IR classification: SB(s)dm pec ; Filter: IRAC 3.6µm;
North: left, East: down; Field dimensions: 15.8× 11.5 arcmin; Surface brightness range
displayed: 16.5−28.0 mag arcsec−2

– 79 –
Fig. 1.28.— NGC 1365 - S4G mid-IR classification: SB(rs,nr)bc ; Filter: IRAC 3.6µm;
North: left, East: down; Field dimensions: 12.6× 9.2 arcmin; Surface brightness range
displayed: 11.0−28.0 mag arcsec−2

– 80 –
Fig. 1.29.— NGC 1433 - S4G mid-IR classification: (R′
1)SB(r,nr,nb)a ; Filter: IRAC
3.6µm; North: up, East: left; Field dimensions: 10.5× 7.6 arcmin; Surface brightness range
displayed: 13.0−28.0 mag arcsec−2

– 81 –
Fig. 1.30.— NGC 1448 - S4G mid-IR classification: SA(rs:)c sp ; Filter: IRAC 3.6µm;
North: up, East: left; Field dimensions: 9.0× 6.6 arcmin; Surface brightness range displayed:
14.0−28.0 mag arcsec−2
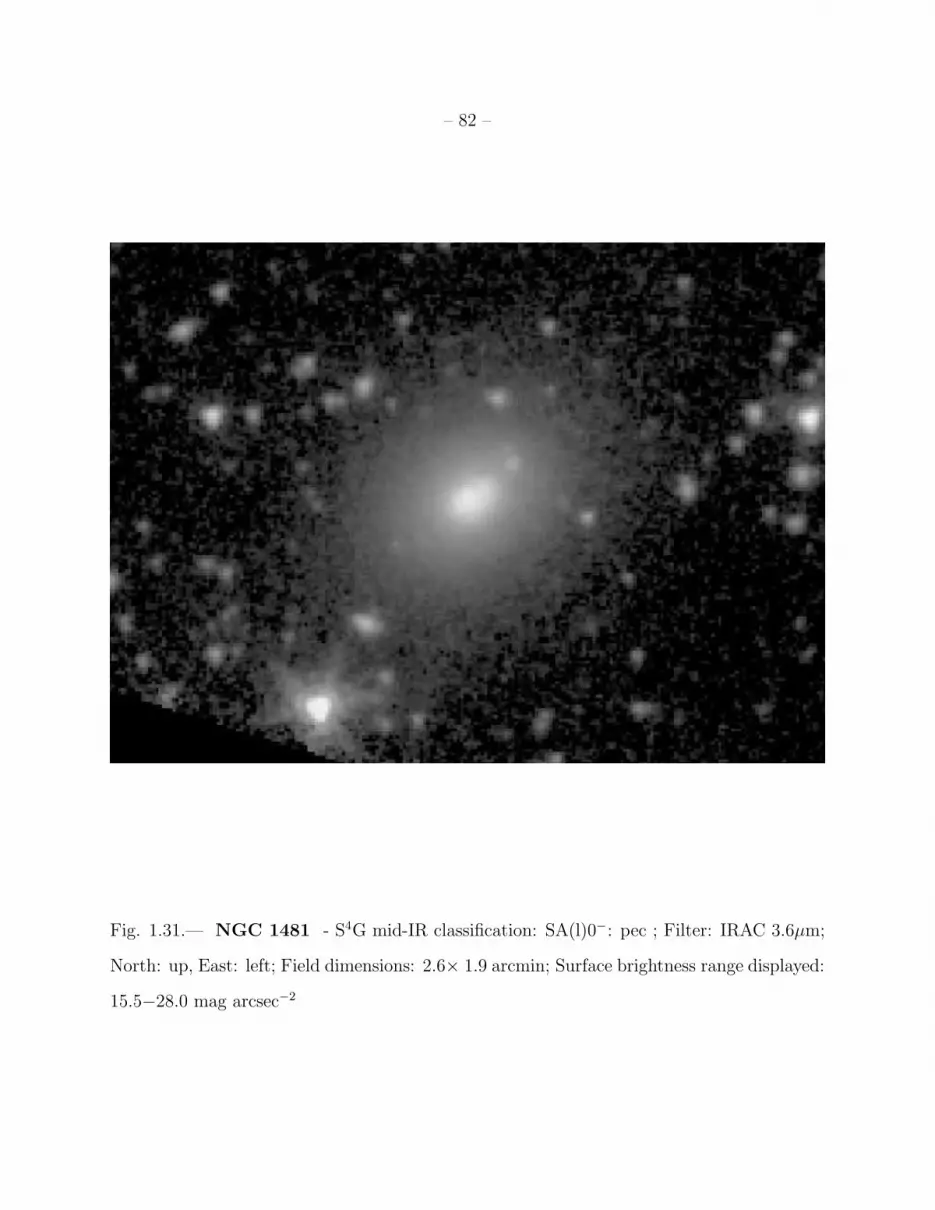
– 82 –
Fig. 1.31.— NGC 1481 - S4G mid-IR classification: SA(l)0−: pec ; Filter: IRAC 3.6µm;
North: up, East: left; Field dimensions: 2.6× 1.9 arcmin; Surface brightness range displayed:
15.5−28.0 mag arcsec−2

– 83 –
Fig. 1.32.— NGC 1482 - S4G mid-IR classification: Sa: sp ; Filter: IRAC 3.6µm;
North: up, East: left; Field dimensions: 5.3× 3.8 arcmin; Surface brightness range displayed:
12.0−28.0 mag arcsec−2

– 84 –
Fig. 1.33.— NGC 1487 - S4G mid-IR classification: Pec ; Filter: IRAC 3.6µm; North: up,
East: left; Field dimensions: 5.8× 4.2 arcmin; Surface brightness range displayed: 15.5−28.0
mag arcsec−2
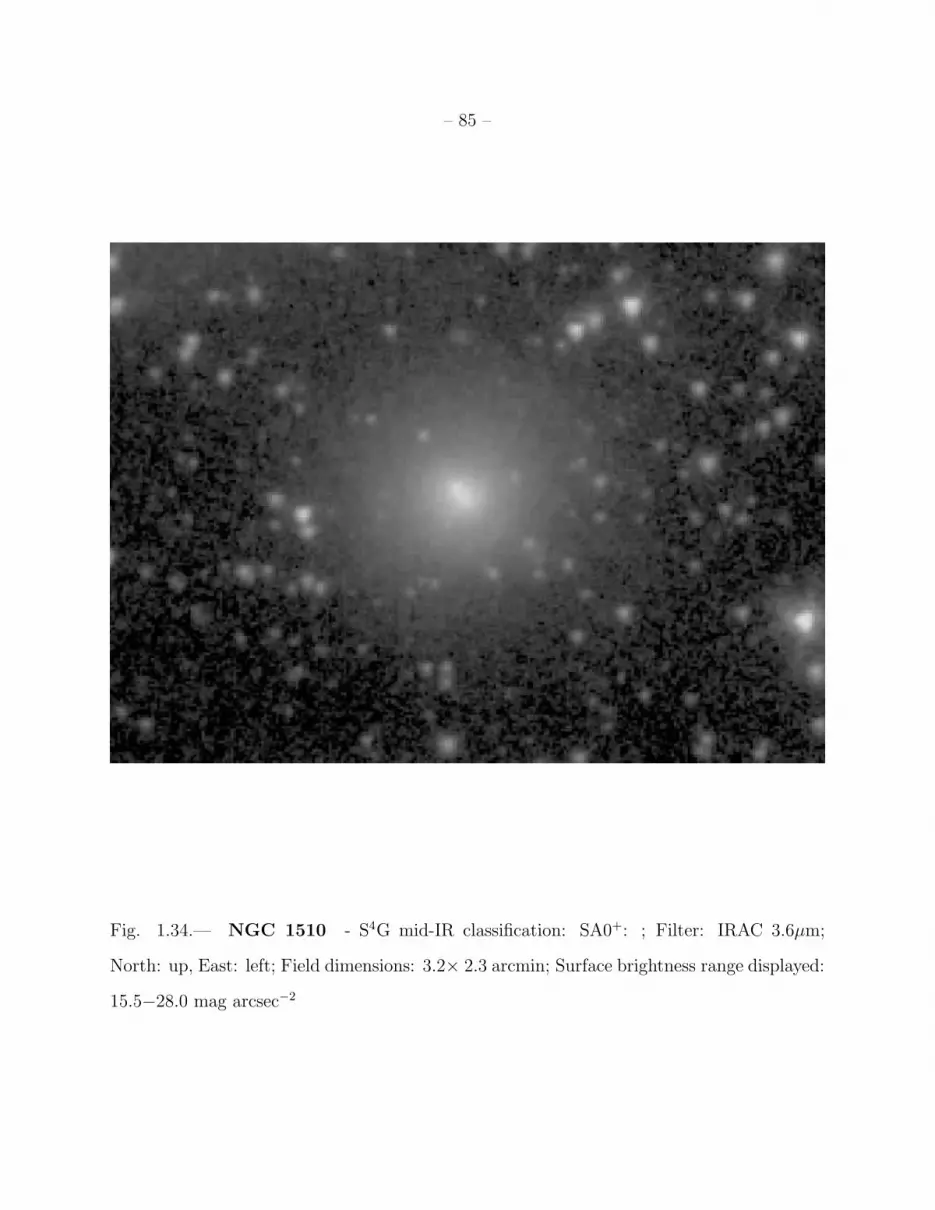
– 85 –
Fig. 1.34.— NGC 1510 - S4G mid-IR classification: SA0+: ; Filter: IRAC 3.6µm;
North: up, East: left; Field dimensions: 3.2× 2.3 arcmin; Surface brightness range displayed:
15.5−28.0 mag arcsec−2
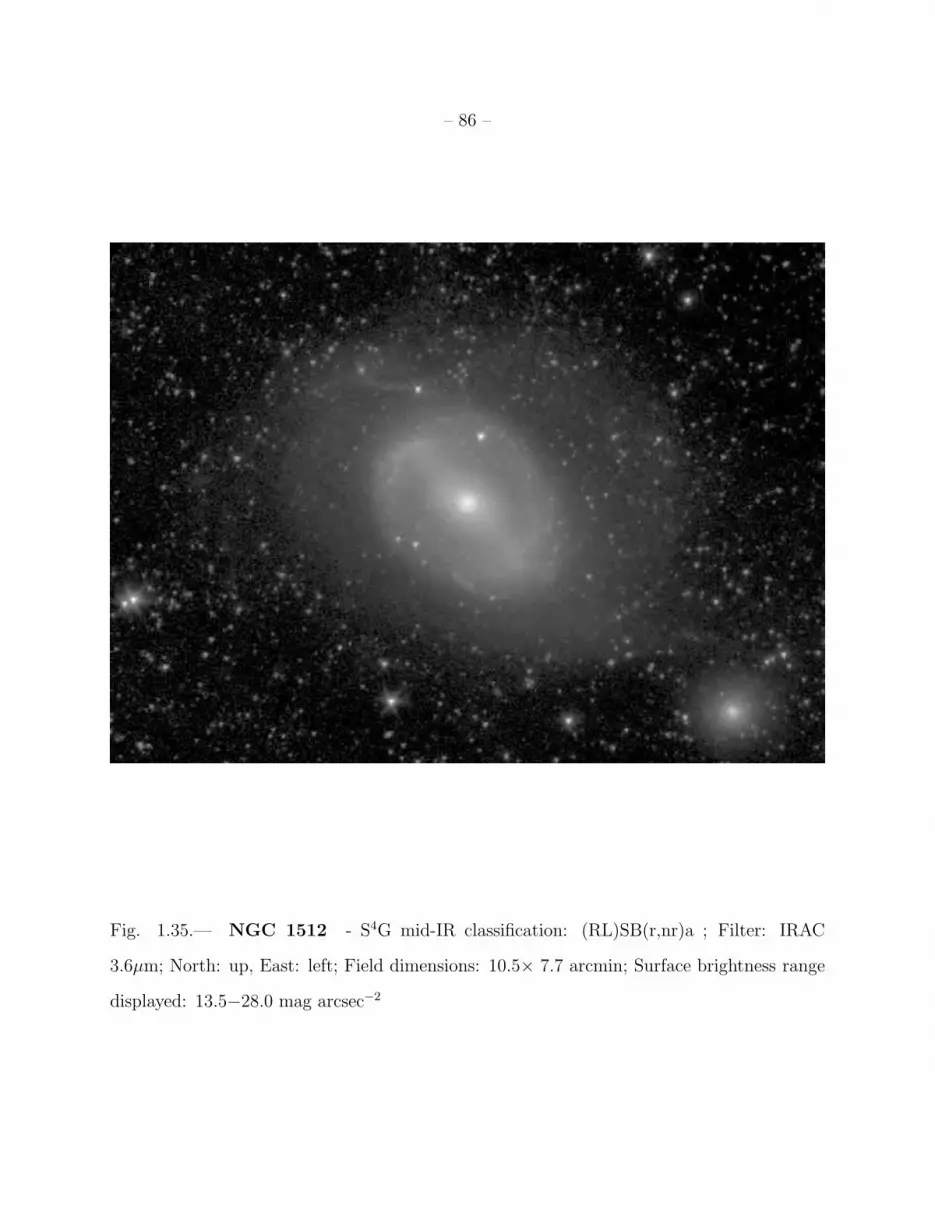
– 86 –
Fig. 1.35.— NGC 1512 - S4G mid-IR classification: (RL)SB(r,nr)a ; Filter: IRAC
3.6µm; North: up, East: left; Field dimensions: 10.5× 7.7 arcmin; Surface brightness range
displayed: 13.5−28.0 mag arcsec−2

– 87 –
Fig. 1.36.— NGC 1559 - S4G mid-IR classification: SB(s)cd ; Filter: IRAC 3.6µm;
North: up, East: left; Field dimensions: 5.7× 4.2 arcmin; Surface brightness range displayed:
15.0−28.0 mag arcsec−2

– 88 –
Fig. 1.37.— NGC 1566 - S4G mid-IR classification: (R′
1)SAB(s)b ; Filter: IRAC 3.6µm;
North: up, East: left; Field dimensions: 11.5× 8.4 arcmin; Surface brightness range dis-
played: 12.0−28.0 mag arcsec−2
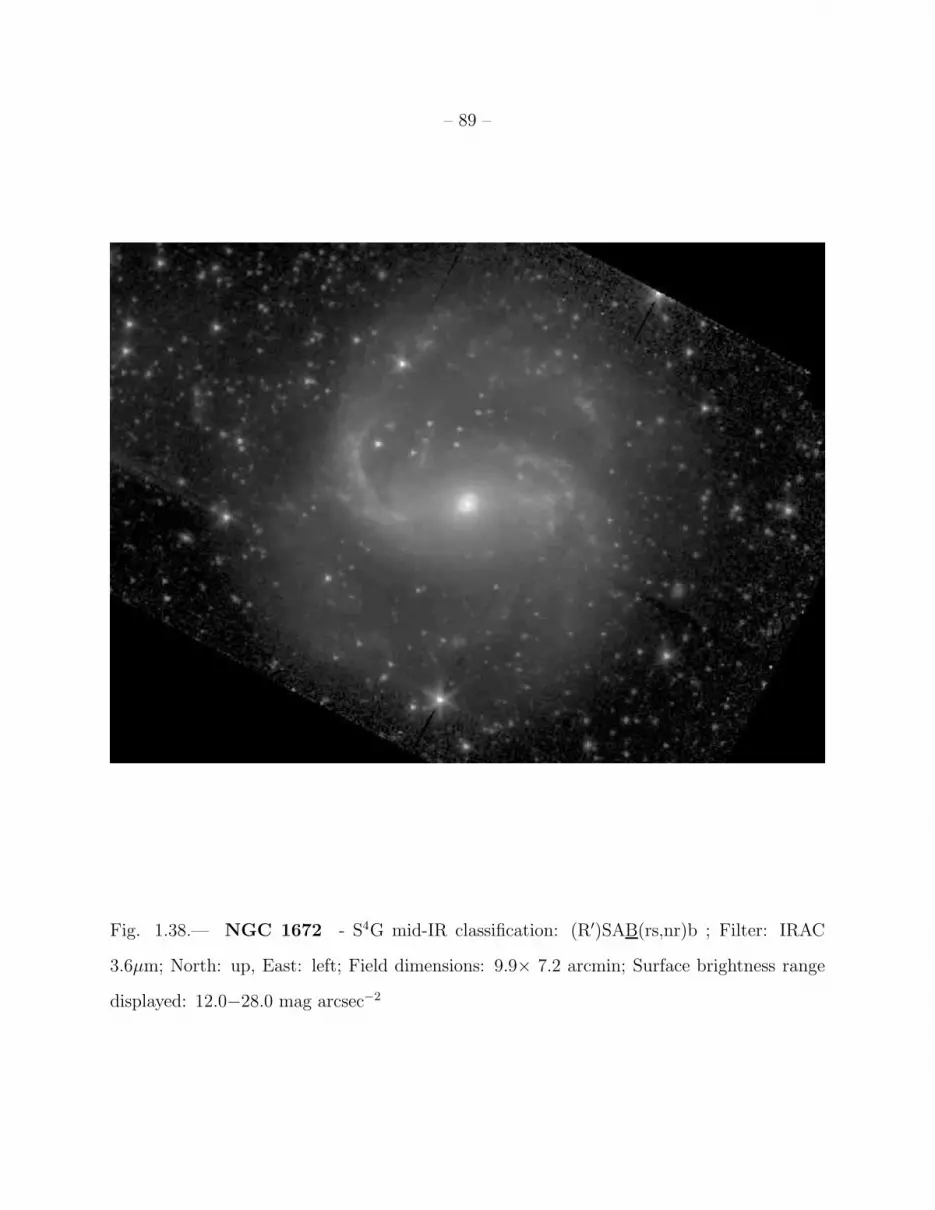
– 89 –
Fig. 1.38.— NGC 1672 - S4G mid-IR classification: (R′)SAB(rs,nr)b ; Filter: IRAC
3.6µm; North: up, East: left; Field dimensions: 9.9× 7.2 arcmin; Surface brightness range
displayed: 12.0−28.0 mag arcsec−2
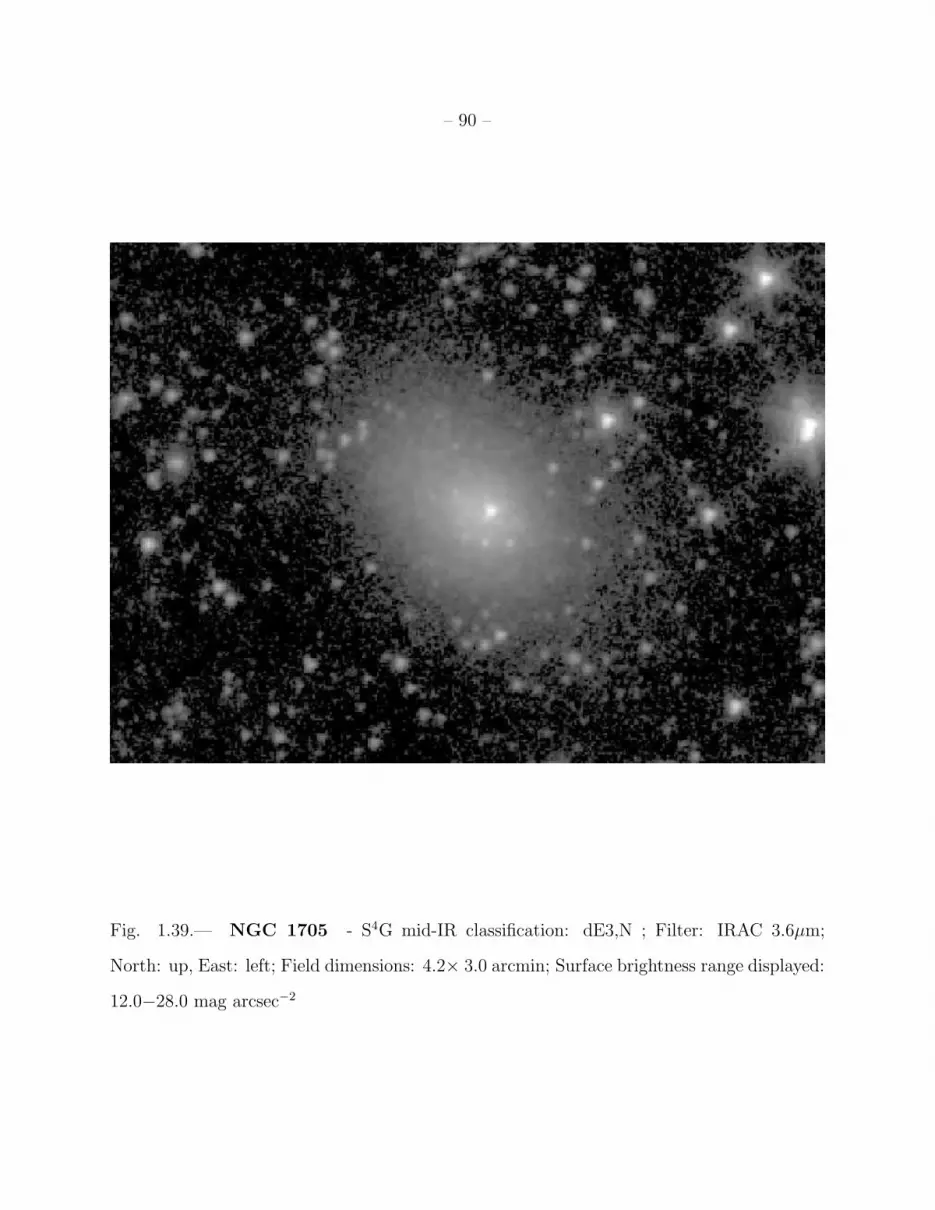
– 90 –
Fig. 1.39.— NGC 1705 - S4G mid-IR classification: dE3,N ; Filter: IRAC 3.6µm;
North: up, East: left; Field dimensions: 4.2× 3.0 arcmin; Surface brightness range displayed:
12.0−28.0 mag arcsec−2

– 91 –
Fig. 1.40.— NGC 1744 - S4G mid-IR classification: SB(s)d ; Filter: IRAC 3.6µm; North:
left, East: down; Field dimensions: 7.9× 5.7 arcmin; Surface brightness range displayed:
17.5−28.0 mag arcsec−2

– 92 –
Fig. 1.41.— NGC 1808 - S4G mid-IR classification: (R1)SAB(s,nr)a ; Filter: IRAC
3.6µm; North: up, East: left; Field dimensions: 10.4× 7.5 arcmin; Surface brightness range
displayed: 11.5−28.0 mag arcsec−2
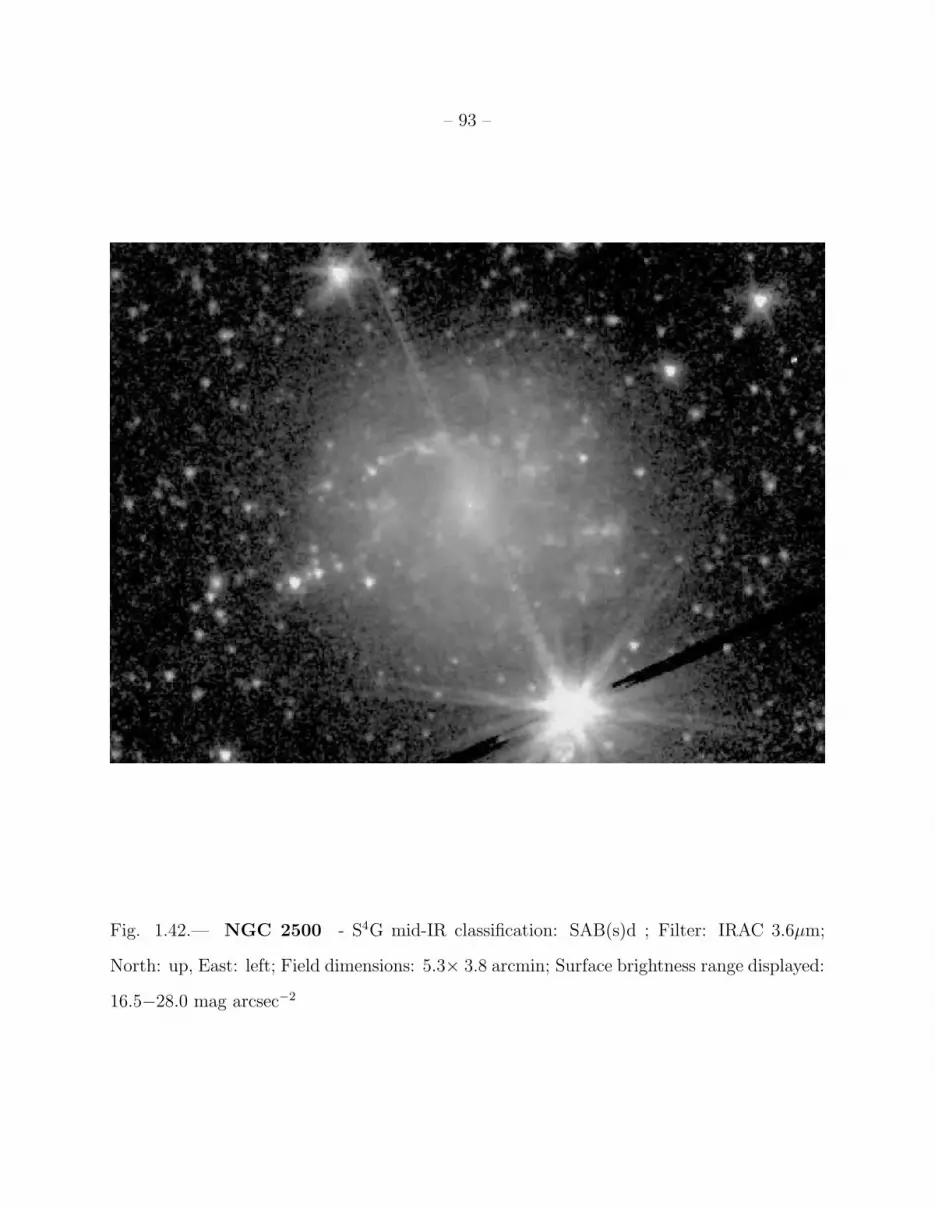
– 93 –
Fig. 1.42.— NGC 2500 - S4G mid-IR classification: SAB(s)d ; Filter: IRAC 3.6µm;
North: up, East: left; Field dimensions: 5.3× 3.8 arcmin; Surface brightness range displayed:
16.5−28.0 mag arcsec−2

– 94 –
Fig. 1.43.— NGC 2552 - S4G mid-IR classification: (R′)SAB(s)m ; Filter: IRAC 3.6µm;
North: up, East: left; Field dimensions: 5.3× 3.8 arcmin; Surface brightness range displayed:
18.0−28.0 mag arcsec−2
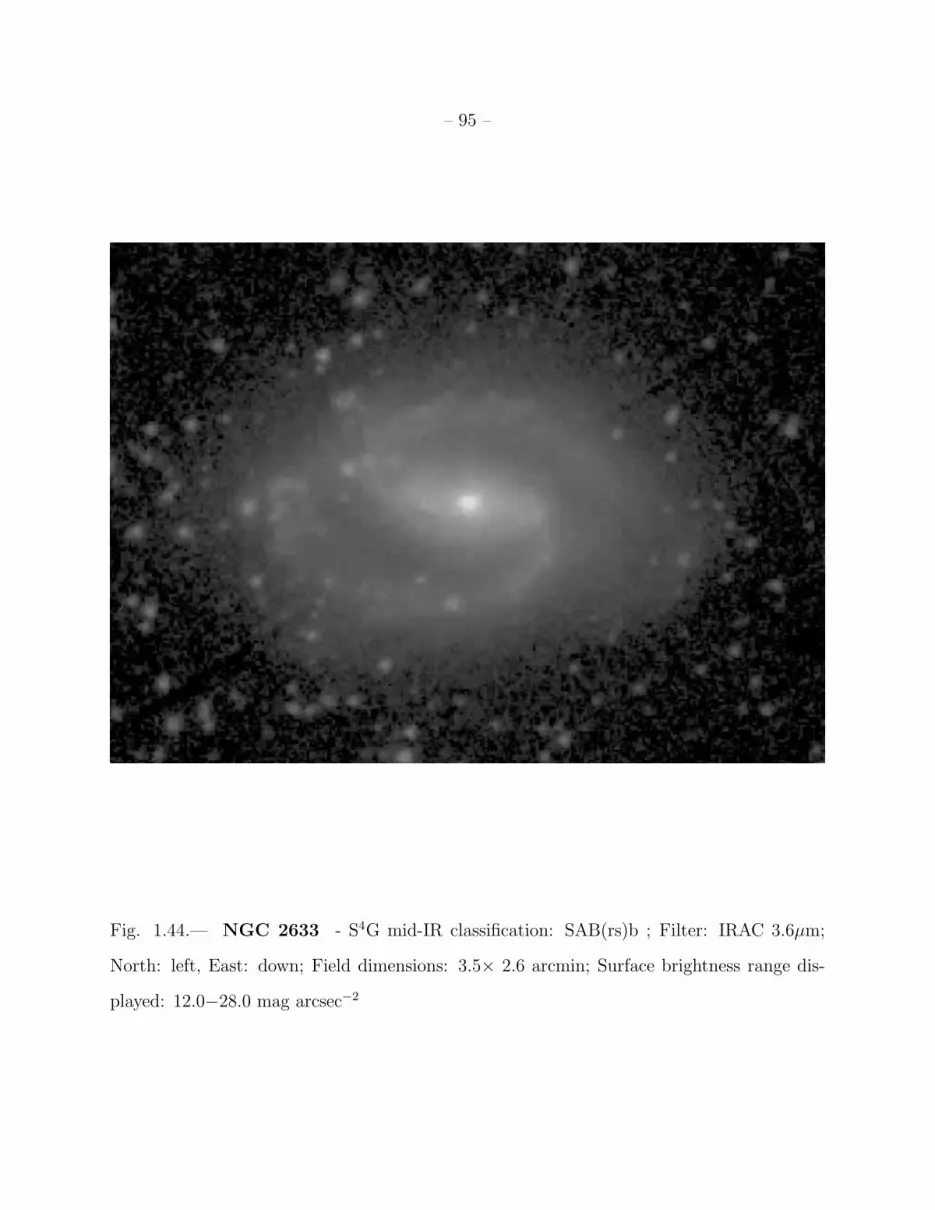
– 95 –
Fig. 1.44.— NGC 2633 - S4G mid-IR classification: SAB(rs)b ; Filter: IRAC 3.6µm;
North: left, East: down; Field dimensions: 3.5× 2.6 arcmin; Surface brightness range dis-
played: 12.0−28.0 mag arcsec−2

– 96 –
Fig. 1.45.— NGC 2634 - S4G mid-IR classification: SA(nl)0− (shells/ripples) ; Filter:
IRAC 3.6µm; North: left, East: down; Field dimensions: 5.3× 3.8 arcmin; Surface brightness
range displayed: 13.5−28.0 mag arcsec−2
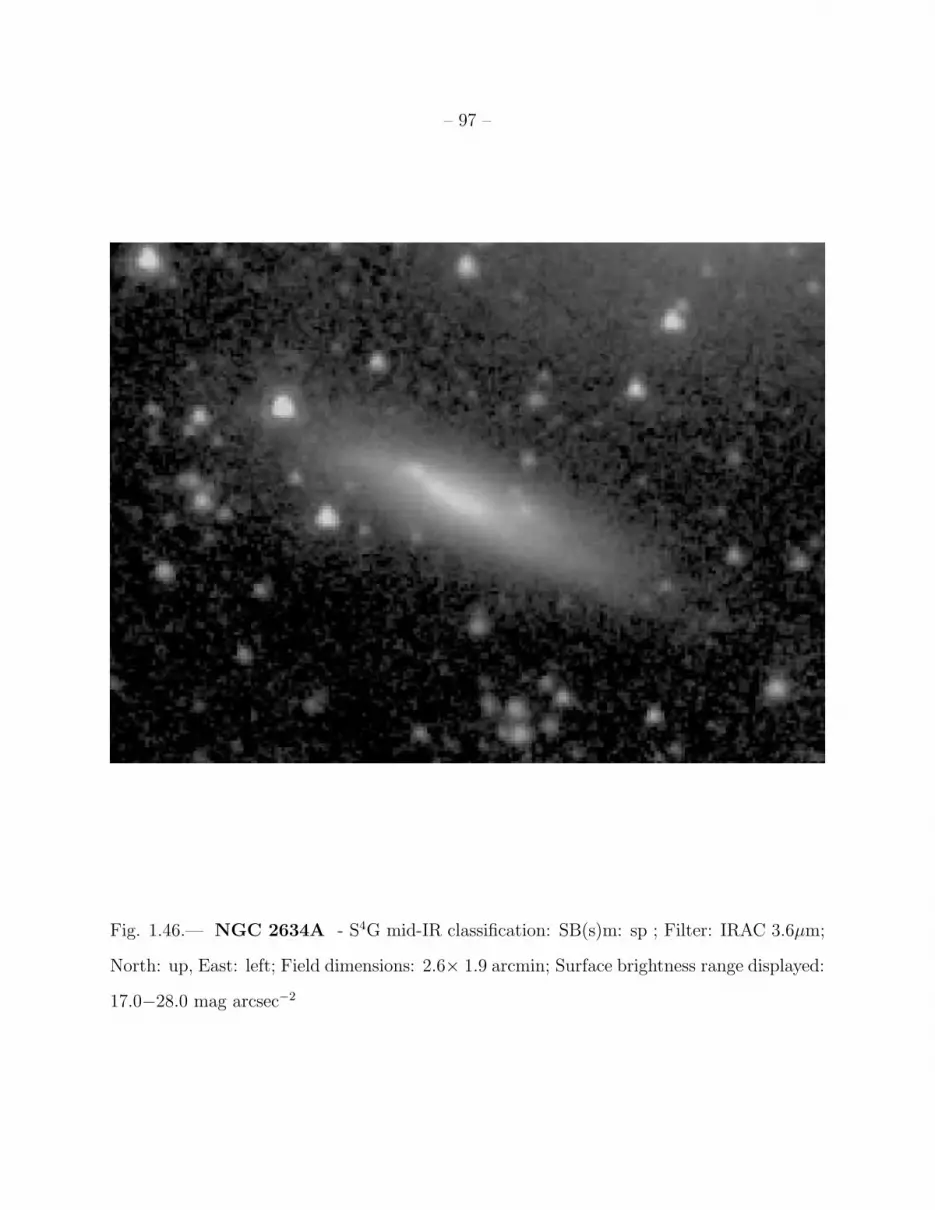
– 97 –
Fig. 1.46.— NGC 2634A - S4G mid-IR classification: SB(s)m: sp ; Filter: IRAC 3.6µm;
North: up, East: left; Field dimensions: 2.6× 1.9 arcmin; Surface brightness range displayed:
17.0−28.0 mag arcsec−2

– 98 –
Fig. 1.47.— NGC 2683 - S4G mid-IR classification: (RL)SBx(rs)0/a sp ; Filter: IRAC
3.6µm; North: up, East: left; Field dimensions: 11.3× 8.2 arcmin; Surface brightness range
displayed: 13.5−28.0 mag arcsec−2
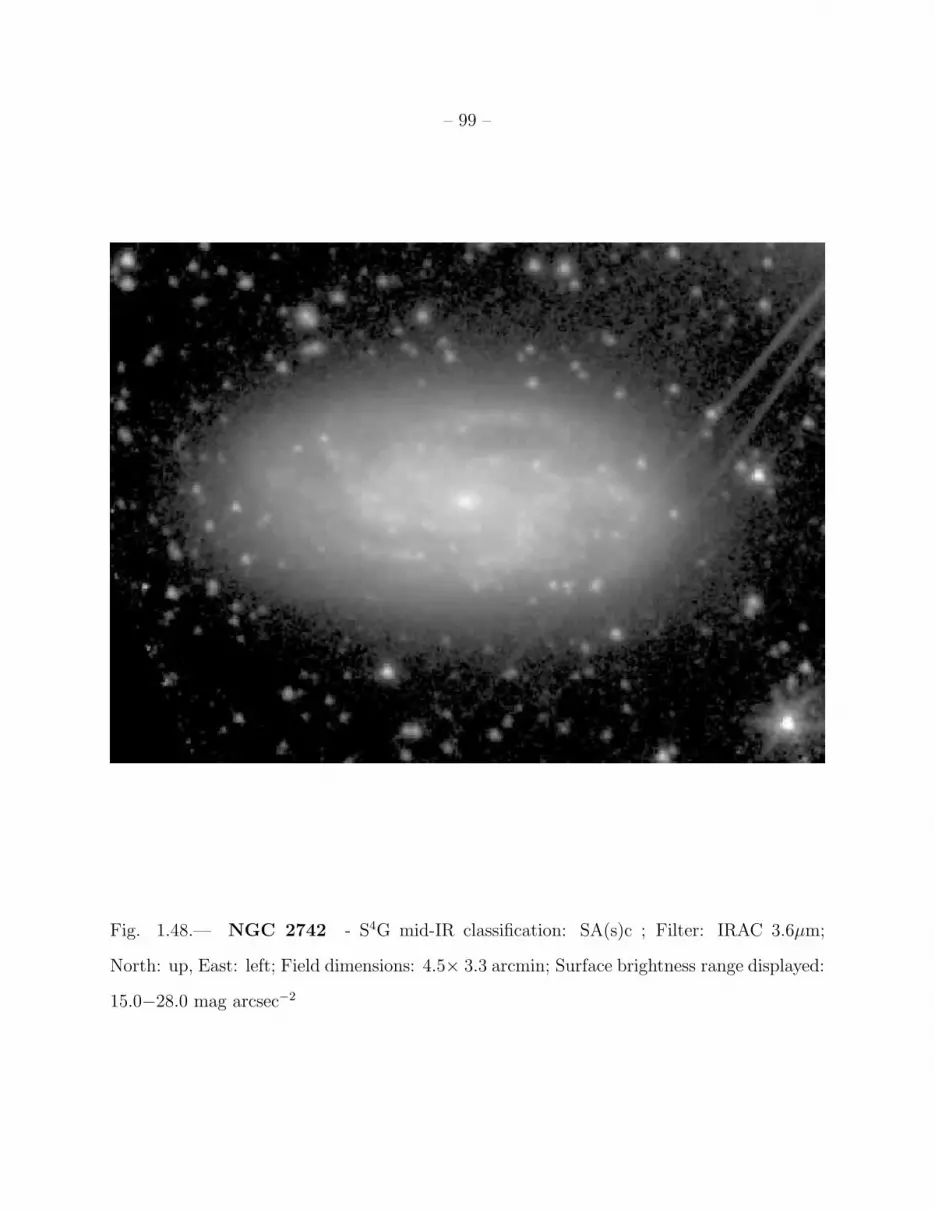
– 99 –
Fig. 1.48.— NGC 2742 - S4G mid-IR classification: SA(s)c ; Filter: IRAC 3.6µm;
North: up, East: left; Field dimensions: 4.5× 3.3 arcmin; Surface brightness range displayed:
15.0−28.0 mag arcsec−2

– 100 –
Fig. 1.49.— NGC 2798 (right) and NGC 2799 (left) - S4G mid-IR classifications:
SAB(s)a pec, SB(s)dm? pec sp, respectively; Filter: IRAC 3.6µm; North: up, East: left;
Field dimensions: 4.5× 3.3 arcmin; Surface brightness range displayed: 12.0−28.0 mag
arcsec−2

– 101 –
Fig. 1.50.— NGC 2805 - S4G mid-IR classification: (R)SAB(rs)c pec ; Filter: IRAC
3.6µm; North: up, East: left; Field dimensions: 7.9× 5.7 arcmin; Surface brightness range
displayed: 16.5−28.0 mag arcsec−2
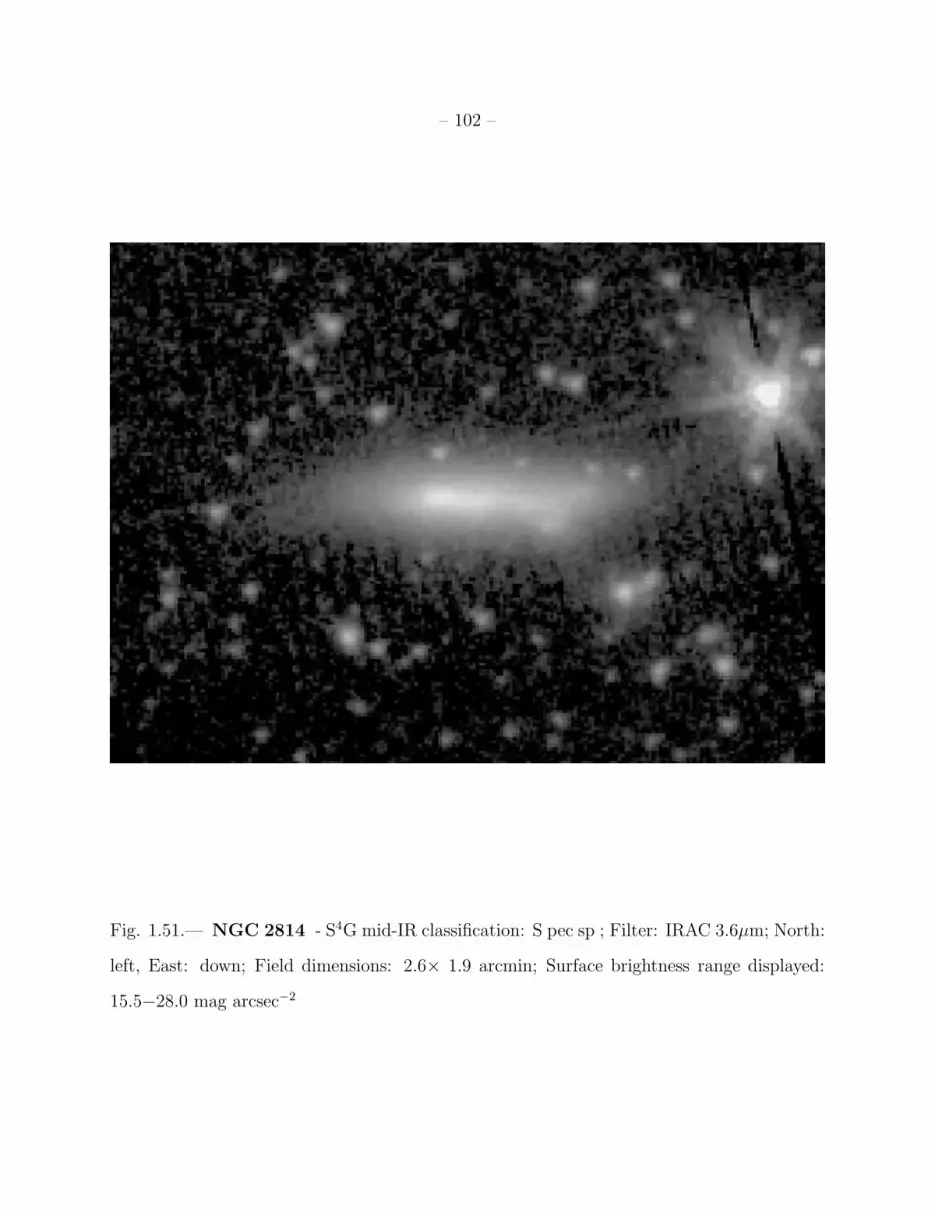
– 102 –
Fig. 1.51.— NGC 2814 - S4G mid-IR classification: S pec sp ; Filter: IRAC 3.6µm; North:
left, East: down; Field dimensions: 2.6× 1.9 arcmin; Surface brightness range displayed:
15.5−28.0 mag arcsec−2

– 103 –
Fig. 1.52.— NGC 2820 - S4Gmid-IR classification: Sc sp ; Filter: IRAC 3.6µm; North: up,
East: left; Field dimensions: 3.9× 2.9 arcmin; Surface brightness range displayed: 15.0−28.0
mag arcsec−2

– 104 –
Fig. 1.53.— NGC 2841 - S4Gmid-IR classification: SAB(r)a ; Filter: IRAC 3.6µm; North:
left, East: down; Field dimensions: 9.6× 7.0 arcmin; Surface brightness range displayed:
12.0−28.0 mag arcsec−2
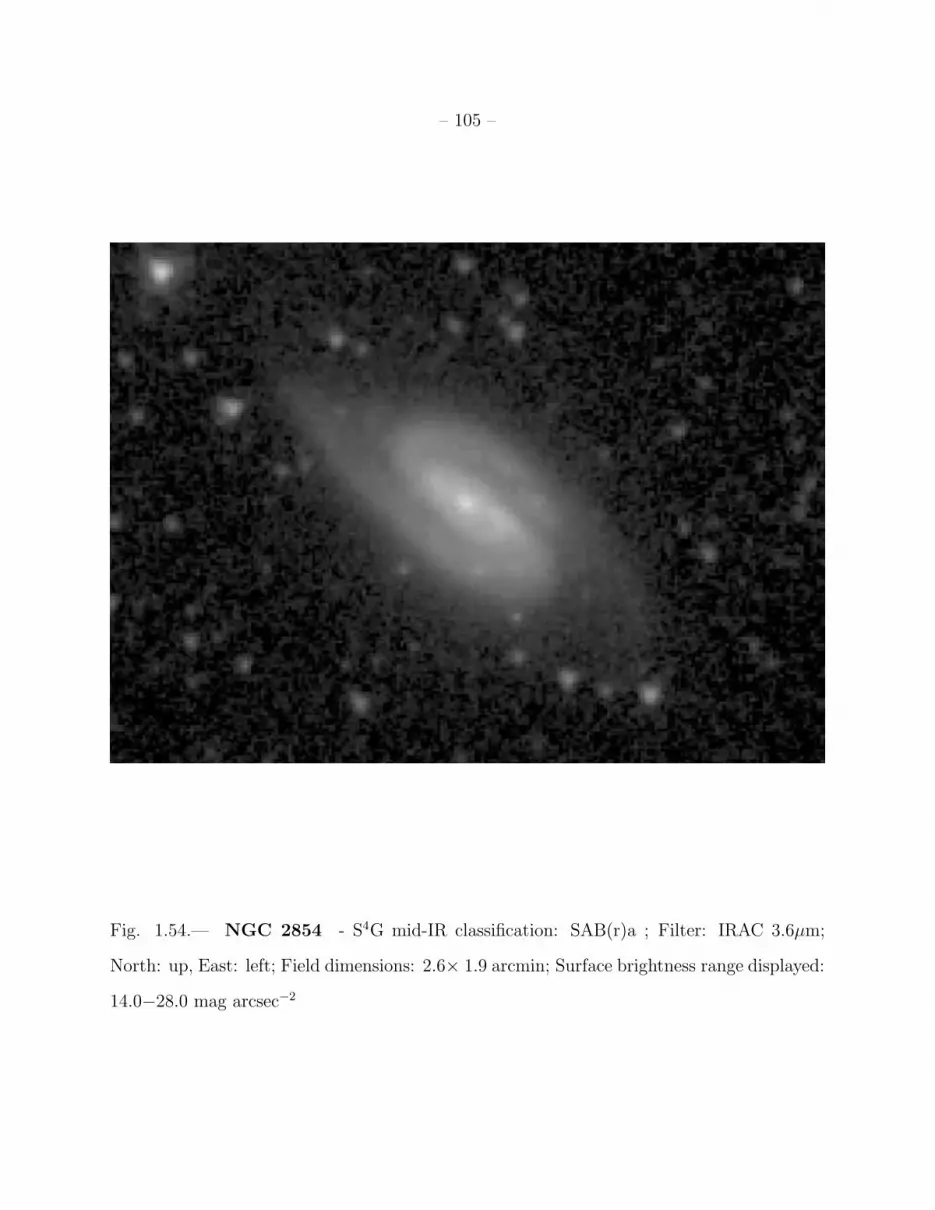
– 105 –
Fig. 1.54.— NGC 2854 - S4G mid-IR classification: SAB(r)a ; Filter: IRAC 3.6µm;
North: up, East: left; Field dimensions: 2.6× 1.9 arcmin; Surface brightness range displayed:
14.0−28.0 mag arcsec−2
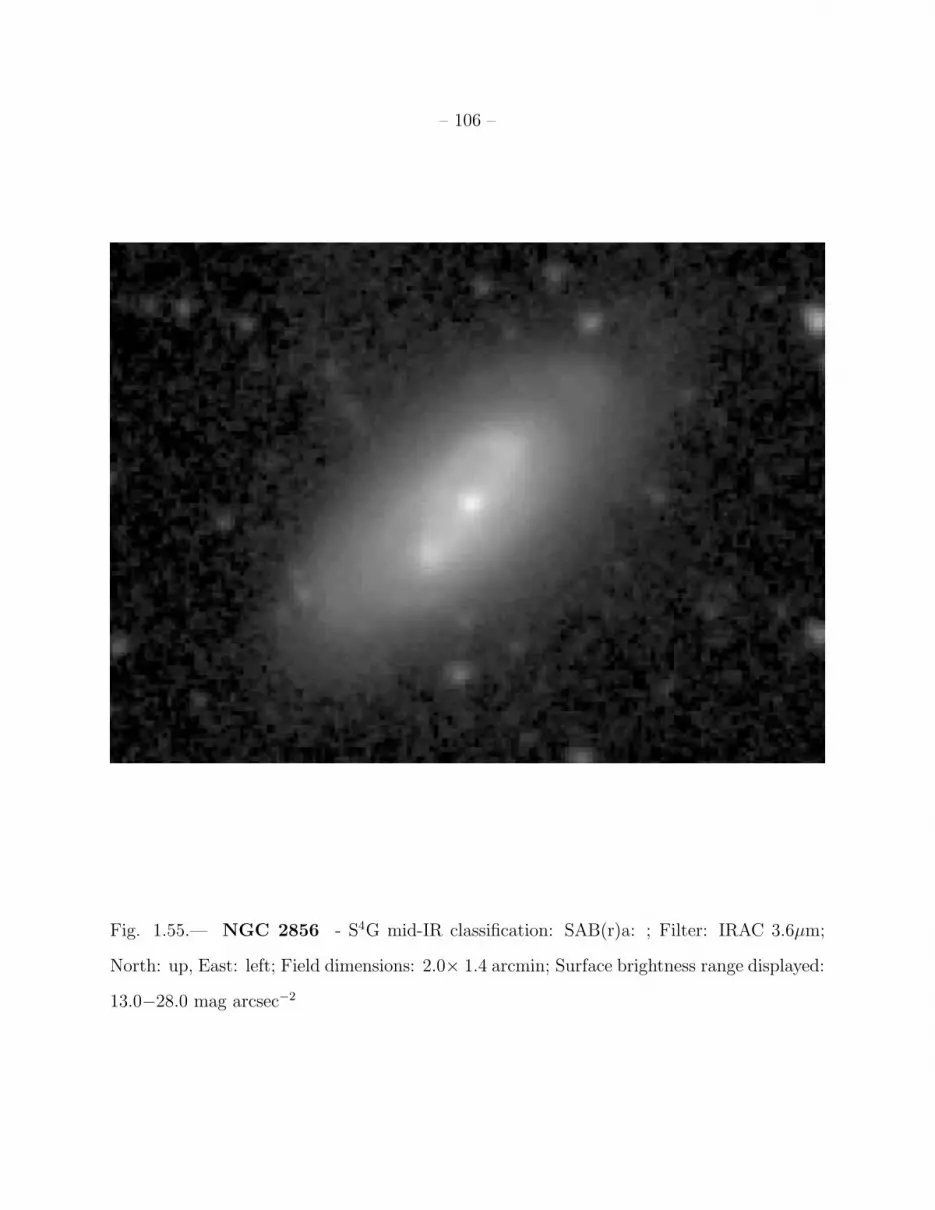
– 106 –
Fig. 1.55.— NGC 2856 - S4G mid-IR classification: SAB(r)a: ; Filter: IRAC 3.6µm;
North: up, East: left; Field dimensions: 2.0× 1.4 arcmin; Surface brightness range displayed:
13.0−28.0 mag arcsec−2

– 107 –
Fig. 1.56.— NGC 2893 - S4G mid-IR classification: (RL)SAB(l)0+ ; Filter: IRAC 3.6µm;
North: up, East: left; Field dimensions: 3.2× 2.3 arcmin; Surface brightness range displayed:
13.0−28.0 mag arcsec−2
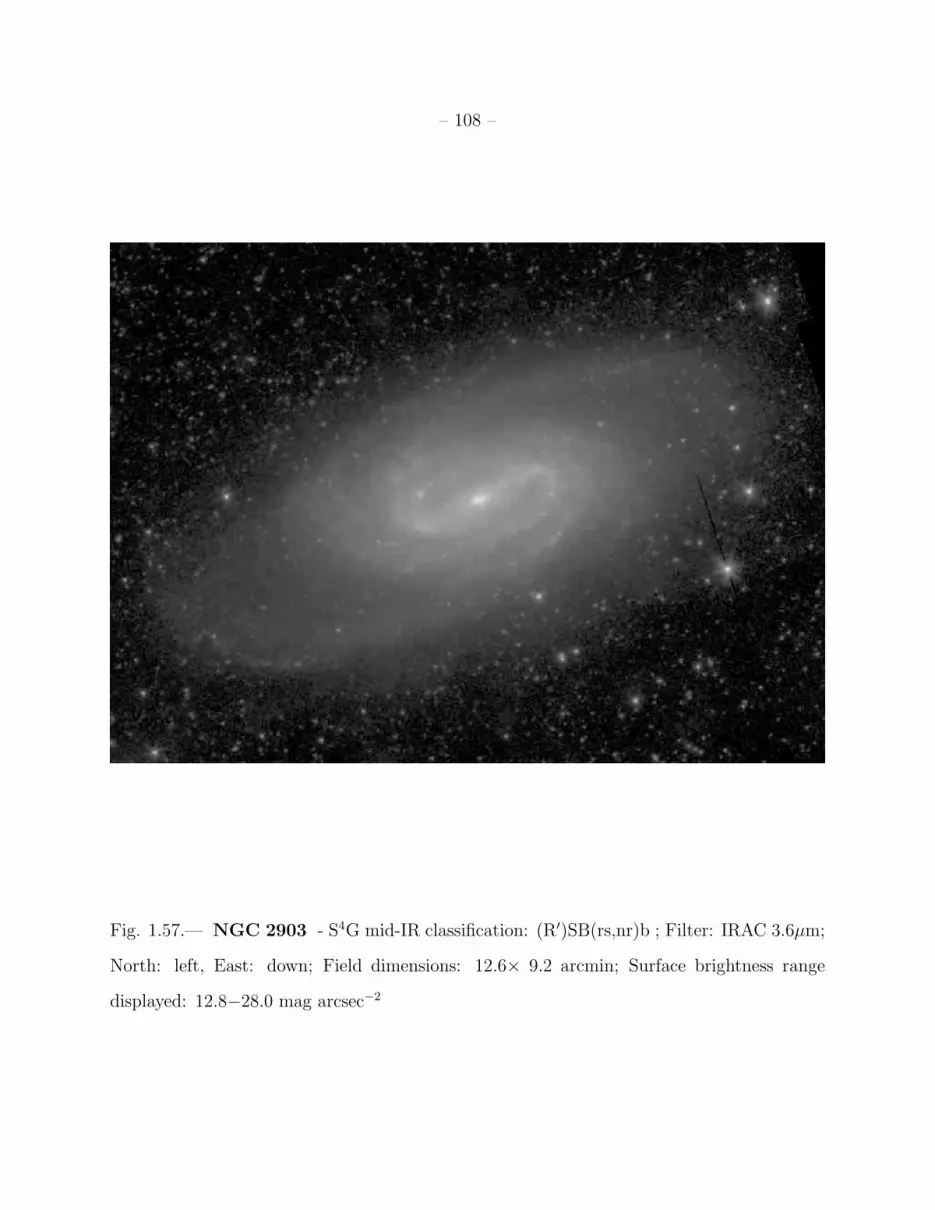
– 108 –
Fig. 1.57.— NGC 2903 - S4G mid-IR classification: (R′)SB(rs,nr)b ; Filter: IRAC 3.6µm;
North: left, East: down; Field dimensions: 12.6× 9.2 arcmin; Surface brightness range
displayed: 12.8−28.0 mag arcsec−2
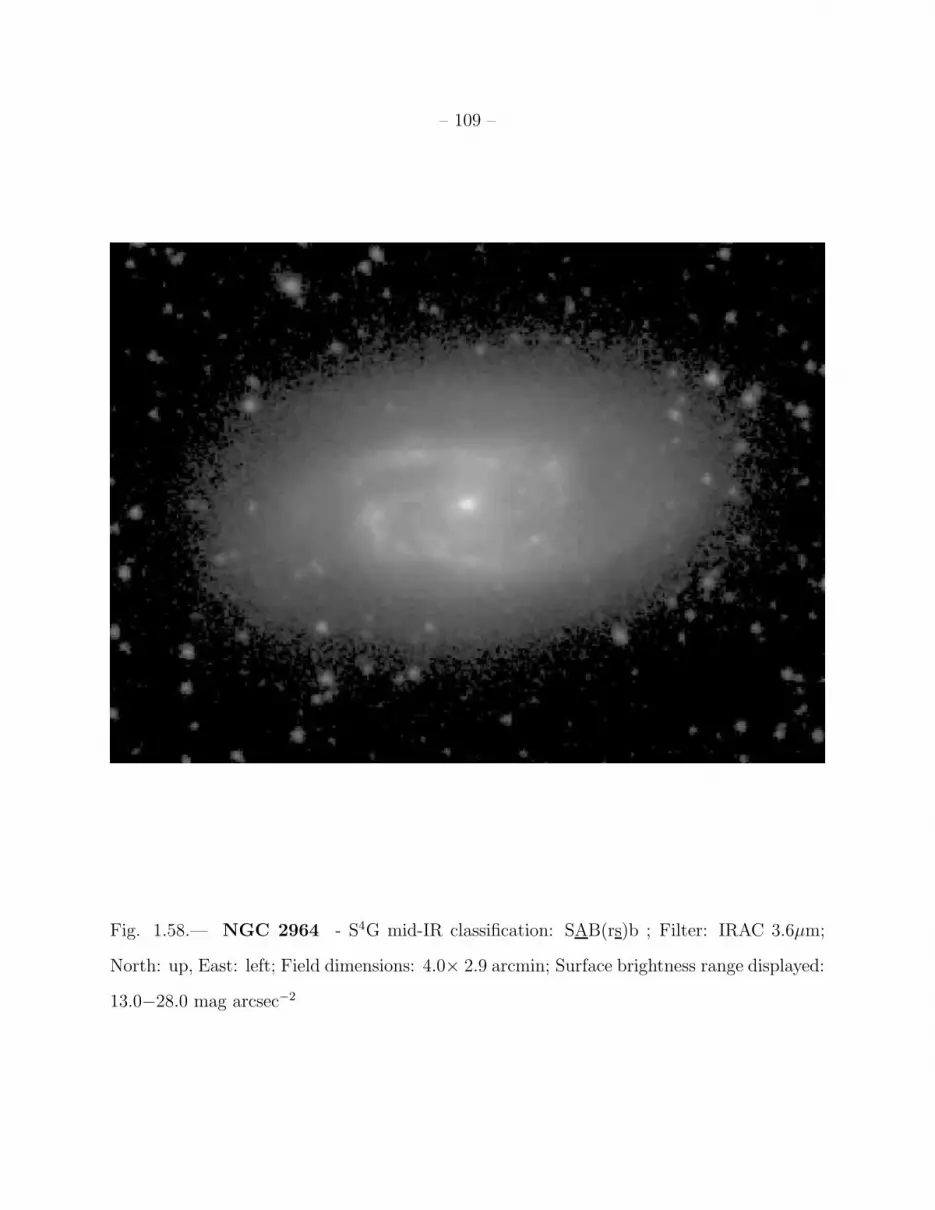
– 109 –
Fig. 1.58.— NGC 2964 - S4G mid-IR classification: SAB(rs)b ; Filter: IRAC 3.6µm;
North: up, East: left; Field dimensions: 4.0× 2.9 arcmin; Surface brightness range displayed:
13.0−28.0 mag arcsec−2
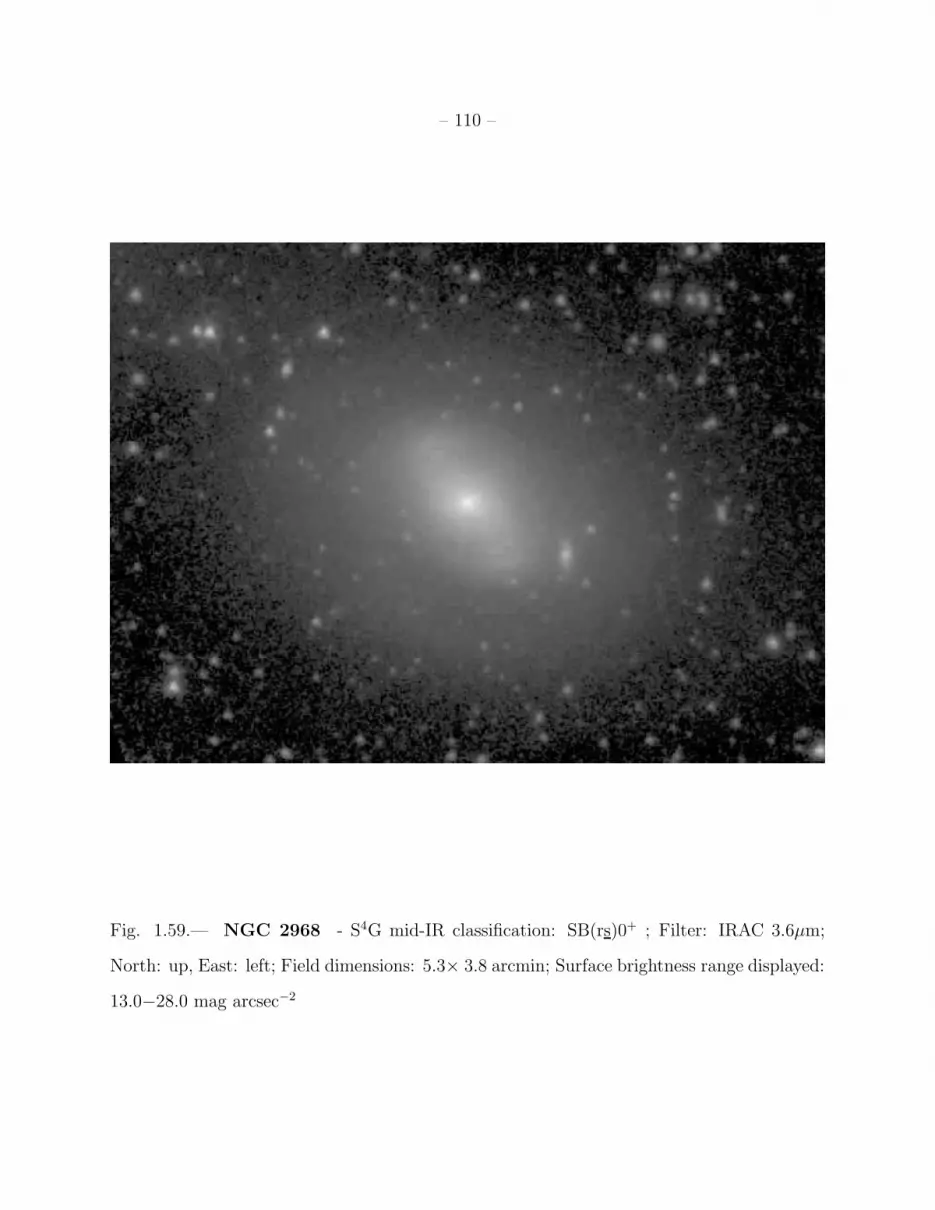
– 110 –
Fig. 1.59.— NGC 2968 - S4G mid-IR classification: SB(rs)0+ ; Filter: IRAC 3.6µm;
North: up, East: left; Field dimensions: 5.3× 3.8 arcmin; Surface brightness range displayed:
13.0−28.0 mag arcsec−2

– 111 –
Fig. 1.60.— NGC 2974 - S4G mid-IR classification: SA(r)0/a ; Filter: IRAC 3.6µm;
North: up, East: left; Field dimensions: 7.9× 5.8 arcmin; Surface brightness range displayed:
13.0−28.0 mag arcsec−2
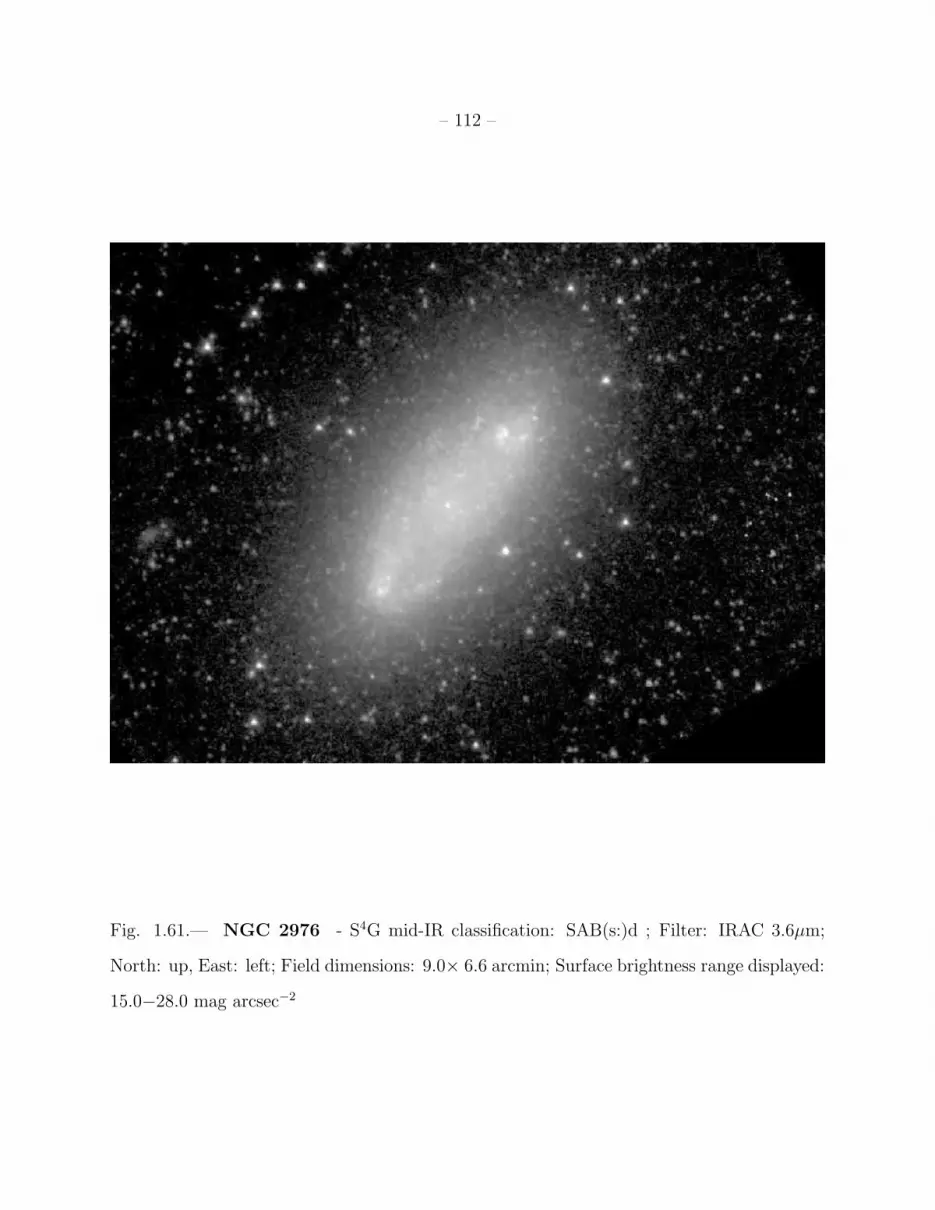
– 112 –
Fig. 1.61.— NGC 2976 - S4G mid-IR classification: SAB(s:)d ; Filter: IRAC 3.6µm;
North: up, East: left; Field dimensions: 9.0× 6.6 arcmin; Surface brightness range displayed:
15.0−28.0 mag arcsec−2

– 113 –
Fig. 1.62.— NGC 3018 (right) and NGC 3023 (left) - S4G mid-IR classifications: SB(s)d,
SB(s)dm, respectively; Filter: IRAC 3.6µm; North: up, East: left; Field dimensions: 5.3×
3.8 arcmin; Surface brightness range displayed: 16.0−28.0 mag arcsec−2

– 114 –
Fig. 1.63.— NGC 3049 - S4Gmid-IR classification: SB(s)ab: ; Filter: IRAC 3.6µm; North:
left, East: down; Field dimensions: 3.2× 2.3 arcmin; Surface brightness range displayed:
14.5−28.0 mag arcsec−2
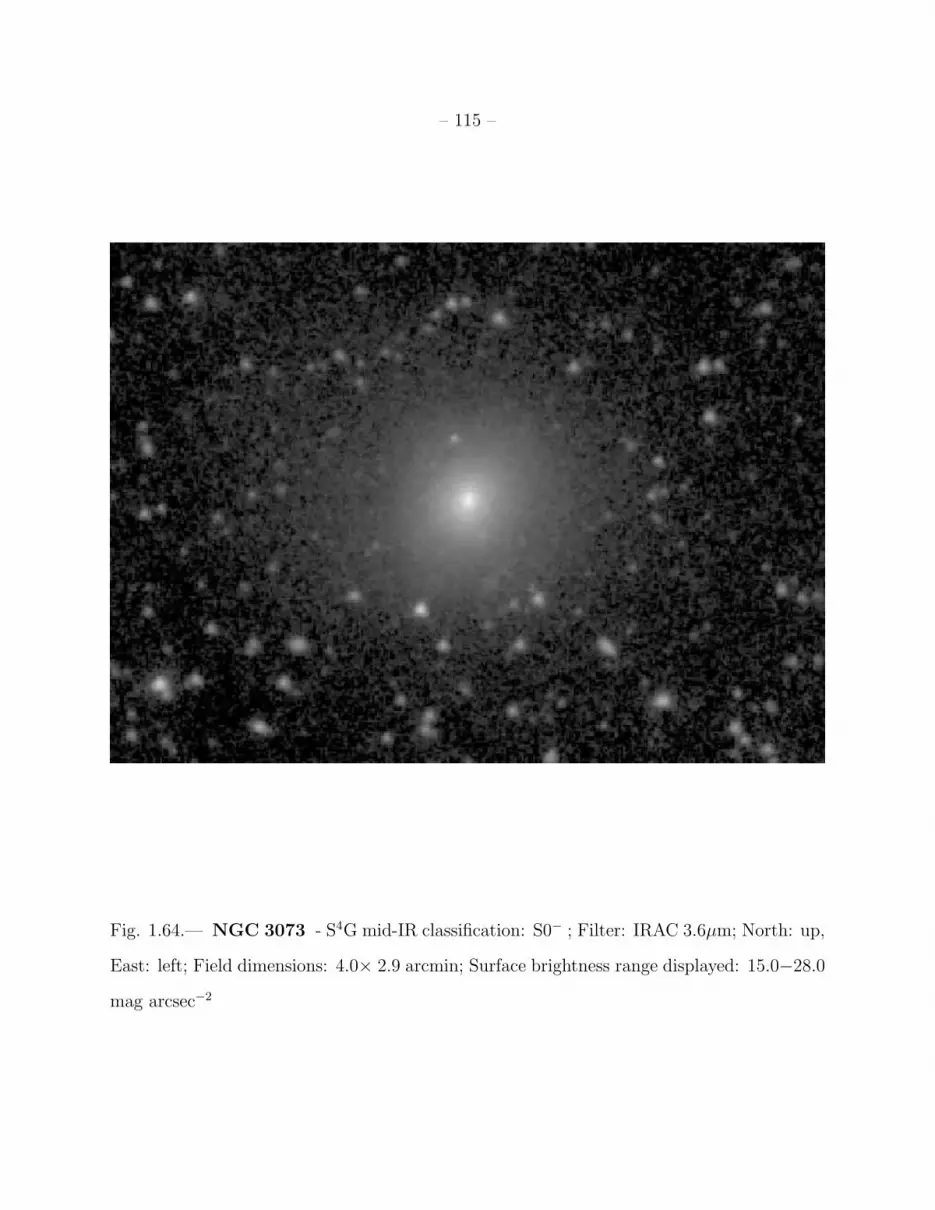
– 115 –
Fig. 1.64.— NGC 3073 - S4G mid-IR classification: S0− ; Filter: IRAC 3.6µm; North: up,
East: left; Field dimensions: 4.0× 2.9 arcmin; Surface brightness range displayed: 15.0−28.0
mag arcsec−2
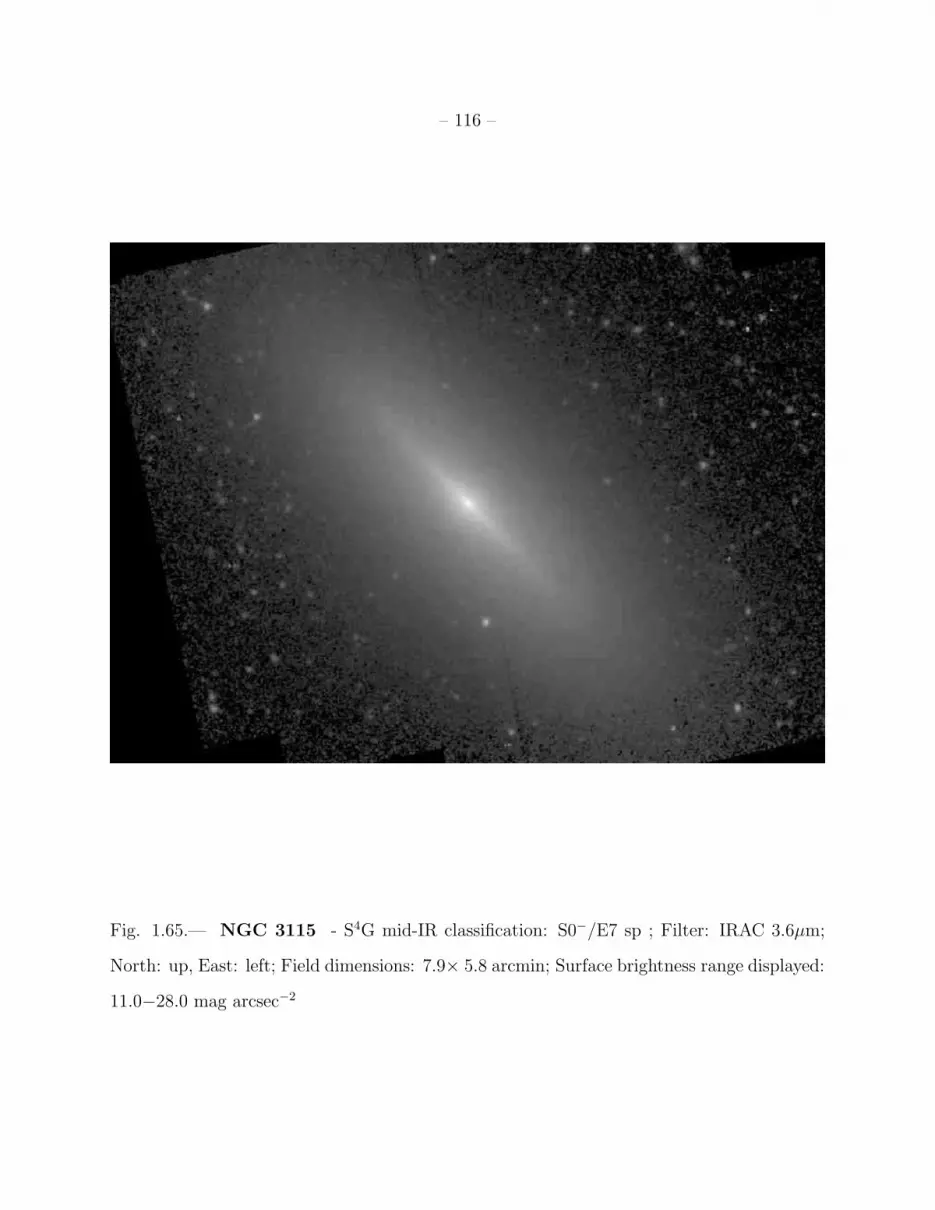
– 116 –
Fig. 1.65.— NGC 3115 - S4G mid-IR classification: S0−/E7 sp ; Filter: IRAC 3.6µm;
North: up, East: left; Field dimensions: 7.9× 5.8 arcmin; Surface brightness range displayed:
11.0−28.0 mag arcsec−2

– 117 –
Fig. 1.66.— NGC 3147 - S4G mid-IR classification: SAB(rs)b ; Filter: IRAC 3.6µm;
North: left, East: down; Field dimensions: 5.6× 4.1 arcmin; Surface brightness range dis-
played: 12.0−28.0 mag arcsec−2
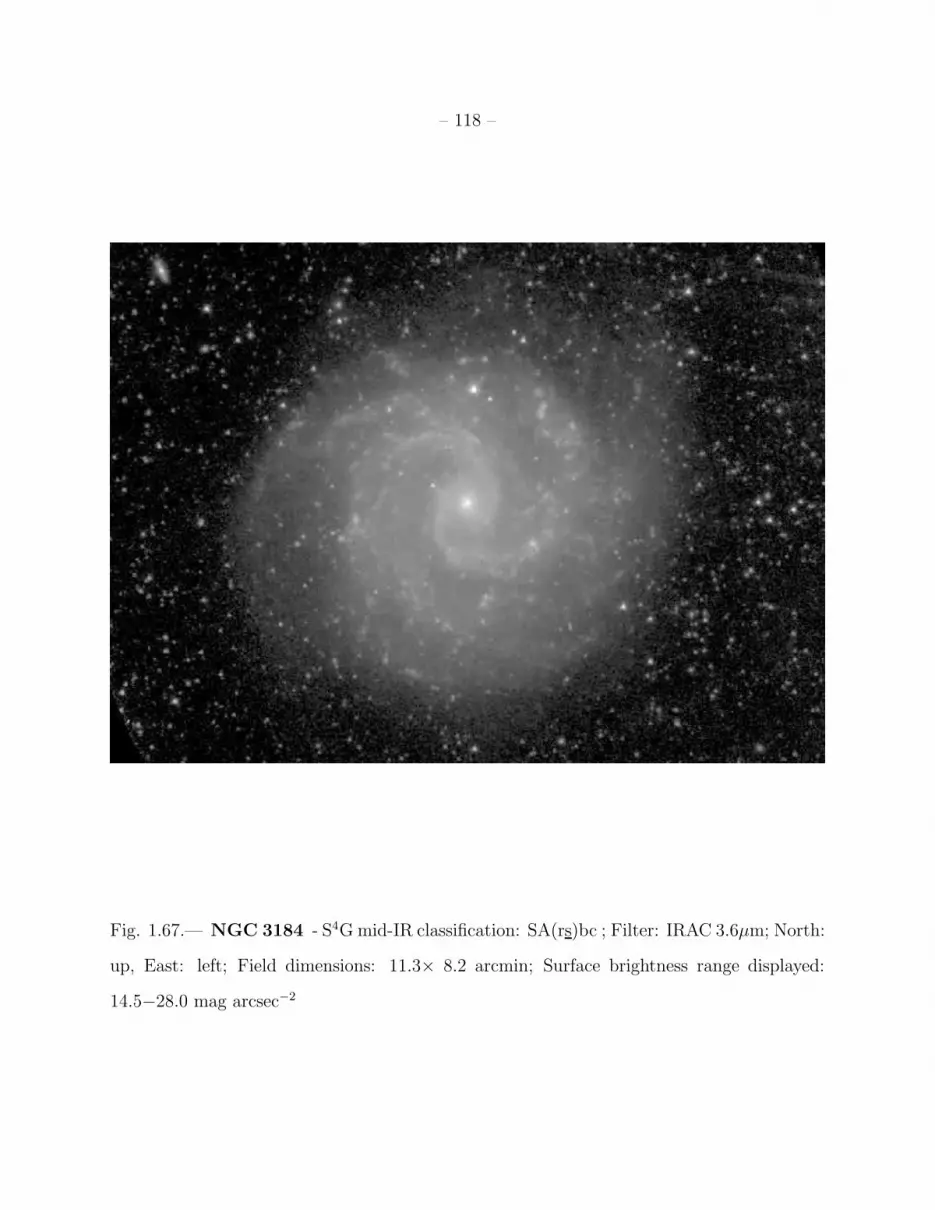
– 118 –
Fig. 1.67.— NGC 3184 - S4Gmid-IR classification: SA(rs)bc ; Filter: IRAC 3.6µm; North:
up, East: left; Field dimensions: 11.3× 8.2 arcmin; Surface brightness range displayed:
14.5−28.0 mag arcsec−2
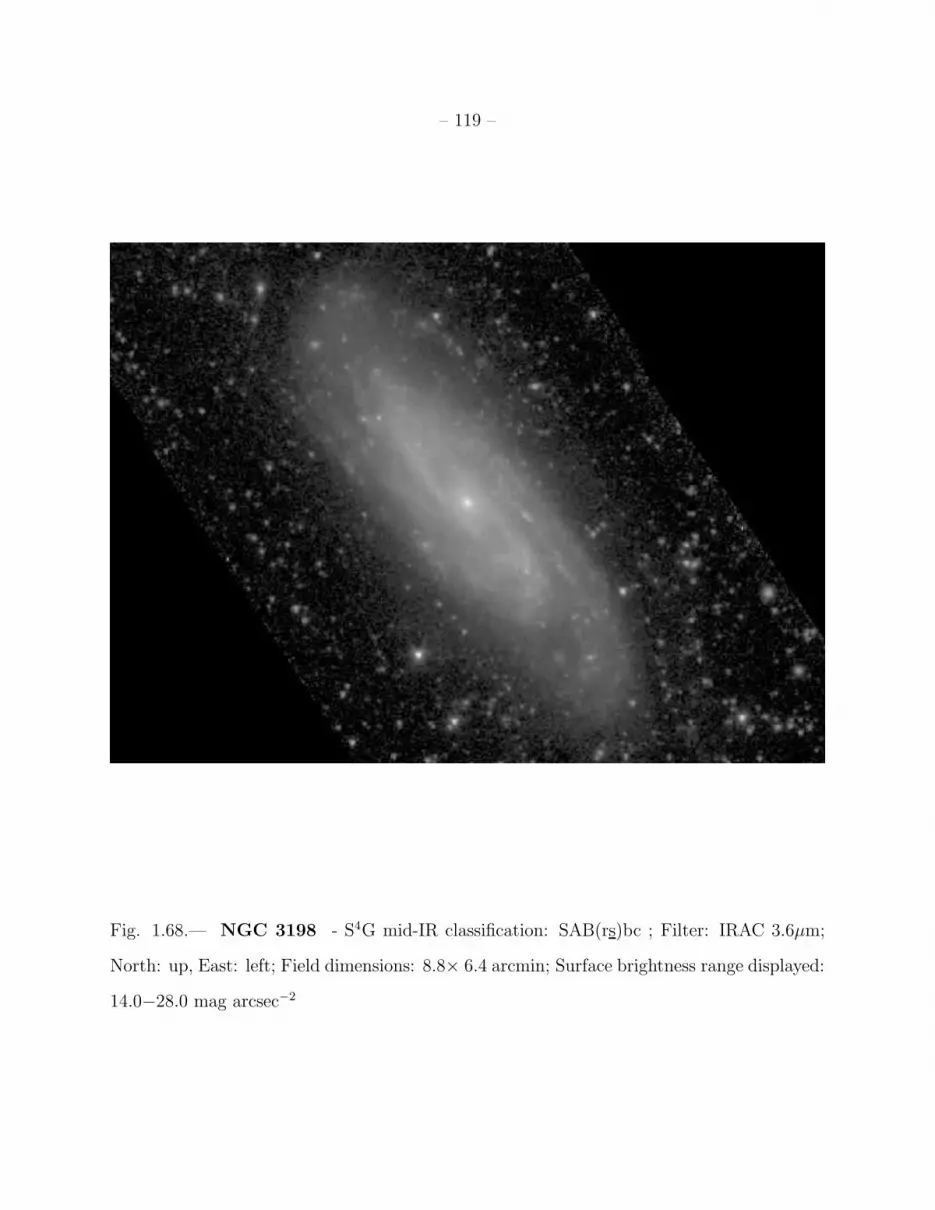
– 119 –
Fig. 1.68.— NGC 3198 - S4G mid-IR classification: SAB(rs)bc ; Filter: IRAC 3.6µm;
North: up, East: left; Field dimensions: 8.8× 6.4 arcmin; Surface brightness range displayed:
14.0−28.0 mag arcsec−2

– 120 –
Fig. 1.69.— NGC 3299 - S4G mid-IR classification: SABd: ; Filter: IRAC 3.6µm; North:
left, East: down; Field dimensions: 3.2× 2.3 arcmin; Surface brightness range displayed:
18.5−28.0 mag arcsec−2
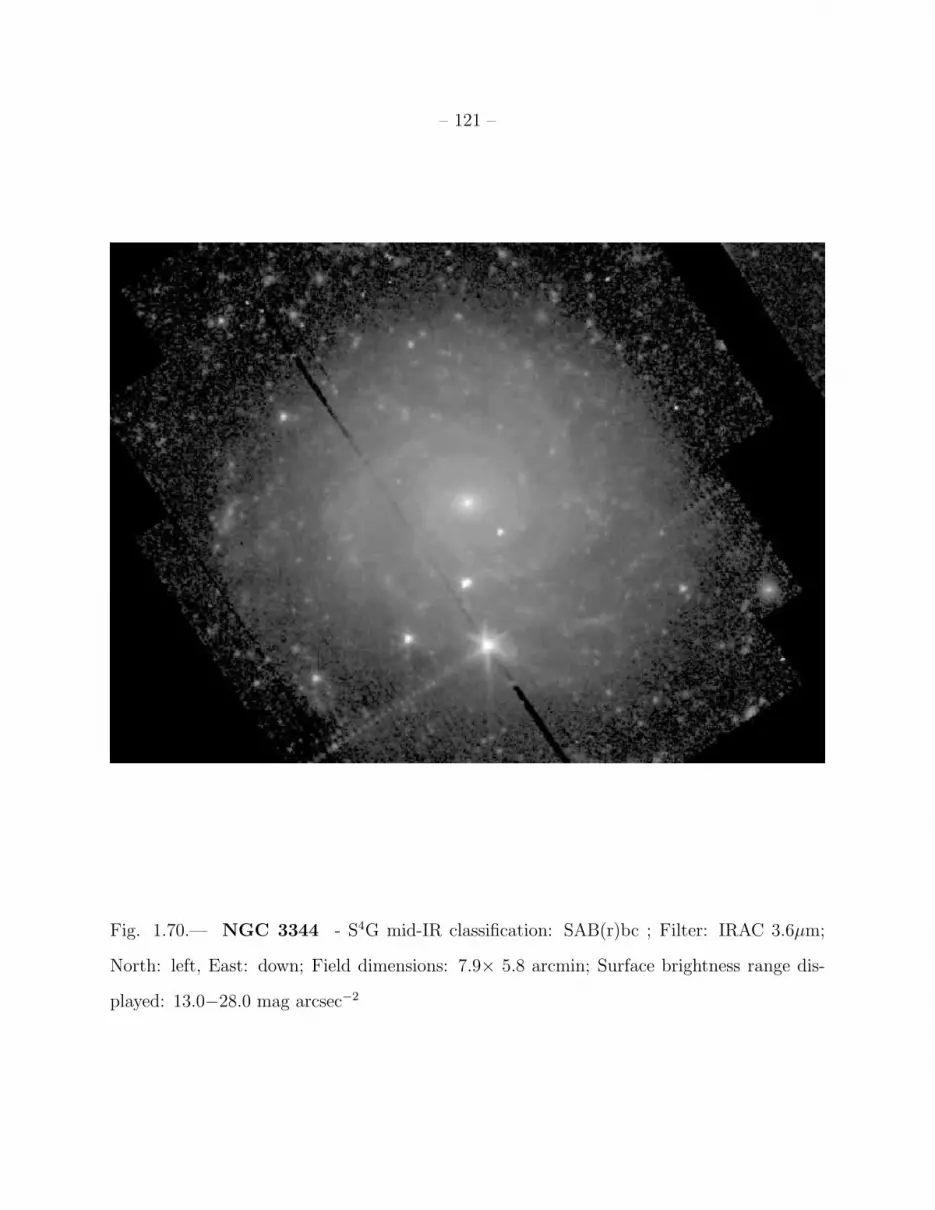
– 121 –
Fig. 1.70.— NGC 3344 - S4G mid-IR classification: SAB(r)bc ; Filter: IRAC 3.6µm;
North: left, East: down; Field dimensions: 7.9× 5.8 arcmin; Surface brightness range dis-
played: 13.0−28.0 mag arcsec−2

– 122 –
Fig. 1.71.— NGC 3351 - S4G mid-IR classification: (R′)SB(r,nr)a ; Filter: IRAC 3.6µm;
North: left, East: down; Field dimensions: 10.5× 7.6 arcmin; Surface brightness range
displayed: 13.5−28.0 mag arcsec−2
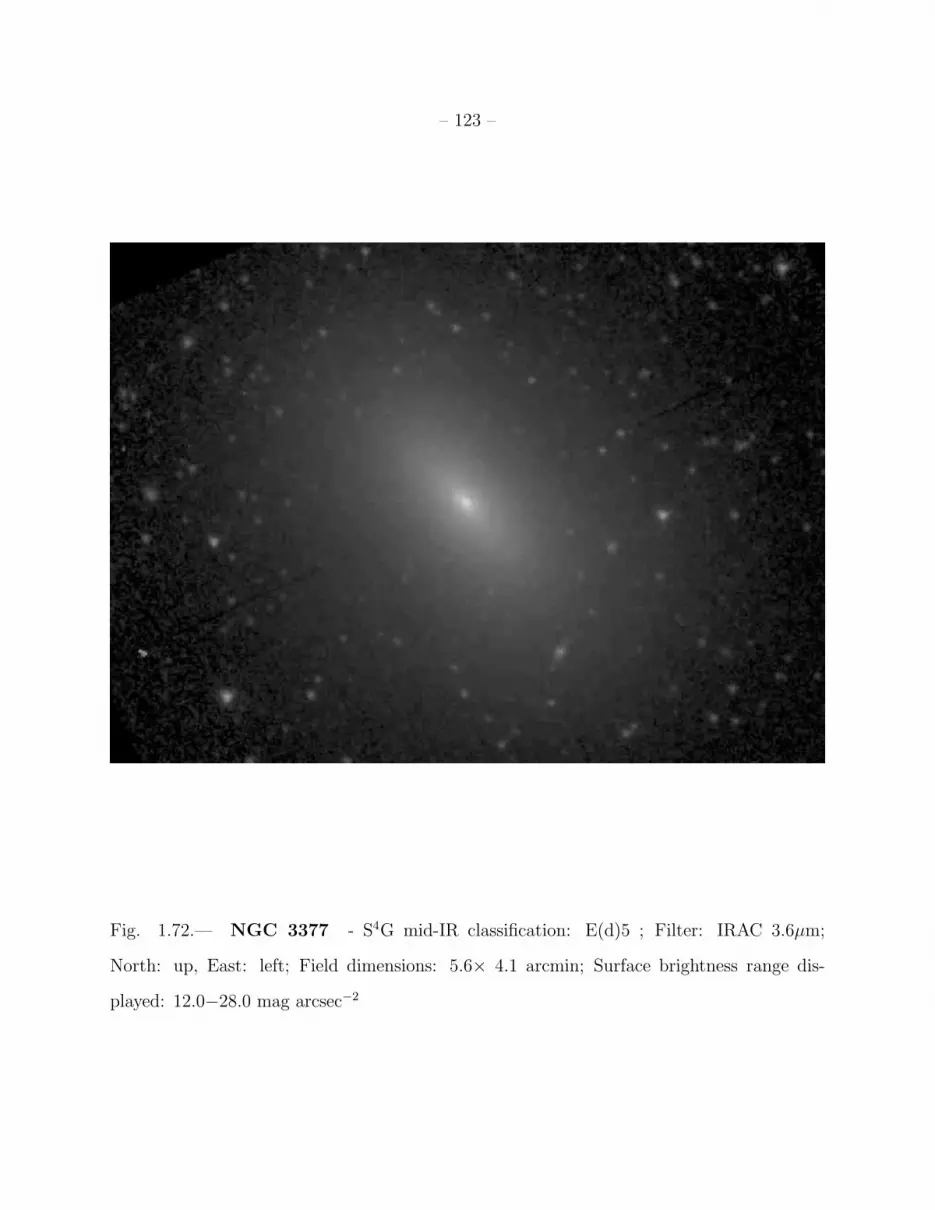
– 123 –
Fig. 1.72.— NGC 3377 - S4G mid-IR classification: E(d)5 ; Filter: IRAC 3.6µm;
North: up, East: left; Field dimensions: 5.6× 4.1 arcmin; Surface brightness range dis-
played: 12.0−28.0 mag arcsec−2
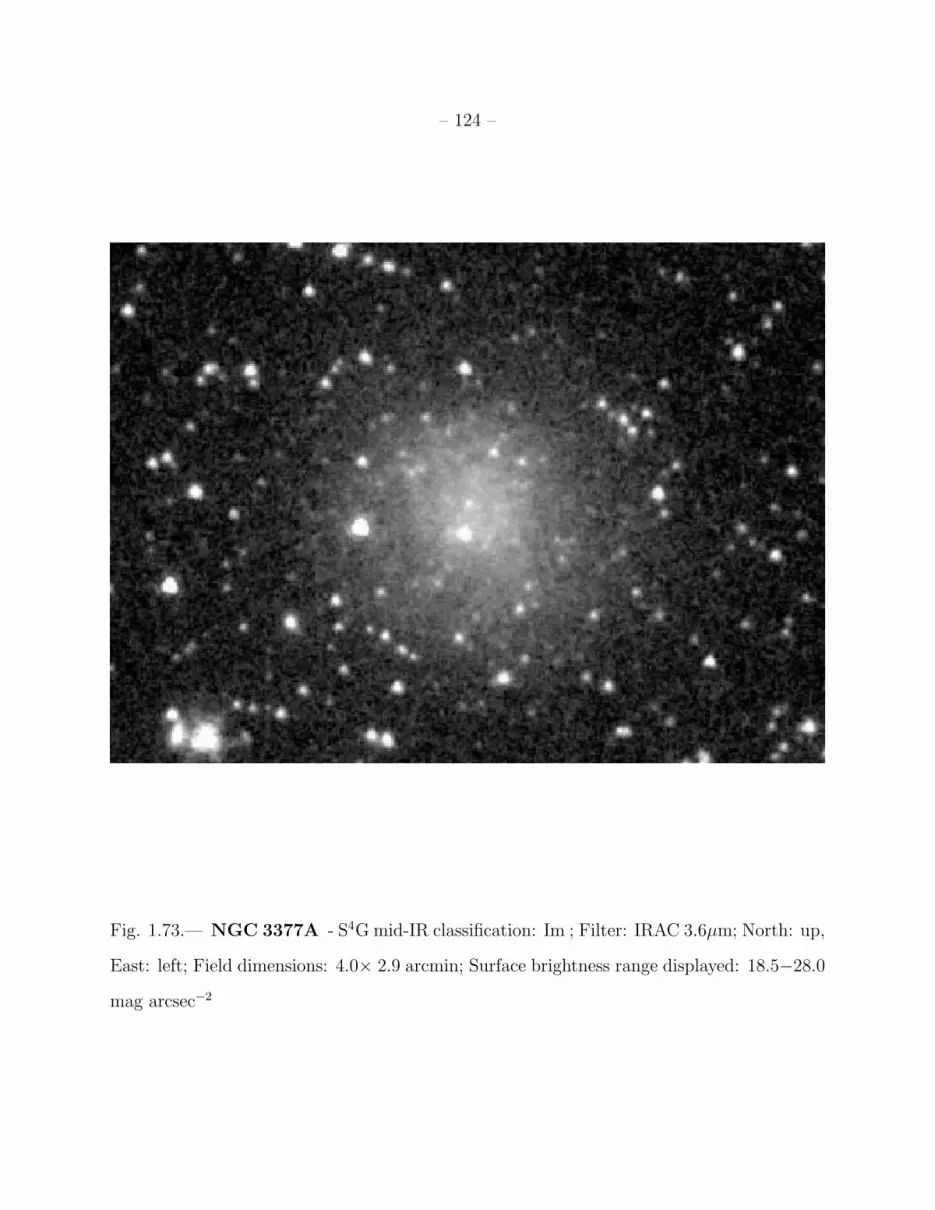
– 124 –
Fig. 1.73.— NGC 3377A - S4Gmid-IR classification: Im ; Filter: IRAC 3.6µm; North: up,
East: left; Field dimensions: 4.0× 2.9 arcmin; Surface brightness range displayed: 18.5−28.0
mag arcsec−2
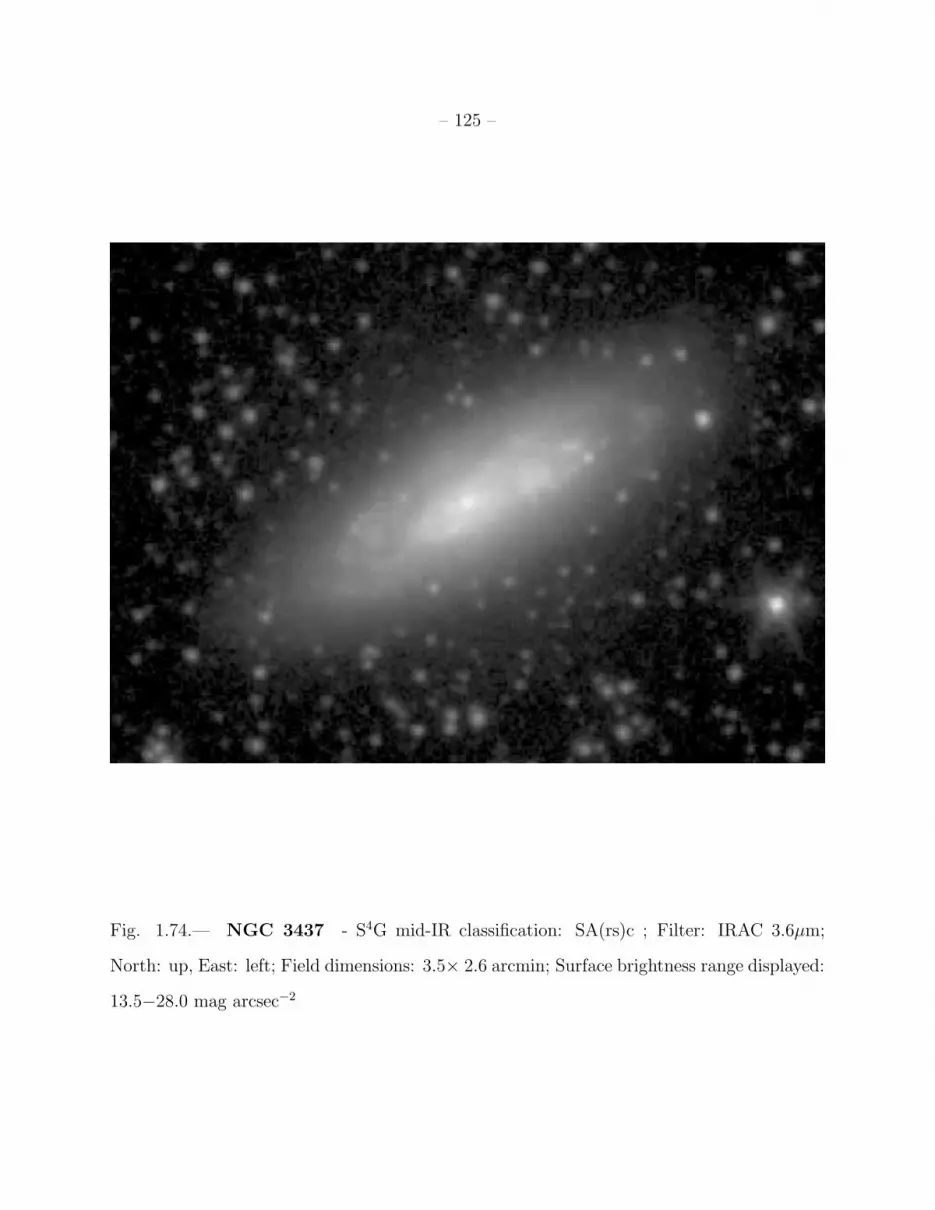
– 125 –
Fig. 1.74.— NGC 3437 - S4G mid-IR classification: SA(rs)c ; Filter: IRAC 3.6µm;
North: up, East: left; Field dimensions: 3.5× 2.6 arcmin; Surface brightness range displayed:
13.5−28.0 mag arcsec−2

– 126 –
Fig. 1.75.— NGC 3489 - S4G mid-IR classification: (R)SB(r:)0o ; Filter: IRAC 3.6µm;
North: up, East: left; Field dimensions: 4.5× 3.3 arcmin; Surface brightness range displayed:
11.5−28.0 mag arcsec−2
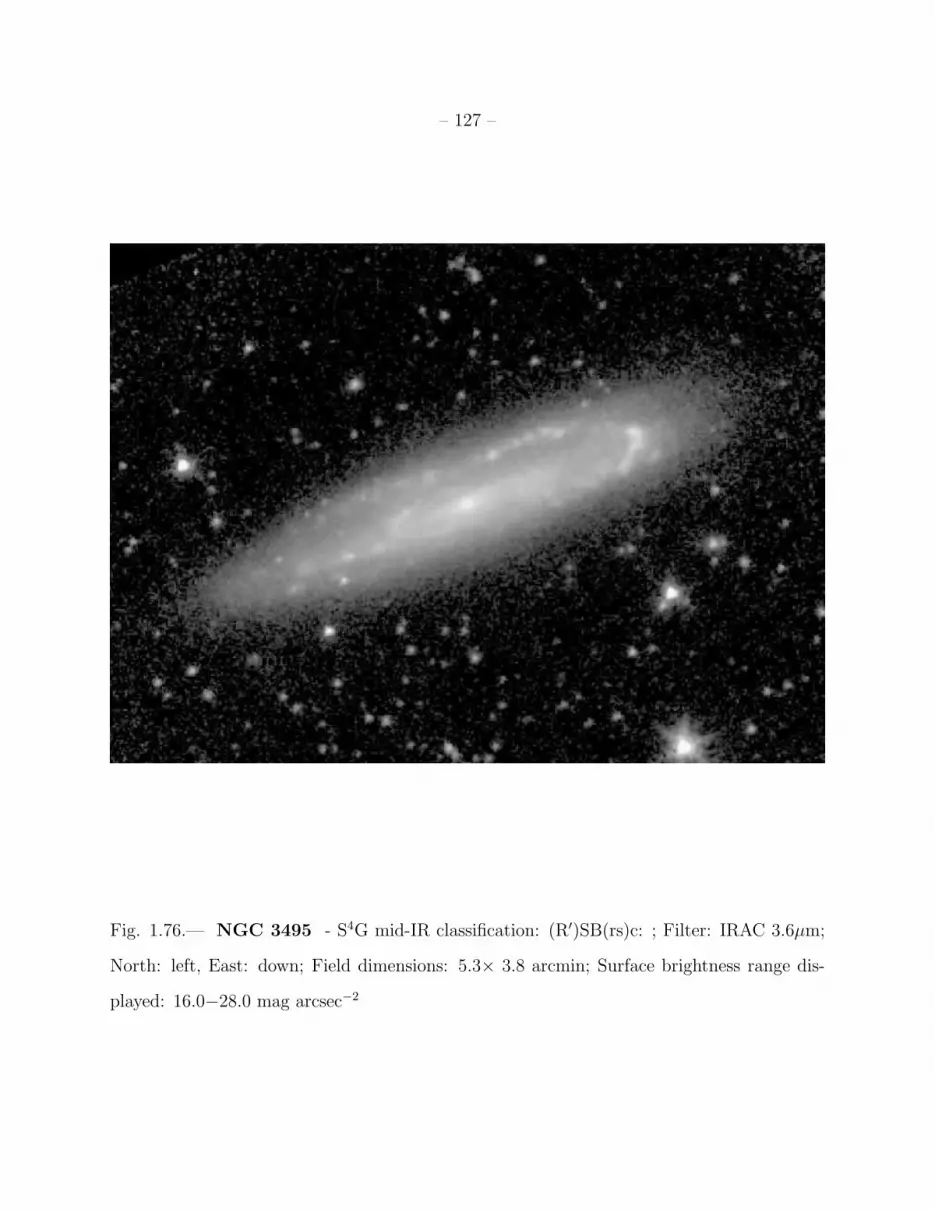
– 127 –
Fig. 1.76.— NGC 3495 - S4G mid-IR classification: (R′)SB(rs)c: ; Filter: IRAC 3.6µm;
North: left, East: down; Field dimensions: 5.3× 3.8 arcmin; Surface brightness range dis-
played: 16.0−28.0 mag arcsec−2
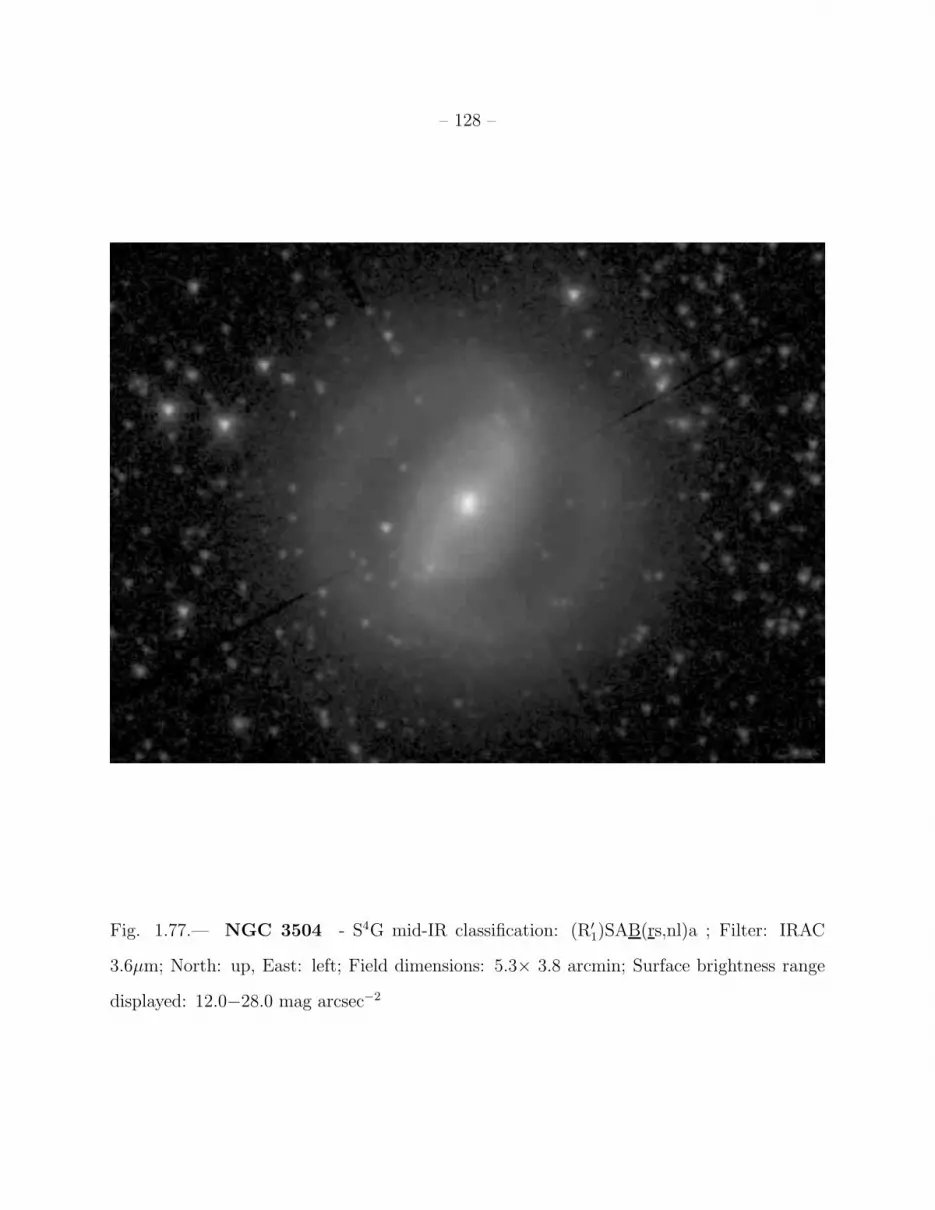
– 128 –
Fig. 1.77.— NGC 3504 - S4G mid-IR classification: (R′
1)SAB(rs,nl)a ; Filter: IRAC
3.6µm; North: up, East: left; Field dimensions: 5.3× 3.8 arcmin; Surface brightness range
displayed: 12.0−28.0 mag arcsec−2

– 129 –
Fig. 1.78.— NGC 3512 - S4G mid-IR classification: SA(s)bc ; Filter: IRAC 3.6µm;
North: up, East: left; Field dimensions: 2.9× 2.1 arcmin; Surface brightness range displayed:
14.5−28.0 mag arcsec−2
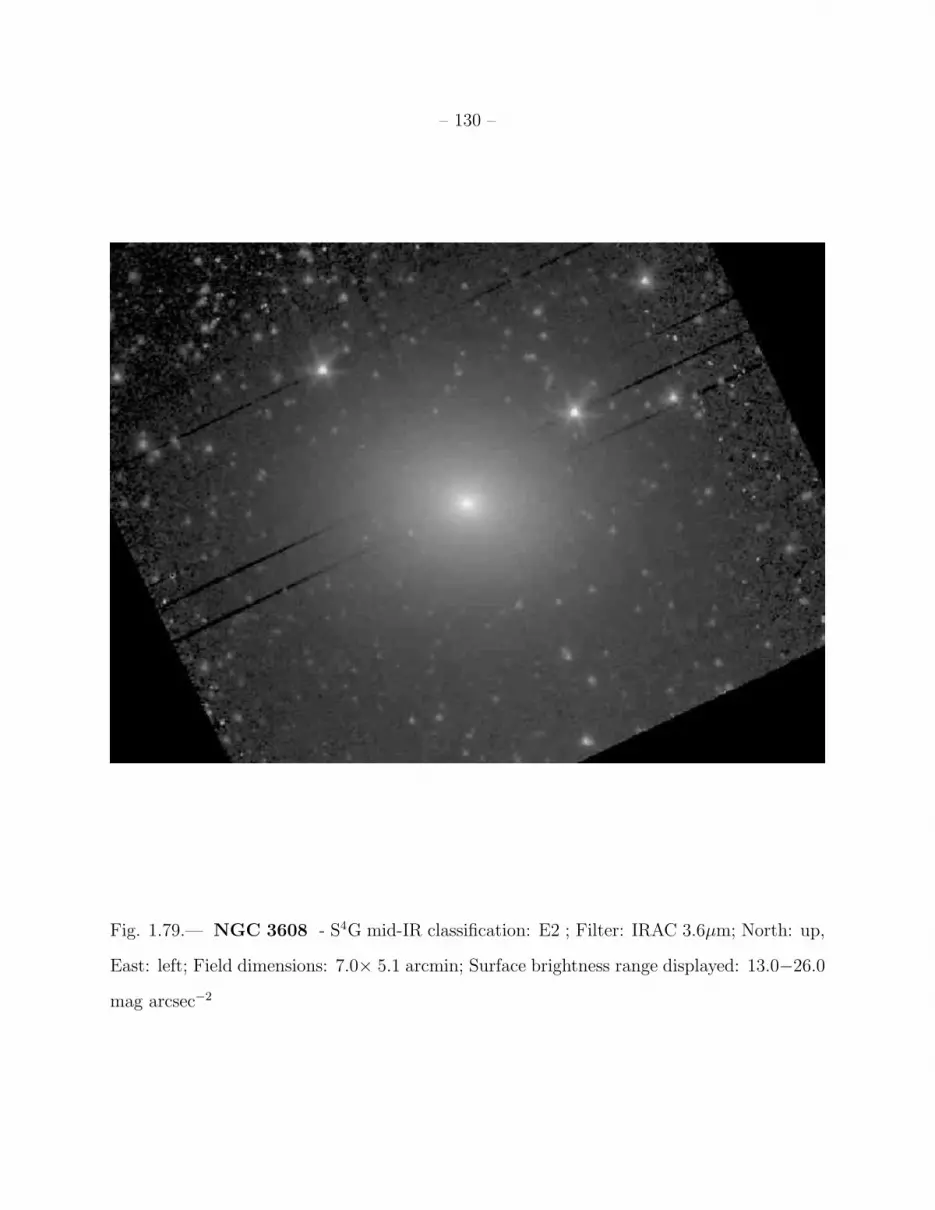
– 130 –
Fig. 1.79.— NGC 3608 - S4G mid-IR classification: E2 ; Filter: IRAC 3.6µm; North: up,
East: left; Field dimensions: 7.0× 5.1 arcmin; Surface brightness range displayed: 13.0−26.0
mag arcsec−2

– 131 –
Fig. 1.80.— NGC 3627 - S4G mid-IR classification: SB(s)b pec ; Filter: IRAC 3.6µm;
North: left, East: down; Field dimensions: 12.6× 9.2 arcmin; Surface brightness range
displayed: 12.0−28.0 mag arcsec−2
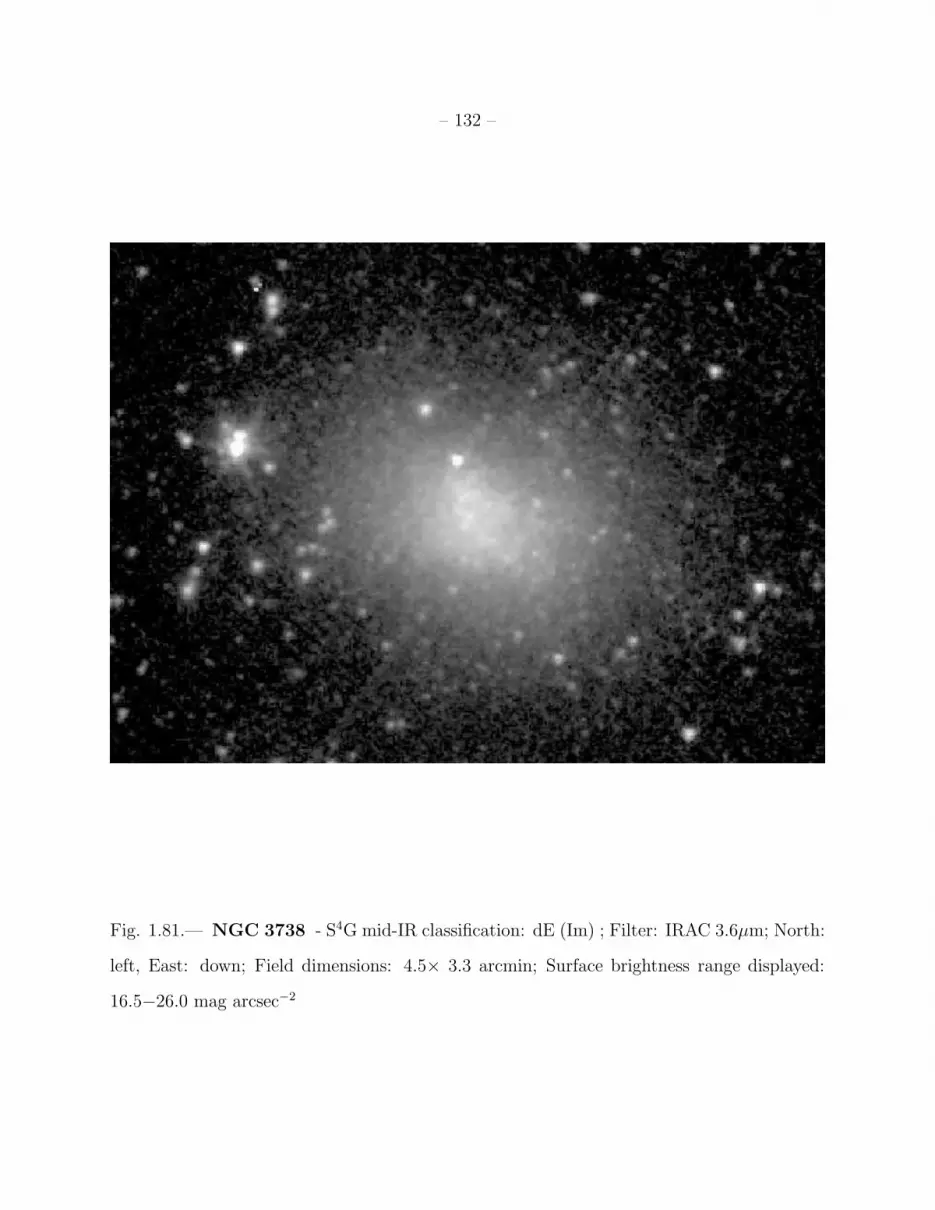
– 132 –
Fig. 1.81.— NGC 3738 - S4G mid-IR classification: dE (Im) ; Filter: IRAC 3.6µm; North:
left, East: down; Field dimensions: 4.5× 3.3 arcmin; Surface brightness range displayed:
16.5−26.0 mag arcsec−2
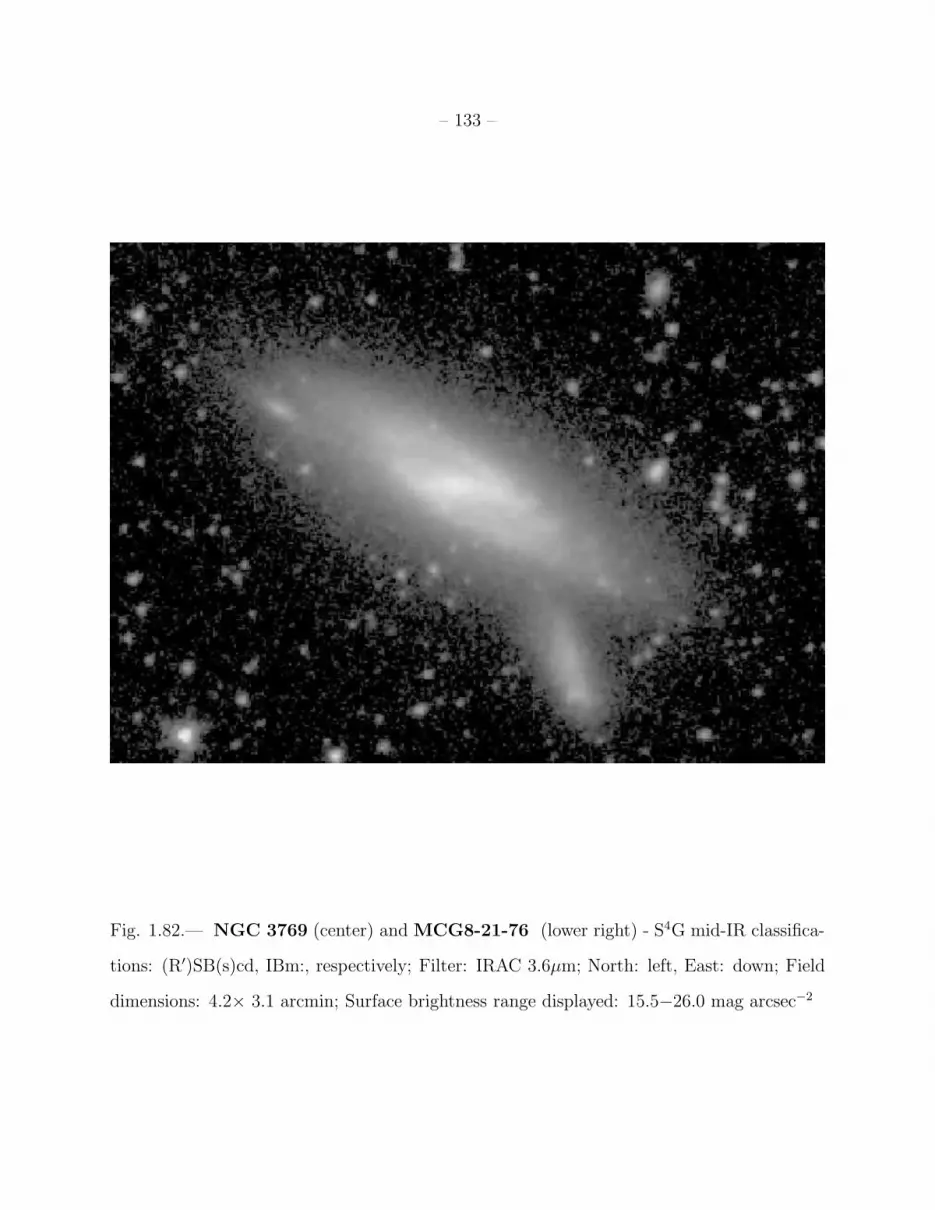
– 133 –
Fig. 1.82.— NGC 3769 (center) and MCG8-21-76 (lower right) - S4G mid-IR classifica-
tions: (R′)SB(s)cd, IBm:, respectively; Filter: IRAC 3.6µm; North: left, East: down; Field
dimensions: 4.2× 3.1 arcmin; Surface brightness range displayed: 15.5−26.0 mag arcsec−2

– 134 –
Fig. 1.83.— NGC 3794 - S4G mid-IR classification: SAB(s)dm ; Filter: IRAC 3.6µm;
North: up, East: left; Field dimensions: 3.5× 2.6 arcmin; Surface brightness range displayed:
17.0−26.0 mag arcsec−2

– 135 –
Fig. 1.84.— NGC 3870 - S4G mid-IR classification: SB(rs)0o? ; Filter: IRAC 3.6µm;
North: left, East: down; Field dimensions: 4.5× 3.3 arcmin; Surface brightness range dis-
played: 15.0−28.0 mag arcsec−2

– 136 –
Fig. 1.85.— NGC 3906 - S4Gmid-IR classification: SB(l)dm ; Filter: IRAC 3.6µm; North:
left, East: down; Field dimensions: 2.9× 2.1 arcmin; Surface brightness range displayed:
17.0−28.0 mag arcsec−2
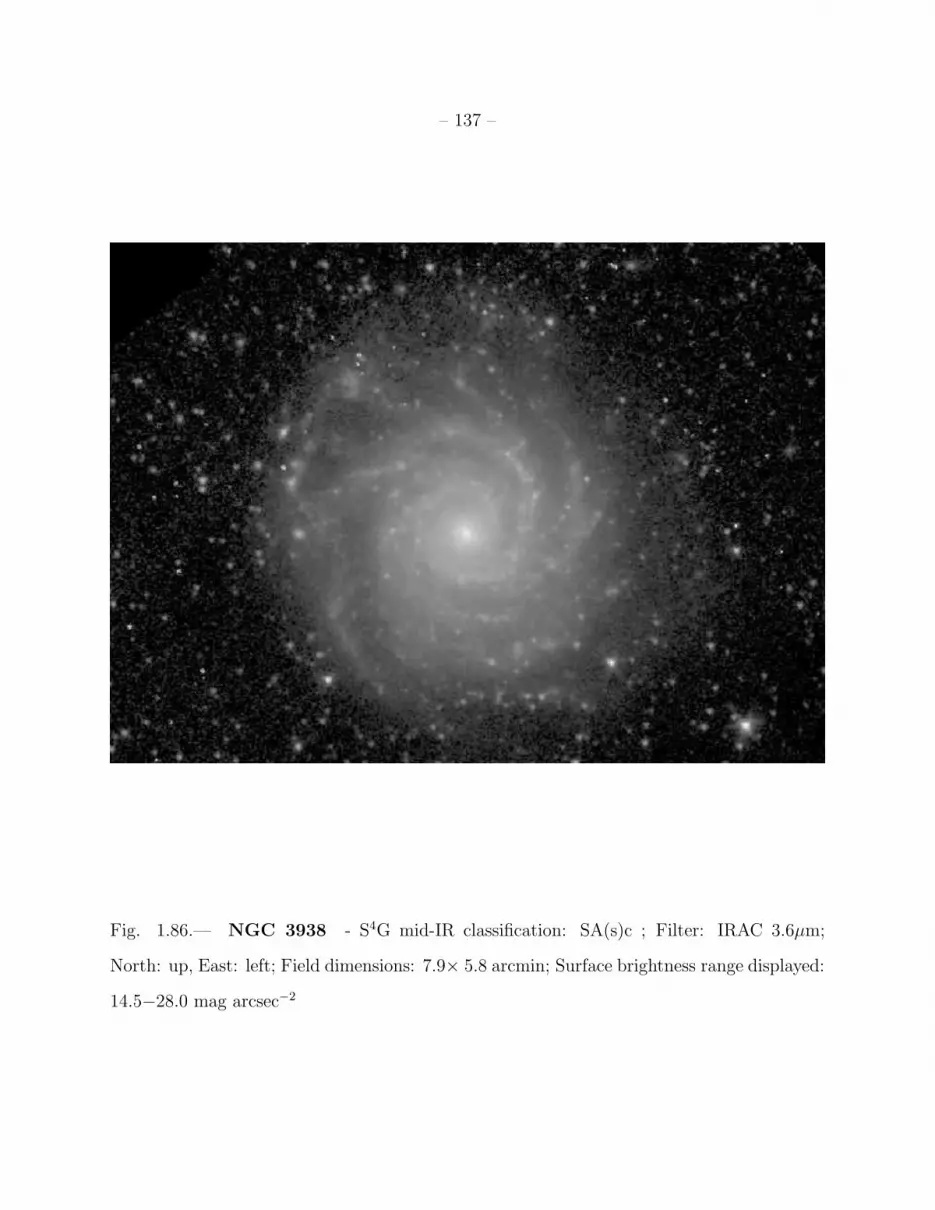
– 137 –
Fig. 1.86.— NGC 3938 - S4G mid-IR classification: SA(s)c ; Filter: IRAC 3.6µm;
North: up, East: left; Field dimensions: 7.9× 5.8 arcmin; Surface brightness range displayed:
14.5−28.0 mag arcsec−2

– 138 –
Fig. 1.87.— NGC 3953 - S4G mid-IR classification: SB(r)bc ; Filter: IRAC 3.6µm; North:
left, East: down; Field dimensions: 9.0× 6.6 arcmin; Surface brightness range displayed:
13.0−28.0 mag arcsec−2

– 139 –
Fig. 1.88.— NGC 4020 - S4Gmid-IR classification: SAB(s)d ; Filter: IRAC 3.6µm; North:
left, East: down; Field dimensions: 3.5× 2.6 arcmin; Surface brightness range displayed:
17.0−28.0 mag arcsec−2
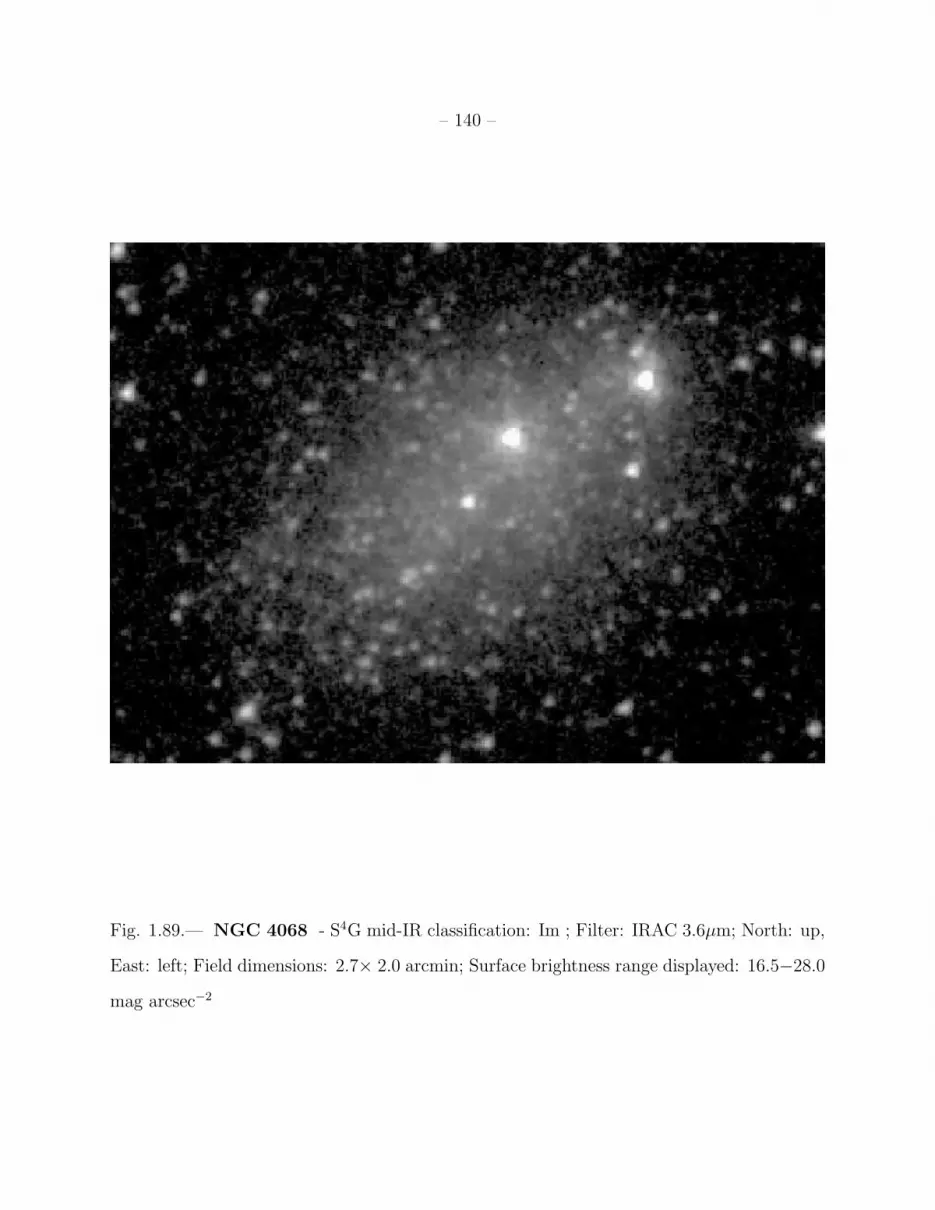
– 140 –
Fig. 1.89.— NGC 4068 - S4G mid-IR classification: Im ; Filter: IRAC 3.6µm; North: up,
East: left; Field dimensions: 2.7× 2.0 arcmin; Surface brightness range displayed: 16.5−28.0
mag arcsec−2

– 141 –
Fig. 1.90.— NGC 4117 - S4G mid-IR classification: S0− sp ; Filter: IRAC 3.6µm; North:
left, East: down; Field dimensions: 2.9× 2.1 arcmin; Surface brightness range displayed:
14.0−28.0 mag arcsec−2
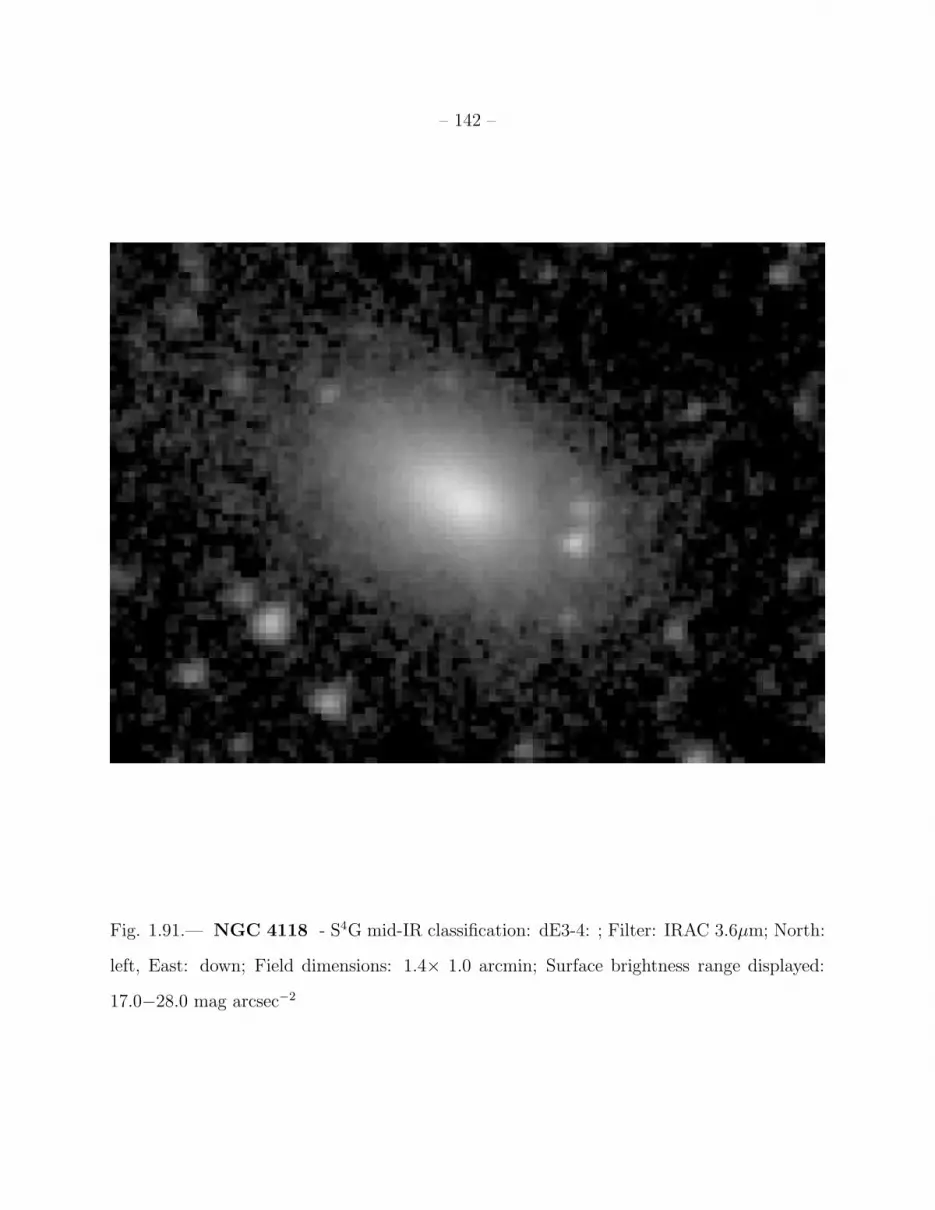
– 142 –
Fig. 1.91.— NGC 4118 - S4G mid-IR classification: dE3-4: ; Filter: IRAC 3.6µm; North:
left, East: down; Field dimensions: 1.4× 1.0 arcmin; Surface brightness range displayed:
17.0−28.0 mag arcsec−2
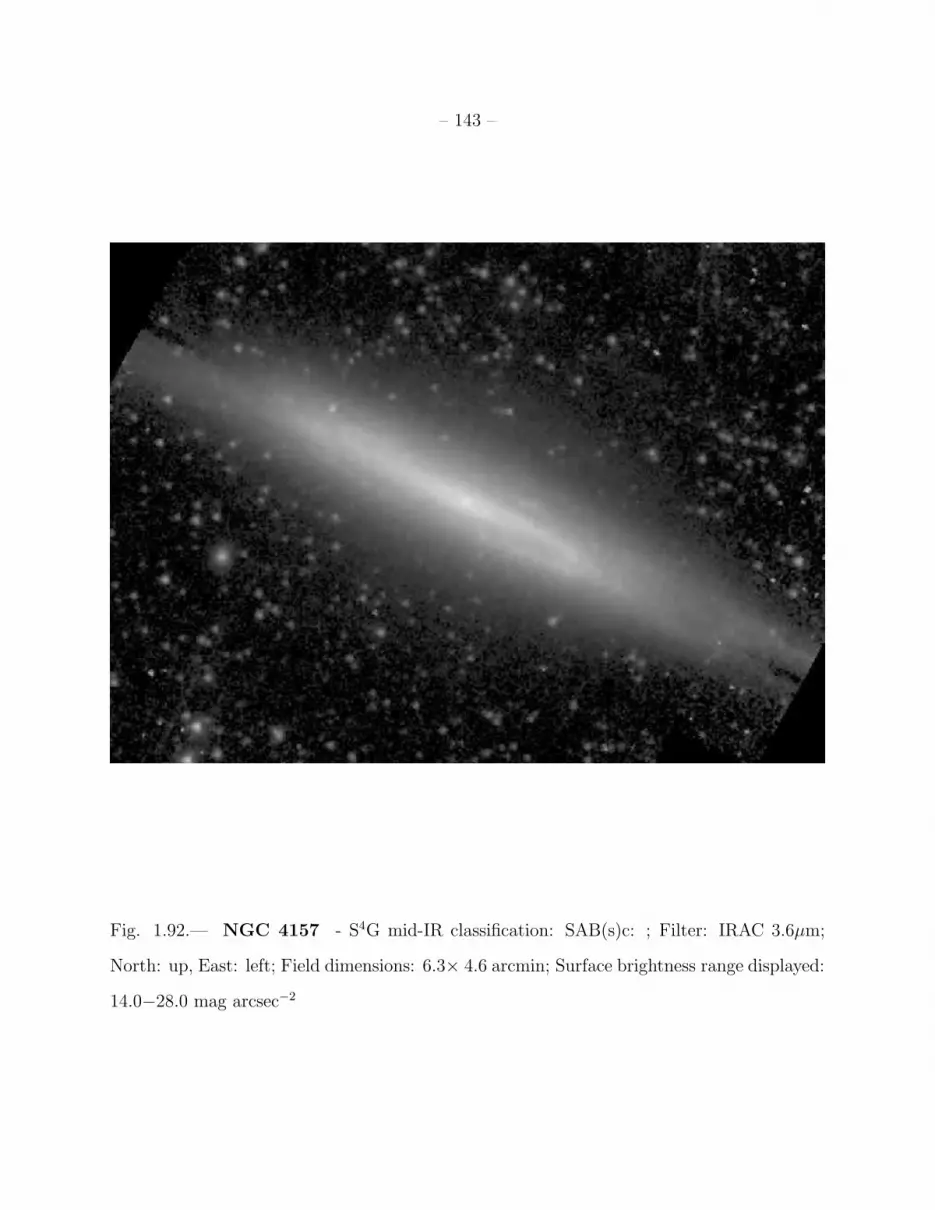
– 143 –
Fig. 1.92.— NGC 4157 - S4G mid-IR classification: SAB(s)c: ; Filter: IRAC 3.6µm;
North: up, East: left; Field dimensions: 6.3× 4.6 arcmin; Surface brightness range displayed:
14.0−28.0 mag arcsec−2

– 144 –
Fig. 1.93.— NGC 4163 - S4G mid-IR classification: dE (Im) ; Filter: IRAC 3.6µm; North:
left, East: down; Field dimensions: 3.5× 2.6 arcmin; Surface brightness range displayed:
18.0−28.0 mag arcsec−2

– 145 –
Fig. 1.94.— NGC 4178 - S4G mid-IR classification: (R′
2)SB(s)d ; Filter: IRAC 3.6µm;
North: left, East: down; Field dimensions: 5.8× 4.2 arcmin; Surface brightness range dis-
played: 15.5−28.0 mag arcsec−2
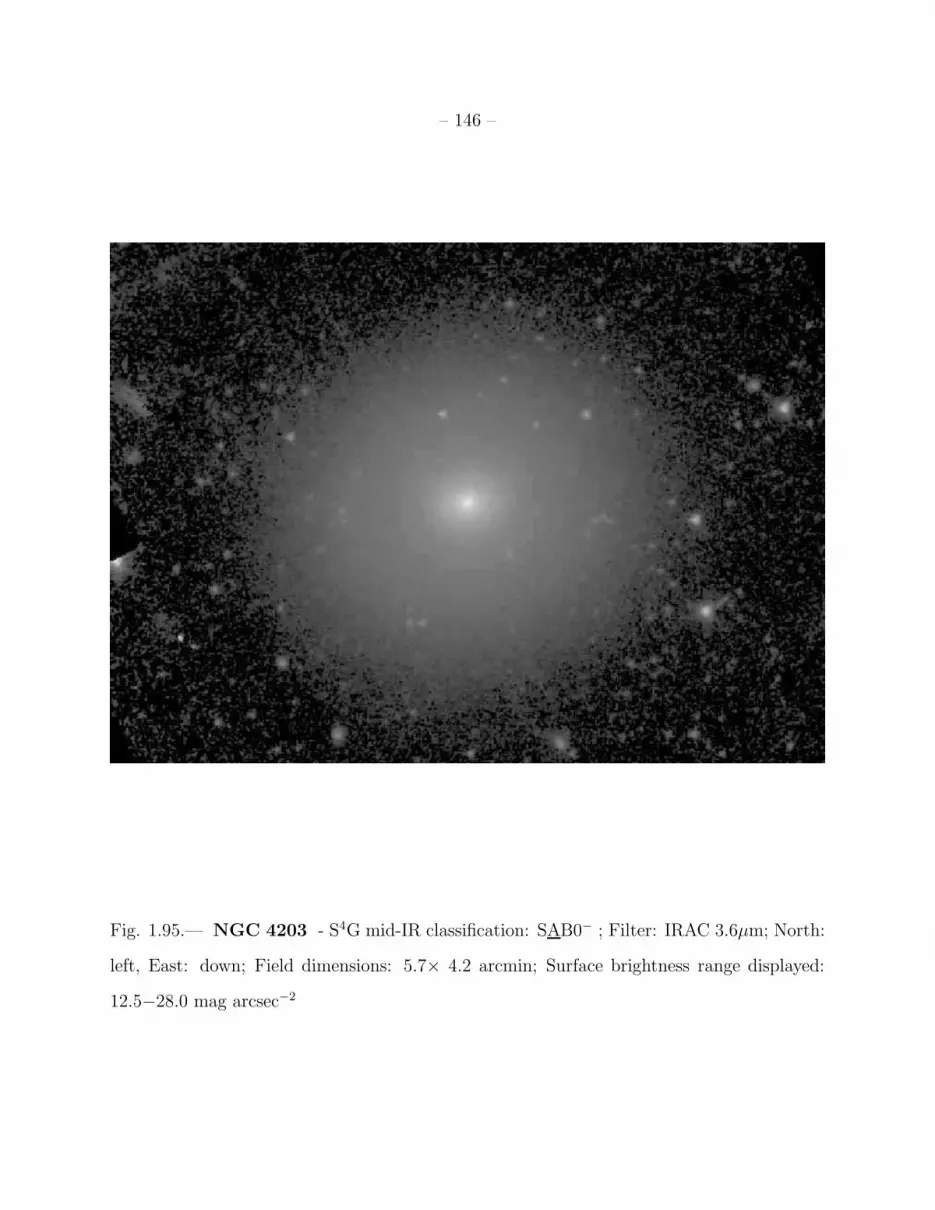
– 146 –
Fig. 1.95.— NGC 4203 - S4G mid-IR classification: SAB0− ; Filter: IRAC 3.6µm; North:
left, East: down; Field dimensions: 5.7× 4.2 arcmin; Surface brightness range displayed:
12.5−28.0 mag arcsec−2

– 147 –
Fig. 1.96.— NGC 4244 - S4G mid-IR classification: Sd sp ; Filter: IRAC 3.6µm; North:
up, East: left; Field dimensions: 15.8× 11.5 arcmin; Surface brightness range displayed:
15.0−28.0 mag arcsec−2
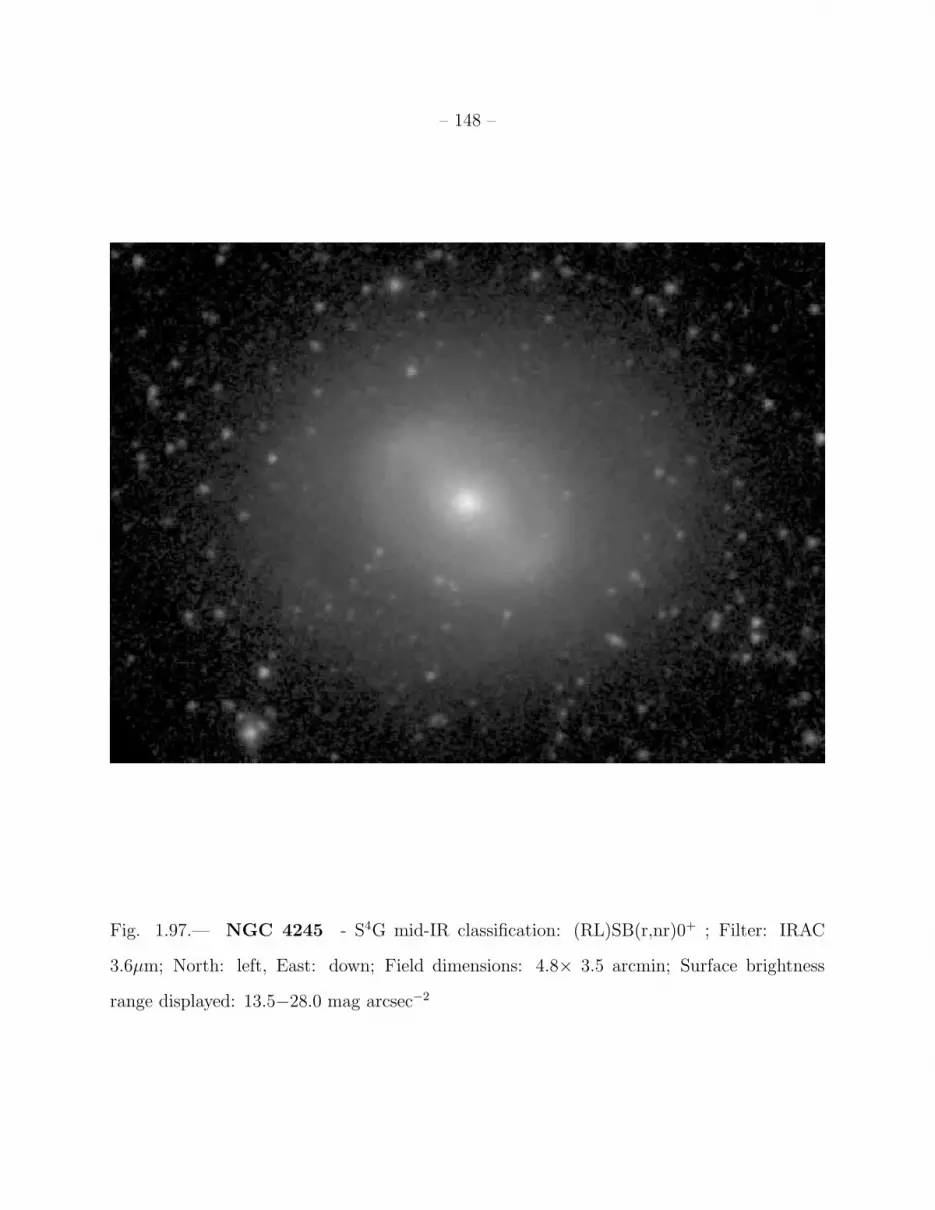
– 148 –
Fig. 1.97.— NGC 4245 - S4G mid-IR classification: (RL)SB(r,nr)0+ ; Filter: IRAC
3.6µm; North: left, East: down; Field dimensions: 4.8× 3.5 arcmin; Surface brightness
range displayed: 13.5−28.0 mag arcsec−2
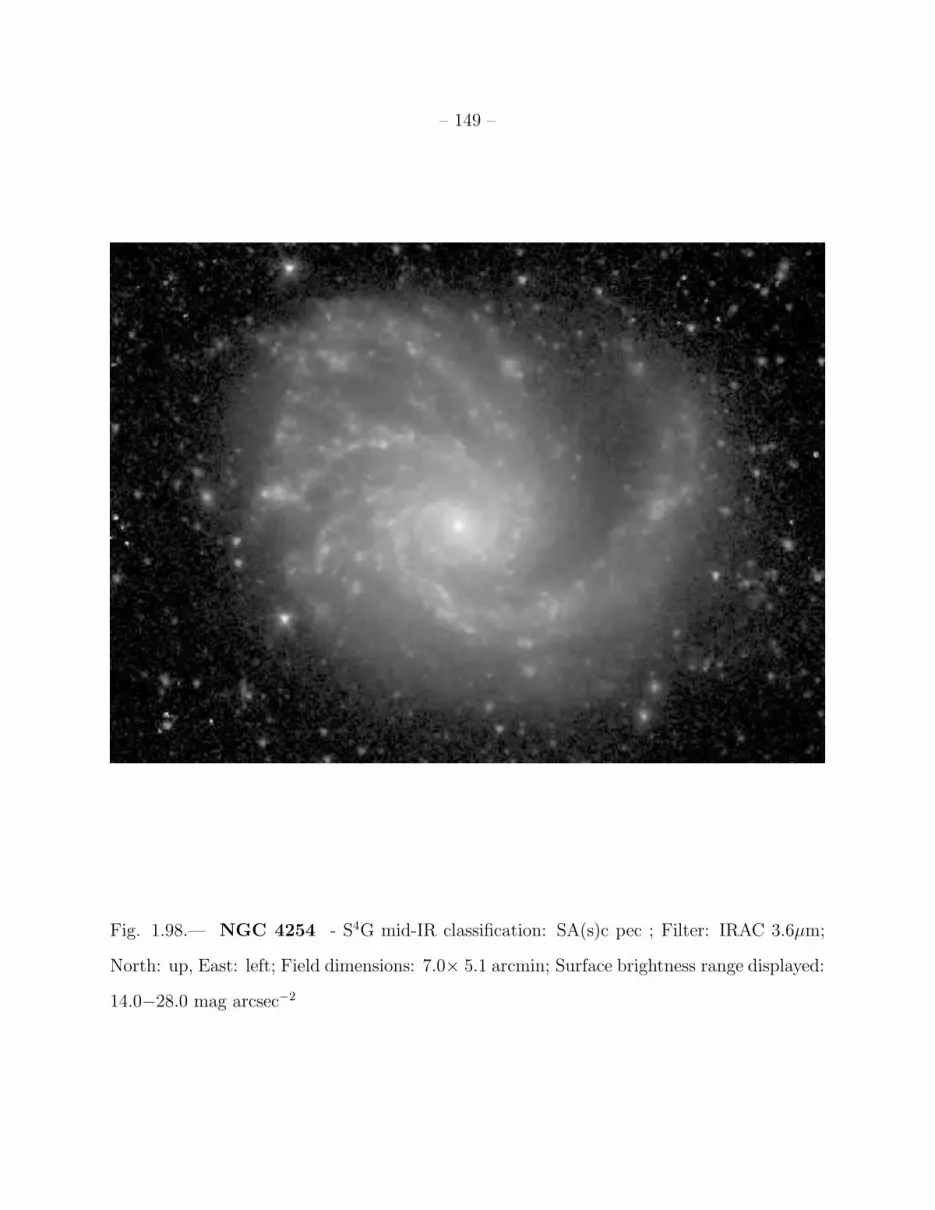
– 149 –
Fig. 1.98.— NGC 4254 - S4G mid-IR classification: SA(s)c pec ; Filter: IRAC 3.6µm;
North: up, East: left; Field dimensions: 7.0× 5.1 arcmin; Surface brightness range displayed:
14.0−28.0 mag arcsec−2

– 150 –
Fig. 1.99.— NGC 4266 - S4G mid-IR classification: S0o sp ; Filter: IRAC 3.6µm;
North: up, East: left; Field dimensions: 3.2× 2.3 arcmin; Surface brightness range displayed:
15.0−28.0 mag arcsec−2

– 151 –
Fig. 1.100.— NGC 4268 - S4G mid-IR classification: SA:(rs)0+ sp ; Filter: IRAC 3.6µm;
North: up, East: left; Field dimensions: 3.2× 2.3 arcmin; Surface brightness range displayed:
13.5−28.0 mag arcsec−2
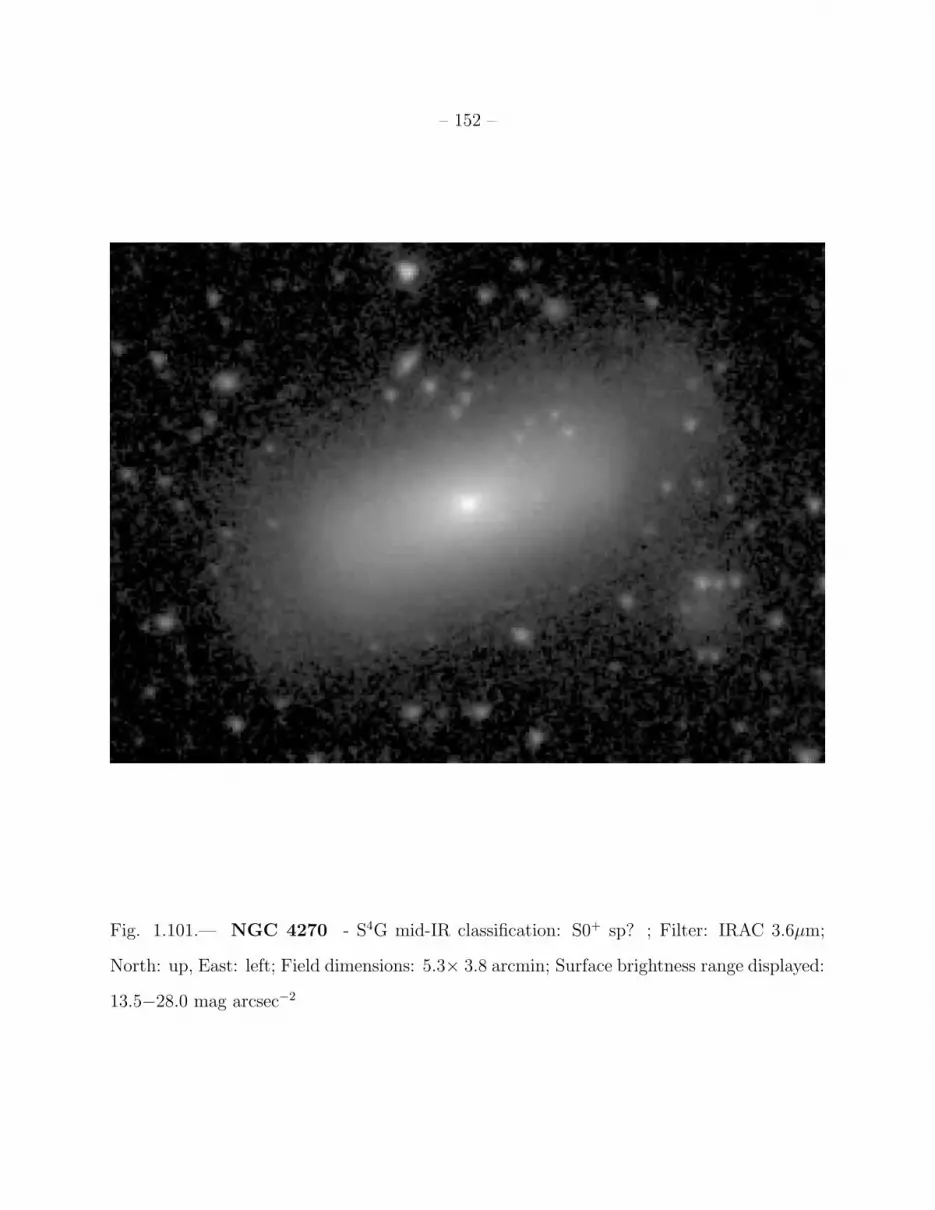
– 152 –
Fig. 1.101.— NGC 4270 - S4G mid-IR classification: S0+ sp? ; Filter: IRAC 3.6µm;
North: up, East: left; Field dimensions: 5.3× 3.8 arcmin; Surface brightness range displayed:
13.5−28.0 mag arcsec−2

– 153 –
Fig. 1.102.— NGC 4273 - S4G mid-IR classification: SAB(s)c pec ; Filter: IRAC
3.6µm; North: left, East: down; Field dimensions: 3.2× 2.3 arcmin; Surface brightness
range displayed: 13.5−28.0 mag arcsec−2

– 154 –
Fig. 1.103.— NGC 4277 - S4G mid-IR classification: SAB(rs)0+ ; Filter: IRAC 3.6µm;
North: up, East: left; Field dimensions: 2.6× 1.9 arcmin; Surface brightness range displayed:
13.5−28.0 mag arcsec−2

– 155 –
Fig. 1.104.— NGC 4281 - S4G mid-IR classification: E(d)5 ; Filter: IRAC 3.6µm;
North: up, East: left; Field dimensions: 5.3× 3.8 arcmin; Surface brightness range displayed:
12.5−28.0 mag arcsec−2
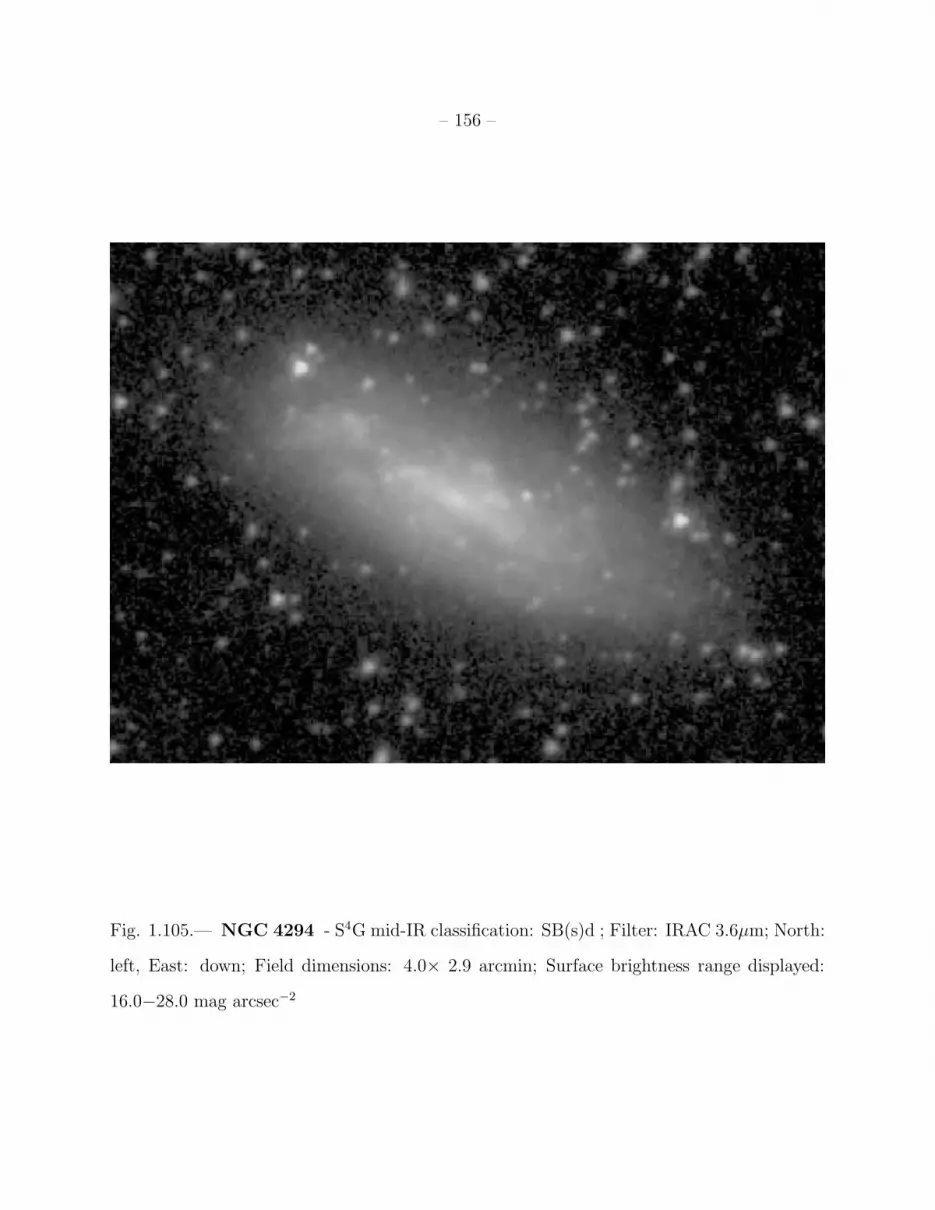
– 156 –
Fig. 1.105.— NGC 4294 - S4G mid-IR classification: SB(s)d ; Filter: IRAC 3.6µm; North:
left, East: down; Field dimensions: 4.0× 2.9 arcmin; Surface brightness range displayed:
16.0−28.0 mag arcsec−2
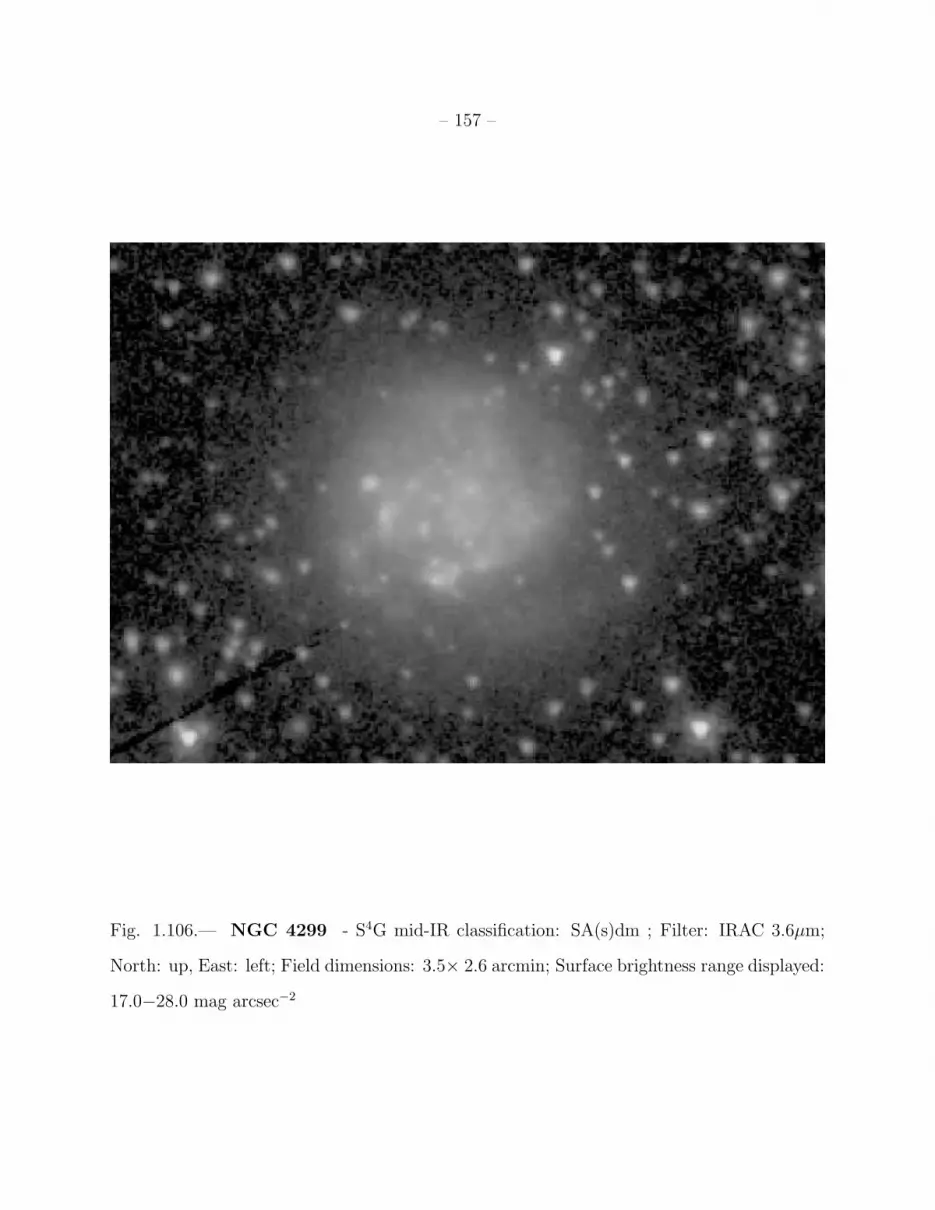
– 157 –
Fig. 1.106.— NGC 4299 - S4G mid-IR classification: SA(s)dm ; Filter: IRAC 3.6µm;
North: up, East: left; Field dimensions: 3.5× 2.6 arcmin; Surface brightness range displayed:
17.0−28.0 mag arcsec−2

– 158 –
Fig. 1.107.— NGC 4314 - S4G mid-IR classification: (R′
1)SB(rl,nr)a ; Filter: IRAC
3.6µm; North: up, East: left; Field dimensions: 7.0× 5.1 arcmin; Surface brightness range
displayed: 13.0−28.0 mag arcsec−2

– 159 –
Fig. 1.108.— NGC 4321 - S4G mid-IR classification: SAB(rs,nr)bc ; Filter: IRAC 3.6µm;
North: left, East: down; Field dimensions: 12.1× 8.9 arcmin; Surface brightness range
displayed: 13.0−28.0 mag arcsec−2

– 160 –
Fig. 1.109.— NGC 4323 - S4G mid-IR classification: dE3,N ; Filter: IRAC 3.6µm;
North: up, East: left; Field dimensions: 2.7× 2.0 arcmin; Surface brightness range displayed:
17.5−28.0 mag arcsec−2

– 161 –
Fig. 1.110.— NGC 4328 - S4G mid-IR classification: dSA(l)0− ; Filter: IRAC 3.6µm;
North: up, East: left; Field dimensions: 2.7× 2.0 arcmin; Surface brightness range displayed:
17.0−28.0 mag arcsec−2

– 162 –
Fig. 1.111.— NGC 4369 - S4G mid-IR classification: (R)SB(rs)0/a: pec ; Filter: IRAC
3.6µm; North: up, East: left; Field dimensions: 4.5× 3.3 arcmin; Surface brightness range
displayed: 14.0−28.0 mag arcsec−2
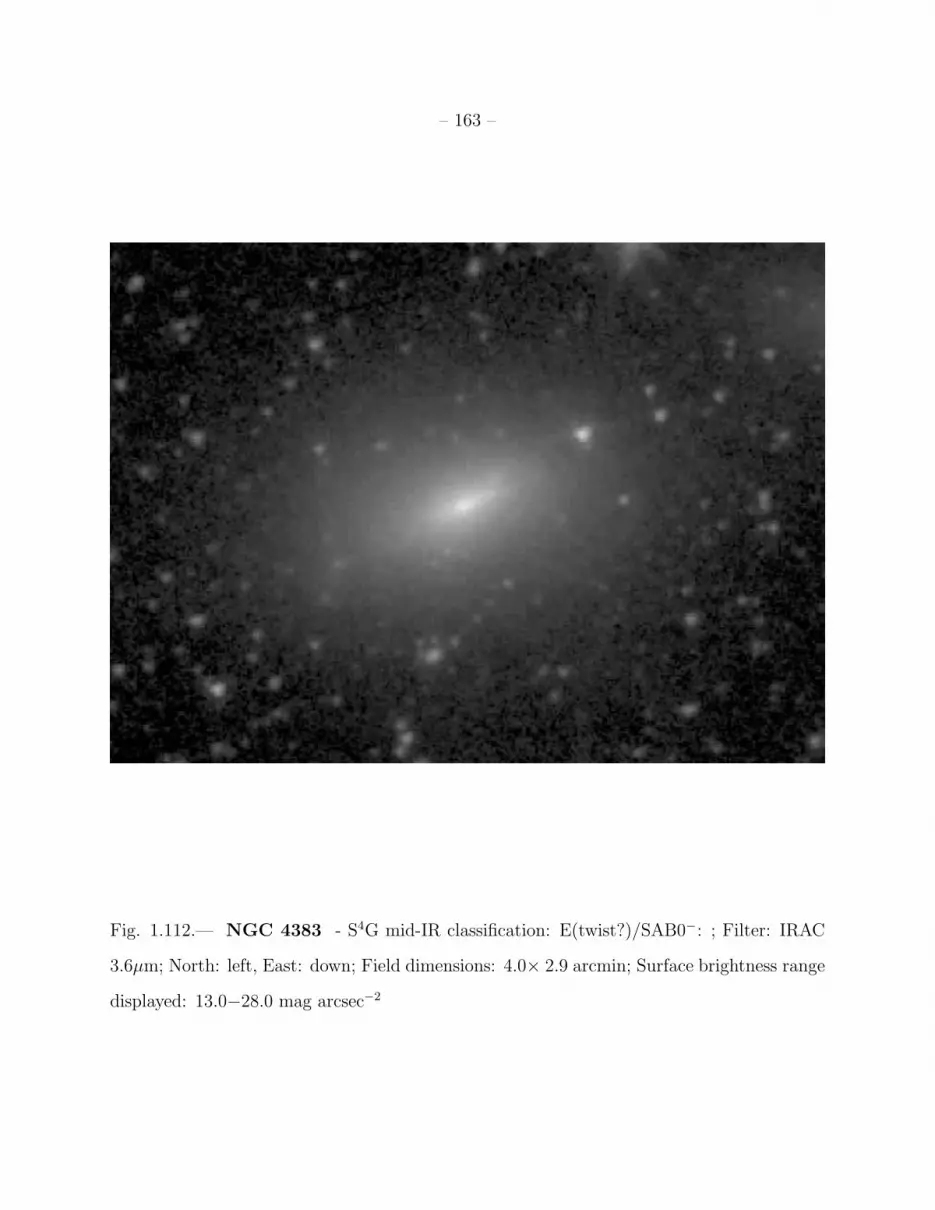
– 163 –
Fig. 1.112.— NGC 4383 - S4G mid-IR classification: E(twist?)/SAB0−: ; Filter: IRAC
3.6µm; North: left, East: down; Field dimensions: 4.0× 2.9 arcmin; Surface brightness range
displayed: 13.0−28.0 mag arcsec−2

– 164 –
Fig. 1.113.— NGC 4396 - S4G mid-IR classification: Scd: pec sp ; Filter: IRAC 3.6µm;
North: up, East: left; Field dimensions: 4.5× 3.3 arcmin; Surface brightness range displayed:
16.5−28.0 mag arcsec−2

– 165 –
Fig. 1.114.— NGC 4437 - S4G mid-IR classification: Sc sp ; Filter: IRAC 3.6µm; North:
up, East: left; Field dimensions: 12.6× 9.2 arcmin; Surface brightness range displayed:
14.5−28.0 mag arcsec−2

– 166 –
Fig. 1.115.— NGC 4527 - S4G mid-IR classification: (R′
2)SAB(rs,nr)bc ; Filter: IRAC
3.6µm; North: up, East: left; Field dimensions: 7.9× 5.7 arcmin; Surface brightness range
displayed: 12.0−28.0 mag arcsec−2
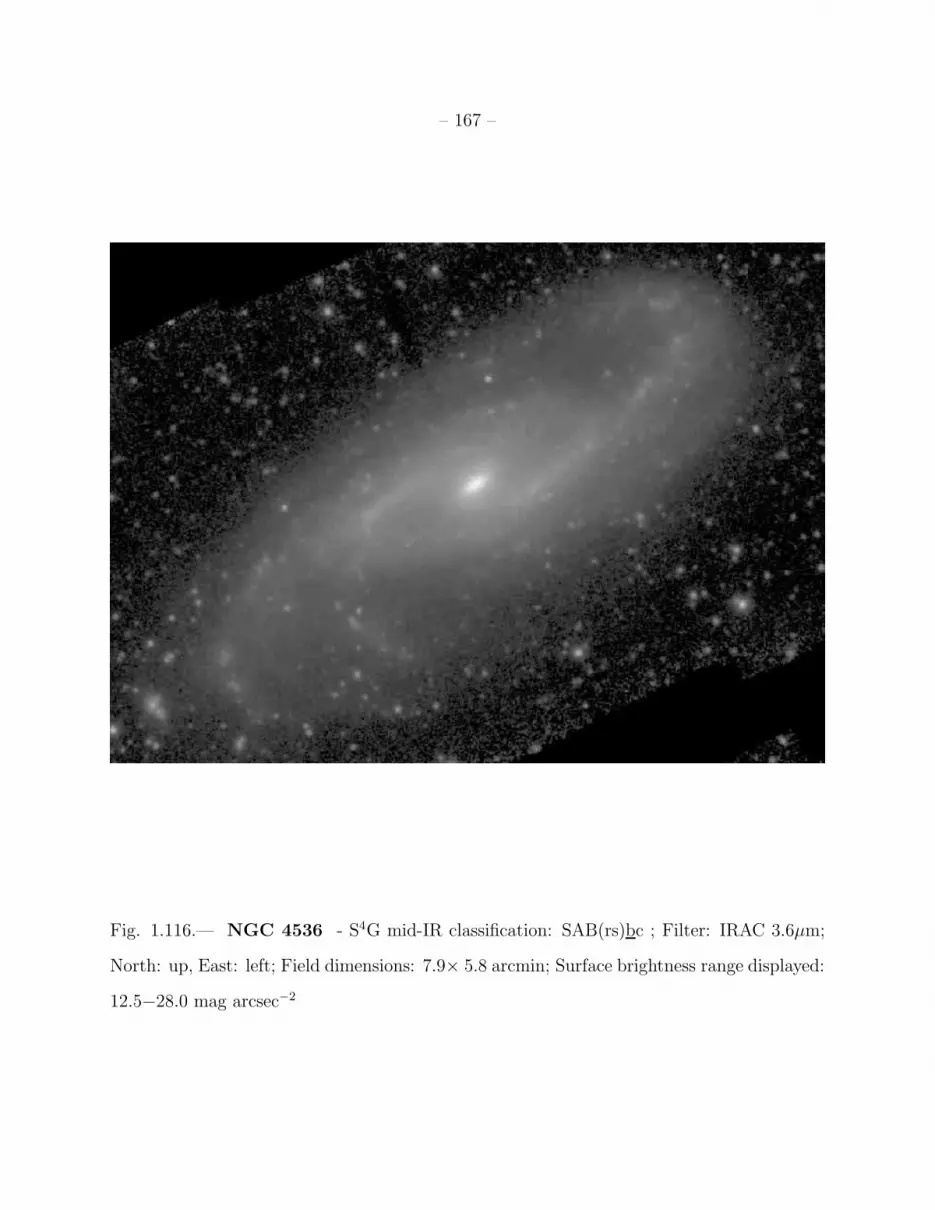
– 167 –
Fig. 1.116.— NGC 4536 - S4G mid-IR classification: SAB(rs)bc ; Filter: IRAC 3.6µm;
North: up, East: left; Field dimensions: 7.9× 5.8 arcmin; Surface brightness range displayed:
12.5−28.0 mag arcsec−2
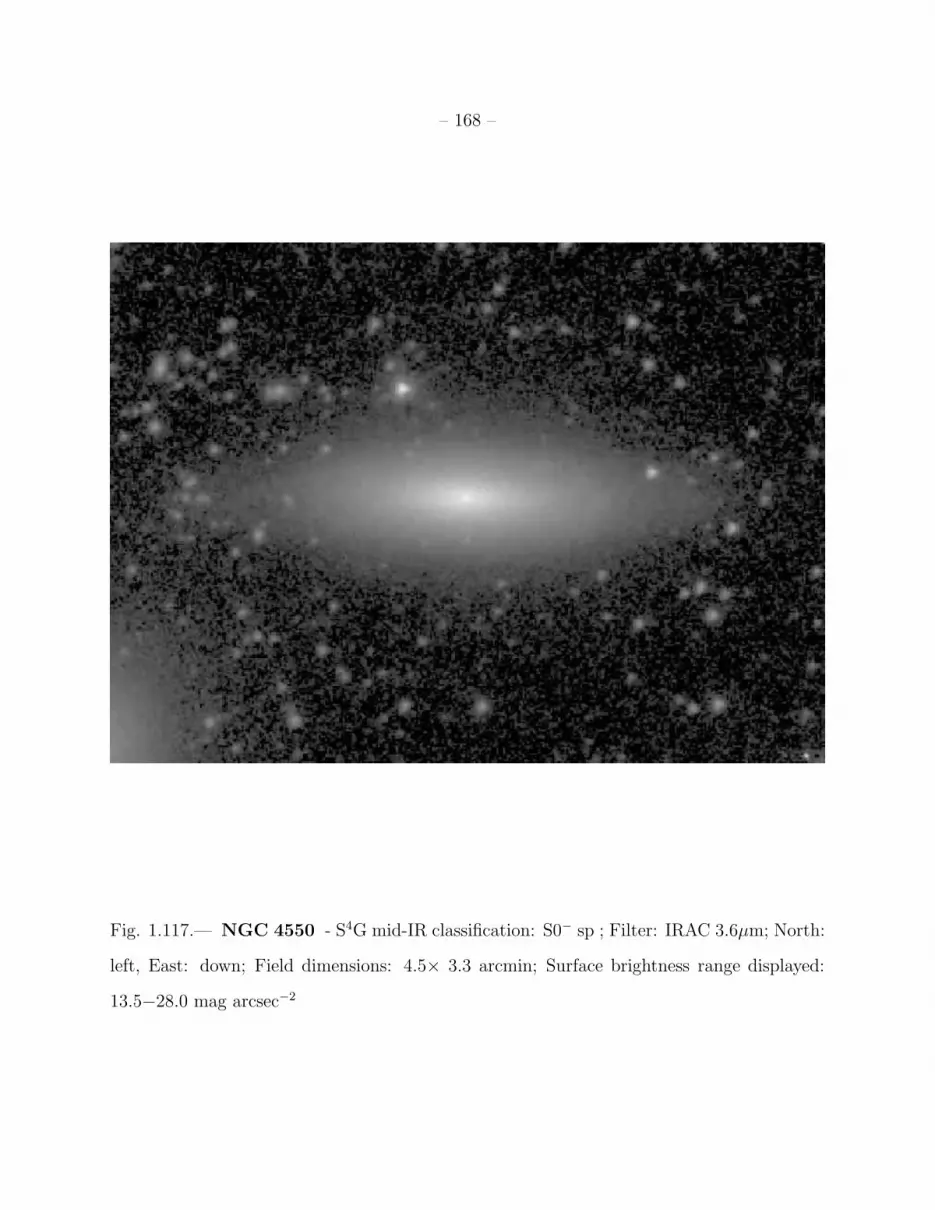
– 168 –
Fig. 1.117.— NGC 4550 - S4G mid-IR classification: S0− sp ; Filter: IRAC 3.6µm; North:
left, East: down; Field dimensions: 4.5× 3.3 arcmin; Surface brightness range displayed:
13.5−28.0 mag arcsec−2
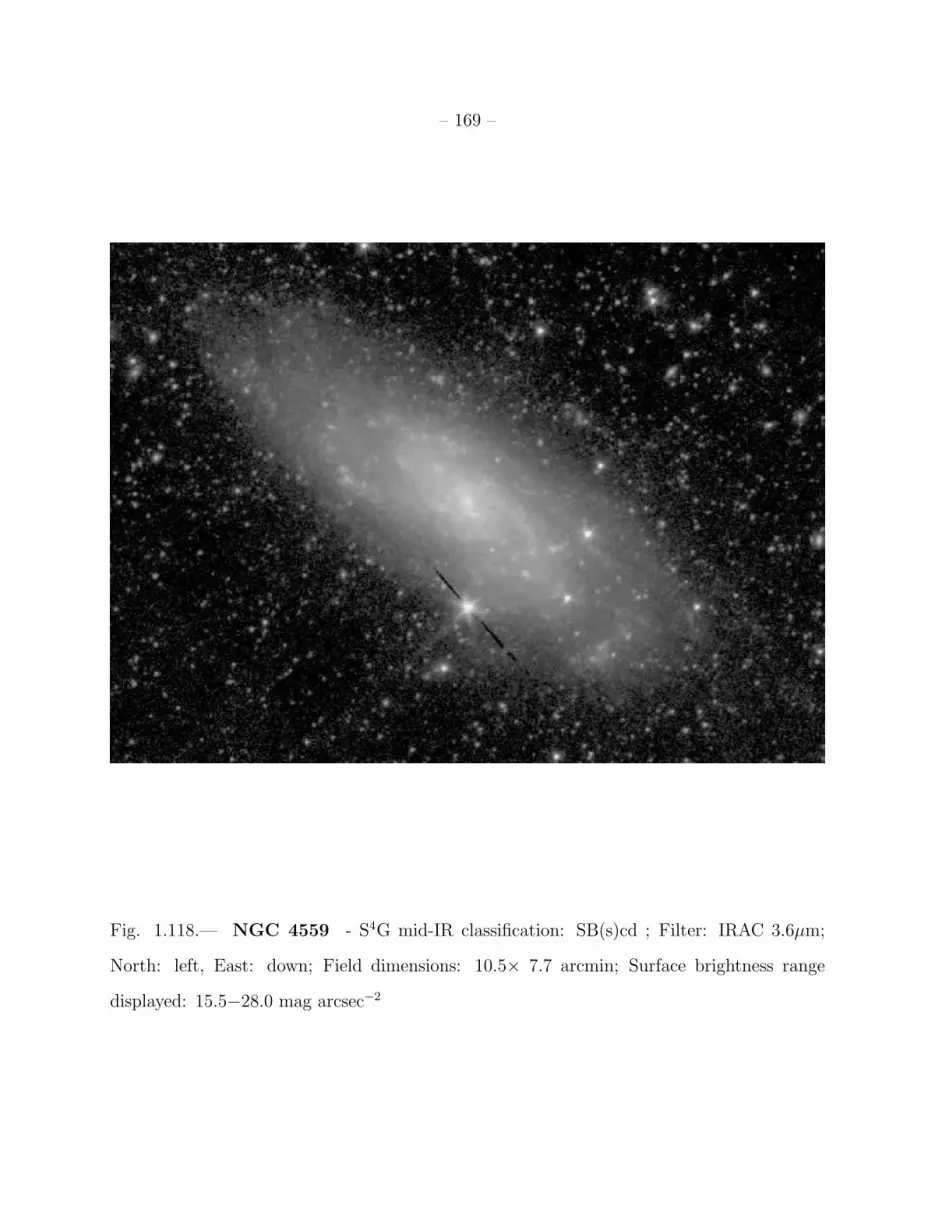
– 169 –
Fig. 1.118.— NGC 4559 - S4G mid-IR classification: SB(s)cd ; Filter: IRAC 3.6µm;
North: left, East: down; Field dimensions: 10.5× 7.7 arcmin; Surface brightness range
displayed: 15.5−28.0 mag arcsec−2

– 170 –
Fig. 1.119.— NGC 4567 (left) and NGC 4568 (right) - S4G mid-IR classifications:
SA(rs)bc, SA(rs)bc, respectively; Filter: IRAC 3.6µm; North: left, East: down; Field di-
mensions: 6.3× 4.6 arcmin; Surface brightness range displayed: 13.0−28.0 mag arcsec−2

– 171 –
Fig. 1.120.— NGC 4579 - S4G mid-IR classification: (R)SB(rs)a ; Filter: IRAC 3.6µm;
North: up, East: left; Field dimensions: 7.9× 5.7 arcmin; Surface brightness range displayed:
12.0−28.0 mag arcsec−2
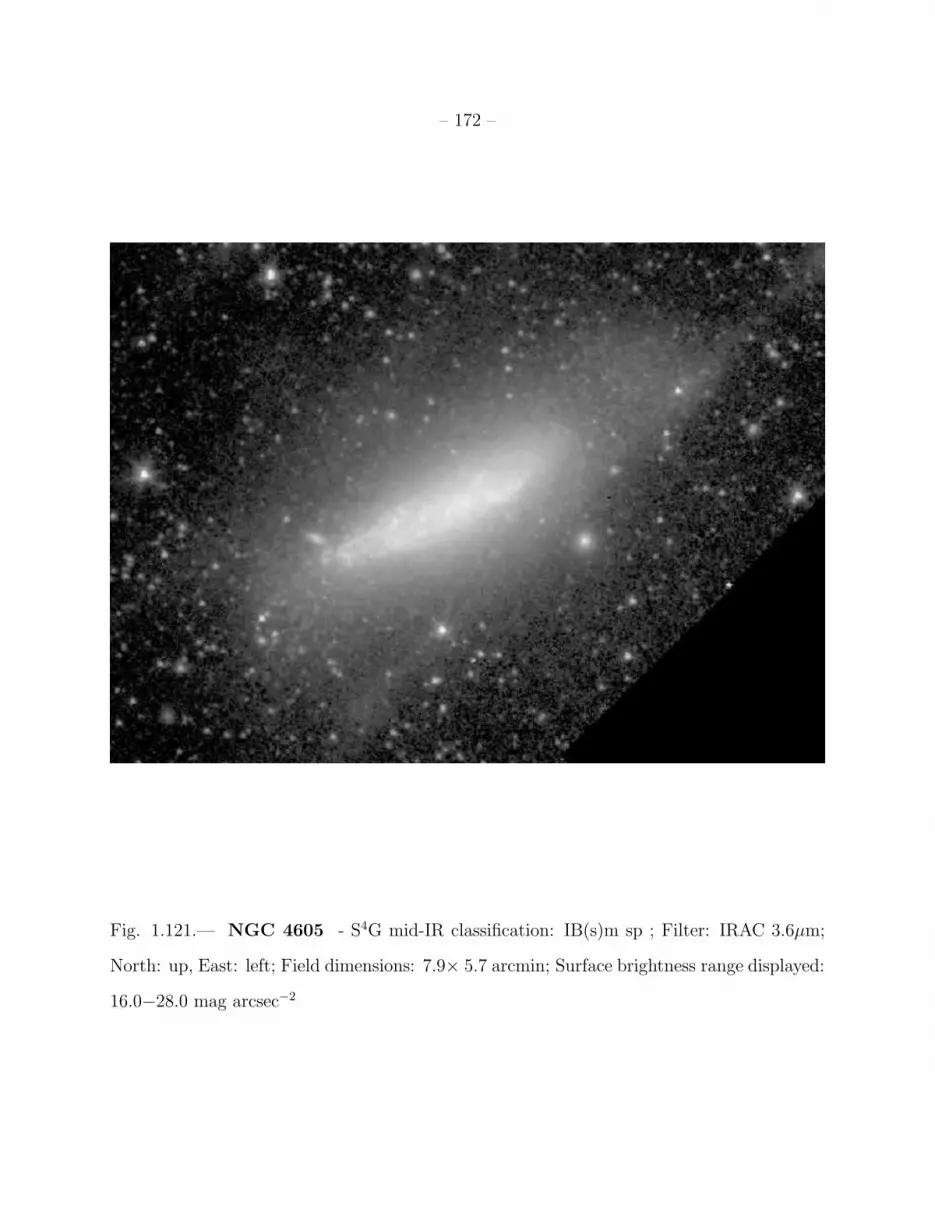
– 172 –
Fig. 1.121.— NGC 4605 - S4G mid-IR classification: IB(s)m sp ; Filter: IRAC 3.6µm;
North: up, East: left; Field dimensions: 7.9× 5.7 arcmin; Surface brightness range displayed:
16.0−28.0 mag arcsec−2
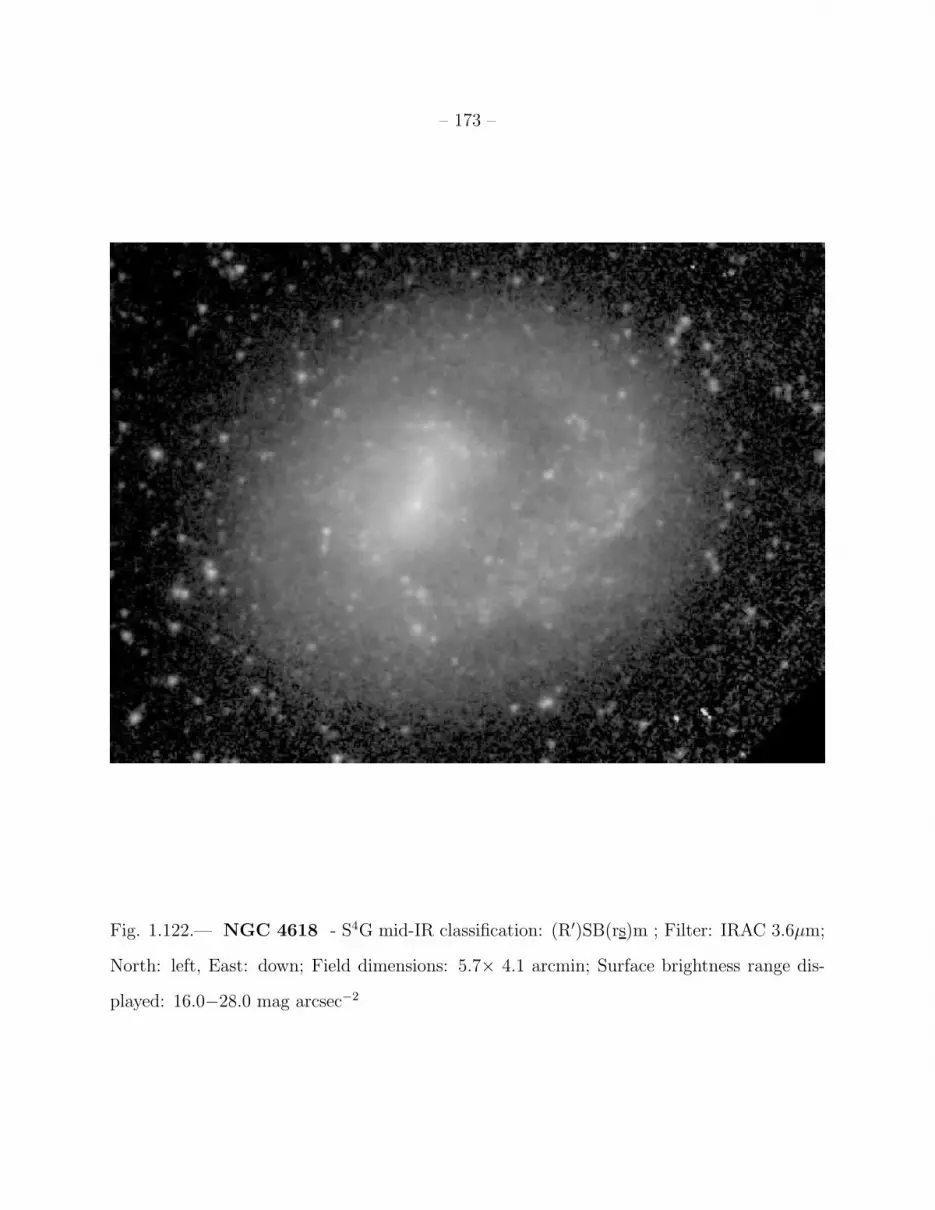
– 173 –
Fig. 1.122.— NGC 4618 - S4G mid-IR classification: (R′)SB(rs)m ; Filter: IRAC 3.6µm;
North: left, East: down; Field dimensions: 5.7× 4.1 arcmin; Surface brightness range dis-
played: 16.0−28.0 mag arcsec−2
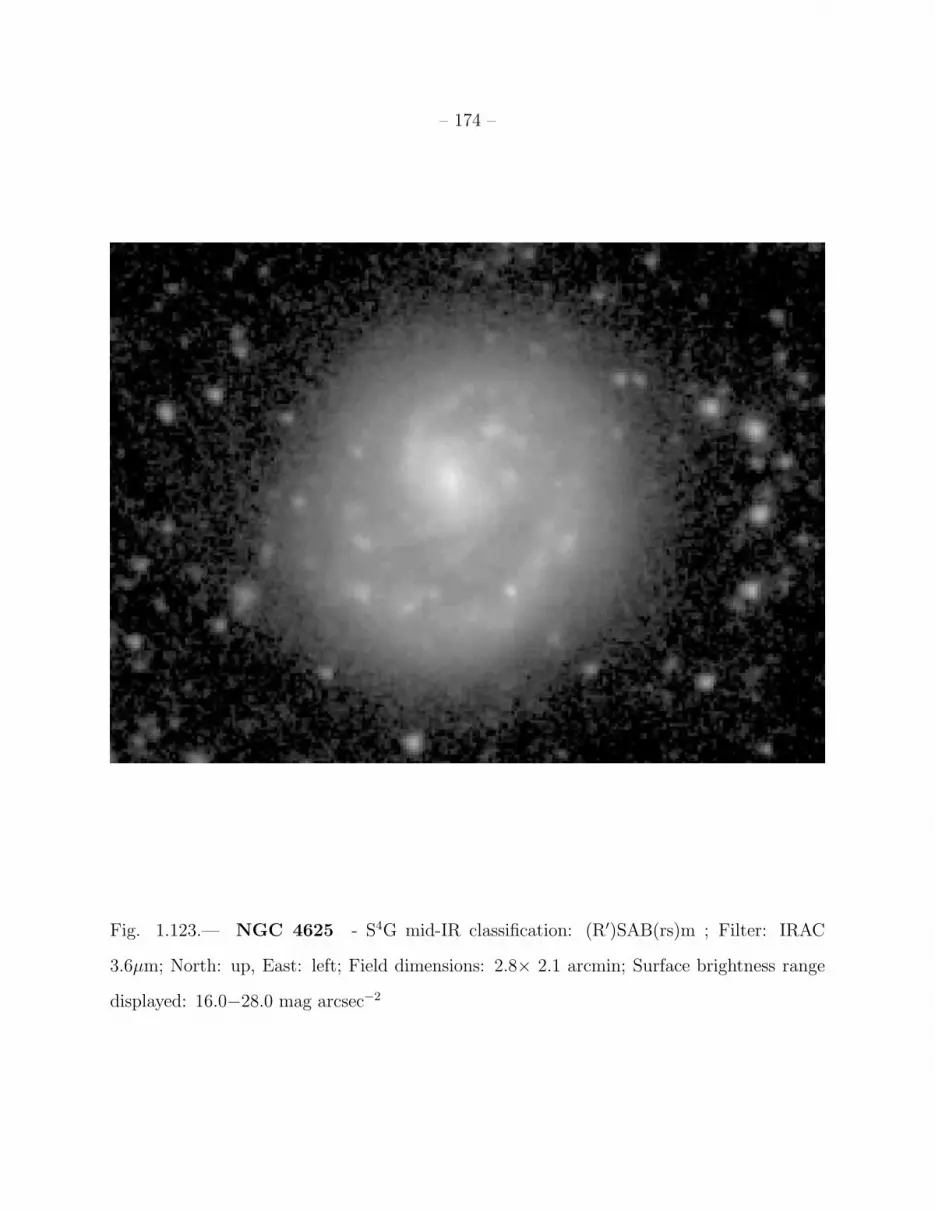
– 174 –
Fig. 1.123.— NGC 4625 - S4G mid-IR classification: (R′)SAB(rs)m ; Filter: IRAC
3.6µm; North: up, East: left; Field dimensions: 2.8× 2.1 arcmin; Surface brightness range
displayed: 16.0−28.0 mag arcsec−2

– 175 –
Fig. 1.124.— NGC 4647 - S4G mid-IR classification: SAB(rs)cd ; Filter: IRAC 3.6µm;
North: up, East: left; Field dimensions: 2.6× 1.9 arcmin; Surface brightness range displayed:
15.0−28.0 mag arcsec−2
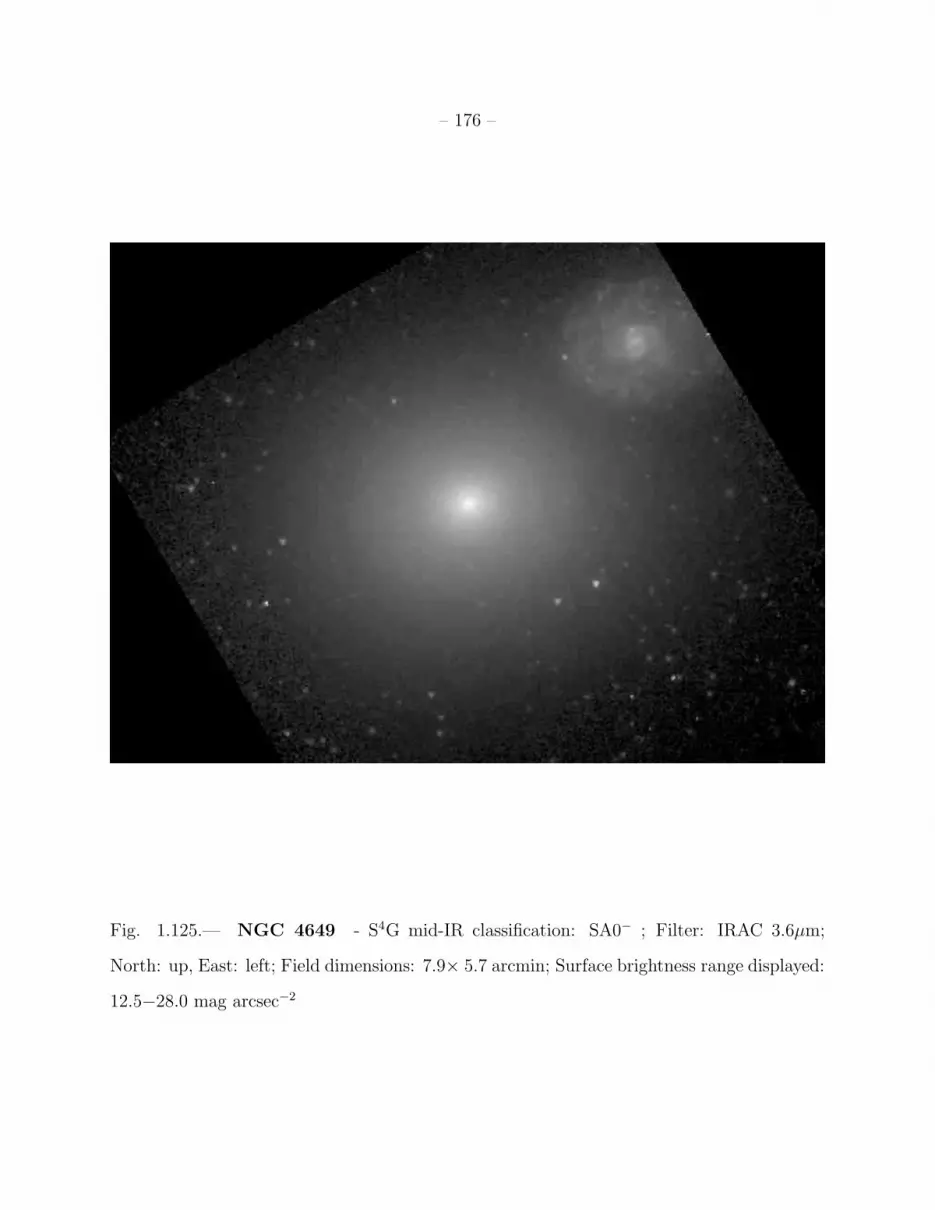
– 176 –
Fig. 1.125.— NGC 4649 - S4G mid-IR classification: SA0− ; Filter: IRAC 3.6µm;
North: up, East: left; Field dimensions: 7.9× 5.7 arcmin; Surface brightness range displayed:
12.5−28.0 mag arcsec−2
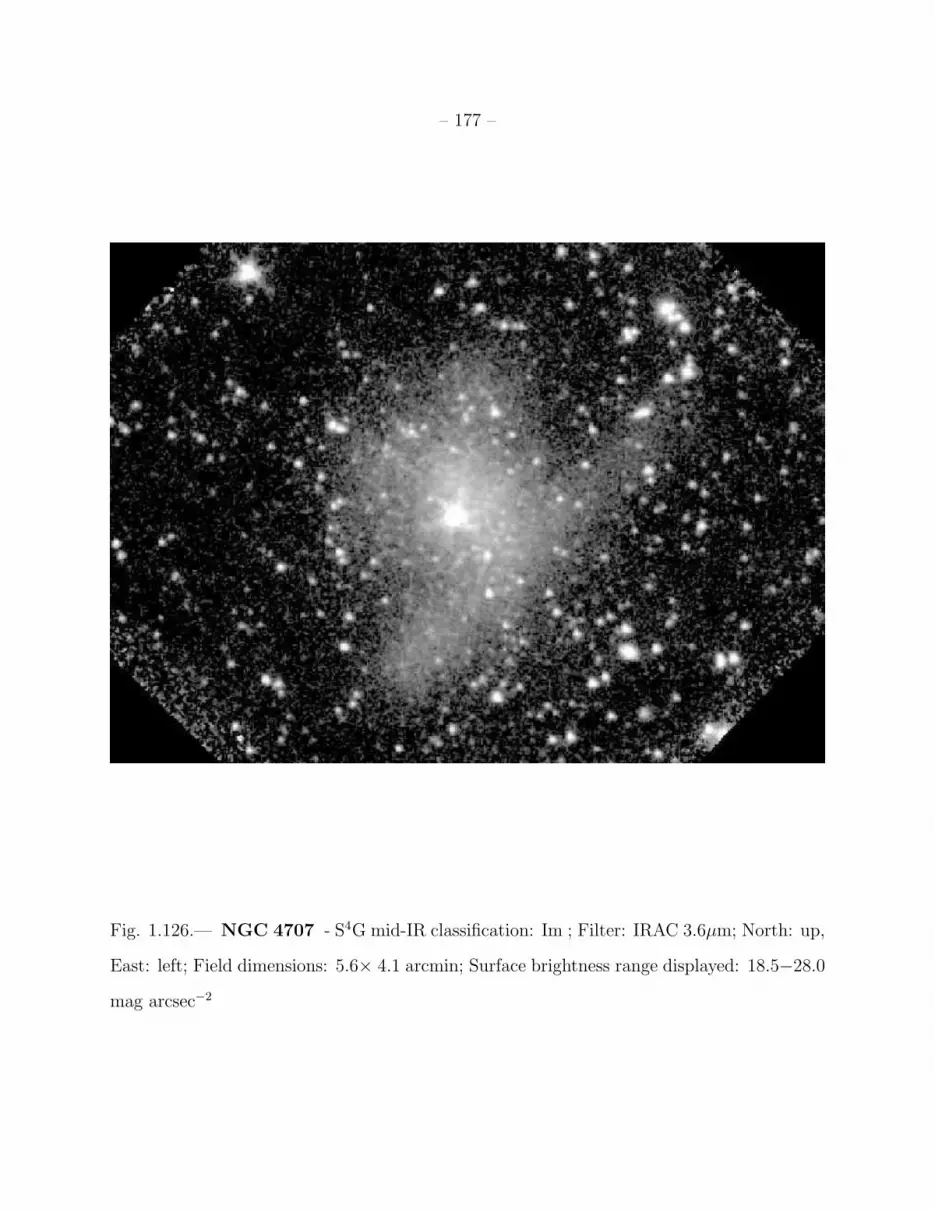
– 177 –
Fig. 1.126.— NGC 4707 - S4G mid-IR classification: Im ; Filter: IRAC 3.6µm; North: up,
East: left; Field dimensions: 5.6× 4.1 arcmin; Surface brightness range displayed: 18.5−28.0
mag arcsec−2

– 178 –
Fig. 1.127.— NGC 4725 - S4G mid-IR classification: SAB(r,nb)a ; Filter: IRAC 3.6µm;
North: up, East: left; Field dimensions: 14.3× 10.4 arcmin; Surface brightness range dis-
played: 12.5−28.0 mag arcsec−2

– 179 –
Fig. 1.128.— NGC 4736 - S4G mid-IR classification: (R)SAB(rl,nr’,nl,nb)a ; Filter: IRAC
3.6µm; North: up, East: left; Field dimensions: 21.0× 15.3 arcmin; Surface brightness range
displayed: 12.0−28.0 mag arcsec−2

– 180 –
Fig. 1.129.— NGC 4750 - S4G mid-IR classification: (R′)SA(rs)a ; Filter: IRAC 3.6µm;
North: left, East: down; Field dimensions: 6.7× 4.9 arcmin; Surface brightness range dis-
played: 13.0−28.0 mag arcsec−2
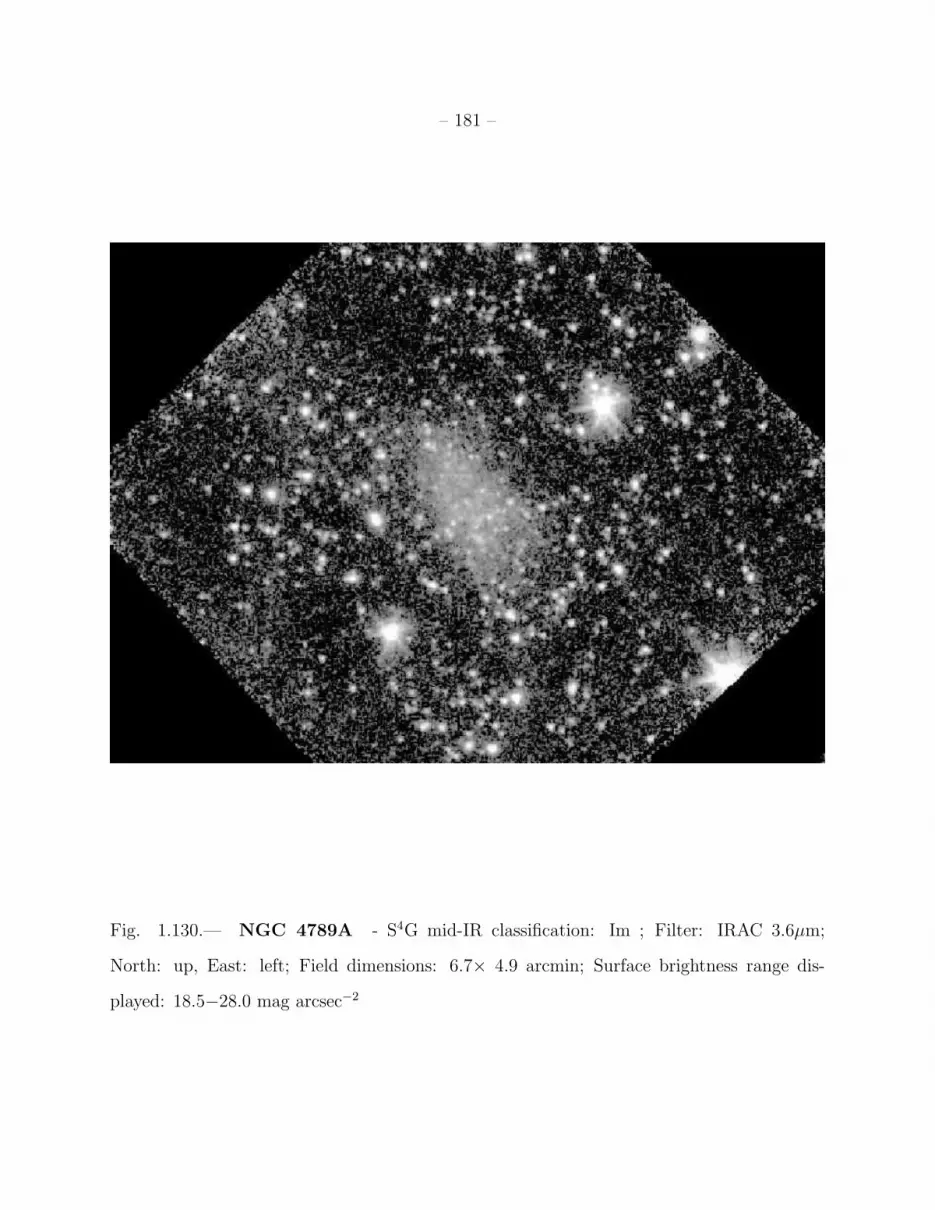
– 181 –
Fig. 1.130.— NGC 4789A - S4G mid-IR classification: Im ; Filter: IRAC 3.6µm;
North: up, East: left; Field dimensions: 6.7× 4.9 arcmin; Surface brightness range dis-
played: 18.5−28.0 mag arcsec−2

– 182 –
Fig. 1.131.— NGC 5018 - S4G mid-IR classification: SAB0− (shells/ripples) pec ; Filter:
IRAC 3.6µm; North: up, East: left; Field dimensions: 6.7× 4.9 arcmin; Surface brightness
range displayed: 12.0−28.0 mag arcsec−2
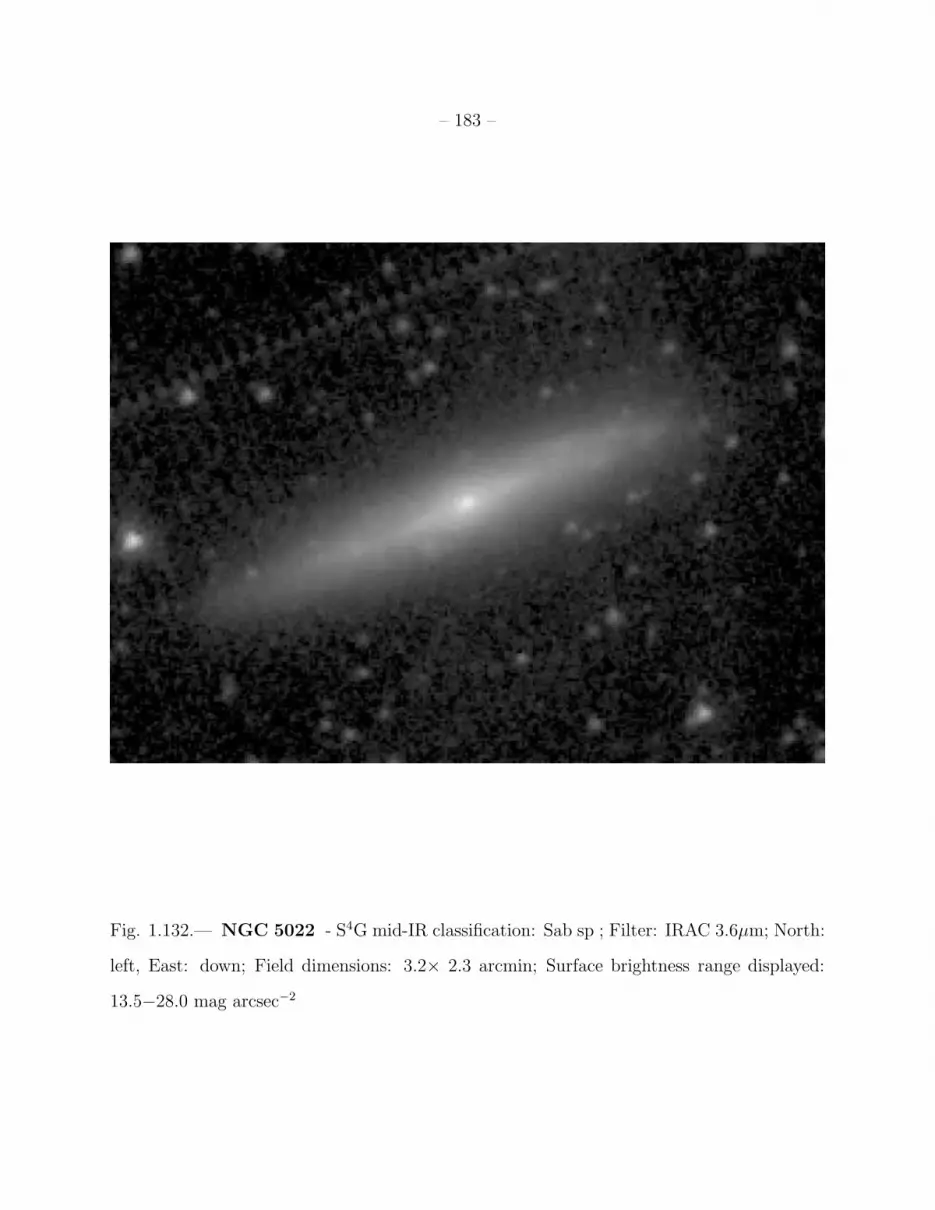
– 183 –
Fig. 1.132.— NGC 5022 - S4G mid-IR classification: Sab sp ; Filter: IRAC 3.6µm; North:
left, East: down; Field dimensions: 3.2× 2.3 arcmin; Surface brightness range displayed:
13.5−28.0 mag arcsec−2

– 184 –
Fig. 1.133.— NGC 5055 - S4G mid-IR classification: SA(rs,rl)bc ; Filter: IRAC 3.6µm;
North: up, East: left; Field dimensions: 12.6× 9.2 arcmin; Surface brightness range dis-
played: 12.0−28.0 mag arcsec−2
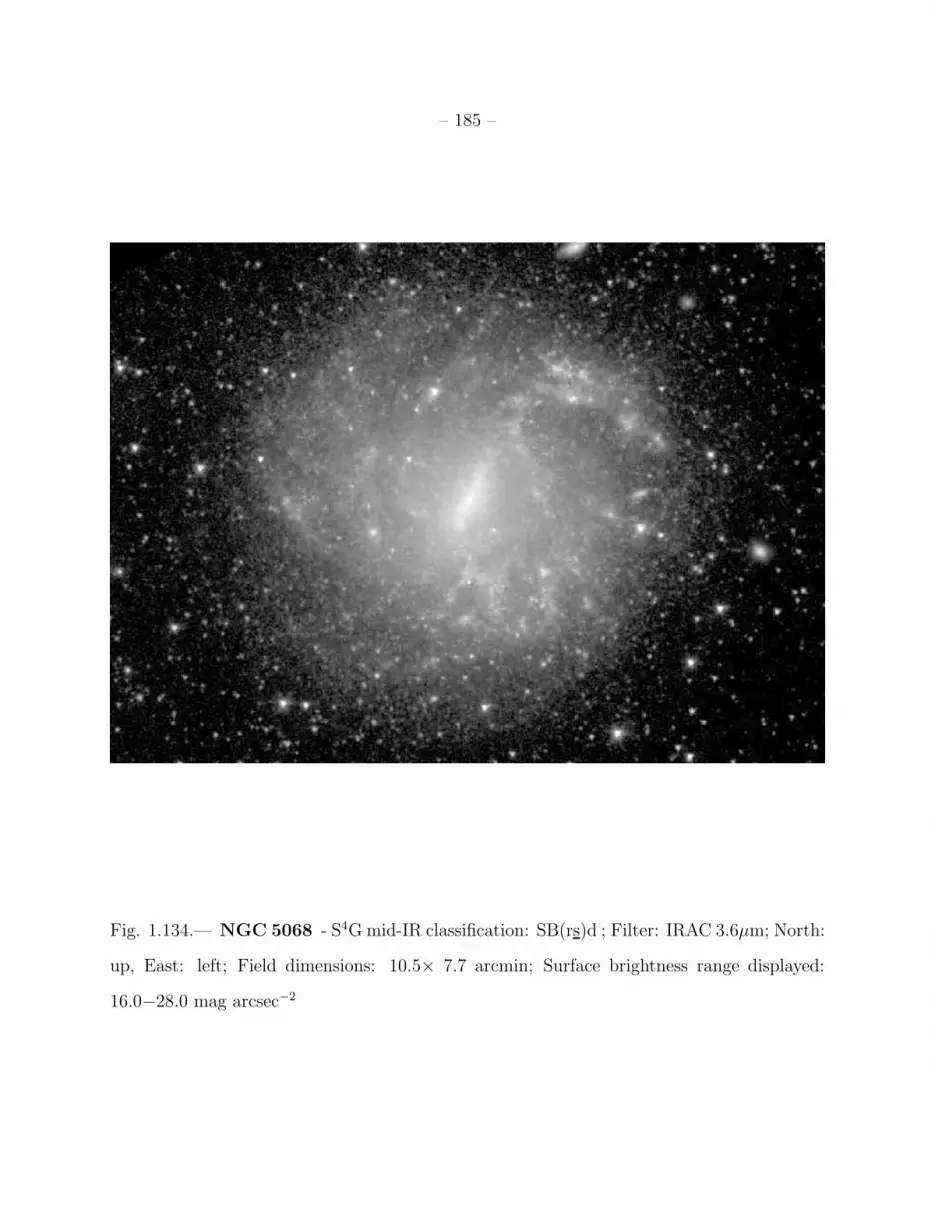
– 185 –
Fig. 1.134.— NGC 5068 - S4Gmid-IR classification: SB(rs)d ; Filter: IRAC 3.6µm; North:
up, East: left; Field dimensions: 10.5× 7.7 arcmin; Surface brightness range displayed:
16.0−28.0 mag arcsec−2

– 186 –
Fig. 1.135.— NGC 5173 - S4G mid-IR classification: E+1 ; Filter: IRAC 3.6µm; North:
up, East: left; Field dimensions: 4.4× 3.2 arcmin; Surface brightness range displayed:
13.5−28.0 mag arcsec−2
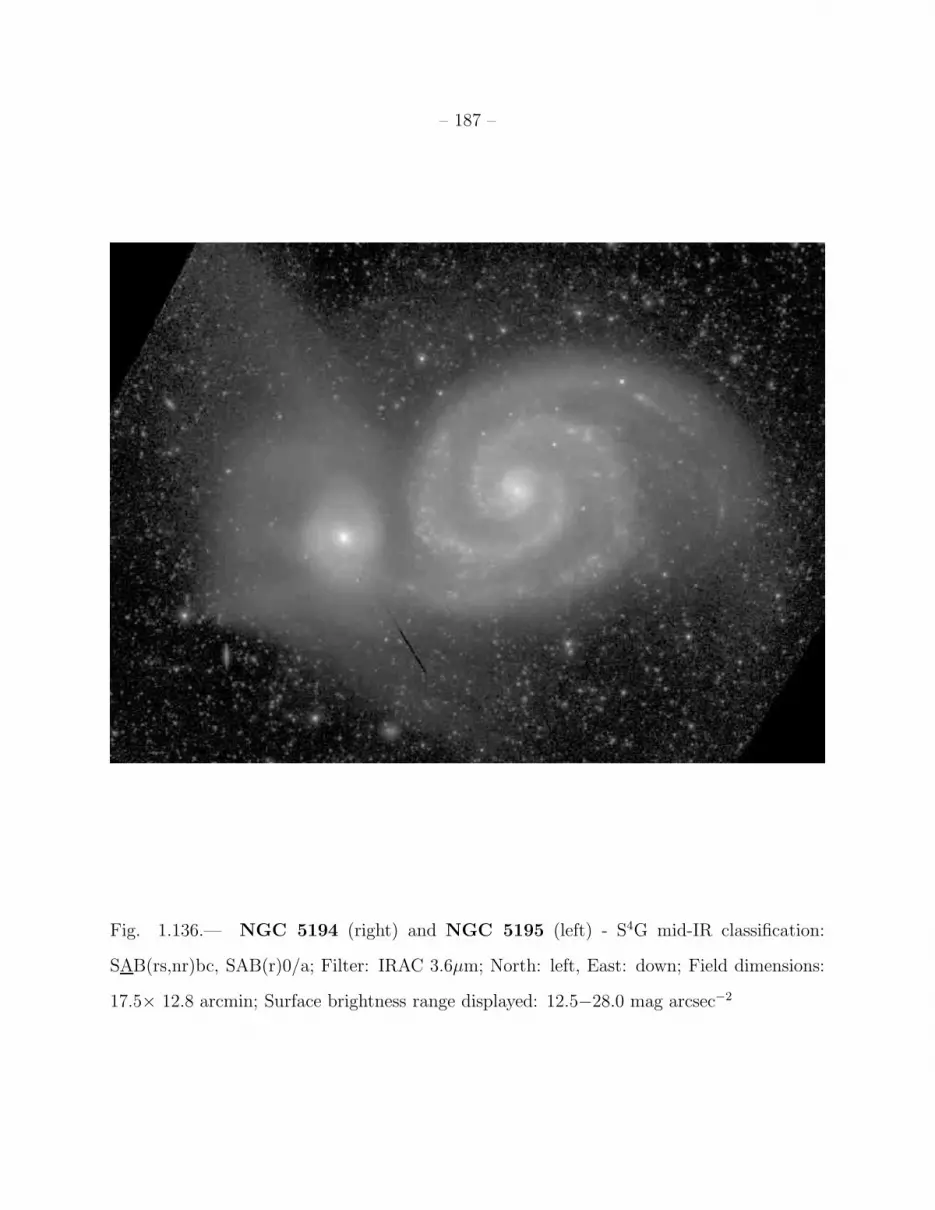
– 187 –
Fig. 1.136.— NGC 5194 (right) and NGC 5195 (left) - S4G mid-IR classification:
SAB(rs,nr)bc, SAB(r)0/a; Filter: IRAC 3.6µm; North: left, East: down; Field dimensions:
17.5× 12.8 arcmin; Surface brightness range displayed: 12.5−28.0 mag arcsec−2

– 188 –
Fig. 1.137.— NGC 5216 (right) and NGC 5218 (left) - S4G mid-IR classifications:
E0(shells?) pec, SB(rs)a pec, respectively; Filter: IRAC 3.6µm; North: left, East: down;
Field dimensions: 7.9× 5.7 arcmin; Surface brightness range displayed: 14.0−28.0 mag
arcsec−2

– 189 –
Fig. 1.138.— NGC 5248 - S4G mid-IR classification: SAB(s,nr)bc ; Filter: IRAC 3.6µm;
North: up, East: left; Field dimensions: 7.0× 5.1 arcmin; Surface brightness range displayed:
13.5−28.0 mag arcsec−2
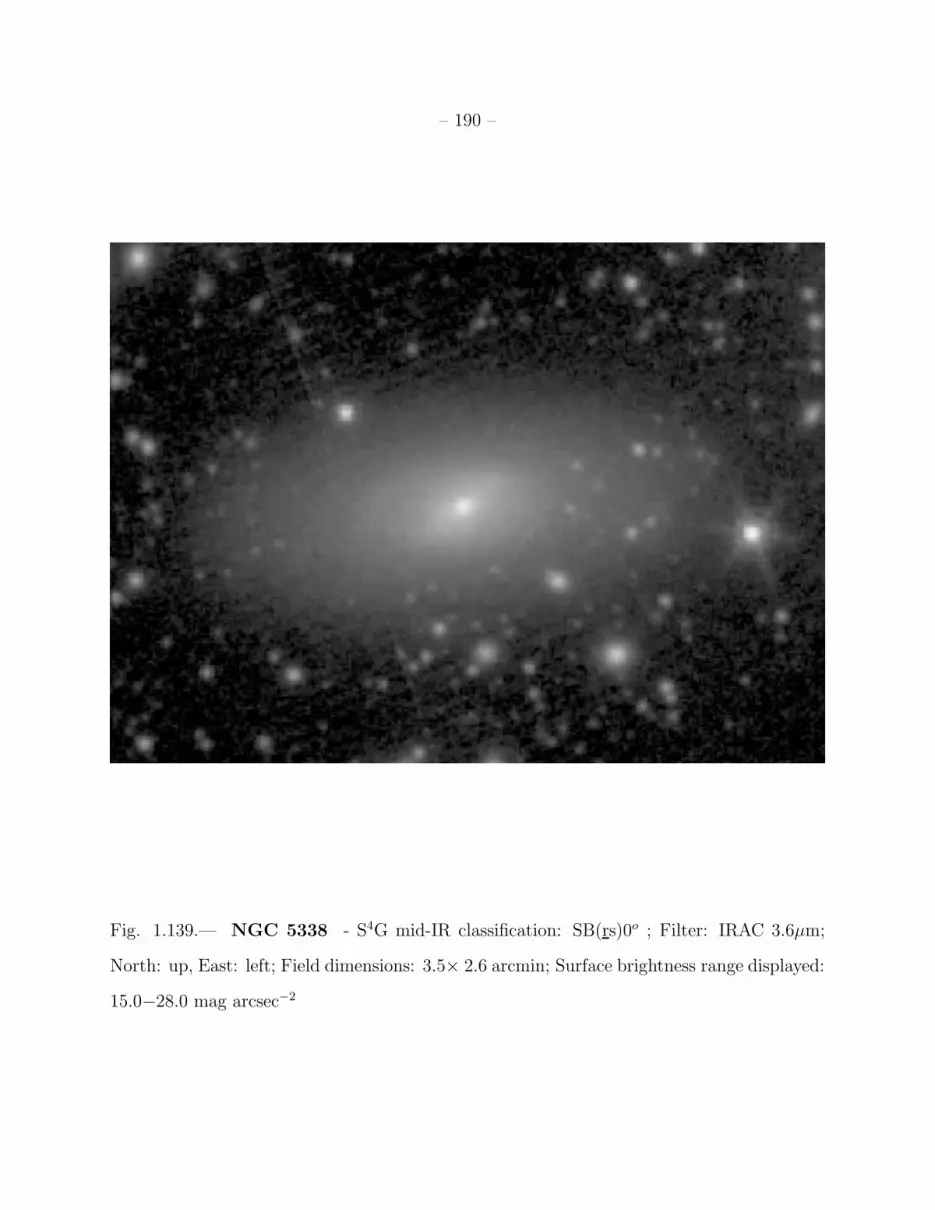
– 190 –
Fig. 1.139.— NGC 5338 - S4G mid-IR classification: SB(rs)0o ; Filter: IRAC 3.6µm;
North: up, East: left; Field dimensions: 3.5× 2.6 arcmin; Surface brightness range displayed:
15.0−28.0 mag arcsec−2

– 191 –
Fig. 1.140.— NGC 5350 - S4G mid-IR classification: SB(rs)ab ; Filter: IRAC 3.6µm;
North: up, East: left; Field dimensions: 3.5× 2.6 arcmin; Surface brightness range displayed:
14.0−28.0 mag arcsec−2
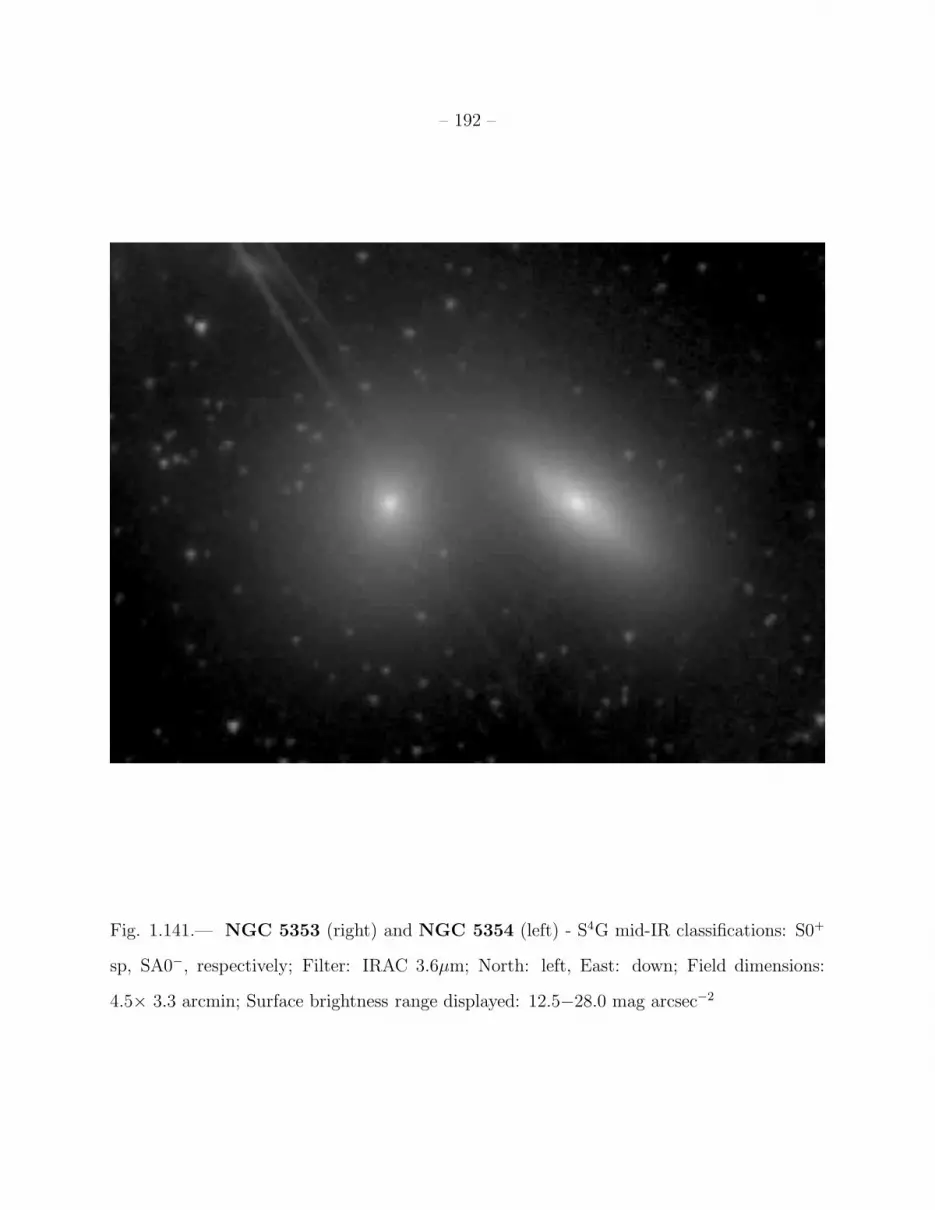
– 192 –
Fig. 1.141.— NGC 5353 (right) and NGC 5354 (left) - S4G mid-IR classifications: S0+
sp, SA0−, respectively; Filter: IRAC 3.6µm; North: left, East: down; Field dimensions:
4.5× 3.3 arcmin; Surface brightness range displayed: 12.5−28.0 mag arcsec−2

– 193 –
Fig. 1.142.— NGC 5355 - S4G mid-IR classification: SAB(s)0o ; Filter: IRAC 3.6µm;
North: up, East: left; Field dimensions: 2.6× 1.9 arcmin; Surface brightness range displayed:
14.0−28.0 mag arcsec−2
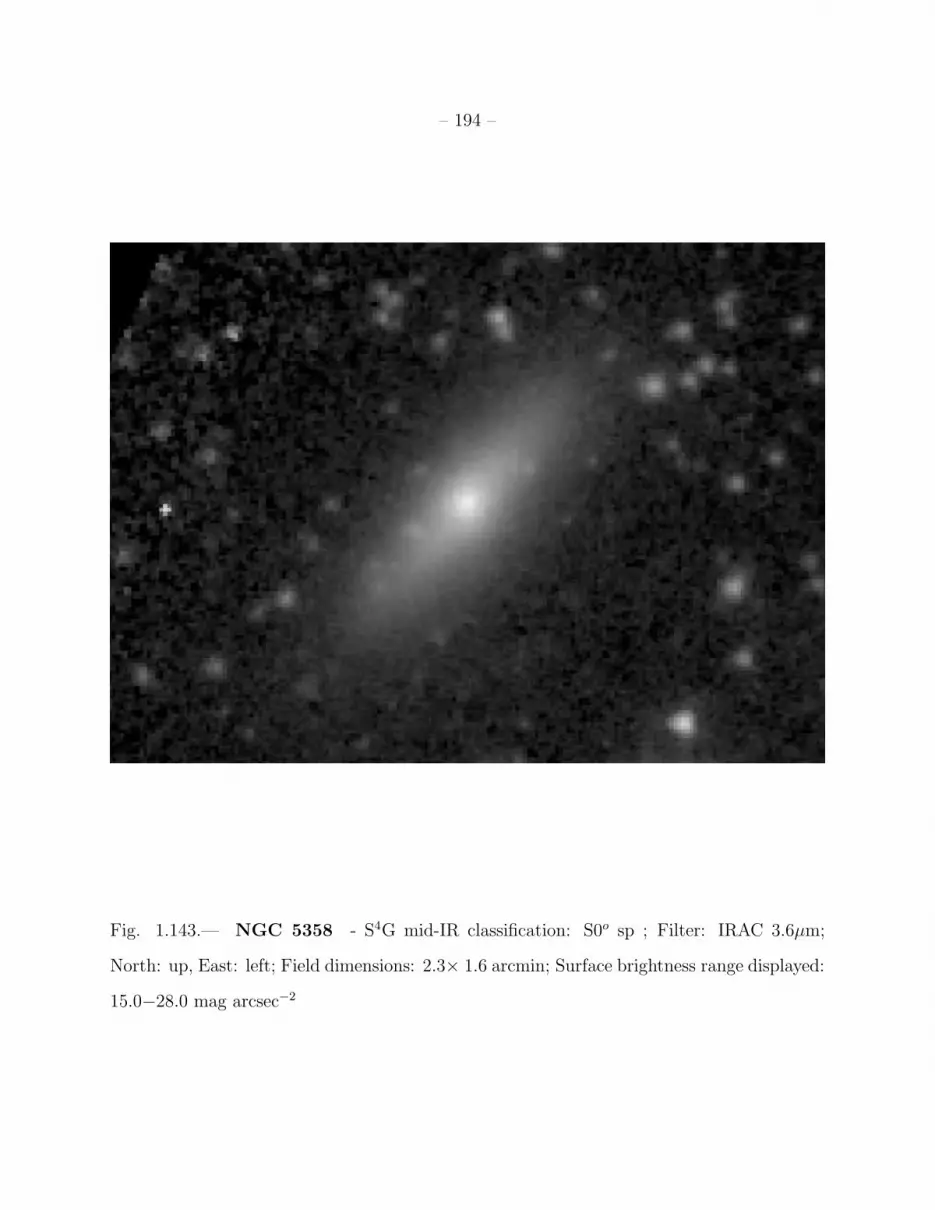
– 194 –
Fig. 1.143.— NGC 5358 - S4G mid-IR classification: S0o sp ; Filter: IRAC 3.6µm;
North: up, East: left; Field dimensions: 2.3× 1.6 arcmin; Surface brightness range displayed:
15.0−28.0 mag arcsec−2

– 195 –
Fig. 1.144.— NGC 5377 - S4G mid-IR classification: (R1)SAB(s)0/a ; Filter: IRAC
3.6µm; North: left, East: down; Field dimensions: 5.8× 4.2 arcmin; Surface brightness
range displayed: 13.0−28.0 mag arcsec−2
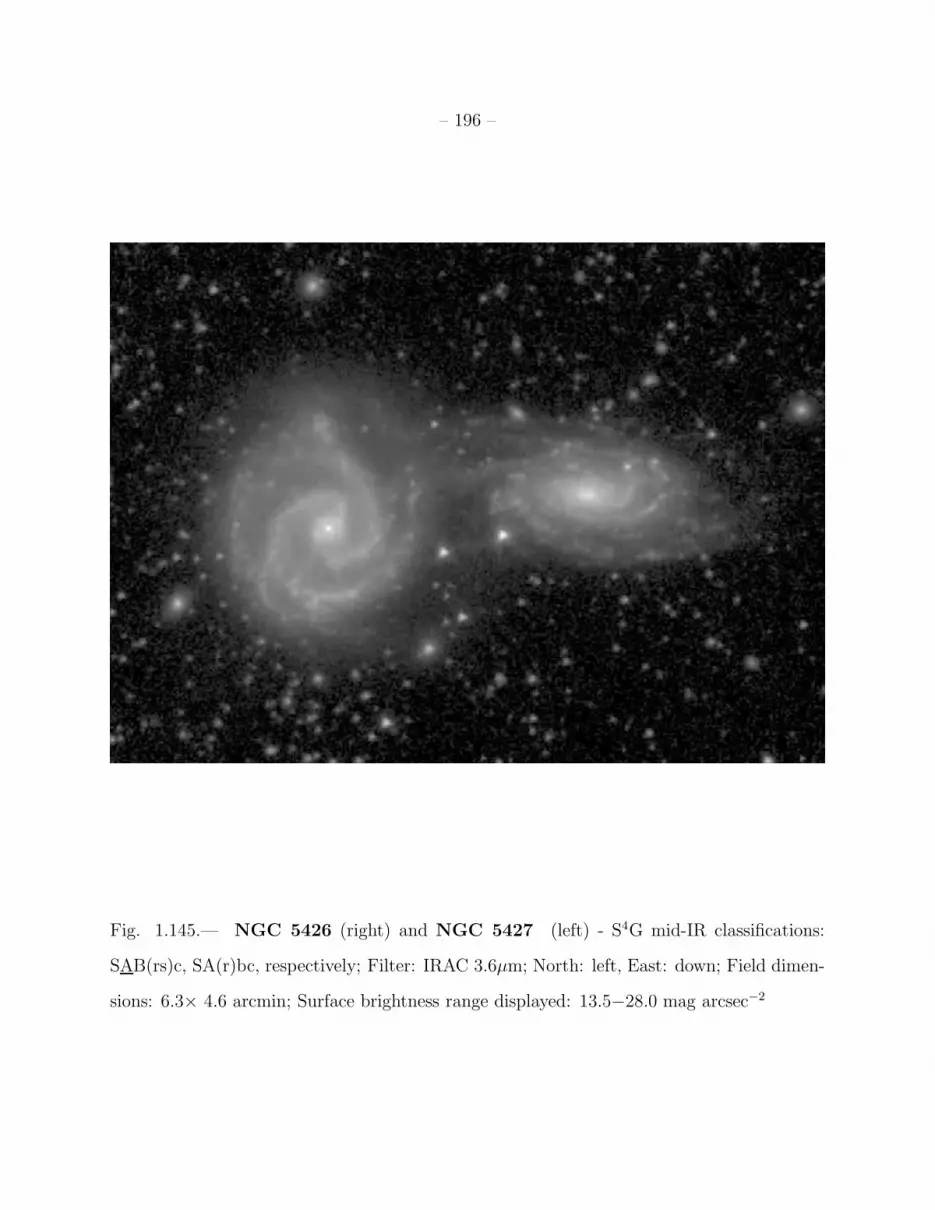
– 196 –
Fig. 1.145.— NGC 5426 (right) and NGC 5427 (left) - S4G mid-IR classifications:
SAB(rs)c, SA(r)bc, respectively; Filter: IRAC 3.6µm; North: left, East: down; Field dimen-
sions: 6.3× 4.6 arcmin; Surface brightness range displayed: 13.5−28.0 mag arcsec−2
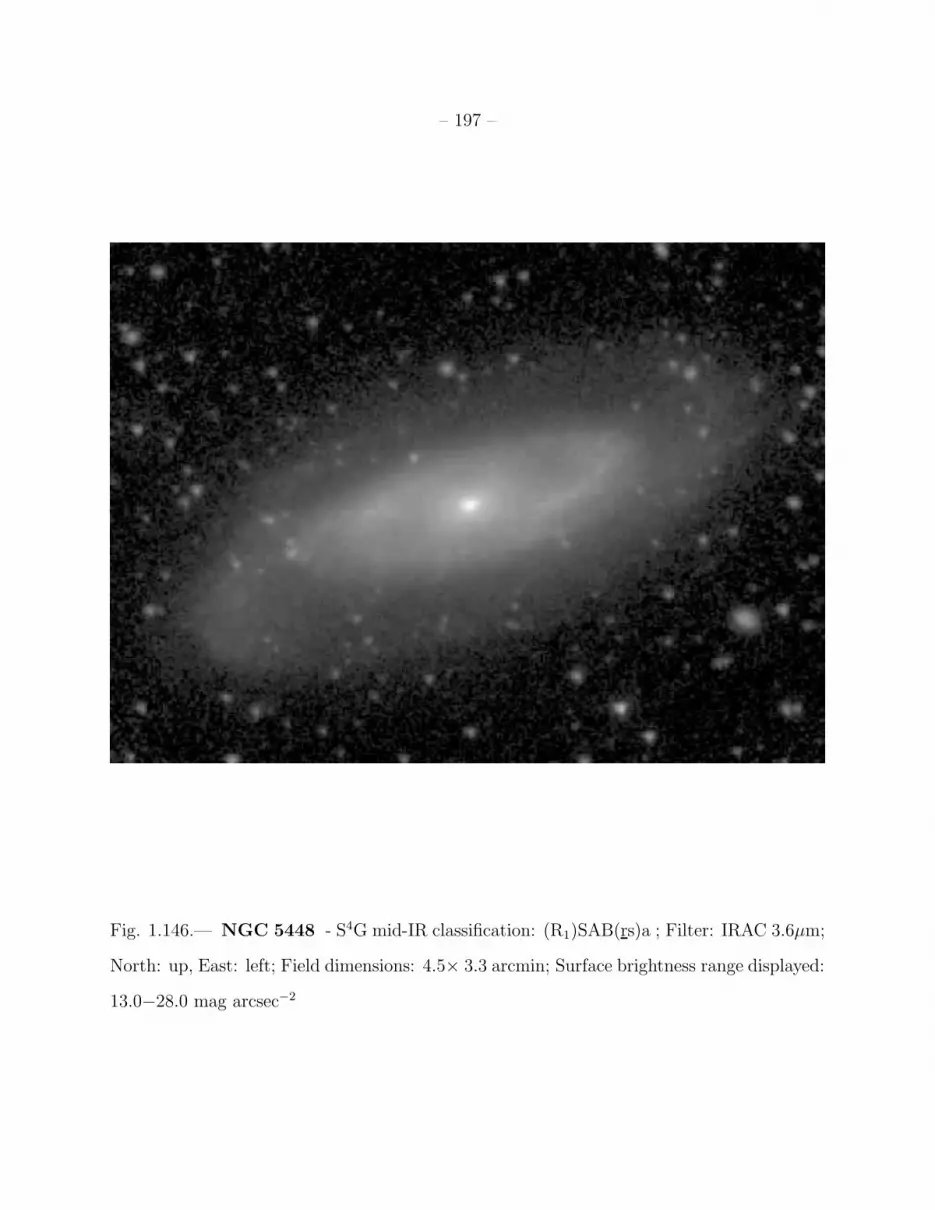
– 197 –
Fig. 1.146.— NGC 5448 - S4G mid-IR classification: (R1)SAB(rs)a ; Filter: IRAC 3.6µm;
North: up, East: left; Field dimensions: 4.5× 3.3 arcmin; Surface brightness range displayed:
13.0−28.0 mag arcsec−2
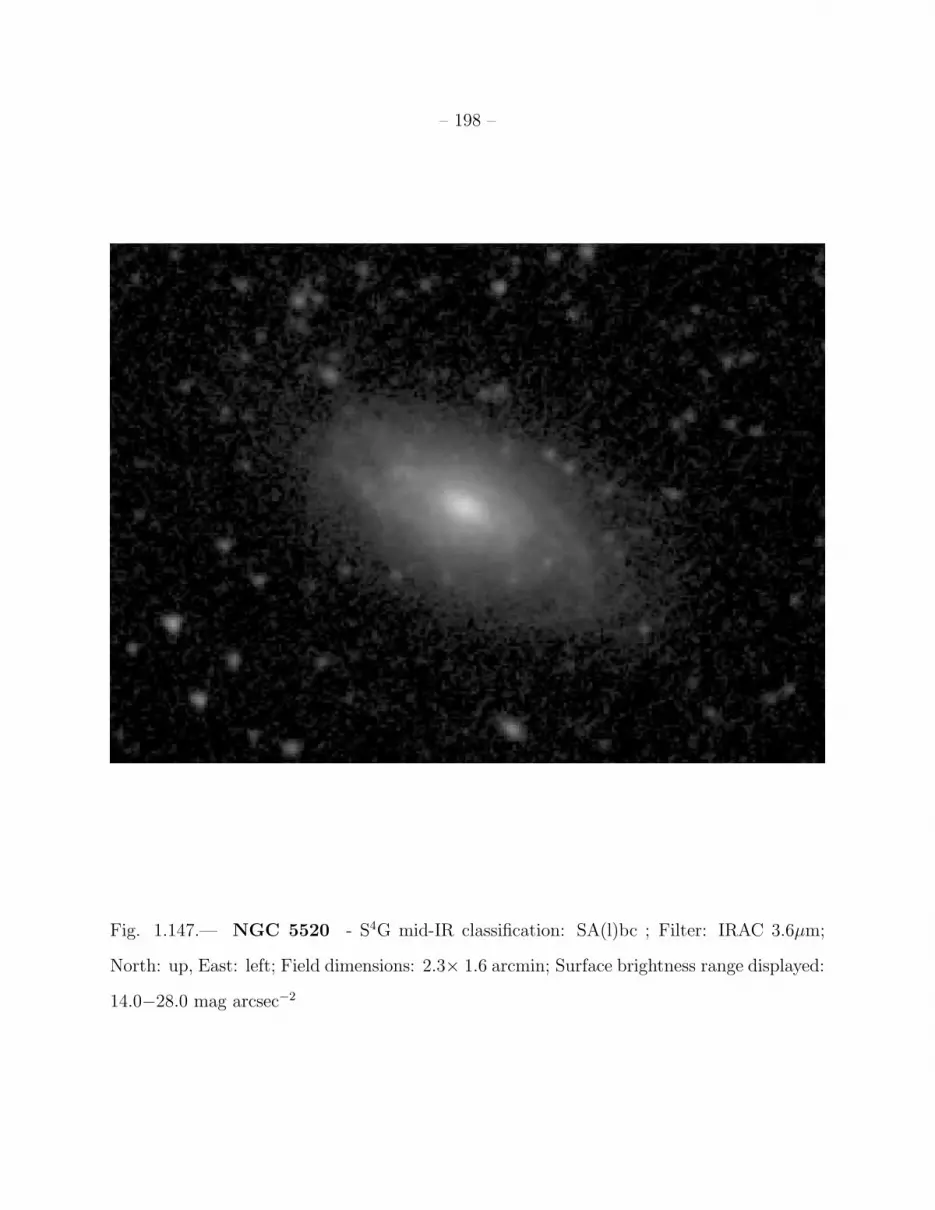
– 198 –
Fig. 1.147.— NGC 5520 - S4G mid-IR classification: SA(l)bc ; Filter: IRAC 3.6µm;
North: up, East: left; Field dimensions: 2.3× 1.6 arcmin; Surface brightness range displayed:
14.0−28.0 mag arcsec−2

– 199 –
Fig. 1.148.— NGC 5713 - S4G mid-IR classification: (R′)SB(rs)ab: pec ; Filter: IRAC
3.6µm; North: left, East: down; Field dimensions: 4.9× 3.5 arcmin; Surface brightness range
displayed: 13.0−28.0 mag arcsec−2
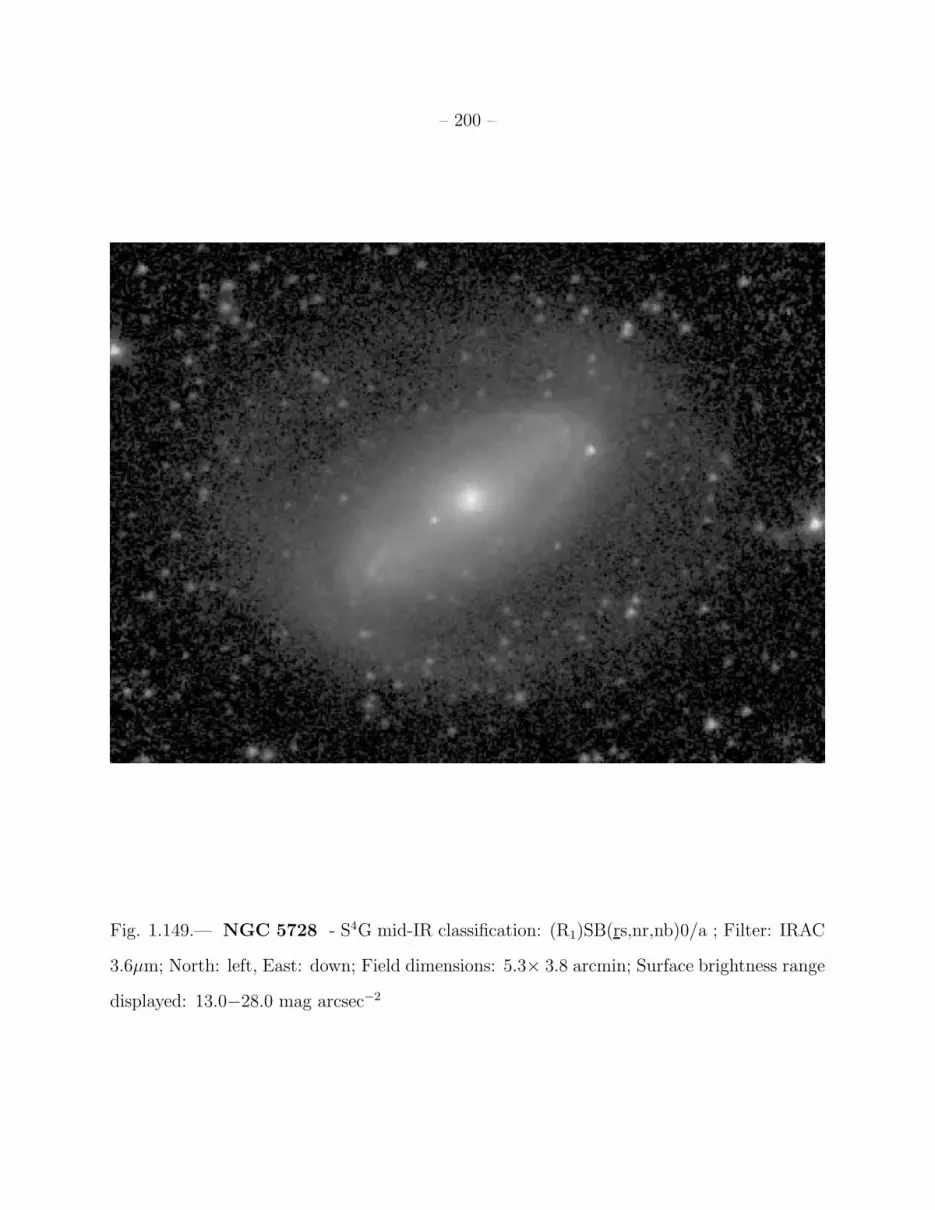
– 200 –
Fig. 1.149.— NGC 5728 - S4G mid-IR classification: (R1)SB(rs,nr,nb)0/a ; Filter: IRAC
3.6µm; North: left, East: down; Field dimensions: 5.3× 3.8 arcmin; Surface brightness range
displayed: 13.0−28.0 mag arcsec−2
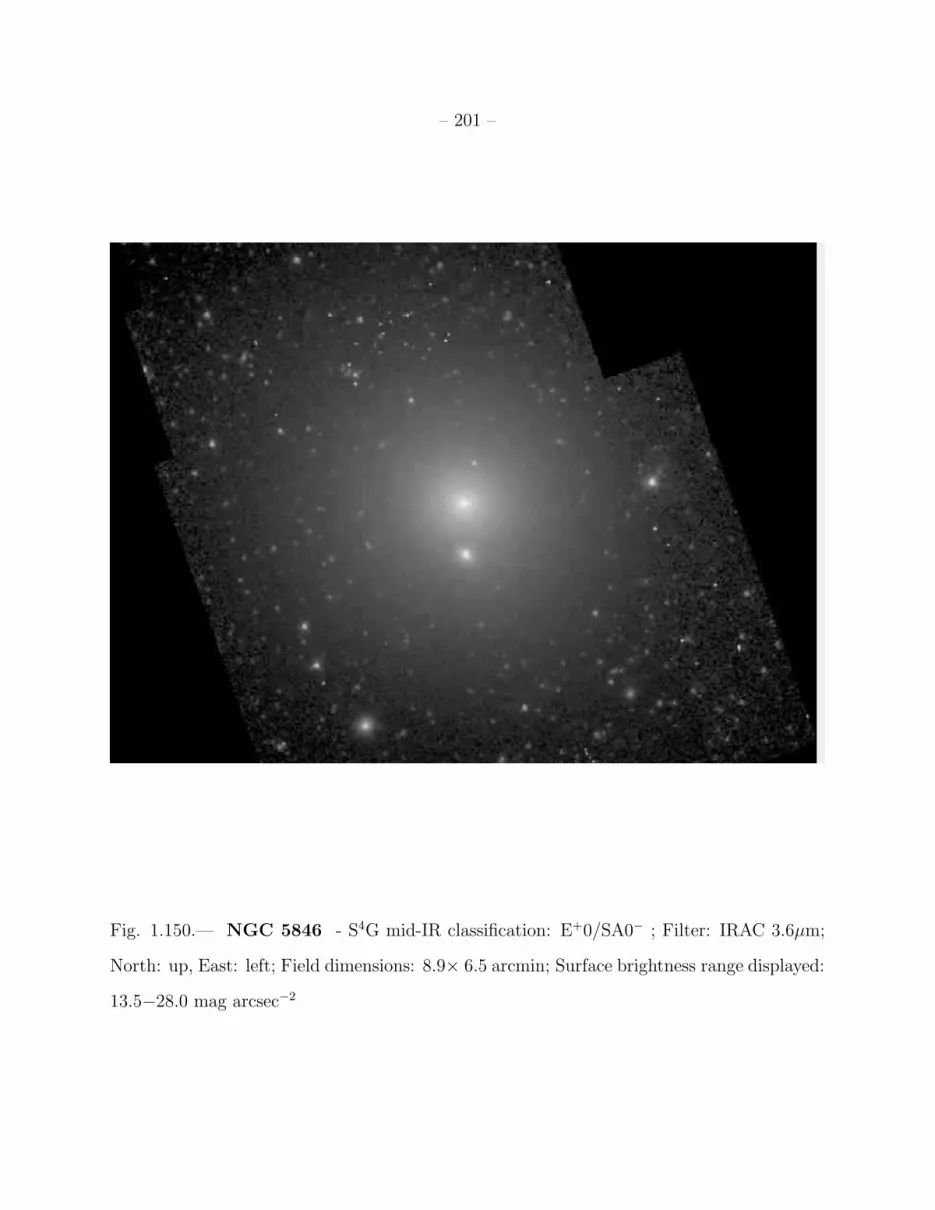
– 201 –
Fig. 1.150.— NGC 5846 - S4G mid-IR classification: E+0/SA0− ; Filter: IRAC 3.6µm;
North: up, East: left; Field dimensions: 8.9× 6.5 arcmin; Surface brightness range displayed:
13.5−28.0 mag arcsec−2
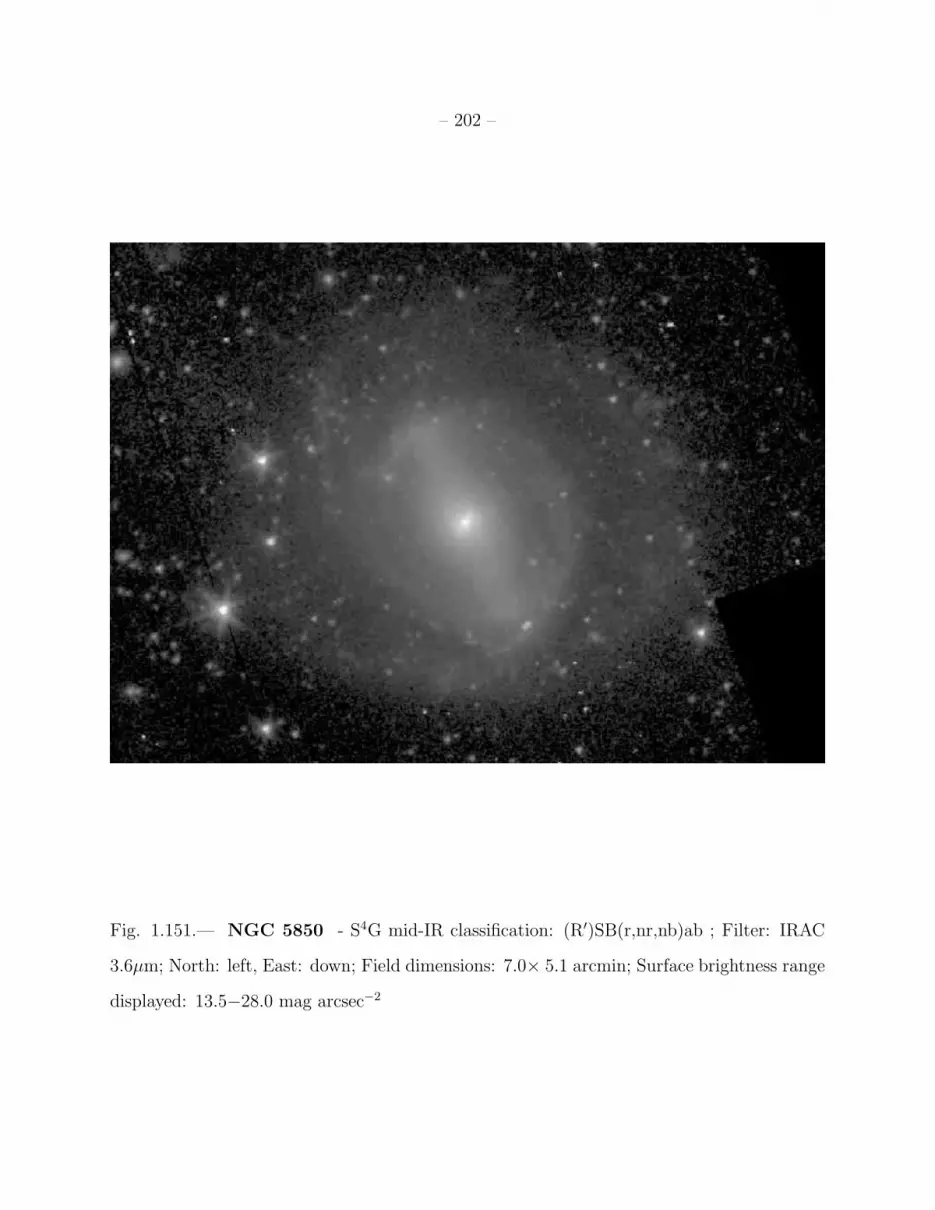
– 202 –
Fig. 1.151.— NGC 5850 - S4G mid-IR classification: (R′)SB(r,nr,nb)ab ; Filter: IRAC
3.6µm; North: left, East: down; Field dimensions: 7.0× 5.1 arcmin; Surface brightness range
displayed: 13.5−28.0 mag arcsec−2

– 203 –
Fig. 1.152.— NGC 5981 - S4G mid-IR classification: S0+ sp ; Filter: IRAC 3.6µm; North:
left, East: down; Field dimensions: 4.0× 2.9 arcmin; Surface brightness range displayed:
14.5−28.0 mag arcsec−2

– 204 –
Fig. 1.153.— NGC 5982 - S4G mid-IR classification: E2 ; Filter: IRAC 3.6µm; North: up,
East: left; Field dimensions: 7.0× 5.1 arcmin; Surface brightness range displayed: 13.0−28.0
mag arcsec−2
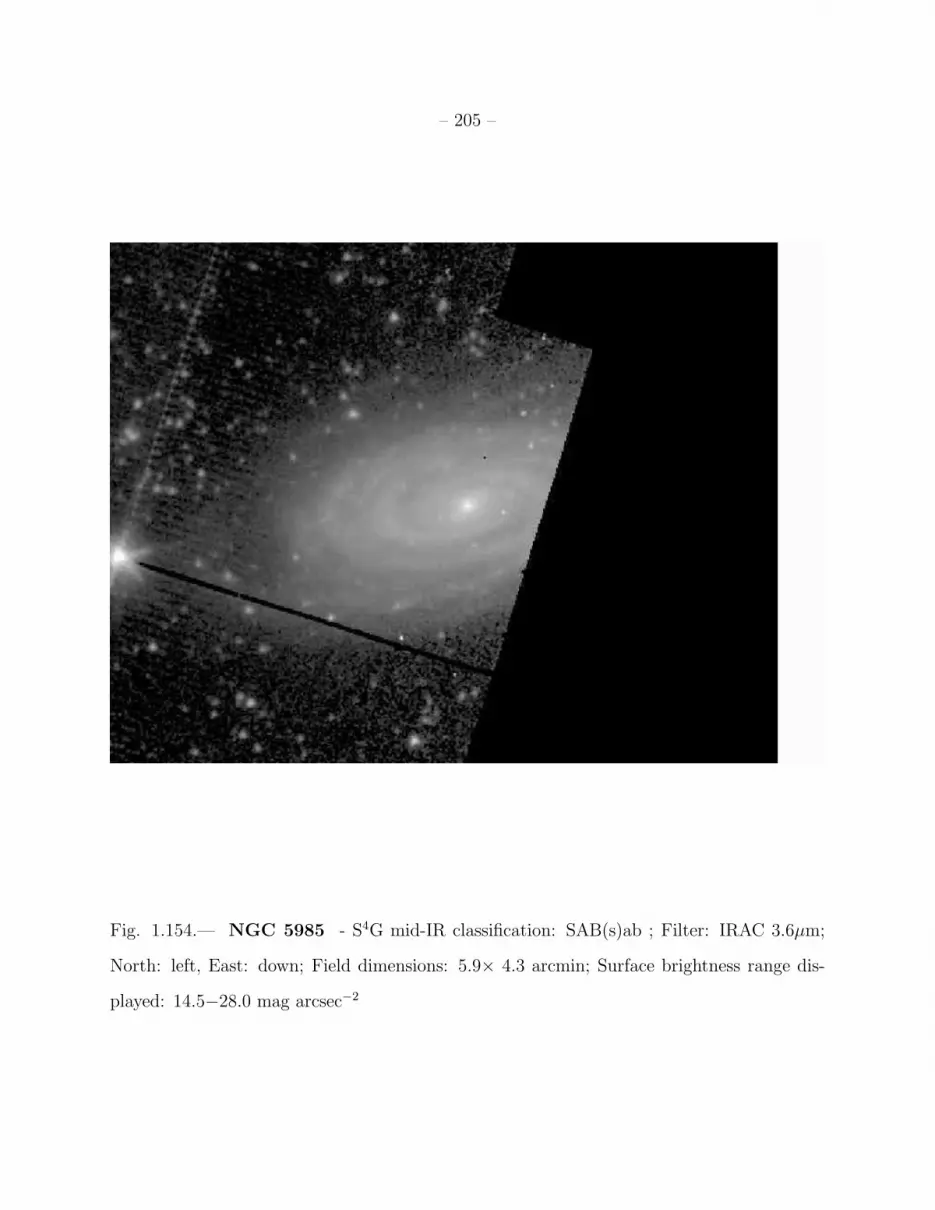
– 205 –
Fig. 1.154.— NGC 5985 - S4G mid-IR classification: SAB(s)ab ; Filter: IRAC 3.6µm;
North: left, East: down; Field dimensions: 5.9× 4.3 arcmin; Surface brightness range dis-
played: 14.5−28.0 mag arcsec−2

– 206 –
Fig. 1.155.— NGC 7064 - S4G mid-IR classification: Sd sp ; Filter: IRAC 3.6µm;
North: up, East: left; Field dimensions: 4.5× 3.3 arcmin; Surface brightness range displayed:
18.0−28.0 mag arcsec−2
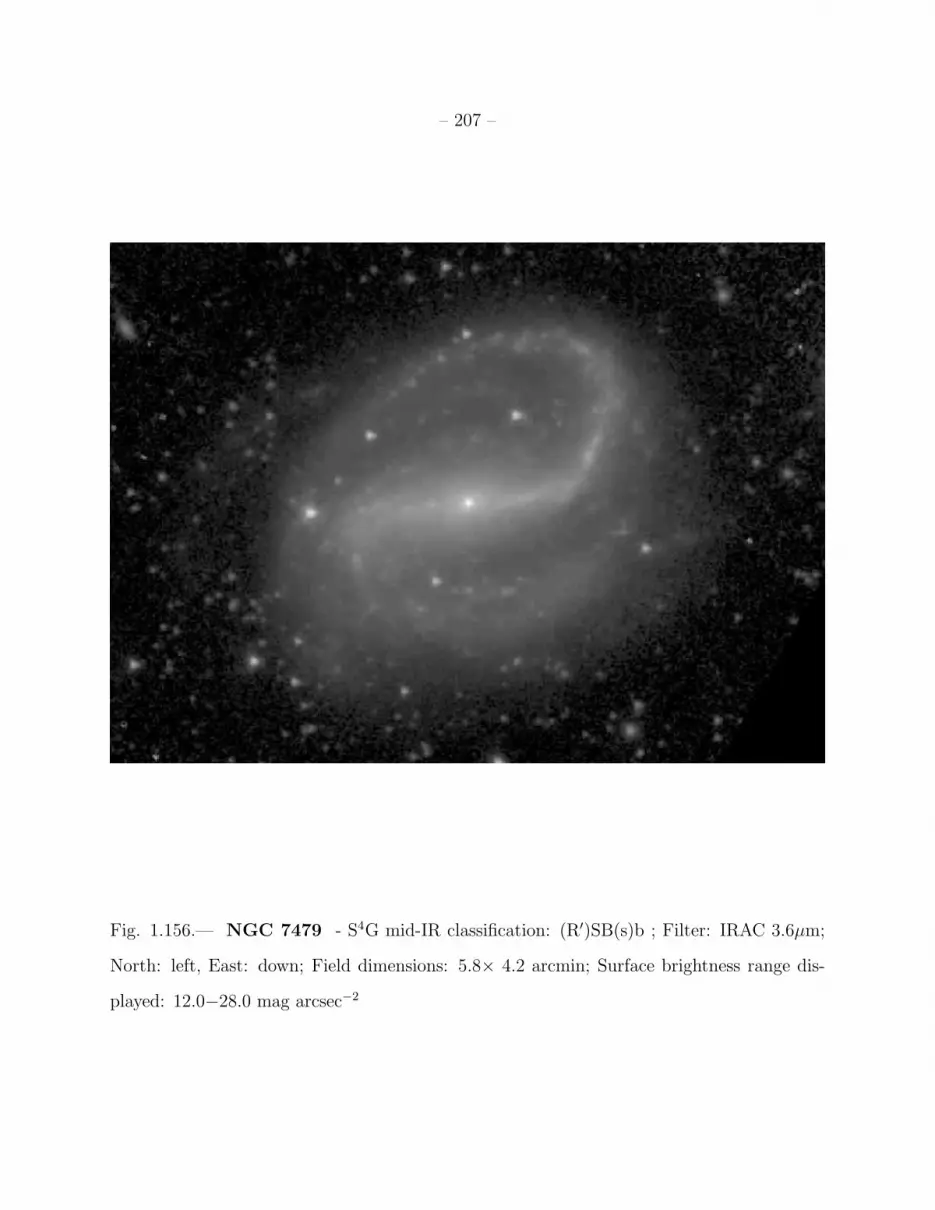
– 207 –
Fig. 1.156.— NGC 7479 - S4G mid-IR classification: (R′)SB(s)b ; Filter: IRAC 3.6µm;
North: left, East: down; Field dimensions: 5.8× 4.2 arcmin; Surface brightness range dis-
played: 12.0−28.0 mag arcsec−2

– 208 –
Fig. 1.157.— NGC 7552 - S4G mid-IR classification: (R′
1)SB(rs,nr)a ; Filter: IRAC
3.6µm; North: up, East: left; Field dimensions: 6.3× 4.6 arcmin; Surface brightness range
displayed: 12.0−28.0 mag arcsec−2

– 209 –
Fig. 1.158.— NGC 7731 (upper right) and NGC 7732 (lower left) - S4G mid-IR clas-
sifications: (R1R′
2)SAB(r)a, SBd: sp, respectively; Filter: IRAC 3.6µm; North: up, East:
left; Field dimensions: 4.5× 3.3 arcmin; Surface brightness range displayed: 14.0−28.0 mag
arcsec−2

– 210 –
Fig. 1.159.— NGC 7793 - S4G mid-IR classification: SA(s)c ; Filter: IRAC 3.6µm; North:
up, East: left; Field dimensions: 11.7× 8.5 arcmin; Surface brightness range displayed:
14.0−28.0 mag arcsec−2

– 211 –
Fig. 1.160.— IC 749 - S4G mid-IR classification: SB(rs)cd ; Filter: IRAC 3.6µm;
North: up, East: left; Field dimensions: 4.0× 2.9 arcmin; Surface brightness range dis-
played: 16.5−28.0 mag arcsec−2

– 212 –
Fig. 1.161.— IC 750 - S4G mid-IR classification: SA(s)a ; Filter: IRAC 3.6µm; North: up,
East: left; Field dimensions: 4.0× 2.9 arcmin; Surface brightness range displayed: 13.0−28.0
mag arcsec−2

– 213 –
Fig. 1.162.— IC 797 - S4G mid-IR classification: SAB(s)dm: ; Filter: IRAC 3.6µm;
North: up, East: left; Field dimensions: 2.9× 2.1 arcmin; Surface brightness range displayed:
17.0−28.0 mag arcsec−2
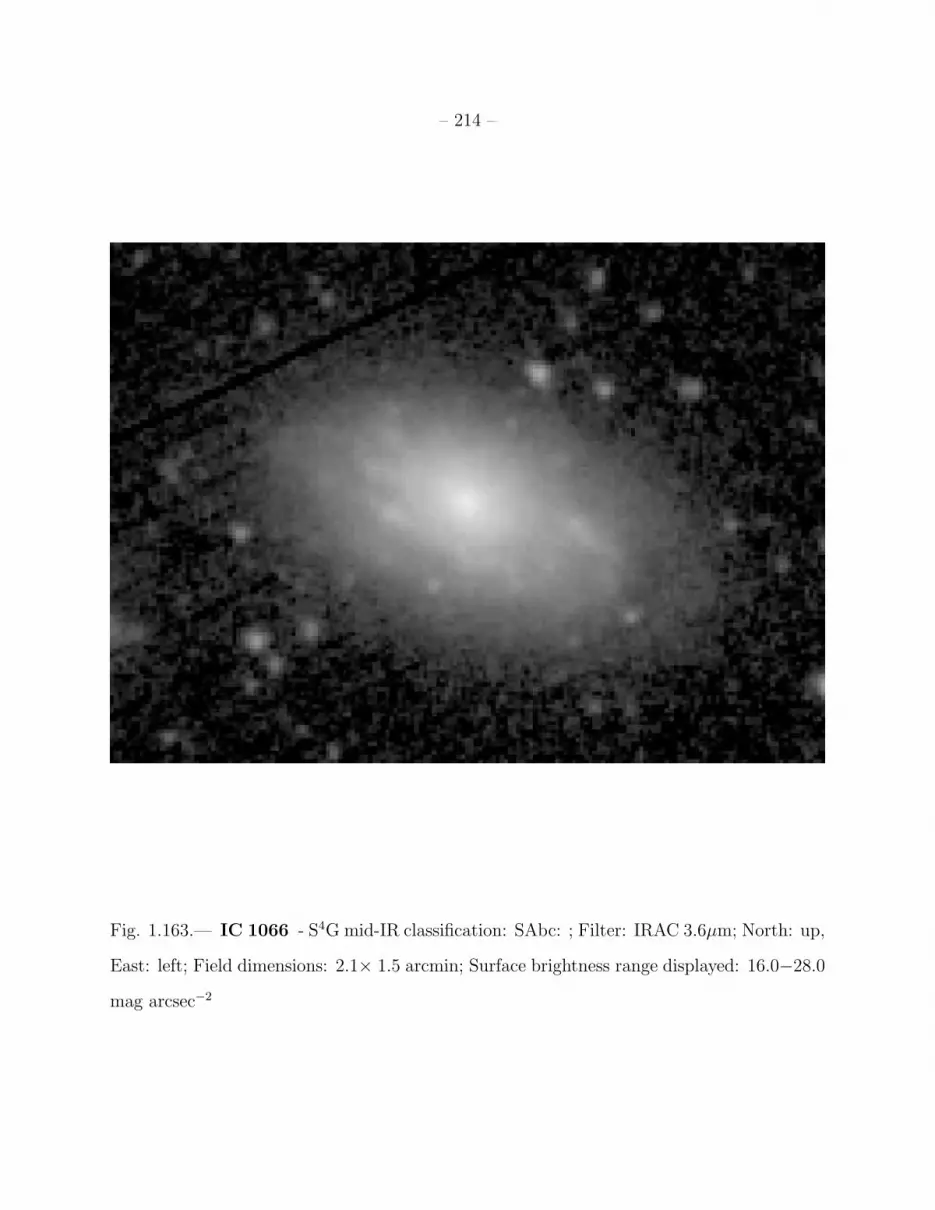
– 214 –
Fig. 1.163.— IC 1066 - S4G mid-IR classification: SAbc: ; Filter: IRAC 3.6µm; North: up,
East: left; Field dimensions: 2.1× 1.5 arcmin; Surface brightness range displayed: 16.0−28.0
mag arcsec−2
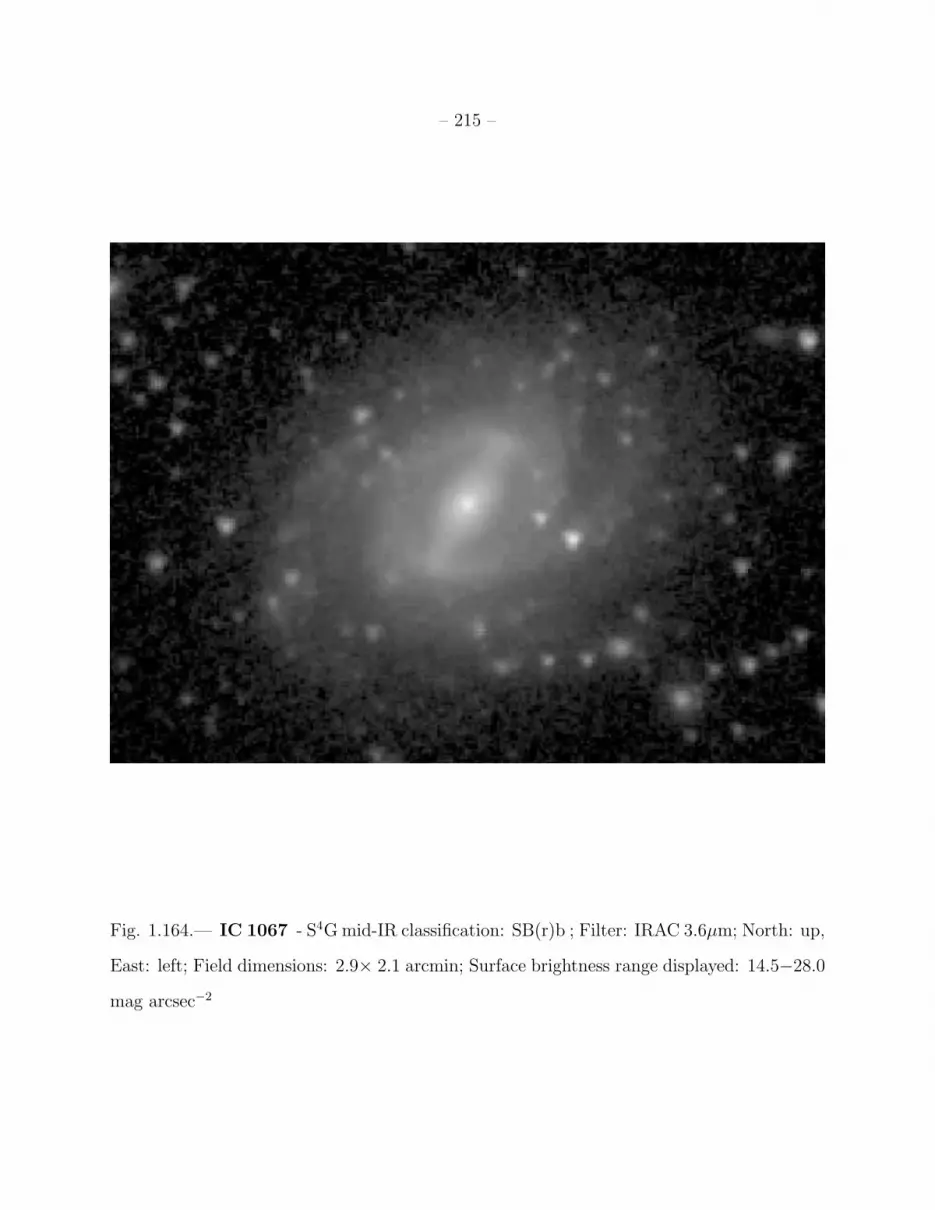
– 215 –
Fig. 1.164.— IC 1067 - S4Gmid-IR classification: SB(r)b ; Filter: IRAC 3.6µm; North: up,
East: left; Field dimensions: 2.9× 2.1 arcmin; Surface brightness range displayed: 14.5−28.0
mag arcsec−2

– 216 –
Fig. 1.165.— IC 1574 - S4G mid-IR classification: IBm sp? ; Filter: IRAC 3.6µm; North:
left, East: down; Field dimensions: 2.9× 2.1 arcmin; Surface brightness range displayed:
18.5−28.0 mag arcsec−2

– 217 –
Fig. 1.166.— IC 1727 - S4G mid-IR classification: SB(s)m ; Filter: IRAC 3.6µm; North:
left, East: down; Field dimensions: 7.2× 5.2 arcmin; Surface brightness range displayed:
18.5−28.0 mag arcsec−2

– 218 –
Fig. 1.167.— IC 1959 - S4G mid-IR classification: SBd sp ; Filter: IRAC 3.6µm; North:
left, East: down; Field dimensions: 3.5× 2.6 arcmin; Surface brightness range displayed:
17.5−27.0 mag arcsec−2
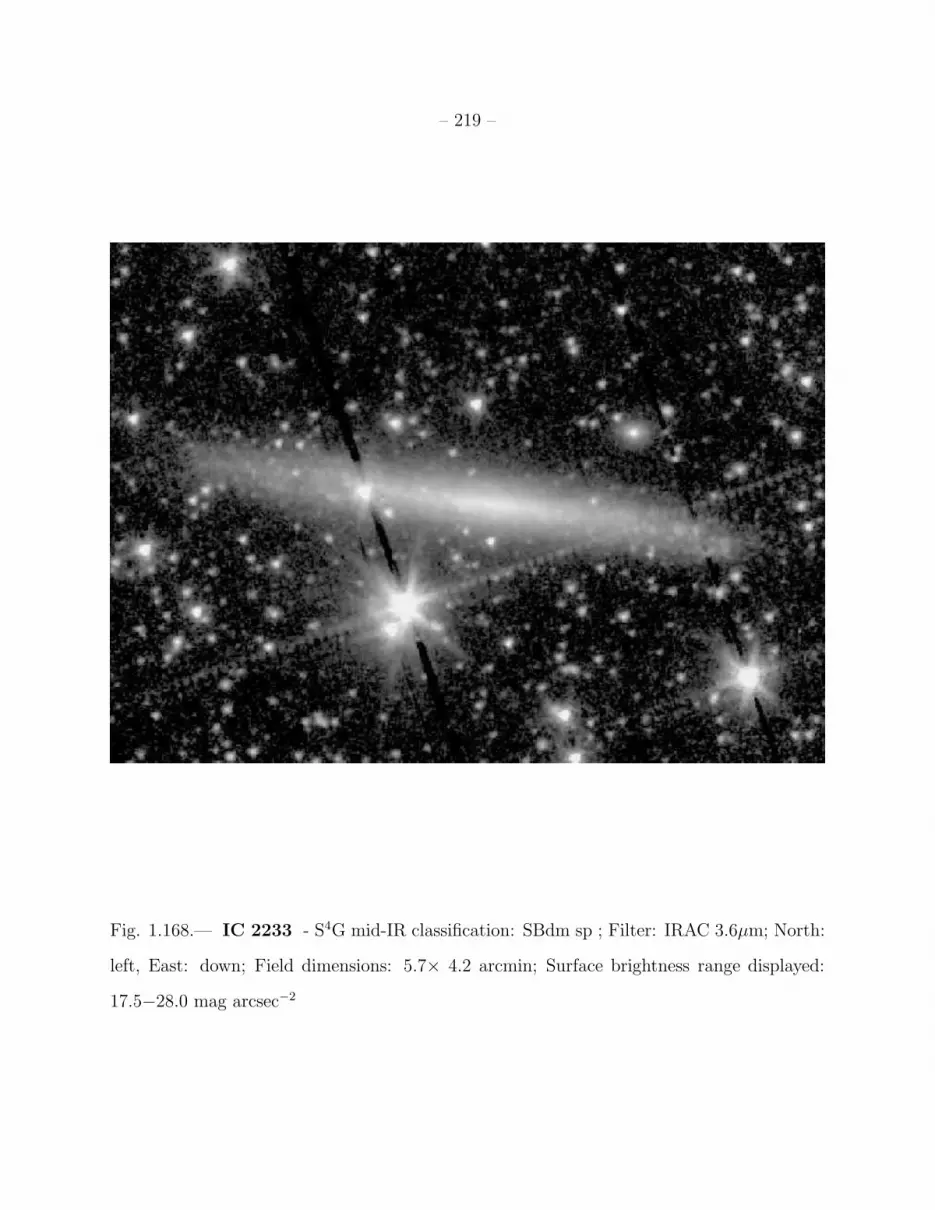
– 219 –
Fig. 1.168.— IC 2233 - S4G mid-IR classification: SBdm sp ; Filter: IRAC 3.6µm; North:
left, East: down; Field dimensions: 5.7× 4.2 arcmin; Surface brightness range displayed:
17.5−28.0 mag arcsec−2
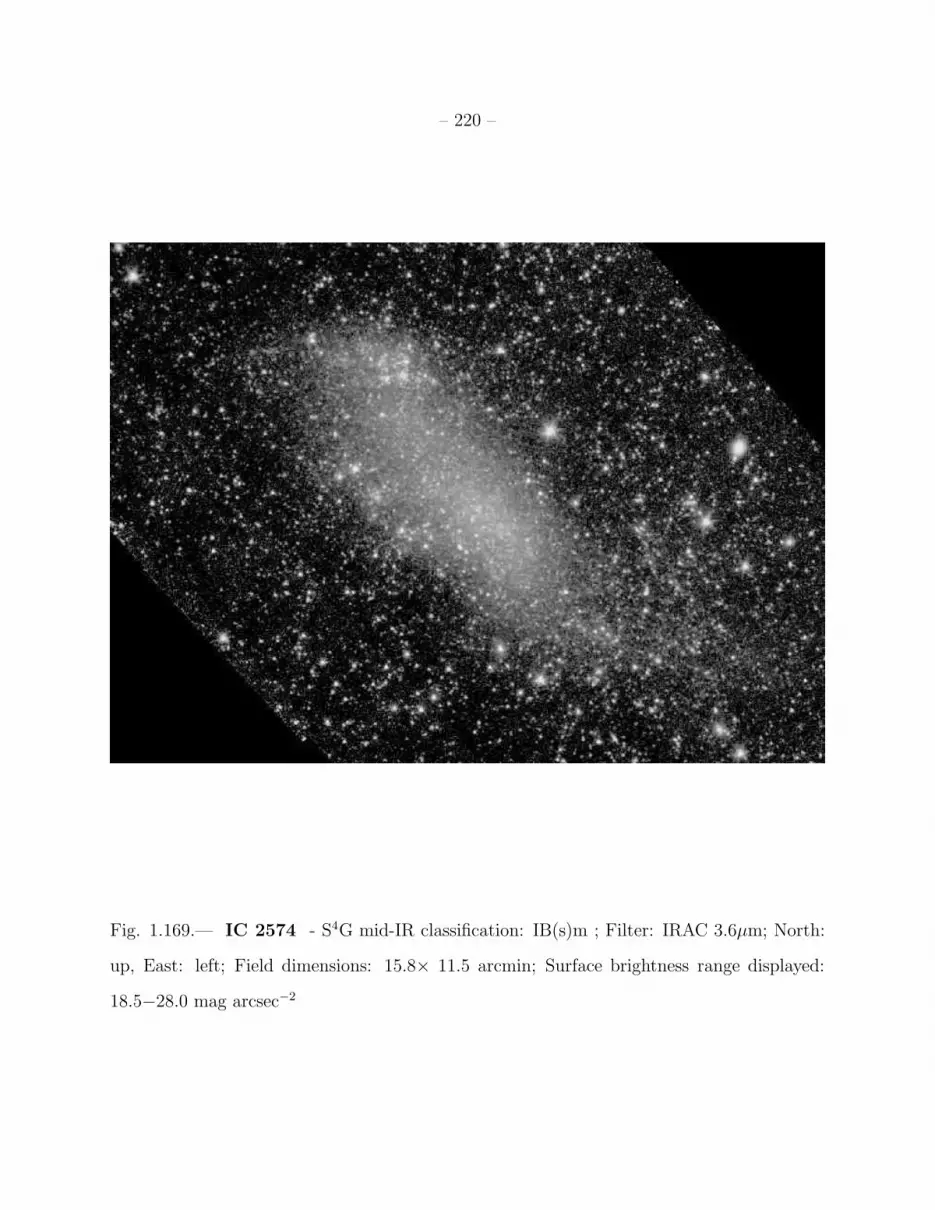
– 220 –
Fig. 1.169.— IC 2574 - S4G mid-IR classification: IB(s)m ; Filter: IRAC 3.6µm; North:
up, East: left; Field dimensions: 15.8× 11.5 arcmin; Surface brightness range displayed:
18.5−28.0 mag arcsec−2

– 221 –
Fig. 1.170.— IC 3392 - S4G mid-IR classification: SA(rs)ab ; Filter: IRAC 3.6µm;
North: up, East: left; Field dimensions: 5.3× 3.8 arcmin; Surface brightness range displayed:
15.0−28.0 mag arcsec−2

– 222 –
Fig. 1.171.— IC 4182 - S4G mid-IR classification: SA(s)m ; Filter: IRAC 3.6µm;
North: up, East: left; Field dimensions: 7.9× 5.8 arcmin; Surface brightness range dis-
played: 18.5−28.0 mag arcsec−2
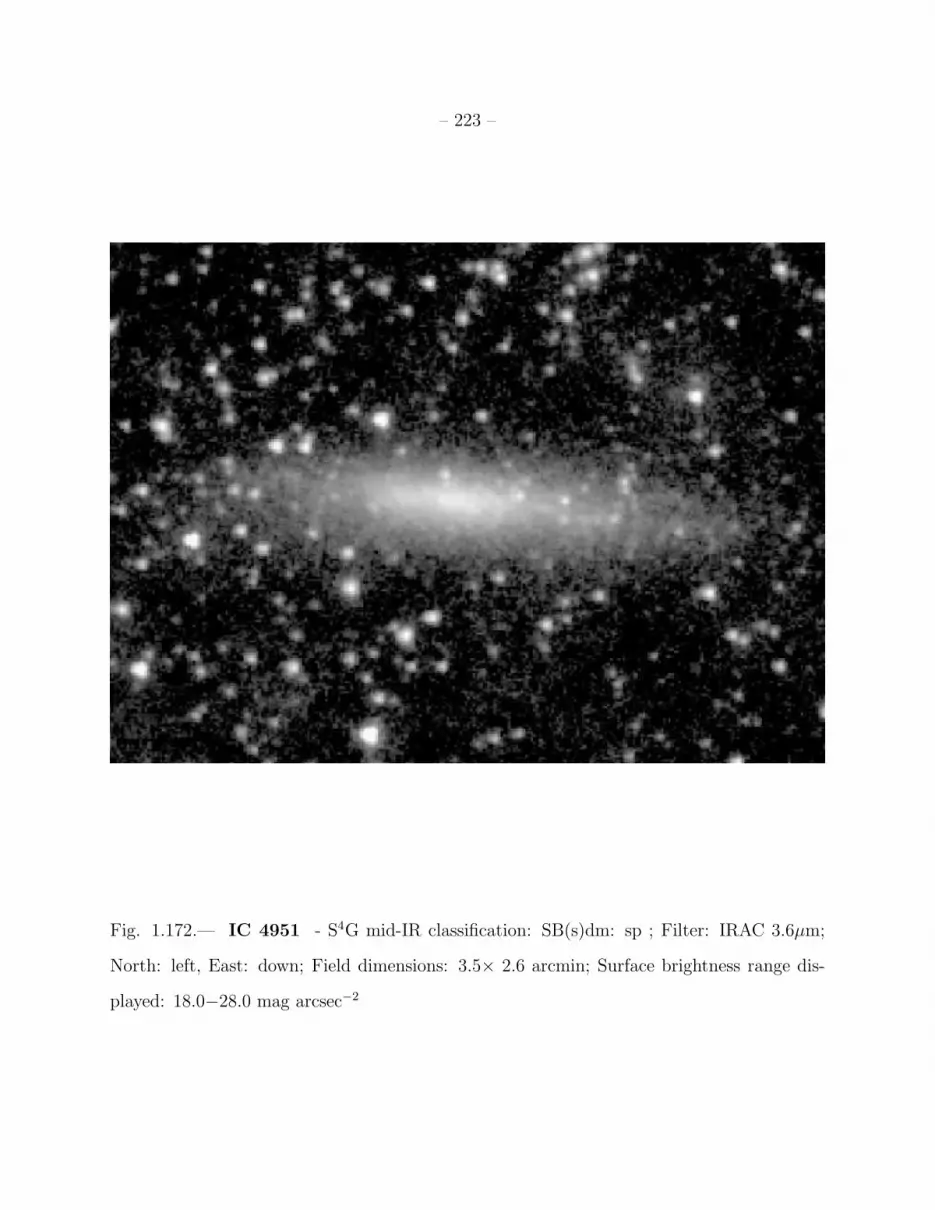
– 223 –
Fig. 1.172.— IC 4951 - S4G mid-IR classification: SB(s)dm: sp ; Filter: IRAC 3.6µm;
North: left, East: down; Field dimensions: 3.5× 2.6 arcmin; Surface brightness range dis-
played: 18.0−28.0 mag arcsec−2

– 224 –
Fig. 1.173.— IC 5052 - S4G mid-IR classification: Sd sp ; Filter: IRAC 3.6µm; North:
left, East: down; Field dimensions: 7.0× 5.1 arcmin; Surface brightness range displayed:
16.5−28.0 mag arcsec−2
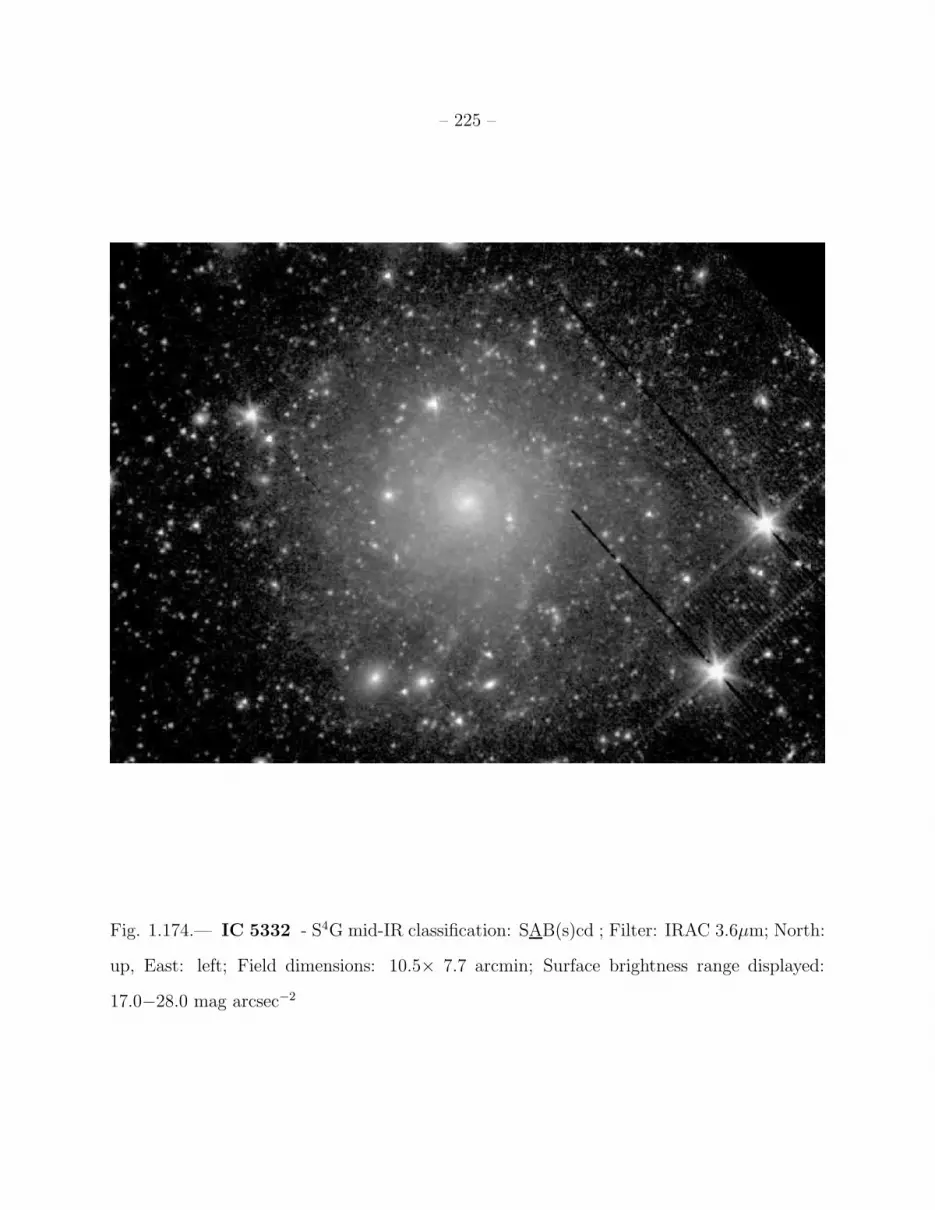
– 225 –
Fig. 1.174.— IC 5332 - S4G mid-IR classification: SAB(s)cd ; Filter: IRAC 3.6µm; North:
up, East: left; Field dimensions: 10.5× 7.7 arcmin; Surface brightness range displayed:
17.0−28.0 mag arcsec−2
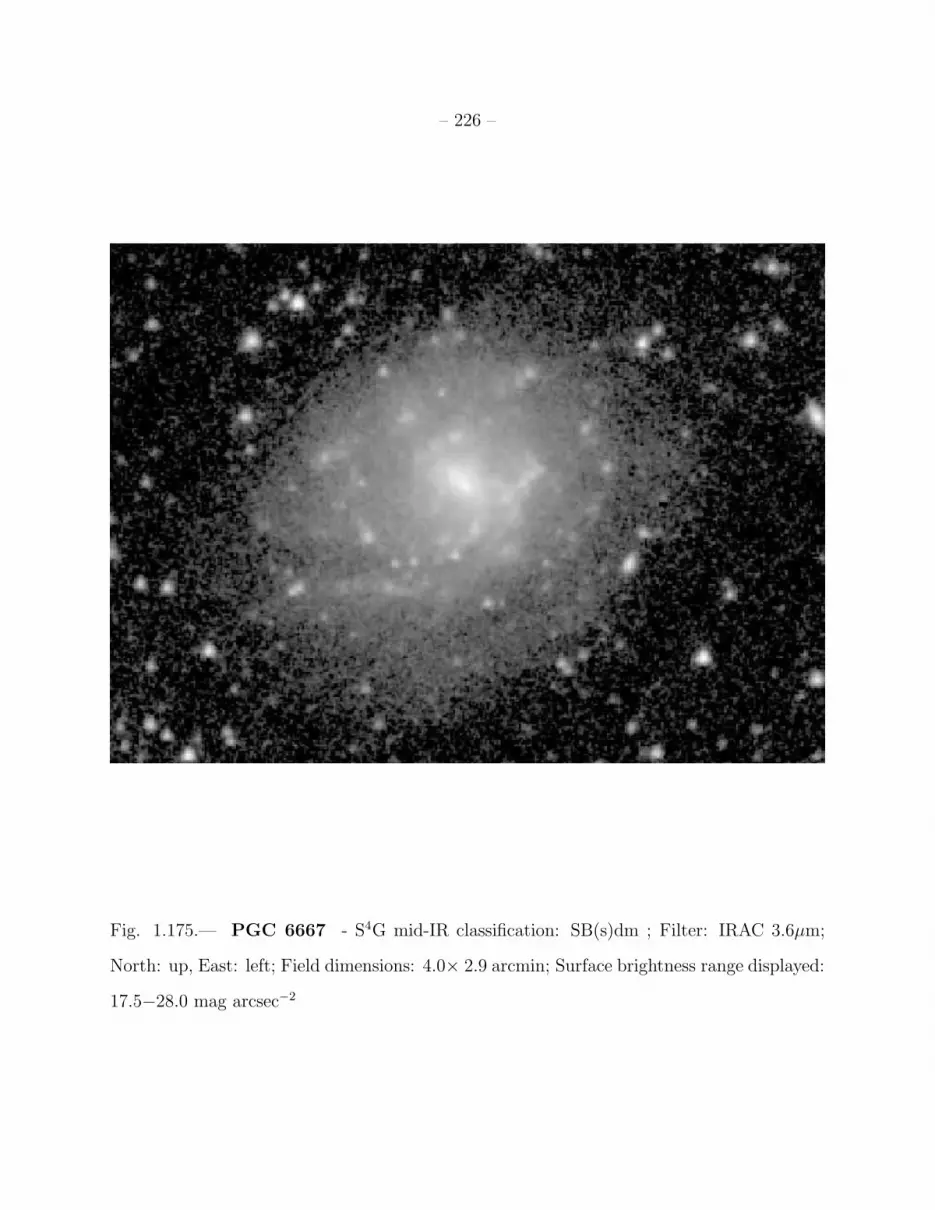
– 226 –
Fig. 1.175.— PGC 6667 - S4G mid-IR classification: SB(s)dm ; Filter: IRAC 3.6µm;
North: up, East: left; Field dimensions: 4.0× 2.9 arcmin; Surface brightness range displayed:
17.5−28.0 mag arcsec−2
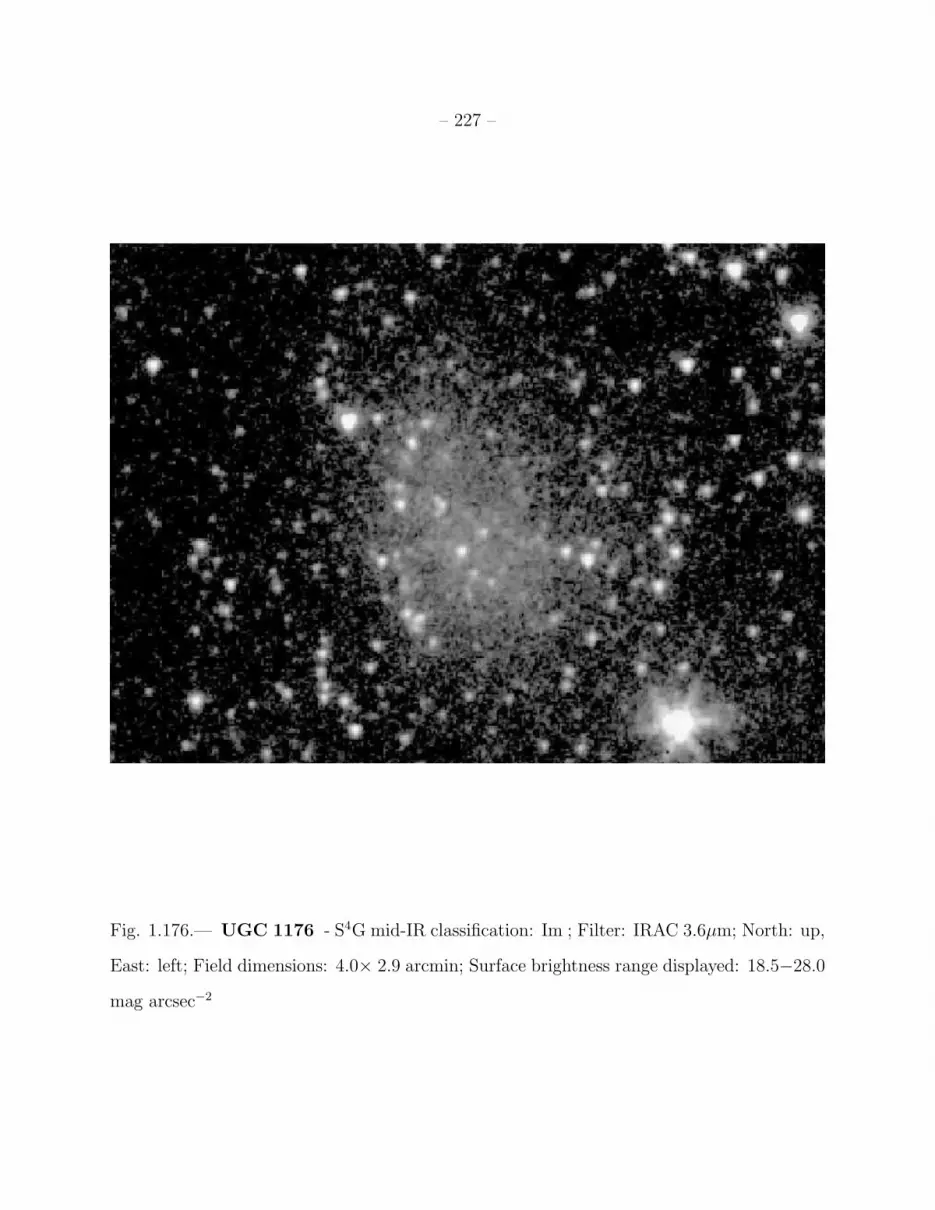
– 227 –
Fig. 1.176.— UGC 1176 - S4G mid-IR classification: Im ; Filter: IRAC 3.6µm; North: up,
East: left; Field dimensions: 4.0× 2.9 arcmin; Surface brightness range displayed: 18.5−28.0
mag arcsec−2

– 228 –
Fig. 1.177.— UGC 4305 - S4G mid-IR classification: Im ; Filter: IRAC 3.6µm; North:
up, East: left; Field dimensions: 10.5× 7.7 arcmin; Surface brightness range displayed:
18.5−28.0 mag arcsec−2

– 229 –
Fig. 1.178.— UGC 4426 - S4G mid-IR classification: Im ; Filter: IRAC 3.6µm; North: up,
East: left; Field dimensions: 3.9× 2.9 arcmin; Surface brightness range displayed: 18.5−28.0
mag arcsec−2
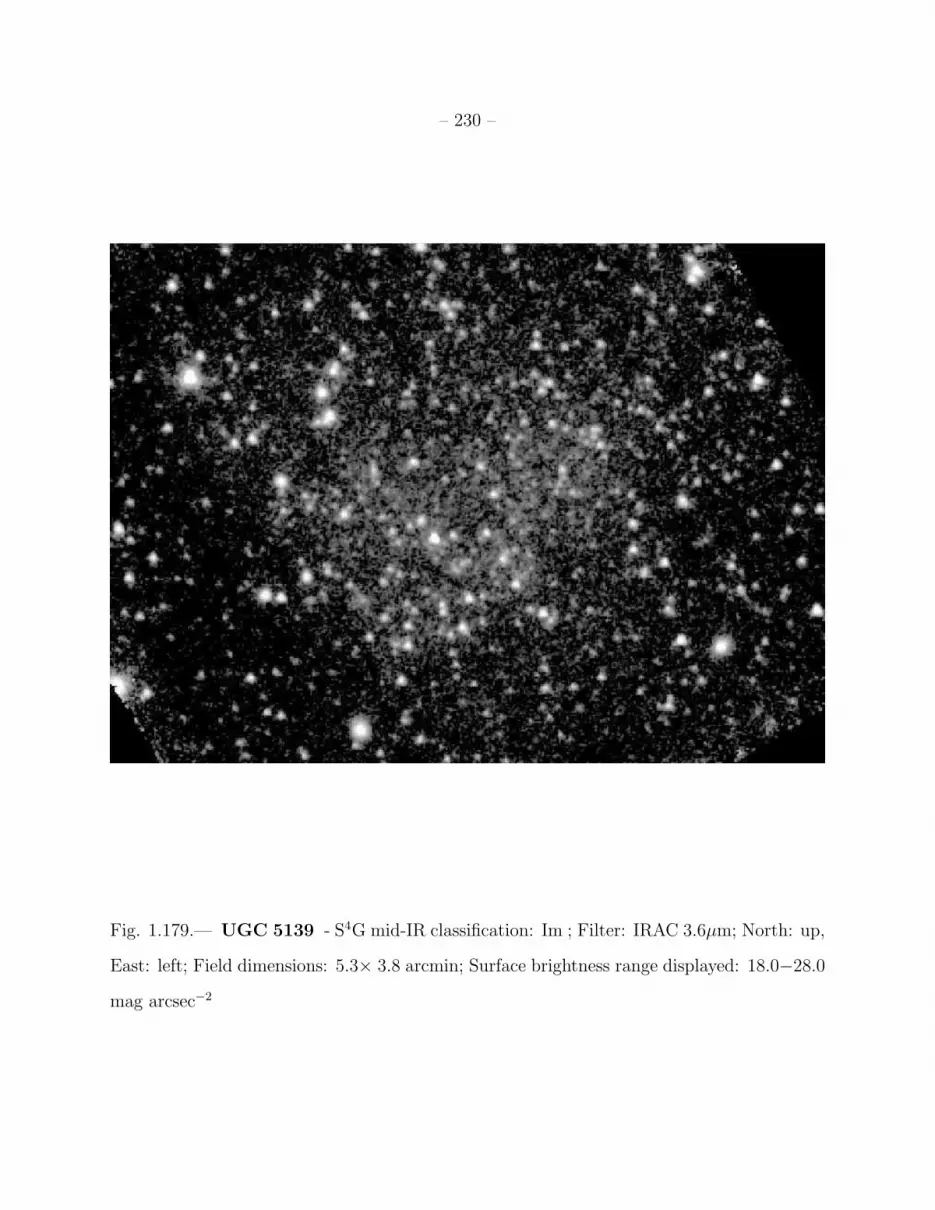
– 230 –
Fig. 1.179.— UGC 5139 - S4G mid-IR classification: Im ; Filter: IRAC 3.6µm; North: up,
East: left; Field dimensions: 5.3× 3.8 arcmin; Surface brightness range displayed: 18.0−28.0
mag arcsec−2
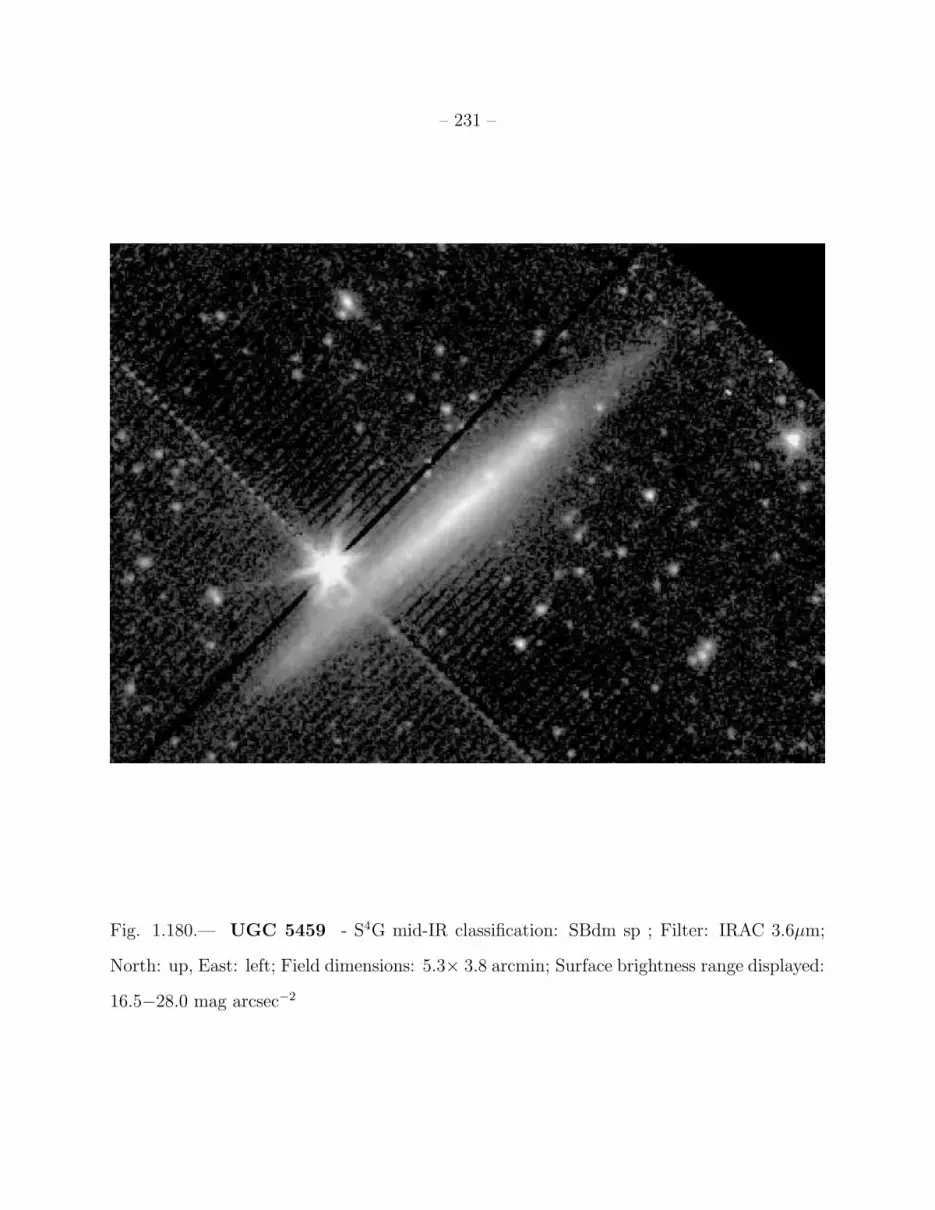
– 231 –
Fig. 1.180.— UGC 5459 - S4G mid-IR classification: SBdm sp ; Filter: IRAC 3.6µm;
North: up, East: left; Field dimensions: 5.3× 3.8 arcmin; Surface brightness range displayed:
16.5−28.0 mag arcsec−2

– 232 –
Fig. 1.181.— UGC 6817 - S4G mid-IR classification: Im ; Filter: IRAC 3.6µm; North: up,
East: left; Field dimensions: 5.3× 3.8 arcmin; Surface brightness range displayed: 18.0−28.0
mag arcsec−2
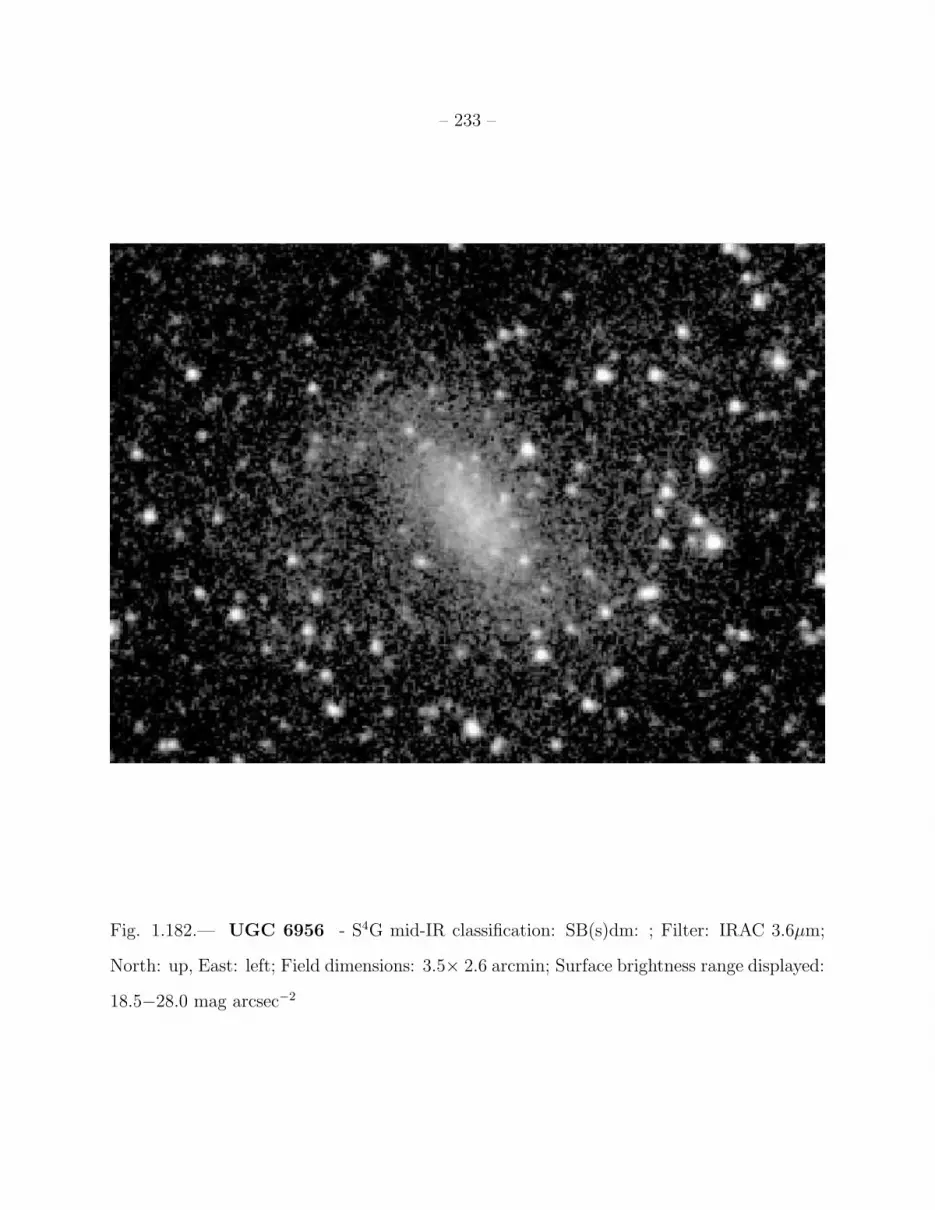
– 233 –
Fig. 1.182.— UGC 6956 - S4G mid-IR classification: SB(s)dm: ; Filter: IRAC 3.6µm;
North: up, East: left; Field dimensions: 3.5× 2.6 arcmin; Surface brightness range displayed:
18.5−28.0 mag arcsec−2

– 234 –
Fig. 1.183.— UGC 7504 - S4G mid-IR classification: S0− ; Filter: IRAC 3.6µm; North:
left, East: down; Field dimensions: 3.2× 2.3 arcmin; Surface brightness range displayed:
18.0−28.0 mag arcsec−2
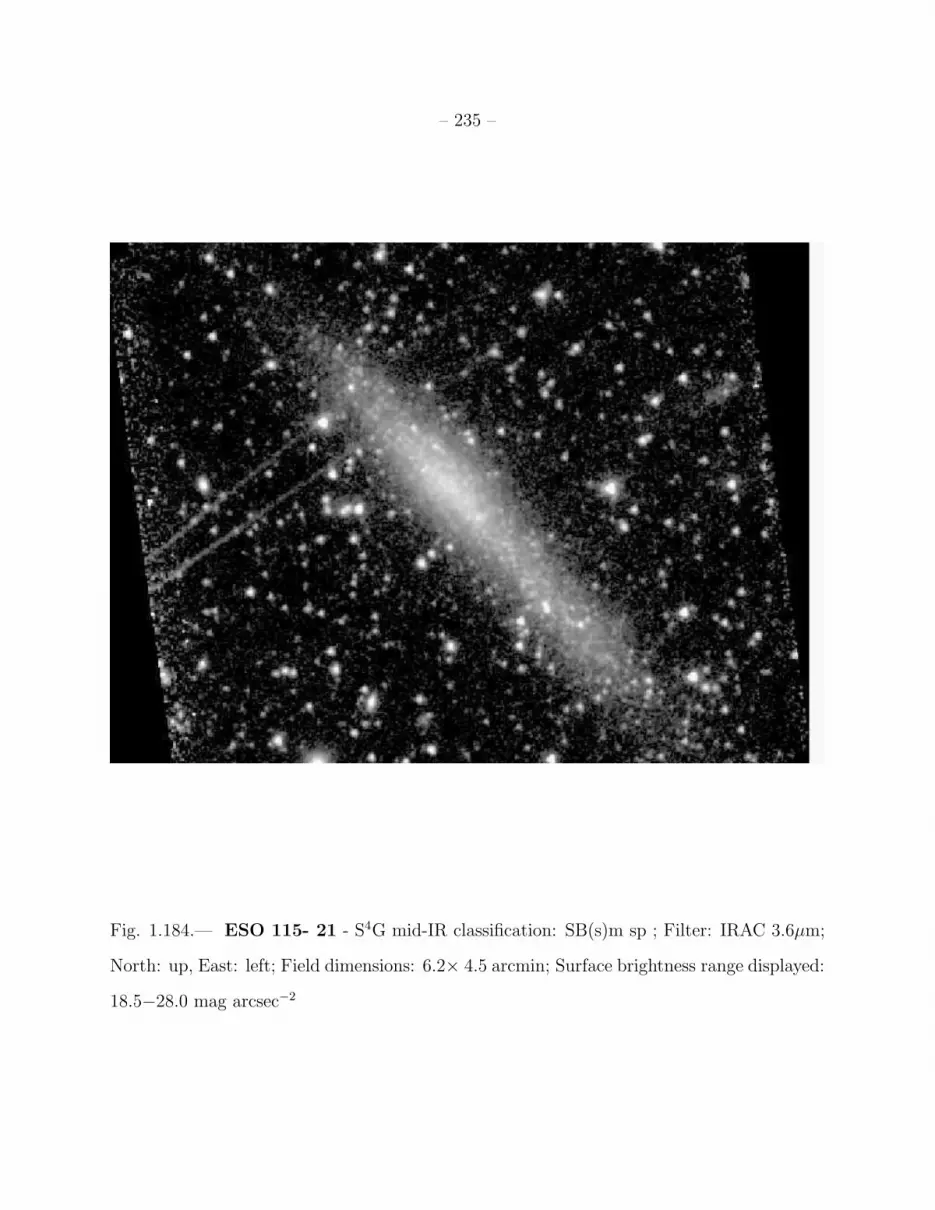
– 235 –
Fig. 1.184.— ESO 115- 21 - S4G mid-IR classification: SB(s)m sp ; Filter: IRAC 3.6µm;
North: up, East: left; Field dimensions: 6.2× 4.5 arcmin; Surface brightness range displayed:
18.5−28.0 mag arcsec−2

– 236 –
Fig. 1.185.— ESO 119- 16 - S4G mid-IR classification: (R′)SAB(s)dm: ; Filter: IRAC
3.6µm; North: up, East: left; Field dimensions: 3.5× 2.6 arcmin; Surface brightness range
displayed: 18.5−28.0 mag arcsec−2

– 237 –
Fig. 1.186.— ESO 149- 3 - S4G mid-IR classification: IBm: sp ; Filter: IRAC 3.6µm;
North: up, East: left; Field dimensions: 3.5× 2.6 arcmin; Surface brightness range displayed:
18.5−28.0 mag arcsec−2

– 238 –
Fig. 1.187.— ESO 154- 23 - S4G mid-IR classification: SB(s)d sp ; Filter: IRAC 3.6µm;
North: up, East: left; Field dimensions: 9.0× 6.6 arcmin; Surface brightness range displayed:
18.5−28.0 mag arcsec−2

– 239 –
Fig. 1.188.— ESO 245- 5 - S4G mid-IR classification: IAB(s)m ; Filter: IRAC 3.6µm;
North: up, East: left; Field dimensions: 5.7× 4.2 arcmin; Surface brightness range displayed:
18.5−28.0 mag arcsec−2

– 240 –
Fig. 1.189.— ESO 245- 7 - S4G mid-IR classification: Im ; Filter: IRAC 3.6µm; North: up,
East: left; Field dimensions: 6.6× 4.8 arcmin; Surface brightness range displayed: 18.5−28.0
mag arcsec−2
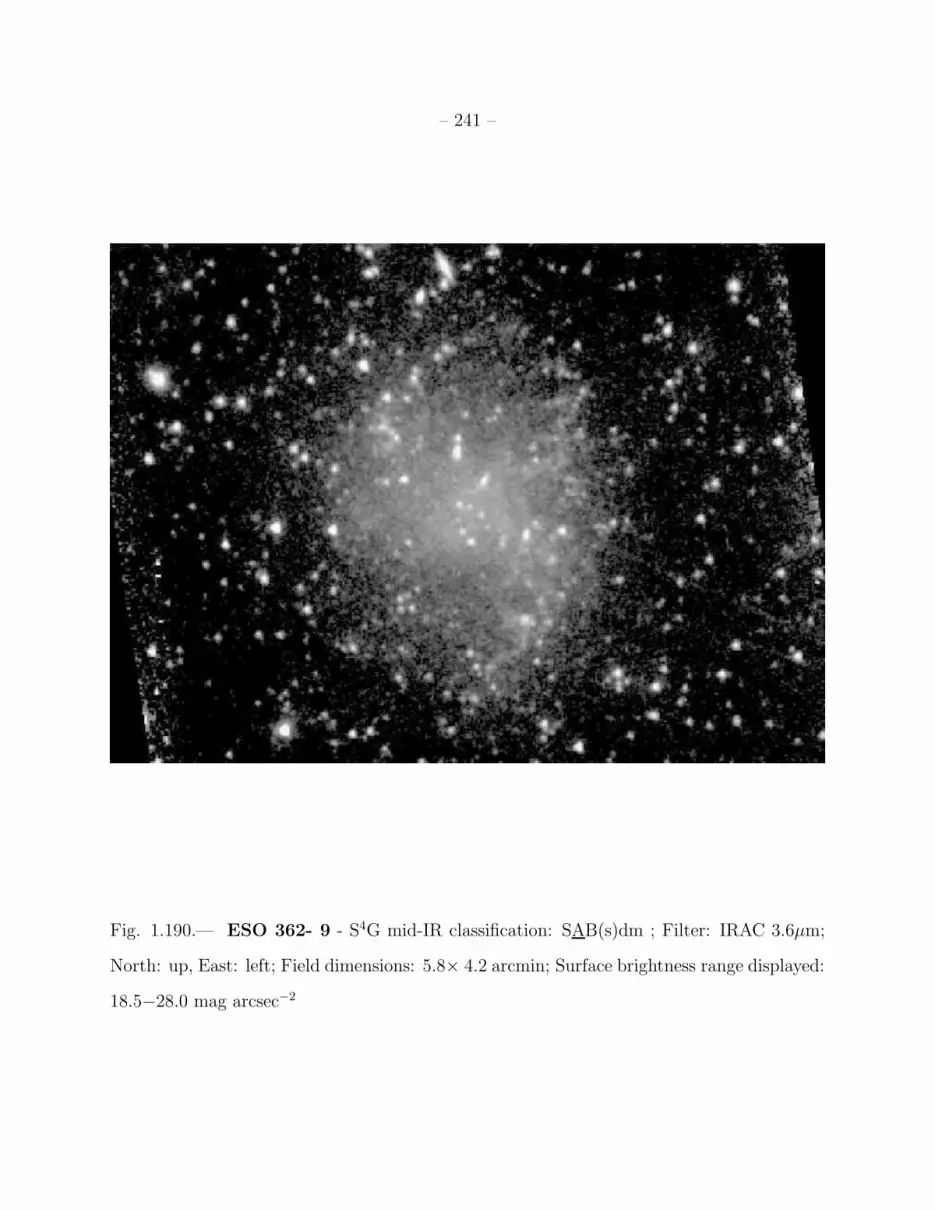
– 241 –
Fig. 1.190.— ESO 362- 9 - S4G mid-IR classification: SAB(s)dm ; Filter: IRAC 3.6µm;
North: up, East: left; Field dimensions: 5.8× 4.2 arcmin; Surface brightness range displayed:
18.5−28.0 mag arcsec−2
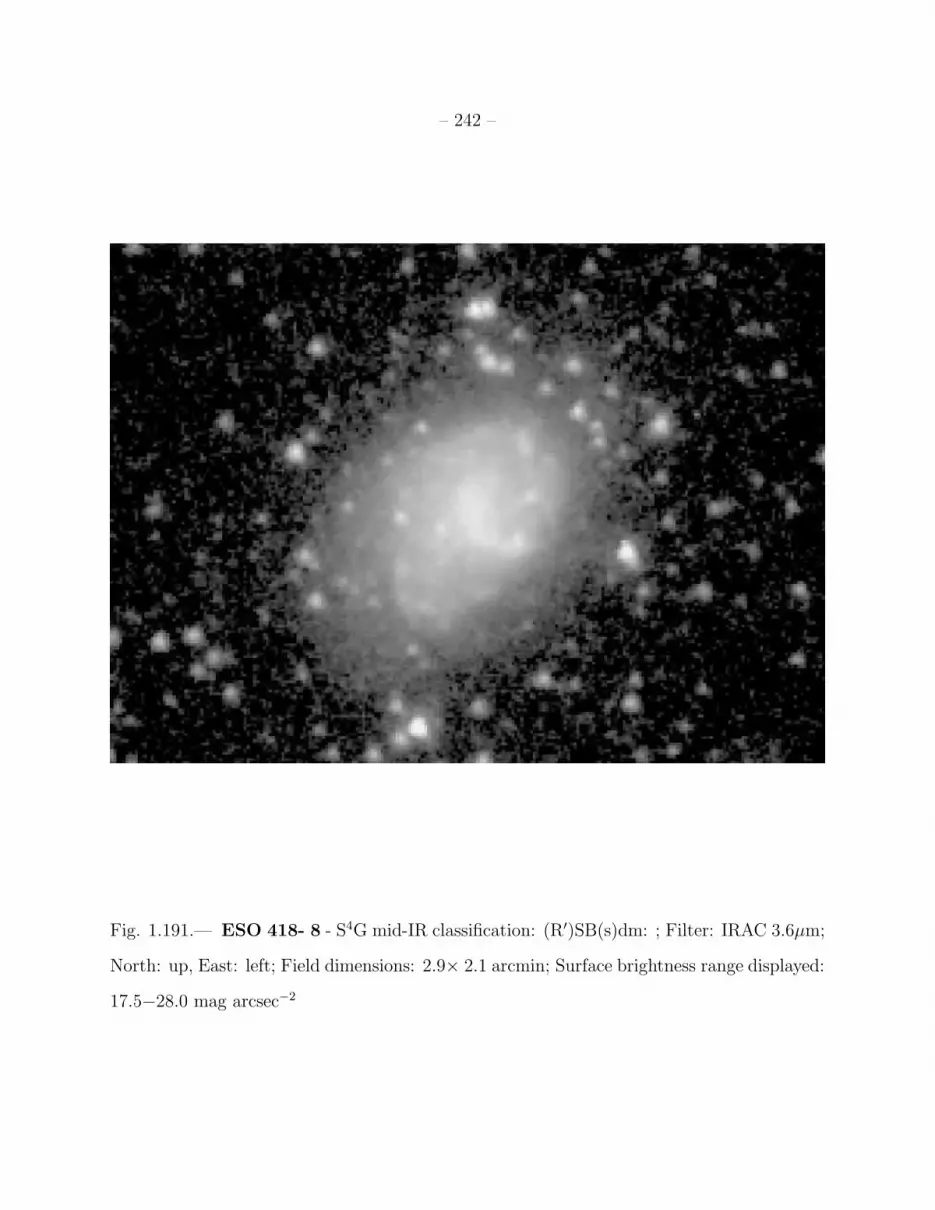
– 242 –
Fig. 1.191.— ESO 418- 8 - S4G mid-IR classification: (R′)SB(s)dm: ; Filter: IRAC 3.6µm;
North: up, East: left; Field dimensions: 2.9× 2.1 arcmin; Surface brightness range displayed:
17.5−28.0 mag arcsec−2
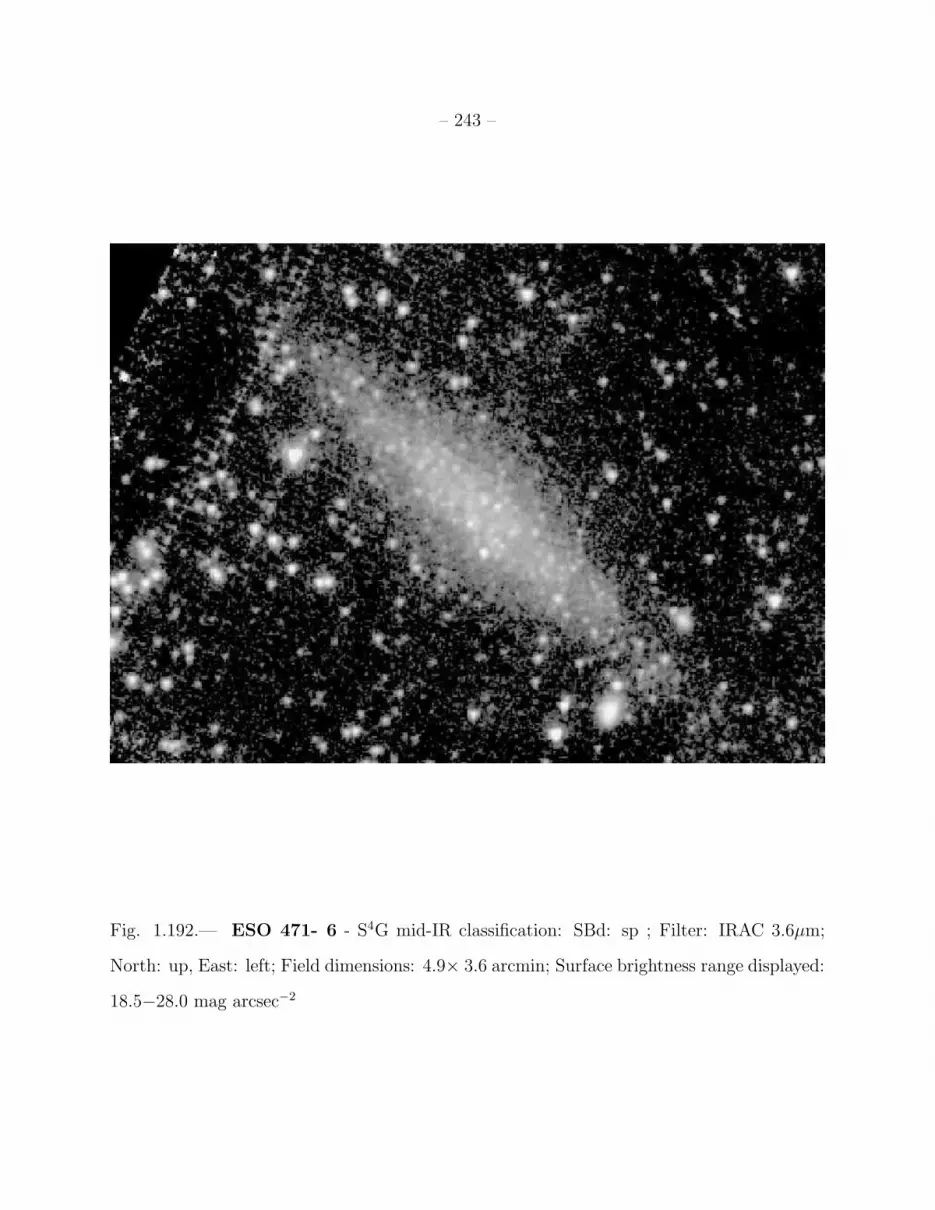
– 243 –
Fig. 1.192.— ESO 471- 6 - S4G mid-IR classification: SBd: sp ; Filter: IRAC 3.6µm;
North: up, East: left; Field dimensions: 4.9× 3.6 arcmin; Surface brightness range displayed:
18.5−28.0 mag arcsec−2

– 244 –
Fig. 1.193.— ESO 483- 13 - S4G mid-IR classification: dE4,N/SA0− ; Filter: IRAC
3.6µm; North: up, East: left; Field dimensions: 3.7× 2.7 arcmin; Surface brightness range
displayed: 15.5−28.0 mag arcsec−2

– 245 –
Fig. 1.194.— ESO 486- 21 - S4G mid-IR classification: dE (Im) ; Filter: IRAC 3.6µm;
North: up, East: left; Field dimensions: 2.6× 1.9 arcmin; Surface brightness range displayed:
18.0−26.0 mag arcsec−2
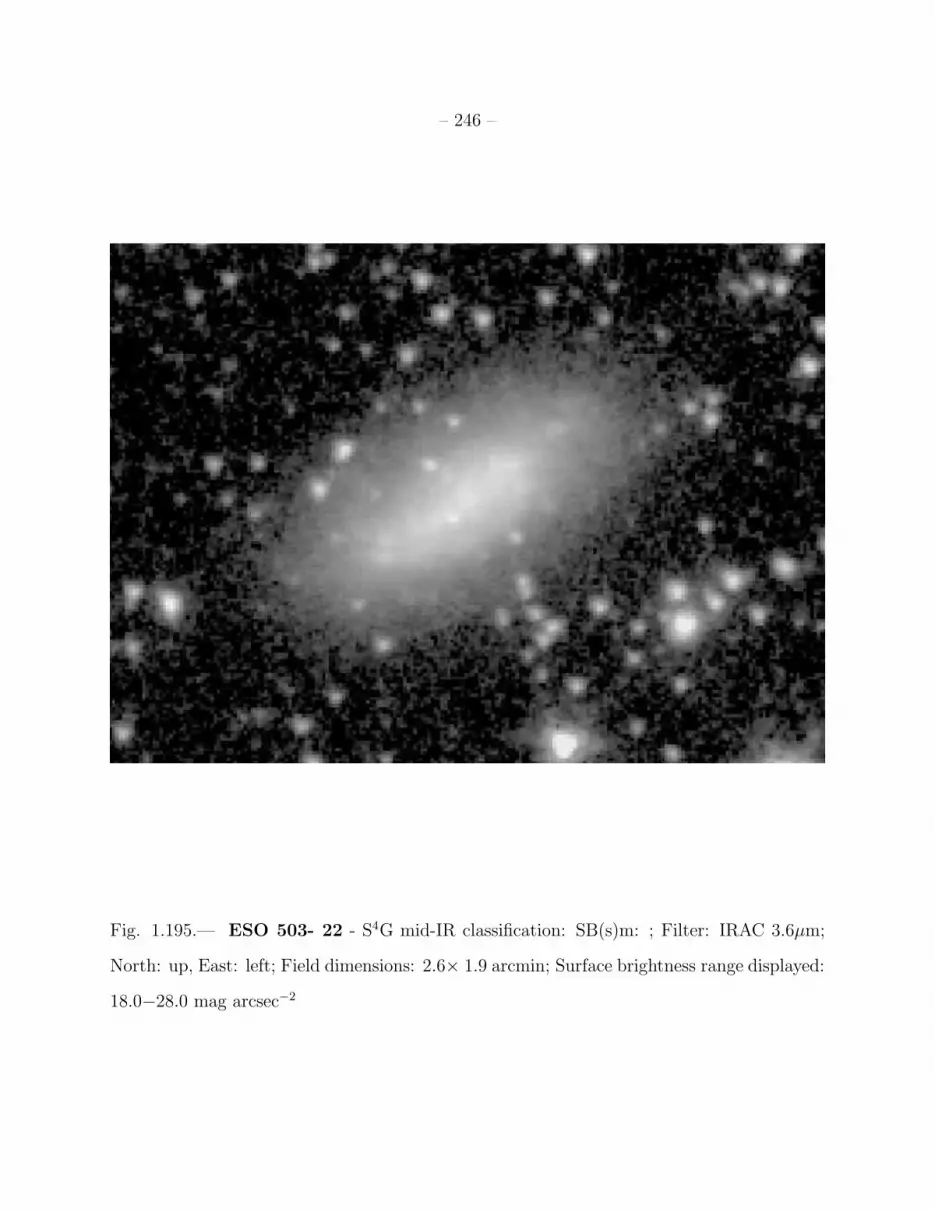
– 246 –
Fig. 1.195.— ESO 503- 22 - S4G mid-IR classification: SB(s)m: ; Filter: IRAC 3.6µm;
North: up, East: left; Field dimensions: 2.6× 1.9 arcmin; Surface brightness range displayed:
18.0−28.0 mag arcsec−2
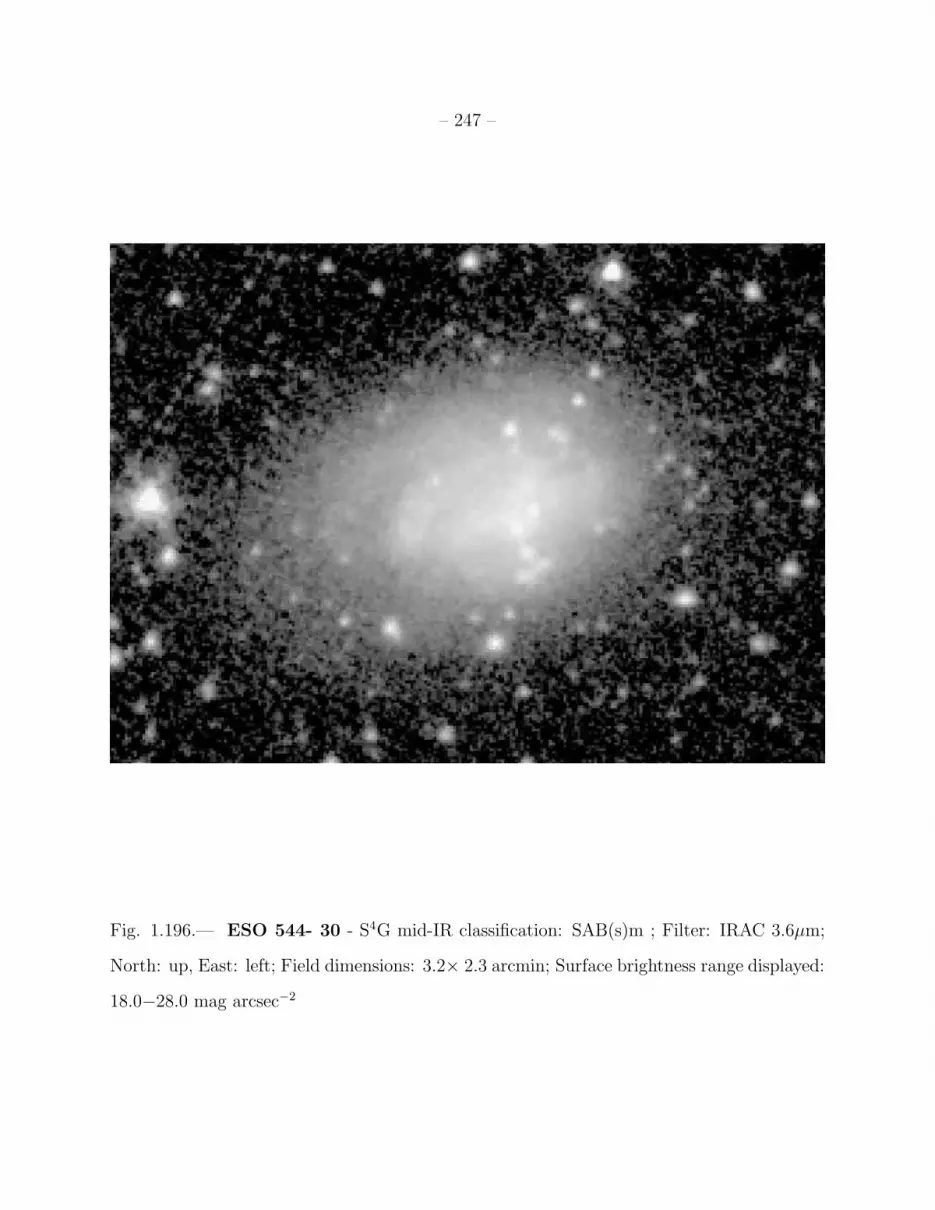
– 247 –
Fig. 1.196.— ESO 544- 30 - S4G mid-IR classification: SAB(s)m ; Filter: IRAC 3.6µm;
North: up, East: left; Field dimensions: 3.2× 2.3 arcmin; Surface brightness range displayed:
18.0−28.0 mag arcsec−2

– 248 –
Fig. 1.197.— CGCG265-55 - S4G mid-IR classification: dE (Im) ; Filter: IRAC 3.6µm;
North: up, East: left; Field dimensions: 4.0× 2.9 arcmin; Surface brightness range displayed:
16.5−28.0 mag arcsec−2
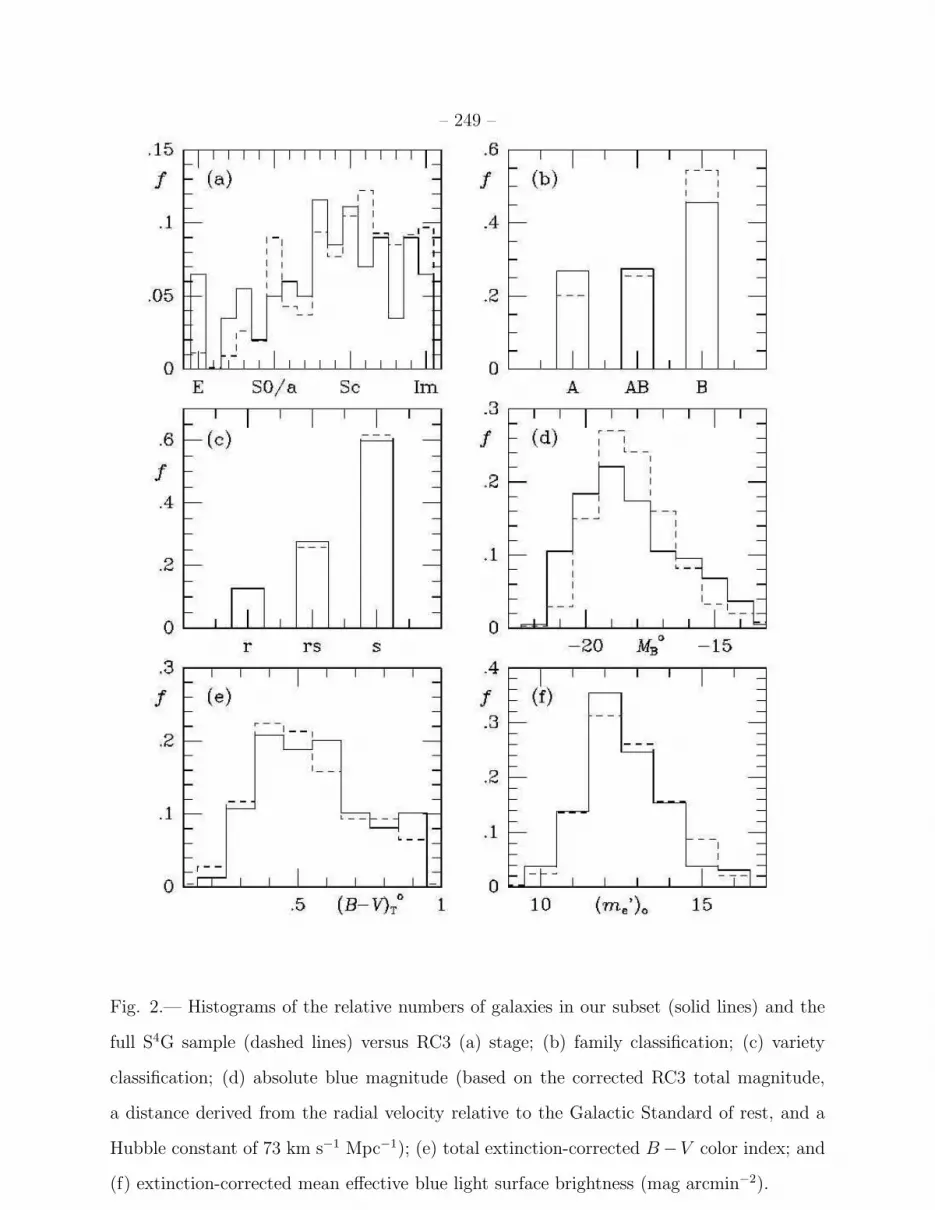
– 249 –
Fig. 2.— Histograms of the relative numbers of galaxies in our subset (solid lines) and the
full S4G sample (dashed lines) versus RC3 (a) stage; (b) family classification; (c) variety
classification; (d) absolute blue magnitude (based on the corrected RC3 total magnitude,
a distance derived from the radial velocity relative to the Galactic Standard of rest, and a
Hubble constant of 73 km s−1 Mpc−1); (e) total extinction-corrected B−V color index; and
(f) extinction-corrected mean effective blue light surface brightness (mag arcmin−2).

– 250 –
Fig. 3.— Histograms of morphological index differences ∆(T, F, V ) = T, F, V (S4G) −
T, F, V (RC3), where T is the numerical stage index, F is the numerical family index, and V
is the numerical variety index. The stage index ranges from T=−5 for E galaxies to +10 for
magellanic irregulars, Im. The family index is F=−1 for SA galaxies, 0 for SAB galaxies,
and +1 for SB galaxies. The variety index is V=−1 for (r), 0 for (rs), and +1 for (s) galaxies.
Types with underlines (e.g., Sbc, SAB, (rs), etc.) are assigned half steps. Varieties like (rl)
or (l) are not assigned numerical indices.
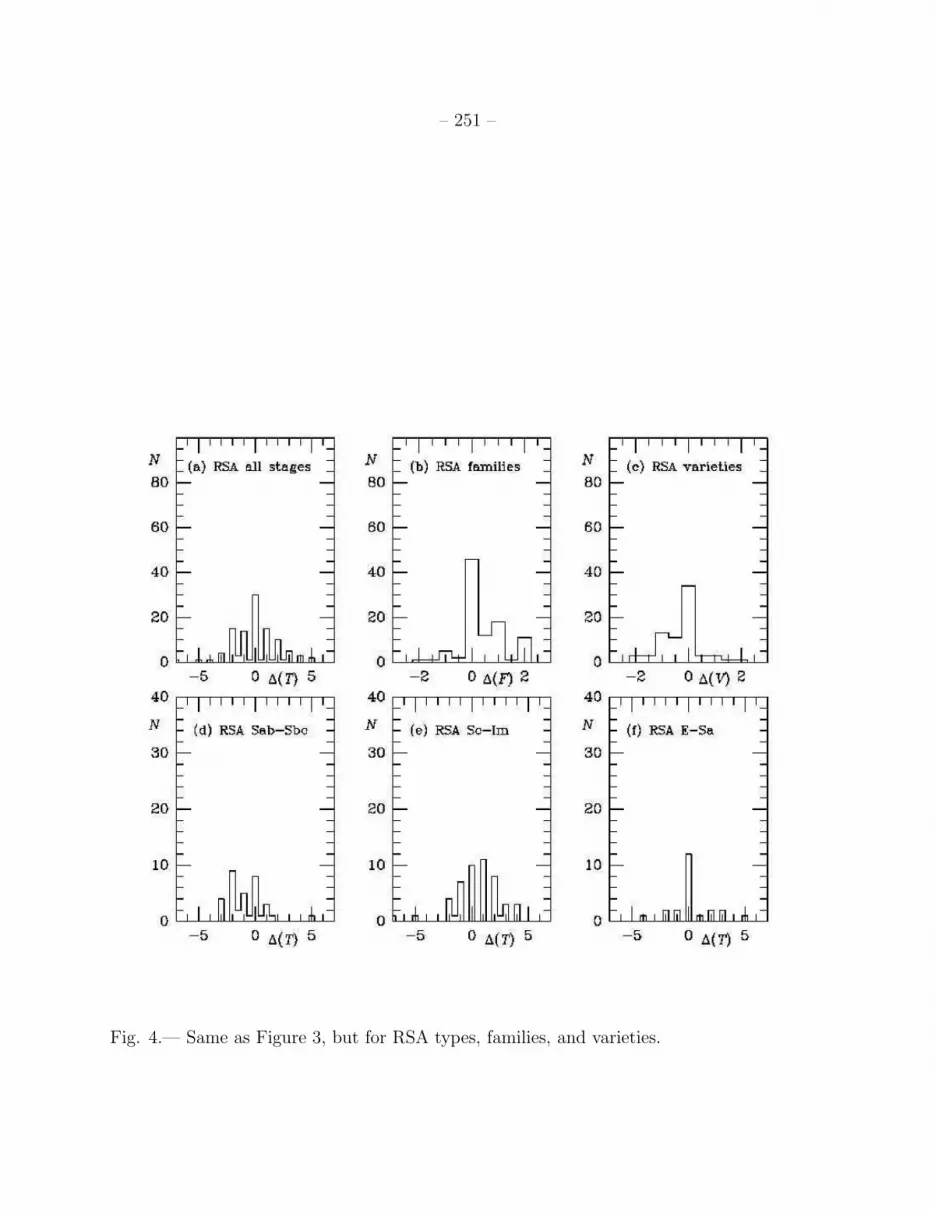
– 251 –
Fig. 4.— Same as Figure 3, but for RSA types, families, and varieties.
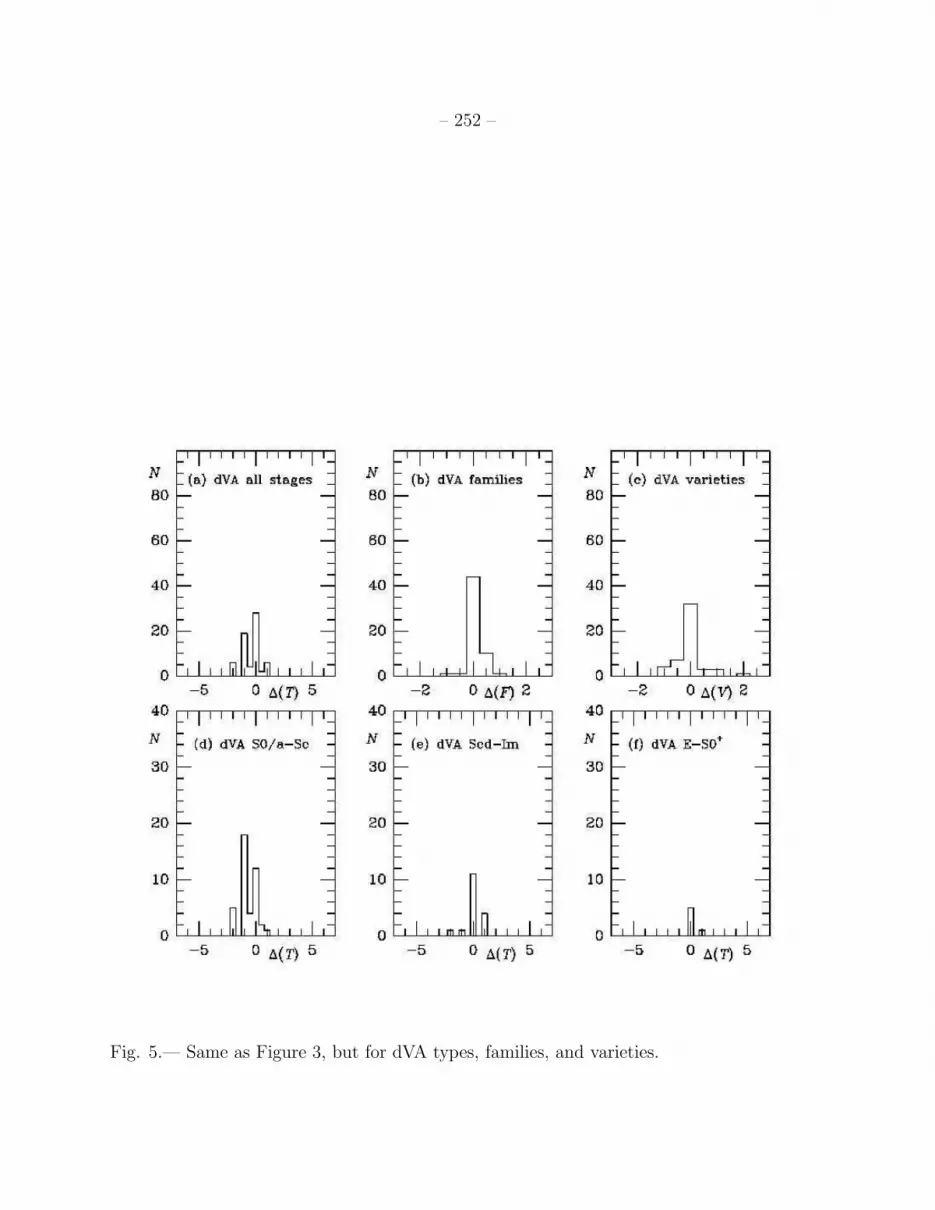
– 252 –
Fig. 5.— Same as Figure 3, but for dVA types, families, and varieties.
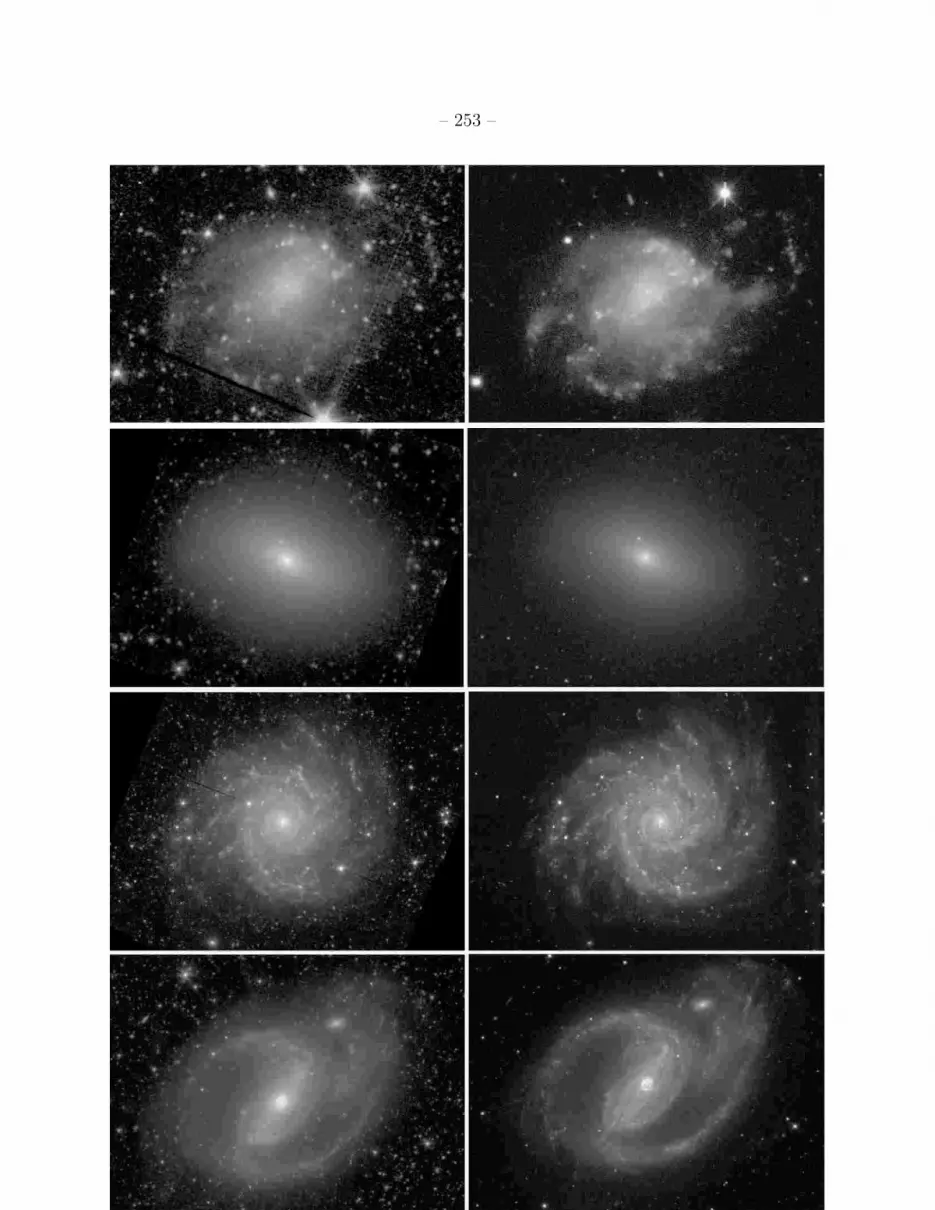
– 253 –

– 254 –
Fig. 6 (cont.).— Comparison between 3.6µm images (left) and B-band images (right) for
(top-to-bottom) NGC 428, NGC 584, NGC 628, and NGC 1097. All of the images are in
units of mag arcsec−2, and the B-band images are from the dVA.
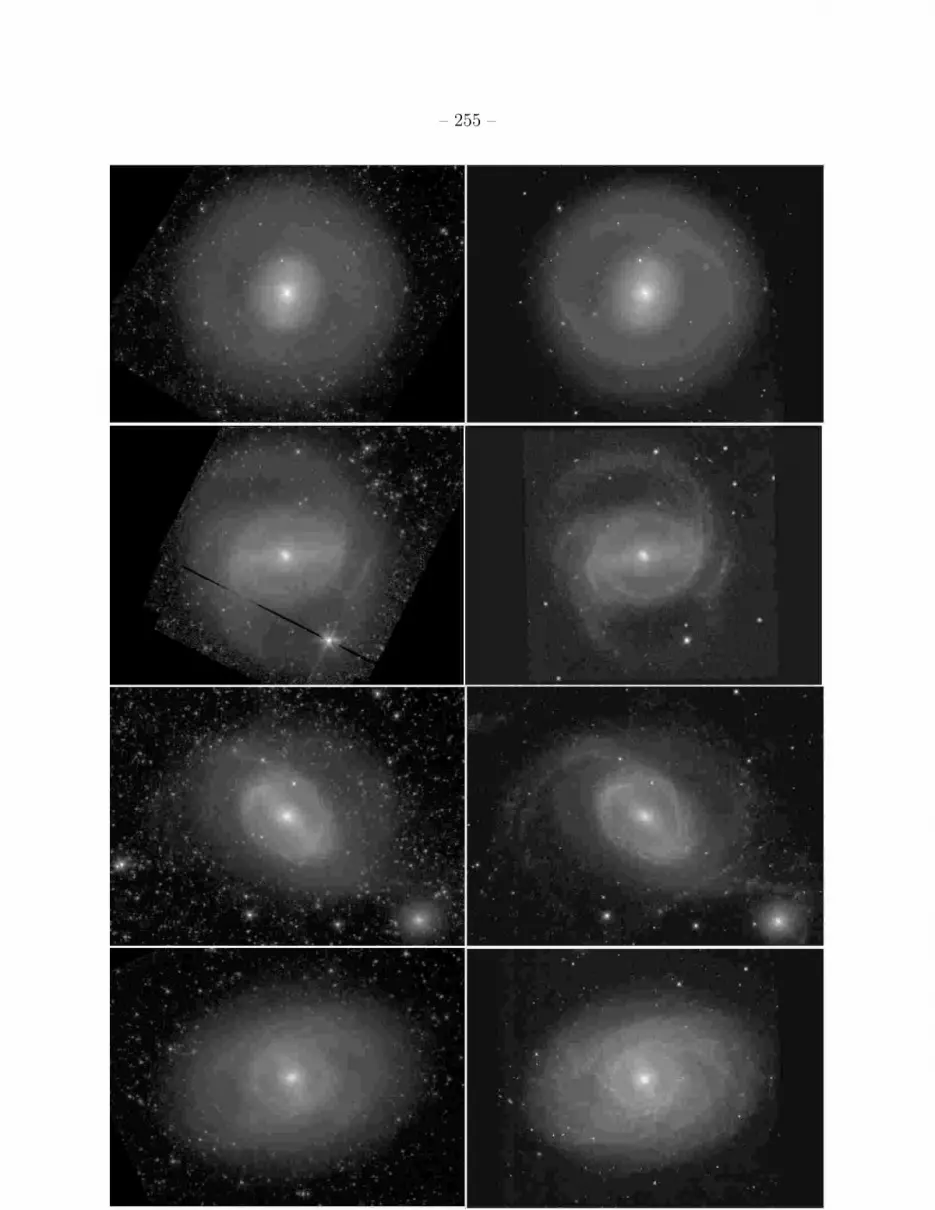
– 255 –

– 256 –
Fig. 7 (cont.).— Comparison between 3.6µm images (left) and B-band images (right) for
four ringed galaxies (top-to-bottom): NGC 1291, NGC 1433, NGC 1512, and NGC 3351.
All of the images are in units of mag arcsec−2, and the B-band images are from the dVA.

– 257 –
Fig. 8.—
– 258 –
Fig. 8 (cont.).— Comparison between 3.6µm images (left) and optical images (right) for two
flocculent spirals (top-to-bottom): NGC 2841, NGC 5055. All of the images are in units of
mag arcsec−2. The optical image of NGC 2841 is B-band and is from the dVA. The optical
image of NGC 5055 is g-band and is from the SDSS.
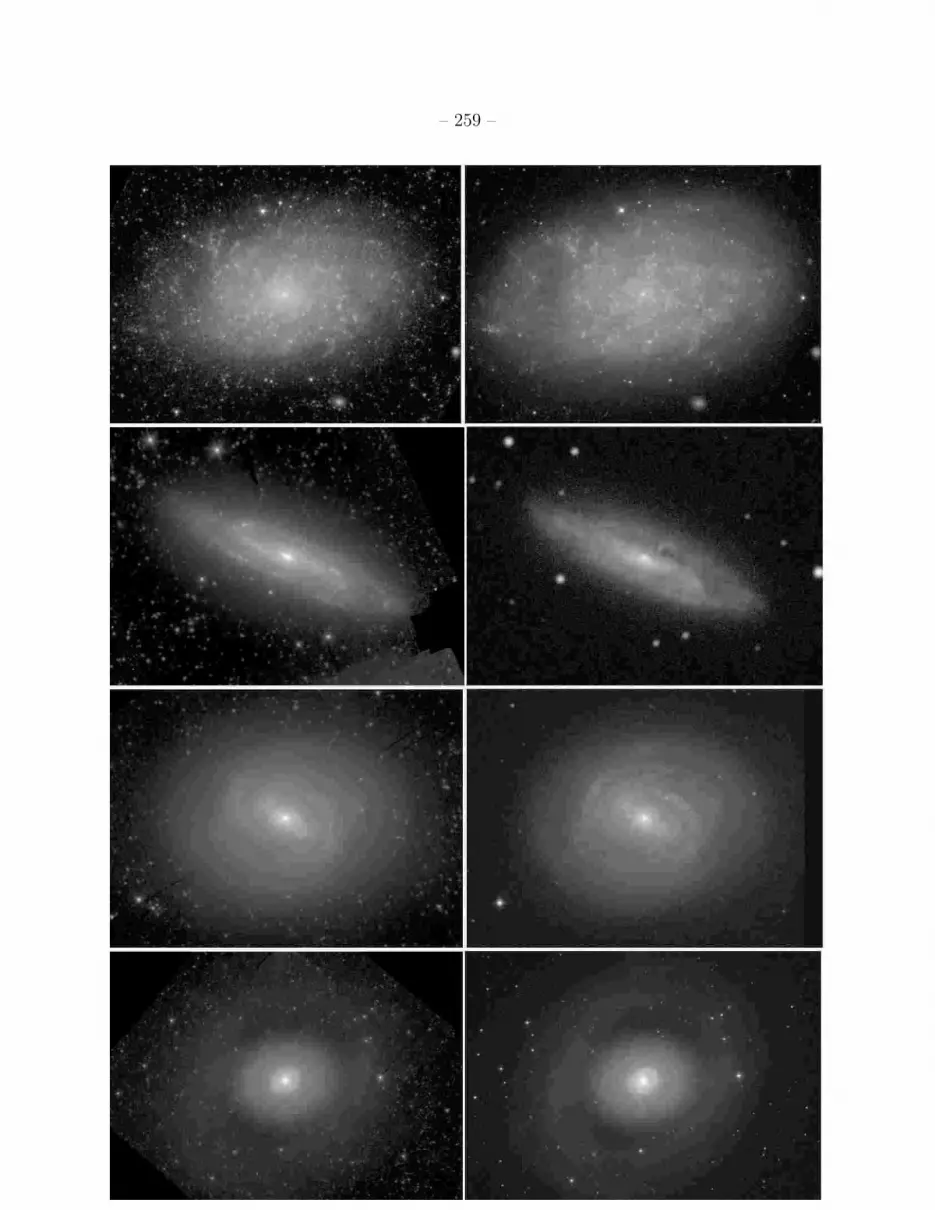
– 259 –
– 260 –
Fig. 9 (cont.).— Comparison between 3.6µm images (left) and B-band images (right) for
four late to early-type galaxies (top-to-bottom): NGC 7793, NGC 4527, NGC 4579, and
NGC 4736. All of the images are in units of mag arcsec−2. The B-band images are from the
dVA.

– 261 –
– 262 –
Fig. 10 (cont.).— Comparison between 3.6µm images (left) and B-band images (right) for
four late-type galaxies (top-to-bottom): NGC 1705, NGC 3738, NGC 3906, and NGC 4618.
All of the images are in units of mag arcsec−2. The B-band images of NGC 1705, 3906, and
4618 are from the dVA. The B-band image of NGC 3738 is from Taylor et al. (2005).
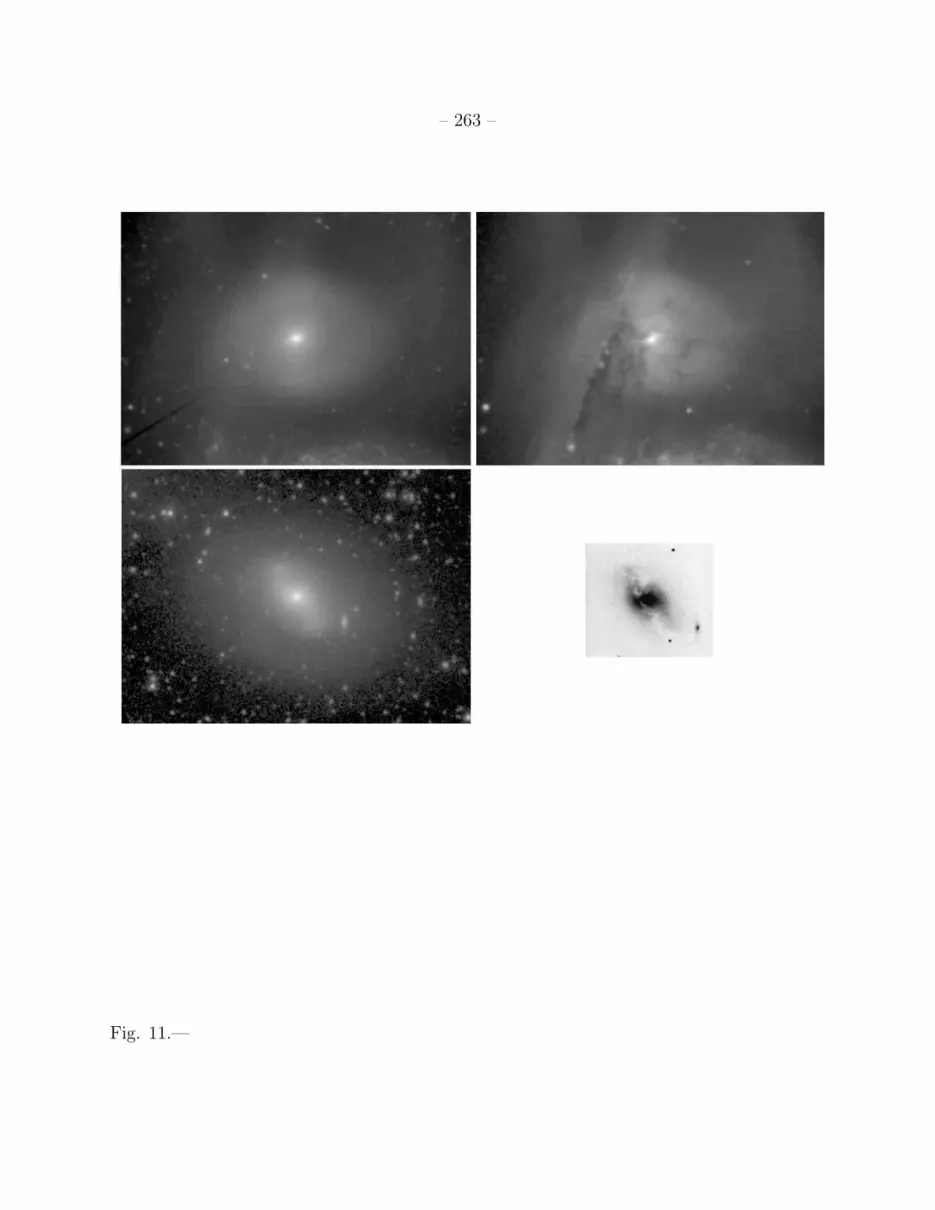
– 263 –
Fig. 11.—
– 264 –
Fig. 11 (cont.).— Comparison between 3.6µm images (left) and B-band images (right) of
two I0 galaxies: top panels: NGC 5195; bottom panels: NGC 2968. The B-band image of
NGC 2968 is from the Carnegie Atlas of Galaxies (Sandage & Bedke 1994).

– 265 –
Fig. 12.—

– 266 –
Fig. 12 (cont.).— 3.6µm images of six special cases: top panels: NGC 470 (left) and 4536
(right), showing prominent, highly-flattened pseudobulges. Middle panels: IC 750 (left) and
IC 3392 (right), two “double-stage” galaxies having bright inner spirals imbedded in an S0
or S0/a-like background disk. Bottom panels: NGC 5713 (left) and NGC 3769 (right), two
more double-stage galaxies.
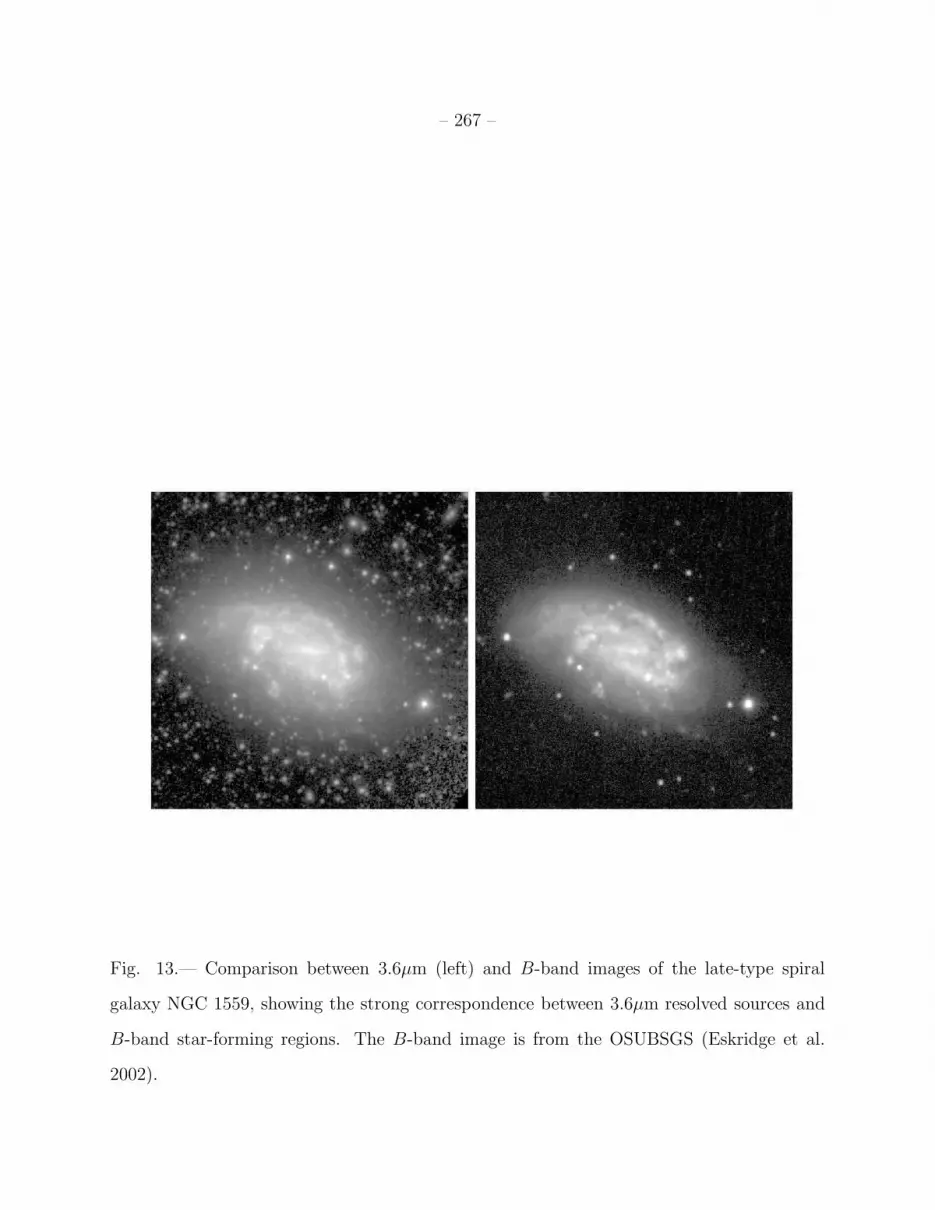
– 267 –
Fig. 13.— Comparison between 3.6µm (left) and B-band images of the late-type spiral
galaxy NGC 1559, showing the strong correspondence between 3.6µm resolved sources and
B-band star-forming regions. The B-band image is from the OSUBSGS (Eskridge et al.
2002).
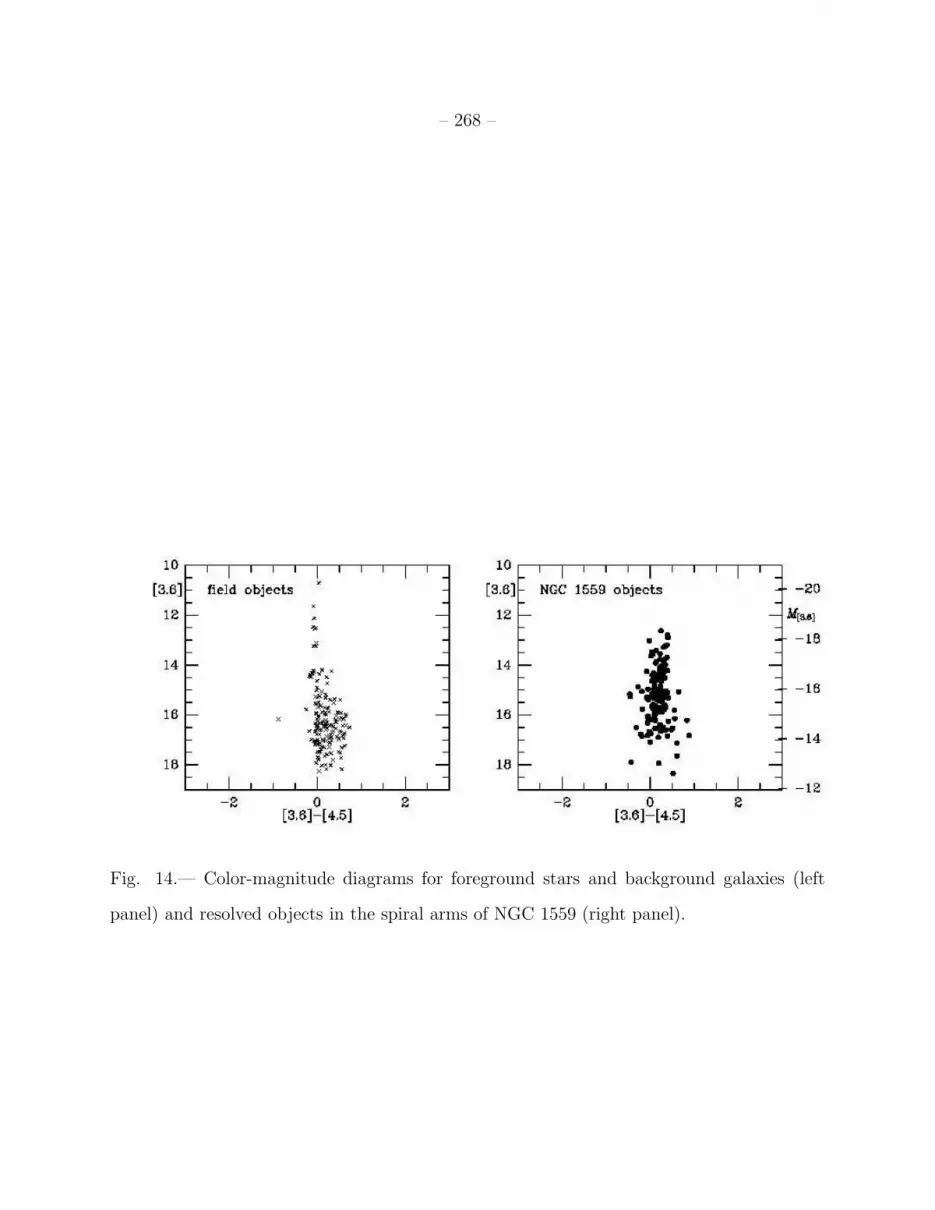
– 268 –
Fig. 14.— Color-magnitude diagrams for foreground stars and background galaxies (left
panel) and resolved objects in the spiral arms of NGC 1559 (right panel).
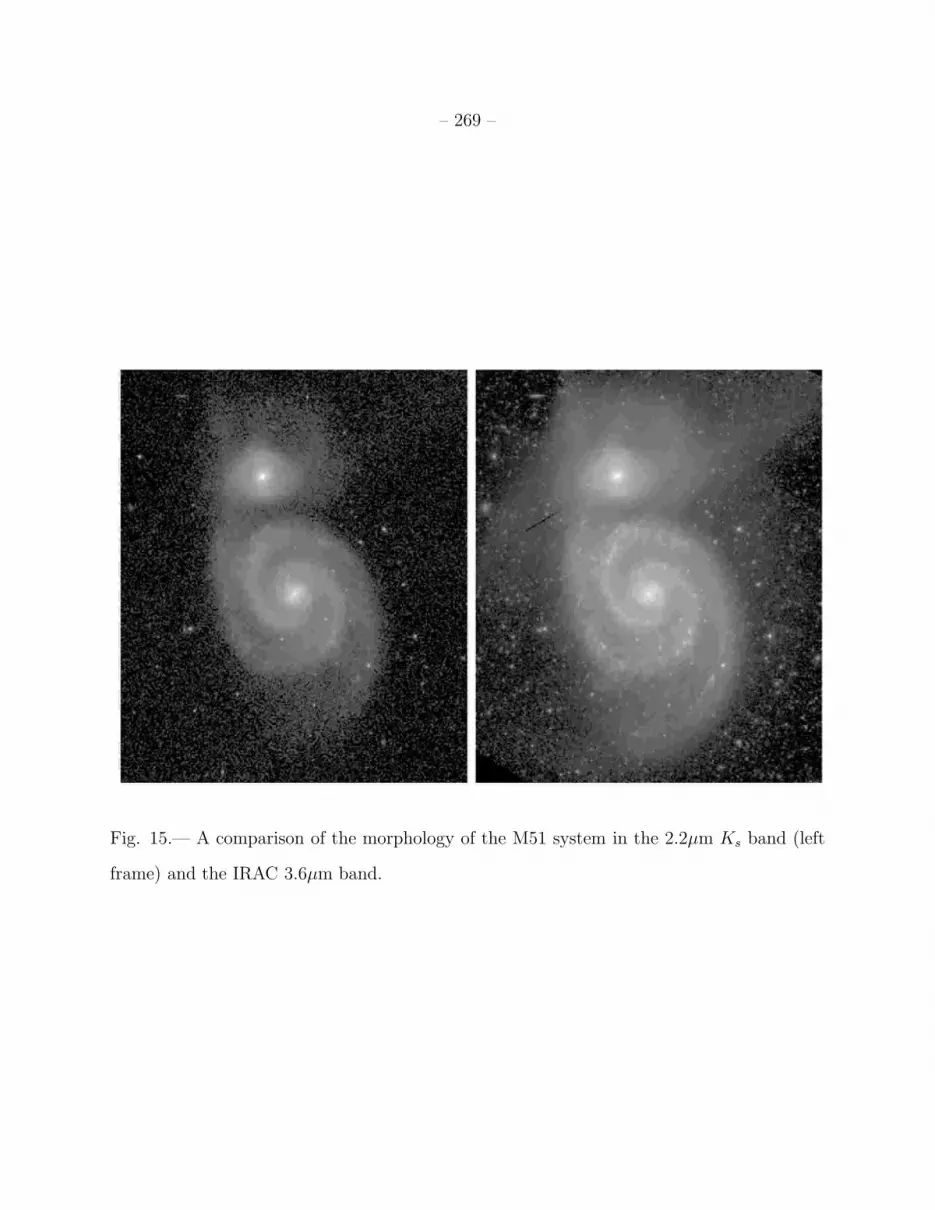
– 269 –
Fig. 15.— A comparison of the morphology of the M51 system in the 2.2µm Ks band (left
frame) and the IRAC 3.6µm band.