Microtextural properties of layered double hydroxides: a theoretical and structural model
17
Microtextural properties of layered double hydroxides: a theoretical and structural model Juan J. Bravo-Su arez a,b , Edgar A. P aez-Mozo c , S. Ted Oyama b, * a Centro de Investigaciones en Cat alisis, Escuela de Ingenier ıa Qu ımica, Universidad Industrial de Santander, A.A. 678, Bucaramanga, Colombia b Environmental Catalysis and Nanomaterials Laboratory, Department of Chemical Engineering, Virginia Polytechnic Institute and State University, Blacksburg, VA 24061-0211, USA c Centro de Investigaciones en Cat alisis, Escuela de Qu ımica, Universidad Industrial de Santander, A.A. 678 Bucaramanga, Colombia Received 11 July 2003; received in revised form 14 October 2003; accepted 14 October 2003 Abstract In this paper, a theoretical method to estimate the textural properties of layered double hydroxides (LDHs) of the type [M 2þ 1x M 3þ x (OH) 2 ][A n x=n ] is presented. The theoretical calculations are based on the structure and composition of the LDH, using geometrical models of an LDH crystallite and the intercalating anion. Several examples of the application of this model to LDHs and pillared LDHs are shown. The estimated properties include the interpillar distances, the interlamellar and external areas, the interlamellar free volume, the fraction of external anions and the apparent and true density of the LDH. For well crystallized LDH samples, agreement between the estimated and the experimental results is found, for poorly crystalline samples, a correlation be- tween the degree of crystallite agglomeration and the experimental areas is proposed. Ó 2003 Elsevier Inc. All rights reserved. Keywords: Layered double hydroxides; Hydrotalcite; Textural properties; Theoretical model; Agglomeration 1. Introduction Among layered compounds, layered double hydrox- ides (LDHs) represent one of the most technologically promising materials because of their relative ease of preparation and broad uses as adsorbents, anion exchangers, catalysts and catalyst supports [1]. The LDHs can be described as layered compounds of bru- cite-like structure (Mg(OH) 2 ), with positively charged layers due to a partial substitution of divalent M 2þ metals by trivalent M 3þ metals. Between the layers there are counter anions to balance the electrical charge and coordinating water molecules. LDHs are commonly represented by the general formula: [M 2þ 1x M 3þ x - (OH) 2 ] xþ (A n x=n ) mH 2 O, where M 2þ and M 3þ can be any divalent and trivalent metal ions (with ionic radius similar to Mg 2þ ), x is the metal ratio M 3þ /(M 2þ +M 3þ ) and A n is the interlamellar charge-compensating anion. The flexibility of the LDHs to incorporate in their structure a variety of metals and anions has increased the interest in these materials. Special attention is being paid to LDHs with bulky and stable anions, i.e. poly- oxometalates (POMs), since they can give rise to a wide range of microporous materials [2]. The specific surface area (SSA) of LDH compounds can range from a few m 2 /g up to about 100 m 2 /g. The synthesis method can have a great influence on the final properties of the SSAs. Several factors may play a major role in determining the textural properties, such as the aging and hydrothermal treatments of LDH precipitates as well as the degasification regimes used before mea- suring the adsorption–desorption isotherms [3]. Some examples of how the SSA changes with these parameters are given in Table 1 [3–6]. In general, in the case of small inorganic anions (carbonates, nitrates, chlorides, etc.) the chemical composition of the LDHs does not have a significant effect on the obtained SSAs. Although, in some cases, the use of mixtures of organic solvents and * Corresponding author. E-mail addresses: [email protected] (J.J. Bravo-Su arez), oyama@ vt.edu (S. Ted Oyama). 1387-1811/$ - see front matter Ó 2003 Elsevier Inc. All rights reserved. doi:10.1016/j.micromeso.2003.10.003 www.elsevier.com/locate/micromeso Microporous and Mesoporous Materials 67 (2004) 1–17
-
Upload
independent -
Category
Documents
-
view
3 -
download
0
Transcript of Microtextural properties of layered double hydroxides: a theoretical and structural model

www.elsevier.com/locate/micromeso
Microporous and Mesoporous Materials 67 (2004) 1–17
Microtextural properties of layered double hydroxides:a theoretical and structural model
Juan J. Bravo-Su�aarez a,b, Edgar A. P�aaez-Mozo c, S. Ted Oyama b,*
a Centro de Investigaciones en Cat�aalisis, Escuela de Ingenier�ııa Qu�ıımica, Universidad Industrial de Santander, A.A. 678, Bucaramanga, Colombiab Environmental Catalysis and Nanomaterials Laboratory, Department of Chemical Engineering, Virginia Polytechnic Institute and State University,
Blacksburg, VA 24061-0211, USAc Centro de Investigaciones en Cat�aalisis, Escuela de Qu�ıımica, Universidad Industrial de Santander, A.A. 678 Bucaramanga, Colombia
Received 11 July 2003; received in revised form 14 October 2003; accepted 14 October 2003
Abstract
In this paper, a theoretical method to estimate the textural properties of layered double hydroxides (LDHs) of the type
[M2þ1�xM
3þx (OH)2][A
n�x=n] is presented. The theoretical calculations are based on the structure and composition of the LDH, using
geometrical models of an LDH crystallite and the intercalating anion. Several examples of the application of this model to LDHs
and pillared LDHs are shown. The estimated properties include the interpillar distances, the interlamellar and external areas, the
interlamellar free volume, the fraction of external anions and the apparent and true density of the LDH. For well crystallized LDH
samples, agreement between the estimated and the experimental results is found, for poorly crystalline samples, a correlation be-
tween the degree of crystallite agglomeration and the experimental areas is proposed.
� 2003 Elsevier Inc. All rights reserved.
Keywords: Layered double hydroxides; Hydrotalcite; Textural properties; Theoretical model; Agglomeration
1. Introduction
Among layered compounds, layered double hydrox-
ides (LDHs) represent one of the most technologicallypromising materials because of their relative ease of
preparation and broad uses as adsorbents, anion
exchangers, catalysts and catalyst supports [1]. The
LDHs can be described as layered compounds of bru-
cite-like structure (Mg(OH)2), with positively charged
layers due to a partial substitution of divalent M2þ
metals by trivalent M3þ metals. Between the layers there
are counter anions to balance the electrical charge andcoordinating water molecules. LDHs are commonly
represented by the general formula: [M2þ1�xM
3þx -
(OH)2]xþ(An�
x=n) ÆmH2O, where M2þ and M3þ can be any
divalent and trivalent metal ions (with ionic radius
similar to Mg2þ), x is the metal ratio M3þ/(M2þ +M3þ)
*Corresponding author.
E-mail addresses: [email protected] (J.J. Bravo-Su�aarez), oyama@
vt.edu (S. Ted Oyama).
1387-1811/$ - see front matter � 2003 Elsevier Inc. All rights reserved.
doi:10.1016/j.micromeso.2003.10.003
and An� is the interlamellar charge-compensating anion.
The flexibility of the LDHs to incorporate in their
structure a variety of metals and anions has increased
the interest in these materials. Special attention is beingpaid to LDHs with bulky and stable anions, i.e. poly-
oxometalates (POMs), since they can give rise to a wide
range of microporous materials [2].
The specific surface area (SSA) of LDH compounds
can range from a few m2/g up to about 100 m2/g. The
synthesis method can have a great influence on the final
properties of the SSAs. Several factors may play a major
role in determining the textural properties, such as theaging and hydrothermal treatments of LDH precipitates
as well as the degasification regimes used before mea-
suring the adsorption–desorption isotherms [3]. Some
examples of how the SSA changes with these parameters
are given in Table 1 [3–6]. In general, in the case of small
inorganic anions (carbonates, nitrates, chlorides, etc.)
the chemical composition of the LDHs does not have a
significant effect on the obtained SSAs. Although, insome cases, the use of mixtures of organic solvents and
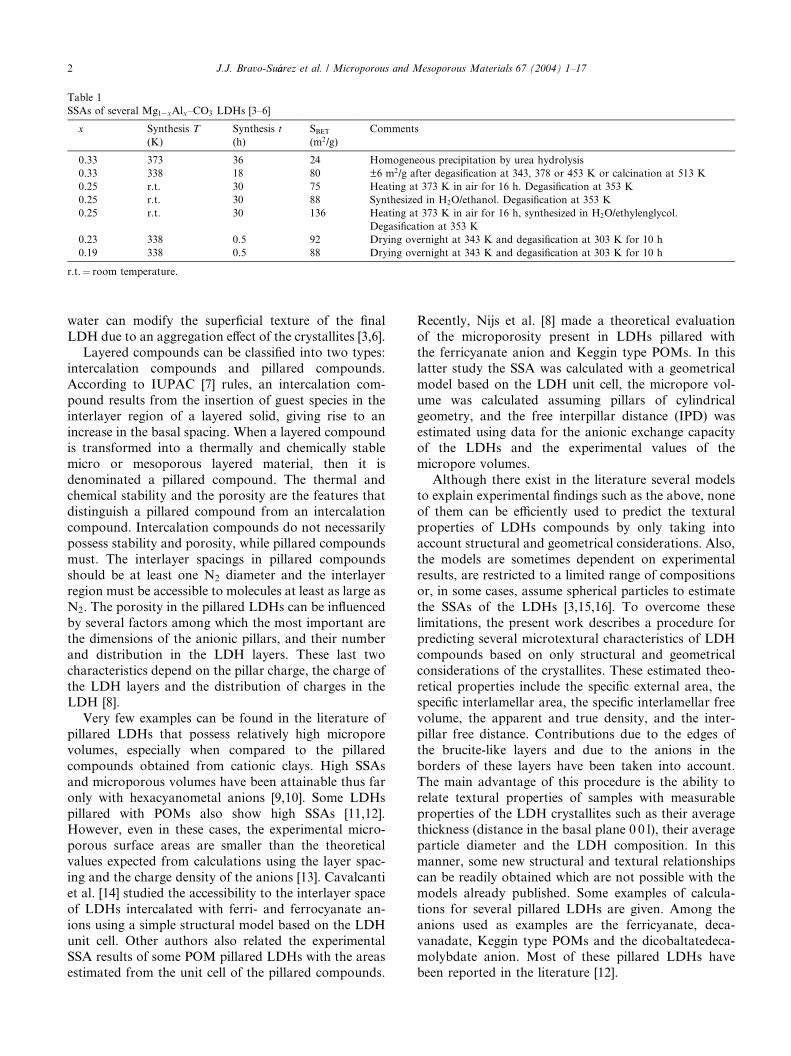
Table 1
SSAs of several Mg1�xAlx–CO3 LDHs [3–6]
x Synthesis T
(K)
Synthesis t
(h)
SBET
(m2/g)
Comments
0.33 373 36 24 Homogeneous precipitation by urea hydrolysis
0.33 338 18 80 ±6 m2/g after degasification at 343, 378 or 453 K or calcination at 513 K
0.25 r.t. 30 75 Heating at 373 K in air for 16 h. Degasification at 353 K
0.25 r.t. 30 88 Synthesized in H2O/ethanol. Degasification at 353 K
0.25 r.t. 30 136 Heating at 373 K in air for 16 h, synthesized in H2O/ethylenglycol.
Degasification at 353 K
0.23 338 0.5 92 Drying overnight at 343 K and degasification at 303 K for 10 h
0.19 338 0.5 88 Drying overnight at 343 K and degasification at 303 K for 10 h
r.t.¼ room temperature.
2 J.J. Bravo-Su�aarez et al. / Microporous and Mesoporous Materials 67 (2004) 1–17
water can modify the superficial texture of the final
LDH due to an aggregation effect of the crystallites [3,6].
Layered compounds can be classified into two types:
intercalation compounds and pillared compounds.
According to IUPAC [7] rules, an intercalation com-
pound results from the insertion of guest species in the
interlayer region of a layered solid, giving rise to an
increase in the basal spacing. When a layered compoundis transformed into a thermally and chemically stable
micro or mesoporous layered material, then it is
denominated a pillared compound. The thermal and
chemical stability and the porosity are the features that
distinguish a pillared compound from an intercalation
compound. Intercalation compounds do not necessarily
possess stability and porosity, while pillared compounds
must. The interlayer spacings in pillared compoundsshould be at least one N2 diameter and the interlayer
region must be accessible to molecules at least as large as
N2. The porosity in the pillared LDHs can be influenced
by several factors among which the most important are
the dimensions of the anionic pillars, and their number
and distribution in the LDH layers. These last two
characteristics depend on the pillar charge, the charge of
the LDH layers and the distribution of charges in theLDH [8].
Very few examples can be found in the literature of
pillared LDHs that possess relatively high micropore
volumes, especially when compared to the pillared
compounds obtained from cationic clays. High SSAs
and microporous volumes have been attainable thus far
only with hexacyanometal anions [9,10]. Some LDHs
pillared with POMs also show high SSAs [11,12].However, even in these cases, the experimental micro-
porous surface areas are smaller than the theoretical
values expected from calculations using the layer spac-
ing and the charge density of the anions [13]. Cavalcanti
et al. [14] studied the accessibility to the interlayer space
of LDHs intercalated with ferri- and ferrocyanate an-
ions using a simple structural model based on the LDH
unit cell. Other authors also related the experimentalSSA results of some POM pillared LDHs with the areas
estimated from the unit cell of the pillared compounds.
Recently, Nijs et al. [8] made a theoretical evaluation
of the microporosity present in LDHs pillared with
the ferricyanate anion and Keggin type POMs. In this
latter study the SSA was calculated with a geometrical
model based on the LDH unit cell, the micropore vol-
ume was calculated assuming pillars of cylindrical
geometry, and the free interpillar distance (IPD) was
estimated using data for the anionic exchange capacityof the LDHs and the experimental values of the
micropore volumes.
Although there exist in the literature several models
to explain experimental findings such as the above, none
of them can be efficiently used to predict the textural
properties of LDHs compounds by only taking into
account structural and geometrical considerations. Also,
the models are sometimes dependent on experimentalresults, are restricted to a limited range of compositions
or, in some cases, assume spherical particles to estimate
the SSAs of the LDHs [3,15,16]. To overcome these
limitations, the present work describes a procedure for
predicting several microtextural characteristics of LDH
compounds based on only structural and geometrical
considerations of the crystallites. These estimated theo-
retical properties include the specific external area, thespecific interlamellar area, the specific interlamellar free
volume, the apparent and true density, and the inter-
pillar free distance. Contributions due to the edges of
the brucite-like layers and due to the anions in the
borders of these layers have been taken into account.
The main advantage of this procedure is the ability to
relate textural properties of samples with measurable
properties of the LDH crystallites such as their averagethickness (distance in the basal plane 0 0 l), their average
particle diameter and the LDH composition. In this
manner, some new structural and textural relationships
can be readily obtained which are not possible with the
models already published. Some examples of calcula-
tions for several pillared LDHs are given. Among the
anions used as examples are the ferricyanate, deca-
vanadate, Keggin type POMs and the dicobaltatedeca-molybdate anion. Most of these pillared LDHs have
been reported in the literature [12].
J.J. Bravo-Su�aarez et al. / Microporous and Mesoporous Materials 67 (2004) 1–17 3
2. Theoretical calculations
All theoretical calculations are based on the general
LDH formula: [M2þ1�xM
3þx (OH)2]
xþ[An�x=n]. LDHs com-
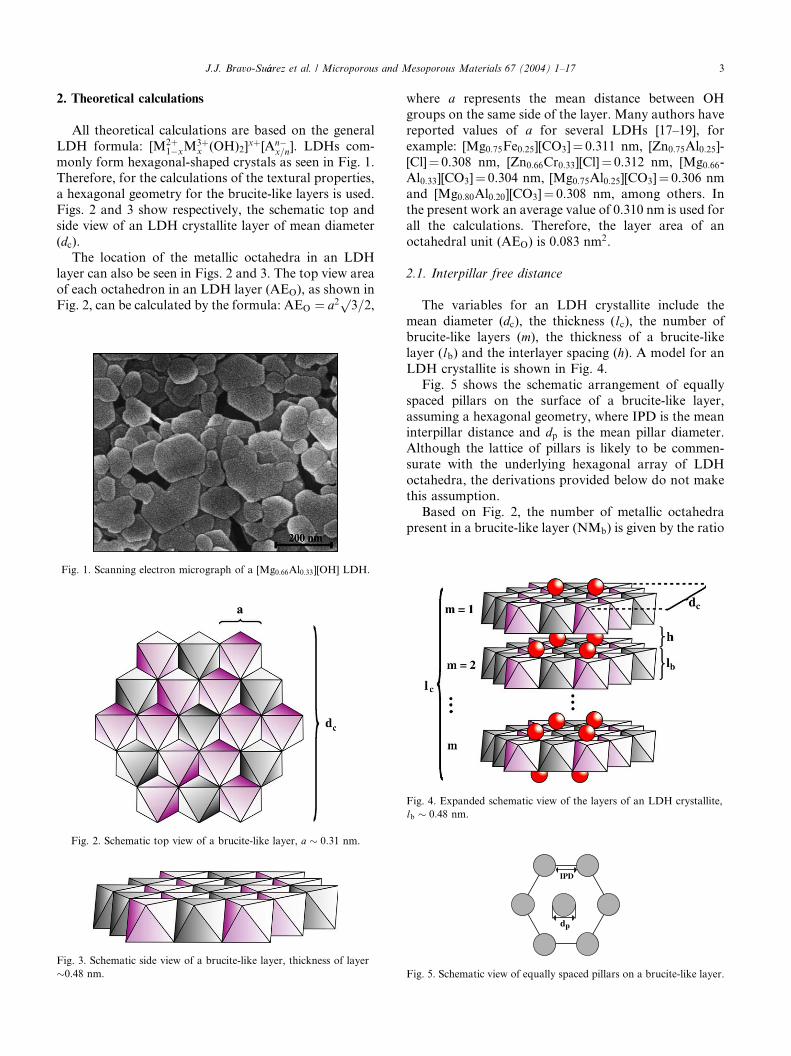
monly form hexagonal-shaped crystals as seen in Fig. 1.Therefore, for the calculations of the textural properties,
a hexagonal geometry for the brucite-like layers is used.
Figs. 2 and 3 show respectively, the schematic top and
side view of an LDH crystallite layer of mean diameter
(dc).The location of the metallic octahedra in an LDH
layer can also be seen in Figs. 2 and 3. The top view area
of each octahedron in an LDH layer (AEO), as shown inFig. 2, can be calculated by the formula: AEO ¼ a2
p3=2,
Fig. 1. Scanning electron micrograph of a [Mg0:66Al0:33][OH] LDH.
Fig. 2. Schematic top view of a brucite-like layer, a � 0:31 nm.
Fig. 3. Schematic side view of a brucite-like layer, thickness of layer
�0.48 nm.
where a represents the mean distance between OH
groups on the same side of the layer. Many authors have
reported values of a for several LDHs [17–19], for
example: [Mg0:75Fe0:25][CO3]¼ 0.311 nm, [Zn0:75Al0:25]-
[Cl]¼ 0.308 nm, [Zn0:66Cr0:33][Cl]¼ 0.312 nm, [Mg0:66-Al0:33][CO3]¼ 0.304 nm, [Mg0:75Al0:25][CO3]¼ 0.306 nm
and [Mg0:80Al0:20][CO3]¼ 0.308 nm, among others. In
the present work an average value of 0.310 nm is used for
all the calculations. Therefore, the layer area of an
octahedral unit (AEO) is 0.083 nm2.
2.1. Interpillar free distance
The variables for an LDH crystallite include the
mean diameter (dc), the thickness (lc), the number of
brucite-like layers (m), the thickness of a brucite-like
layer (lb) and the interlayer spacing (h). A model for an
LDH crystallite is shown in Fig. 4.
Fig. 5 shows the schematic arrangement of equally
spaced pillars on the surface of a brucite-like layer,
assuming a hexagonal geometry, where IPD is the meaninterpillar distance and dp is the mean pillar diameter.
Although the lattice of pillars is likely to be commen-
surate with the underlying hexagonal array of LDH
octahedra, the derivations provided below do not make
this assumption.
Based on Fig. 2, the number of metallic octahedra
present in a brucite-like layer (NMb) is given by the ratio
Fig. 4. Expanded schematic view of the layers of an LDH crystallite,
lb � 0:48 nm.
dp
IPD
Fig. 5. Schematic view of equally spaced pillars on a brucite-like layer.
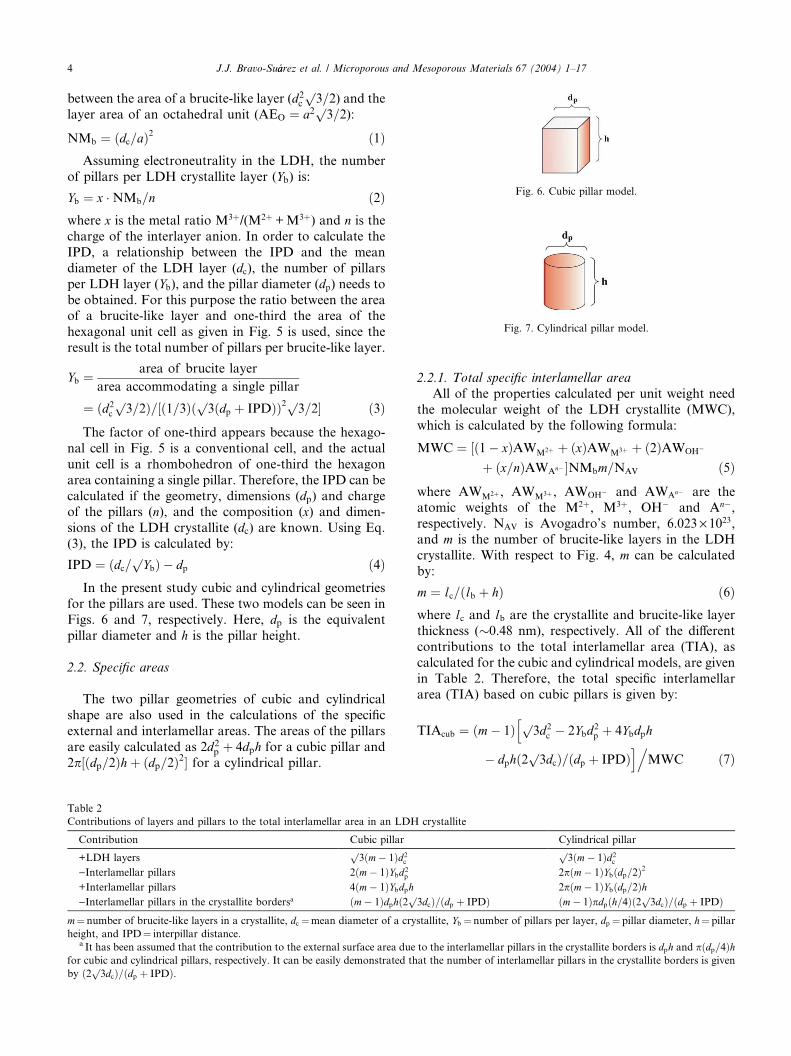
Fig. 6. Cubic pillar model.
Fig. 7. Cylindrical pillar model.
4 J.J. Bravo-Su�aarez et al. / Microporous and Mesoporous Materials 67 (2004) 1–17
between the area of a brucite-like layer (d2cp3=2) and the
layer area of an octahedral unit (AEO ¼ a2p3=2):
NMb ¼ ðdc=aÞ2 ð1ÞAssuming electroneutrality in the LDH, the number
of pillars per LDH crystallite layer (Yb) is:
Yb ¼ x �NMb=n ð2Þwhere x is the metal ratio M3þ/(M2þ +M3þ) and n is the
charge of the interlayer anion. In order to calculate the
IPD, a relationship between the IPD and the mean
diameter of the LDH layer (dc), the number of pillars
per LDH layer (Yb), and the pillar diameter (dp) needs tobe obtained. For this purpose the ratio between the areaof a brucite-like layer and one-third the area of the
hexagonal unit cell as given in Fig. 5 is used, since the
result is the total number of pillars per brucite-like layer.
Yb ¼area of brucite layer
area accommodating a single pillar
¼ ðd2c
p3=2Þ=½ð1=3Þðp3ðdp þ IPDÞÞ2p3=2� ð3Þ
The factor of one-third appears because the hexago-
nal cell in Fig. 5 is a conventional cell, and the actual
unit cell is a rhombohedron of one-third the hexagon
area containing a single pillar. Therefore, the IPD can be
calculated if the geometry, dimensions (dp) and chargeof the pillars (n), and the composition (x) and dimen-
sions of the LDH crystallite (dc) are known. Using Eq.
(3), the IPD is calculated by:
IPD ¼ ðdc=pYbÞ � dp ð4Þ
In the present study cubic and cylindrical geometries
for the pillars are used. These two models can be seen in
Figs. 6 and 7, respectively. Here, dp is the equivalent
pillar diameter and h is the pillar height.
2.2. Specific areas
The two pillar geometries of cubic and cylindrical
shape are also used in the calculations of the specific
external and interlamellar areas. The areas of the pillars
are easily calculated as 2d2p þ 4dph for a cubic pillar and
2p½ðdp=2Þhþ ðdp=2Þ2� for a cylindrical pillar.
Table 2
Contributions of layers and pillars to the total interlamellar area in an LDH
Contribution Cubic pillar
+LDH layersp3ðm� 1Þd2
c
)Interlamellar pillars 2ðm� 1ÞYbd2p
+Interlamellar pillars 4ðm� 1ÞYbdph)Interlamellar pillars in the crystallite bordersa ðm� 1Þdphð2
p
m¼ number of brucite-like layers in a crystallite, dc ¼mean diameter of a cry
height, and IPD¼ interpillar distance.a It has been assumed that the contribution to the external surface area due
for cubic and cylindrical pillars, respectively. It can be easily demonstrated th
by ð2p3dcÞ=ðdp þ IPDÞ.
2.2.1. Total specific interlamellar area
All of the properties calculated per unit weight need
the molecular weight of the LDH crystallite (MWC),
which is calculated by the following formula:
MWC ¼ ½ð1� xÞAWM2þ þ ðxÞAWM3þ þ ð2ÞAWOH�
þ ðx=nÞAWAn� �NMbm=NAV ð5Þ
where AWM2þ , AWM3þ , AWOH� and AWAn� are the
atomic weights of the M2þ, M3þ, OH� and An�,
respectively. NAV is Avogadro’s number, 6.023 · 1023,and m is the number of brucite-like layers in the LDH
crystallite. With respect to Fig. 4, m can be calculated
by:
m ¼ lc=ðlb þ hÞ ð6Þwhere lc and lb are the crystallite and brucite-like layer
thickness (�0.48 nm), respectively. All of the different
contributions to the total interlamellar area (TIA), as
calculated for the cubic and cylindrical models, are given
in Table 2. Therefore, the total specific interlamellararea (TIA) based on cubic pillars is given by:
TIAcub ¼ ðm� 1Þ p3d2
c
h� 2Ybd2
p þ 4Ybdph
� dphð2p3dcÞ=ðdp þ IPDÞ
i.MWC ð7Þ
crystallite
Cylindrical pillarp3ðm� 1Þd2
c
2pðm� 1ÞYbðdp=2Þ2
2pðm� 1ÞYbðdp=2Þh3dcÞ=ðdp þ IPDÞ ðm� 1Þpdpðh=4Þð2
p3dcÞ=ðdp þ IPDÞ
stallite, Yb ¼number of pillars per layer, dp ¼ pillar diameter, h¼ pillar
to the interlamellar pillars in the crystallite borders is dph and pðdp=4Þhat the number of interlamellar pillars in the crystallite borders is given
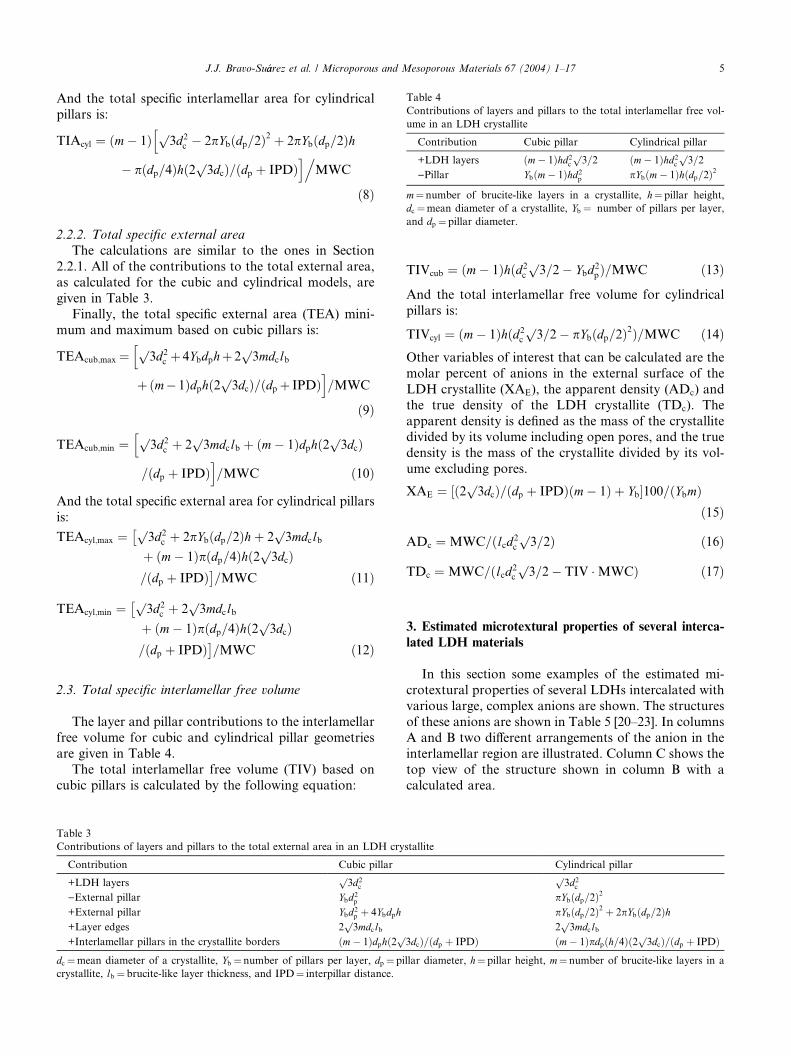
Table 4
Contributions of layers and pillars to the total interlamellar free vol-
ume in an LDH crystallite
Contribution Cubic pillar Cylindrical pillar
+LDH layers ðm� 1Þhd2c
p3=2 ðm� 1Þhd2
c
p3=2
)Pillar Ybðm� 1Þhd2p pYbðm� 1Þhðdp=2Þ2
m¼ number of brucite-like layers in a crystallite, h¼ pillar height,
J.J. Bravo-Su�aarez et al. / Microporous and Mesoporous Materials 67 (2004) 1–17 5
And the total specific interlamellar area for cylindrical
pillars is:
TIAcyl ¼ ðm� 1Þ p3d2
c
h� 2pYbðdp=2Þ2 þ 2pYbðdp=2Þh
� pðdp=4Þhð2p3dcÞ=ðdp þ IPDÞ
i.MWC
ð8Þ
dc ¼mean diameter of a crystallite, Yb ¼ number of pillars per layer,and dp ¼pillar diameter.
2.2.2. Total specific external area
The calculations are similar to the ones in Section
2.2.1. All of the contributions to the total external area,
as calculated for the cubic and cylindrical models, are
given in Table 3.Finally, the total specific external area (TEA) mini-
mum and maximum based on cubic pillars is:
TEAcub;max ¼p3d2
c
hþ 4Ybdphþ 2
p3mdclb
þðm� 1Þdphð2p3dcÞ=ðdpþ IPDÞ
i=MWC
ð9Þ
TEAcub;min ¼p3d2
c
hþ 2
p3mdclb þ ðm� 1Þdphð2
p3dcÞ
=ðdp þ IPDÞi=MWC ð10Þ
And the total specific external area for cylindrical pillars
is:
TEAcyl;max ¼p3d2
c
�þ 2pYbðdp=2Þhþ 2
p3mdclb
þ ðm� 1Þpðdp=4Þhð2p3dcÞ
=ðdp þ IPDÞ�=MWC ð11Þ
TEAcyl;min ¼p3d2
c
�þ 2
p3mdclb
þ ðm� 1Þpðdp=4Þhð2p3dcÞ
=ðdp þ IPDÞ�=MWC ð12Þ
2.3. Total specific interlamellar free volume
The layer and pillar contributions to the interlamellar
free volume for cubic and cylindrical pillar geometries
are given in Table 4.
The total interlamellar free volume (TIV) based on
cubic pillars is calculated by the following equation:
Table 3
Contributions of layers and pillars to the total external area in an LDH cry
Contribution Cubic pillar
+LDH layersp3d2
c
)External pillar Ybd2p
+External pillar Ybd2p þ 4Ybdph
+Layer edges 2p3mdclb
+Interlamellar pillars in the crystallite borders ðm� 1Þdphð2p
dc ¼mean diameter of a crystallite, Yb ¼number of pillars per layer, dp ¼pi
crystallite, lb ¼ brucite-like layer thickness, and IPD¼ interpillar distance.
TIVcub ¼ ðm� 1Þhðd2c
p3=2� Ybd2
pÞ=MWC ð13Þ
And the total interlamellar free volume for cylindrical
pillars is:
TIVcyl ¼ ðm� 1Þhðd2c
p3=2� pYbðdp=2Þ2Þ=MWC ð14Þ
Other variables of interest that can be calculated are the
molar percent of anions in the external surface of the
LDH crystallite (XAE), the apparent density (ADc) and
the true density of the LDH crystallite (TDc). The
apparent density is defined as the mass of the crystallitedivided by its volume including open pores, and the true
density is the mass of the crystallite divided by its vol-
ume excluding pores.
XAE ¼ ½ð2p3dcÞ=ðdp þ IPDÞðm� 1Þ þ Yb�100=ðYbmÞð15Þ
ADc ¼ MWC=ðlcd2c
p3=2Þ ð16Þ
TDc ¼ MWC=ðlcd2c
p3=2� TIV �MWCÞ ð17Þ
3. Estimated microtextural properties of several interca-
lated LDH materials
In this section some examples of the estimated mi-
crotextural properties of several LDHs intercalated with
various large, complex anions are shown. The structures
of these anions are shown in Table 5 [20–23]. In columns
A and B two different arrangements of the anion in the
interlamellar region are illustrated. Column C shows the
top view of the structure shown in column B with acalculated area.
stallite
Cylindrical pillarp3d2
c
pYbðdp=2Þ2
pYbðdp=2Þ2 þ 2pYbðdp=2Þh2p3mdclb
3dcÞ=ðdp þ IPDÞ ðm� 1Þpdpðh=4Þð2p3dcÞ=ðdp þ IPDÞ
llar diameter, h¼ pillar height, m¼number of brucite-like layers in a
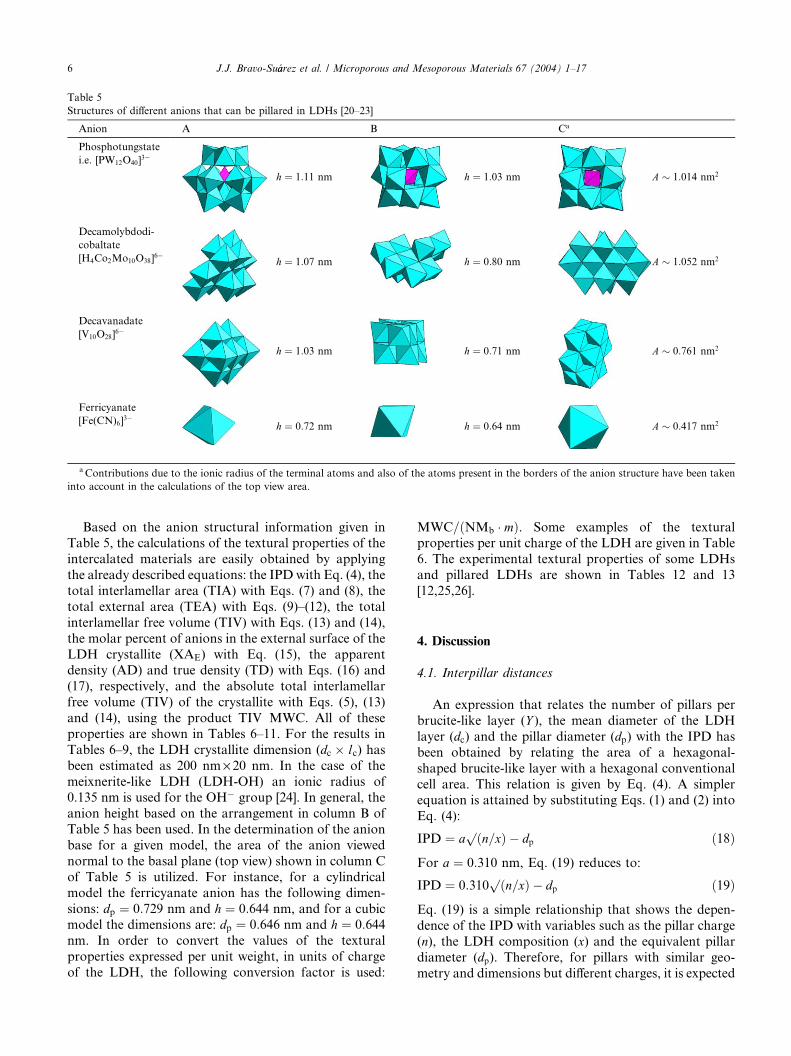
Table 5
Structures of different anions that can be pillared in LDHs [20–23]
Anion A B Ca
Phosphotungstate
i.e. [PW12O40]3�
h ¼ 1:11 nm h ¼ 1:03 nm A � 1:014 nm2
Decamolybdodi-
cobaltate
[H4Co2Mo10O38]6�
h ¼ 1:07 nm h ¼ 0:80 nm A � 1:052 nm2
Decavanadate
[V10O28]6�
h ¼ 1:03 nm h ¼ 0:71 nm A � 0:761 nm2
Ferricyanate
[Fe(CN)6]3�
h ¼ 0:72 nm h ¼ 0:64 nm A � 0:417 nm2
aContributions due to the ionic radius of the terminal atoms and also of the atoms present in the borders of the anion structure have been taken
into account in the calculations of the top view area.
6 J.J. Bravo-Su�aarez et al. / Microporous and Mesoporous Materials 67 (2004) 1–17
Based on the anion structural information given inTable 5, the calculations of the textural properties of the
intercalated materials are easily obtained by applying
the already described equations: the IPDwith Eq. (4), the
total interlamellar area (TIA) with Eqs. (7) and (8), the
total external area (TEA) with Eqs. (9)–(12), the total
interlamellar free volume (TIV) with Eqs. (13) and (14),
the molar percent of anions in the external surface of the
LDH crystallite (XAE) with Eq. (15), the apparentdensity (AD) and true density (TD) with Eqs. (16) and
(17), respectively, and the absolute total interlamellar
free volume (TIV) of the crystallite with Eqs. (5), (13)
and (14), using the product TIV ÆMWC. All of these
properties are shown in Tables 6–11. For the results in
Tables 6–9, the LDH crystallite dimension (dc � lc) hasbeen estimated as 200 nm · 20 nm. In the case of the
meixnerite-like LDH (LDH-OH) an ionic radius of0.135 nm is used for the OH� group [24]. In general, the
anion height based on the arrangement in column B of
Table 5 has been used. In the determination of the anion
base for a given model, the area of the anion viewed
normal to the basal plane (top view) shown in column C
of Table 5 is utilized. For instance, for a cylindrical
model the ferricyanate anion has the following dimen-
sions: dp ¼ 0:729 nm and h ¼ 0:644 nm, and for a cubicmodel the dimensions are: dp ¼ 0:646 nm and h ¼ 0:644nm. In order to convert the values of the textural
properties expressed per unit weight, in units of charge
of the LDH, the following conversion factor is used:
MWC=ðNMb � mÞ. Some examples of the texturalproperties per unit charge of the LDH are given in Table
6. The experimental textural properties of some LDHs
and pillared LDHs are shown in Tables 12 and 13
[12,25,26].
4. Discussion
4.1. Interpillar distances
An expression that relates the number of pillars per
brucite-like layer (Y ), the mean diameter of the LDH
layer (dc) and the pillar diameter (dp) with the IPD has
been obtained by relating the area of a hexagonal-
shaped brucite-like layer with a hexagonal conventional
cell area. This relation is given by Eq. (4). A simplerequation is attained by substituting Eqs. (1) and (2) into
Eq. (4):
IPD ¼ apðn=xÞ � dp ð18Þ
For a ¼ 0:310 nm, Eq. (19) reduces to:
IPD ¼ 0:310pðn=xÞ � dp ð19Þ
Eq. (19) is a simple relationship that shows the depen-
dence of the IPD with variables such as the pillar charge
(n), the LDH composition (x) and the equivalent pillar
diameter (dp). Therefore, for pillars with similar geo-
metry and dimensions but different charges, it is expected
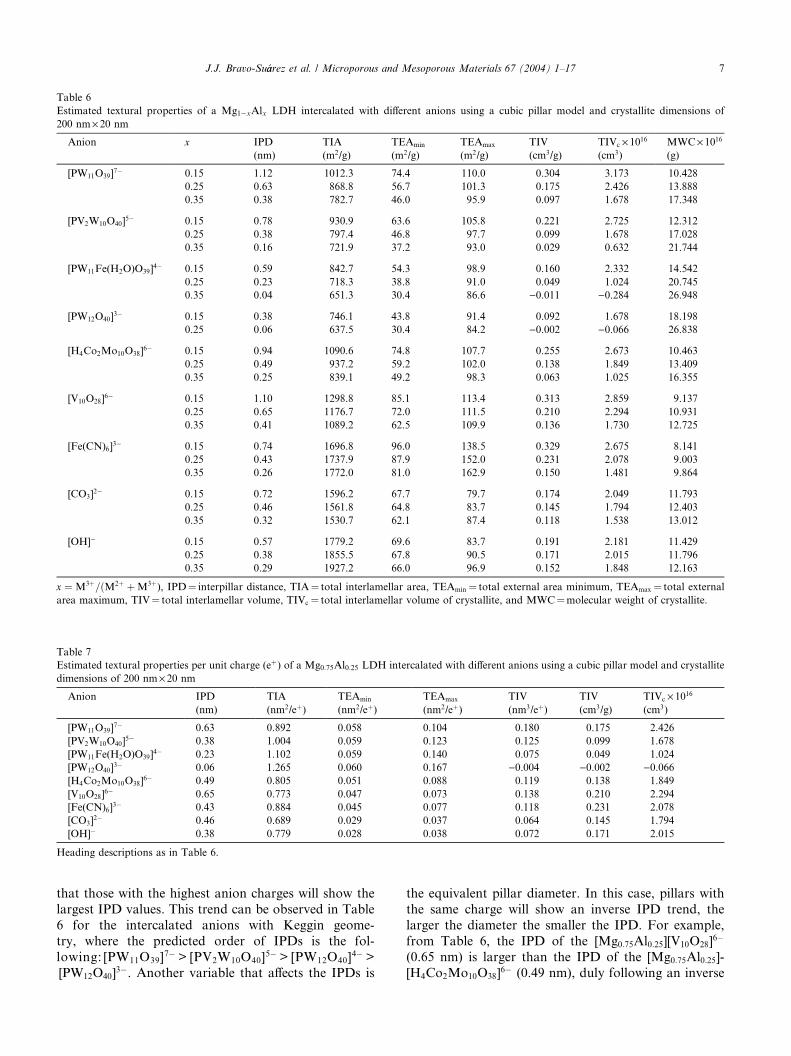
Table 6
Estimated textural properties of a Mg1�xAlx LDH intercalated with different anions using a cubic pillar model and crystallite dimensions of
200 nm· 20 nm
Anion x IPD
(nm)
TIA
(m2/g)
TEAmin
(m2/g)
TEAmax
(m2/g)
TIV
(cm3/g)
TIVc · 1016(cm3)
MWC· 1016(g)
[PW11O39]7� 0.15 1.12 1012.3 74.4 110.0 0.304 3.173 10.428
0.25 0.63 868.8 56.7 101.3 0.175 2.426 13.888
0.35 0.38 782.7 46.0 95.9 0.097 1.678 17.348
[PV2W10O40]5� 0.15 0.78 930.9 63.6 105.8 0.221 2.725 12.312
0.25 0.38 797.4 46.8 97.7 0.099 1.678 17.028
0.35 0.16 721.9 37.2 93.0 0.029 0.632 21.744
[PW11Fe(H2O)O39]4� 0.15 0.59 842.7 54.3 98.9 0.160 2.332 14.542
0.25 0.23 718.3 38.8 91.0 0.049 1.024 20.745
0.35 0.04 651.3 30.4 86.6 )0.011 )0.284 26.948
[PW12O40]3� 0.15 0.38 746.1 43.8 91.4 0.092 1.678 18.198
0.25 0.06 637.5 30.4 84.2 )0.002 )0.066 26.838
[H4Co2Mo10O38]6� 0.15 0.94 1090.6 74.8 107.7 0.255 2.673 10.463
0.25 0.49 937.2 59.2 102.0 0.138 1.849 13.409
0.35 0.25 839.1 49.2 98.3 0.063 1.025 16.355
[V10O28]6� 0.15 1.10 1298.8 85.1 113.4 0.313 2.859 9.137
0.25 0.65 1176.7 72.0 111.5 0.210 2.294 10.931
0.35 0.41 1089.2 62.5 109.9 0.136 1.730 12.725
[Fe(CN)6]3� 0.15 0.74 1696.8 96.0 138.5 0.329 2.675 8.141
0.25 0.43 1737.9 87.9 152.0 0.231 2.078 9.003
0.35 0.26 1772.0 81.0 162.9 0.150 1.481 9.864
[CO3]2� 0.15 0.72 1596.2 67.7 79.7 0.174 2.049 11.793
0.25 0.46 1561.8 64.8 83.7 0.145 1.794 12.403
0.35 0.32 1530.7 62.1 87.4 0.118 1.538 13.012
[OH]� 0.15 0.57 1779.2 69.6 83.7 0.191 2.181 11.429
0.25 0.38 1855.5 67.8 90.5 0.171 2.015 11.796
0.35 0.29 1927.2 66.0 96.9 0.152 1.848 12.163
x ¼ M3þ=ðM2þ þM3þ), IPD¼ interpillar distance, TIA¼ total interlamellar area, TEAmin ¼ total external area minimum, TEAmax ¼ total external
area maximum, TIV¼ total interlamellar volume, TIVc ¼ total interlamellar volume of crystallite, and MWC¼molecular weight of crystallite.
Table 7
Estimated textural properties per unit charge (eþ) of a Mg0:75Al0:25 LDH intercalated with different anions using a cubic pillar model and crystallite
dimensions of 200 nm· 20 nm
Anion IPD
(nm)
TIA
(nm2/eþ)
TEAmin
(nm2/eþ)
TEAmax
(nm2/eþ)
TIV
(nm3/eþ)
TIV
(cm3/g)
TIVc · 1016(cm3)
[PW11O39]7� 0.63 0.892 0.058 0.104 0.180 0.175 2.426
[PV2W10O40]5� 0.38 1.004 0.059 0.123 0.125 0.099 1.678
[PW11Fe(H2O)O39]4� 0.23 1.102 0.059 0.140 0.075 0.049 1.024
[PW12O40]3� 0.06 1.265 0.060 0.167 )0.004 )0.002 )0.066
[H4Co2Mo10O38]6� 0.49 0.805 0.051 0.088 0.119 0.138 1.849
[V10O28]6� 0.65 0.773 0.047 0.073 0.138 0.210 2.294
[Fe(CN)6]3� 0.43 0.884 0.045 0.077 0.118 0.231 2.078
[CO3]2� 0.46 0.689 0.029 0.037 0.064 0.145 1.794
[OH]� 0.38 0.779 0.028 0.038 0.072 0.171 2.015
Heading descriptions as in Table 6.
J.J. Bravo-Su�aarez et al. / Microporous and Mesoporous Materials 67 (2004) 1–17 7
that those with the highest anion charges will show the
largest IPD values. This trend can be observed in Table
6 for the intercalated anions with Keggin geome-
try, where the predicted order of IPDs is the fol-
lowing: [PW11O39]7� > [PV2W10O40]
5� > [PW12O40]4� >
[PW12O40]3�. Another variable that affects the IPDs is
the equivalent pillar diameter. In this case, pillars with
the same charge will show an inverse IPD trend, the
larger the diameter the smaller the IPD. For example,
from Table 6, the IPD of the [Mg0:75Al0:25][V10O28]6�
(0.65 nm) is larger than the IPD of the [Mg0:75Al0:25]-
[H4Co2Mo10O38]6� (0.49 nm), duly following an inverse
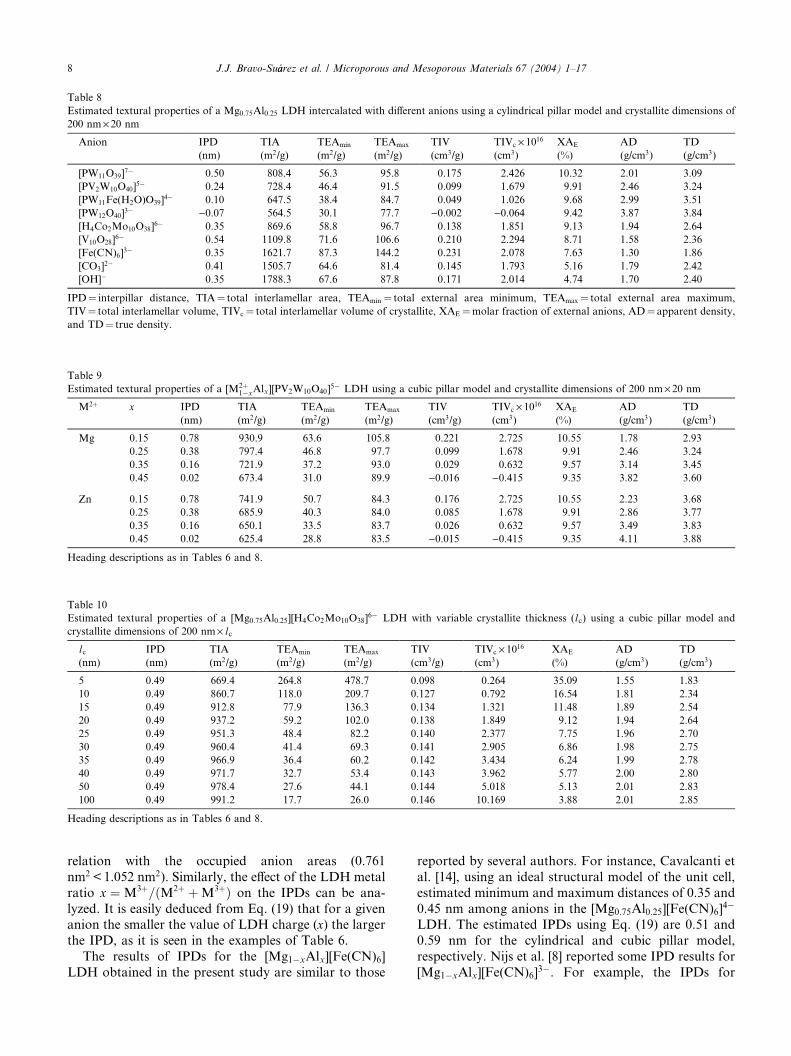
Table 8
Estimated textural properties of a Mg0:75Al0:25 LDH intercalated with different anions using a cylindrical pillar model and crystallite dimensions of
200 nm · 20 nm
Anion IPD
(nm)
TIA
(m2/g)
TEAmin
(m2/g)
TEAmax
(m2/g)
TIV
(cm3/g)
TIVc · 1016(cm3)
XAE
(%)
AD
(g/cm3)
TD
(g/cm3)
[PW11O39]7� 0.50 808.4 56.3 95.8 0.175 2.426 10.32 2.01 3.09
[PV2W10O40]5� 0.24 728.4 46.4 91.5 0.099 1.679 9.91 2.46 3.24
[PW11Fe(H2O)O39]4� 0.10 647.5 38.4 84.7 0.049 1.026 9.68 2.99 3.51
[PW12O40]3� )0.07 564.5 30.1 77.7 )0.002 )0.064 9.42 3.87 3.84
[H4Co2Mo10O38]6� 0.35 869.6 58.8 96.7 0.138 1.851 9.13 1.94 2.64
[V10O28]6� 0.54 1109.8 71.6 106.6 0.210 2.294 8.71 1.58 2.36
[Fe(CN)6]3� 0.35 1621.7 87.3 144.2 0.231 2.078 7.63 1.30 1.86
[CO3]2� 0.41 1505.7 64.6 81.4 0.145 1.793 5.16 1.79 2.42
[OH]� 0.35 1788.3 67.6 87.8 0.171 2.014 4.74 1.70 2.40
IPD¼ interpillar distance, TIA¼ total interlamellar area, TEAmin ¼ total external area minimum, TEAmax ¼ total external area maximum,
TIV¼ total interlamellar volume, TIVc ¼ total interlamellar volume of crystallite, XAE ¼molar fraction of external anions, AD¼ apparent density,
and TD¼ true density.
Table 9
Estimated textural properties of a [M2þ1�xAlx][PV2W10O40]
5� LDH using a cubic pillar model and crystallite dimensions of 200 nm· 20 nm
M2þ x IPD
(nm)
TIA
(m2/g)
TEAmin
(m2/g)
TEAmax
(m2/g)
TIV
(cm3/g)
TIVc · 1016(cm3)
XAE
(%)
AD
(g/cm3)
TD
(g/cm3)
Mg 0.15 0.78 930.9 63.6 105.8 0.221 2.725 10.55 1.78 2.93
0.25 0.38 797.4 46.8 97.7 0.099 1.678 9.91 2.46 3.24
0.35 0.16 721.9 37.2 93.0 0.029 0.632 9.57 3.14 3.45
0.45 0.02 673.4 31.0 89.9 )0.016 )0.415 9.35 3.82 3.60
Zn 0.15 0.78 741.9 50.7 84.3 0.176 2.725 10.55 2.23 3.68
0.25 0.38 685.9 40.3 84.0 0.085 1.678 9.91 2.86 3.77
0.35 0.16 650.1 33.5 83.7 0.026 0.632 9.57 3.49 3.83
0.45 0.02 625.4 28.8 83.5 )0.015 )0.415 9.35 4.11 3.88
Heading descriptions as in Tables 6 and 8.
Table 10
Estimated textural properties of a [Mg0:75Al0:25][H4Co2Mo10O38]6� LDH with variable crystallite thickness (lc) using a cubic pillar model and
crystallite dimensions of 200 nm· lclc(nm)
IPD
(nm)
TIA
(m2/g)
TEAmin
(m2/g)
TEAmax
(m2/g)
TIV
(cm3/g)
TIVc · 1016(cm3)
XAE
(%)
AD
(g/cm3)
TD
(g/cm3)
5 0.49 669.4 264.8 478.7 0.098 0.264 35.09 1.55 1.83
10 0.49 860.7 118.0 209.7 0.127 0.792 16.54 1.81 2.34
15 0.49 912.8 77.9 136.3 0.134 1.321 11.48 1.89 2.54
20 0.49 937.2 59.2 102.0 0.138 1.849 9.12 1.94 2.64
25 0.49 951.3 48.4 82.2 0.140 2.377 7.75 1.96 2.70
30 0.49 960.4 41.4 69.3 0.141 2.905 6.86 1.98 2.75
35 0.49 966.9 36.4 60.2 0.142 3.434 6.24 1.99 2.78
40 0.49 971.7 32.7 53.4 0.143 3.962 5.77 2.00 2.80
50 0.49 978.4 27.6 44.1 0.144 5.018 5.13 2.01 2.83
100 0.49 991.2 17.7 26.0 0.146 10.169 3.88 2.01 2.85
Heading descriptions as in Tables 6 and 8.
8 J.J. Bravo-Su�aarez et al. / Microporous and Mesoporous Materials 67 (2004) 1–17
relation with the occupied anion areas (0.761
nm2 < 1.052 nm2). Similarly, the effect of the LDH metal
ratio x ¼ M3þ=ðM2þ þM3þÞ on the IPDs can be ana-
lyzed. It is easily deduced from Eq. (19) that for a givenanion the smaller the value of LDH charge (x) the largerthe IPD, as it is seen in the examples of Table 6.
The results of IPDs for the [Mg1�xAlx][Fe(CN)6]
LDH obtained in the present study are similar to those
reported by several authors. For instance, Cavalcanti et
al. [14], using an ideal structural model of the unit cell,
estimated minimum and maximum distances of 0.35 and
0.45 nm among anions in the [Mg0:75Al0:25][Fe(CN)6]4�
LDH. The estimated IPDs using Eq. (19) are 0.51 and
0.59 nm for the cylindrical and cubic pillar model,
respectively. Nijs et al. [8] reported some IPD results for
[Mg1�xAlx][Fe(CN)6]3�. For example, the IPDs for
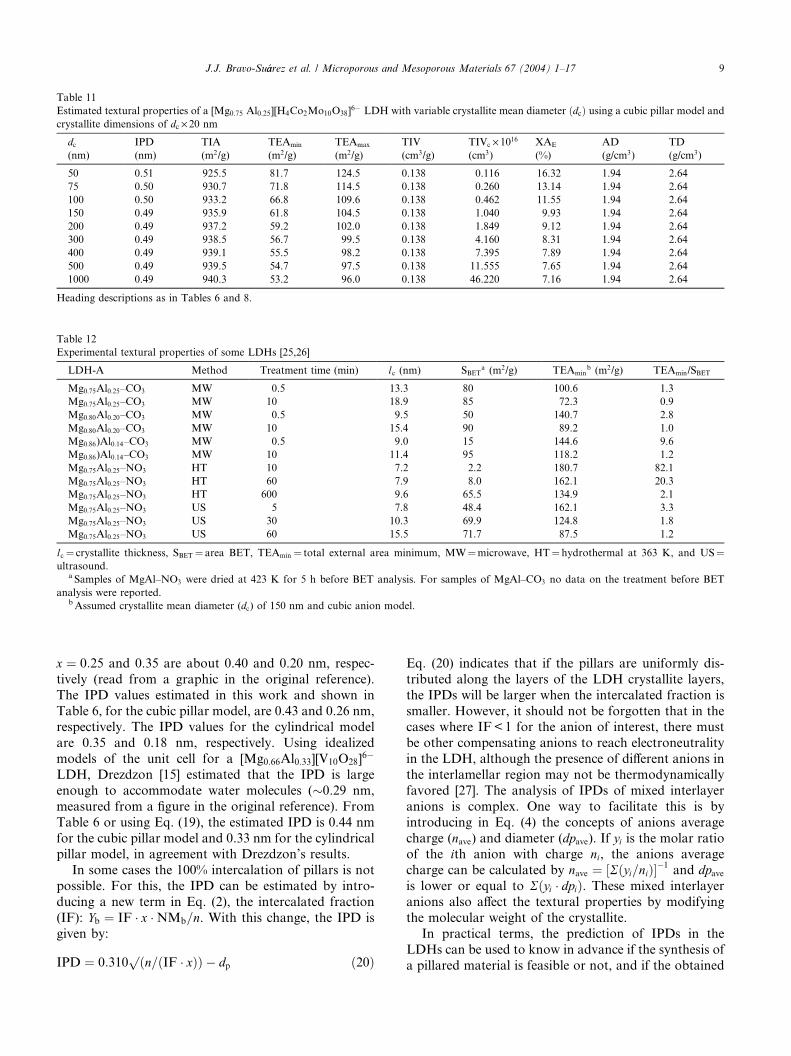
Table 11
Estimated textural properties of a [Mg0:75 Al0:25][H4Co2Mo10O38]6� LDH with variable crystallite mean diameter ðdcÞ using a cubic pillar model and
crystallite dimensions of dc · 20 nm
dc(nm)
IPD
(nm)
TIA
(m2/g)
TEAmin
(m2/g)
TEAmax
(m2/g)
TIV
(cm3/g)
TIVc · 1016(cm3)
XAE
(%)
AD
(g/cm3)
TD
(g/cm3)
50 0.51 925.5 81.7 124.5 0.138 0.116 16.32 1.94 2.64
75 0.50 930.7 71.8 114.5 0.138 0.260 13.14 1.94 2.64
100 0.50 933.2 66.8 109.6 0.138 0.462 11.55 1.94 2.64
150 0.49 935.9 61.8 104.5 0.138 1.040 9.93 1.94 2.64
200 0.49 937.2 59.2 102.0 0.138 1.849 9.12 1.94 2.64
300 0.49 938.5 56.7 99.5 0.138 4.160 8.31 1.94 2.64
400 0.49 939.1 55.5 98.2 0.138 7.395 7.89 1.94 2.64
500 0.49 939.5 54.7 97.5 0.138 11.555 7.65 1.94 2.64
1000 0.49 940.3 53.2 96.0 0.138 46.220 7.16 1.94 2.64
Heading descriptions as in Tables 6 and 8.
Table 12
Experimental textural properties of some LDHs [25,26]
LDH-A Method Treatment time (min) lc (nm) SBETa (m2/g) TEAmin
b (m2/g) TEAmin/SBET
Mg0:75Al0:25–CO3 MW 0.5 13.3 80 100.6 1.3
Mg0:75Al0:25–CO3 MW 10 18.9 85 72.3 0.9
Mg0:80Al0:20–CO3 MW 0.5 9.5 50 140.7 2.8
Mg0:80Al0:20–CO3 MW 10 15.4 90 89.2 1.0
Mg0:86)Al0:14–CO3 MW 0.5 9.0 15 144.6 9.6
Mg0:86)Al0:14–CO3 MW 10 11.4 95 118.2 1.2
Mg0:75Al0:25–NO3 HT 10 7.2 2.2 180.7 82.1
Mg0:75Al0:25–NO3 HT 60 7.9 8.0 162.1 20.3
Mg0:75Al0:25–NO3 HT 600 9.6 65.5 134.9 2.1
Mg0:75Al0:25–NO3 US 5 7.8 48.4 162.1 3.3
Mg0:75Al0:25–NO3 US 30 10.3 69.9 124.8 1.8
Mg0:75Al0:25–NO3 US 60 15.5 71.7 87.5 1.2
lc ¼ crystallite thickness, SBET ¼ area BET, TEAmin ¼ total external area minimum, MW¼microwave, HT¼ hydrothermal at 363 K, and US¼ultrasound.
a Samples of MgAl–NO3 were dried at 423 K for 5 h before BET analysis. For samples of MgAl–CO3 no data on the treatment before BET
analysis were reported.bAssumed crystallite mean diameter (dc) of 150 nm and cubic anion model.
J.J. Bravo-Su�aarez et al. / Microporous and Mesoporous Materials 67 (2004) 1–17 9
x ¼ 0:25 and 0.35 are about 0.40 and 0.20 nm, respec-
tively (read from a graphic in the original reference).
The IPD values estimated in this work and shown in
Table 6, for the cubic pillar model, are 0.43 and 0.26 nm,respectively. The IPD values for the cylindrical model
are 0.35 and 0.18 nm, respectively. Using idealized
models of the unit cell for a [Mg0:66Al0:33][V10O28]6�
LDH, Drezdzon [15] estimated that the IPD is large
enough to accommodate water molecules (�0.29 nm,
measured from a figure in the original reference). From
Table 6 or using Eq. (19), the estimated IPD is 0.44 nm
for the cubic pillar model and 0.33 nm for the cylindricalpillar model, in agreement with Drezdzon’s results.
In some cases the 100% intercalation of pillars is not
possible. For this, the IPD can be estimated by intro-
ducing a new term in Eq. (2), the intercalated fraction
(IF): Yb ¼ IF � x �NMb=n. With this change, the IPD is
given by:
IPD ¼ 0:310pðn=ðIF � xÞÞ � dp ð20Þ
Eq. (20) indicates that if the pillars are uniformly dis-
tributed along the layers of the LDH crystallite layers,
the IPDs will be larger when the intercalated fraction is
smaller. However, it should not be forgotten that in thecases where IF< 1 for the anion of interest, there must
be other compensating anions to reach electroneutrality
in the LDH, although the presence of different anions in
the interlamellar region may not be thermodynamically
favored [27]. The analysis of IPDs of mixed interlayer
anions is complex. One way to facilitate this is by
introducing in Eq. (4) the concepts of anions average
charge (nave) and diameter (dpave). If yi is the molar ratioof the ith anion with charge ni, the anions average
charge can be calculated by nave ¼ ½Rðyi=niÞ��1and dpave
is lower or equal to Rðyi � dpiÞ. These mixed interlayer
anions also affect the textural properties by modifying
the molecular weight of the crystallite.
In practical terms, the prediction of IPDs in the
LDHs can be used to know in advance if the synthesis of
a pillared material is feasible or not, and if the obtained
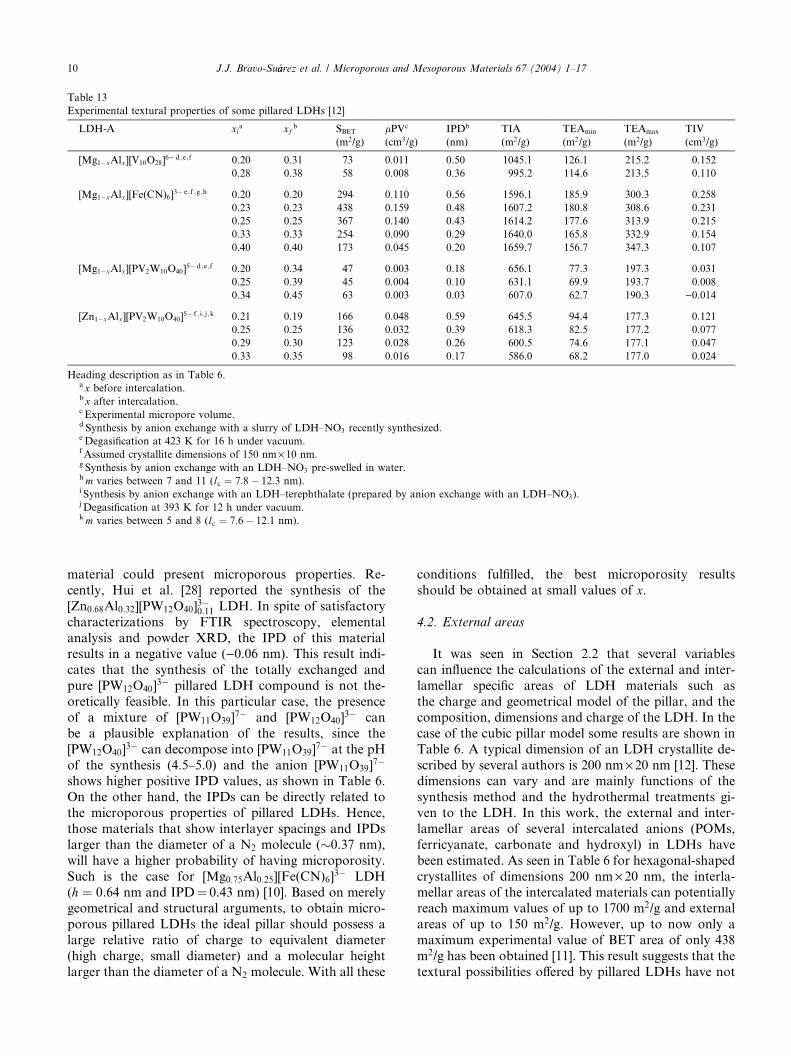
Table 13
Experimental textural properties of some pillared LDHs [12]
LDH-A xia xf b SBET
(m2/g)
lPVc
(cm3/g)
IPDb
(nm)
TIA
(m2/g)
TEAmin
(m2/g)
TEAmax
(m2/g)
TIV
(cm3/g)
[Mg1�xAlx][V10O28]6� d ;e ; f 0.20 0.31 73 0.011 0.50 1045.1 126.1 215.2 0.152
0.28 0.38 58 0.008 0.36 995.2 114.6 213.5 0.110
[Mg1�xAlx][Fe(CN)6]3� e ;f ;g ;h 0.20 0.20 294 0.110 0.56 1596.1 185.9 300.3 0.258
0.23 0.23 438 0.159 0.48 1607.2 180.8 308.6 0.231
0.25 0.25 367 0.140 0.43 1614.2 177.6 313.9 0.215
0.33 0.33 254 0.090 0.29 1640.0 165.8 332.9 0.154
0.40 0.40 173 0.045 0.20 1659.7 156.7 347.3 0.107
[Mg1�xAlx][PV2W10O40]5� d ;e ; f 0.20 0.34 47 0.003 0.18 656.1 77.3 197.3 0.031
0.25 0.39 45 0.004 0.10 631.1 69.9 193.7 0.008
0.34 0.45 63 0.003 0.03 607.0 62.7 190.3 )0.014
[Zn1�xAlx][PV2W10O40]5� f ; i ; j ;k 0.21 0.19 166 0.048 0.59 645.5 94.4 177.3 0.121
0.25 0.25 136 0.032 0.39 618.3 82.5 177.2 0.077
0.29 0.30 123 0.028 0.26 600.5 74.6 177.1 0.047
0.33 0.35 98 0.016 0.17 586.0 68.2 177.0 0.024
Heading description as in Table 6.a x before intercalation.b x after intercalation.c Experimental micropore volume.d Synthesis by anion exchange with a slurry of LDH–NO3 recently synthesized.eDegasification at 423 K for 16 h under vacuum.f Assumed crystallite dimensions of 150 nm· 10 nm.g Synthesis by anion exchange with an LDH–NO3 pre-swelled in water.hm varies between 7 and 11 (lc ¼ 7:8� 12:3 nm).i Synthesis by anion exchange with an LDH–terephthalate (prepared by anion exchange with an LDH–NO3).j Degasification at 393 K for 12 h under vacuum.km varies between 5 and 8 (lc ¼ 7:6� 12:1 nm).
10 J.J. Bravo-Su�aarez et al. / Microporous and Mesoporous Materials 67 (2004) 1–17
material could present microporous properties. Re-
cently, Hui et al. [28] reported the synthesis of the
[Zn0:68Al0:32][PW12O40]3�0:11 LDH. In spite of satisfactory
characterizations by FTIR spectroscopy, elemental
analysis and powder XRD, the IPD of this materialresults in a negative value ()0.06 nm). This result indi-
cates that the synthesis of the totally exchanged and
pure [PW12O40]3� pillared LDH compound is not the-
oretically feasible. In this particular case, the presence
of a mixture of [PW11O39]7� and [PW12O40]
3� can
be a plausible explanation of the results, since the
[PW12O40]3� can decompose into [PW11O39]
7� at the pH
of the synthesis (4.5–5.0) and the anion [PW11O39]7�
shows higher positive IPD values, as shown in Table 6.
On the other hand, the IPDs can be directly related to
the microporous properties of pillared LDHs. Hence,
those materials that show interlayer spacings and IPDs
larger than the diameter of a N2 molecule (�0.37 nm),
will have a higher probability of having microporosity.
Such is the case for [Mg0:75Al0:25][Fe(CN)6]3� LDH
(h ¼ 0:64 nm and IPD¼ 0.43 nm) [10]. Based on merelygeometrical and structural arguments, to obtain micro-
porous pillared LDHs the ideal pillar should possess a
large relative ratio of charge to equivalent diameter
(high charge, small diameter) and a molecular height
larger than the diameter of a N2 molecule. With all these
conditions fulfilled, the best microporosity results
should be obtained at small values of x.
4.2. External areas
It was seen in Section 2.2 that several variables
can influence the calculations of the external and inter-
lamellar specific areas of LDH materials such as
the charge and geometrical model of the pillar, and the
composition, dimensions and charge of the LDH. In the
case of the cubic pillar model some results are shown in
Table 6. A typical dimension of an LDH crystallite de-
scribed by several authors is 200 nm · 20 nm [12]. Thesedimensions can vary and are mainly functions of the
synthesis method and the hydrothermal treatments gi-
ven to the LDH. In this work, the external and inter-
lamellar areas of several intercalated anions (POMs,
ferricyanate, carbonate and hydroxyl) in LDHs have
been estimated. As seen in Table 6 for hexagonal-shaped
crystallites of dimensions 200 nm · 20 nm, the interla-
mellar areas of the intercalated materials can potentiallyreach maximum values of up to 1700 m2/g and external
areas of up to 150 m2/g. However, up to now only a
maximum experimental value of BET area of only 438
m2/g has been obtained [11]. This result suggests that the
textural possibilities offered by pillared LDHs have not
J.J. Bravo-Su�aarez et al. / Microporous and Mesoporous Materials 67 (2004) 1–17 11
been totally exploited. According to Nijs et al. [8],
interlamellar pore blocking and collapse of brucite-like
layers can occur during the intercalation process, which
will reduce the predicted values. The predictions for
minimum and maximum SSAs are also shown in Table6. The maximum TEA includes all possible contribu-
tions, such as the external surface and edges of the LDH
layers, the anions present in the borders and in the
exterior of the top and bottom layers. The minimum
TEA does not take into account the contribution due to
the anions in the external surfaces. In cases where the
LDH materials have a uniform distribution of anions on
the external surface and the values of h and IPD aremuch larger than 0.37 nm, the TEA may be close to the
maximum value. On the other hand, when the h or IPDs
are close to or smaller than 0.37 nm, the TEA will be
near the minimum value. The LDH charge can influ-
ence, in many different ways, the total specific areas of
the LDH. For the interlamellar areas, the larger the
LDH charge the higher the concentration of the anions
in the interlayer region, so that the interlamellar areaof the crystallite (TIA ÆMWC) should be larger. For
example, [Mg1�xAlx][PW11O39]7� LDH (x ¼ 0:15, 0.25
and 0.35) has crystallite TIA values of 1.056 · 10�12,
1.207 · 10�12 and 1.358 · 10�12 m2, respectively. How-
ever, when the TIA is expressed per unit charge of the
LDH, as proposed by Yun and Pinnavaia [29], a com-
pletely opposite behavior is obtained, the higher the
charge of the LDH the smaller the TIA, expressed innm2/eþ. When the TIAs are expressed in m2/g, it is
difficult to establish a relationship with the LDH charge
since in this case the TIA is a function not only of the
geometry and charge of the anion and the brucite-like
layers, but also of the molecular weight of the interca-
lated LDH. The difference in molecular weight for dif-
ferent LDHs can be seen in the values of MWCs for
different LDH charges, either for the same anion oranions with the same geometry (i.e. Keggin type). These
results are shown in Table 6.
When considering the effect of the charge of similar
anion geometries on the specific areas, the results are
very similar to those observed for the charge of the
LDH. The smaller the anion charge the higher the
number of anions necessary to reach electroneutrality,
giving larger crystallite TIAs and TEAs (expressed inm2). For instance, the crystallite TIA for the LDHs:
[Mg0:75Al0:25][PW11O39]7�, [Mg0:75Al0:25][PV2W10O40]
5�
and [Mg0:75Al0:25][PW11Fe(H2O)O39]4� are 1.207 ·
10�12, 1.358 · 10�12 and 1.490 · 10�12 m2, respectively.
The results in Table 7 show that the same trend is ob-
tained when comparing the TIAs expressed in nm2/eþ
and this is because the pillar dimensions and the LDH
charge have been kept constant. If the TIAs expressed inm2/g are compared, then the smaller the anion charge
the smaller the TIA values due to a higher anion con-
centration and therefore a higher molecular weight of
the LDH. From the results in Tables 6 and 8, the specific
areas are similar for both cubic and cylindrical anion
models, although the estimated IPDs are slightly smaller
when using the cylindrical anion model. Similarly, the
effect of the LDH molecular weight on the texturalproperties for different metals in the brucite-like layers
can be observed in Table 9. The textural properties ex-
pressed per unit weight of the LDH will be higher for the
[Zn1�xAlx][PV2W10O40]5� than for the [Mg1�xAlx][PV2-
W10O40]5� because of the greater molecular weight of
the Zn in comparison to the Mg. If the same results are
expressed in nm2/eþ, then the areas will be the same for
both materials as long as LDH charges are the same.For example, the TEAmax for the LDHs [Zn0:75-
Al0:25][PV2W10O40]5� and [Mg0:75Al0:25][PV2W10O40]
5�
are both equal to 0.123 nm2/eþ. This result is expectedsince the textural properties expressed per unit charge do
not depend on the LDH molecular weight. The crys-
tallite TIA and TEA results for an LDH crystallite
of [Zn1�xAlx][PV2W10O40]5� and [Mg1�xAlx][PV2W10-
O40]5� in m2 are also the same.
The estimated textural properties of the LDH
[Mg0:75Al0:25][H4Co2Mo10O38]6� for crystallites with
different thickness and mean diameter dimensions are
given in Tables 10 and 11, respectively. From the results
in Table 10, it is observed that the crystallite thickness
(lc) has a considerable effect on the specific areas,
especially on the TEA. Thus, the larger the values of lcthe smaller the values of TIA and TEA. It is worthwhileto note this inverse relationship of the lc’s with the TEAs
(in m2/g). For example, a reduction of 50% in the
crystallite thickness results in an increase of almost
100% in the TEAs. On the other hand, the crystallite
diameter (dc) also has some effect on the specific areas,
although not as pronounced as in the case of the crys-
tallite thickness. From the results in Table 11, it is noted
that the TEA and the TIA reach an almost constantvalue when dc is over 150 nm.
Reichle [30,31] reported BET areas for the LDH
Mg0:75Al0:25–CO3 of 120 m2/g for a sample crystallized
at 338 K for 18 h and 14 m2/g for a sample crystallized
at 473 K for 18 h. These BET area results were
explained using crystallite dimensions of 200 nm · 10 nm(TEAmin ¼ 125 m2/g) and 1000 nm · 100 nm (TEAmin ¼13 m2/g), respectively. However, these dimensions aresomewhat large, and from the published TEM results of
these materials [30,31] the dimensions 100 nm · 10 nm
(TEAmin ¼ 133.8 m2/g) and 500 nm · 50 nm (TEAmin ¼26.2 m2/g) may be more appropriate. In addition, only a
fraction of the TEAmin values can be experimentally
measured by a probe molecule such as N2. With regards
to Fig. 2, the fraction of a hexagon covered by a
spherical probe molecule is p=ð2p3Þ. Therefore the mea-surable TEAmin(mTEAmin) will be given by pTEAmin=ð2p3Þ. Because the height of the carbonate anion
(h ¼ 0:27 nm) is smaller than 0.37 nm, a contribution to
12 J.J. Bravo-Su�aarez et al. / Microporous and Mesoporous Materials 67 (2004) 1–17
the total area due to external and interlayer anions is
excluded. The estimated mTEAmin for the MgAl–CO3
LDHs crystallized at 338 and 473 K are 121.3 and
23.8 m2/g, respectively. These results are in agree-
ment with the experimental findings. Many otherexamples of the synthesis and characterization of LDH
compounds, including their morphological characteris-
tics, have been published [3]. However, very few of these
comprise a full textural characterization with crystallite
thickness and mean diameter, specific areas and micro-
pore volumes. In most of the cases, the values of the
average crystallite thickness (distance in the basal plane
0 0 l), shown in the present work to have an appreciableinfluence in the specific areas of LDHs, have not been
reported, even though they can be easily calculated from
powder XRD results by means of Scherrer’s equation
[32].
The BET area of LDHs can show substantial differ-
ences even for the same material, as seen in Table 1.
According to Rives [3], the observed differences are
mostly a result of the aging and hydrothermal treat-ments given during the synthesis, or the drying process
before BET analysis. From a structural point of view,
these discrepancies in BET areas can be explained by the
differences in the average dimensions of the LDH crys-
tallite. For instance, in the synthesis of the LDH
[Mg0:75Al0:25][CO3] by the urea method, Constantino
et al. [4] obtained a BET area of 24 m2/g. The measured
crystallite mean diameter by the SEM method variedbetween 0.5 and 10 lm. Using similar synthetic condi-
tions, Oh et al. [33] observed average diameters of 2 lm.
However, neither of the two studies indicated values of
the average crystallite thickness. The estimated TEAmin
for a crystallite with dimensions of 2000 nm · 40 nm is
28.8 m2/g and the mTEAmin is 26.1 m2/g. This result
indicates that the crystallite thickness may have a value
close to 40 nm, which may be in agreement with the highcrystallinity of these materials as observed in the pub-
lished powder XRD patterns. For the rest of the LDHs
in Table 1, with the exception of the LDH [Mg0:75Al0:25]-
[CO3] synthesized in a water/ethylene glycol medium,
the observed BET areas are around 80–90 m2/g. These
BET area results can be estimated using a value of
crystallite diameter (dc) close to 150 nm, and a crystallite
thickness (lc) of about 15.0 nm. The differences observedwith the sample synthesized in the water/ethylene glycol
media can be explained by a variation in the mean
diameter and thickness of the crystallite. A more de-
tailed discussion of this difference is not possible since
the values of dc and lc were not described in the original
reference. Velu et al. [5] reported the values of crystallite
thickness for the LDHs [Mg0:77Al0:23][CO3] (17.6 nm)
and [Mg0:81Al0:19][CO3] (12.9 nm); the BET areasof these materials are shown in Table 1. If an aver-
age crystallite diameter of 150 nm is assumed, then
the estimated mTEAmin for these LDHs are 70.9
and 93.7 m2/g, respectively. These estimated values
are comparable with the experimental results, 92 and
88 m2/g.
Recently, Hussein et al. [25] and Seida et al. [26]
studied the effect of microwave radiation and ultrasoundon the synthesis of MgAl LDHs and the effect that these
treatments have on the textural properties of the
resulting materials. The first authors presented the
evolution of the crystallite thickness (lc) together with
the BET area of the resulting LDHs, when the LDH was
synthesized with hydrothermal treatments under a
microwave field using exposure times between 0.5 and
10 min. The experimental results are given in Table 12.The observed crystallite thickness for the LDHs
[Mg0:75Al0:25][CO3], [Mg0:80Al0:20][CO3] and [Mg0:86-
Al0:14][CO3] varied between 13.3–18.9, 9.5–15.4 and 9.0–
11.4 nm for microwave exposure times of 0.5 and 10
min, respectively, and the BET areas were 80–85, 50–90
and 15–95 m2/g, respectively. Assuming a particle
diameter (dc) of 150 nm, the estimated TEAmin for these
materials are 100.6–72.3, 140.7–89.2 and 144.6–118.2m2/g, respectively. The larger deviations presented by
the BET areas at the shortest exposure time can be ex-
plained by the poor crystallinity of the samples and due
to a crystallite aggregation of the type face-to-face or
card-house [19], resulting in a reduction in the total
external area. The resulting face-to-face type aggregate
from two crystallites would form a ‘‘new crystallite’’ of
greater thickness. If the interfacial space between thesetwo crystallites is not accessible or very limited to N2
molecules, then the total external surface area can be
decreased up to 50%. An analysis of the ratio TEAmin/
SBET shows that when large values are obtained there is
a high tendency to form face-to-face aggregates with a
higher number of crystallites. In this way, from the re-
sults in Table 12, there are more aggregates at shorter
microwave exposure times for an LDH with the samecharge (½Mg0:86Al0:14�½CO3� � 0:5min ¼ 9:6 > ½Mg0:86-
Al0:14�½CO3� � 10min ¼ 1:2) and at smaller values of
x for different LDH charges (½Mg0:86Al0:14�½CO3� �0:5min ¼ 9:6 > ½Mg0:80Al0:20�½CO3� � 0:5min ¼ 2:8 >½Mg0:75Al0:25�½CO3� � 0:5min ¼ 1:3). Similar behavior is
noted from the results of the synthesis of the LDH
Mg0:75Al0:25–NO3 subjected to hydrothermal (363 K)
and ultrasound treatments. The results of TEAmin/SBETfor the hydrothermally treated samples (t ¼ 10, 60 and
600 min) are 82.1, 20.3 and 2.1, respectively, and for the
samples treated under ultrasound (t ¼ 5, 30 and 60 min)
the TEAmin/SBET are 3.3, 1.8 and 1.2, respectively. At
elevated treatment times (HT or US), the crystallinity of
the sample is higher and the values of lc are much larger,
resulting in TEAmin/SBET values close to 1.0. Therefore,
there is a lower probability of forming face-to-faceaggregates, which means that at these conditions the
experimental values of the BET area agree with the
mTEAmin.
J.J. Bravo-Su�aarez et al. / Microporous and Mesoporous Materials 67 (2004) 1–17 13
[Mg0:75Al0:25][NO3] LDHs have been also synthesized
by Fetter et al. [34] using high concentrations of metals
(2.5 M), relatively short precipitation times (10 min) and
a subsequent treatment of the LDH slurry with micro-
wave radiation for 5 min. After a degasification of theLDH samples at 373 K for 2 h, the resulting areas are
quite small (�3 m2/g). The BET area differences of the
MgAl–NO3 with the MgAl–CO3 are explained by these
authors in terms of the higher interlayer density of the
NO�3 anions in the LDH, which prevents N2 molecules
from accessing the interlayer space. For the MgAl–CO3,
with a lower anion density, the N2 can supposedly dif-
fuse more easily into the interlayer region. From theresults in the present study and from the literature, these
explanations are not completely satisfactory. It is true
that in an LDH the NO�3 density is higher than for the
CO2�3 , since both anions possess a similar geometry and
a different charge, as given by the estimated IPDs for
these materials. For the [Mg1�xAlx][NO3] (x ¼ 0:15,0.25, 0.35) the IPDs are 0.38, 0.20 and 0.11 nm,
respectively, while for the [Mg1�xAlx][CO3] (x ¼ 0:15,0.25, 0.35) the IPDs are 0.72, 0.46 and 0.32 nm,
respectively. Although the IPDs for the MgAl–CO3 are
larger than a N2 molecule, it would be erroneous to
think that these N2 molecules can reach the interlamellar
region since the interlayer distance for the CO2�3 is about
0.27 nm. Also, if we compare the equivalent molecular
weights of the crystallites of MgAl–NO3 and MgAl–
CO3 with the same dimensions, the obtained values aresimilar. A more satisfactory explanation of Fetter et al.’s
results would have to do with the poor crystallinity of
the synthesized materials together with a high agglom-
eration of the crystallites. The textural properties of
others LDHs of NO�3 and CO2�
3 have been also pub-
lished in the literature. For instance, Velu et al. [35]
synthesized the LDHs of [Zn0:64Al0:36][CO3] and
[Zn0:63Al0:37][NO3]. The crystallite thickness (lc) and theBET areas were 25.2 and 18.0 nm, and 45 and 32 m2/g
(read from a graphic in the original reference), respec-
tively. If a crystallite diameter of 150 nm is assumed,
then the measurable TEAmin (mTEAmin) are 35.6 and
48.6 m2/g, respectively. These values are comparable
with the experimental results.
Although the results of the model presented in this
study are applicable to LDHs of the type[M2þ
1�xM3þx (OH)2][A
n�x=n], similar trends for the textural
properties have been found in LDHs of the type
[Mþ1�xM
3þx (OH)2]
ð2x�1Þþ[An�ð2x�1Þ=n] [36]. Ulibarri et al.
[37] studied the textural properties of the LDH
[Liþ0:33Al3þ0:67(OH)2]0:33þ[An�
0:33=n] as a function of the time
and the temperature of the hydrothermal treatment. The
experimental results indicated that the longer the time of
the hydrothermal treatment at 403 K the larger thecrystallite thickness. The values of the crystallite thick-
ness varied from 2.4 nm for a sample not treated
hydrothermally, up to 31.9 nm for a sample treated for
48 h. The BET areas of these samples ranged from 55.5
to 5.5 m2/g, respectively. These results follow the
same behavior observed for the LDH of the type
[M2þ1�xM
3þx (OH)2][A
n�x=n], where the larger the crystallite
thickness the smaller the TEAmin. Regarding the tem-perature of the hydrothermal treatment, a similar
behavior is also noted. As the temperature of the
hydrothermal treatment at 48 h increased, the LDH
crystallite thickness becomes greater giving as a result a
reduction of the BET area.
The intercalation of POMs in LDHs has been well
studied owing to the potential that these materials
present as catalysts and adsorbents with shape selectiv-ity [2]. Several methods of intercalation of POMs in
LDHs have been described in the literature, including
direct synthesis [29], direct anion exchange [38,39], anion
exchange by acid elimination [15] and reconstruction of
the LDH structure [40,41]. Recently, Nijs et al. [12]
studied the microporous properties of some of these
intercalated compounds. Some of the results of this
study are shown in Table 13. In the case of the LDHs[Mg1�xAlx][V10O28] and [Mg1�xAlx][PV2W10O40] the
values of the TEAs and the crystallite diameter (dc) andthickness (lc) were not described. For calculation pur-
poses, LDH crystallites with dimensions of 150 nm · 10nm have been assumed. From the results in Table 13, the
values of TEAmin are almost twice the BET area for the
LDH [Mg1�xAlx][V10O28]. This result may indicate that
the BET area is mainly due to the external area of theLDH crystallite. The explanation for why the BET area
is smaller than the TEAmin may be that face-to-face
aggregates are formed or simply a crystallite thickness
larger than 10 nm is present. For the LDH [Mg1�xAlx]-
[PV2W10O40], the values of TEAmin estimated with the
model are much closer to the BET areas, but still larger.
Again, a difference in the crystallite thickness could
explain these variations. For these two intercalatedcompounds, there is no formation of interlamellar
microporosity, even for the [Mg1�xAlx][V10O28] that
shows an IPD of 0.50 nm, since it is very probable that
the synthesized material contains other isopolyvana-
dates species of lower charge that would make access
more difficult to the interlayer region. In the LDH
[Mg1�xAlx][PV2W10O40] (xf ¼ 0:34, 0.39, 0.45), small
and even close to zero values of IPDs are observed (0.18,0.10 and 0.03 nm). This may be because the initial xvalues of the original LDH (x ¼ 0:20, 0.25, 0.34) are
much smaller than those of the final intercalated mate-
rial, due to a partial dissolution of the Mg from the
brucite-like layers. These faults in the lamellar structure
could be used by the POMs as exchange sites, and
according to Nijs et al. [9], this would explain why in
some cases the obtained interlayer distances are smallerthan expected. Consequently, the IPDs of this LDH
[Mg1�xAlx][PV2W10O40] should be calculated for x val-
ues between xi and xf . The obtained IPDs are 0.55–0.18,
Fig. 8. Model of a brucite like layer with equally spaced cubic anions.
14 J.J. Bravo-Su�aarez et al. / Microporous and Mesoporous Materials 67 (2004) 1–17
0.39–0.10, and 0.18–0.03 nm, respectively. Additionally,
the decomposition of the [PV2W10O40]5� in other Keg-
gin type POMs cannot be excluded, which could be also
intercalated in the LDH.
The LDHs [Mg1�xAlx][Fe(CN)6]3� and [Zn1�xAlx]-
[PV2W10O40] have crystallite thicknesses between 7.8–
12.3 and 7.6–12.1 nm, respectively [9]. Thus, an average
value of 10 nm has been taken for both materials and a
value of 150 nm has been estimated for the crystallite
diameter (dc). With these dimensions the estimated tex-
tural properties are given in Table 13. The
[Mg1�xAlx][Fe(CN)6]3� LDH presents values of TEAmin
smaller than the BET area. This BET area increases asthe value of x decreases, in agreement with the increas-
ing IPDs. These results together with the micropore
volume are an indicative of the presence of micropo-
rosity. The BET areas register a maximum value at
x ¼ 0:23, and below it the BET areas start decreasing.
This reduction is not in agreement with the theoretical
predictions. According to Nijs [12] this reduction in the
BET areas can be attributed to the loss of LDH crys-tallinity at the degasification conditions of the sample,
due to a lower thermal stability of the pillared materials
at low x values. On the other hand, aggregation of these
low crystalline materials can contribute to the decrease
of the total external area. If the external area of these
intercalated materials is assumed to have a value close to
the TEAmin, then the micropore areas can be calculated
based on experimental data. The interlamellar areasreach a maximum of up to 16% of the theoretical value.
On the one hand, this result can be understood if the
IPD is viewed as an average value. For example, the
LDH [Mg0:75Al0:25][Fe(CN)6]3� that has a BET area of
367 m2/g and a relatively high thermal stability at the
degasification conditions has an IPD of about 0.43 nm.
Therefore, if this material is assumed to have a normal
distribution of IPDs with an average value of 0.43 nmand a standard deviation of 0.05 nm, then only 88% of
the total IPDs will show values larger than 0.37 nm.
Consequently, not all of the pores formed in the inter-
lamellar region will be accessible to N2 molecules. On
the other hand, the low interlamellar areas can be
understood if we take into account that the IPDs and
the interlayer spacing (h) for the ferricyanate anion are
smaller than 0.74 nm (twice the diameter of a N2 mole-cule). For this reason, only a fraction of the total
interlamellar area (TIA) estimated theoretically can be
measured experimentally.
4.3. Interlamellar areas
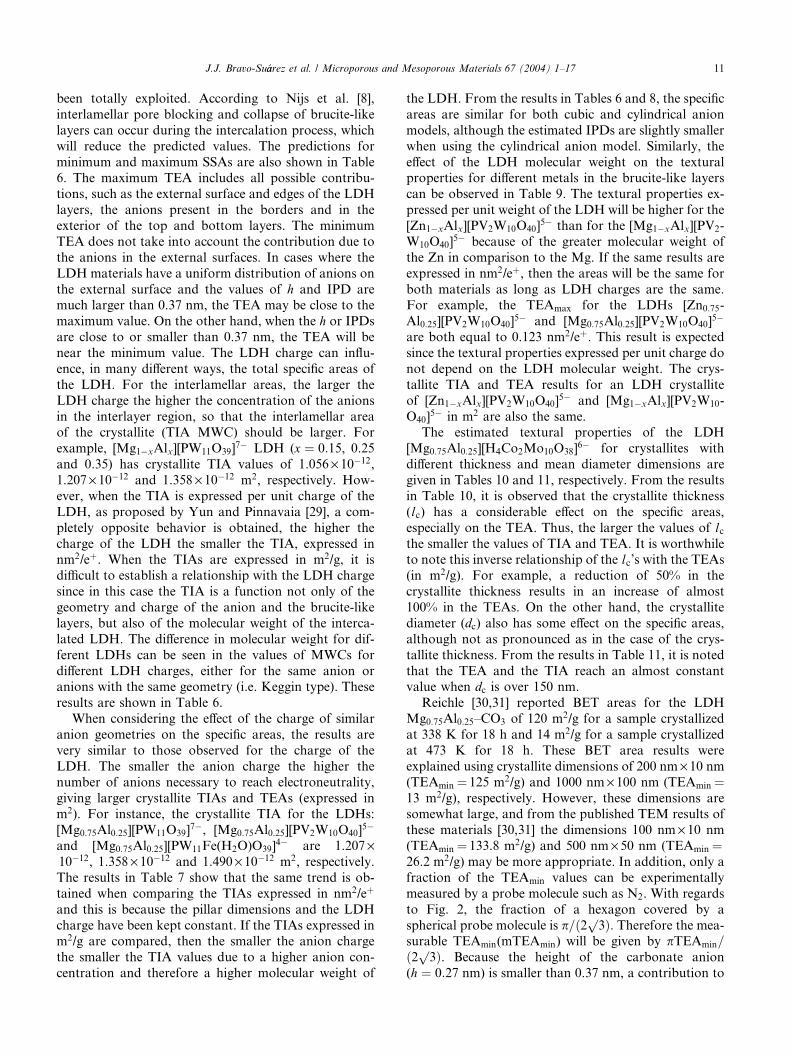
To estimate the fraction of TIA measured experi-
mentally, an equilateral parallelogram geometry for abrucite-like layer with equally spaced cubic pillars is
assumed. This model is schematically shown in Fig. 8.
For IPD values between 0.37 and 0.74 nm, an equation
to estimate the fraction of the TIA that can be experi-
mentally measured (FIAmea) is obtained in the following
manner. Two different types of ‘‘empty spaces’’ can beidentified: the first type lies between pillars in the same
row and the second type lies between two rows of pillars.
The total number of available empty spaces for the first
type is given by NPsðNPs � 1Þ and for the second type
by ð2NPs � 1ÞðNPs � 1Þ, respectively. NPs is the number
of pillars on one of the sides of the structure in Fig. 8.
The fraction of TIA that can be experimentally mea-
sured is given by the ratio between the area measured byN2 molecules and the theoretical area. This ratio ex-
pressed as a function of NPs is: ½AN2NPsðNPs � 1Þþ
AN2ð2NPs � 1ÞðNPs � 1Þ�=½IPD2NPsðNPs � 1Þp3þ 2dp-
hNPsðNPs � 1Þ þ IPD2ð2NPs � 1ÞðNPs � 1Þp3 þ dp-hð2NPs � 1ÞðNPs � 1Þ�. Simplifying common terms and
also for values of NPs � 1 the following equation is
obtained:
FIAmea ¼ 3AN2=ð3p3IPD2 þ 4dphÞ ð21Þ
where AN2is the molecular cross sectional area of a
nitrogen molecule (0.163 nm2). Using Eq. (21), the
fraction of TIA that can be experimentally measured for
the LDH [Mg0:77Al0:23][Fe(CN)6]3� corresponds
approximately to 17%, that is, 273.2 m2/g. By comparing
this result with the experimental 257 m2/g, the model
explains adequately the experimental results for the
[Mg0:77Al0:23][Fe(CN)6]3� LDH. In the case of the
[Zn1�xAlx][PV2W10O40], the BET areas are also larger
than the values of TEAmin; together with the micropore
volumes it can be said that this material has micropo-
rosity. Similarly, the BET areas show an increasing
trend as the x values decrease. If the micropore areas are
calculated by SBET)TEAmin, then only up to 11% of the
TIA theoretical value is obtained. These differences can
be explained with similar arguments used for the[Mg1�xAlx][Fe(CN)6]
3� materials.
4.4. Interlamellar free volumes
Some results of the estimated TIVs for several inter-
calated LDHs with crystallites dimensions (dc � lc) 200nm · 20 nm are shown in Table 6. In all cases, as ex-
pected, the TIV decreases when the LDH charge (x)
J.J. Bravo-Su�aarez et al. / Microporous and Mesoporous Materials 67 (2004) 1–17 15
increases, as a result of a higher concentration of anions
in the interlayer region. If two anions of similar charge
are compared, with the same LDH charge, the TIV is
lower for the bulkier anion. For example, the LDH
[Mg0:75Al0:25][H4Co2Mo10O38]6� (0.138 cm3/g) has a
lower TIV than the LDH [Mg0:66Al0:33][V10O28]6� (0.210
cm3/g). On the other hand, a comparison of anions of
similar volume within an LDH of the same charge
shows that the TIVs are higher for the anions of higher
charge. Therefore, for the Keggin anion series shown in
Table 6, the estimated TIVs follow the trend:
[PW11O39]7� > [PV2W10O40]
5� > [PW11Fe(H2O)O39]4� >
[PW12O40]3�. For a given LDH compound, independent
of the anion model utilized, the estimated TIVs are the
same since, in the calculations, the area occupied by the
anion remains the same. When the effect of the metals in
the brucite-like layers is studied, the lower TIVs are for
the LDHs that contain the heavier metals due to the
molecular weight effect on the TIVs expressed in cm3/g.
In absolute terms, the TIVc (in cm3) is the same as long
as the LDH charge and crystallite dimensions are thesame. For instance, the [Zn0:75Al0:25][PV2W10O40]
5� and
the [Mg0:75Al0:25][PV2W10O40]5� have the same TIVc ¼
1:678� 10�16 cm3. A similar result is obtained when the
TIVs are expressed per unit charge of the LDH (nm3/eþ)because the LDH charge is the same for both materials.
The effect of the crystallite dimensions can be seen in
Tables 10 and 11. In the case of the LDH
[Mg0:75Al0:25][H4Co2Mo10O38] with a constant crystal-lite diameter (dc), when the crystallite thickness (lc) in-creases the TIV also increases, reaching an almost
constant value over a lc of 25 nm. The same result is
obtained when the units of the TIVs are expressed in
nm3/eþ since the conversion factor g/eþ, MWC/
(NMc � x �m), is only function of the LDH charge and
molecular weight. For this same material, if the crys-
tallite thickness is kept constant and the crystallite di-ameter is modified, then the estimated TIV remains
constant. Similarly to the TIA, the crystallite thickness
presents a more pronounced effect on the TIVs than the
crystallite diameter. However, in the case of the TIVc’s,
as shown in Tables 10 and 11, a constant increase of the
crystallite interlamellar free volume is observed as the
values of dc or lc are incremented.
Three different strategies can be utilized to compareTIVs of intercalated LDHs with similar crystallite di-
mensions: using TIVs expressed in cm3/g, in nm3/eþ or
in cm3. Therefore, for the LDHs Mg0:75Al0:25�An� ob-
served in Table 7, the anion order of the five highest
TIVs expressed in cm3/g are: [Fe(CN)6]3� (0.231) > [V10-
O28]6� (0.210) > [PW11O39]
7� (0.175) > [OH]� (0.171) >
[CO3]2� (0.145); in nm3/eþ: [PW11 O39]
7� (0.180) > [V10-
O28]6� (0.138) > [PV2W10O40]
5� (0.125) > [H4Co2Mo10-O38]
6� (0.119) > [Fe(CN)6]3� (0.118) and in cm3 · 1016:
[PW11 O39]7� (2.426) > [V10O28]
6� (2.294) > [Fe(CN)6]3�
(2.078) > [OH]� (2.015) > [H4Co2Mo10O38]6� (1.849).
The experimental results of the micropore volumes of
several pillared LDHs are shown in Table 13. The lPV/TIV ratio of these materials varies between 7% and 69%.
The highest value is presented by the LDH [Mg0:77-
Al0:23][Fe(CN)6]3�. This result can be explained if the
method used to measure the micropore volume using N2
is taken into account, because when the IPDs and the
interlayer spacings fall between 0.37 and 0.74 nm, it is
not possible to experimentally measure all of the theo-
retical TIV. In this case, an expression similar to Eq.
(21) is derived to determine the fraction of TIV that can
be experimentally measured (FIVmea): ½VN2NPsðNPs �
1ÞþVN2ð2NPs� 1ÞðNPs� 1Þ�=½ðp3=2ÞIPD2hNPsðNPs�
1Þ þ ðp3=2ÞIPD2hð2NPs � 1Þ ðNPs � 1Þ�. Simplifying
terms and for NPs � 1 the following expression is ob-
tained:
FIVmea ¼ 2VN2=ðp3IPD2hÞ ð22Þ
VN2is the volume of a N2 molecule, calculated from the
liquid density of N2 at the boiling point (0.808 g/cm3).
Eq. (22) is valid for values of h and IPDs between 0.37
and 0.74 nm. For [Mg0:77Al0:23][Fe(CN)6]3� the maxi-
mum fraction of the TIV that can be measured is about45%. However, the experimental value is 69%. This re-
sult could be explained by the presence of IPDs > 0:74nm and by a contribution to the micropore volume from
the external area, the LDH mesoporosity or both [42].
4.5. Other properties
Other LDH properties that can be estimated in the
present study include the molar fraction of the anions
present in the external surface of the crystallite and the
LDH apparent and true densities. The molar fraction of
the LDH external anions (XAE) is an important variablein the pillared LDH compounds, especially when they
are used as catalysts. For example, in the POM pillared
LDHs, the polyoxometalate usually plays the role of
active site in the catalytic process. In catalysis, the cat-
alytic activity can be expressed as turnover rates (TOR),
molecules reacting per active site per unit time. The
TORs in reactions catalyzed by LDH-POMs are typi-
cally calculated on the basis of the total POMs present inthe LDH [13]. However, in many cases the reacting
molecules are too big to access the interlamellar region.
Thus, it is more likely that the reactions will be carried
out in the external surface of the LDH. In this work, Eq.
(15) is used for the calculation of the fraction of external
anions. This equation takes into account contributions
due to the top and bottom external crystallite layers and
also the anions in the borders of the LDH crystallitelayers. Eq. (15) is based on the assumption that there are
enough interlamellar anions in each layer (Y ) to equili-
brate the LDH charge (x). Therefore, the total anions
present in the top and bottom external crystallite layers
are Y . As noted from Eq. (15), the XAE is a function of
16 J.J. Bravo-Su�aarez et al. / Microporous and Mesoporous Materials 67 (2004) 1–17
the dimensions and charge of the LDH and the interca-
lated anion. The results of XAE for several intercalated
Mg0:75Al0:25LDHs, with crystallites of dimensions 200
nm · 20 nm, are shown in Table 8. The values of XAE for
the POMs can vary between 8.7% and 10.3%, and for theferricyanate anion it is 7.6%. The effect of the LDH
charge on the XAE can be observed in Table 9. A small
reduction in the values of XAE is noted when increasing
the LDH charge. Additionally, the results of XAE for the
LDH [Mg0:75Al0:25][H4Co2Mo10O38], with a crystallite of
constant diameter (dc) and variable thickness (lc), arepresented in Table 10. Note that XAE values decrease as
the crystallite thickness increases. A similar trend is ob-served when the crystallite diameter is increased and the
crystallite thickness is kept constant, although at values
of dc over 300 nm the variation of XAE is slight.
Density is one of the properties of the LDHs that has
been little studied. Typically, density values of 2.00 g/
cm3 are assumed. However, as shown in this study,
the LDH density can vary appreciably depending on the
intercalated anion. As seen from Eqs. (16) and (17), theapparent density is a function of the dimensions and
molecular weight of the LDH crystallite. The true den-
sity is also a function of the interlamellar free volume.
Density calculations shown in Table 8, for the LDHs
Mg0:75Al0:25-A with crystallites of dimensions 200
nm · 20 nm, indicate that the apparent density values
vary from 1.30 g/cm3 for the [Mg0:75Al0:25][Fe(CN)6] up
to 3.00 g/cm3 for the [Mg0:75Al0:25][PW11Fe(H2O)O39].The true density values vary from 1.86 g/cm3 for the
[Mg0:75Al0:25][Fe(CN)6] up to 3.51 g/cm3 for the
[Mg0:75Al0:25][PW11Fe(H2O)O39]. The density calcula-
tions for the [M2þ1�xAlx][PV2W10O40](M
2þ ¼Mg,Zn)
LDHs with crystallite dimensions of 200 nm · 20 nm are
given in Table 9. For both materials the apparent and
true densities are larger at higher LDH charges. On the
other hand, the densities of the [Zn1�xAlx][PV2W10O40]are greater than for the [Mg1�xAlx][PV2W10O40] due to
the heavier molecular weight of the Zn with respect to
the Mg. The results of densities for the LDH [Mg0:75-
Al0:25][H4Co2Mo10O38] as a function of the crystallite
diameter and thickness are given in Tables 10 and 11.
Although the variation of the crystallite diameter (dc)does not affect the obtained density values, the apparent
density is larger when the crystallite thickness (lc) isincreased; showing little variation at values of lc over 30nm and reaching an almost constant value over 50 nm.
The true density values are also larger as the crystallite
thickness increases, but the variation is greater than that
observed for the apparent density.
5. Conclusions
Several simple equations have been presented for the
calculation of the textural properties of LDH com-
pounds. These estimates were made by modeling the
properties of an LDH crystallite and the intercalating
anion. One of the main advantages of this approach is
the correlation of the LDH textural properties with
LDH characteristics that can be experimentally mea-sured, such as the average crystallite diameter and
thickness (spacing in the basal plane 0 0 l). The results
obtained with this model are comparable with experi-
mental results for BET areas and micropore volumes. In
cases of poor crystallinity, the results of the model do
not agree with the BET values. However, these diver-
gences are explained in terms of the formation of
agglomerates of a face-to-face type. Taking into accountthe results predicted by the model and the method for
the experimental determination of the LDH textural
properties, we were able to explain satisfactorily the
textural results of the LDH [Mg0:77Al0:23][Fe(CN)6]3�,
which has thus far exhibited the highest BET area. It
was also demonstrated that properties such as the areas
and interlamellar free volumes expressed per unit charge
of the LDH give better results than when expressed perunit weight of the LDH, and also that they can be useful
when comparing different LDHs. The results of pre-
dicted LDH densities indicate that it may be possible to
obtain textural information of the LDH crystallite from
the experimental measurement of the LDH apparent
and true densities. In general, the results of this study
contribute to a better understanding of the textural
properties of the LDHs, giving some correlations fortheir prediction. The results also potentially assist in the
synthesis of LDHs for specific applications.
Acknowledgements
We acknowledge financial support for this work by
the Director, Division of Chemical and Thermal Sys-tems of the National Science Foundation under grant
CTS-0321979, and from Universidad Industrial de
Santander and COLCIENCIAS, in the frame of the
project ‘‘Synthesis, characterization and testing of bi-
omimetic catalysts for selective oxidation’’, code 1102-
05665-95.
References
[1] F. Cavani, F. Trifiro, A. Vaccari, Catal. Today 11 (1991) 173.
[2] V. Rives, M.A. Ulibarri, Coord. Chem. Rev. 181 (1999) 61.
[3] V. Rives, in: V. Rives (Ed.), Layered Double Hydroxides: Present
and Future, Nova Science Publishers, Inc, New York, 2001,
p. 229.
[4] U. Costantino, F. Marmottini, M. Nocchetti, R. Vivani, Eur. J.
Inorg. Chem. (1998) 1439.
[5] S. Velu, K. Suzuki, M. Okasaki, T. Osaki, S. Tomura, F. Ohashi,
Chem. Mater. 11 (1999) 2163.
J.J. Bravo-Su�aarez et al. / Microporous and Mesoporous Materials 67 (2004) 1–17 17
[6] F. Malherbe, C. Forano, J.P. Besse, Micropor. Mesopor. Mater.
10 (1997) 67.
[7] R.A. Schoonheydt, T. Pinnavaia, G. Lagaly, N. Gangas, Pure
Appl. Chem. 71 (1999) 2367.
[8] H. Nijs, M. de Bock, N. Maes, E.F. Vansant, J. Porous Mater. 6
(1999) 307.
[9] H. Nijs, P. Cool, E.F. Vansant, Interface Sci. 5 (1997) 83.
[10] H. Nijs, M. de Bock, E.F. Vansant, Micropor. Mesopor. Mater.
30 (1999) 243.
[11] H. Nijs, M. de Bock, E.F. Vansant, J. Porous Mater. 6 (1999) 101.
[12] H. Nijs, Ph.D. thesis, Universiteit Antwerpen, Belgium, 1999.
[13] E.A. Gardner, S.K. Yun, T. Kwon, T.J. Pinnavaia, Appl. Clay
Sci. 13 (1998) 479.
[14] F.A.P. Cavalcanti, A. Schutz, P. Biloen, in: P. Delmon, P.A.
Jacobs, G. Poncelet (Eds.), Preparation of Catalysts IV, Studies in
Surface Science and Catalysis, vol. 31, Elsevier, Amsterdam, 1987,
p. 165.
[15] M.A. Drezdzon, Inorg. Chem. 27 (1988) 4628.
[16] J.H. De Boer, in: D.H. Everett, R.H. Ottewill (Eds.), Surface Area
Determination, Butterworths, London, 1970, p. 7.
[17] R. Allman, Acta Crystallogr. B 24 (1968) 972.
[18] A. De Roy, C. Forano, J.P. Besse, in: V. Rives (Ed.), Layered
Double Hydroxides: Present and Future, Nova Science publishers,
Inc, New York, 2001, p. 1.
[19] S.K. Yun, T.J. Pinnavaia, Chem. Mater. 7 (1995) 348.
[20] G.M. Brown, M.R. Noe-Spirlet, W.R. Busing, H.A. Levy, Acta
Crystallogr. B 33 (1977) 1038.
[21] A.L. Nolan, C.C. Allen, R.C. Burns, D.C. Craig, G.A. Lawrance,
Aust. J. Chem. 51 (1998) 825.
[22] H.T. Evans Jr., Inorg. Chem. 5 (1966) 967.
[23] B. Morosin, Acta Crystallogr. B 34 (1978) 3730.
[24] R.D. Shannon, Acta Crystallogr. A 32 (1976) 751.
[25] M.Z.B. Hussein, Z. Zainal, O.W.S. Tat, R. Ibrahim, Oriental J.
Chem. 15 (1999) 23.
[26] Y. Seida, Y. Nakano, Y. Nakamura, Clays Clay Miner. 50 (2002)
525.
[27] T. Kwon, T.J. Pinnavaia, Chem. Mater. 1 (1989) 381.
[28] J.B. Hui, Q.F. Liu, Y.X. Ma, H.Z. Liu, L.S. Li, R.R. Xu, Chin.
J. Process Eng. 1 (2001) 152.
[29] S.K. Yun, T.J. Pinnavaia, Inorg. Chem. 35 (1996) 6853.
[30] W.T. Reichle, Solids State Ion. 22 (1986) 135.
[31] W.T. Reichle, S.Y. Kang, D.S. Everhardt, J. Catal. 101 (1986) 352.
[32] C. Suryanarayana, M. Grant Norton, X-ray Diffraction: A
Practical Approach, Plenum Press, New York, 1998, p. 207.
[33] J.M. Oh, S.H. Hwang, J.H. Choy, Solids State Ion. 151 (2002)
285.
[34] G. Fetter, M.T. Olguin, P. Bosch, S. Bulbulian, J. Porous Mater. 7
(2000) 469.
[35] S. Velu, V. Ramkumar, A. Narayanan, C.S. Swamy, J. Mater. Sci.
32 (1997) 957.
[36] M.A. Ulibarri, M.J. Hernandez, Mater. Chem. Phys. 14 (1986)
569.
[37] M.A. Ulibarri, J. Cornejo, M.J. Hernandez, J. Mater. Sci. 22
(1987) 1168.
[38] T. Kwon, G.A. Tsigdinos, T.J. Pinnavaia, J. Am. Chem. Soc. 110
(1988) 3653.
[39] E.D. Dimotakis, T.J. Pinnavaia, Inorg. Chem. 29 (1990) 2393.
[40] K. Chibwe, W. Jones, Chem. Mater. 1 (1989) 489.
[41] E. Narita, P. Kaviratna, T.J. Pinnavaia, Chem. Lett. (1991)
805.
[42] K.S.W. Sing, in: D.H. Everett, R.H. Ottewill (Eds.), Surface Area
Determination, Butterworths, London, 1970, p. 25.

![Kinetic Control of Intralayer Cobalt Coordination in Layered Hydroxides: Co[superscript oct subscript x]Co[superscript tet subscript x](OH)[subscript 2](Cl)[subscript x](H[subscript](https://static.fdokumen.com/doc/165x107/631561845cba183dbf07f5ea/kinetic-control-of-intralayer-cobalt-coordination-in-layered-hydroxides-cosuperscript.jpg)