Microstructure mapping of a friction stir welded AA2050 Al–Li–Cu in the T8 state
13
This article was downloaded by: [Institut National Polytechnique de Toulouse ] On: 23 April 2014, At: 02:10 Publisher: Taylor & Francis Informa Ltd Registered in England and Wales Registered Number: 1072954 Registered office: Mortimer House, 37-41 Mortimer Street, London W1T 3JH, UK Philosophical Magazine Publication details, including instructions for authors and subscription information: http://www.tandfonline.com/loi/tphm20 Microstructure mapping of a friction stir welded AA2050 Al–Li–Cu in the T8 state F. De Geuser a , B. Malard ab & A. Deschamps a a SIMaP, Grenoble INP-UJF-CNRS, BP 75, 38402 Saint-Martin- d’Heres Cedex, France b CIRIMAT, INPT-ENSIACET, 4 Allée Emile Monso 31030, Toulouse, France Published online: 10 Apr 2014. To cite this article: F. De Geuser, B. Malard & A. Deschamps (2014): Microstructure mapping of a friction stir welded AA2050 Al–Li–Cu in the T8 state, Philosophical Magazine, DOI: 10.1080/14786435.2014.887862 To link to this article: http://dx.doi.org/10.1080/14786435.2014.887862 PLEASE SCROLL DOWN FOR ARTICLE Taylor & Francis makes every effort to ensure the accuracy of all the information (the “Content”) contained in the publications on our platform. However, Taylor & Francis, our agents, and our licensors make no representations or warranties whatsoever as to the accuracy, completeness, or suitability for any purpose of the Content. Any opinions and views expressed in this publication are the opinions and views of the authors, and are not the views of or endorsed by Taylor & Francis. The accuracy of the Content should not be relied upon and should be independently verified with primary sources of information. Taylor and Francis shall not be liable for any losses, actions, claims, proceedings, demands, costs, expenses, damages, and other liabilities whatsoever or howsoever caused arising directly or indirectly in connection with, in relation to or arising out of the use of the Content. This article may be used for research, teaching, and private study purposes. Any substantial or systematic reproduction, redistribution, reselling, loan, sub-licensing, systematic supply, or distribution in any form to anyone is expressly forbidden. Terms & Conditions of access and use can be found at http://www.tandfonline.com/page/terms- and-conditions
-
Upload
grenoble-inp -
Category
Documents
-
view
1 -
download
0
Transcript of Microstructure mapping of a friction stir welded AA2050 Al–Li–Cu in the T8 state
This article was downloaded by: [Institut National Polytechnique de Toulouse ]On: 23 April 2014, At: 02:10Publisher: Taylor & FrancisInforma Ltd Registered in England and Wales Registered Number: 1072954 Registeredoffice: Mortimer House, 37-41 Mortimer Street, London W1T 3JH, UK
Philosophical MagazinePublication details, including instructions for authors andsubscription information:http://www.tandfonline.com/loi/tphm20
Microstructure mapping of a frictionstir welded AA2050 Al–Li–Cu in the T8stateF. De Geusera, B. Malardab & A. Deschampsa
a SIMaP, Grenoble INP-UJF-CNRS, BP 75, 38402 Saint-Martin-d’Heres Cedex, Franceb CIRIMAT, INPT-ENSIACET, 4 Allée Emile Monso 31030, Toulouse,FrancePublished online: 10 Apr 2014.
To cite this article: F. De Geuser, B. Malard & A. Deschamps (2014): Microstructure mappingof a friction stir welded AA2050 Al–Li–Cu in the T8 state, Philosophical Magazine, DOI:10.1080/14786435.2014.887862
To link to this article: http://dx.doi.org/10.1080/14786435.2014.887862
PLEASE SCROLL DOWN FOR ARTICLE
Taylor & Francis makes every effort to ensure the accuracy of all the information (the“Content”) contained in the publications on our platform. However, Taylor & Francis,our agents, and our licensors make no representations or warranties whatsoever as tothe accuracy, completeness, or suitability for any purpose of the Content. Any opinionsand views expressed in this publication are the opinions and views of the authors,and are not the views of or endorsed by Taylor & Francis. The accuracy of the Contentshould not be relied upon and should be independently verified with primary sourcesof information. Taylor and Francis shall not be liable for any losses, actions, claims,proceedings, demands, costs, expenses, damages, and other liabilities whatsoever orhowsoever caused arising directly or indirectly in connection with, in relation to or arisingout of the use of the Content.
This article may be used for research, teaching, and private study purposes. Anysubstantial or systematic reproduction, redistribution, reselling, loan, sub-licensing,systematic supply, or distribution in any form to anyone is expressly forbidden. Terms &Conditions of access and use can be found at http://www.tandfonline.com/page/terms-and-conditions
Microstructure mapping of a friction stir welded AA2050 Al–Li–Cuin the T8 state
F. De Geusera*, B. Malarda,b and A. Deschampsa
aSIMaP, Grenoble INP-UJF-CNRS, BP 75, 38402 Saint-Martin-d’Heres Cedex, France;bCIRIMAT, INPT-ENSIACET, 4 Allée Emile Monso 31030, Toulouse, France
(Received 29 November 2013; accepted 22 January 2014)
The heterogeneous precipitate microstructure of a AA2050 Al–Li–Cu in theT8 state after friction stir welding has been mapped by small-angle X-rayscattering (SAXS). 2D resolved maps of the fraction and size of both T1platelets precipitates and clusters/GP zones formed at room temperature areprovided. TEM micrographs of selected zone confirm the interpretation ofSAXS intensities. This microstructure mapping is compared to microhardnessmapping and a direct correlation is shown. Short duration heat treatmentsmade in a salt bath help understanding precipitate stability and suggest thatthe temperature exploration alone explains to a large extent the distribution ofthe precipitates microstructure across the welded structure.
Keywords: precipitation; FSW; SAXS; Al–Cu–Li alloys
Introduction
Friction stir welding is now a relatively mature technology that enables solid-statejoining of aluminium alloys and other materials. In aluminium alloys, it proves to beparticularly interesting for high strength, high solute alloys that are difficult to weld byother methods and particularly those containing high levels of Cu. Recently, severaldetailed review papers have summarized the state of the art of the knowledge on thegeneration of heat by friction and plastic flow, on the distribution of plastic flow aroundthe welding tool, on the resulting microstructures and on many related properties [1].When friction stir welded, all precipitation hardening alloys (namely, of the 2000, 6000and 7000 series), regardless of their initial temper (naturally aged or peak aged), sharesome common characteristic microstructure evolutions, but also present significantdifferences. In the weld nugget, the high temperature results in a complete dissolutionof the pre-existing precipitates. Coarse precipitates may form upon cooling, dependingon the quench sensitivity of the alloy and on the details of the welding conditions thatgovern the thermal history in the nugget zone: welding speed, weld thickness, thermalcontact with the backing plate. In the thermo-mechanically affected zone, relativelycoarse precipitates are generally found, in relation to the intermediate temperaturesreached (typically about 350 °C) and the presence of plasticity that can accelerate theformation or transformation of precipitates. The behaviour of the heat-affected zone is
*Corresponding author. Email: [email protected]
© 2014 Taylor & Francis
Philosophical Magazine, 2014http://dx.doi.org/10.1080/14786435.2014.887862
Dow
nloa
ded
by [
Inst
itut N
atio
nal P
olyt
echn
ique
de
Tou
lous
e ]
at 0
2:10
23
Apr
il 20
14
much more alloy and temper-dependent as it depends critically on the stability of themicrostructure with respect to a temperature spike.
In the last decade, new alloys for aerospace applications have been developed basedon the Al–Cu–Li system [2]. Following a composition optimization with respect to theformerly available alloys of this family (e.g. 2195), these alloys present very attractiveproperties without some of the earlier limitations, such as low temperature ageing [3,4].These alloys, which currently attract a large interest, rely mostly on the precipitation ofthe T1-Al2CuLi phase to obtain their mechanical properties [5–8]. In the T8 (nearpeak-aged condition), alloys such as AA2198 containing about 3 wt%Cu and 1 wt%Licontain a high density of very thin T1 plates of high aspect ratio (1.3 nm thickness vs.approximately 50 nm diameter) [5,9,10]. Although several authors have studied thepotentiality of the latest generation of Al–Li–Cu for friction stir welds [11–18], only alimited number of studies are available which characterize their microstructure.
Fonda [19] has observed the distribution of precipitate microstructures across anAA2195 friction stir weld. The alloy, whose initial under-aged temper contained mostlythin T1 and a few θ′ plates, presents in the HAZ and TMAZ a gradual coarsening ofthese plates until complete dissolution in the nugget, where TB precipitates form at hightemperature and δ′ precipitates form at low temperature. Shukla [20,21] studied in detailthe evolution of precipitates in friction stir welds of thin sheets of AA2195-T8. Theyobserved different levels of T1 and θ′ dissolution in the HAZ and TMAZ. Theymeasured no appreciable change in the length of the T1 precipitates in the zones wherepartial dissolution had taken place, nor any appreciable change in thickness. However,due to the extremely low value of T1 thickness [9,10,22], a moderate thickness incre-ment may have been difficult to observe. The dissolution of T1 at the weld centre of aAA2195 in the T8 state was already observed by Chen & Chaturvedi [23].
Cavaliere [14] has studied friction stir welds of AA2198-T851 alloy and shown thepresence of θ′ and δ′ phases in the weld nugget and T1, θ′ and δ′ in the HAZ andTMAZ. This presence of δ′ phase in this alloy is relatively surprising since the detailedstudy of precipitation sequence in this alloy by Decreus [5] did not provide evidence ofthe formation of this phase for this alloy composition (albeit along different thermaltreatments). Steuwer and co-workers [24] have mapped by small-angle X-ray scattering(SAXS) the microstructure across a friction stir weld of AA2199-T8 alloy. Their analy-sis proved some degree of coarsening in the HAZ and TMAZ, associated with thepartial dissolution of the T1 precipitates initially present.
As a result of the spatial variation of temperature and strain history within a weld,the resulting precipitate microstructure is extremely heterogeneous. A large number ofstudies have relied on transmission electron microscopy (TEM) to describe the precipi-tate nanostructures in the different zones of friction stir welds. However, owing to thefact that the precipitate microstructure may vary very quickly over a few mm and to thelarge number of different zones to be characterized, such characterization procedureproves to be extremely time consuming, and it remains difficult to obtain a full pictureof the precipitate distribution across a friction stir weld. Several studies have shown thatusing SAXS with synchrotron light sources made it possible to obtain detailed maps ofprecipitate distributions (average precipitate size, volume fraction), and this method hasbeen applied several times to friction stir welding [24,25]. However, although the inter-pretation of small-angle scattering data in systems showing near-spherical shape precipi-tates is relatively straightforward and leads to high quality precipitate maps, the
2 F. De Geuser et al.
Dow
nloa
ded
by [
Inst
itut N
atio
nal P
olyt
echn
ique
de
Tou
lous
e ]
at 0
2:10
23
Apr
il 20
14
situation is more difficult in precipitate systems where precipitates are highlyanisotropic. Interpretation using classical tools (such as Guinier radius evaluation) hasbeen carried out in one occurrence and provides a qualitative view of microstructuralevolution in welds [24]. However, more advanced data analysis is required if a morequantitative characterization is sought. Recently, a method was proposed to extractquantitative data from SAXS applicable to high aspect ratio precipitate platelets [22]. Itrelies however on the material being highly textured so that the precipitates are viewedclose to edge-on by the X-ray beam. It has been shown in a preliminary study that thissituation is not met in friction stir welds where the grain texture is highly variable fromone region to another [26].
Alloy AA2050-T8 is particularly suited for medium to thick plate applications [27],and its potential for friction stir welding has been evaluated both in terms of mechanicalproperties and corrosion behaviour [28]. The aim of the present paper will be to presenta detailed characterization of the distribution of precipitates across a friction stir weldof this material. This characterization will be obtained using cross-section mapping bySAXS. A special procedure for extracting the morphological information and volumefraction of precipitates from the SAXS data, suited to the specificity of this alloysystem, will be presented, and the quantitative capability of this approach will be shownby comparison with TEM images in a few selected regions. The spatial distribution ofprecipitates will then be compared to the distribution of hardness and discussed bycomparing to that obtained during short duration heat treatments made in a salt bath, soas to reach a better understanding of precipitate stability in this alloy.
Experimental details
The base material consists of AA2050 (Al - 3.5wt% Cu - 1wt% Li with Mg and Ag asmain secondary alloying elements) 15 mm plates in the T8 condition (i.e. solution heattreated, quenched, stress relieved, naturally aged and peak aged at 155 °C) as deliveredby Constellium Voreppe Research Centre (France). The friction stir welding wasperformed by EADS IW in Suresnes (France) at 400 rotations per minute with anadvancement speed of 200 mm per minute. A threaded pin with 3 flats tool was used.Slices transverse to the welding direction were then mechanically cut (10 mm thick forthe microhardness measurements, 1 mm thick for SAXS and TEM).
The microhardness specimen was mirror polished down to 1 μm. The microindenta-tion was performed on a fully automated Wilson Tukon 1102 microindenter fromBuhler, with a load of 500 from a Vickers indenter. A total of 1880 indents (20 × 95)separated from 0.65 mm were used to cover a large enough area around the weldedstructure (13 mm × 60 mm).
The SAXS took place on BM02-D2AM, a French CRG beamline at the ESRF,Grenoble, France. The X-ray energy was 16.128 keV and the beam extension about200 μm in both direction. The sample to the 2D CCD detector distance was about600 mm. The SAXS specimen was mechanically grinded to a thickness of 600 μm,which is closed to their X-ray attenuation length at the energy used. There was a±50-μm thickness variation along the 15 mm × 60 mm specimen, which is accounted forduring the intensity normalization procedure with the help of the measured local trans-mission of the specimen. The specimen was scanned by the X-ray beam with a step of0.5 mm, each time recording a 0.5s image. After correction of the detector distortions
Philosophical Magazine 3
Dow
nloa
ded
by [
Inst
itut N
atio
nal P
olyt
echn
ique
de
Tou
lous
e ]
at 0
2:10
23
Apr
il 20
14

(dark current, flat-field, grid distortions), normalization and subtraction of the back-ground noise, the corrected 2D intensity could be used as such or radially averaged toobtain an average intensity as a function of the scattering vector q. Details on theinterpretation of the SAXS intensity will be given further in the paper.
Specimens for transmission electron microscopy (TEM) were prepared by mechani-cally grinding the transverse slice to a thickness of about 100 μm and punching 3 mmdiscs from the regions of interest, as defined after SAXS observations (i.e. base materialfar away from the weld centre and the thermo-mechanically affected zone where precip-itates thickening occur (see further in the paper)). The TEM foils were then preparedthrough standard twin-jet electropolishing using 1/3 nitric acid in methanol at −20 °C.The TEM observations were performed on a JEOL 3010, operating at 300 kV.
TEM observations
A bright field transmission electron micrograph of the base material is shown inFigure 1(a) together with the corresponding diffraction pattern as an inset (viewingdirection ⟨1 1 0⟩). This TEM micrograph confirms that the microstructure is composedessentially of very thin T1 precipitates. Two variants out of 4 are parallel to the zoneaxis and show as streaking in the directions normal to their habit planes on the diffrac-tion pattern. The base material consists in a fine dispersion of thin T1 precipitates homo-geneously distributed within the grains. Figure 1(b) is a bright field TEM micrographobtained in the thermo-mechanically affected zone, in a zone which will be identifiedfurther in the paper as a zone containing thicker precipitates (viewing direction ⟨1 1 2⟩).In this zone axis, only 1 variant of T1 appears edge on. Here again, the microstructureconsists of T1 precipitates homogeneously distributed, albeit of different length, thick-ness and volume fraction than in the base material.
Figure 1. (colour online) TEM observations: (a) bright field of the base material in the ⟨1 1 0⟩ view-ing direction (2 variants of T1 are observed as thin lines, as confirmed by diffraction pattern, inset) and(b) bright field obtained in the TMAZ in the ⟨1 1 2⟩ viewing direction (1 variant of T1 is observed).
4 F. De Geuser et al.
Dow
nloa
ded
by [
Inst
itut N
atio
nal P
olyt
echn
ique
de
Tou
lous
e ]
at 0
2:10
23
Apr
il 20
14

In the weld nugget, the situation is completely different (Figure 2). Both on thebright field or on the diffraction pattern (not shown here), no indication of T1, θ′ nor δ′precipitates. It is unsure from these observations if smaller clusters and/or GP zones arepresent at this stage, but no indications were found on the diffraction pattern. Coarseparticles are observed. As they can also be found in the base material, they are mostlikely Mn-bearing dispersoids and pre-existed the FSW process. From these TEMobservations, it seems reasonable to assume that the FSW process has dissolved thedominating T1 precipitates.
SAXS mapping of the FSW weld
In order to map the precipitates microstructure of the welded structure, we haveperformed a regular scanning of a transverse section of the weld with the X-ray beam,recording a SAXS image for each position. The grid step was chosen to be 0.5 mm.The complete map consists in 3360 images (roughly 15 mm × 50 mm). Figure 3 is amosaic made of a subset of all the SAXS images (1 image every 2 mm is shown). Thefirst general observation is that the SAXS signal is generally not isotropic. This is notsurprising since (1) the expected phases are mostly non-spherical, (2) a rolling textureis expected in these aluminium plates and (3) the grain size is of the same order ofmagnitude than the beam size (so that the situation is far from a “powder like” sample).
In the case of a constant known texture, the plate-like T1 precipitates in well-definedhabit planes give rise to the star patterns, which are observed in the base material (seeimages away from the centre in Figure 3). Those can be interpreted using our recentprotocol [22], and both the thickness and the length of the precipitates can be extractedfor precipitates as thin as ~1 nm and as long as ~100 nm. However, this protocol isunpractical in the present situation because of the inhomogeneity of the texture acrossthe weld structure, with the extreme case of the weld nugget where recrystallizationtook place. Visual inspection of the 2D images shown in Figure 3 clearly indicates thatthe microstructure of the weld centre is very different than that of the base material.The signal at the centre is much more isotropic, which seems at first consistent with
Figure 2. Bright field TEM observation of the weld nugget in the ⟨1 1 0⟩ direction.
Philosophical Magazine 5
Dow
nloa
ded
by [
Inst
itut N
atio
nal P
olyt
echn
ique
de
Tou
lous
e ]
at 0
2:10
23
Apr
il 20
14
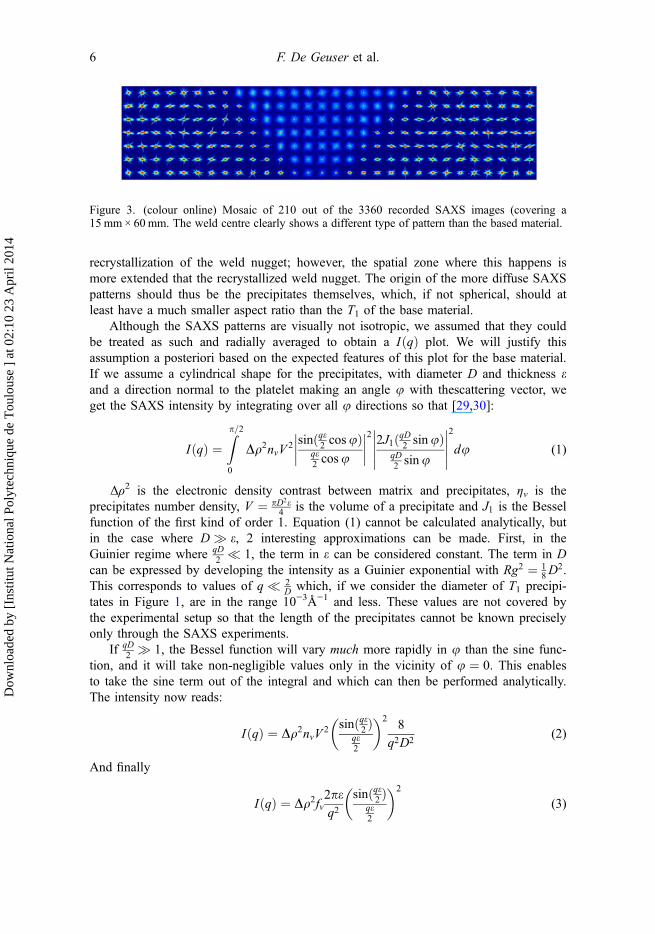
recrystallization of the weld nugget; however, the spatial zone where this happens ismore extended that the recrystallized weld nugget. The origin of the more diffuse SAXSpatterns should thus be the precipitates themselves, which, if not spherical, should atleast have a much smaller aspect ratio than the T1 of the base material.
Although the SAXS patterns are visually not isotropic, we assumed that they couldbe treated as such and radially averaged to obtain a IðqÞ plot. We will justify thisassumption a posteriori based on the expected features of this plot for the base material.If we assume a cylindrical shape for the precipitates, with diameter D and thickness eand a direction normal to the platelet making an angle u with thescattering vector, weget the SAXS intensity by integrating over all u directions so that [29,30]:
IðqÞ ¼Zp=2
0
Dq2nvV2 sinðqe2 cosuÞ
qe2 cosu
��������2 2J1ðqD2 sinuÞ
qD2 sinu
����������2
du (1)
Δρ2 is the electronic density contrast between matrix and precipitates, ην is theprecipitates number density, V ¼ pD2e
4 is the volume of a precipitate and J1 is the Besselfunction of the first kind of order 1. Equation (1) cannot be calculated analytically, butin the case where D � e, 2 interesting approximations can be made. First, in theGuinier regime where qD
2 � 1, the term in e can be considered constant. The term in Dcan be expressed by developing the intensity as a Guinier exponential with Rg2 ¼ 1
8D2.
This corresponds to values of q � 2D which, if we consider the diameter of T1 precipi-
tates in Figure 1, are in the range 10−3Å−1 and less. These values are not covered bythe experimental setup so that the length of the precipitates cannot be known preciselyonly through the SAXS experiments.
If qD2 � 1, the Bessel function will vary much more rapidly in u than the sine func-
tion, and it will take non-negligible values only in the vicinity of u ¼ 0. This enablesto take the sine term out of the integral and which can then be performed analytically.The intensity now reads:
IðqÞ ¼ Dq2nvV2 sinðqe2 Þ
qe2
� �28
q2D2(2)
And finally
IðqÞ ¼ Dq2fv2peq2
sinðqe2 Þqe2
� �2
(3)
Figure 3. (colour online) Mosaic of 210 out of the 3360 recorded SAXS images (covering a15 mm × 60mm. The weld centre clearly shows a different type of pattern than the based material.
6 F. De Geuser et al.
Dow
nloa
ded
by [
Inst
itut N
atio
nal P
olyt
echn
ique
de
Tou
lous
e ]
at 0
2:10
23
Apr
il 20
14
or, for qD � 1 and qe � 1
IðqÞ � Dq2fv2peq2
e�q2e2
12 (4)
with fv ¼ nvV , the volume fraction of particles. This equation shows that in anintermediate range (i.e. for q between 2=D and 1=e), the SAXS intensity of a flatplatelet should exhibit a 1=q2 behaviour, the classical signature of a flat particle [30]. Itis interesting to note that, since we have introduced the precipitate volume fraction, theprecipitates diameter (experimentally out of reach) does not appear explicitly inEquation (3) anymore. If Equation (3) applies (i.e. if the signal arises from flat precipi-tates with a distribution which can be considered as isotropic), fitting of the signal givesboth the thickness of the particles and the relative volume fraction (if the electroniccontrast is unknown).
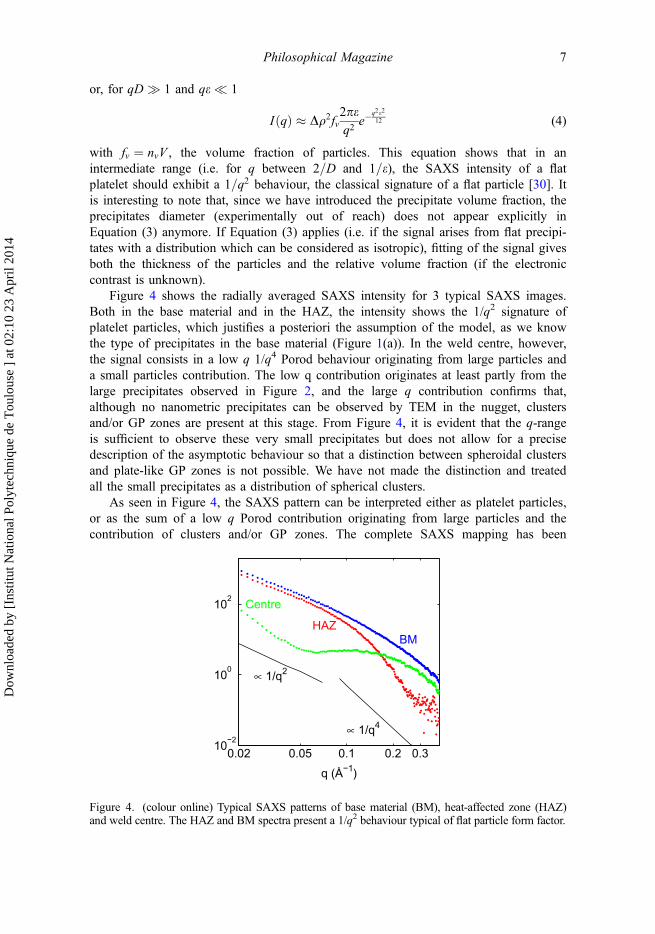
Figure 4 shows the radially averaged SAXS intensity for 3 typical SAXS images.Both in the base material and in the HAZ, the intensity shows the 1/q2 signature ofplatelet particles, which justifies a posteriori the assumption of the model, as we knowthe type of precipitates in the base material (Figure 1(a)). In the weld centre, however,the signal consists in a low q 1/q4 Porod behaviour originating from large particles anda small particles contribution. The low q contribution originates at least partly from thelarge precipitates observed in Figure 2, and the large q contribution confirms that,although no nanometric precipitates can be observed by TEM in the nugget, clustersand/or GP zones are present at this stage. From Figure 4, it is evident that the q-rangeis sufficient to observe these very small precipitates but does not allow for a precisedescription of the asymptotic behaviour so that a distinction between spheroidal clustersand plate-like GP zones is not possible. We have not made the distinction and treatedall the small precipitates as a distribution of spherical clusters.
As seen in Figure 4, the SAXS pattern can be interpreted either as platelet particles,or as the sum of a low q Porod contribution originating from large particles and thecontribution of clusters and/or GP zones. The complete SAXS mapping has been
0.02 0.05 0.1 0.2 0.310−2
100
102
∝ 1/q4
1/q2
BMHAZ
Centre
q (Å−1)
Figure 4. (colour online) Typical SAXS patterns of base material (BM), heat-affected zone (HAZ)and weld centre. The HAZ and BM spectra present a 1/q2 behaviour typical of flat particle form factor.
Philosophical Magazine 7
Dow
nloa
ded
by [
Inst
itut N
atio
nal P
olyt
echn
ique
de
Tou
lous
e ]
at 0
2:10
23
Apr
il 20
14
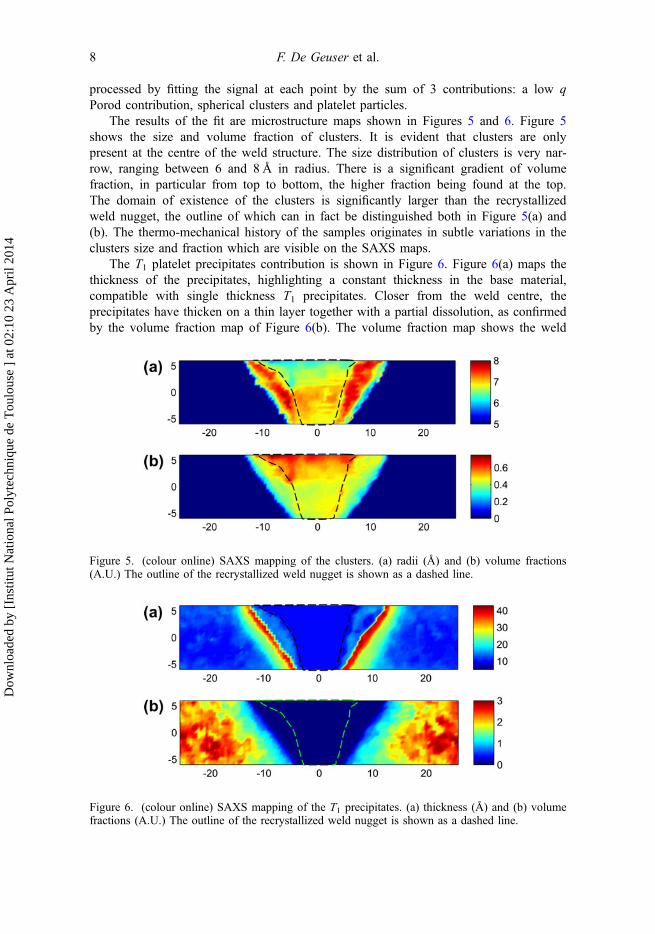
processed by fitting the signal at each point by the sum of 3 contributions: a low qPorod contribution, spherical clusters and platelet particles.
The results of the fit are microstructure maps shown in Figures 5 and 6. Figure 5shows the size and volume fraction of clusters. It is evident that clusters are onlypresent at the centre of the weld structure. The size distribution of clusters is very nar-row, ranging between 6 and 8 Å in radius. There is a significant gradient of volumefraction, in particular from top to bottom, the higher fraction being found at the top.The domain of existence of the clusters is significantly larger than the recrystallizedweld nugget, the outline of which can in fact be distinguished both in Figure 5(a) and(b). The thermo-mechanical history of the samples originates in subtle variations in theclusters size and fraction which are visible on the SAXS maps.
The T1 platelet precipitates contribution is shown in Figure 6. Figure 6(a) maps thethickness of the precipitates, highlighting a constant thickness in the base material,compatible with single thickness T1 precipitates. Closer from the weld centre, theprecipitates have thicken on a thin layer together with a partial dissolution, as confirmedby the volume fraction map of Figure 6(b). The volume fraction map shows the weld
Figure 5. (colour online) SAXS mapping of the clusters. (a) radii (Å) and (b) volume fractions(A.U.) The outline of the recrystallized weld nugget is shown as a dashed line.
Figure 6. (colour online) SAXS mapping of the T1 precipitates. (a) thickness (Å) and (b) volumefractions (A.U.) The outline of the recrystallized weld nugget is shown as a dashed line.
8 F. De Geuser et al.
Dow
nloa
ded
by [
Inst
itut N
atio
nal P
olyt
echn
ique
de
Tou
lous
e ]
at 0
2:10
23
Apr
il 20
14
centre zone where the T1 precipitates have completely disappeared, which correlateswell with the zone of existence of the clusters of Figure 5.
To confirm the existence of the layer of thickened precipitates in the thermo-mechanically affected zone, we have prepared a TEM thin foil in this area, as guidedby the SAXS results. The TEM bright field was shown in Figure 1(b). Although noquantitative thickness measurement can be extracted from this bright field image,comparison between Figure 1(a) and (b) gives a qualitative confirmation of the partialdissolution of the T1 precipitates together with a thickening of the precipitates.
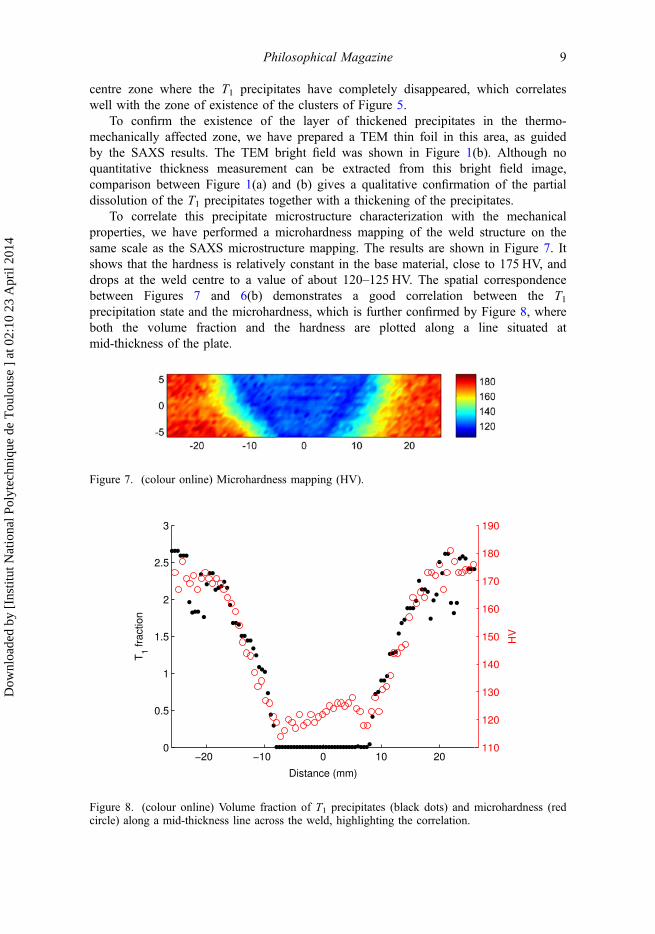
To correlate this precipitate microstructure characterization with the mechanicalproperties, we have performed a microhardness mapping of the weld structure on thesame scale as the SAXS microstructure mapping. The results are shown in Figure 7. Itshows that the hardness is relatively constant in the base material, close to 175 HV, anddrops at the weld centre to a value of about 120–125 HV. The spatial correspondencebetween Figures 7 and 6(b) demonstrates a good correlation between the T1precipitation state and the microhardness, which is further confirmed by Figure 8, whereboth the volume fraction and the hardness are plotted along a line situated atmid-thickness of the plate.
Figure 7. (colour online) Microhardness mapping (HV).
Figure 8. (colour online) Volume fraction of T1 precipitates (black dots) and microhardness (redcircle) along a mid-thickness line across the weld, highlighting the correlation.
Philosophical Magazine 9
Dow
nloa
ded
by [
Inst
itut N
atio
nal P
olyt
echn
ique
de
Tou
lous
e ]
at 0
2:10
23
Apr
il 20
14
Discussion
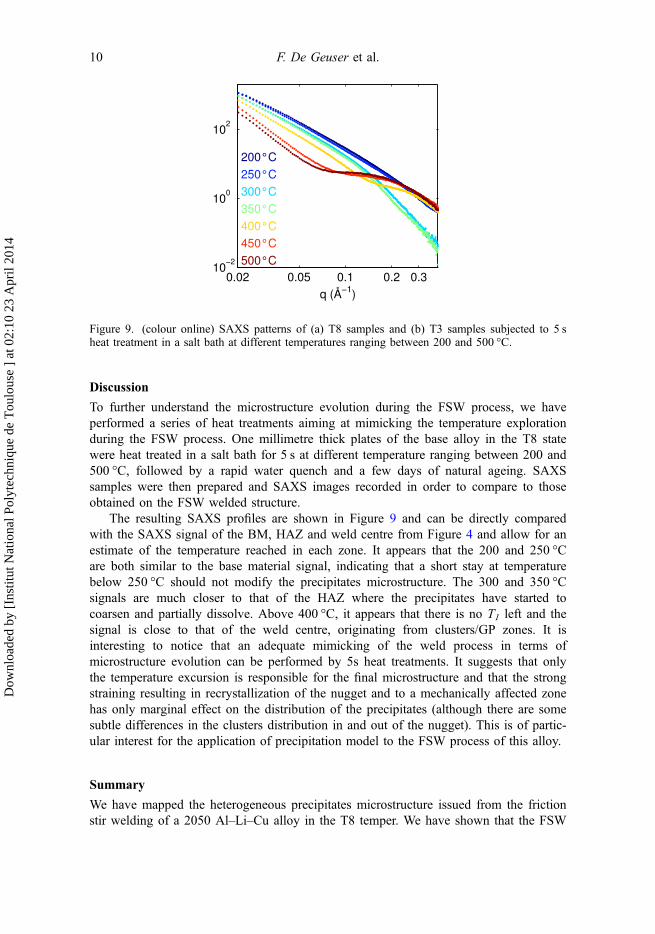
To further understand the microstructure evolution during the FSW process, we haveperformed a series of heat treatments aiming at mimicking the temperature explorationduring the FSW process. One millimetre thick plates of the base alloy in the T8 statewere heat treated in a salt bath for 5 s at different temperature ranging between 200 and500 °C, followed by a rapid water quench and a few days of natural ageing. SAXSsamples were then prepared and SAXS images recorded in order to compare to thoseobtained on the FSW welded structure.
The resulting SAXS profiles are shown in Figure 9 and can be directly comparedwith the SAXS signal of the BM, HAZ and weld centre from Figure 4 and allow for anestimate of the temperature reached in each zone. It appears that the 200 and 250 °Care both similar to the base material signal, indicating that a short stay at temperaturebelow 250 °C should not modify the precipitates microstructure. The 300 and 350 °Csignals are much closer to that of the HAZ where the precipitates have started tocoarsen and partially dissolve. Above 400 °C, it appears that there is no T1 left and thesignal is close to that of the weld centre, originating from clusters/GP zones. It isinteresting to notice that an adequate mimicking of the weld process in terms ofmicrostructure evolution can be performed by 5s heat treatments. It suggests that onlythe temperature excursion is responsible for the final microstructure and that the strongstraining resulting in recrystallization of the nugget and to a mechanically affected zonehas only marginal effect on the distribution of the precipitates (although there are somesubtle differences in the clusters distribution in and out of the nugget). This is of partic-ular interest for the application of precipitation model to the FSW process of this alloy.
Summary
We have mapped the heterogeneous precipitates microstructure issued from the frictionstir welding of a 2050 Al–Li–Cu alloy in the T8 temper. We have shown that the FSW
Figure 9. (colour online) SAXS patterns of (a) T8 samples and (b) T3 samples subjected to 5 sheat treatment in a salt bath at different temperatures ranging between 200 and 500 °C.
10 F. De Geuser et al.
Dow
nloa
ded
by [
Inst
itut N
atio
nal P
olyt
echn
ique
de
Tou
lous
e ]
at 0
2:10
23
Apr
il 20
14
process has dissolved the existing T1 precipitates in a zone, which covers a broaderzone than the weld nugget. Where the temperature has not reached the dissolution tem-perature (about 450 °C), the remaining T1 precipitates have partially dissolved and haveundergone a significant thickening. In T1 free zone, small clusters and/or GP zones haveformed at room temperature after the welding process. The temperature elevation aloneis shown to explain those precipitate variations, the large strains having apparently onlylittle, if any, influence. Comparison between microstructure and microhardness mappinghas provided evidence that there is a strict correlation between the volume fraction ofthe T1 precipitates and the hardness of the material.
AcknowledgementsThis work was financially supported by the ANR MatetPro program (ANR-08-MAPR-0020-05“CORALIS”). The authors would like to thank the staff at D2AM-BM02 CRG beamline atESRF.
References
[1] R.S. Mishra and Z.Y. Ma, Mater. Sci. Eng. R Rep. 50 (2005) p.1.[2] T. Warner, Recently-Developed Aluminum Solutions for Aerospace Applications, in: Mater.
Sci. Forum, Vol. 519, 2006.[3] F. Gayle, F. Heubaum and J. Pickens, J. Scr. Metall. Mater. 24 (1990) p.79.[4] R.A. Herring, F.W. Gayle and J.R. Pickens, J. Mater. Sci. 28 (1993) p.69.[5] B. Decreus, A. Deschamps, F. De Geuser, P. Donnadieu, C. Sigli and M. Weyland, Acta
Mater. 61 (2013) p.2207.[6] B.M. Gable, A.W. Zhu, A.A. Csontos and E.A. Starke, J. Light Met. 1 (2001) p.1.[7] J.F. Nie and B.C. Muddle, Mater. Sci. Eng. A 319 (2001) p.448.[8] S.C. Wang and M.J. Starink, Int. Mater. Rev. 50 (2005) p.193.[9] P. Donnadieu, Y. Shao, F. De Geuser, G.A. Botton, S. Lazar, M. Cheynet, M. de Boissieu
and A. Deschamps, Acta Mater. 59 (2011) p.462.[10] C. Dwyer, M. Weyland, L.Y. Chang and B.C. Muddle, Appl. Phys. Lett. 98 (2011)
p.201909.[11] N.D. Alexopoulos, E. Migklis, A. Stylianos and D.P. Myriounis, Int. J. Fatigue 56 (2013)
p.95.[12] A. Astarita, A. Squillace, E. Armentani and S. Ciliberto. Metall. Ital. (2012) p.31.[13] C. Bitondo, U. Prisco, A. Squilace, P. Buonadonna and G. Dionoro, Int. J. Adv. Manuf.
Technol. 53 (2011) p.505.[14] P. Cavaliere, M. Cabibbo, F. Panella and A. Squillace, Mater. Ds. 30 (2009) p.3622.[15] Y.E. Ma and P. Irving, J. Aircr. 48 (2011) p.1238.[16] Y.E. Ma, Z. Zhao, B. Liu and W. Li, Mater. Sci. Eng. A 569 (2013) p.41.[17] Y.E. Ma, B. Liu and Z. Zhao, Appl. Mech. Mater. 138–139 (2011) p.651.[18] M Yu’e, W. Zhenhai, Fatigue Behaviour in Friction Stir Welded 2198-T8 Al-Li Alloy Joint
for Integral Metal Fuselage Application, 2010.[19] R.W. Fonda and J.F. Bingert, Metall. Mater. Trans A 37 (2006) p.3593.[20] A.K. Shukla and W.A. Baeslack III, Scr. Mater. 56 (2007) p.513.[21] A.K. Shukla and W.A. Baeslack, Sci. Technol. Weld. Join. 14 (2009) p.376.[22] F. De Geuser, F. Bley and A. Deschamps, J. Appl. Crystallogr. 45 (2012) p.1208.[23] D.L. Chen and M.C. Chaturvedi, Metall. Mater. Trans A 32 (2001) p.2729.
Philosophical Magazine 11
Dow
nloa
ded
by [
Inst
itut N
atio
nal P
olyt
echn
ique
de
Tou
lous
e ]
at 0
2:10
23
Apr
il 20
14

[24] A. Steuwer, M. Dumont, J. Altenkirch, S. Birosca, A. Deschamps, P.B. Prangnell and P.J.Withers, Acta Mater. 59 (2011) p.3002.
[25] M. Dumont, A. Steuwer, A. Deschamps, M. Peel and P.J. Withers, Acta Mater. 54 (2006)p.4793.
[26] F. De Geuser, F. Bley, A. Denquin and A. Deschamps, J. Phys. Conf. Ser. 247 (2010)p.012034.
[27] P. Lequeu, K.P. Smith and A. Daniélou, J. Mater. Eng. Perform 19 (2009) p.841.[28] G. Pouget and A.P. Reynolds, Int. J. Fatigue 30 (2008) p.463.[29] A. Guinier and G. Fournet, Small-Angle Scattering of X-Rays, John Wiley & Sons, New
York, 1955.[30] G. Porod, General Theory, in Small-Angle X-ray Scatt, O. Glatter and O. Kratky, eds.,
Academic Press, London, 1982.
12 F. De Geuser et al.
Dow
nloa
ded
by [
Inst
itut N
atio
nal P
olyt
echn
ique
de
Tou
lous
e ]
at 0
2:10
23
Apr
il 20
14