
Microphysical analysis at the cloud edge of a severe hailstorm
13
Microphysical analysis at the cloud edge of a severe hailstorm E. García-Ortega ⁎ , L. López, J.L. Sánchez, J.L. Marcos Laboratorio de Física de la Atmósfera, Instituto de Medio Ambiente, Universidad de León, 24071 León, Spain Accepted 18 January 2006 Abstract Microphysical measurements inside cumulonimbus clouds (Cb) are technically complex and imply some risks. However, data such as the characteristics of the hydrometeors in a cloud, both in liquid and solid phases, their spectrum or the liquid water content are essential to understand microphysical processes inside severe storms as well as the internal structure of the storm. These data can also be used to validate numerical models to characterize severe storms beyond the information provided by the measurements. During a campaign for gathering microphysical data, measurements were carried out through a vigorous cloud turret rising on the flank of a Cb that produced hailstones, at an altitude with temperatures around − 5 °C. Hydrometeor spectra and the liquid water content were determined. The droplet concentration, measured by an FSSP 100, varied a lot depending on the sampling area. The droplet concentration varied inversely when compared to the concentration of larger hydrometeors registered by an OAP 2D2-C. In addition, in some areas supercooled large drops were found to form accumulation zones. The microphysical results have been used to calculate the minimum magnitude of a sustained updraft required to produce supercooled water at an altitude of − 16°C in adverse conditions for the increase in liquid water due to the presence of ice particle populations. © 2006 Elsevier B.V. All rights reserved. Keywords: Liquid water content; Droplet spectra; Updraft; Supercooled water 1. Introduction Hail storms are frequent phenomena during the summer months on both sides of the Pyrenees. To the south, the Spanish region known as the Ebro Valley is one of the areas in Europe with the highest number of cases of severe convective phenomena (Fig. 1). The temperature of cloud bases in summer storms is usually over 9°C and the cloud tops are at an altitude where the temperature is around − 50°C. These storms are of the warm-based cloud type (Sánchez et al., 1999), and thus have a great potential for producing a significant amount of liquid water content. In this area most hailstorms are classified as multicellular whereas supercells represent only 4% of storms (Castro et al., 1992). One of the main characteristics of severe storms is the presence of an intense updraft associated with the cloud system. Miller et al. (1988) have described updrafts of up to 40m s − 1 in a supercell in Montana. Values of 10–20m s − 1 may easily be surpassed. On many occasions the highest values of updrafts are reached at an altitude above the freezing point. Ice crystals, graupel and frozen drops start developing when the temperature is around − 5°C. These hydrometeors interact with each other by means of interparticle Atmospheric Research 82 (2006) 337 – 349 www.elsevier.com/locate/atmos ⁎ Corresponding author. Departamento de Física, Facultad de CC. BB. y Ambientales, 24071 León, Spain. Tel.: +34 987 291 499; fax: +34 987 291 945. E-mail address: [email protected] (E. García-Ortega). 0169-8095/$ - see front matter © 2006 Elsevier B.V. All rights reserved. doi:10.1016/j.atmosres.2006.01.009
-
Upload
independent -
Category
Documents
-
view
6 -
download
0
Transcript of Microphysical analysis at the cloud edge of a severe hailstorm
2 (2006) 337–349www.elsevier.com/locate/atmos
Atmospheric Research 8
Microphysical analysis at the cloud edge of a severe hailstorm
E. García-Ortega ⁎, L. López, J.L. Sánchez, J.L. Marcos
Laboratorio de Física de la Atmósfera, Instituto de Medio Ambiente, Universidad de León, 24071 León, Spain
Accepted 18 January 2006
Abstract
Microphysical measurements inside cumulonimbus clouds (Cb) are technically complex and imply some risks. However, datasuch as the characteristics of the hydrometeors in a cloud, both in liquid and solid phases, their spectrum or the liquid water contentare essential to understand microphysical processes inside severe storms as well as the internal structure of the storm. These datacan also be used to validate numerical models to characterize severe storms beyond the information provided by the measurements.During a campaign for gathering microphysical data, measurements were carried out through a vigorous cloud turret rising on theflank of a Cb that produced hailstones, at an altitude with temperatures around −5°C. Hydrometeor spectra and the liquid watercontent were determined. The droplet concentration, measured by an FSSP 100, varied a lot depending on the sampling area. Thedroplet concentration varied inversely when compared to the concentration of larger hydrometeors registered by an OAP 2D2-C. Inaddition, in some areas supercooled large drops were found to form accumulation zones. The microphysical results have been usedto calculate the minimum magnitude of a sustained updraft required to produce supercooled water at an altitude of −16°C inadverse conditions for the increase in liquid water due to the presence of ice particle populations.© 2006 Elsevier B.V. All rights reserved.
Keywords: Liquid water content; Droplet spectra; Updraft; Supercooled water
1. Introduction
Hail storms are frequent phenomena during thesummer months on both sides of the Pyrenees. To thesouth, the Spanish region known as the Ebro Valley isone of the areas in Europe with the highest number ofcases of severe convective phenomena (Fig. 1). Thetemperature of cloud bases in summer storms is usuallyover 9°C and the cloud tops are at an altitude where thetemperature is around −50°C. These storms are of the
⁎ Corresponding author. Departamento de Física, Facultad de CC.BB. y Ambientales, 24071 León, Spain. Tel.: +34 987 291 499;fax: +34 987 291 945.
E-mail address: [email protected] (E. García-Ortega).
0169-8095/$ - see front matter © 2006 Elsevier B.V. All rights reserved.doi:10.1016/j.atmosres.2006.01.009
warm-based cloud type (Sánchez et al., 1999), and thushave a great potential for producing a significant amountof liquid water content. In this area most hailstorms areclassified as multicellular whereas supercells representonly 4% of storms (Castro et al., 1992).
One of the main characteristics of severe storms isthe presence of an intense updraft associated with thecloud system. Miller et al. (1988) have describedupdrafts of up to 40m s−1 in a supercell in Montana.Values of 10–20m s−1 may easily be surpassed. Onmany occasions the highest values of updrafts arereached at an altitude above the freezing point. Icecrystals, graupel and frozen drops start developing whenthe temperature is around −5°C. These hydrometeorsinteract with each other by means of interparticle
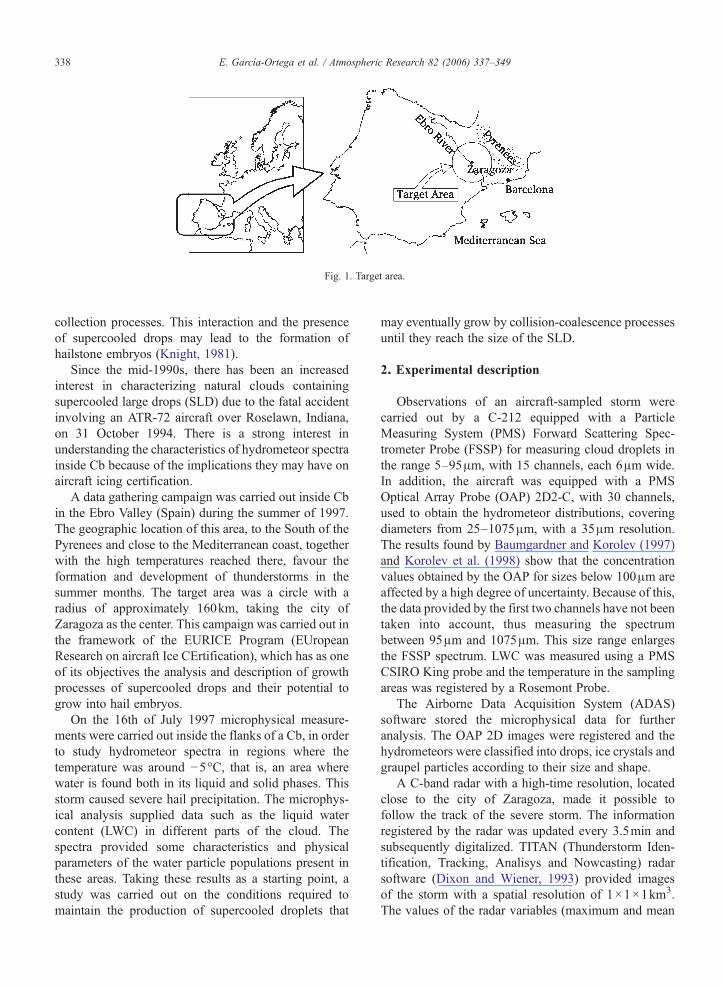
Fig. 1. Target area.
338 E. García-Ortega et al. / Atmospheric Research 82 (2006) 337–349
collection processes. This interaction and the presenceof supercooled drops may lead to the formation ofhailstone embryos (Knight, 1981).
Since the mid-1990s, there has been an increasedinterest in characterizing natural clouds containingsupercooled large drops (SLD) due to the fatal accidentinvolving an ATR-72 aircraft over Roselawn, Indiana,on 31 October 1994. There is a strong interest inunderstanding the characteristics of hydrometeor spectrainside Cb because of the implications they may have onaircraft icing certification.
A data gathering campaign was carried out inside Cbin the Ebro Valley (Spain) during the summer of 1997.The geographic location of this area, to the South of thePyrenees and close to the Mediterranean coast, togetherwith the high temperatures reached there, favour theformation and development of thunderstorms in thesummer months. The target area was a circle with aradius of approximately 160km, taking the city ofZaragoza as the center. This campaign was carried out inthe framework of the EURICE Program (EUropeanResearch on aircraft Ice CErtification), which has as oneof its objectives the analysis and description of growthprocesses of supercooled drops and their potential togrow into hail embryos.
On the 16th of July 1997 microphysical measure-ments were carried out inside the flanks of a Cb, in orderto study hydrometeor spectra in regions where thetemperature was around −5°C, that is, an area wherewater is found both in its liquid and solid phases. Thisstorm caused severe hail precipitation. The microphys-ical analysis supplied data such as the liquid watercontent (LWC) in different parts of the cloud. Thespectra provided some characteristics and physicalparameters of the water particle populations present inthese areas. Taking these results as a starting point, astudy was carried out on the conditions required tomaintain the production of supercooled droplets that
may eventually grow by collision-coalescence processesuntil they reach the size of the SLD.
2. Experimental description
Observations of an aircraft-sampled storm werecarried out by a C-212 equipped with a ParticleMeasuring System (PMS) Forward Scattering Spec-trometer Probe (FSSP) for measuring cloud droplets inthe range 5–95μm, with 15 channels, each 6μm wide.In addition, the aircraft was equipped with a PMSOptical Array Probe (OAP) 2D2-C, with 30 channels,used to obtain the hydrometeor distributions, coveringdiameters from 25–1075μm, with a 35μm resolution.The results found by Baumgardner and Korolev (1997)and Korolev et al. (1998) show that the concentrationvalues obtained by the OAP for sizes below 100μm areaffected by a high degree of uncertainty. Because of this,the data provided by the first two channels have not beentaken into account, thus measuring the spectrumbetween 95μm and 1075μm. This size range enlargesthe FSSP spectrum. LWC was measured using a PMSCSIRO King probe and the temperature in the samplingareas was registered by a Rosemont Probe.
The Airborne Data Acquisition System (ADAS)software stored the microphysical data for furtheranalysis. The OAP 2D images were registered and thehydrometeors were classified into drops, ice crystals andgraupel particles according to their size and shape.
A C-band radar with a high-time resolution, locatedclose to the city of Zaragoza, made it possible tofollow the track of the severe storm. The informationregistered by the radar was updated every 3.5min andsubsequently digitalized. TITAN (Thunderstorm Iden-tification, Tracking, Analisys and Nowcasting) radarsoftware (Dixon and Wiener, 1993) provided imagesof the storm with a spatial resolution of 1×1×1km3.The values of the radar variables (maximum and mean
339E. García-Ortega et al. / Atmospheric Research 82 (2006) 337–349
reflectivity factor, echo top, base or height ofmaximum reflectivity) were stored for subsequentanalyses. A telemetry system was used to know theposition of the aircraft at every moment and thisposition was shown on the TITAN software display.The speed of the aircraft was 80m s−1.
Information about the meteorological conditions wasprovided by a sounding carried out at the airport ofZaragoza at 1200 UTC. In addition, the 900, 500 and200hPa back trajectories provided information about theorigin of the air masses present at the time and locationof the storm.
3. Observations
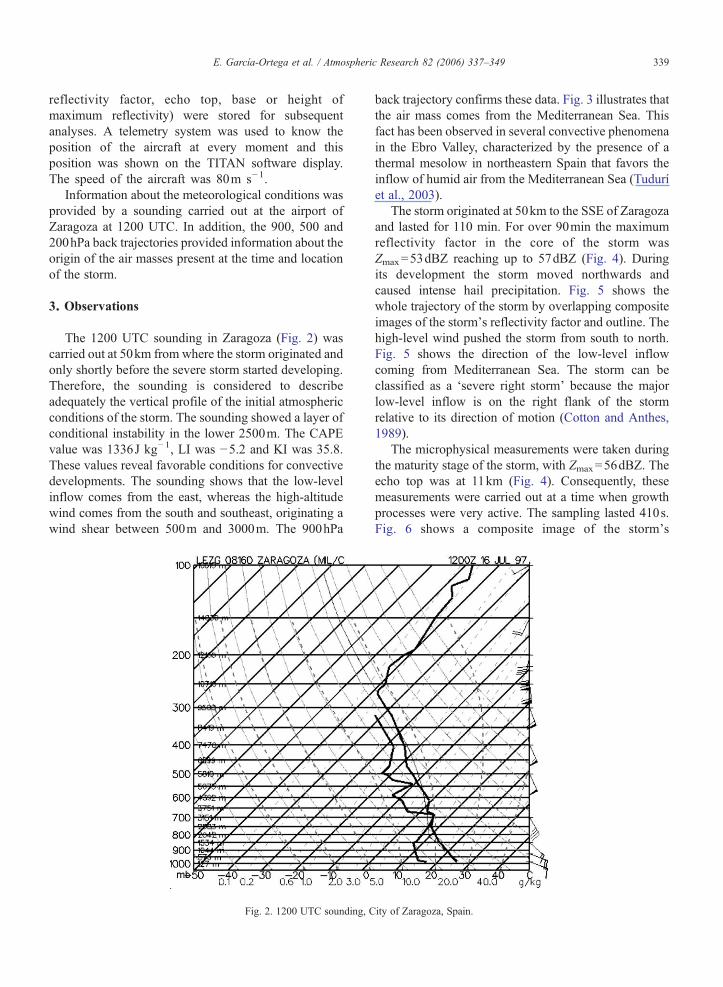
The 1200 UTC sounding in Zaragoza (Fig. 2) wascarried out at 50km from where the storm originated andonly shortly before the severe storm started developing.Therefore, the sounding is considered to describeadequately the vertical profile of the initial atmosphericconditions of the storm. The sounding showed a layer ofconditional instability in the lower 2500m. The CAPEvalue was 1336J kg−1, LI was −5.2 and KI was 35.8.These values reveal favorable conditions for convectivedevelopments. The sounding shows that the low-levelinflow comes from the east, whereas the high-altitudewind comes from the south and southeast, originating awind shear between 500m and 3000m. The 900hPa
Fig. 2. 1200 UTC sounding, C
back trajectory confirms these data. Fig. 3 illustrates thatthe air mass comes from the Mediterranean Sea. Thisfact has been observed in several convective phenomenain the Ebro Valley, characterized by the presence of athermal mesolow in northeastern Spain that favors theinflow of humid air from the Mediterranean Sea (Tuduríet al., 2003).
The storm originated at 50km to the SSE of Zaragozaand lasted for 110 min. For over 90min the maximumreflectivity factor in the core of the storm wasZmax=53dBZ reaching up to 57dBZ (Fig. 4). Duringits development the storm moved northwards andcaused intense hail precipitation. Fig. 5 shows thewhole trajectory of the storm by overlapping compositeimages of the storm's reflectivity factor and outline. Thehigh-level wind pushed the storm from south to north.Fig. 5 shows the direction of the low-level inflowcoming from Mediterranean Sea. The storm can beclassified as a ‘severe right storm’ because the majorlow-level inflow is on the right flank of the stormrelative to its direction of motion (Cotton and Anthes,1989).
The microphysical measurements were taken duringthe maturity stage of the storm, with Zmax=56dBZ. Theecho top was at 11km (Fig. 4). Consequently, thesemeasurements were carried out at a time when growthprocesses were very active. The sampling lasted 410s.Fig. 6 shows a composite image of the storm's
ity of Zaragoza, Spain.
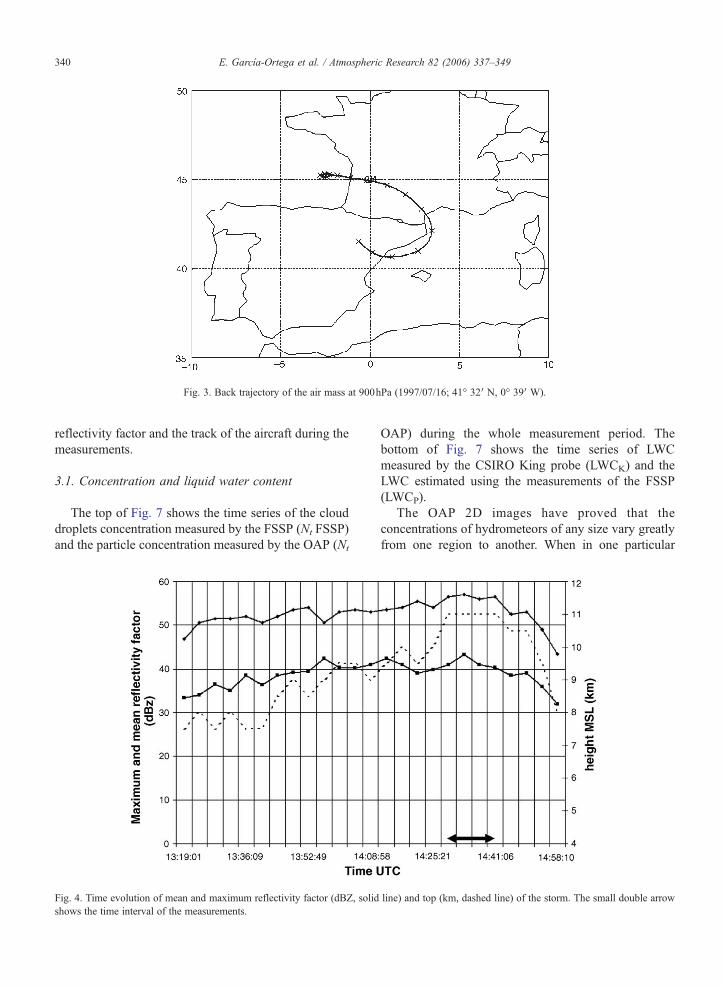
Fig. 3. Back trajectory of the air mass at 900hPa (1997/07/16; 41° 32′ N, 0° 39′ W).
340 E. García-Ortega et al. / Atmospheric Research 82 (2006) 337–349
reflectivity factor and the track of the aircraft during themeasurements.
3.1. Concentration and liquid water content
The top of Fig. 7 shows the time series of the clouddroplets concentration measured by the FSSP (Nt FSSP)and the particle concentration measured by the OAP (Nt
Fig. 4. Time evolution of mean and maximum reflectivity factor (dBZ, solidshows the time interval of the measurements.
OAP) during the whole measurement period. Thebottom of Fig. 7 shows the time series of LWCmeasured by the CSIRO King probe (LWCK) and theLWC estimated using the measurements of the FSSP(LWCP).
The OAP 2D images have proved that theconcentrations of hydrometeors of any size vary greatlyfrom one region to another. When in one particular
line) and top (km, dashed line) of the storm. The small double arrow

Fig. 5. Track of the storm showing the direction of the warm air flow.
341E. García-Ortega et al. / Atmospheric Research 82 (2006) 337–349
region hydrometeors of D>100μm predominate, fewerdroplets are found and the value of Nt FSSP decreases.Fig. 7 shows that when there is an increase in Nt FSSPthere is a decrease in Nt OAP. In fact, it has beendemonstrated that in areas where high concentrations ofcloud droplets predominate, the OAP 2D images showan almost complete absence of hydrometeors with adiameter of more than 100μm. There is a greatvariability between the concentration values registeredby the FSSP and the OAP. This variability dependsgreatly on the characteristics of the study zone, andtherefore also on the dominating growth processes.During the same data gathering campaign, in stormswith a maximum reflectivity factor of Zmax<45 dBZ,there were predominantly a mixture of cloud dropletsand other larger hydrometeors (in liquid or solidphase). However, in this case study, there are areaswith very different particle distributions, with dropletsdominating in some areas, graupel particles in otherareas, and even SLD.
As far as LWC is concerned, the CSIRO King probewas used for a direct measurement, LWCK, and the FSSPfor an estimation, LWCP. If yi represents the concentra-tion of droplets with a diameterDa Di− w
2 ;Di þ w2
� �(w is
the width of each channel and Di the representativediameter of each class) in a time interval, the LWCP
contained in droplets with diameters between 5μm and95μm, grouped in n=15 classes is
LWCP ¼ p6qw
Xni¼1
yiD3i
where ρw is the water density.It has been noted that, in general, the instantaneous
values of LWCK are consistent with LWCP. However,there are some short time intervals where differenceshave been observed between the two (Fig. 7). Afteranalyzing the spectra of these intervals it was noted thatthere was a high concentration of droplets that wereoutside the optimal range of the CSIRO King probe(diameters between 10 and 40μm).
Fig. 7 shows that when Nt FSSP increases, LWCincreases as well. LWC is proportional to the cubeddroplet diameter. Hence, the increase in LWC may bedue either to the presence of cloud droplets with largediameters within the range of the FSSP, or to animportant increase in Nt FSSP, even when the clouddroplet diameter is small. Bearing in mind the goodagreement between the results of the CSIRO King probe
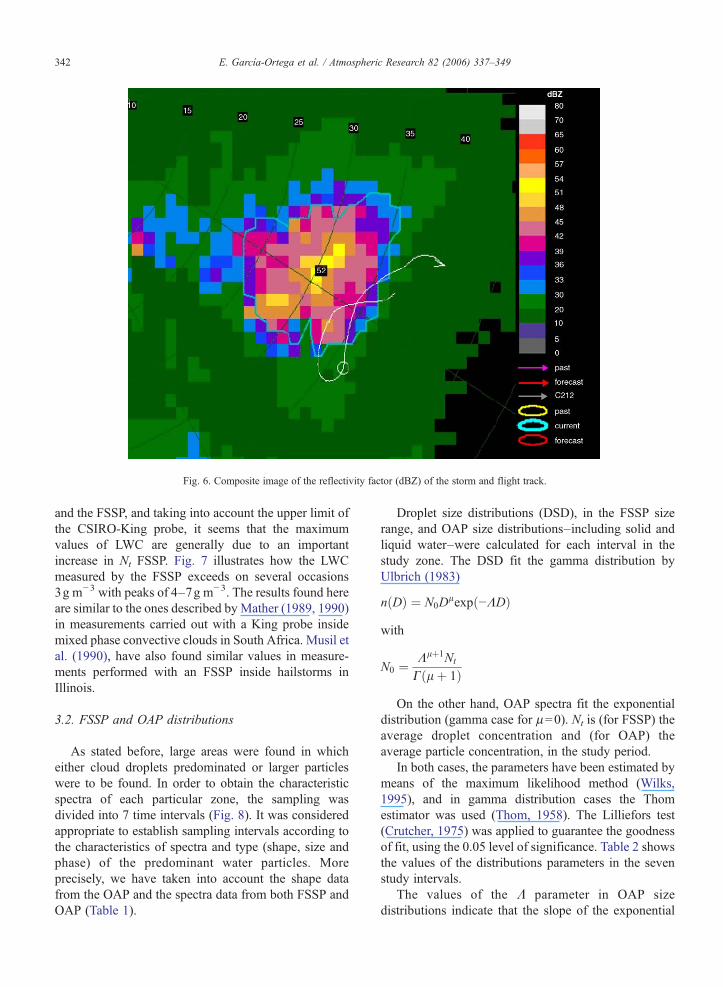
Fig. 6. Composite image of the reflectivity factor (dBZ) of the storm and flight track.
342 E. García-Ortega et al. / Atmospheric Research 82 (2006) 337–349
and the FSSP, and taking into account the upper limit ofthe CSIRO-King probe, it seems that the maximumvalues of LWC are generally due to an importantincrease in Nt FSSP. Fig. 7 illustrates how the LWCmeasured by the FSSP exceeds on several occasions3g m−3 with peaks of 4–7g m−3. The results found hereare similar to the ones described by Mather (1989, 1990)in measurements carried out with a King probe insidemixed phase convective clouds in South Africa. Musil etal. (1990), have also found similar values in measure-ments performed with an FSSP inside hailstorms inIllinois.
3.2. FSSP and OAP distributions
As stated before, large areas were found in whicheither cloud droplets predominated or larger particleswere to be found. In order to obtain the characteristicspectra of each particular zone, the sampling wasdivided into 7 time intervals (Fig. 8). It was consideredappropriate to establish sampling intervals according tothe characteristics of spectra and type (shape, size andphase) of the predominant water particles. Moreprecisely, we have taken into account the shape datafrom the OAP and the spectra data from both FSSP andOAP (Table 1).
Droplet size distributions (DSD), in the FSSP sizerange, and OAP size distributions–including solid andliquid water–were calculated for each interval in thestudy zone. The DSD fit the gamma distribution byUlbrich (1983)
nðDÞ ¼ N0Dlexpð−KDÞ
with
N0 ¼ Klþ1Nt
Cðlþ 1ÞOn the other hand, OAP spectra fit the exponential
distribution (gamma case for μ=0). Nt is (for FSSP) theaverage droplet concentration and (for OAP) theaverage particle concentration, in the study period.
In both cases, the parameters have been estimated bymeans of the maximum likelihood method (Wilks,1995), and in gamma distribution cases the Thomestimator was used (Thom, 1958). The Lilliefors test(Crutcher, 1975) was applied to guarantee the goodnessof fit, using the 0.05 level of significance. Table 2 showsthe values of the distributions parameters in the sevenstudy intervals.
The values of the Λ parameter in OAP sizedistributions indicate that the slope of the exponential
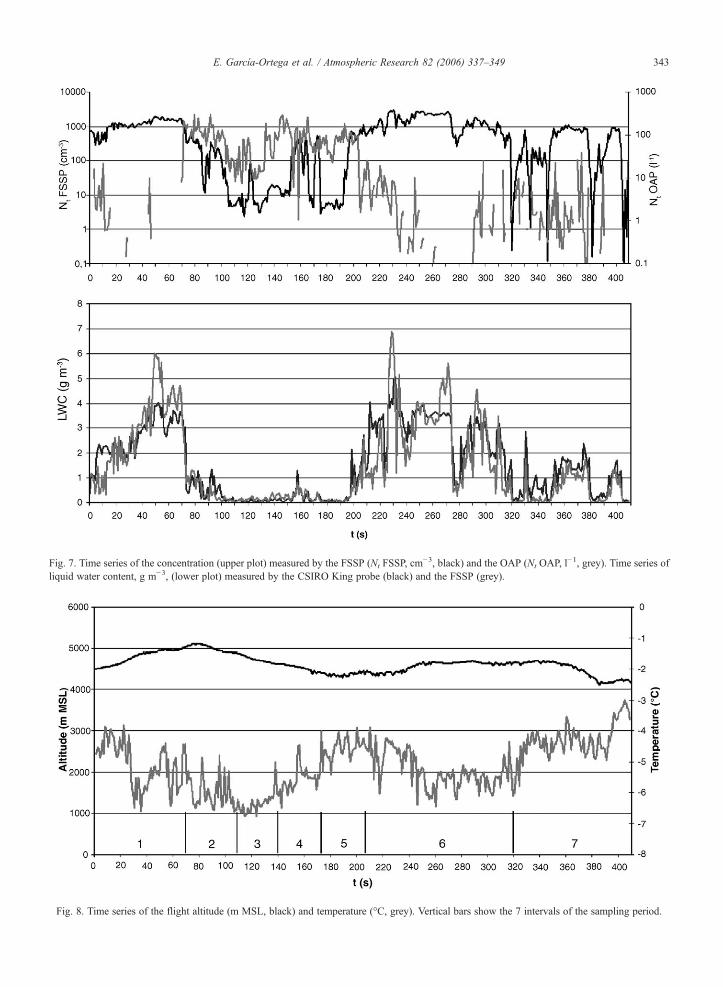
Fig. 7. Time series of the concentration (upper plot) measured by the FSSP (Nt FSSP, cm−3, black) and the OAP (Nt OAP, l
−1, grey). Time series ofliquid water content, g m−3, (lower plot) measured by the CSIRO King probe (black) and the FSSP (grey).
Fig. 8. Time series of the flight altitude (m MSL, black) and temperature (°C, grey). Vertical bars show the 7 intervals of the sampling period.
343E. García-Ortega et al. / Atmospheric Research 82 (2006) 337–349
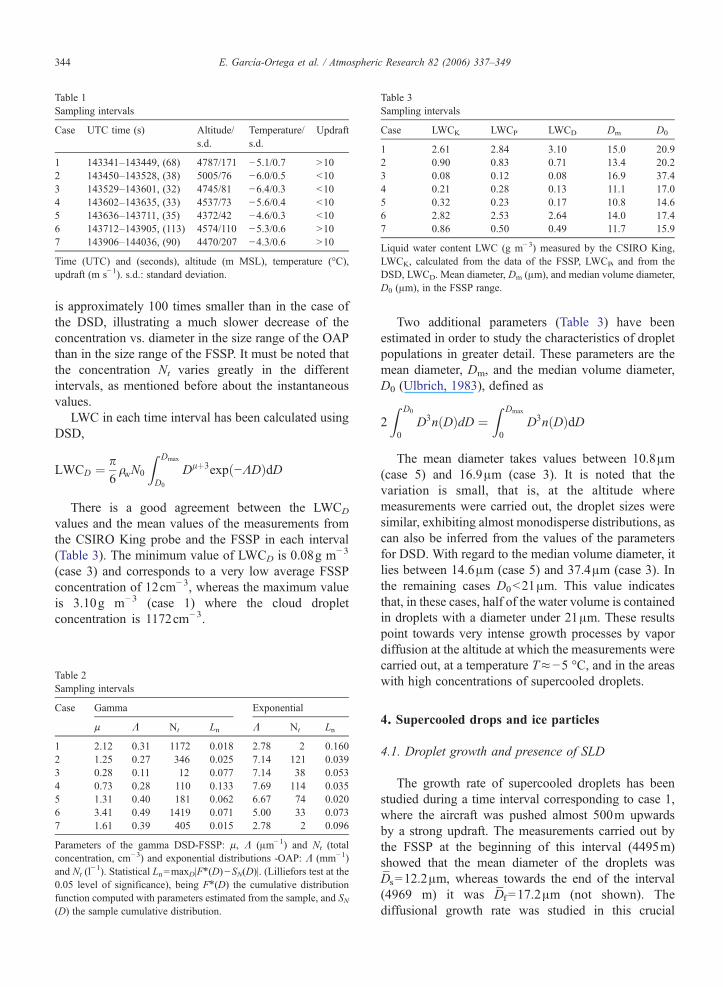
Table 3Sampling intervals
Case LWCK LWCP LWCD Dm D0
1 2.61 2.84 3.10 15.0 20.92 0.90 0.83 0.71 13.4 20.23 0.08 0.12 0.08 16.9 37.44 0.21 0.28 0.13 11.1 17.05 0.32 0.23 0.17 10.8 14.66 2.82 2.53 2.64 14.0 17.47 0.86 0.50 0.49 11.7 15.9
Liquid water content LWC (g m−3) measured by the CSIRO King,LWCK, calculated from the data of the FSSP, LWCP, and from theDSD, LWCD. Mean diameter, Dm (μm), and median volume diameter,D0 (μm), in the FSSP range.
Table 1Sampling intervals
Case UTC time (s) Altitude/s.d.
Temperature/s.d.
Updraft
1 143341–143449, (68) 4787/171 −5.1/0.7 >102 143450–143528, (38) 5005/76 −6.0/0.5 <103 143529–143601, (32) 4745/81 −6.4/0.3 <104 143602–143635, (33) 4537/73 −5.6/0.4 <105 143636–143711, (35) 4372/42 −4.6/0.3 <106 143712–143905, (113) 4574/110 −5.3/0.6 >107 143906–144036, (90) 4470/207 −4.3/0.6 >10
Time (UTC) and (seconds), altitude (m MSL), temperature (°C),updraft (m s−1). s.d.: standard deviation.
344 E. García-Ortega et al. / Atmospheric Research 82 (2006) 337–349
is approximately 100 times smaller than in the case ofthe DSD, illustrating a much slower decrease of theconcentration vs. diameter in the size range of the OAPthan in the size range of the FSSP. It must be noted thatthe concentration Nt varies greatly in the differentintervals, as mentioned before about the instantaneousvalues.
LWC in each time interval has been calculated usingDSD,
LWCD ¼ p6qwN0
Z Dmax
D0
Dlþ3exp −KDð ÞdD
There is a good agreement between the LWCD
values and the mean values of the measurements fromthe CSIRO King probe and the FSSP in each interval(Table 3). The minimum value of LWCD is 0.08g m−3
(case 3) and corresponds to a very low average FSSPconcentration of 12cm−3, whereas the maximum valueis 3.10g m−3 (case 1) where the cloud dropletconcentration is 1172cm−3.
Table 2Sampling intervals
Case Gamma Exponential
μ Λ Nt Ln Λ Nt Ln
1 2.12 0.31 1172 0.018 2.78 2 0.1602 1.25 0.27 346 0.025 7.14 121 0.0393 0.28 0.11 12 0.077 7.14 38 0.0534 0.73 0.28 110 0.133 7.69 114 0.0355 1.31 0.40 181 0.062 6.67 74 0.0206 3.41 0.49 1419 0.071 5.00 33 0.0737 1.61 0.39 405 0.015 2.78 2 0.096
Parameters of the gamma DSD-FSSP: μ, Λ (μm−1) and Nt (totalconcentration, cm−3) and exponential distributions -OAP: Λ (mm−1)and Nt (l
−1). Statistical Ln=maxD|F⁎(D)−SN(D)|. (Lilliefors test at the0.05 level of significance), being F⁎(D) the cumulative distributionfunction computed with parameters estimated from the sample, and SN(D) the sample cumulative distribution.
Two additional parameters (Table 3) have beenestimated in order to study the characteristics of dropletpopulations in greater detail. These parameters are themean diameter, Dm, and the median volume diameter,D0 (Ulbrich, 1983), defined as
2Z D0
0D3nðDÞdD ¼
Z Dmax
0D3nðDÞdD
The mean diameter takes values between 10.8μm(case 5) and 16.9μm (case 3). It is noted that thevariation is small, that is, at the altitude wheremeasurements were carried out, the droplet sizes weresimilar, exhibiting almost monodisperse distributions, ascan also be inferred from the values of the parametersfor DSD. With regard to the median volume diameter, itlies between 14.6μm (case 5) and 37.4μm (case 3). Inthe remaining cases D0<21μm. This value indicatesthat, in these cases, half of the water volume is containedin droplets with a diameter under 21μm. These resultspoint towards very intense growth processes by vapordiffusion at the altitude at which the measurements werecarried out, at a temperature T≈−5 °C, and in the areaswith high concentrations of supercooled droplets.
4. Supercooled drops and ice particles
4.1. Droplet growth and presence of SLD
The growth rate of supercooled droplets has beenstudied during a time interval corresponding to case 1,where the aircraft was pushed almost 500m upwardsby a strong updraft. The measurements carried out bythe FSSP at the beginning of this interval (4495m)showed that the mean diameter of the droplets wasD̄s=12.2μm, whereas towards the end of the interval(4969 m) it was D̄f =17.2μm (not shown). Thediffusional growth rate was studied in this crucial
345E. García-Ortega et al. / Atmospheric Research 82 (2006) 337–349
interval using the diffusion equation (Rogers and Yau,1996)
rdrdt
¼ S v; w−1� �
− ar þ b
r3
ðFk þ FdÞwhere r is the radius of a cloud droplet, sv,w is theambient saturation ratio with respect to water, Fk is athermodynamic term associated with heat conductionand Fd is a term associated with vapor diffusion. Thekinetic effects that influence the transfer of heat andmass have been taken into account. The term a/r is a‘curvature term’ which expresses the increase insaturation ratio over a droplet as compared to a flatsurface. The term b/r3 shows the reduction in vapourpressure due to the presence of a dissolved substance.Parameter a depends on temperature and b depends onthe characteristics of the condensation nuclei. Theresults obtained by Fukuta and Walter (1970) withreference to factors Fk and Fd have also been takeninto account. Calculations show that the updrafts thatare necessary to maintain the growth rate may varybetween 10m s− 1 and 20m s− 1 depending on thechanges in the degree of supersaturation.
SLD of up to 3mm in diameter were found in thestudy zone. These SLD were found along a distanceof about 500m in interval no. 2 and along about 800m in interval no. 4, in areas with updrafts under
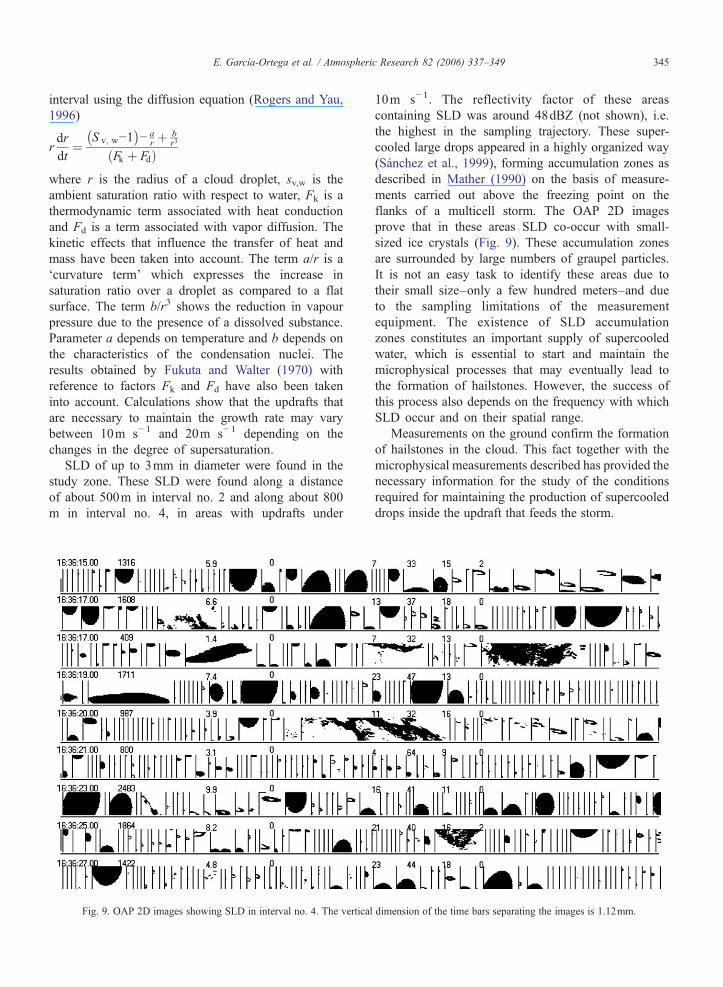
Fig. 9. OAP 2D images showing SLD in interval no. 4. The vertical
10m s− 1. The reflectivity factor of these areascontaining SLD was around 48dBZ (not shown), i.e.the highest in the sampling trajectory. These super-cooled large drops appeared in a highly organized way(Sánchez et al., 1999), forming accumulation zones asdescribed in Mather (1990) on the basis of measure-ments carried out above the freezing point on theflanks of a multicell storm. The OAP 2D imagesprove that in these areas SLD co-occur with small-sized ice crystals (Fig. 9). These accumulation zonesare surrounded by large numbers of graupel particles.It is not an easy task to identify these areas due totheir small size–only a few hundred meters–and dueto the sampling limitations of the measurementequipment. The existence of SLD accumulationzones constitutes an important supply of supercooledwater, which is essential to start and maintain themicrophysical processes that may eventually lead tothe formation of hailstones. However, the success ofthis process also depends on the frequency with whichSLD occur and on their spatial range.
Measurements on the ground confirm the formationof hailstones in the cloud. This fact together with themicrophysical measurements described has provided thenecessary information for the study of the conditionsrequired for maintaining the production of supercooleddrops inside the updraft that feeds the storm.
dimension of the time bars separating the images is 1.12mm.
346 E. García-Ortega et al. / Atmospheric Research 82 (2006) 337–349
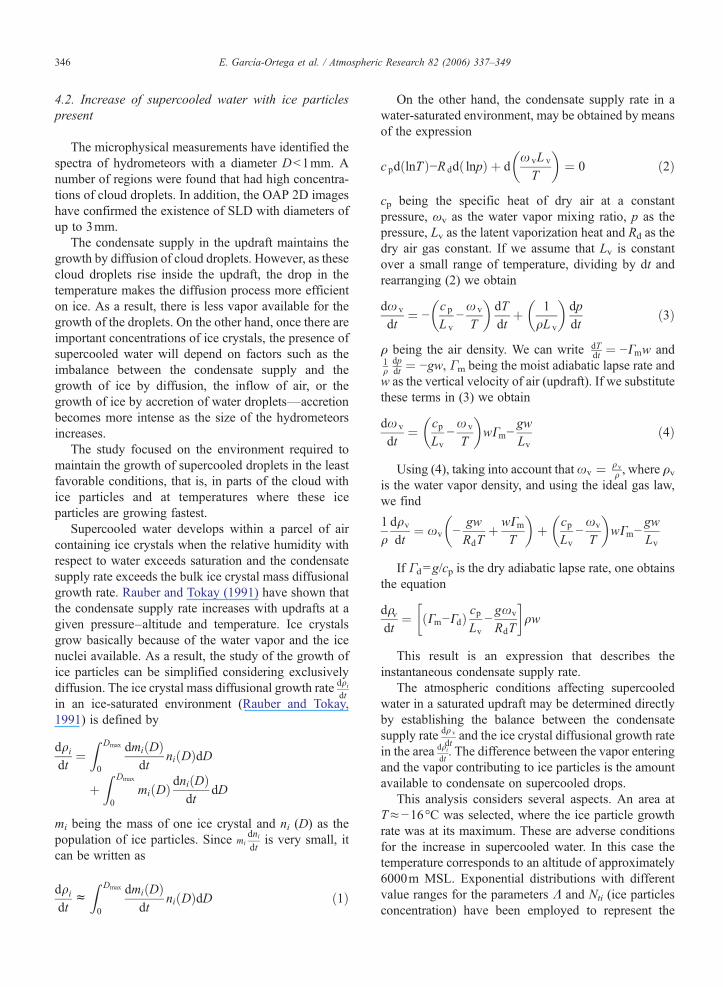
4.2. Increase of supercooled water with ice particlespresent
The microphysical measurements have identified thespectra of hydrometeors with a diameter D<1mm. Anumber of regions were found that had high concentra-tions of cloud droplets. In addition, the OAP 2D imageshave confirmed the existence of SLD with diameters ofup to 3mm.
The condensate supply in the updraft maintains thegrowth by diffusion of cloud droplets. However, as thesecloud droplets rise inside the updraft, the drop in thetemperature makes the diffusion process more efficienton ice. As a result, there is less vapor available for thegrowth of the droplets. On the other hand, once there areimportant concentrations of ice crystals, the presence ofsupercooled water will depend on factors such as theimbalance between the condensate supply and thegrowth of ice by diffusion, the inflow of air, or thegrowth of ice by accretion of water droplets—accretionbecomes more intense as the size of the hydrometeorsincreases.
The study focused on the environment required tomaintain the growth of supercooled droplets in the leastfavorable conditions, that is, in parts of the cloud withice particles and at temperatures where these iceparticles are growing fastest.
Supercooled water develops within a parcel of aircontaining ice crystals when the relative humidity withrespect to water exceeds saturation and the condensatesupply rate exceeds the bulk ice crystal mass diffusionalgrowth rate. Rauber and Tokay (1991) have shown thatthe condensate supply rate increases with updrafts at agiven pressure–altitude and temperature. Ice crystalsgrow basically because of the water vapor and the icenuclei available. As a result, the study of the growth ofice particles can be simplified considering exclusivelydiffusion. The ice crystal mass diffusional growth rate dqi
dtin an ice-saturated environment (Rauber and Tokay,1991) is defined by
dqidt
¼Z Dmax
0
dmiðDÞdt
ni Dð ÞdD
þZ Dmax
0mi Dð Þ dniðDÞ
dtdD
mi being the mass of one ice crystal and ni (D) as thepopulation of ice particles. Since mi
dnidt
is very small, itcan be written as
dqidt
cZ Dmax
0
dmiðDÞdt
ni Dð ÞdD ð1Þ
On the other hand, the condensate supply rate in awater-saturated environment, may be obtained by meansof the expression
c pd lnTð Þ−R dd lnpð Þ þ dx vL v
T
� �¼ 0 ð2Þ
cp being the specific heat of dry air at a constantpressure, ωv as the water vapor mixing ratio, p as thepressure, Lv as the latent vaporization heat and Rd as thedry air gas constant. If we assume that Lv is constantover a small range of temperature, dividing by dt andrearranging (2) we obtain
dx v
dt¼ −
c p
L v−x v
T
� �dTdt
þ 1qL v
� �dpdt
ð3Þ
ρ being the air density. We can write dTdt ¼ −Cmw and
1q
dpdt ¼ −gw, Γm being the moist adiabatic lapse rate and
w as the vertical velocity of air (updraft). If we substitutethese terms in (3) we obtain
dx v
dt¼ cp
Lv−x v
T
� �wCm−
gwLv
ð4Þ
Using (4), taking into account thatxv ¼ qvq , where ρv
is the water vapor density, and using the ideal gas law,we find
1qdqv
dt¼ xv −
gwRdT
þ wCmT
� �þ cp
Lv−xv
T
� �wCm−
gwLv
If Γd=g/cp is the dry adiabatic lapse rate, one obtainsthe equation
dqvdt
¼ Cm−Cdð Þ cpLv
−gxv
RdT
� qw
This result is an expression that describes theinstantaneous condensate supply rate.
The atmospheric conditions affecting supercooledwater in a saturated updraft may be determined directlyby establishing the balance between the condensatesupply rate dq v
dtand the ice crystal diffusional growth rate
in the area dqidt. The difference between the vapor entering
and the vapor contributing to ice particles is the amountavailable to condensate on supercooled drops.
This analysis considers several aspects. An area atT≈−16°C was selected, where the ice particle growthrate was at its maximum. These are adverse conditionsfor the increase in supercooled water. In this case thetemperature corresponds to an altitude of approximately6000m MSL. Exponential distributions with differentvalue ranges for the parameters Λ and Nti (ice particlesconcentration) have been employed to represent the
347E. García-Ortega et al. / Atmospheric Research 82 (2006) 337–349
population of ice particles, taking as a reference theestimated values of the parameters in the measurementarea. The maximum effective diameters considered forthese particles were between 1mm and 5mm. Themaximum diameters observed by the OAP 2D imageslay in this range too.
Specifying Eq. (1) for the case of an exponentialdistribution, and considering the diffusional growthequation of an ice crystal (Pruppacher and Klett, 1996)we have
dqidt
cZ Dmax
04p
D2A ̂iS v;iNtiKexp −KDð ÞdD
where A ̂i is a function that depends on thermodynamicparameters, and sv,i is the supersaturation with respectto ice.
The results found indicate that the ice mass growthrate increases when the Λ parameter is at its lowest valueand the maximum diameter of the ice particles at itshighest value. However, the findings for maximumdiameters of 3mm or larger do not vary greatly fromthose found for diameters of 1mm. In general, the largerthe ice particles, the higher the ice crystal growth rate inthe area. Alternatively, for a specific value of Λ, the icemass growth rate is higher when Nti increases.
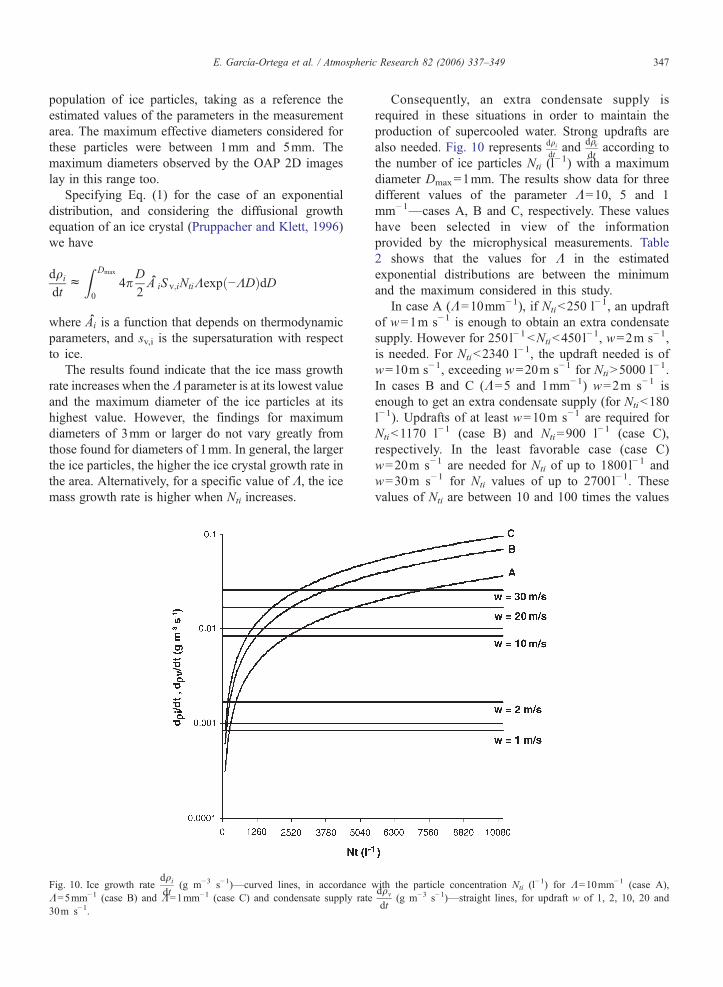
Fig. 10. Ice growth ratedqidt
(g m−3 s−1)—curved lines, in accordanceΛ=5mm−1 (case B) and Λ=1mm−1 (case C) and condensate supply rate30m s−1.
Consequently, an extra condensate supply isrequired in these situations in order to maintain theproduction of supercooled water. Strong updrafts arealso needed. Fig. 10 represents dqi
dtand dqv
dtaccording to
the number of ice particles Nti (l−1) with a maximum
diameter Dmax=1mm. The results show data for threedifferent values of the parameter Λ=10, 5 and 1mm−1—cases A, B and C, respectively. These valueshave been selected in view of the informationprovided by the microphysical measurements. Table2 shows that the values for Λ in the estimatedexponential distributions are between the minimumand the maximum considered in this study.
In case A (Λ=10mm−1), if Nti<250 l−1, an updraftof w=1m s−1 is enough to obtain an extra condensatesupply. However for 250l−1 <Nti<450l
−1, w=2m s−1,is needed. For Nti<2340 l−1, the updraft needed is ofw=10m s−1, exceeding w=20m s−1 for Nti>5000 l−1.In cases B and C (Λ=5 and 1mm−1) w=2m s−1 isenough to get an extra condensate supply (for Nti<180l−1). Updrafts of at least w=10m s−1 are required forNti<1170 l−1 (case B) and Nti=900 l−1 (case C),respectively. In the least favorable case (case C)w=20m s−1 are needed for Nti of up to 1800l−1 andw=30m s−1 for Nti values of up to 2700l−1. Thesevalues of Nti are between 10 and 100 times the values
with the particle concentration Nti (l−1) for Λ=10mm−1 (case A),
dqmdt
(g m−3 s−1)—straight lines, for updraft w of 1, 2, 10, 20 and
348 E. García-Ortega et al. / Atmospheric Research 82 (2006) 337–349
included in Table 2 for the exponential distributions inthe OAP size range. Concentrations similar to these onescannot be discarded, since it must be noted that abovethe measurement area there must be important numbersof ice particles of smaller sizes than the ones observed inthe OAP 2D images. Consequently, there may be higherconcentrations than the ones registered at the altitudewhere the measurements were carried out.
5. Conclusions
This paper has described the microphysical measure-ments carried out inside a severe storm that occurredover the Ebro Valley (Spain) the 16th of August 1997.The area where this Cb developed has a particularly highconvective activity during the summer months. Thestorm originated 50km to the SSE of Zaragoza andlasted 110min. During this time, a C-band radarregistered maximum reflectivity factors of over 50dBZ. The inflow of warm and humid air from theMediterranean Sea and the high-altitude wind from theSouth favored the formation and development of thestorm. The storm moved from South to North andcaused intense hail precipitation.
Microphysical measurements were carried out insidethe right flank of the storm at an altitude correspondingto the isotherm of −5°C, where liquid and solidhydrometeors coexist. The results found show thespectrum of hydrometeors with diameters under 1 mm.A great variability was observed in the concentration ofsupercooled droplets in the FSSP size range, and also inthe concentration of liquid and solid particles in theOAP size range, depending on the sampling zone. Thelarge amounts of cloud droplets in areas with a strongupdraft produced very high cloud droplet concentrationsof around 1000cm−3. It was in these areas that themaximum values for LWC were found: 4–7g m−3. Atthe altitude where the measurements were carried out,the cloud droplet spectra showed a gamma profile thattends to a quasi-monodisperse distributions, with meandiameters between 10.8μm and 16.9μm. In the areaswhere the updraft was not that strong, larger hydro-meteors predominated, with high concentrations ofgraupel particles with spectra of an exponential profile.SLD were found forming accumulation zones of a fewhundred meters. The OAP 2D images show that thediameters of these SLD were of up to 3mm and that theycoexisted with small ice particles.
The data provided by the microphysical measure-ments inside this hailstorm were used to carry out atheoretical analysis in order to determine what condi-tions are needed to maintain the growth of supercooled
droplets at temperatures where ice particles are alsopresent and growing fastest, that is, at an altitude abovethe point where the measurements were actually carriedout. The sustained growth of supercooled dropletswould eventually progress into further growth bycollision-coalescence until they reached the maximumsize of the SLD observed in the OAP 2D images.
At an altitude corresponding to the isotherm −16°C,the difference between the vapor entering and the vaporcontributing to ice particles is the amount available tocondensate on supercooled drops. It has been assumedfor the purposes of this study that ice particle sizedistributions have an exponential form. The values ofthese parameters have been calculated using theinformation provided by the microphysical measure-ments carried out at −5°C. Updrafts of at least 10m s−1
are required to provide enough vapor to sustain thegrowth of supercooled droplets in areas with high iceparticle concentrations of 1170l−1 (for Λ=5mm−1) and900l−1 (for Λ=1mm−1), respectively, thus favoring theformation of embryos that may eventually grow intohailstones.
Acknowledgments
The authors thank Noelia Ramón for translating thepaper into proper English. We would like to express ourgratitude to the technical staff of the INTA and CLAEXfor operating the C-212 and collecting the data usedhere. The collaboration of the many colleagues whohave contributed to the success of the Project is alsoacknowledged. This study was supported by the CICYTthrough the ESP-97/1594/E, REN 2000-1210 CLI andADV Terres de Ponent.
References
Baumgardner, D., Korolev, A., 1997. Airspeed corrections for opticalarray probe sample volumes. J. Atmos. Ocean. Technol. 14,1224–1229.
Castro, A., Sánchez, J.L., Fraile, R., 1992. Statistical comparison ofthe properties of thunderstorms in different areas around the EbroValley (Spain). Atmos. Res. 28, 237–257.
Cotton, W.R., Anthes, R.A., 1989. Storm and Cloud Dynamics.Academic Press, New York. 883 pp.
Crutcher, H.L., 1975. A note on the possible misuse of theKolmogorov-Smirnov test. J. Appl. Meteorol. 14, 1600–1603.
Dixon, M., Wiener, G., 1993. TITAN: Thunderstorm Identification,Tracking, Analysis and Nowcasting—a radar-based methodology.J. Atmos. Ocean. Technol. 10, 785–797.
Fukuta, N., Walter, L.A., 1970. Kinetics of hydrometeor growth from avapor-spherical model. J. Atmos. Sci. 27, 1160–1172.
Knight, C.A., 1981. Case studies on convective storms, Case study 9:13 June 1974: Mature storm study. A small, isolated, ‘steady state’convective storm. NCAR Tech. Note NCAR/TN-163+STR.
349E. García-Ortega et al. / Atmospheric Research 82 (2006) 337–349
Korolev, A.V., Strapp, J.W., Isaac, G.A., 1998. Evaluation of theaccuracy of PMS optical array probes. J. Atmos. Ocean. Technol.15, 708–720.
Mather, G.K., 1989. Estimates of precipitation embryo densities usingmeasurements from aircraft radar. J. Appl. Meteorol. 28,1089–1097.
Mather, G.K., 1990. Evidence of an accumulation or ‘Big Drop’ zone.Bull. Am. Meteorol. Soc. 71 (3), 345–348.
Miller, L.J., Tuttle, J.D., Knight, C.K., 1988. Airflow and hail growthin a severe northern High Plains supercell. J. Atmos. Sci. 45,736–762.
Musil, D.J., Smith, P.L., Wescott, N.E., 1990. Armored aircraftobservations of a severe hailstorm in Illinois. Conf. on SevereLocal Storms and the Conf. on Atmospheric Electricity. Amer.Meteor. Soc.
Pruppacher, H.R., Klett, J.D., 1996. Microphysics of Clouds andPrecipitation. D. Reidel. 714 pp.
Rauber, R.M., Tokay, A., 1991. An explanation for the existence ofsupercooled water at the top of cold clouds. J. Atmos. Sci. 48,1005–1023.
Rogers, R.R., Yau, M.K., 1996. A Short Course in Cloud Physics.Butterworth-Heinemann. 290 pp.
Sánchez, J.L., García, E., Marcos, J.L., Dessens, J., 1999. Formation ofbig and giant drops inside Mediterranean convective cells. Proc.of the EGS Plinius Conf., Maratea. Eur. Geophys. Soc., Italy,pp. 57–65.
Thom, H.C.S., 1958. A note on the gamma distribution. Mon. WeatherRev. 86, 117–122.
Ulbrich, C.W., 1983. Natural variations in the analytical form of theraindrop size distribution. J. Appl. Meteorol. 22, 1764–1775.
Tudurí, E., Romero, R., López, L., García, E., Sánchez, J.L., Ramis,C., 2003. The 14 July 2001 hailstorm on northeastern Spain:diagnosis of the meteorological situation. Atmos. Res. 67–68,541–558.
Wilks, D.S., 1995. Statistical Methods in the Atmospheric Sciences.Academic Press. 467 pp.